1. Introduction
Ships as a transportation unit have rapidly increased in size. This is attributed to mass transportation, which has lowered the cost per TEU (Twenty Equivalent Unit), allowing for economy of scale. An increase of cargo capacity improves reliability and reduces shipping cost. It is because an increase of the vessel scale can lead to strategic partnerships of companies and competence in collecting cargoes. Such a trend raises a question regarding whether existing terminals can manage the ships or not. To tackle the question, this paper anticipates the time of mega ships’ actual appearance in the shipping market and the dimensions of the ships. The size of vessels affects the water level of terminals, unloading equipment, and the structure of the quay wall. Furthermore, this paper focuses on the coping ability of the existing container terminals. In the following section, precedent studies on predictions of vessel dimensions are reviewed to examine the progress of the aforementioned, and they are compared with the results of this study.
2. Precedent Studies
Won, Cho, and Lee analyzed the trend toward mega containerships and the capacity for mega vessels in Busan Port. In the analysis; they claimed that Busan Port needs to secure a water depth of at least 17 m and 430 m of berth length, and they also predicted 58 to 73 m and 61 to 80 m of outreach for a quay crane to handle 25,000 TEU ships and 30,000 TEU ships respectively [
1].
Kim concluded that surveyed ports have secured 16 m for water depth and have actively installed cranes that are 60 m or more since 2005 [
2].
Hong & Lee proposed design criteria for container cranes to handle 15,000 TEU vessels, which are 78 m for outreach, 25 m for back reach, 250 mpm for the average speed of hoist, 350 mpm for the average speed of trolley, and 75 moves/hr for productivity in cargo handling [
3].
Cho, Won, and Lee predicted the launch of 25,000 TEU ships and 30,000 TEU ships in 2017 and in 2026 respectively. They estimated that the 25,000 TEU ships would measure 447 m lengthwise with a breadth of 61 m and a maximum draft of 18.3 m; and the 30,000 TEU ships would be 517 m lengthwise with a breadth of 65 m and a maximum draft of 19.4 m [
4].
Kim conducted a linear regression analysis between TEU and the length of ships, and estimated 553.8 m of length, 82.1 m of breadth, 35 rows on deck, and 14 tiers on deck [
5].
Malchow suggested that if future developments still follow the exponential regression curve, which has described the growth up to this point very well, where the first 23,000 TEU vessel will be seen around the year 2020, and vessels of 30,000 TEU could be expected from 2025 onwards. As this size would correspond with approximately 20 m of draught, it should be the ultimate limit for the size [
6].
Enrico Musso et al. suggested that the performance requirements of container terminals have increased significantly, highlighting necessary changes in their layout, infrastructure, and equipment Following the advent of megaships [
7].
Imai, Nishimura, and Papadimitriou insisted that the megaship is competitive in all scenarios for Asia-Europe, while it is viable for Asia-North America only when the freight rate and feeder costs are low [
8].
Iris et al. showed that they can efficiently solve the problem for a 2 km berth length where 60 ships call the port per week [
9].
Meng, Weng, and Suyic studied the impact analysis of mega vessels on container terminal operations. First, the container operation process at a container terminal is formulated as a queuing network. Based on the queuing network, a simulation model was then developed. The results suggest that the current port facilities may not be sufficient to accommodate more mega container vessels [
10].
Iris et al. optimized loading operations and yard management for mega vessels. For mega vessels, the loading operations can be coordinated with quay cranes, yard trucks, and yard equipment [
11].
Iris et al. and Li et al. studied the integrated berth allocation and quay crane assignment problem. They try to solve the problem to optimality by considering quay crane coverage ranges i.e., ship breadth [
9,
11].
Kim, Lee, and Park proposed that the determination of the turning basin for vessels entering and sailing the berth has been considered in the design standard of harbor construction rules of the port. In this regard, the turning basin has been determined by the max size of the entering vessel of the berth/port [
12].
3. Prediction of the Dimensions for Mega Container Vessels
3.1. Emergence of Mega Container Vessels
As of 2017, the biggest containership is the OOCL Hong Kong. It has 21,413 TEU ship capacity and measures 400 m LOA (length of all) with a breadth of 58.8 m, DWT (Deadweight Tonnage) of 197,317 ton and depth of 32.5 m. The next largest ships are the Saint Exupery, the Madrid Maersk, and the MOL Triumph, and their ship capacities exceed 20,000 TEU as shown in
Table 1.
3.2. The Status of Calling Ships at Busan Port
New mega container vessels have started entering Busan Port in recent years. The Saint Exupery of CMA (Compagnie Maritime d’Affrètement)/CGA (Compagnie Générale Maritime), the largest ships, was at BNCT (Busan New Container Terminal) in 2018, and the Munich Maersk arrived at PNIT (Pusan New International Terminal) in 2018 and MORTEN MAERSK called at PNC (Pusan New Container) to unload cargo as well in 2017. According to the report of the container terminal, the maximum dimensions of calling ships at Busan port with 400 m lengthwise, a breadth of 59 m, draft of 16.0 m, GT (Gross Tonnage) of 217,673 ton and 20,656 TEU capacity as shown in
Table 2.
3.3. Estimation for the Dimensions of Mega Container Vessels
According to the order book, the biggest vessel is HMM’s 23,000 TEU ship, and its dimensions are expected to be 399 m lengthwise with a breadth of 61 m and 33.2 m of depth [
13]. If this trend is consistent, 25,000 to 30,000 TEU ships will appear in the shipping market in the near future. In this section, this paper predicts the relationships between the ship capacity of vessels (TEU) and ship length (m). The analysis is conducted using the dimensions of 300 vessels that consist of 8000 or more TEU ships entering PNC, PNIT, and BNCT in Busan New-Port.
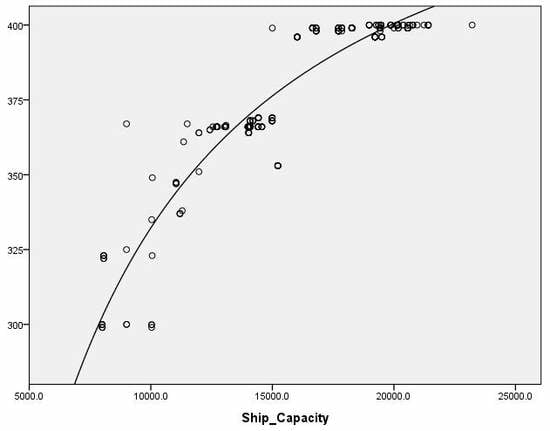
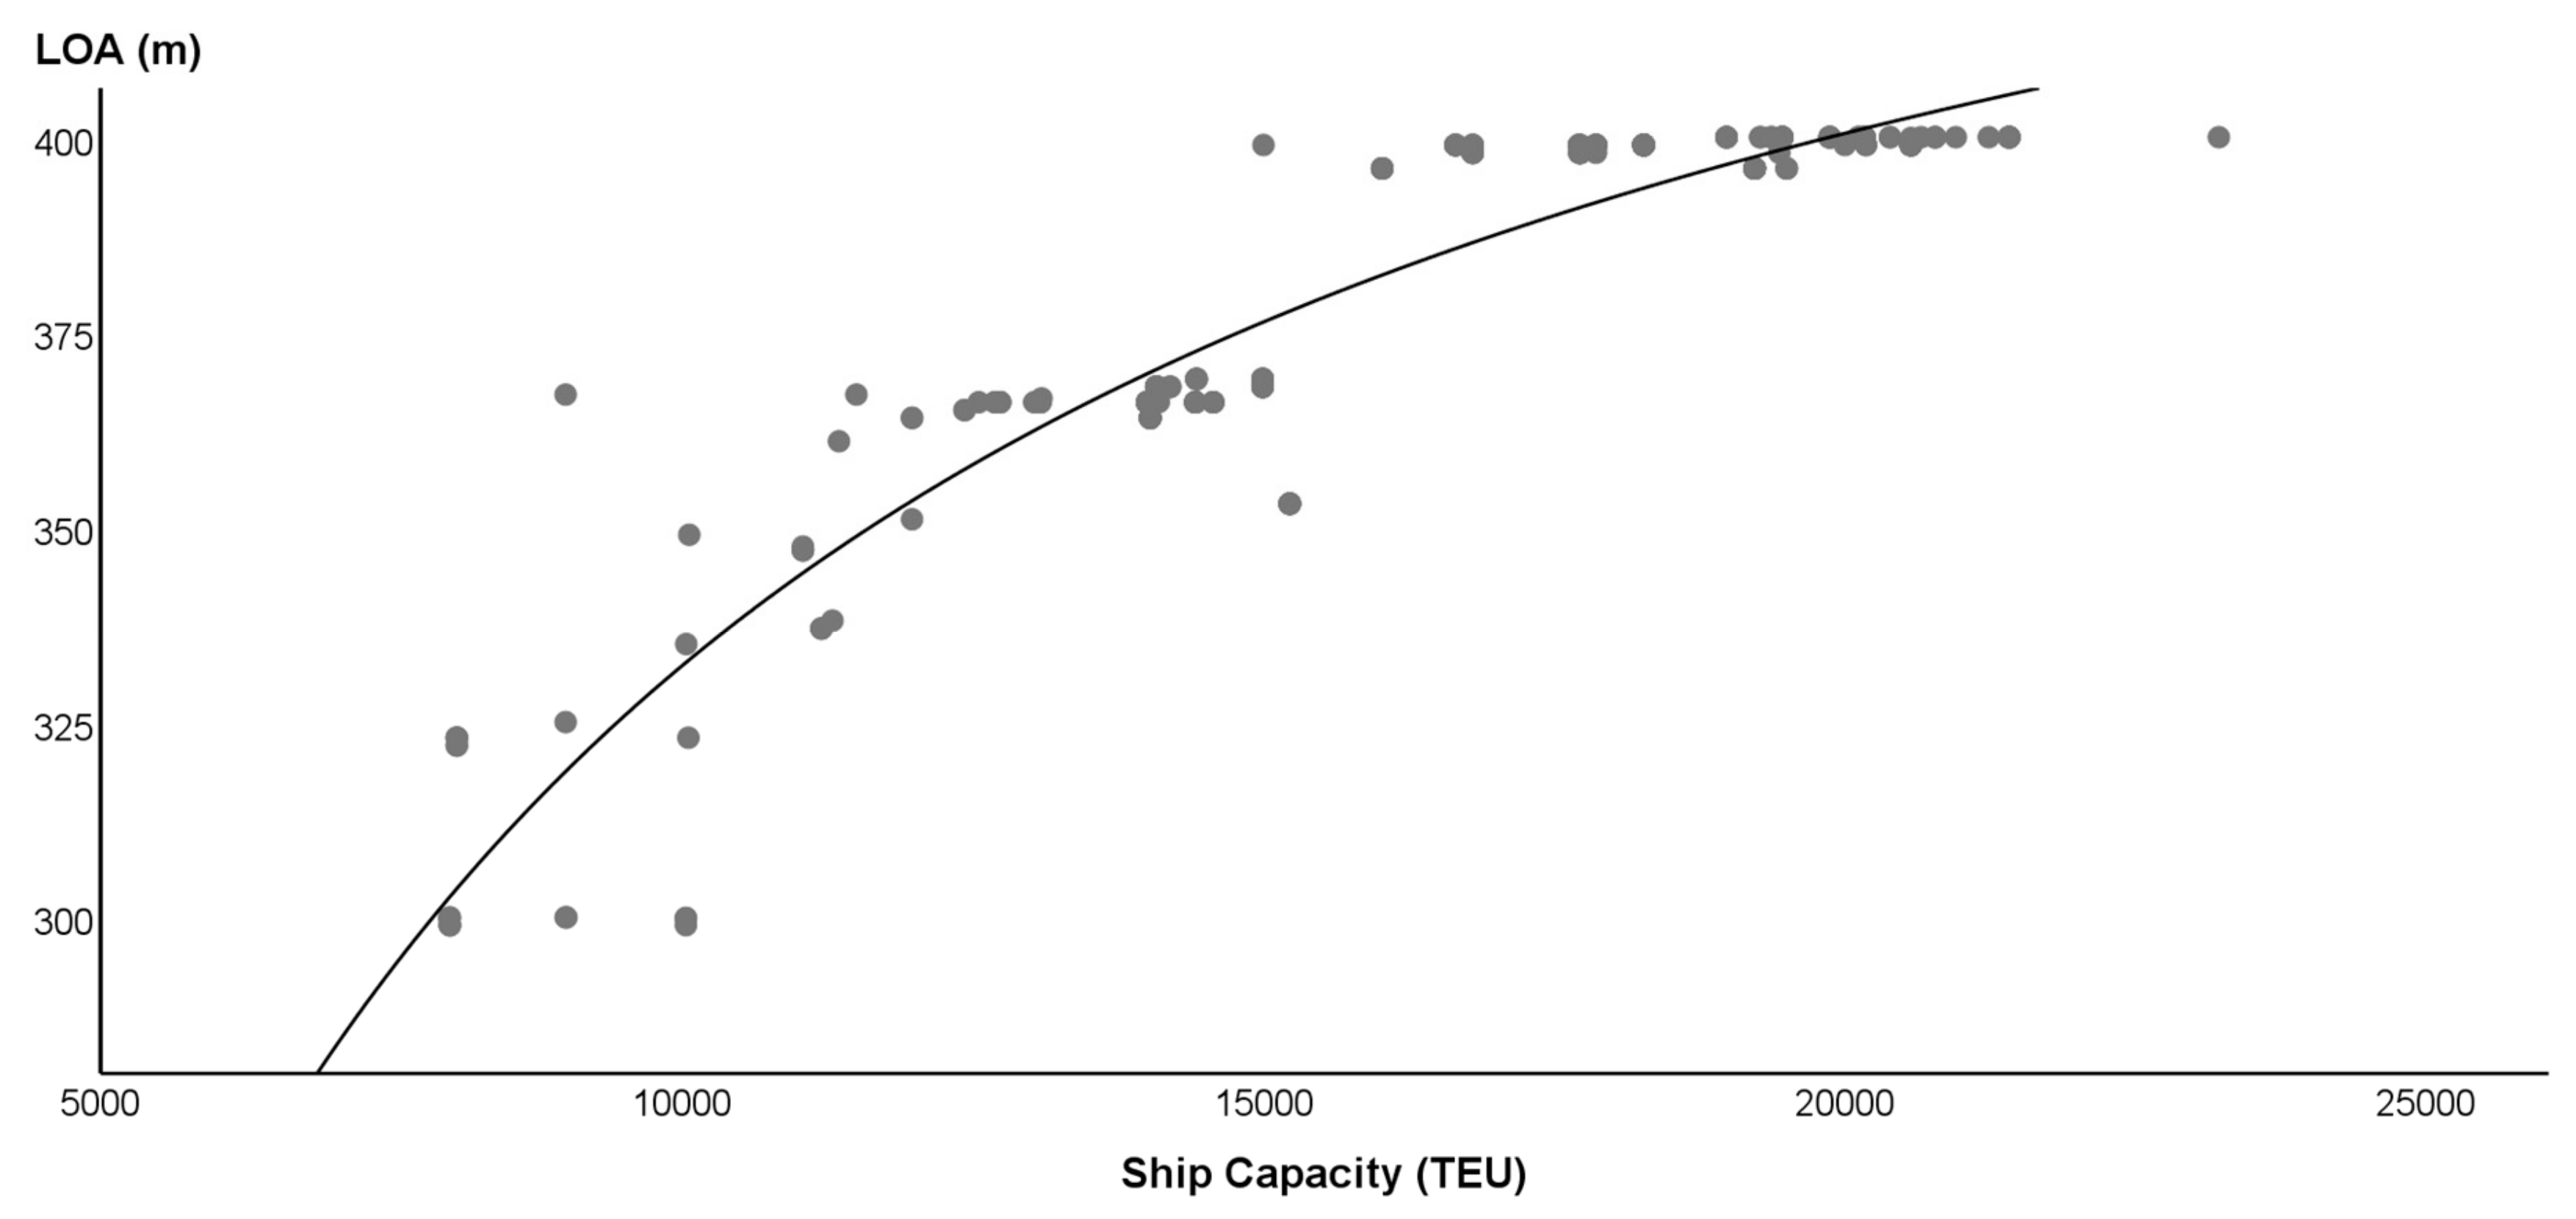
Estimation of Ship Length (
Figure 1): The regression analysis shows an S-curve as a best fitting model as shown in
Figure 1. MSE (mean square error), the standard error of this model, is 0.04. It is the lowest value among those of alternative models. The S-model shows a 93.4% correlation between ship capacity (TEU) and ship length (m), which is considered to be highly significant. The analysis of the variance suggests that the independent variable of ship size has significance in the statistical data as shown in
Table 3.
The following is the regression equation between ship capacity and ship length:
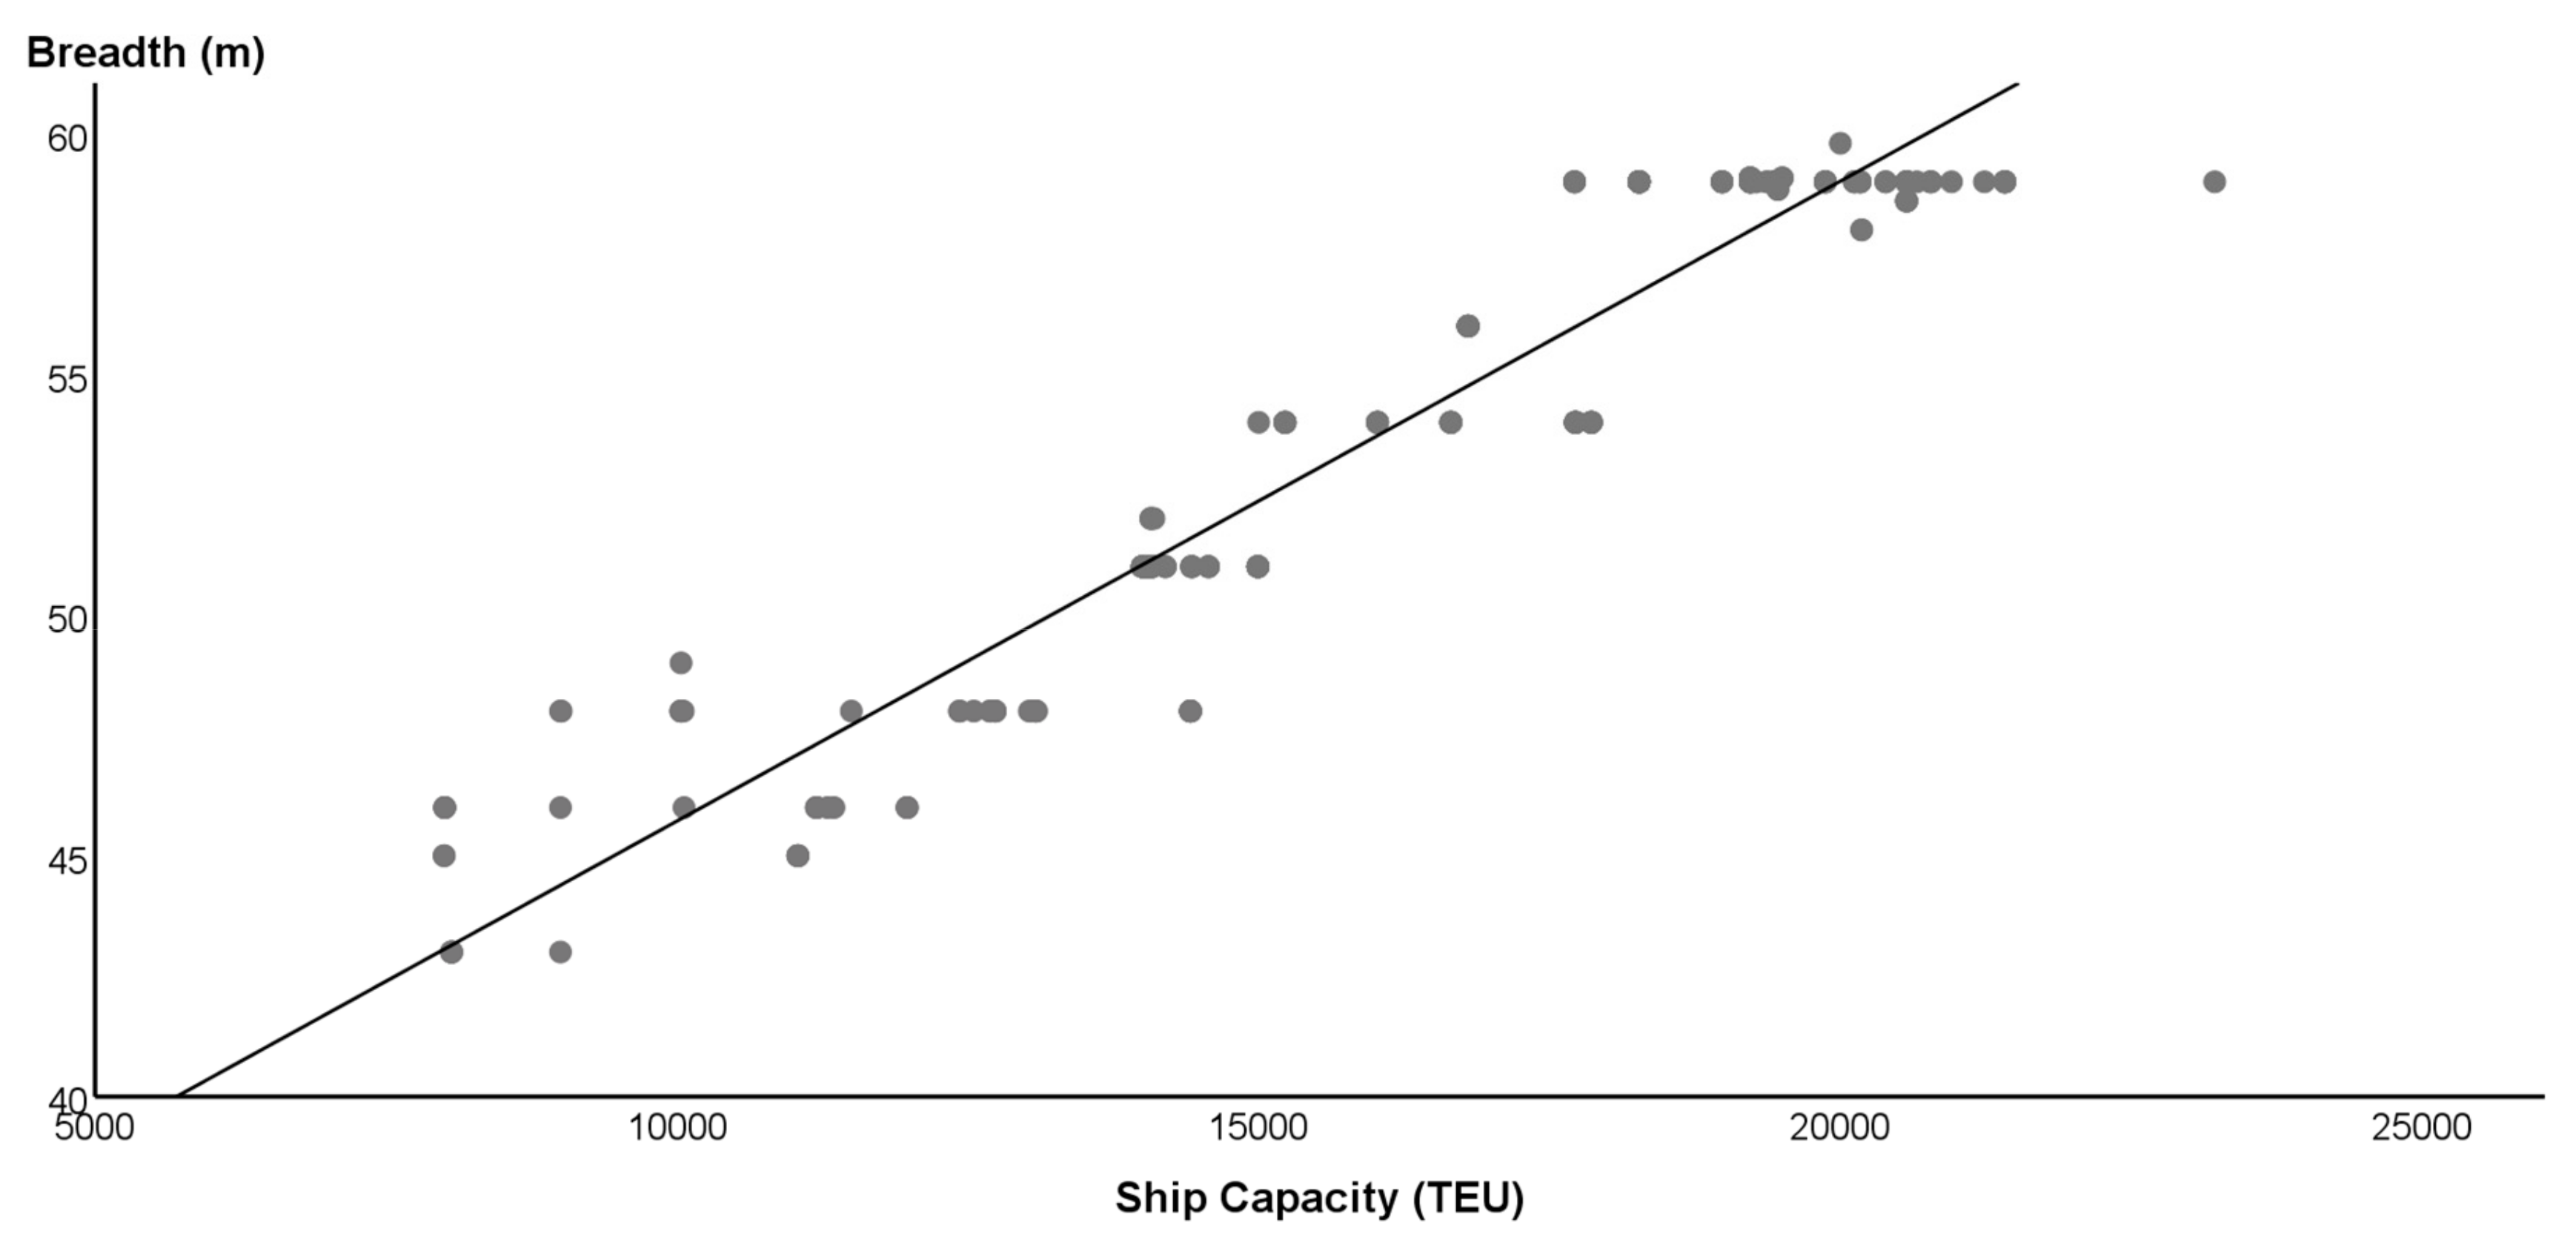
Estimation of Ship Breadth (
Figure 2): The regression analysis shows a linear model as a practical model. MSE, the standard error of this model, is 0.560. The model shows a 90.0% correlation between ship capacity (TEU) and ship breadth. The analysis of variance suggests that the independent variable of ship size has significance in the statistical data as shown in
Table 4.
The following is the regression equation between ship capacity and ship breadth.
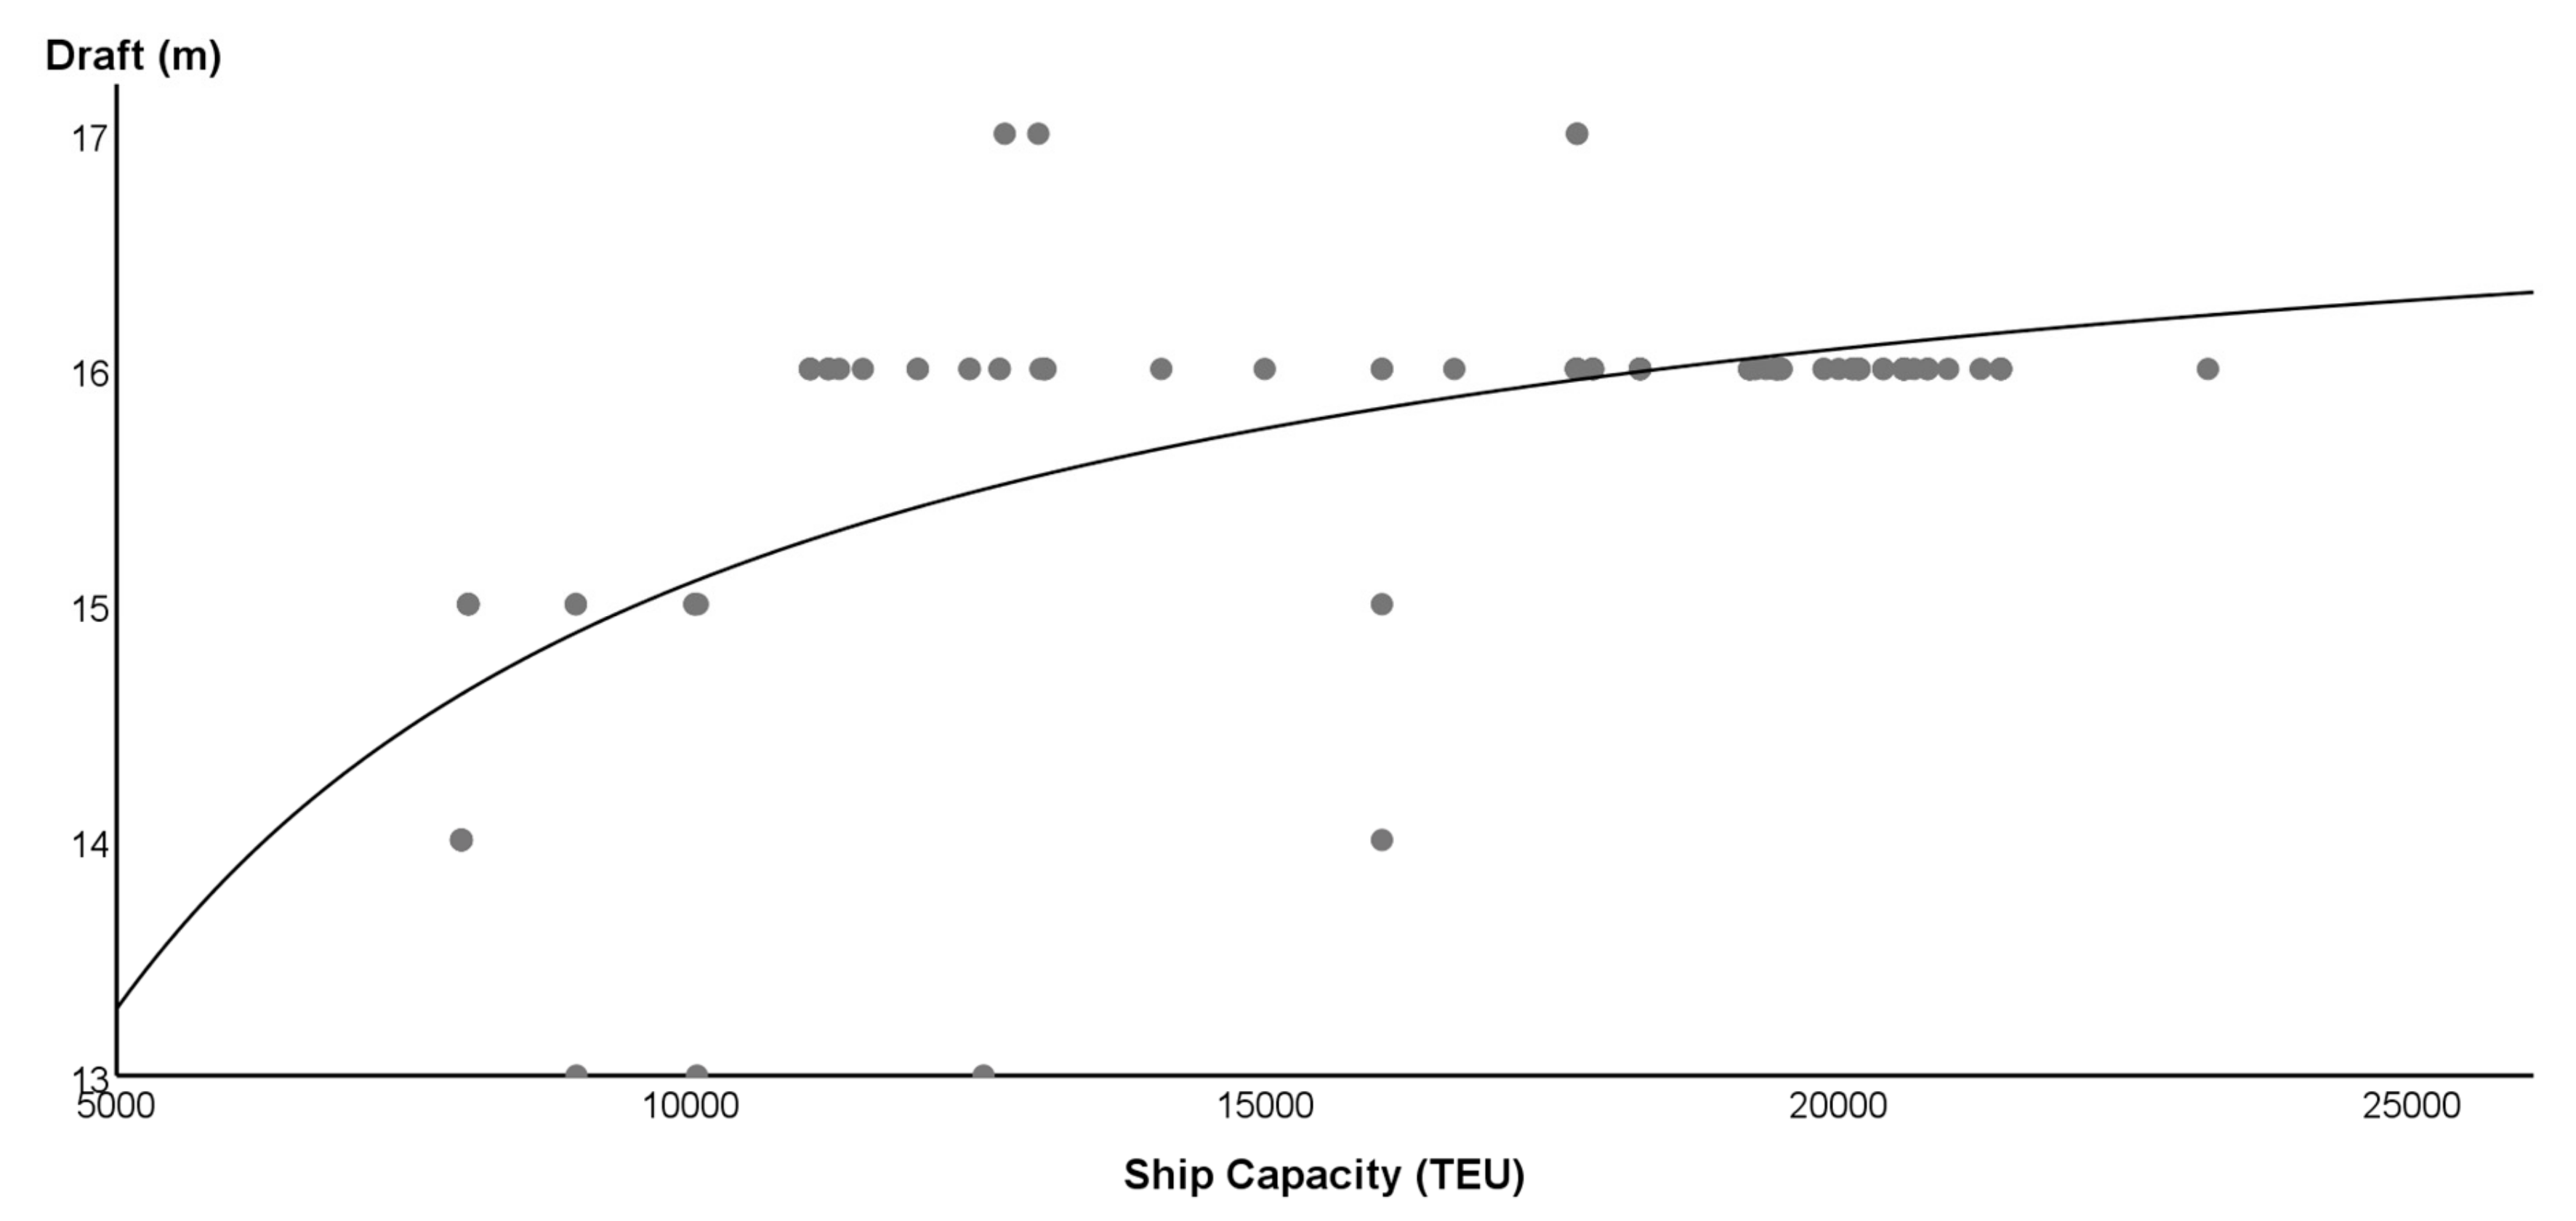
Estimation of Draft (
Figure 3): The regression analysis shows an S-curve as a best fitting model as shown in
Figure 3. MSE, the standard error of this model, is 0.035. It is the lowest value among those of alternative models. The model shows a 66.1% correlation between ship capacity (TEU) and draft. The analysis of variance suggests that the independent variable of ship size has significance in the statistical data as shown in
Table 5.
The following is the regression equation between ship capacity and draft:
In
Figure 1, the group of ships near 366 m and 400 m of LOA can be seen as a cluster, which is the results of several factors related to the infrastructure like: accessible quay length, turning basin, new Panama Canal or Suez Canal dimensions, etc.
The cluster of ships near 366 m and 400 m does not seem to have direct relation to quay length and turning basin because most of container terminals have a quay length of more than 400 m and are 1.5−2.0 times the diameter of LOA.
According to the rule of navigation by the SCA (Suez Canal Authority), the dimensions of ships to transit the Canal are limited to 400 m of LOA, a maximum of 20.1 m of draught, and 50 m of beam. If LOA is longer than 400 m, the vessel needs to receive permission from the SCA. The SCA’s table shows the difference in the relationship between the draft and beam of a ship. For example, if the draft is 16.0 m, the beam is extended to 62.2 m, which is the reason for the cluster of ships with around 400 m LOA, around 59 m in beam, and around 16.0 m in draft [
14].
However, the cluster of ships near 366 m and 400 m seems to have a direct relation to the Panama Canal and Suez Canal dimensions. The dimensions of the new locks of the Panama Canal are 427 m long, 55 m wide, and 18.3 m deep. The corresponding maximum dimensions for vessels that transit these locks are 366 m LOA, 49 m in beam, and 15.2 m in draft. The dimensions of the new locks of the Panama Canal are the reason for the cluster of ships with around 366 m LOA, around 49 m in beam, and around 15.0 m in draft [
15].
3.4. Prediction of the Dimensions of Mega Container Vessels
A famous study in 1999 argued that the final stage of container ship development would be a Malaccamax container ship, with an estimated capacity of 18,000 TEU [
15].
OECD (Organization for Economic Co-operation and Development) ITF (International Transport Forum) [
16] made three scenarios for 2020 about average container ship size on main trade lanes. They argued the ship dimensions would increase until 2020 on all of the selected trade lanes. Scenario A reflects the existing trend towards larger ship sizes in all trade areas. In scenario B, the ship size increase is a little stronger for the Europe–Far East and Europe–America–Asia trades, but the ship size growth on the transpacific and transatlantic trades is not affected strongly. In scenario C, the ship size increase on the Europe–Far East trade is far beyond the expected market growth. Following scenario B, the dimension of a 24,000 TEU ship is expected to be 430 m of length and 62.0 m of breadth,
McKinsey predicted 30,000 TEU ULCVs (ultra-large container vessels) would appear in the near future and further consolidation among container shippers would occur through outright mergers and acquisitions [
17].
With S-curve regression modeling, the dimensions of a 25,000 TEU ship is predicted to measure 431 m lengthwise with a breadth of 62.6 m and a summer draft of 16.9 m, while the dimension of a 30,000 TEU ship is expected to be 453 m in length, 67.0 m of breadth, and 17.3 m of summer draft as shown in
Table 6.
The predicted dimensions of this paper are different from those of previous researches as shown in
Table 7. KMI (Korea Maritime Institute) predicted that the dimensions of a 25,000 TEU ship would be 462.3 m in length, 60.7 m of breadth, and 17.0 m of draft [
18]. Their prediction compared with this paper’s, LOA is 31 m longer and breadth is 5.3 m shorter. However, OECD/ITF’s prediction [
16] compared with this paper’s gives an LOA that is 1 m shorter and the breadth is 4 m shorter as shown in
Table 7.
In the case of 30,000 TEU, KMI [
18] predicted that the dimensions would be 517 m in length, 65.0 m of breadth, and 19.4 m of full draft as shown in
Table 8. Their prediction, comparing with this paper’s, gives an LOA that is 64 m longer and the breadth is 2.0 m shorter as shown in
Table 8.
4. Ports Infrastructure Constraints
4.1. Constraints Caused by Water Depth of Container Terminals
The depth of sea channel should be adequate to safely accommodate ships with the deepest draft. Reviewing tidal effects in a sea channel and turning space, container terminals for handling mega ships should consider its impact. The most commonly used method for the channel depth selection is the PIANC (Permanent International Association of Navigation Congresses) guidance report [
19]. According to the PIANC method, channel depth is estimated from ship draft, tide height, squat, wave-induced motion, a margin depending on type of bottom, and water density. Considering the mentioned factors, the channel depth/draft ratio should be applied to be 1.1 to 1.3. A minimum 1.1 ratio is applied in sheltered waters and 1.3 ratio are applied in waves up to 1 m. When the 25,000 TEU ship calls at terminal, the depth should be 18.6 m to 22.0 m. As Rotterdam port has a channel depth of 20 m, which is MLLW (mean lower low waters), the mega ship with full draft has to call during the time window of high tide. High tide, which is MHHW (mean higher high waters) at Rotterdam port is estimated to be 1.58 m for one week. This terminal can handle a megaship of 25,000 TEU with a draft of 21.58 m. The time windows of high tide at Rotterdam port are around 07:30 am and 20:00 pm based on UTC(Coordinated Universal Time)+2 [
20].
The research method of Rotterdam port is applied to RWG (Rotterdam World Gate) of Rotterdam, HIT (Hong Kong International Terminals) of Hong Kong, SSICT (Sheng Dong International Container Terminal) of Shanghai, TUAS of Singapore and Phase 2–5 of Busan as shown in
Table 9. The research has the implication that the water depth at HIT of Hong Kong and SSICT of Shanghai is not sufficient to accommodate a megaship of 25,000 TEU, even if the megaship utilized the time windows of high tide, as shown in
Table 9. For example, the time windows of Rotterdam Port on 1st May, 2019 are 3:03 PM CEST (Central European Summer Time) and MHHW at high tide is 1.88 m [
20], the time windows of Hong Kong Port on 1st May, 2019 are 7:11 PM HKT (Hong Kong Time) and MHHW at high tide is 1.73 m [
21], the time windows of Shanghai Port on 1st May, 2019 are 10:48 PM CST(China Standard Time) and MHHW at high tide is 2.03 m [
22], the time windows of Singapore Port on 1st May, 2019 are 10:11 PM UTC+8 and MHHW at high tide is 2.28 m [
23] and the time windows of Busan Port on 1st May, 2019 are 6:56 PM KST(Korea Standard Time) and MHHW at high tide is 1.03 m [
24].
4.2. Constraints of Ship Waiting Time
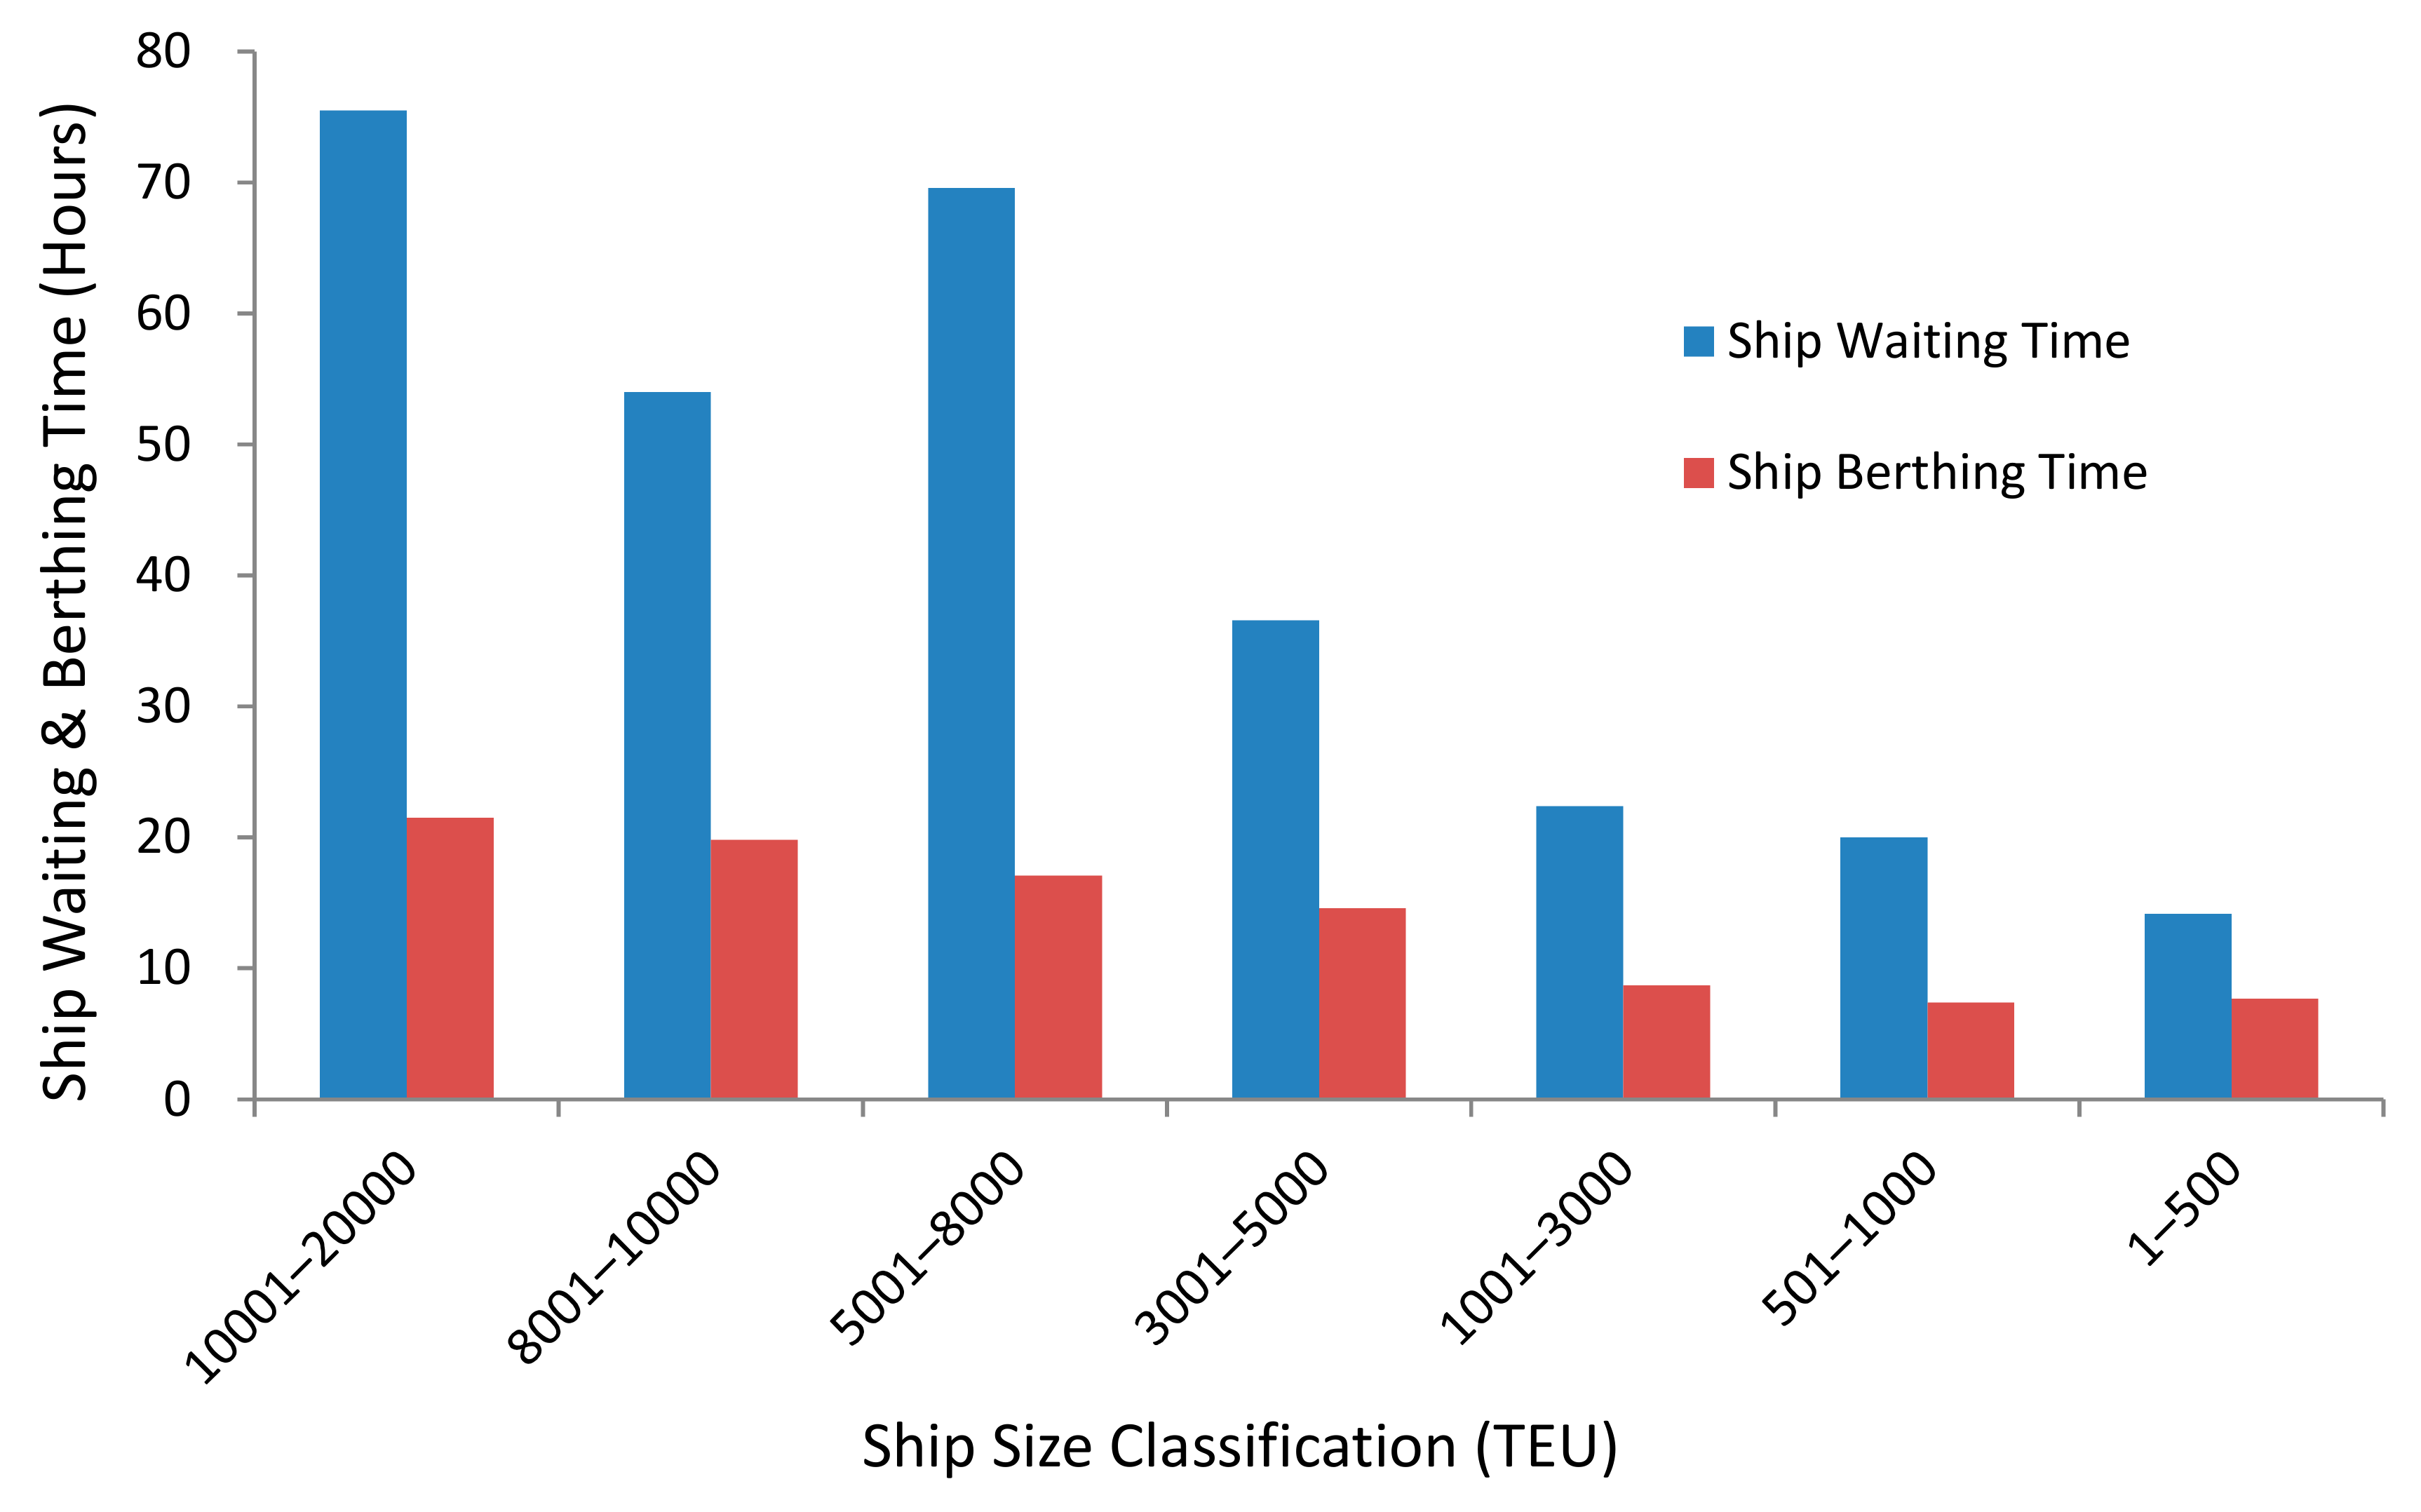
The second challenge a port operator faces is an increase of ship waiting time. The length of a 25,000 TEU ship and a 30,000 TEU ship are predicted to be 431 m and 453 m, respectively (
Table 10). As the gap between ships is given to be 10% of the length of the ships, a vessel occupies 478 to 498 m of a quay wall. That is, if the arrangement of quay walls is in a straight line, mega vessels need more waiting time to secure enough space along a quay wall than smaller ones do.
Identifying average waiting time as proof, these authors collected data of ship waiting times at a terminal for 3 years (2014–2016) from PORT-MIS (Port Management Information System), which is the largest terminal in Busan New-Port, with 2000 m length of berth, at which 12,439 ships have called over the 3-year period as shown
Table 10 and
Figure 4.
The collected data from PORT-MIS consists of sum of waiting time, no. of waiting ships and the derived average waiting time, berthing time, and port time by ship size classification. The following figures are the result of average waiting times, berthing time, and port time in a terminal of Busan New-Port.
This analysis reveals that larger ships wait for a longer time, where the AWT (average waiting time) is 75.5 h; as a result, a difficulty exists in allocating the proper seat of berth. To reduce megaship waiting time, a terminal should make a differentiated berthing plan based on ship size, berthing time, etc. Reviewing the berthing time and port time, larger ships take longer times, where the ABT (average berthing time) is 21.5 h and APT (average port time) is 97.0 h as shown in
Table 10.
4.3. Constraints of Handling Cargo by Quay Cranes
The third difficulty arises when the existing quay cranes limit the loading and unloading work of mega vessels. Through checking the outreach of a QC and the height of the crane, the limitation can generally be confirmed. Busan New-Port has quay cranes that have an outreach of 24 container rows and 35 or 42.67 m of rail gauge as shown in
Table 11. The outreach of 24 QC rows is calculated as follows: the length from the center of the ocean side rail to the berth line is 6.5 m, the length from berth line to the fender is 1.4 m, the width of container loading is 24 rows and 62 m, and the ship angle of pitch is 1.5° and 0.78 m. The sum of the value is 70.4 m total. The outreach of the QC to handle 24 rows of ships should be a minimum of 70.4 m for container ships under 22,000 TEU. If a 25,000 TEU ship or 30,000 TEU ship calls at the terminal, the outreach of the QC should be a minimum of 74.3 m or 81.0 m, respectively as shown in
Table 12.
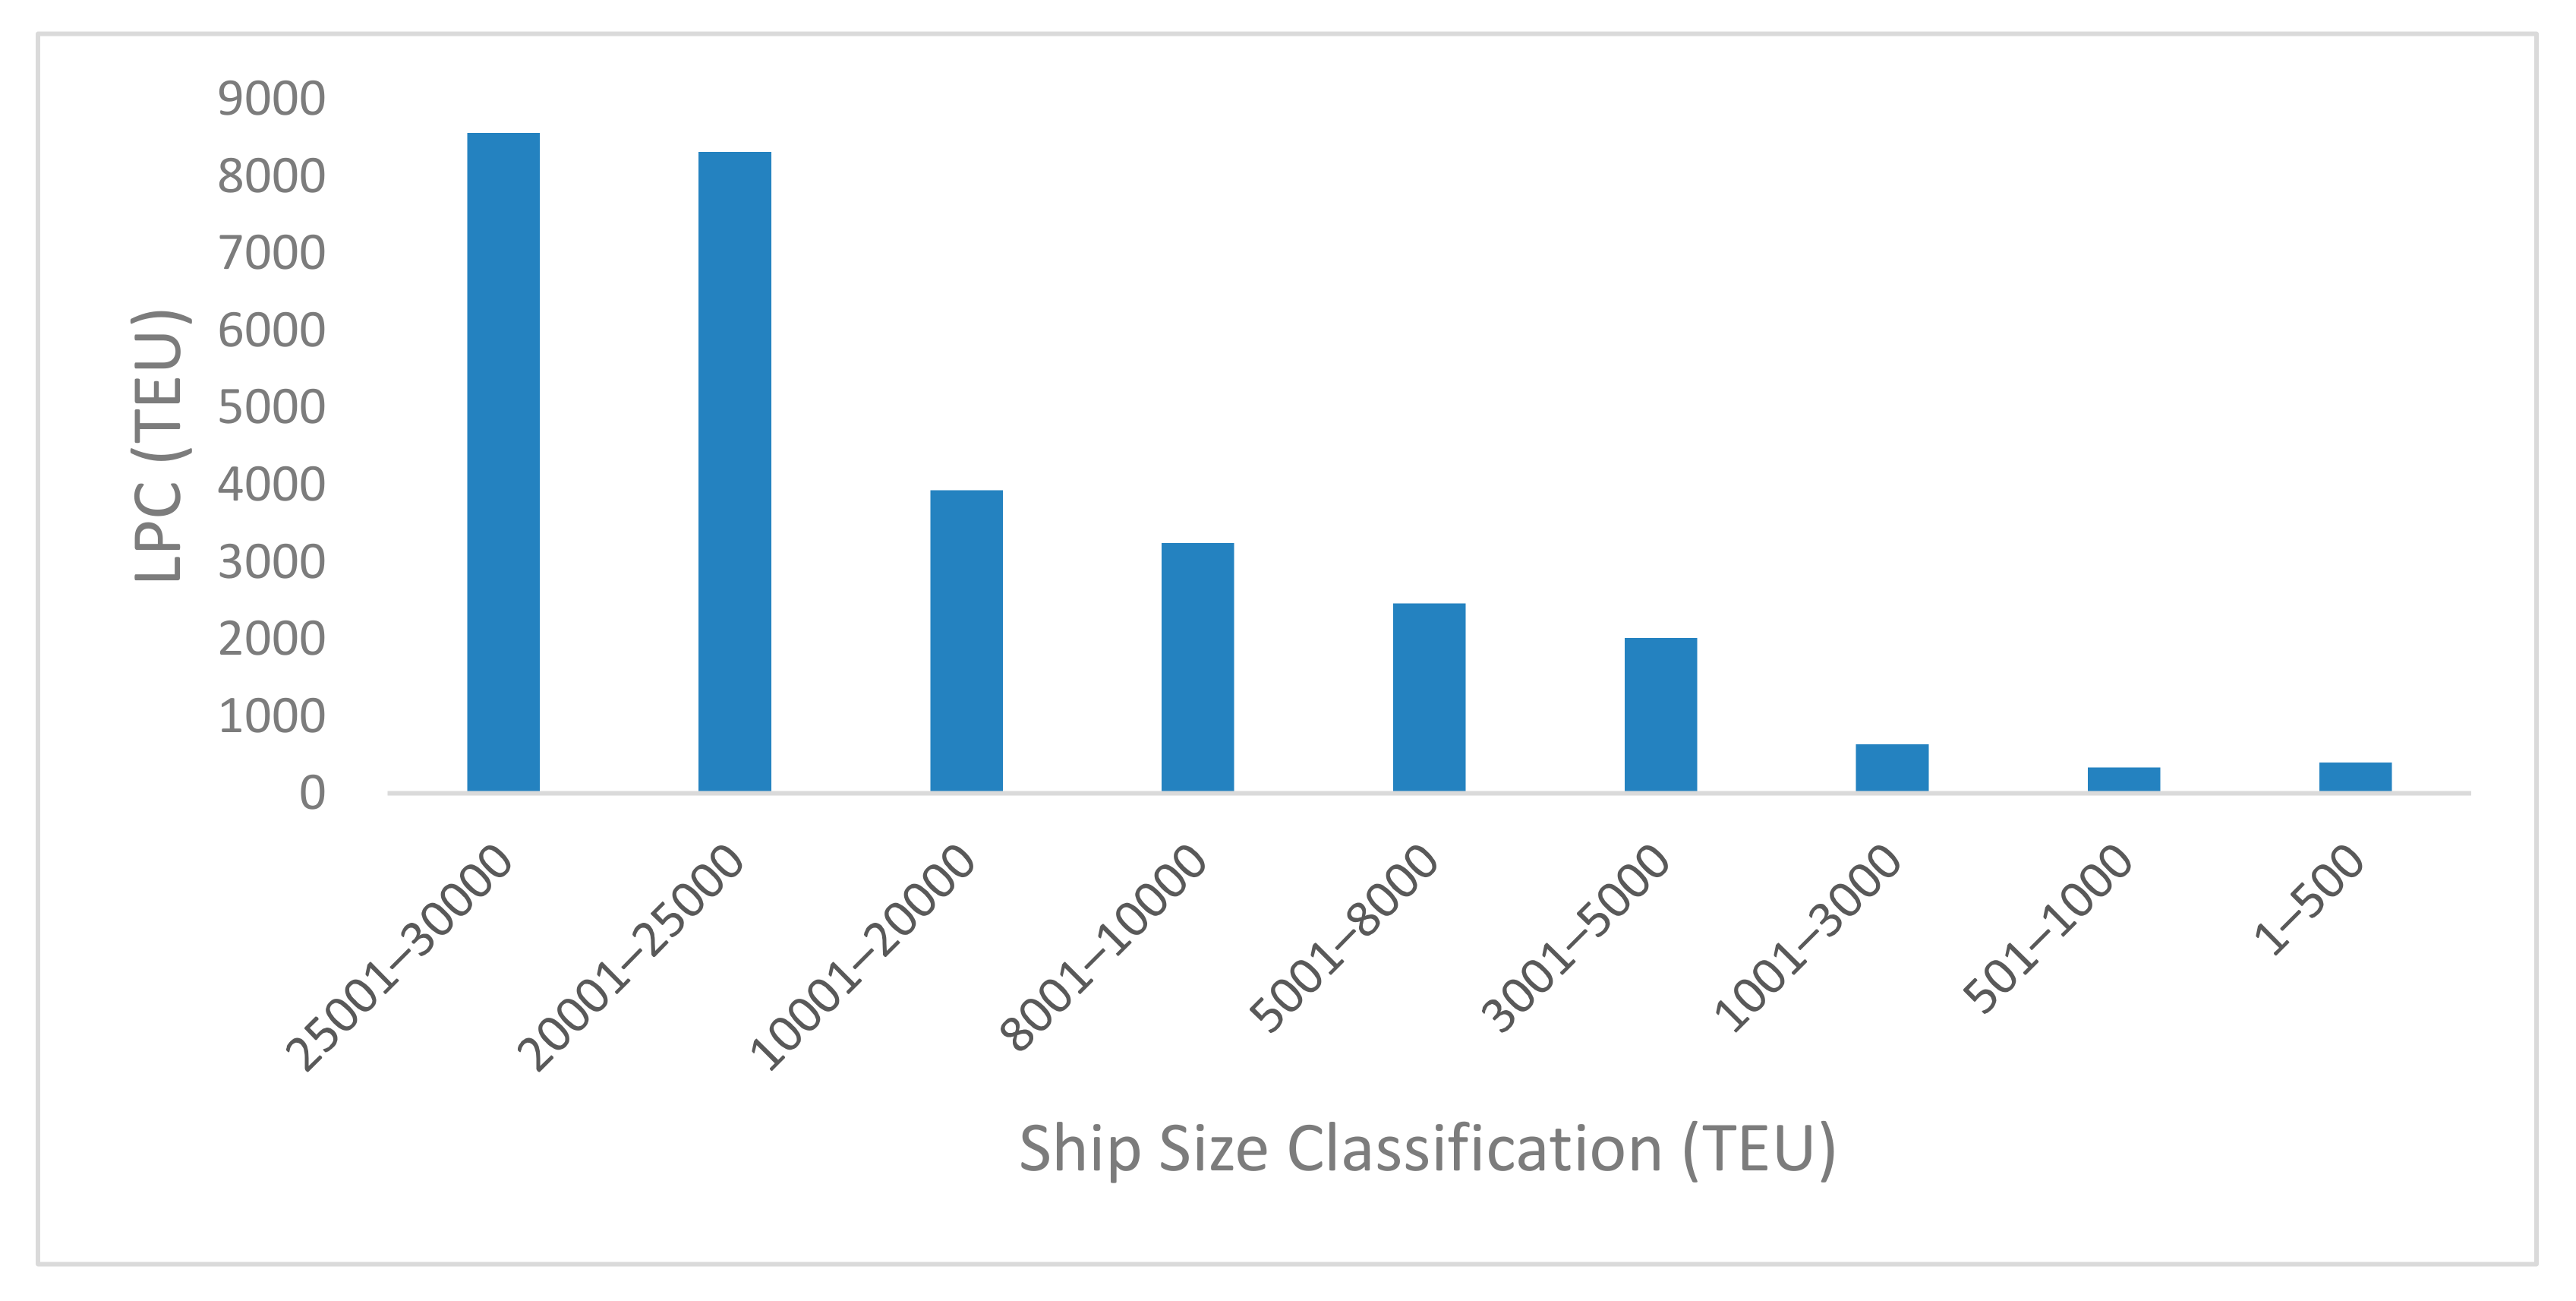
4.4. Constraints of Yard Capacity and Yard Equipment
As megaships are calling at the port, the available stacking area and the number of handling equipment can be limited too. According to the collected data from 2014 to 2016 from PORT-MIS, larger ships tend to carry more LPC (lifts per call) than those of smaller ships (
Figure 5). If a mega container ship of 22,500 TEU and 27,500 TEU calls at a terminal, the LPC of an 8000 TEU will be loaded and unloaded simultaneously with a 31.2% load rate. The amount of LPC of megaships increases by more than 2 times those of 15,000 TEU ships as shown in
Table 13 and
Figure 5.
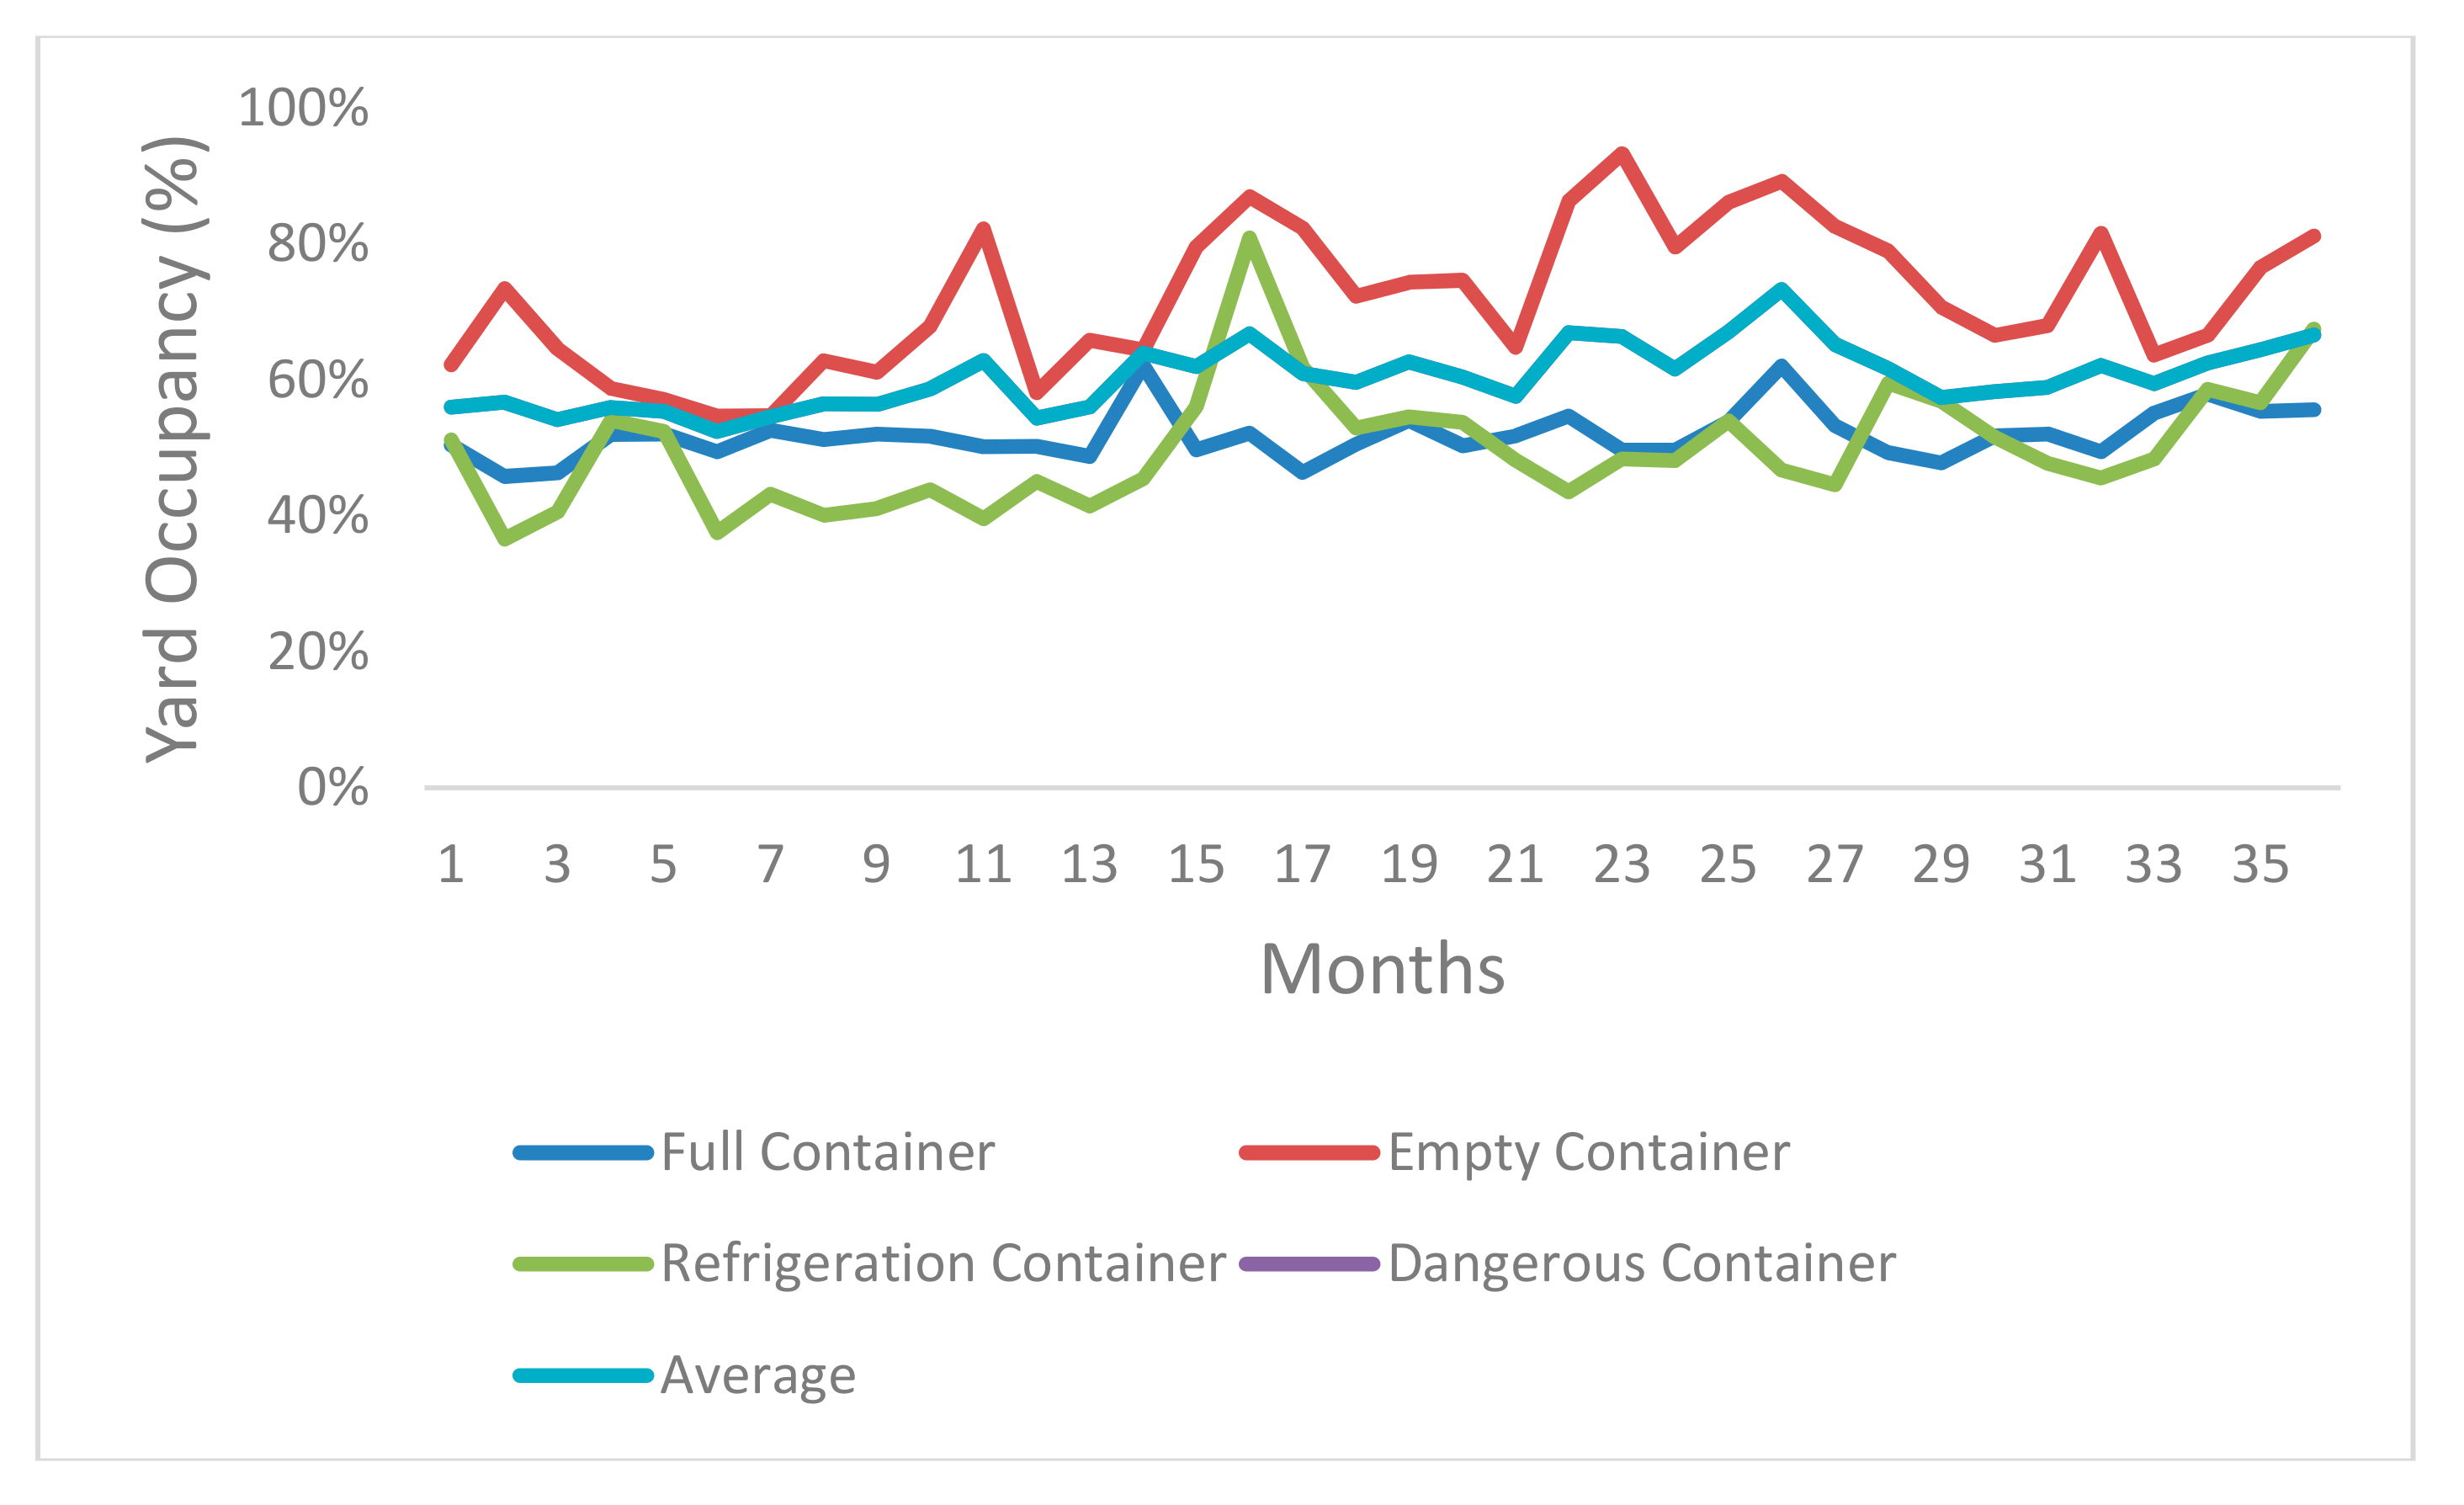
In order to deal with yard capacity in container terminals, monthly yard occupancy rates in a terminal was analyzed over the course of 3 years. The data on yard occupancy were directly collected from a TOC (terminal operation company). The average occupancy was 60.4%, the standard deviation was 4.7%, the minimum occupancy was 52.4%, and the maximum occupancy was 73.3% (
Figure 6). If mega ships of more than 20,000 TEU were alongside other ships, the occupancy rate of the yard excessively increased during peak time.
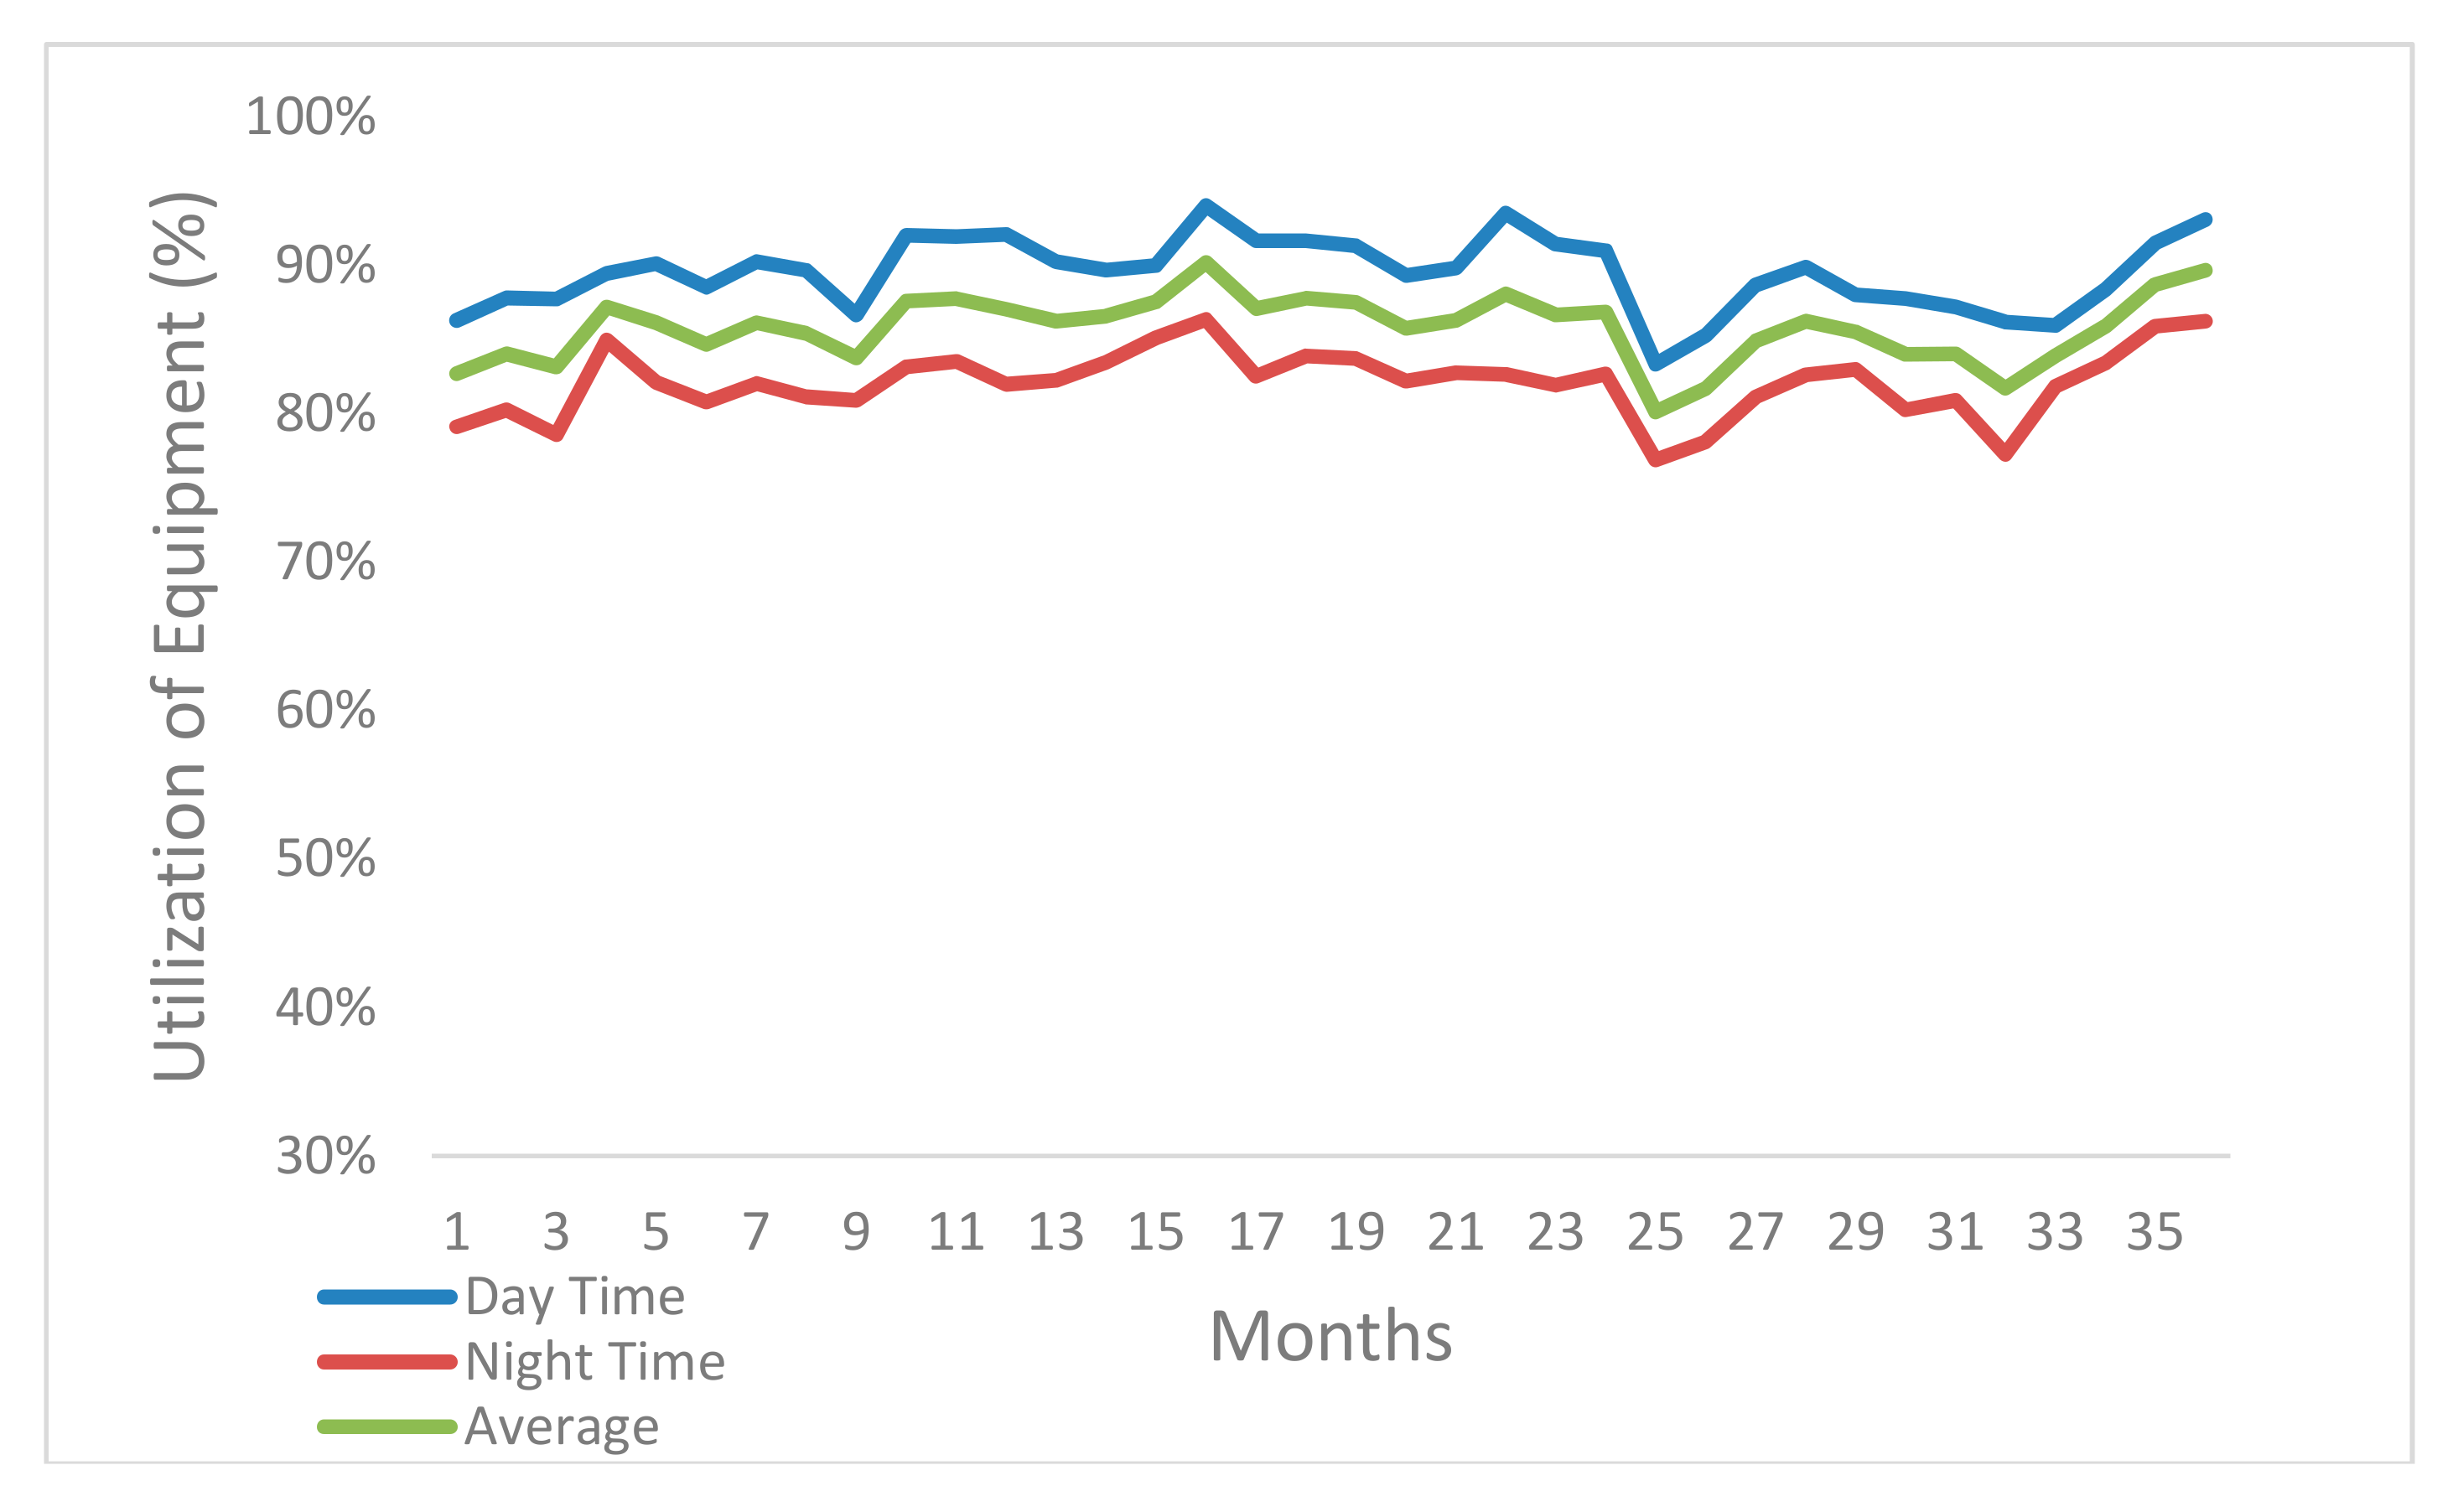
In order to deal with the equipment operation rate in the container terminal yard, monthly equipment operation rates over 3 years was analyzed. The yard equipment included RTG (Rubber Tired Gantry Crane), RMGC (Rail Mounted Gantry Crane), top handler, and reach stacker. The data of equipment operation rate were directly collected from a TOC. The average was 85.8%, the standard deviation was 0.37%, the minimum was 80.1%, and the maximum was 90.1% (
Figure 7). If megaships of more than 20,000 TEU were alongside berth with other ships, the rate was excessively increased at peak time.
5. Conclusions
This paper predicted the dimensions of mega container vessels and covers constraints of alternative ports. The prediction of megaships’ dimensions is conducted via regression analysis, and the data selection and the choice of the best fitting model are key factors to increase the reliability of this paper. To reduce errors of the prediction equations, ships over 8000 TEU were selected among large vessels on the shipbuilding market, and the ship with the least standard error was picked for the calculation, while the estimation of breadth reflected the historical trend. The biggest ship currently in a shipbuilding contract was HMM’s vessel which is 23,000 TEU, but a 30,000 TEU mega ship is predicted to appear in the shipbuilding market in 2025.
As a result of the analysis, the dimensions of a 22,000 TEU ship is predicted to measure 415 m lengthwise with a breadth of 62.0 m (24 rows) and a summer draft of 16.6 m, while a 25,000 TEU ship is predicted to measure 431 m lengthwise with a breadth of 66.0 m (26 rows) and a summer draft of 16.9 m, and a 30,000 TEU ship is expected to be 453 m in length, 72.0 m of breadth (28 rows), and 17.3 m of summer draft.
As the outreach of QCs in most of container terminals was less than 70.4 m, they can handle container ships smaller than 22000 TEU.
If a 30,000 TEU ship calls at a port, the depth of the water level of terminals with 20 m needs to increase, and the cost would be excessive. This fact suggests that newly constructed terminals need to be at least 20 m deep in order to accommodate mega ships.
The length of 30,000 TEU ships are predicted to be 453 m. As the gap between ships is 10% of the length of the ships, a vessel occupies 498 m of a quay wall. Considering the length of megaships, the length of berth should be more than a minimum of 500 m. Recently opened ACT (automatic container terminals) after 2015 have a length of berth more than 1000 m.
For a 25,000 TEU ship or 30,000 TEU ship, the outreach of the QC should be a minimum of 74.3 m or 81.0 m respectively. As the new ACTs have set up QCs to handle 24 rows of 22,000 TEU container ships, container terminals should consider that the outreach of QCs will be more than 80 m like the T2 of Jebel Ali terminal in Dubai port.
Importantly, the waiting time of mega ships has increased in order to allocate the proper seat on a berth. The result of average waiting times in of Busan New-Port has implications that larger ships wait longer than the smaller ones. To effectively reduce megaship waiting time, a terminal should make a differentiated berthing plan based on ship size, berthing time, and cargo handling priority. Mega ship calling causes the yard occupancy rate to increase in a terminal. A result of this survey shows the average of occupancy to be 60.4%, the minimum being 52.4% and the maximum being 73.3%. At peak times, the maximum occupancy indicates the yard capacity exceeded a proper utilization rate of 60%. Yard equipment operation rates increased with the occupancy rate of yard capacity for megaship calling. After surveying monthly equipment operation rate over a 3-year period, the average was found to be 85.8%, the minimum being 80.1%, and the maximum being 90.1%. This means the yard equipment was fully utilized. If a megaship of more than 25,000 TEU appeared, the rate excessively increased during peak time.


