Article

Towing Operation Methods of Offshore Integrated Meteorological Mast for Offshore Wind Farms

1
State Key Laboratory of Hydraulic Engineering Simulation and Safety, Tianjin University, Tianjin 300072, China
2
Key Laboratory of Coast Civil Structure Safety, Ministry of Education, Tianjin University, Tianjin 300072, China
3
School of Civil Engineering, Tianjin University, Tianjin 300072, China
*
Author to whom correspondence should be addressed.
J. Mar. Sci. Eng. 2019, 7(4), 100; https://doi.org/10.3390/jmse7040100
Submission received: 22 January 2019 / Revised: 30 March 2019 / Accepted: 3 April 2019 / Published: 11 April 2019
(This article belongs to the Special Issue Marine Structures)

Abstract

:
An offshore integrated meteorological mast (OIMM) is introduced which has great application potential for the development of offshore wind turbine power. This innovative OIMM features in two aspects: the integrated construction and the integrated transportation. Its integrated techniques enable this OIMM to be prefabricated onshore and transported by a relatively small tugboat to the installation site. It is efficient in construction, rapid in transportation and saving in cost. The towing process is an important section for the integrated transportation, which makes the towing operation necessary to investigate. With the numerical simulation software MOSES, the hydrodynamic behavior of the towing operation is investigated. Two special wet towing methods (surface towing and submerged towing) are adopted and analyzed in terms of the towing resistance, towing speed, fairlead position and the motion response. The results show that for both towing methods, to obtain a higher speed by increasing the towing force is uneconomic since the towing resistance increases a much higher percentage than the towing speed dose. Surface towing has a smaller resistance but larger motion response compared to submerged towing. The submerged towing shows a clear descending heave motion. The heave and pitch motions are smaller with the lower fairlead position and fluctuate less with deeper submerged depth.

1. Introduction

The development of offshore wind turbine power characteristics is based on the anemometer technology including both meteorological mast structures and measurement devices [1]. While the primary problem for an offshore meteorological mast is associated with the structure design. Offshore meteorological masts are usually required to be installed on a fixed or a floating foundation. It can be expensive to install such a foundation or platform and maintain the instrument in an offshore location [1]. Tianjin University and Dao Da Heavy Industry Company (DDHI) developed an offshore meteorological mast with an innovative foundation as an integrated structure (OIMM) that reduces costs by shortening the installation process and narrowing down the required amount of marine operation equipment [2,
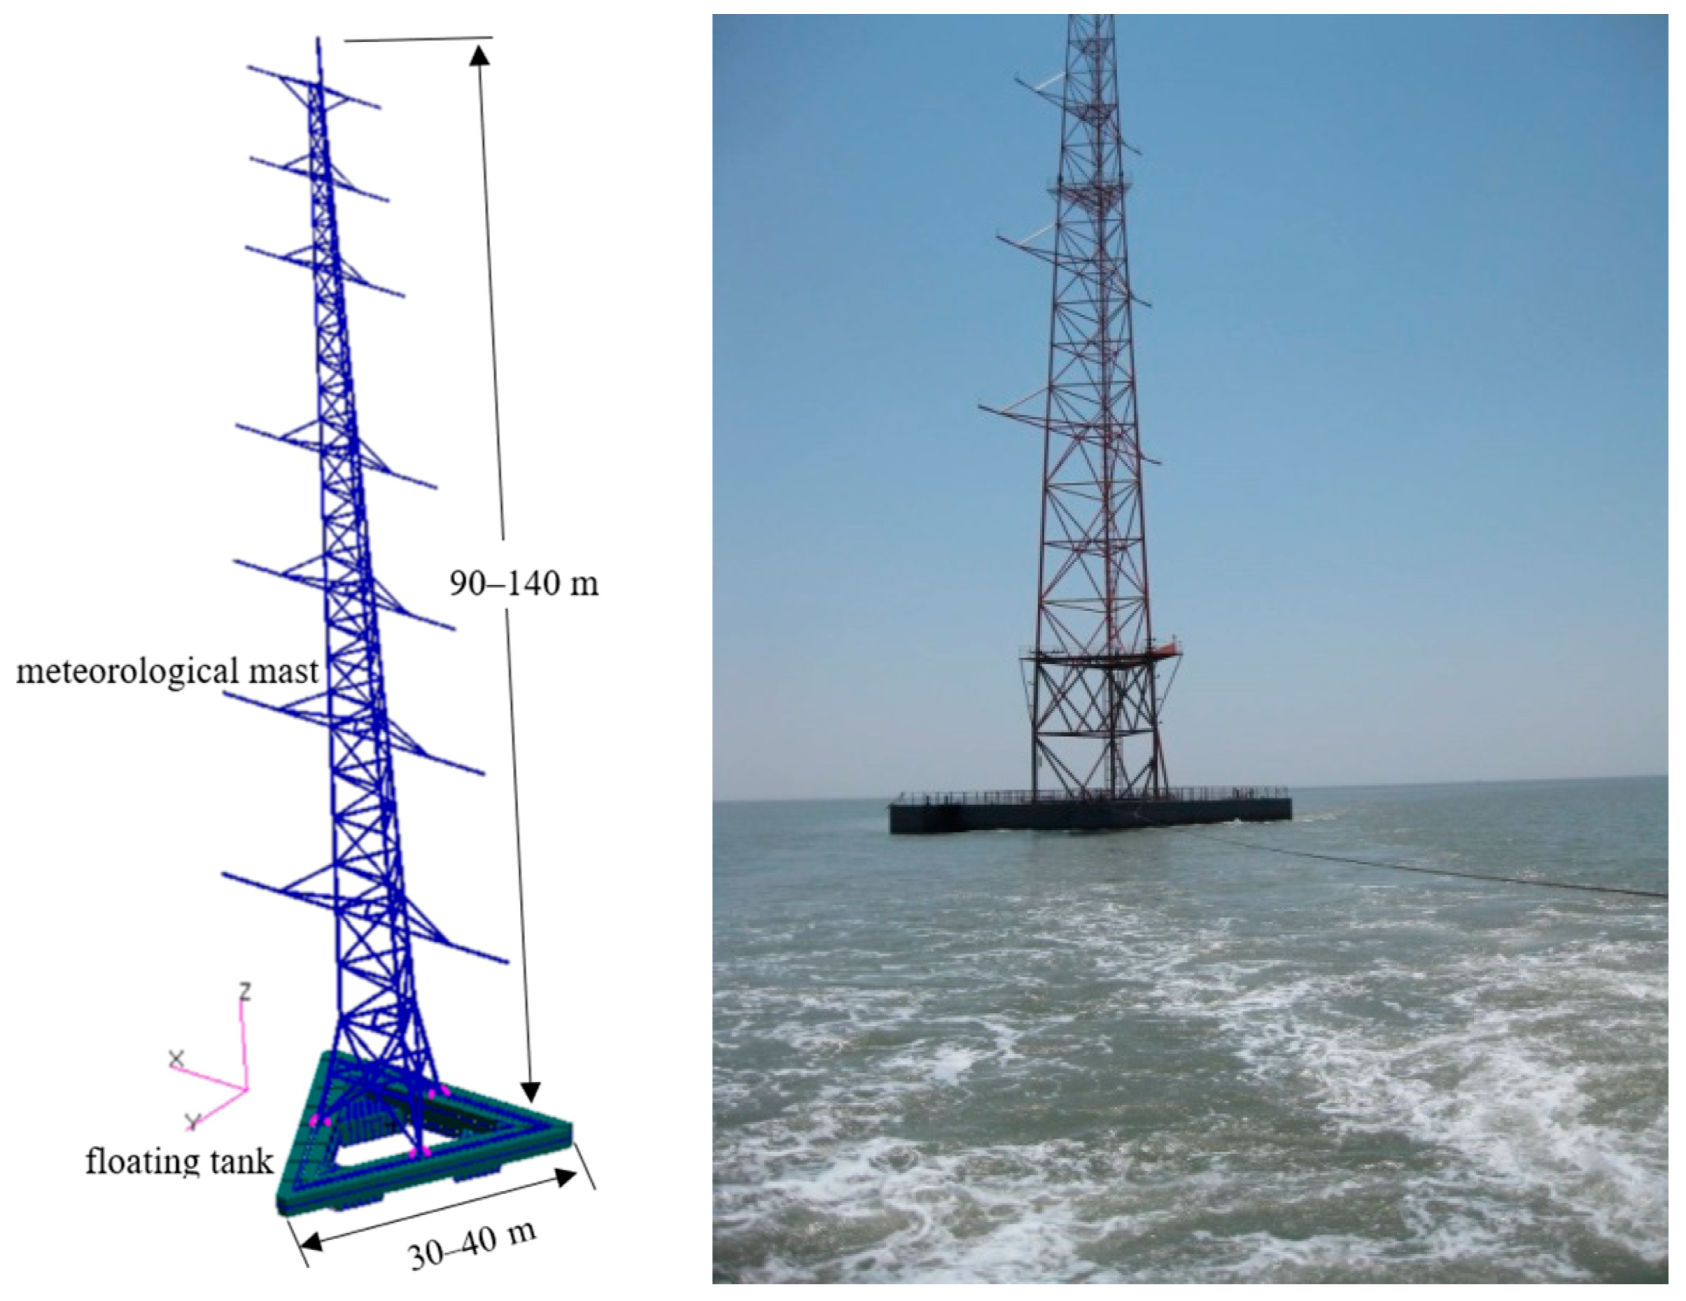
3]. This offshore integrated meteorological mast (OIMM) is shown in Figure 1 with the transporting operation. The OIMM excels in two aspects: the integrated construction and the integrated installation. It can be manufactured onshore, hoisted into the sea and wet towed to an installation site. Since the structure has a big triangular floating tank, thus it can be self-floating and wet towed. As can be seen in Figure 1, the OIMM has three major components: the upper meteorological mast, the floating tank, and the anti-slide skirt plates (bottom).
The design concept of this OIMM is based on many former research [4,5,6] about the one-step-installation technology applied in the lager-scale composite bucket foundation (CBF). However, the construction and installation process for the OIMM are more simplified and different, because it has a relatively small dimensional size of infrastructure and a much higher superstructure. Generally, the entire OIMM weights about 300 t, and it has a height varying from 90–140 m, which can be adjusted based on specific requirements. The huge floating tank usually has multiple subdivisions inside to function as individual ballast compartments and to facilitate the stability adjustment during the wet-towing. It can also function as a gravity type foundation during the service life. The upper structure is a meteorological mast that carries many wind measurement devices. The bottom anti-slide skirt plates penetrate the sea bed working as suction caissons, and providing horizontal righting moment by the lateral resistance.
Many publications are focused on the offshore structure installation technology to understand the behavior of the structure and estimate the feasibility of this installation process. The basic dynamics of a subsea template, assembled system, were studied by calculating the dynamic forces and displacements by using time integration in SIMO (simulation of marine operations, SESAM package) [7,8]. They estimated the tension of a lift wire by SIMO and a simplified method simulating this dynamic system which agreed well with the experimental investigation. The feasibility of dry transport a TLP (tension leg platform) by a heavy lift transport vessel was studied, and the motion behavior of TLP structure and its transport vessel were evaluated [9]. Eriksson and Kullander [10] conducted a wet towing of a substructure with special equipment and vessels in Sweden. Some researchers focus on the towing stability feature and important influence factors in terms of the different sea conditions for a floating platform and offshore wind turbines [11,12,13,14]. A dynamic analysis of the wet tow for a floating wind turbine based on a multi-body model in SESAM has been performed by Ding et al., and the towline force and the stability features are studied [15]. While a comparison of the cost estimation between the dry towing and the wet towing for a semisubmersible platform, conducted by Kim et al. [16], suggests that the wet towing is more cost-saving for this structure. More installation solutions, especially for deepwater structures, backed by engineering tools and numerical simulation methods are discussed by Wang et al. [17] with main characteristics and critical challenges.
Little research has been done on the offshore meteorological mast, especially for the transport operation. Based on the above research, this paper adopts two special wet towing methods to the innovative OIMM and compares the corresponding dynamic performance by using the numerical simulation software MOSES (offshore platform design and installation software). The purpose is to obtain the feasibility of the two towing methods with respect to its reliability and operability. 
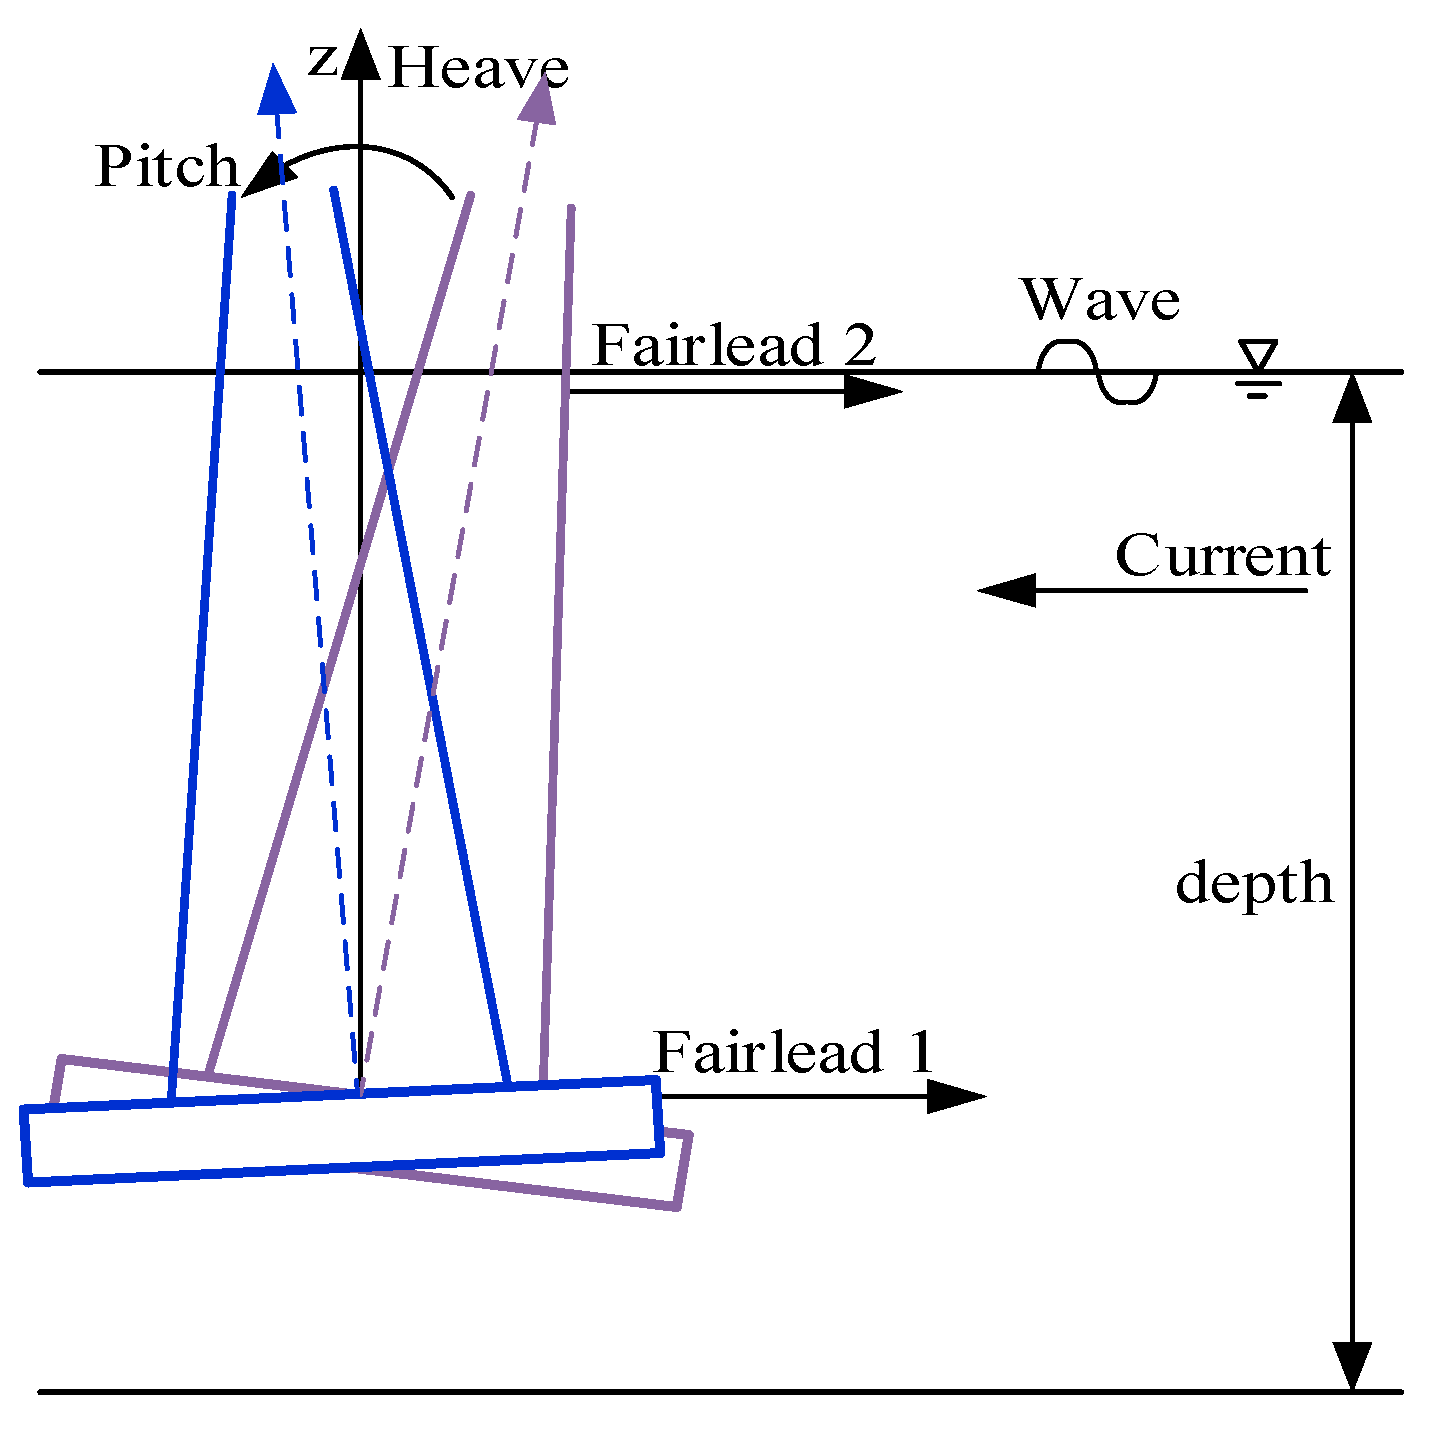
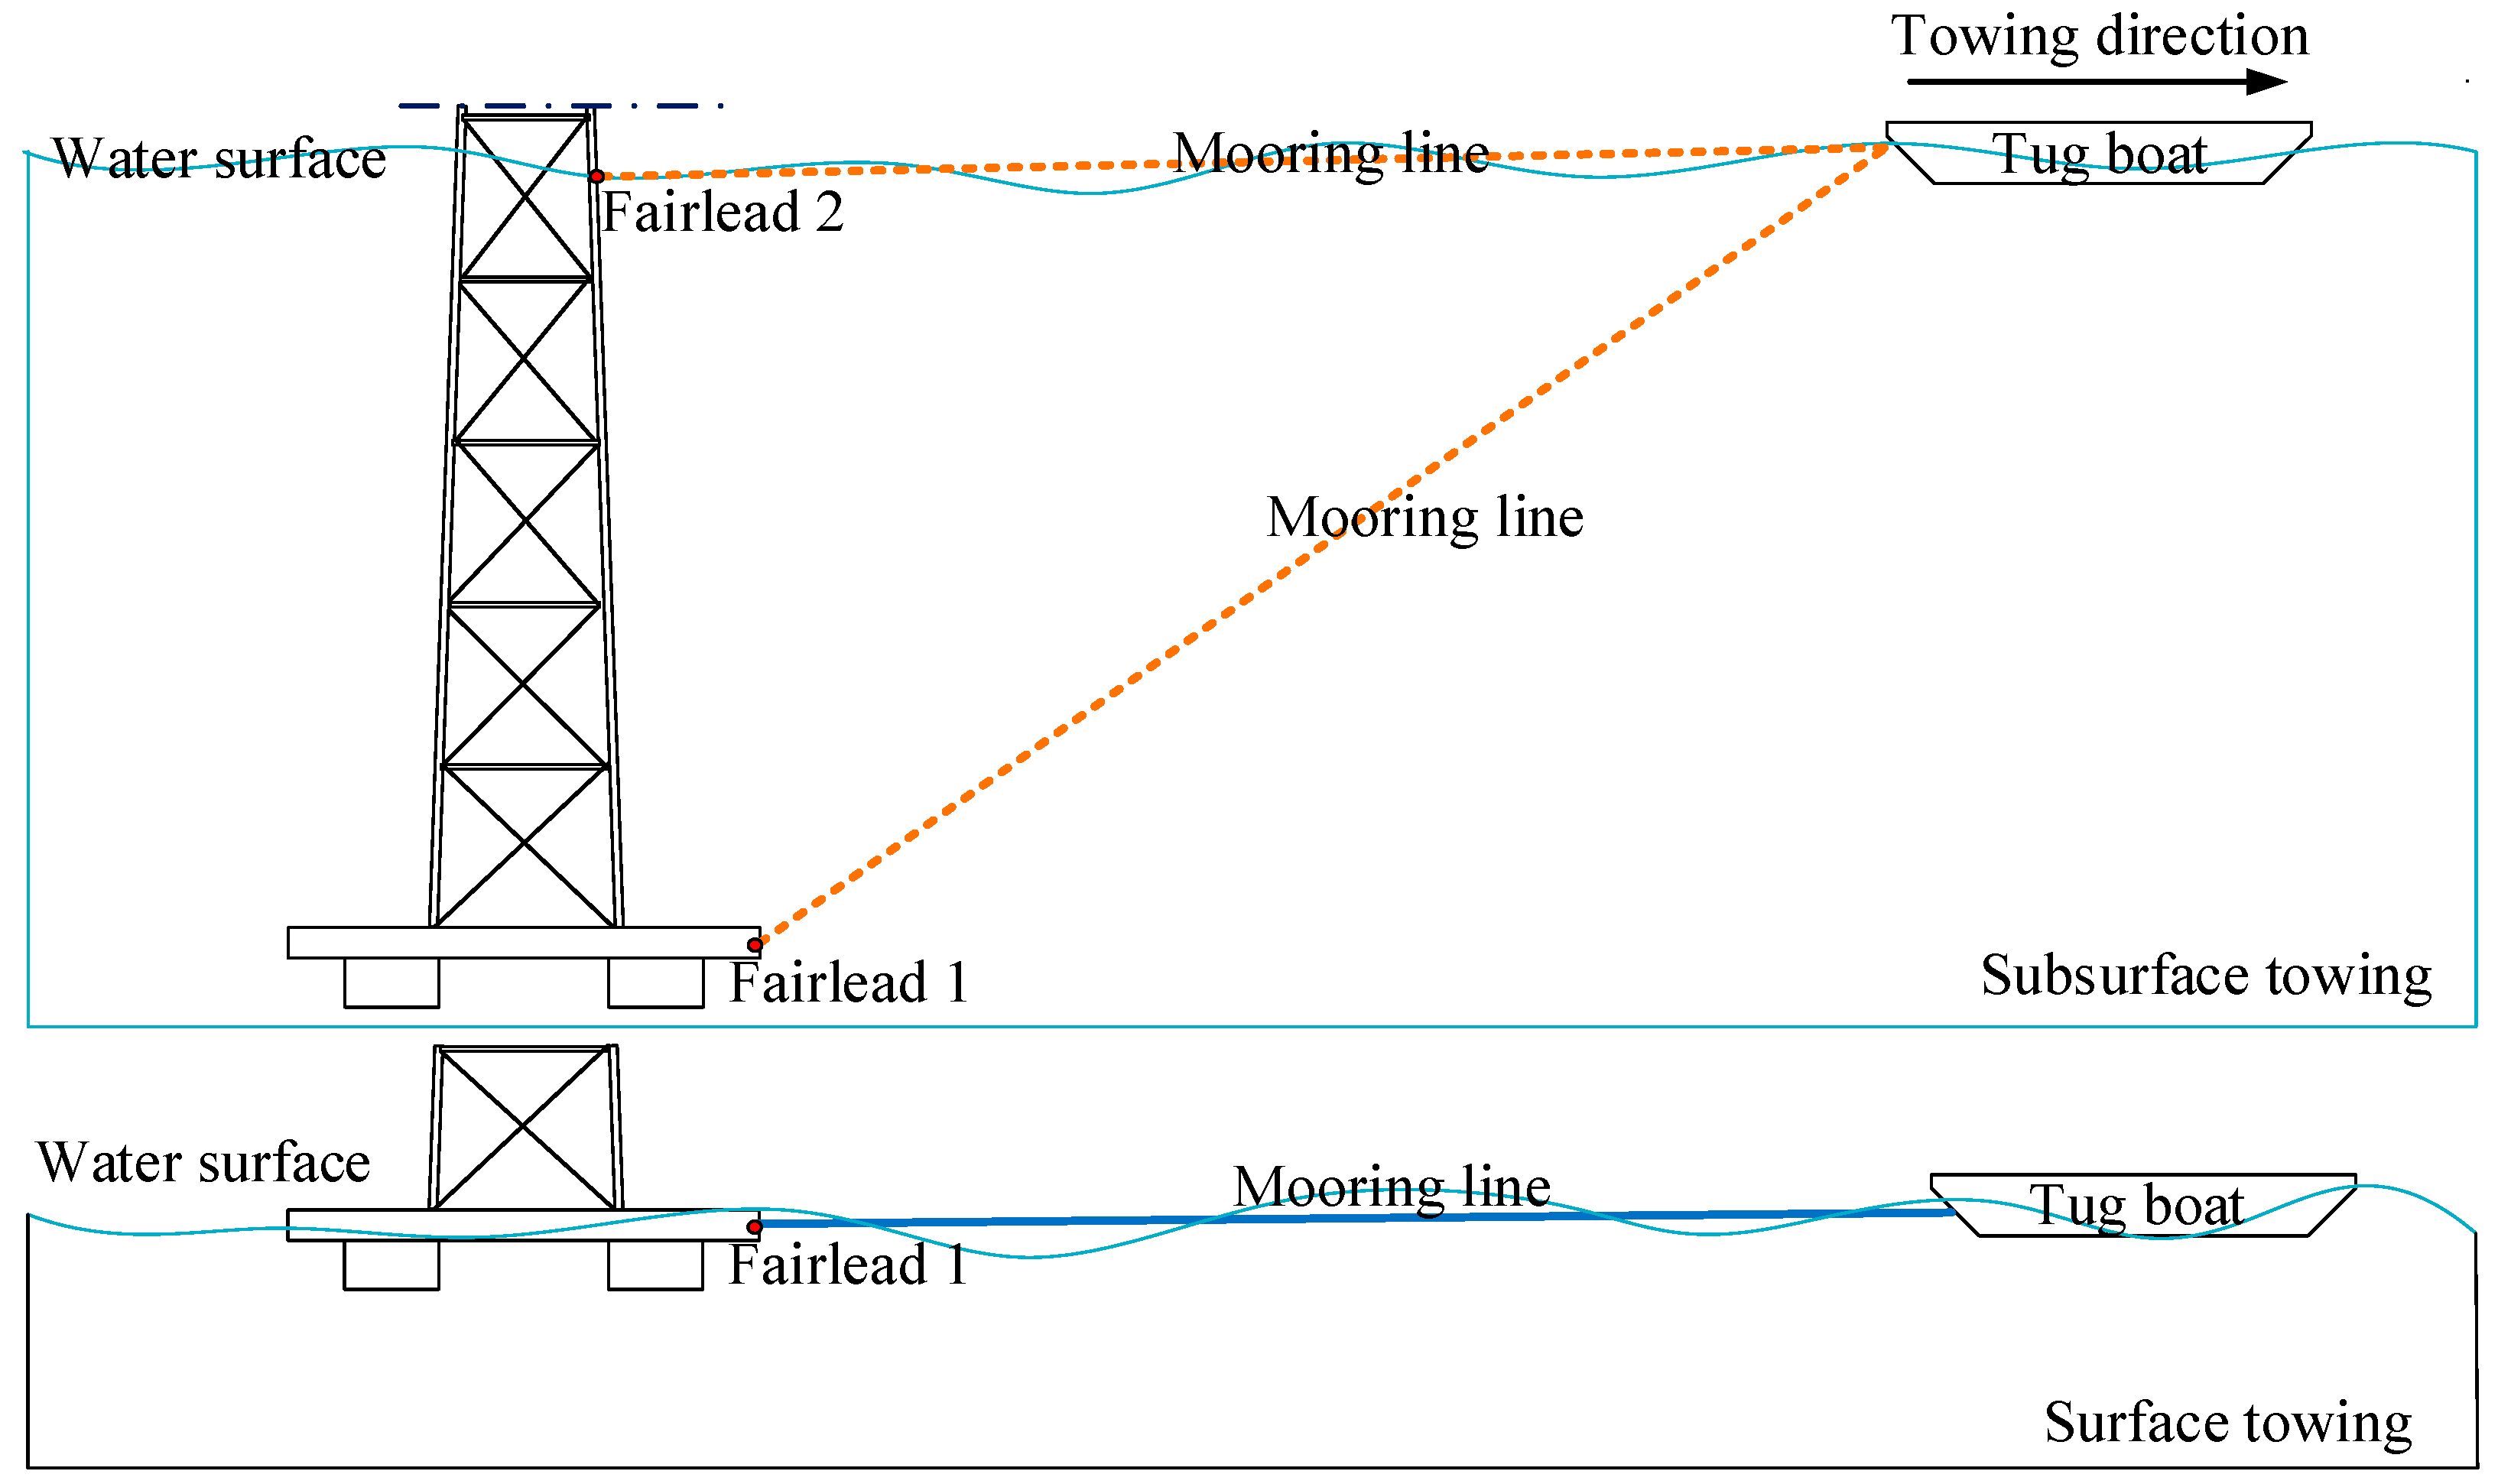
Figure 2 demonstrates the detailed information of the applied towing methods: the surface towing and the submerged towing (or subsurface towing). As for the submerged towing method, the mooring point can either be attached to the floating tank (fairlead 1) or to the mast (fairlead 2). While for the surface towing method, the mooring point is attached to the floating tank (fairlead 1). The OIMM is designed to be suitable for a water depth around 50 m. Therefore, when performing a submerged towing simulation, the submerged depth of the OIMM is defined varying within 0–40 m. For the surface towing method, it is simple with only one submerged depth (draft). The towing resistance based on these two methods is obtained and compared between the MOSES simulation and the manual computation method. The towing speed and hydrodynamic motion responses relating to the mooring positions are also considered and compared. The results can provide recommendations and references for the estimation of the feasibility of the two methods and on the optimization of the towing operation for OIMM.
The paper is organized as follows. Section 2 introduces the relevant methods for the computation of the towing resistance and the hydrodynamic theory. A comparison of towing resistance between the numerical method and manual method is shown in Section 3, as well as the detailed explanations about the towing speed and the mooring positions. Section 4 illustrates the results based on the discussion in Section 3, and conclusions are drawn in Section 5.

2. Theory Background

The towing resistance is a basic parameter, on which the towing system depends. The estimation methods have been investigated by many researchers [18,19] in terms of the speed reduction and numerical calculation. The total resistance for different sea states can be described by four different types of resistance: surface friction, energy loss due to wave generating, energy loss due to current, wind resistance. For low speed towing, the surface friction counts for a majority. According to DNV-RP-H103 [20], the tug will have the maximum towing force at zero velocity and in the absence of wind, waves and current, and the available towing force decreases with forward velocity. In this paper, the towing resistance is obtained from two methods: the numerical computation by MOSES, and the manual computation by the Guidelines for Towage at Sea (CCS code) [21].

2.1. Towing Resistance By MOSES

In MOSES, the towing resistance is primarily influenced by the wind force and the viscous drag force. The viscous drag force is illustrated as a portion of the system which is the velocity squared term in Morison’s equation, the viscous roll damping, or the viscous drag on a piece. This can be either an excitation due to wave or current, or a damping in still water [22]. Generally, MOSES employs three hydrodynamic theories: Morison’s equation, strip theory, and 3D-diffraction theory. The Morison’s Equation is used for beam element and the viscous drag will be computed. For panel model, the 3D-diffraction theory is applied.
The drag force on a cylinder in an unsteady viscous flow is determined by Morison’s Equation, which consists of a combination of an inertia term and a drag term:
d F = ρ π D 2 4 C M V ¨ + ρ 2 C D D | V | V
where d F is the force per unit length of a cylinder [N/m], D is the diameter of cylinder [m], ρ is the density of fluid [kg/m3], C M is the mass coefficient, C D is the drag coefficient, V ¨ is the acceleration [m/s2].
Drag force on submerged element consists mainly of friction resistance and pressure resistance. Friction resistance can be expressed as:
F = 1 2 C F ρ V 2 S
where F is the friction resistance on object [N] and V is the towing velocity [m/s]. C F is the dimensionless friction coefficient depended on the Reynolds number. S is the wet surface area of the object [m2].
The pressure distribution on panel element can be found by velocity potential function and Bernoulli’s equation with boundary conditions [23].
V = Φ i Φ x + j Φ y + k Φ z
p + ρ g z + ρ Φ t + ρ 2 V · V = C
where p is the pressure in Bernoulli’s equation, C is an arbitrary function of time.

2.2. Towing Resistance By Code

As for the manual computation, the Guidelines for Towage at Sea (CCS code) provides an estimation of ocean towage resistance considering the towing speed, by the following empirical equation:
R T = 1.15 [ R f + R B + ( R f t + R B t ) ]   kN
R f = 1.67 A 1 V 1.83 × 10 3   kN
R B = 0.147 δ A 2 V 1.74 + 0.15 V   kN
where: Rf and RB are the friction and the residual resistance of towed vessel, in kN; Rft and RBt are the friction and the residual resistance of towing vessel, in kN; A1 is the wetted surface area under waterline of vessel or surface structure, in m2; V is the towage velocity, in m/s; δ is the block coefficient; A2 is the submerged transverse section area amidships, in m2. Rf is the residual resistance of towing vessel, in kN.
For drilling units or other surface structures with huge wind area, the towage resistance is also to be calculated as follows, taken whichever is greater:
R = 0.7 ( R f + R B ) + R a   kN
R a = 0.5 ρ V 2 C x A i × 10 3   kN
where: Rf and RB are the same as (1) above, and the Ra is the air resistance; ρ is the air density, to be taken as 1.22 kg/ m3; V is the wind velocity, to be taken as 20.6 m/s; A i is the wind area, to be taken as upwind, in m2; C x is the configuration coefficient of wind area.
Equations (5)–(9) are applied to compute the total towing resistance of the floating tank and the upper meteorological mast. The resistance of the towing vessel (tugboat) is not included in the total resistance so that it can be compared with numerical results for which the towing resistance is given separately.
The sea states in MOSES are defined according to the items in CCS guidelines. The wind velocity is 20.6 m/s, and the current velocity is 0.5 m/s. The towing speed is 3 m/s with a significant wave height of 2 m.
The results of towing resistance based on this code will be analyzed in Section 3.

2.3. The Hydrodynamic Theory

The motion of the OIMM is featured by the free surface boundary condition, which is nonlinear and makes the description of the body motion complex. Based on the potential theory, the dynamic responses of marine structures are widely studied. The problem of hydrodynamics can be formulated in terms of potential theory based on the following assumptions:
The sea water is assumed incompressible and inviscid. The fluid motion is irrotational. Viscous effects are neglected and the fluid is assumed to be incompressible. The depth h is finite and constant and the free surface is infinite in all directions. Assumed the motion of the body and the fluid to be small for a linearization of the boundary condition and free surface condition.
A velocity potential ϕ can be used to describe the fluid velocity vector V (x, y, z) = (u, v, w) at time t at the point X = (x, y, z) in a cartesian coordinate system fixed in space [23].
It is convenient to decompose the total velocity potential in the alternative forms [24]:
ϕ = ϕ 0 e i w t + ϕ 7 e i w t + i = 1 6 ϕ i η ˙ i
where ϕ 0 e i w t is the velocity potential of the incident wave system; ϕ 7 e i w t is the scattered field due to the presence of the body; the diffraction problem can be solved by considering the ϕ 0 and the ϕ 7 together; ϕ i , i = 1–6, is the contribution to the velocity potential from the i th mode of motion. Therefore the ϕ i ( i = 1–6) is called the radiation potential.
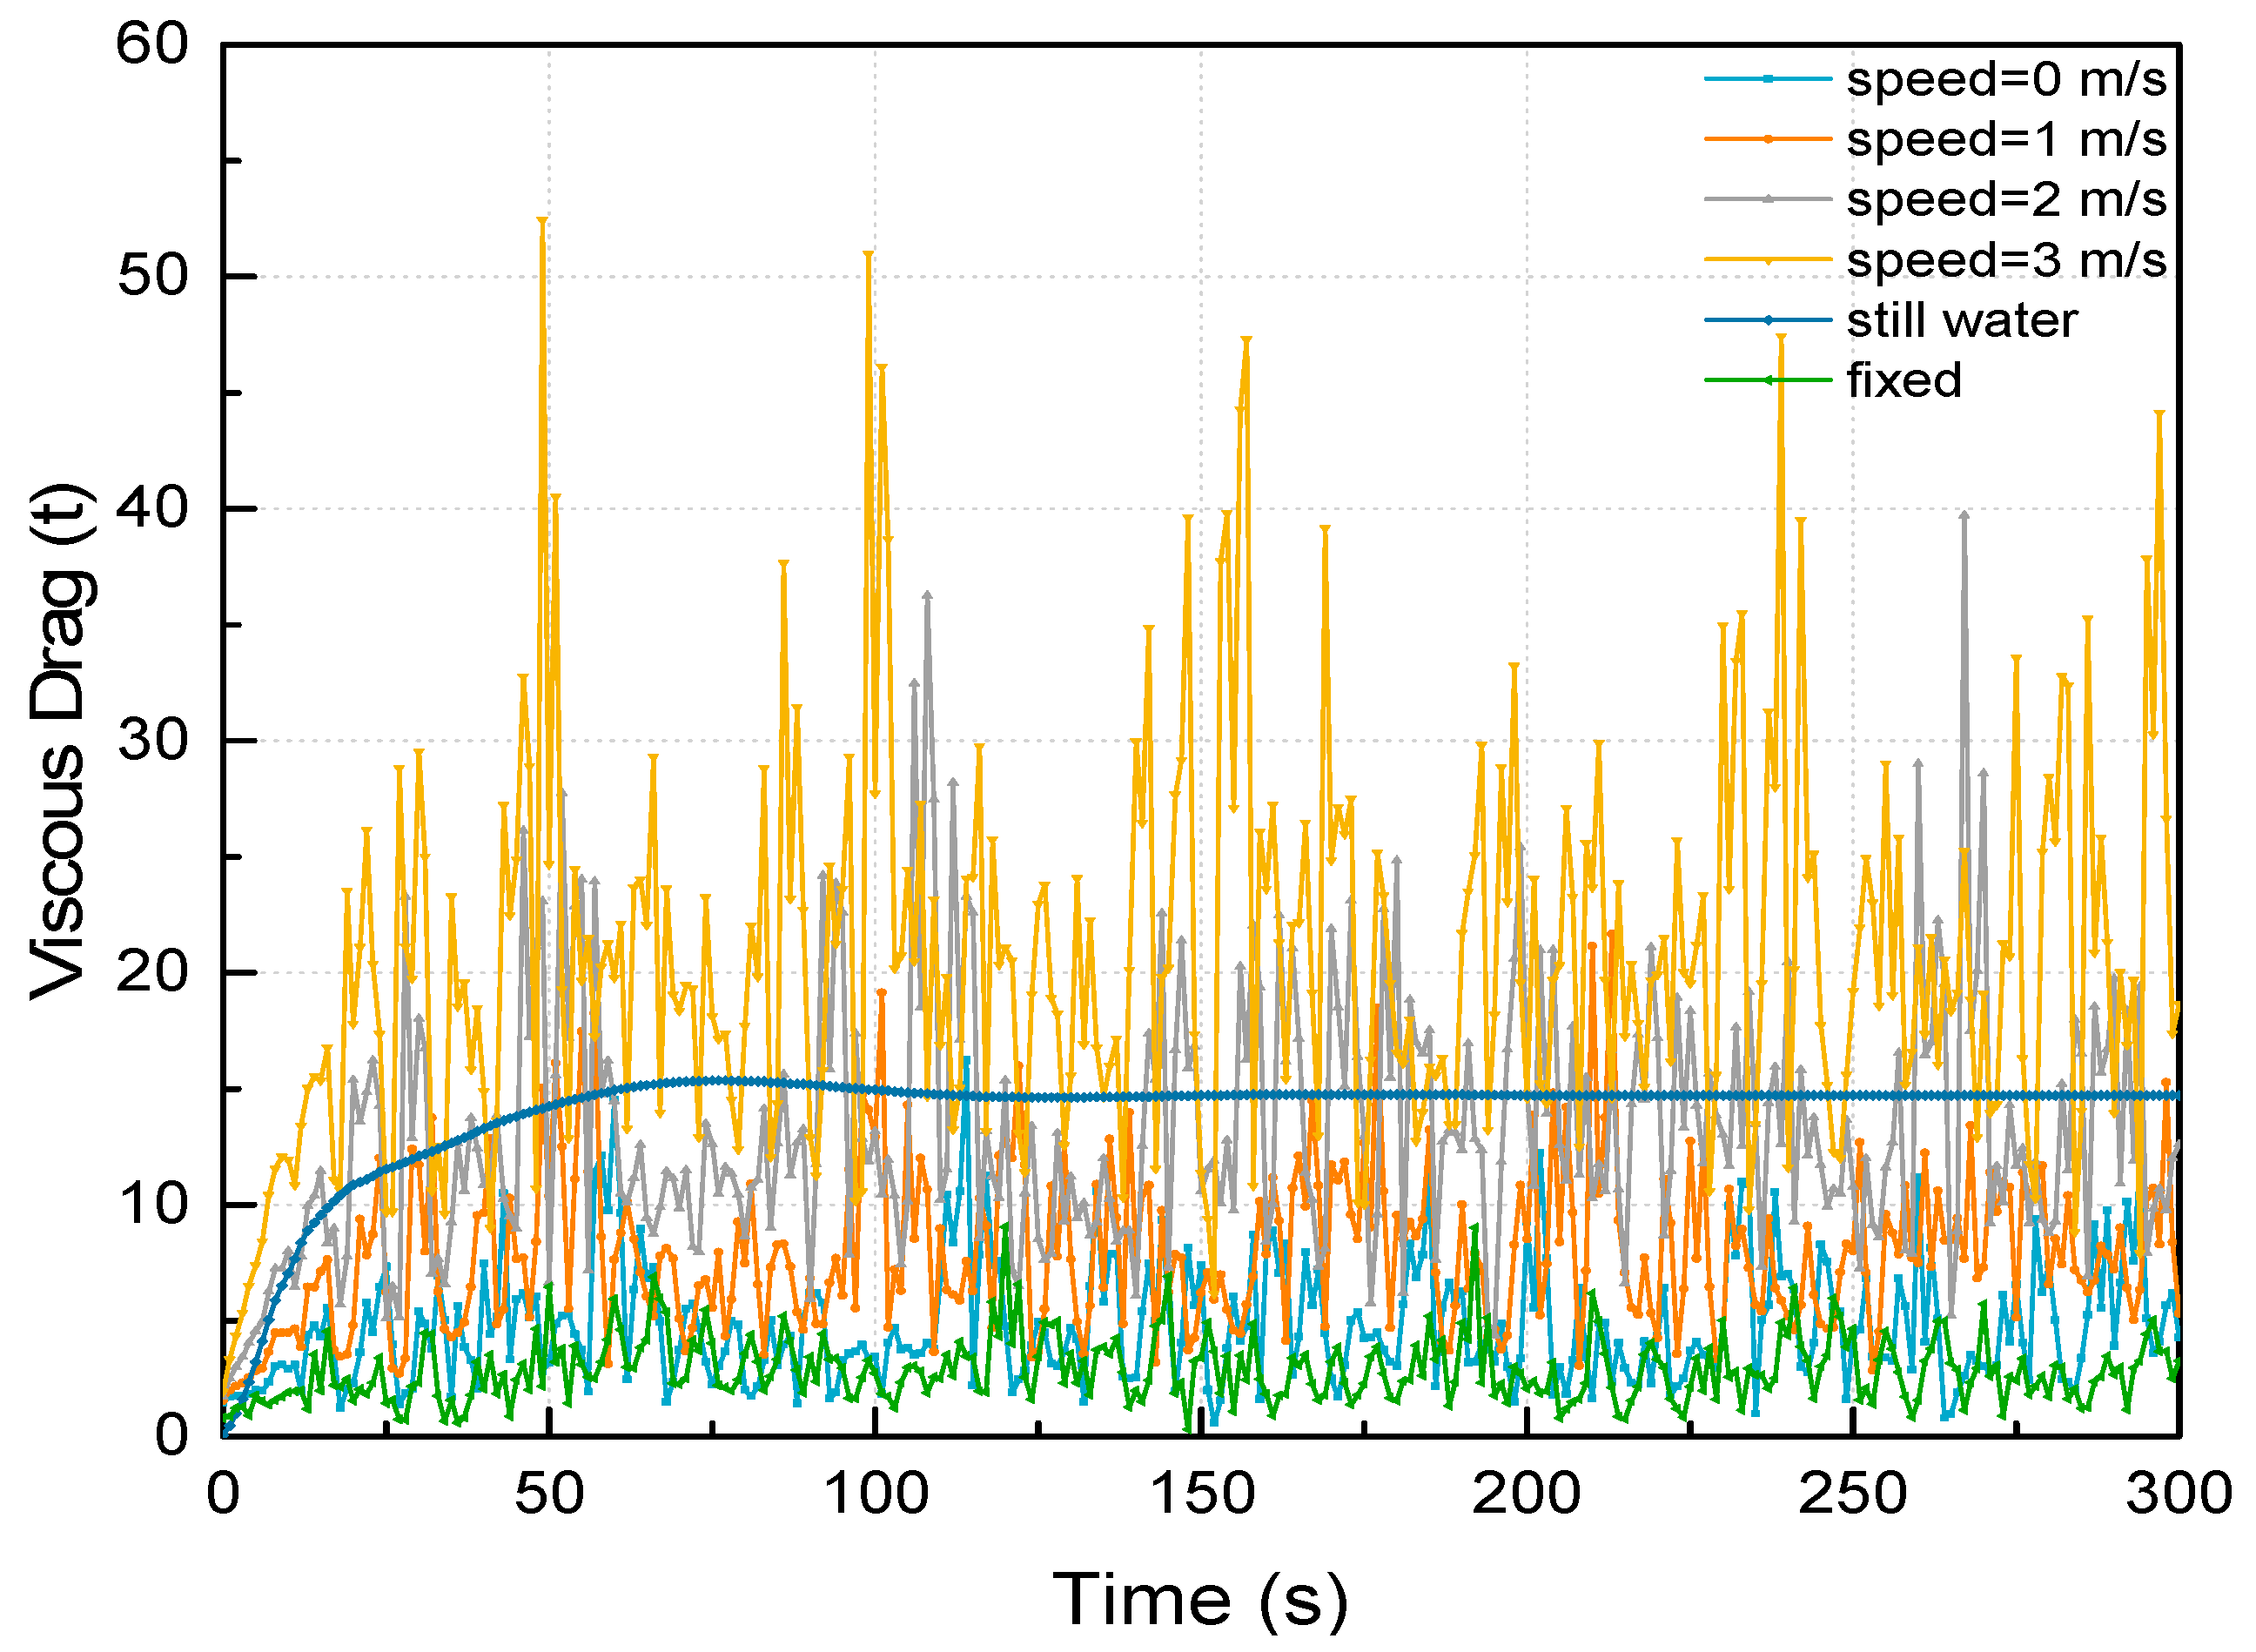
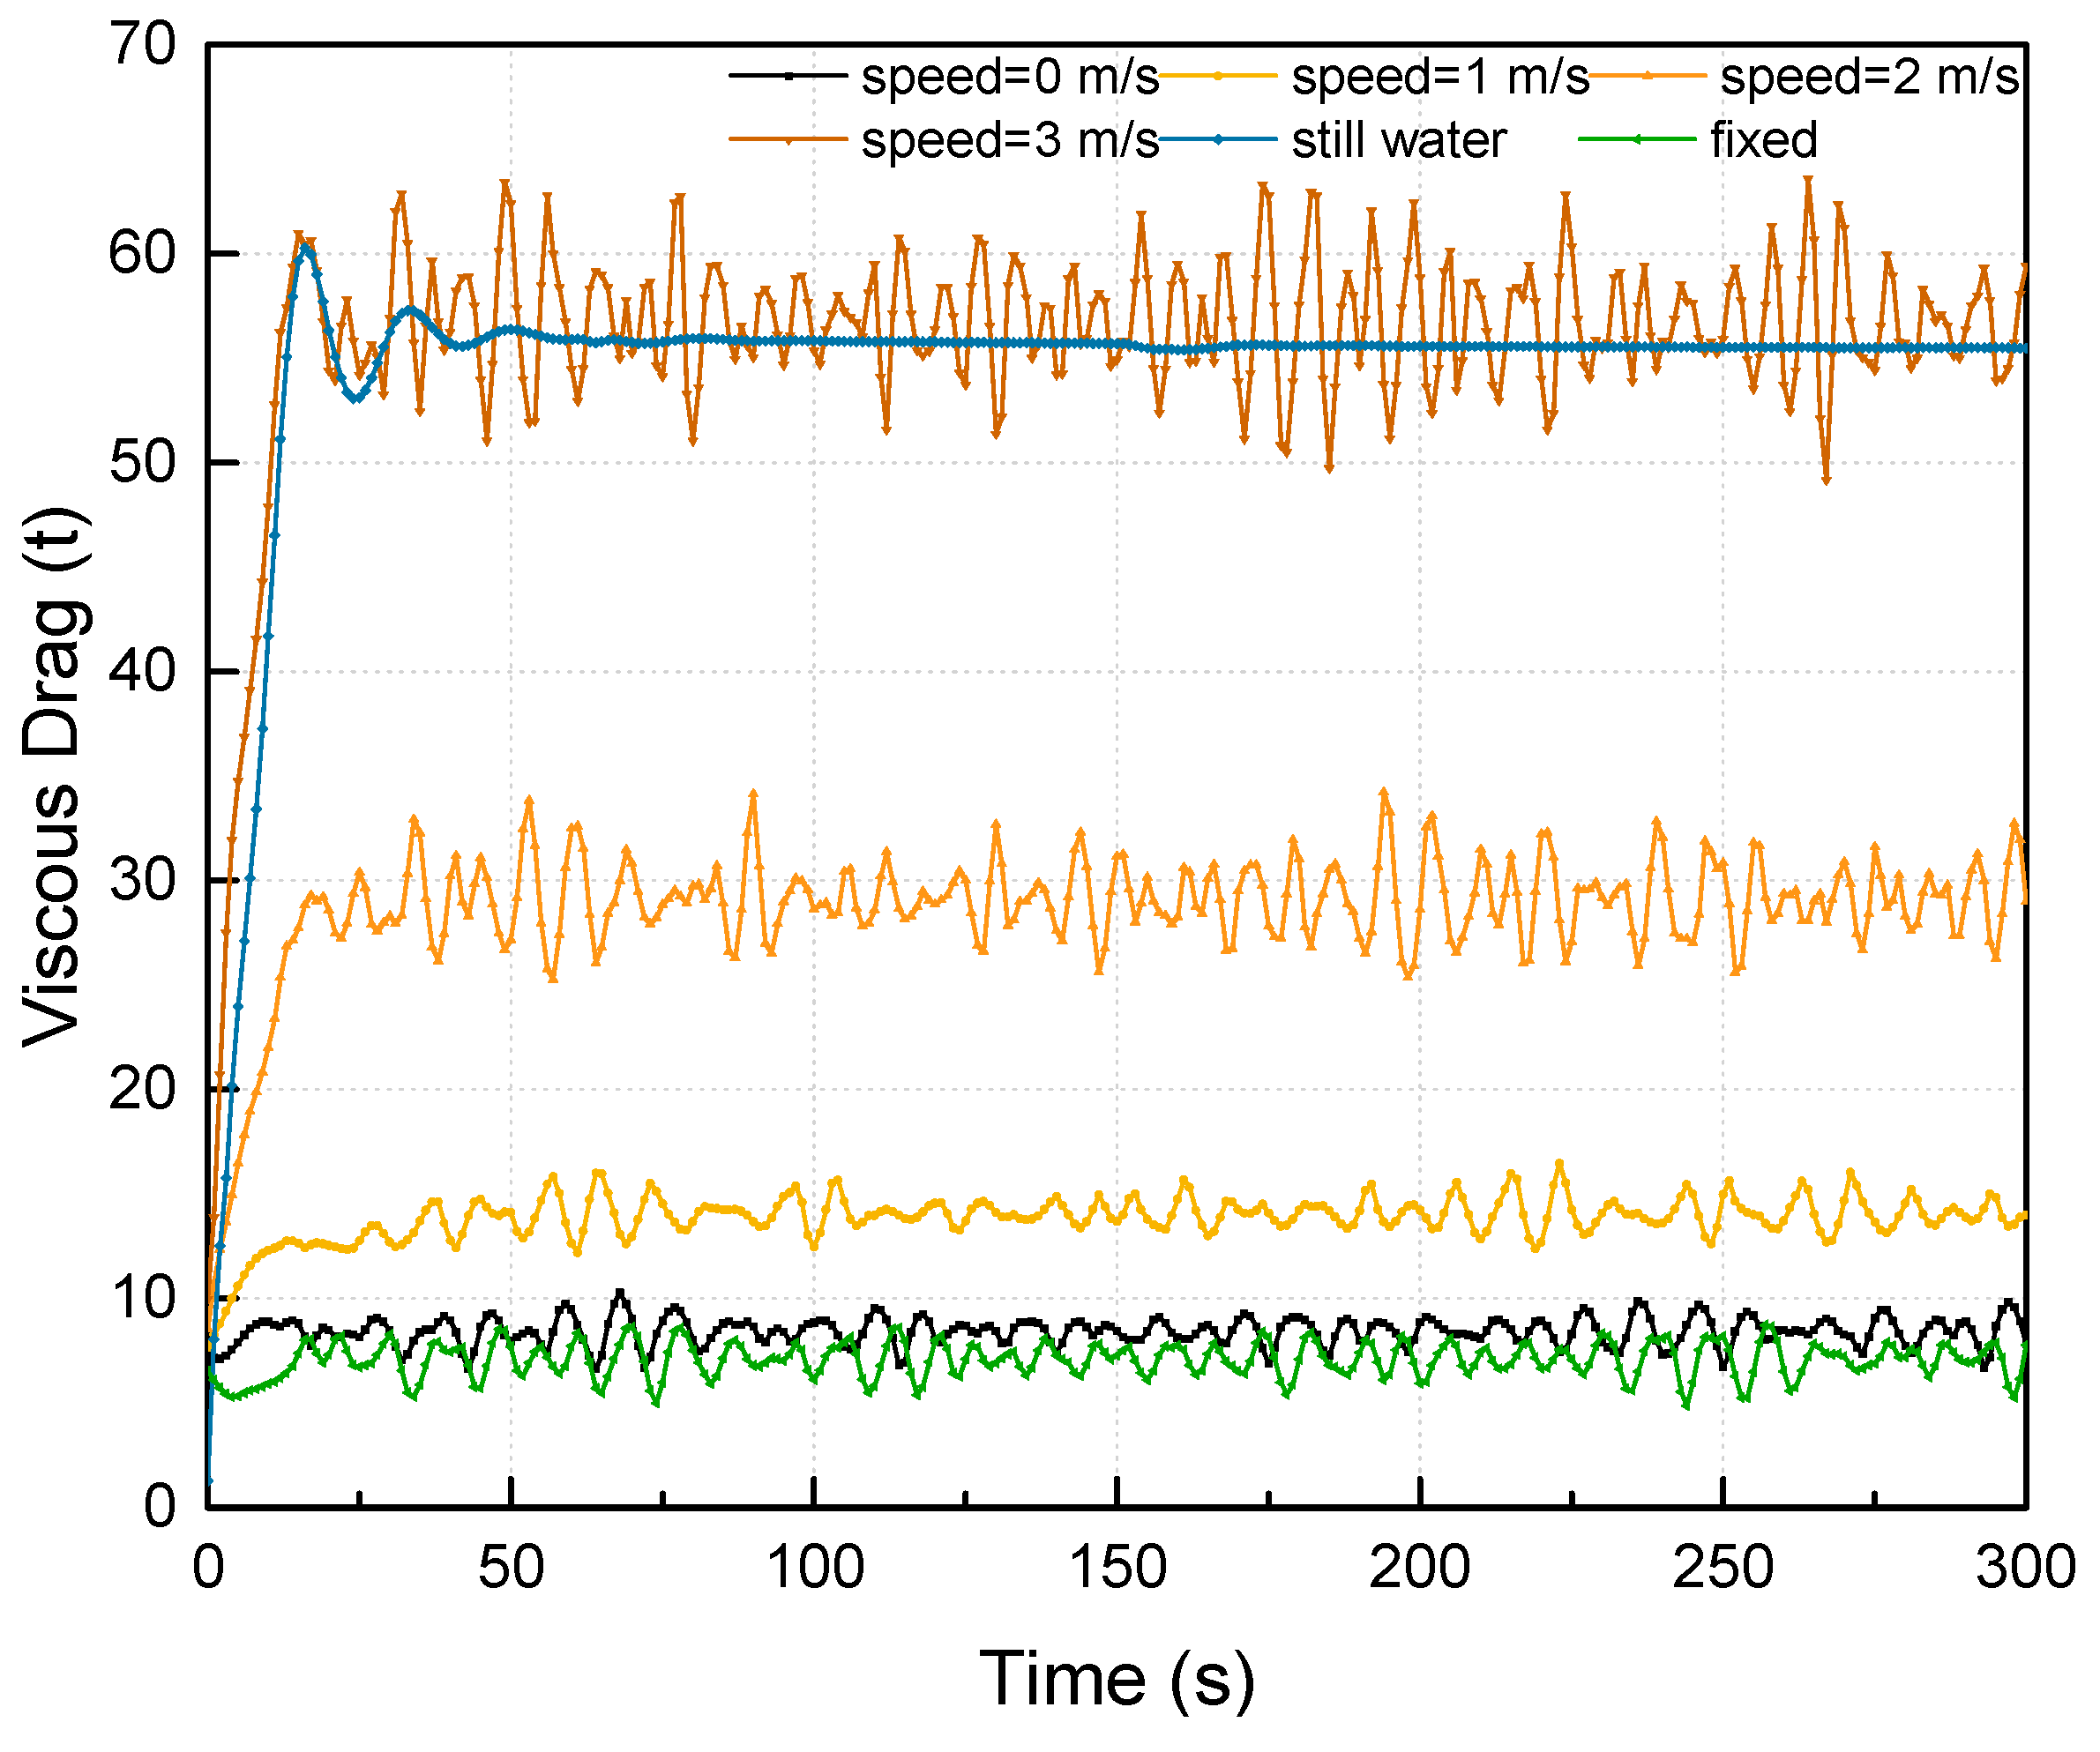
The towing dynamic problem in this paper is analyzed separately by whether or not considering the forward speed. To achieve that, we change the forward speed by applying different towing force. In two ways, the system has no forward speed. One is to tow the structure with a limited force and keep the OIMM to its initial position without moving forward. Another way is that the towing tugboat is fixed in the global system and the OIMM connected with the tugboat by a mooring line, and then the OIMM can oscillate under the environment loadings.

3. Comparisons and Analyses

3.1. Towing Resistance in Different Towing Methods

In Section 2, the numerical method and the manual computation method have been introduced to obtain the towing resistance. The results are shown in this section and analyzed in Section 4. The towing resistance is compared based on the surface towing and the submerged towing. As for the submerged towing, the towing resistance of the OIMM is different if the initial submerged depth changes. Therefore, four submerged depths are considered and compared by the manual method and the numerical methods. For the surface towing, only one submerged depth (draft) is considered because the vertical height of the floating tank is small (shown in Figure 1). The OIMM can be self-floating with a draft of 0.85 m which has been verified to be able to maintain adequate floating stability. Thus, this draft is used for the surface towing.
The towing resistance for submerged towing computed by the manual method and the numerical method has been tabled in four groups corresponding to four submerged conditions (10 m, 20 m, 30 m, 40 m). For both numerical and manual methods, the resistance caused by the mooring line is not considered. The wind force listed in Table 1 is based on the CCS code and the wind force on the floating tank is not considered. The detailed computation of the towing resistance is listed in Table 2.
In MOSES, a time domain simulation was conducted and the required towing force was adjusted according to the final velocity of the OIMM. The towing resistance is compared under the same towing speed. The wind force and the towing resistant by MOSES are shown in Table 3.
The wind forces from Table 2 and Table 3 are generally agreed. More detailed discussion is presented in Section 4.1.

3.2. Towing with Forward Speed

In this section, the relation among the towing resistance, towing methods, and the resulted speed are analyzed. The analyses results will provide the towing operation with suggestions on feasible environment conditions and the choice of possible towing equipment.
In Section 2.2, it has been illustrated that the total potential can be investigated in terms of the radiation potential and the diffraction potential separately. The radiation problem does not consider an incident wave. Therefore, the towing operation can be investigated by whether including the wave and current loads. This can be achieved directly by the numerical method.
In addition, the towing operation performed in the calm sea condition with a forward speed will be compared in terms of the surface towing and the submerged towing. For both towing operations, optional towing velocity is around 3–5 knots [7]. Therefore, four different velocities (0 m/s, 1 m/s, 2 m/s, 3 m/s) are chosen to compare the towing resistance and towing stability in complex loading states. As has been mentioned, the zero forward speed can be achieved by exerting a limited towing force.
Moreover, another towing operation is performed as a comparison with zero forward speed achieved by fixing the tugboat in the global system. The simulation is performed in both surface towing and submerged towing. The wave, current and wind loads are taken in to account. The towing force is not needed when the tugboat is fixed. The results of the comparison are shown in Section 4.2.

3.3. Mooring Positions

This section focuses on the feasibility and superiority of the mooring positions (fairlead positions) based on two towing methods. Generally, the surface towing method is applied to the self-floating objects and the large structures will adopt the submerged towing [25]. Considering the high-rise feature of the OIMM, both towing methods can be applied. For the surface towing, only one fairlead position, fairlead 1 is taken. As for the submerged towing, both fairlead 1 and fairlead 2 can be applied. The dynamic performance of this towing system relates to the mooring positions, because the orientation and the position of the applied towing force are associated with the fairlead positions.
To eliminate the additional effect by the towline and tugboat, the towing system is simplified by substitute the towline with a constant horizontal force, which will provide the driving force to OIMM. In this simplified system, the only interaction is the environment loading with OIMM.
In addition, for each mooring position, the dynamic features of the submerged towing are further compared in terms of the submerged depth. This comparative analysis will be a more valuable reference when the OIMM is higher and the sea is deeper. With different submerged depths, not only the towing resistance but also the motion responses will change. The impact caused by fairlead positions on the dynamic motion responses of the OIMM are compared in heave and pitch motions. The results are discussed in Section 4.3 which may be benefit the optimization of the towing operation and maneuverability of the towed structures.

4. Results and Discussions

4.1. Towing Resistance

In this section, the towing resistance obtained by two methods (MOSES and CCS code) is discussed. Two towing methods are distinguished by the submerged depth. Specifically, the surface tow corresponds to the shallowest submerged depth and the submerged tow includes four different depths (10 m, 20 m, 30 m, 40 m). The comparison is shown in Figure 3.
Figure 3 depicts the variations of the towing resistance between numerical method and manual computation (CCS). Basically, the surface towing method has the lowest towing resistance suggesting that the surface friction force caused by current and wave accounts for a large part of the towing resistance. In Section 3.1, from Table 2 and Table 3, the wind forces by MOSES and CCS code are basically agreed. Thus, the total resistance is dominated by wave and current loadings. However, the growth of towing resistance by numerical method is much higher than that by CCS code, especially for the submerged towing.
The difference is quite small for the surface tow and shallow submerged tow. The maximum different is around 37% corresponding to the submerged depth of 40 m. This increased difference between MOSES and CCS methods can be accounted for by the submerged area of the slender structure (meteorological mast) which increase as the depth goes deeper. That is, the Morison’s Equation was used in MOSES to compute the wave and current interaction on beam element (meteorological mast), while for CCS code, the entire submerged part adopted the same estimation method. The figure implies that the CCS code comparatively underestimates the towing resistance, especially for submerged conditions with slender part.
Other reasons accounting for the overestimation may because that the sea environment performed in MOSES is irregular wave condition and the current induced force is more sensitive to the panel model for diffraction. Moreover, the resistance growth by CCS code mainly results from the increase of the wet surface of the meteorological mast which is quite limited and the friction and the residual resistance of the floating tank does not change under the water. While by the numerical method, a slender structure will make a difference because of the Morison’s Equation.
For this high-rise structure, the wind force can be significant compared with the wave and current loads, which should be considered. To analyze the individual effects of environment loadings, the surface towing was performed. It means the water plane and wet surface were the same, and then the towing resistance caused by the wave and current is the same. Besides the wind load is at the maximum since the entire mast is above the surface. The towing force is balanced with the resistance and results in a stable forward speed. In Figure 4, wind, wave and current effects are separately investigated in terms of the induced forward speed and they are compared with the total effect. The total effect means all environment loads are considered. The towing force applied to the system varies from 5–25 t.
As shown in Figure 4, generally the current induced speed line is closest to the total effect line. Wave occupies much less impact when the forward speed is higher. The wind load has a dominant effect only when the towing force at the lowest level and it declines significantly afterward. In general, Figure 4 suggests that for OIMM the wave and current loads are dominant for normal towing speeds (above 1 m/s), which supports the increased difference shown in Figure 3. Since the submerged part of the mast is not considered in manual results and the current and wave loads on this part are considerable.

4.2. Forward Speed

In this section, the towing resistance under different forward speeds are compared. The towing resistance is defined as the viscous drag force in MOSES. The resistance variations are compared in a time domain for both surface towing and subsurface towing. The comparison is considered from two perspectives: zero-speed and none-zero speed. This has been illustrated in Section 3.2. Two loading environments are defined for the none-zero speed towing. One does not consider the wave and current loadings (the still water condition). The other is normal including all environment loadings. Notice that the towing force applied to the still water condition was the same as that applied to the speed condition of 3 m/s.
Figure 5 shows the time domain results of the viscous drag force for the surface towing. Viscous drag curves fluctuate significantly as towing speed increases because of the free surface effects on the floating tank. The dynamic motion under higher speed conditions is larger because the wet surface area varies significantly and accounts for this fluctuation. The fixed condition shows a similar variation as the 0 m/s speed condition. The viscous drag forces for the fixed and the 0 m/s speed conditions are the lowest, which is reasonable because the resistance is in proportion to the second order of the velocity term. That is, the lower speed corresponds to lower sea loads. The still water condition has a close and smaller viscous resistance as the 3 m/s speed condition since the same towing force was applied for them and the latter has wave and current induced resistance. Without the wave and current, the viscous drag curve is smooth. In addition, the viscous resistance increases by around 20% for every speed increase of 1 m/s.
Figure 6 illustrates the time domain results of the viscous drag force of the submerged towing. The submerged depth is 40 m. The resistance curve fluctuates much less than that of the surface towing, which is because the water plane is much smaller. The resistance force increases significantly as each additional growth of the towing speed. More specifically, the resistance force nearly doubled for each additional towing speed. The fixed condition presents a similar variation as that of the 0 m/s speed condition. As for the still water condition, basically it has a close and smaller viscous resistance similar to that of the 3 m/s speed condition since the same towing force was applied for them. Likewise, the time history curve is smooth for the still water condition. Generally, the towing process for submerged towing is more stable, which can be beneficial from a practical perspective.
In Figure 7, the applied towing force and the balanced viscous drag resistance for both surface towing and submerged towing are compared. The submerged depth is 40 m for subsurface towing and six groups are chosen based on the towing speed. For fixed body condition, no towing force is applied and only the balanced resistance is shown. Compared with the surface towing, to perform a submerged towing requires larger towing force so as to achieve a similar towing speed, especially for high speed towing. The required towing force and balanced viscous drag force are proportional to the second order of the towing speed. For the surface towing, the water plane area is similar and the distinction between the viscous drag force and towing force is quite clear for the still water condition. The resistance is smaller compared with the condition of speed 3 m/s, which is reasonable. Because the wave and current effects are eliminated.
Generally, based on the above figures, it suggests that to obtain a higher speed by increasing the towing force is low efficient in terms of the transportation cost since the towing resistance will increase by a larger margin.

4.3. Mooring Position

In this section, the impacts of the mooring positions are investigated from the viscous resistance and the motion response perspectives. The submerged towing was performed with an initial depth of 40 m. As has been shown in Figure 2, there are two mooring positions named as fairlead 1 attached to the floating tank; and fairlead 2 attached to the tower near to the surface, respectively. The two fairlead positions excel at different aspects. For instance, the fairlead 2 is near to the free surface and can be conveniently connected with a towline. While the fairlead 1 attached the floating tank in a height near to the center of gravity has a smaller force arm, which is benefit for a relatively small motion response amplitude. Thus, it is necessary to analyze the dynamic behavior under these two conditions. Figure 8 depicts the motion responses and the sea environment with two fairlead positions.
In Figure 9, it is shown that the surface towing method has a much lower resistance but significant fluctuation since it has a larger water plane area. While for the submerged towing method, the fairlead 1 has a smaller resistance level compared with the fairlead 2. The difference of viscous drag between fairlead 1 and 2 is related to various reasons, for example, the initial submerged depth and the towing speed. Therefore, to verify this regulation, more simulations with different submerged depths are compared with the same forward speed, as shown in Figure 10 and Figure 11.
In Figure 10, the time history curves for viscous drag force with four submerged depths are compared in terms of the fairlead positions. These curves are smoothed by FFT (fast fourier transform). To eliminate the impacts due to the towing speed, the same towing speed (3 m/s) is chosen for all submerged conditions.
This shows that the difference of viscous drag force caused by fairlead position is more significant when the submerged depth is shallow, and the difference becomes moderate for the increase of submerged depth. Besides, these curves under shallow-submerged condition obviously have greater fluctuations and lower viscous resistance than the deep ones. This can be observed clearly from Figure 11 with the standard deviation (STD) of the viscous resistance. This is related to the wet surface and the water plane area. For shallow submerged depth, the submerged part is smaller, thus the viscous drag is smaller; while the water plane is larger, corresponding to a heavier fluctuation. Since the water plane area is much smaller when it was towed in a deeper depth, the difference of the viscous drag due to the fairlead positions becomes limited. In conclusion, for practical operations, when the same level of the towing speed is required, adopting the mooring position of fairlead 1 is reasonable, since the towing resistance is lower.
The pitch and heave motion responses for the submerged towing are compared in Figure 12 and Figure 13. The wind force is not considered here to simplify the loading environment and the same towing speed is maintained. The motion responses are clearly influenced by two fairlead positions.
In Figure 12, pitch motions are depicted. As can be seen, the pitch angles are positive for fairlead 1 suggesting a backward rotation of the OIMM. For deeper submerged depth, pitch angles are larger, but its fluctuations are smaller. As for fairlead 2, it shows a quite opposite feature. The negative pitch angle means the OIMM leans forward. The oscillations are more stable, and the amplitude is smaller at a deeper submergence depth. In general, the pitch motion for the fairlead 2 is larger than that of the fairlead 1.
As for Figure 13, the heave motion of the submerged towing with fairlead position 1 shows a slight descending motion except for the deepest one which ascends slowly by around 1 m. The submerged depth of 30 m presents the most significant heave motion and ends up with a relative stable vertical position. As for fairlead 2, the heave motions are negative for all depths and the amplitude is larger. The deepest submerged condition shows the lowest heave motion. Likewise, the submerged depth of 30 m with fairlead 2 shows the most significant heave motion. In general, with a mooring position of the fairlead 2, the heave motion is larger than that of the fairlead 1.
The pitch and heave motion responses prove that fairlead 1 is superior to fairlead 2 because of the smaller amplitude. As shown in Figure 13, the descending heave motion can be explained that the OIMM leans forward and the wave and current force may result in a relative downward force on the OIMM. Especially when the mooring position is near to the surface and the towing force may aggravate the lean angle. Besides, the current velocity is different on the top and the bottom surfaces of the floating tank accounting for the pressure difference, which may further result in this descending motion. The ascending motion for fairlead 1 can be explained for the same reason. The submerged depth is near to the sea bed where the current velocity decreases rapidly. Thus, the current velocity decreases near to the bottom of the floating tank and the induced pressure on bottom surface of is larger than that of the upper surface of the floating tank. Therefore, the OIMM could be lifted slightly.

5. Conclusions

This study deals with the dynamic characteristics of an innovative integrated offshore structure OIMM in terms of the towing resistance and motion responses. Two special towing methods are adopted for this high-rise structure and the hydrodynamic software MOSES is applied to simulate the towing process in time domain. This paper estimates the feasibility of the towing operations and provides suggestions for potential problems when conducting an offshore wet towing for the OIMM.
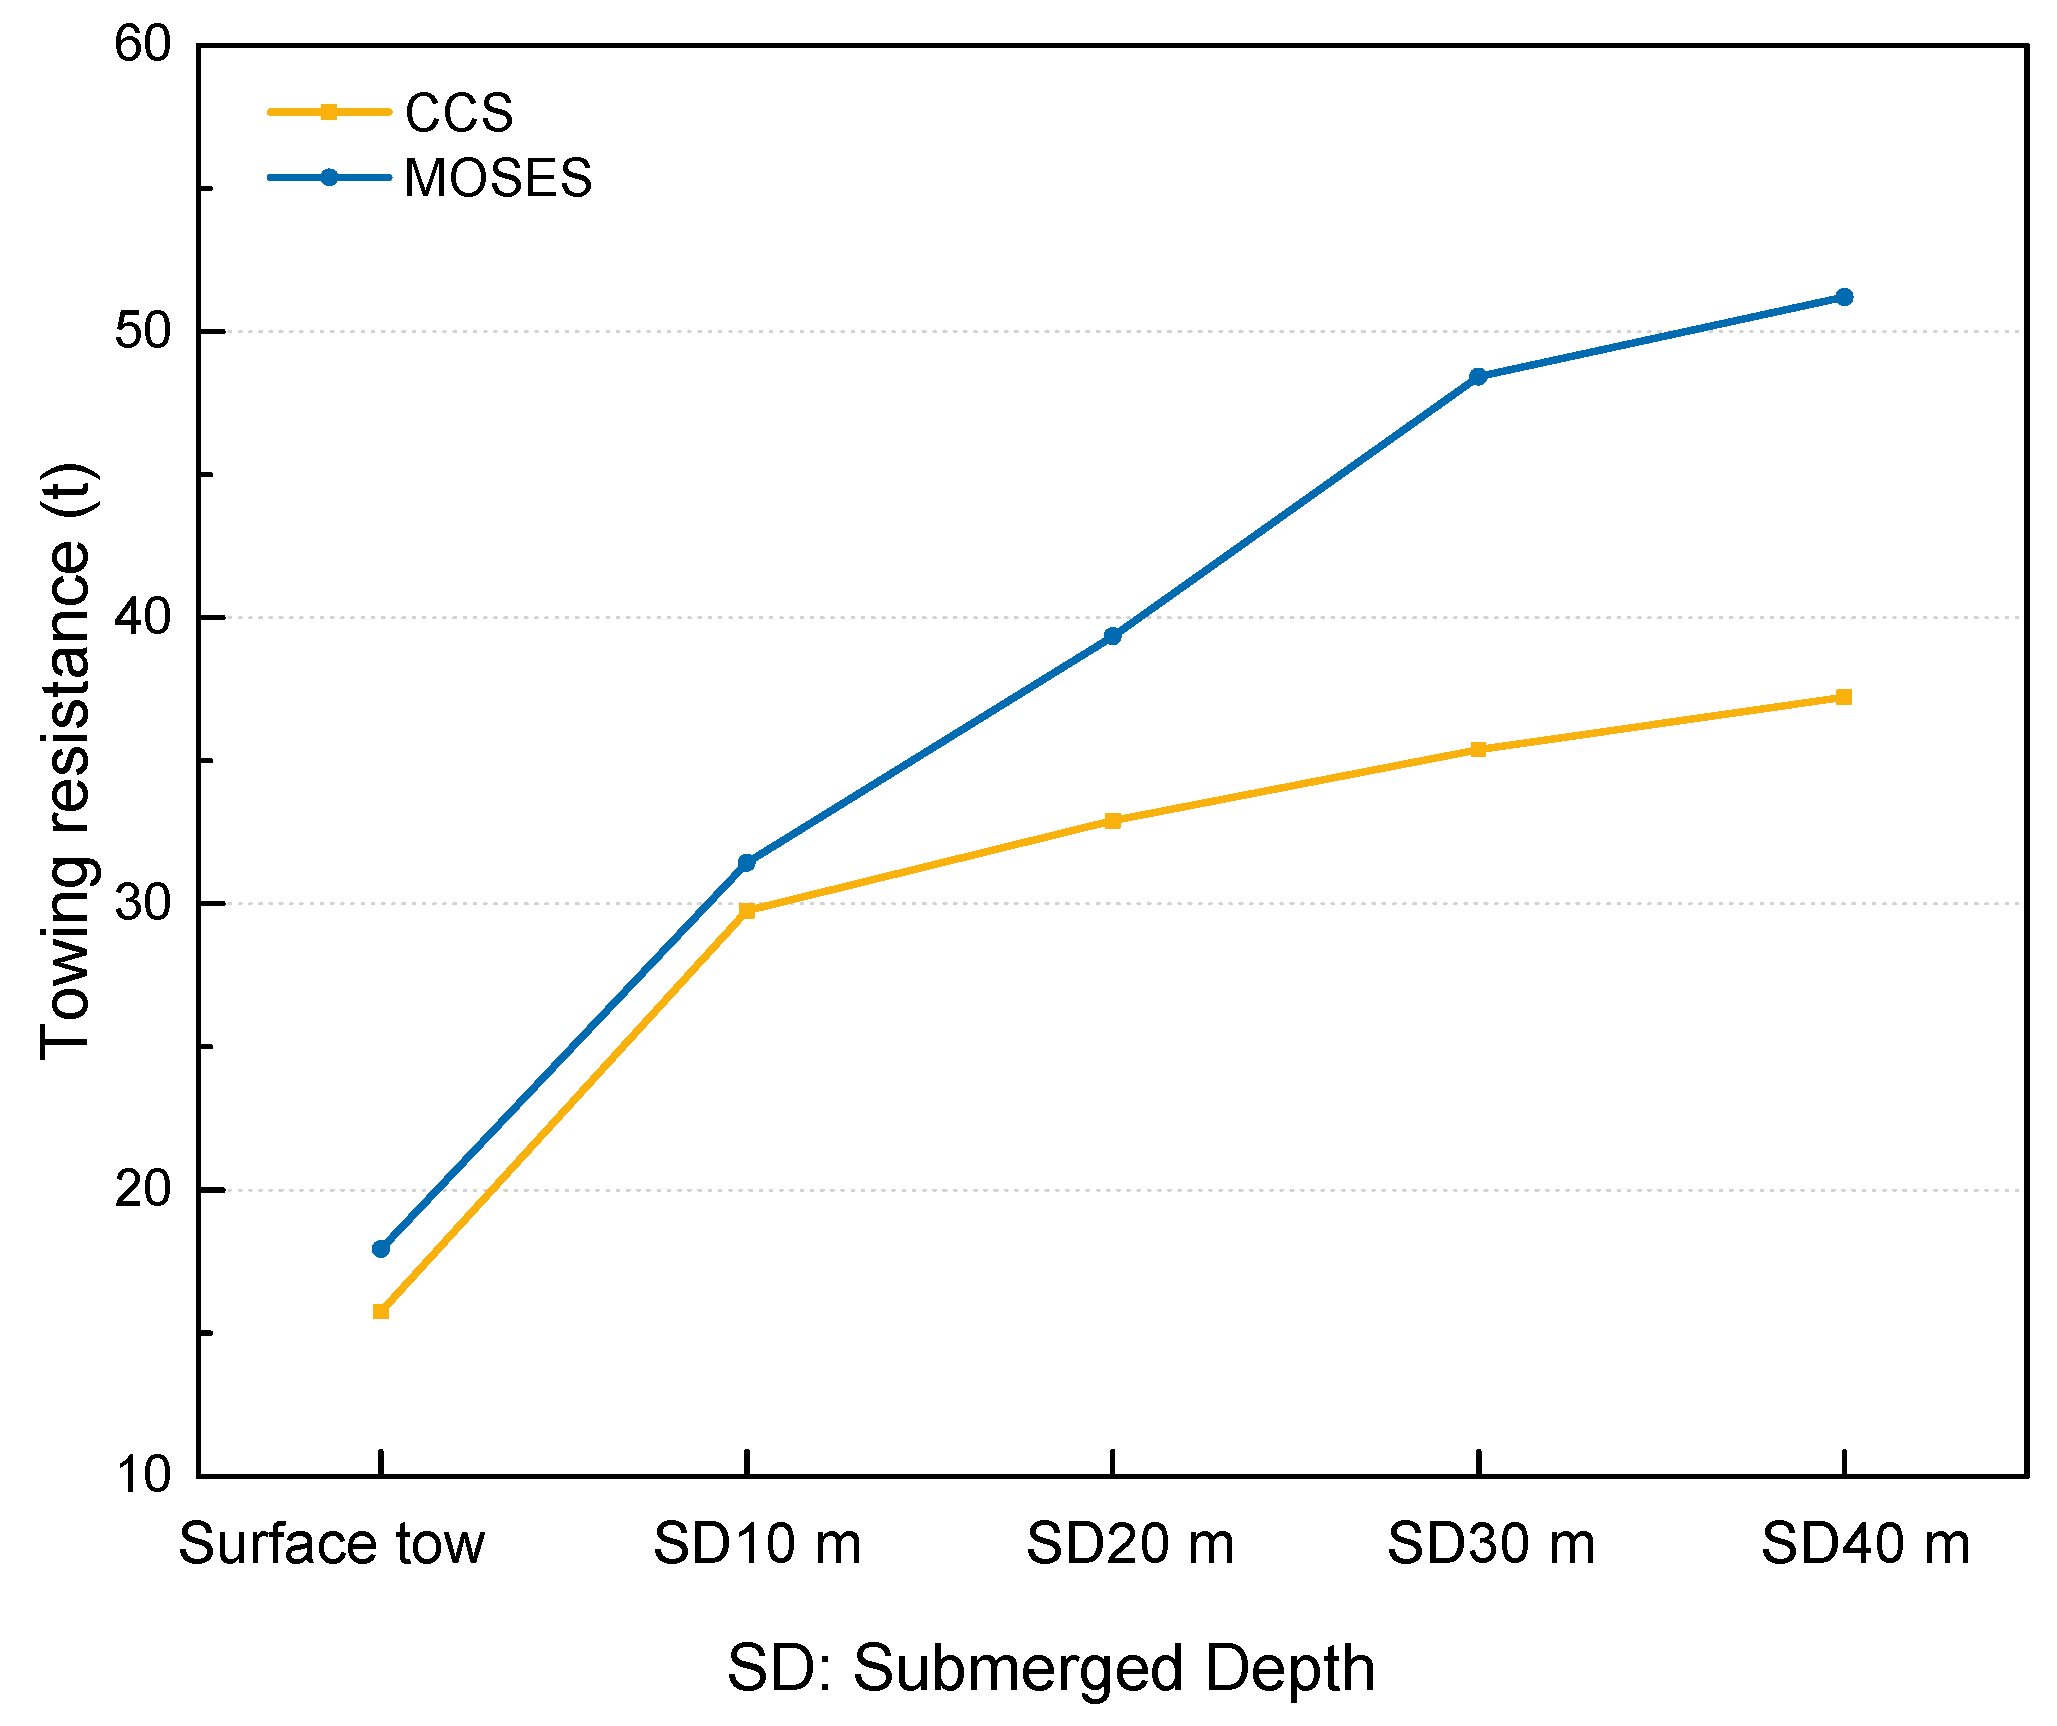
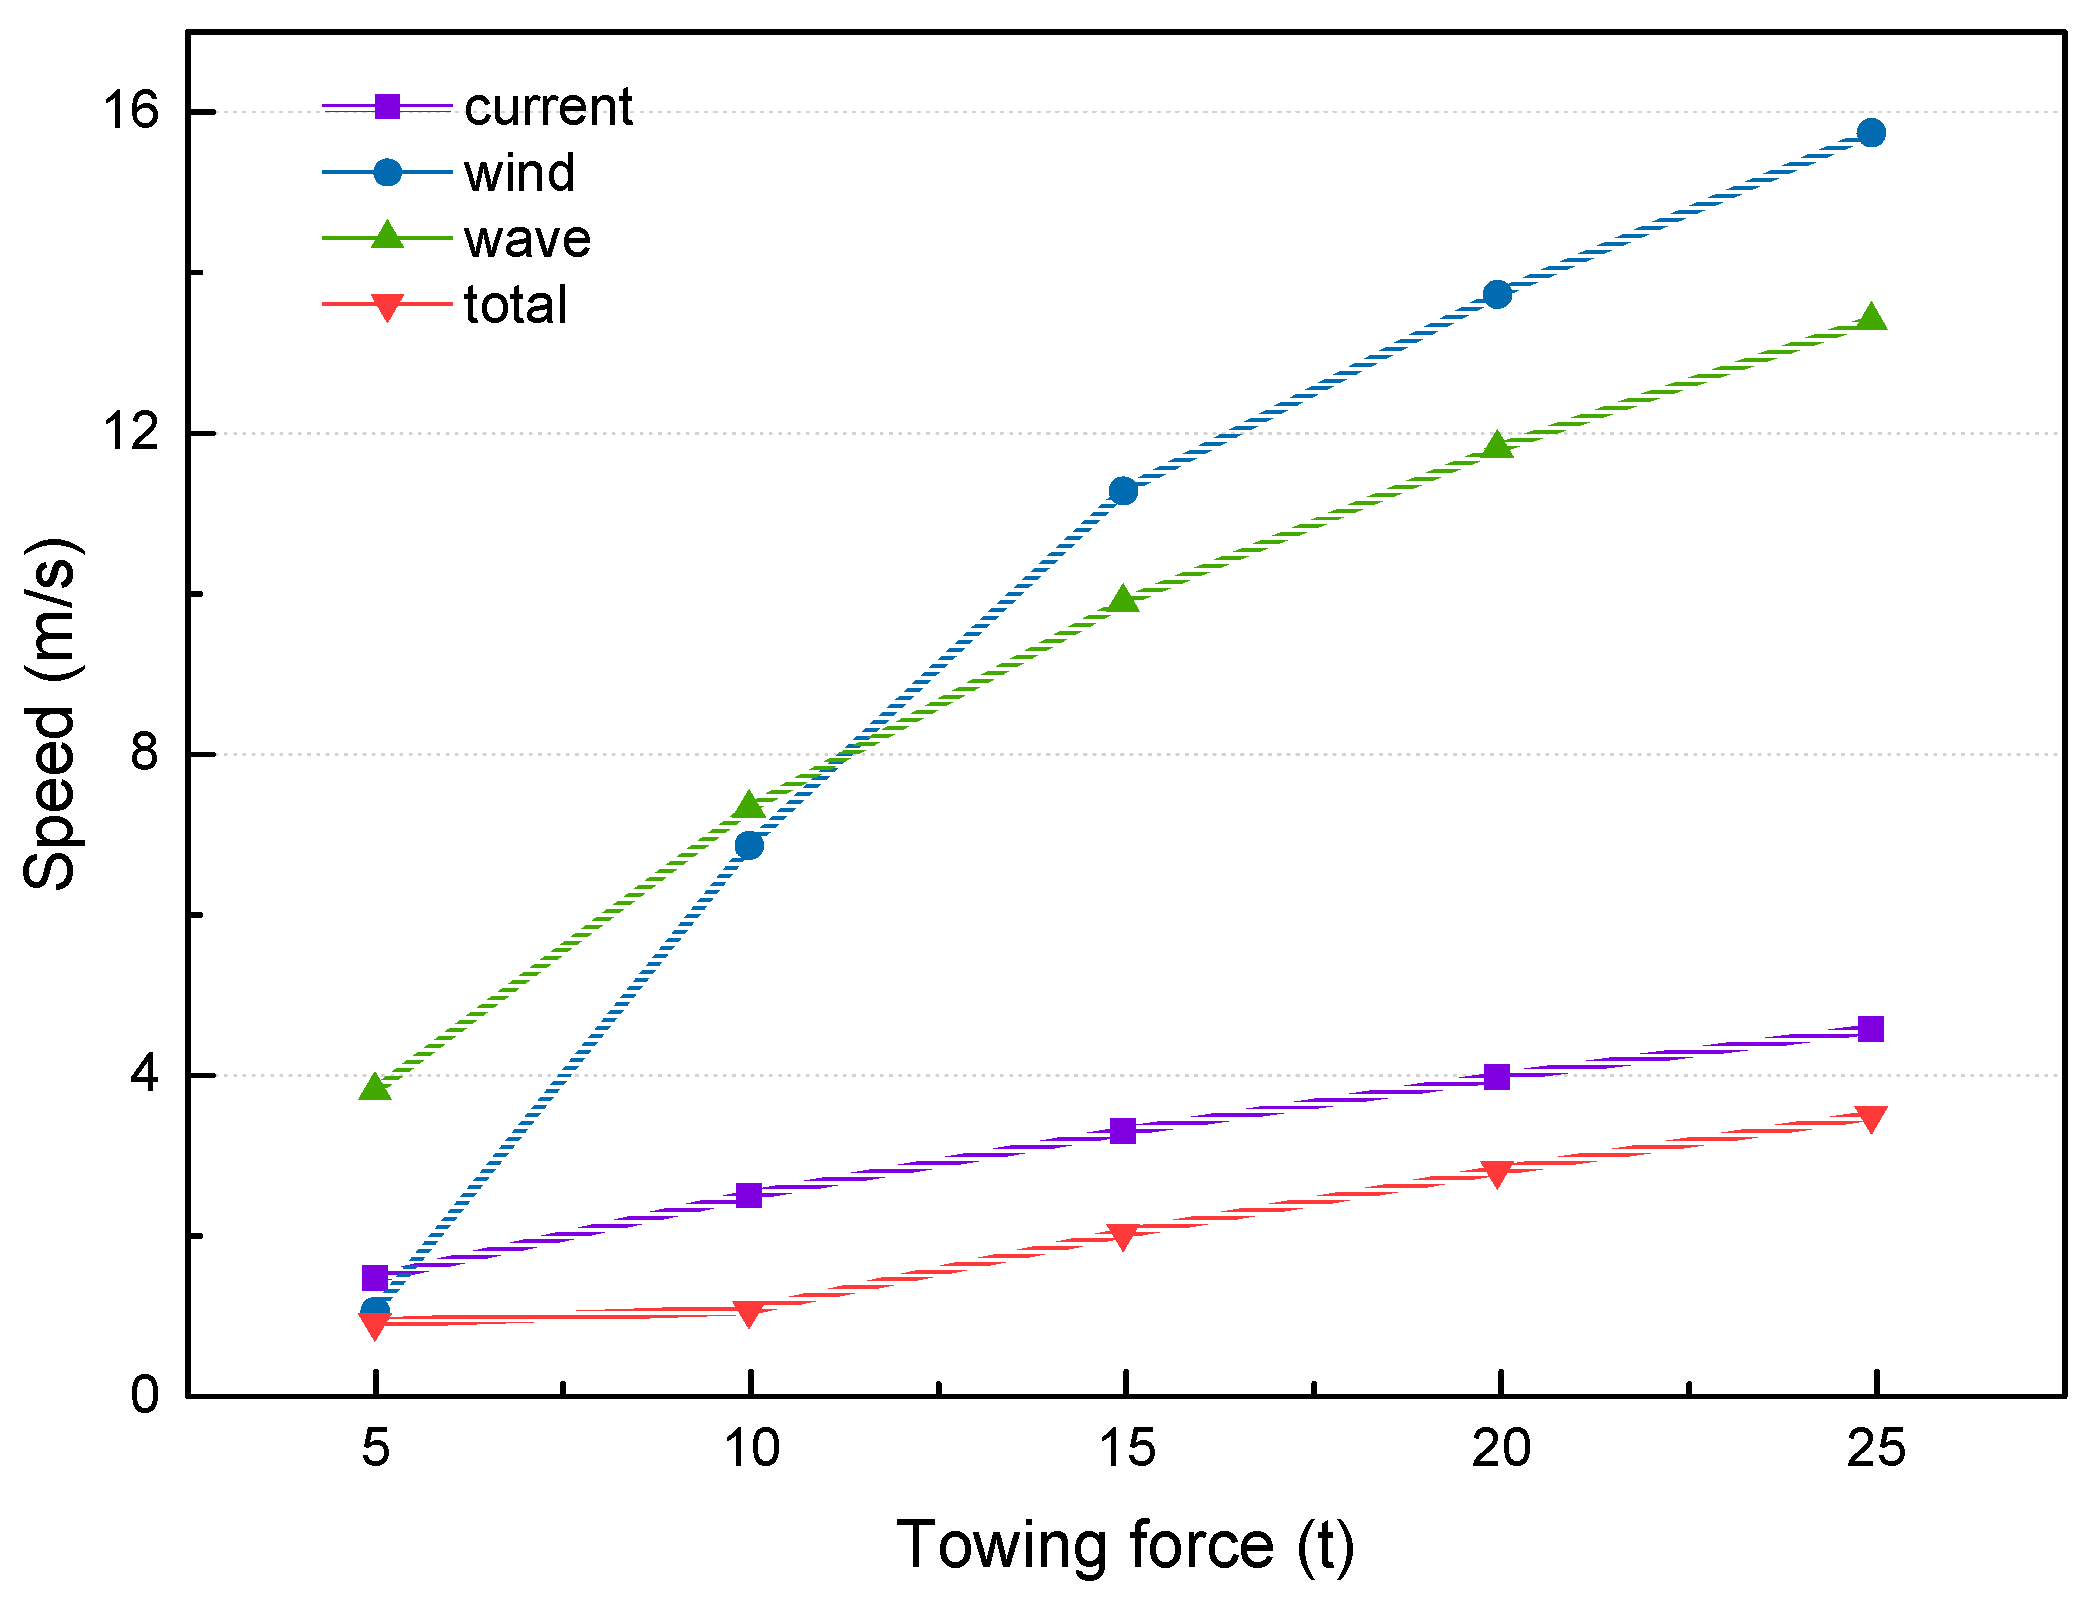
First, the towing resistance is obtained by MOSES and CCS code. The numerical result is verified with manual computation. The manual result of towing resistance is agreed with the result by MOSES for surface towing and shallow submerged towing. For deep submerged towing, the difference between two methods is caused by the applied theory in MOSES and CCS. The potential theory and Morison equation are applied in numerical method, while empirical equations are used by CCS code. The current impact is the most important component since the induced speed is closest to the overall induced speed.
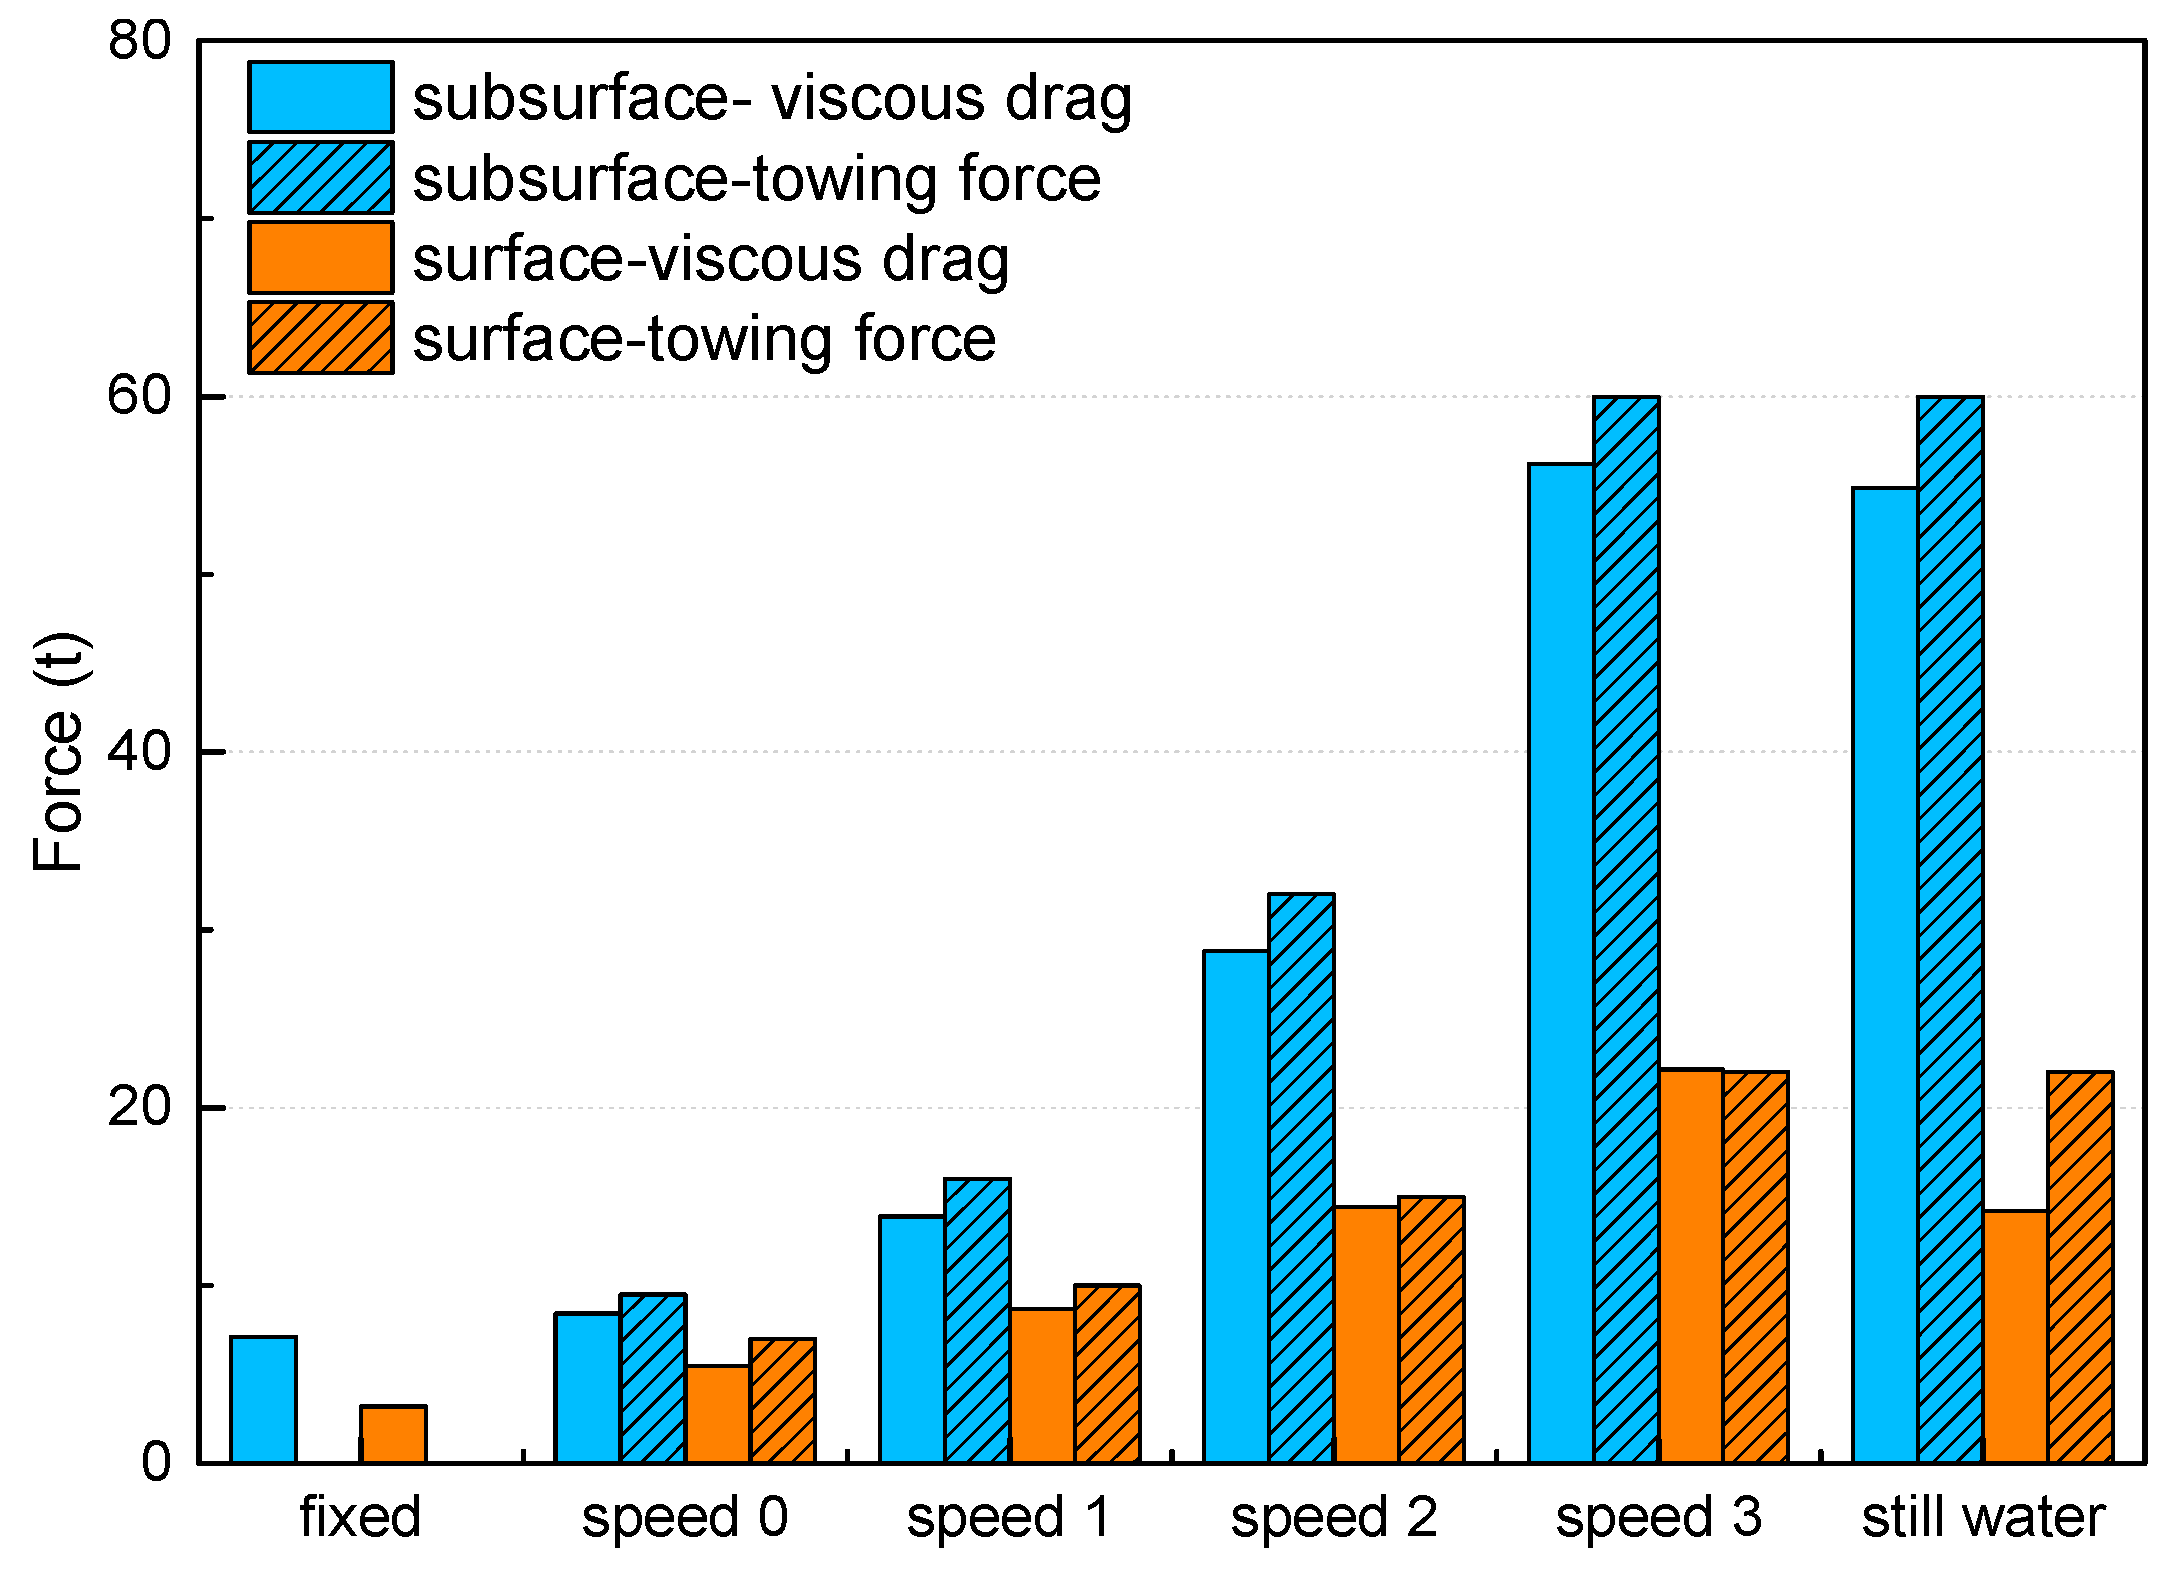
Secondly, the surface and submerged towing methods are compared in terms of different forward speeds and the results suggest that to obtain a higher speed by increasing the towing force is unreasonable with respect to the transportation cost, since the towing resistance increases much higher. Larger towing force is required for submerged towing to achieve the same speed level as surface towing, particularly when the towing speed becomes higher.
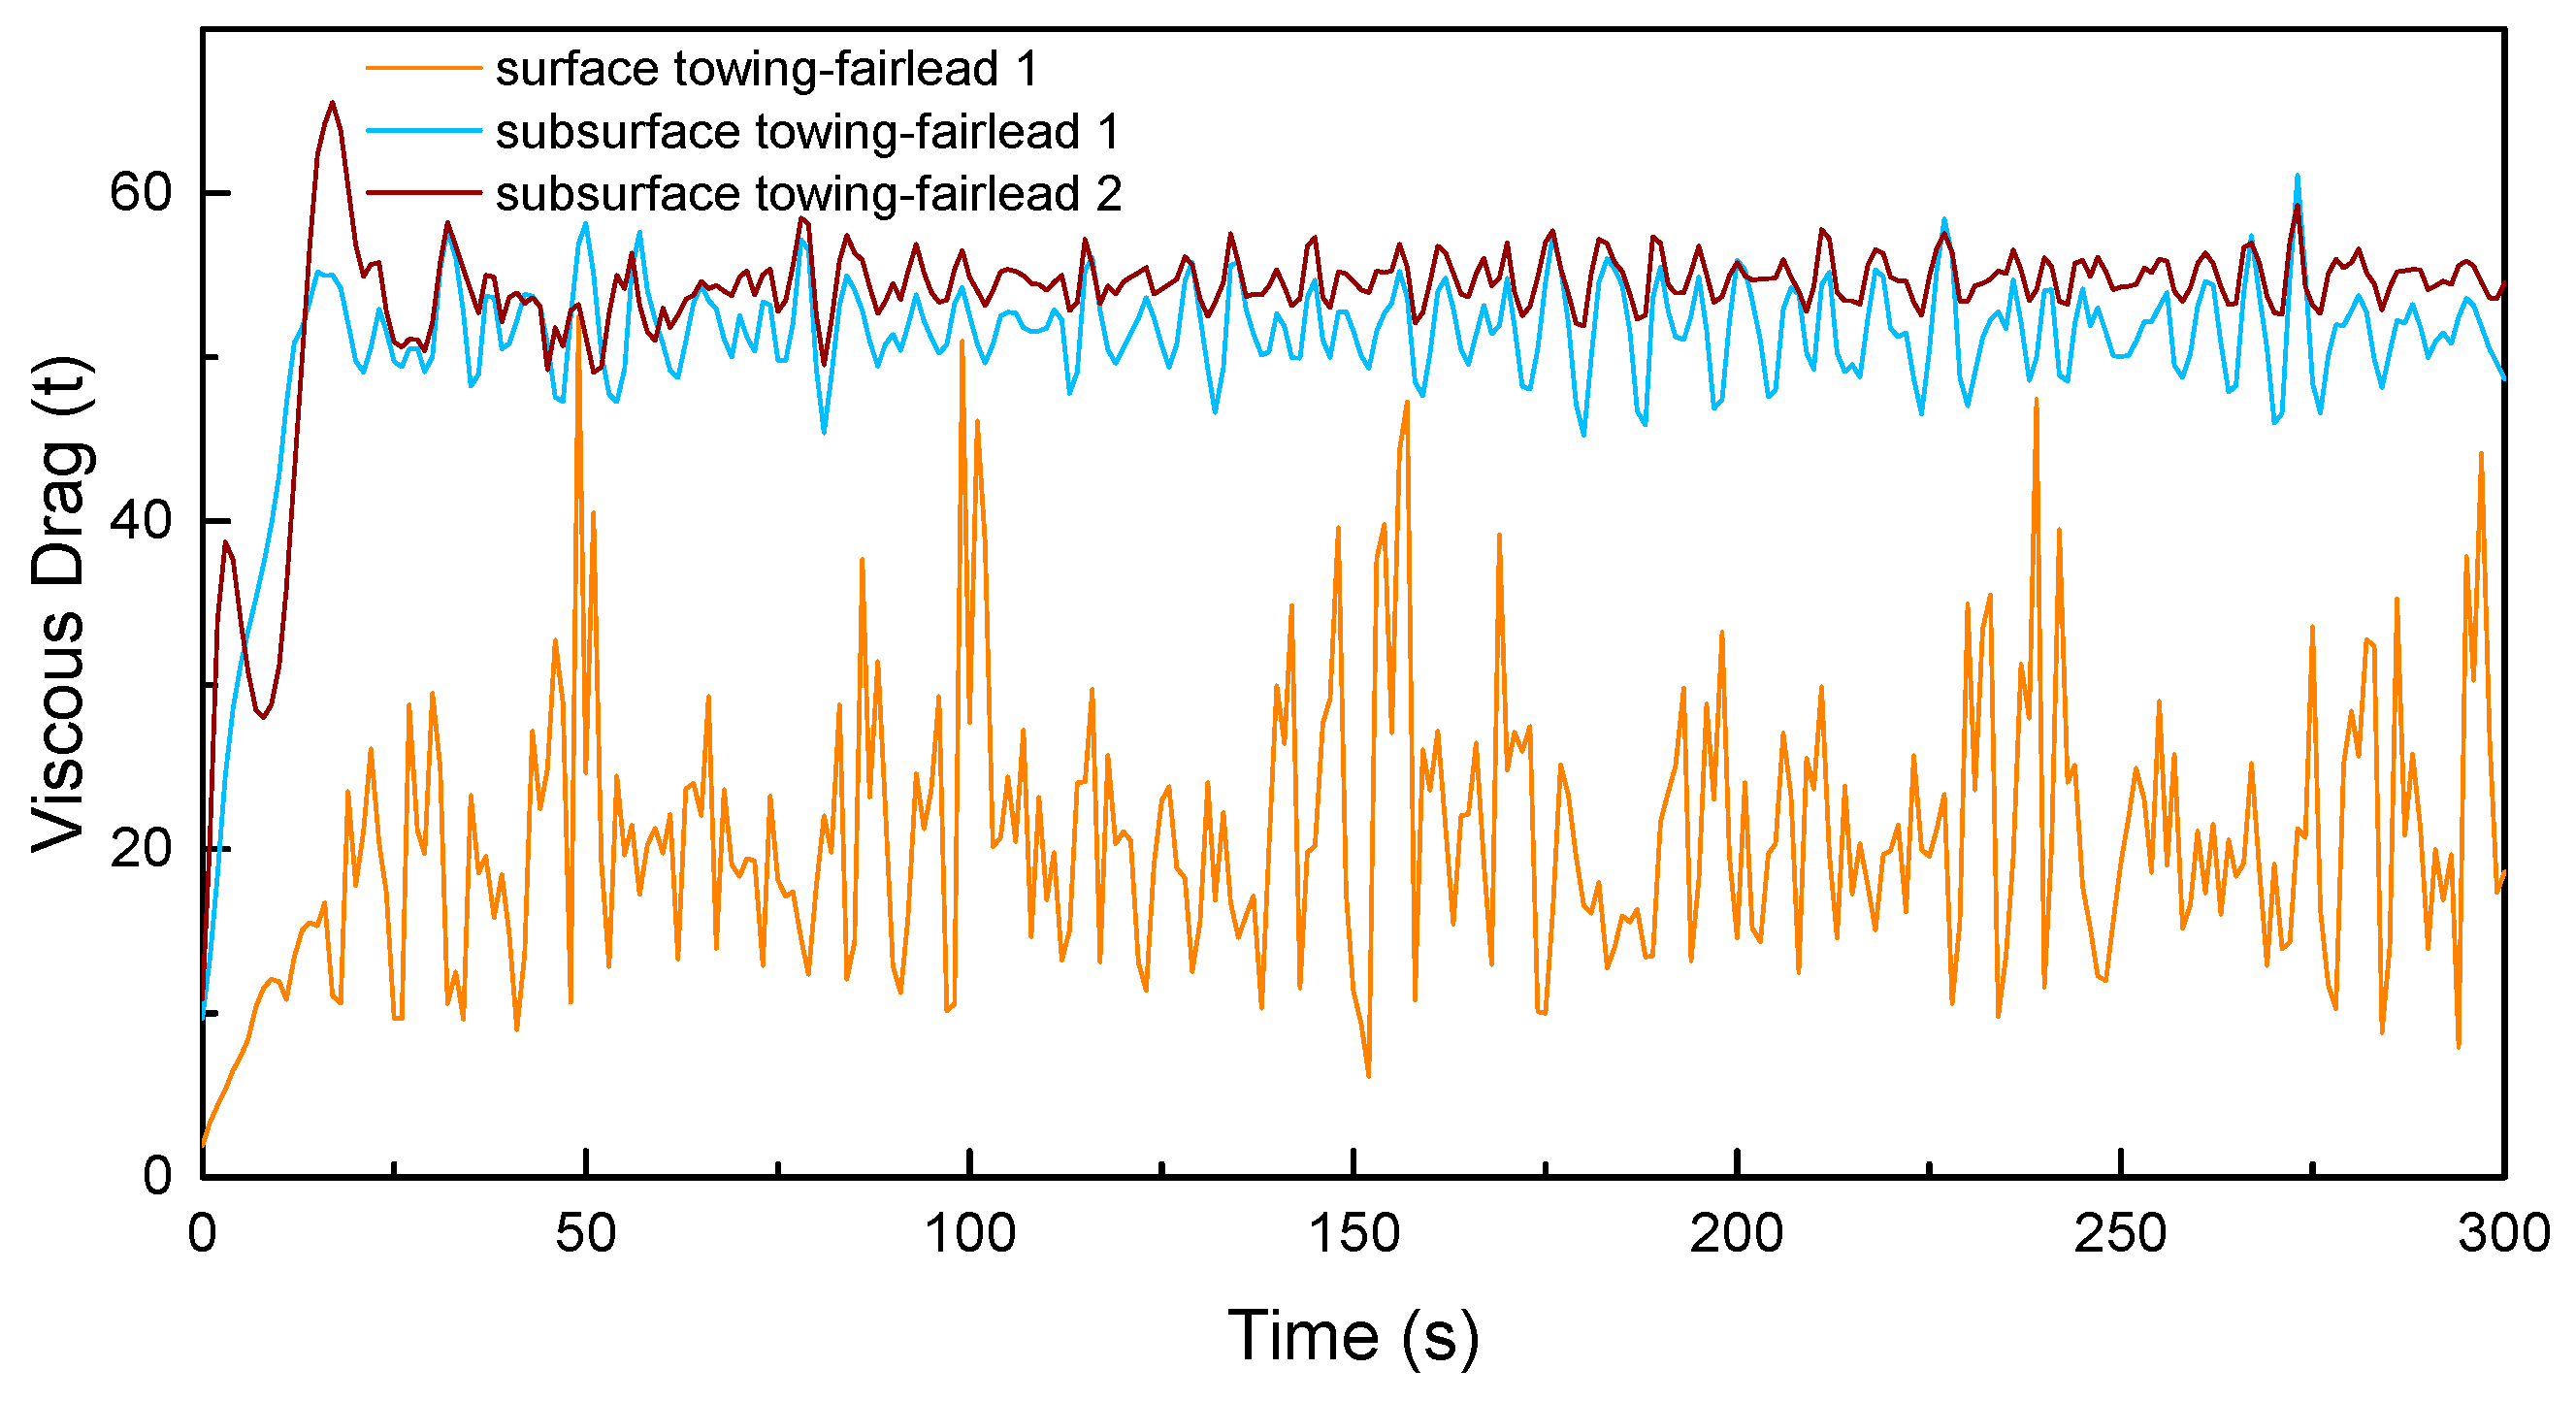
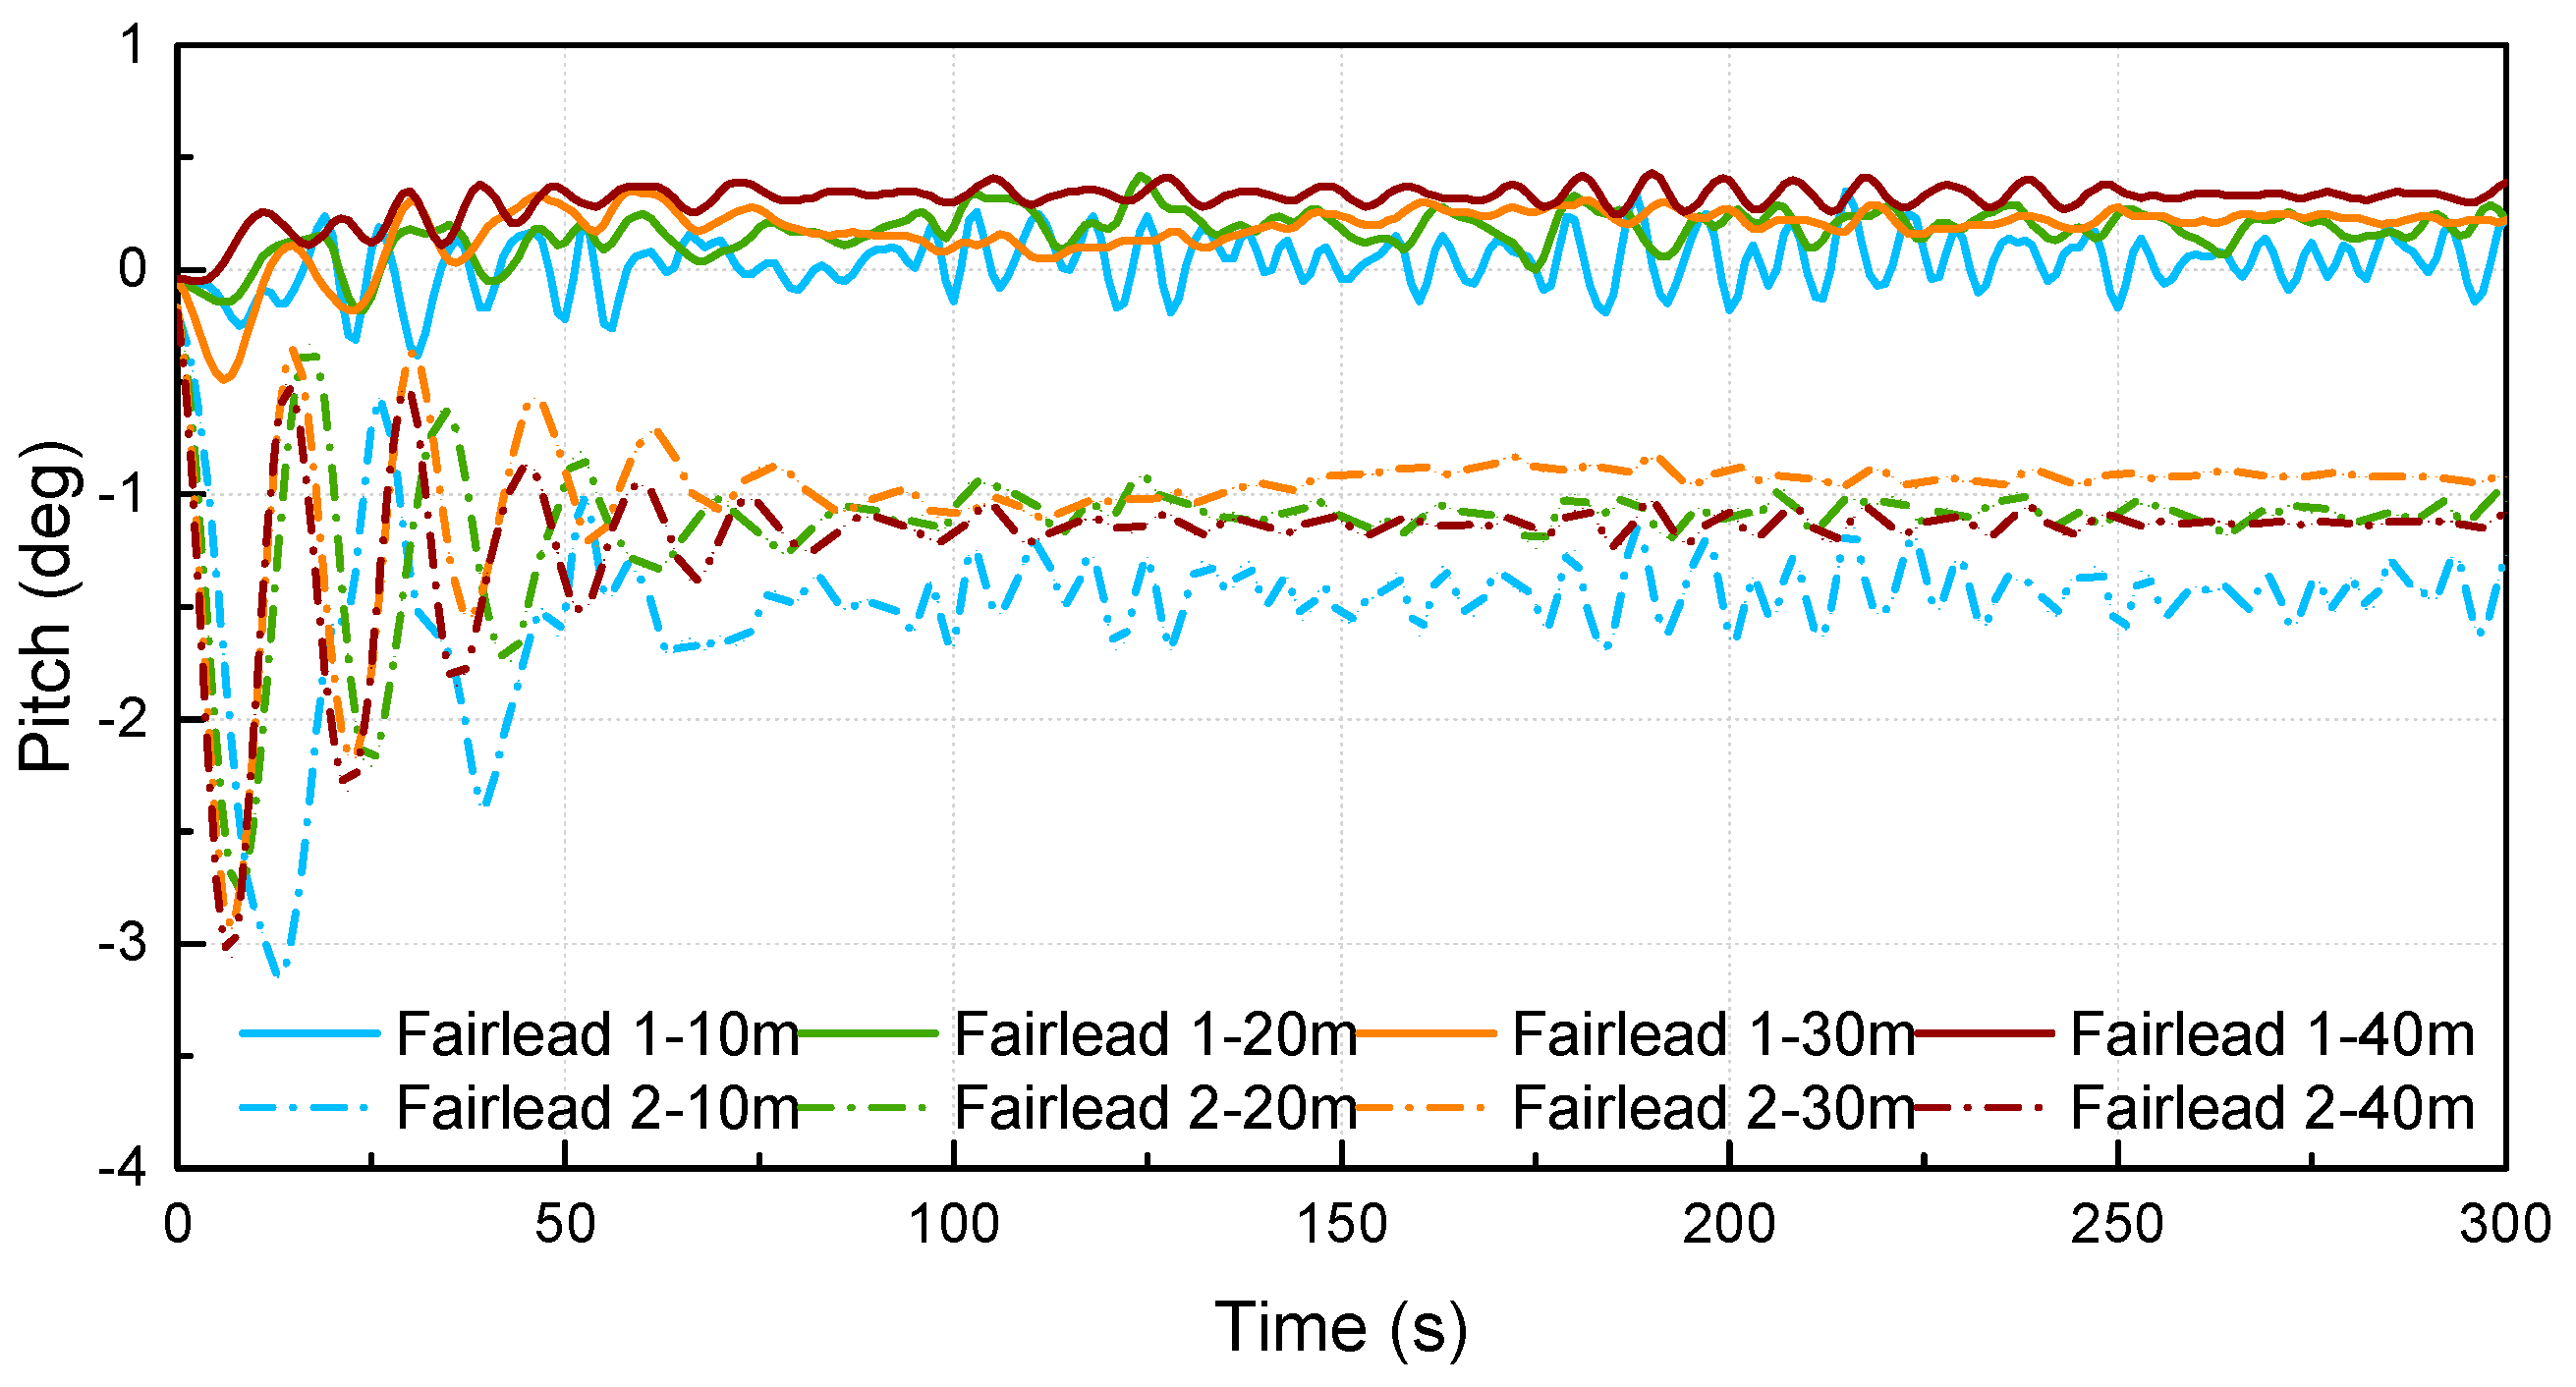
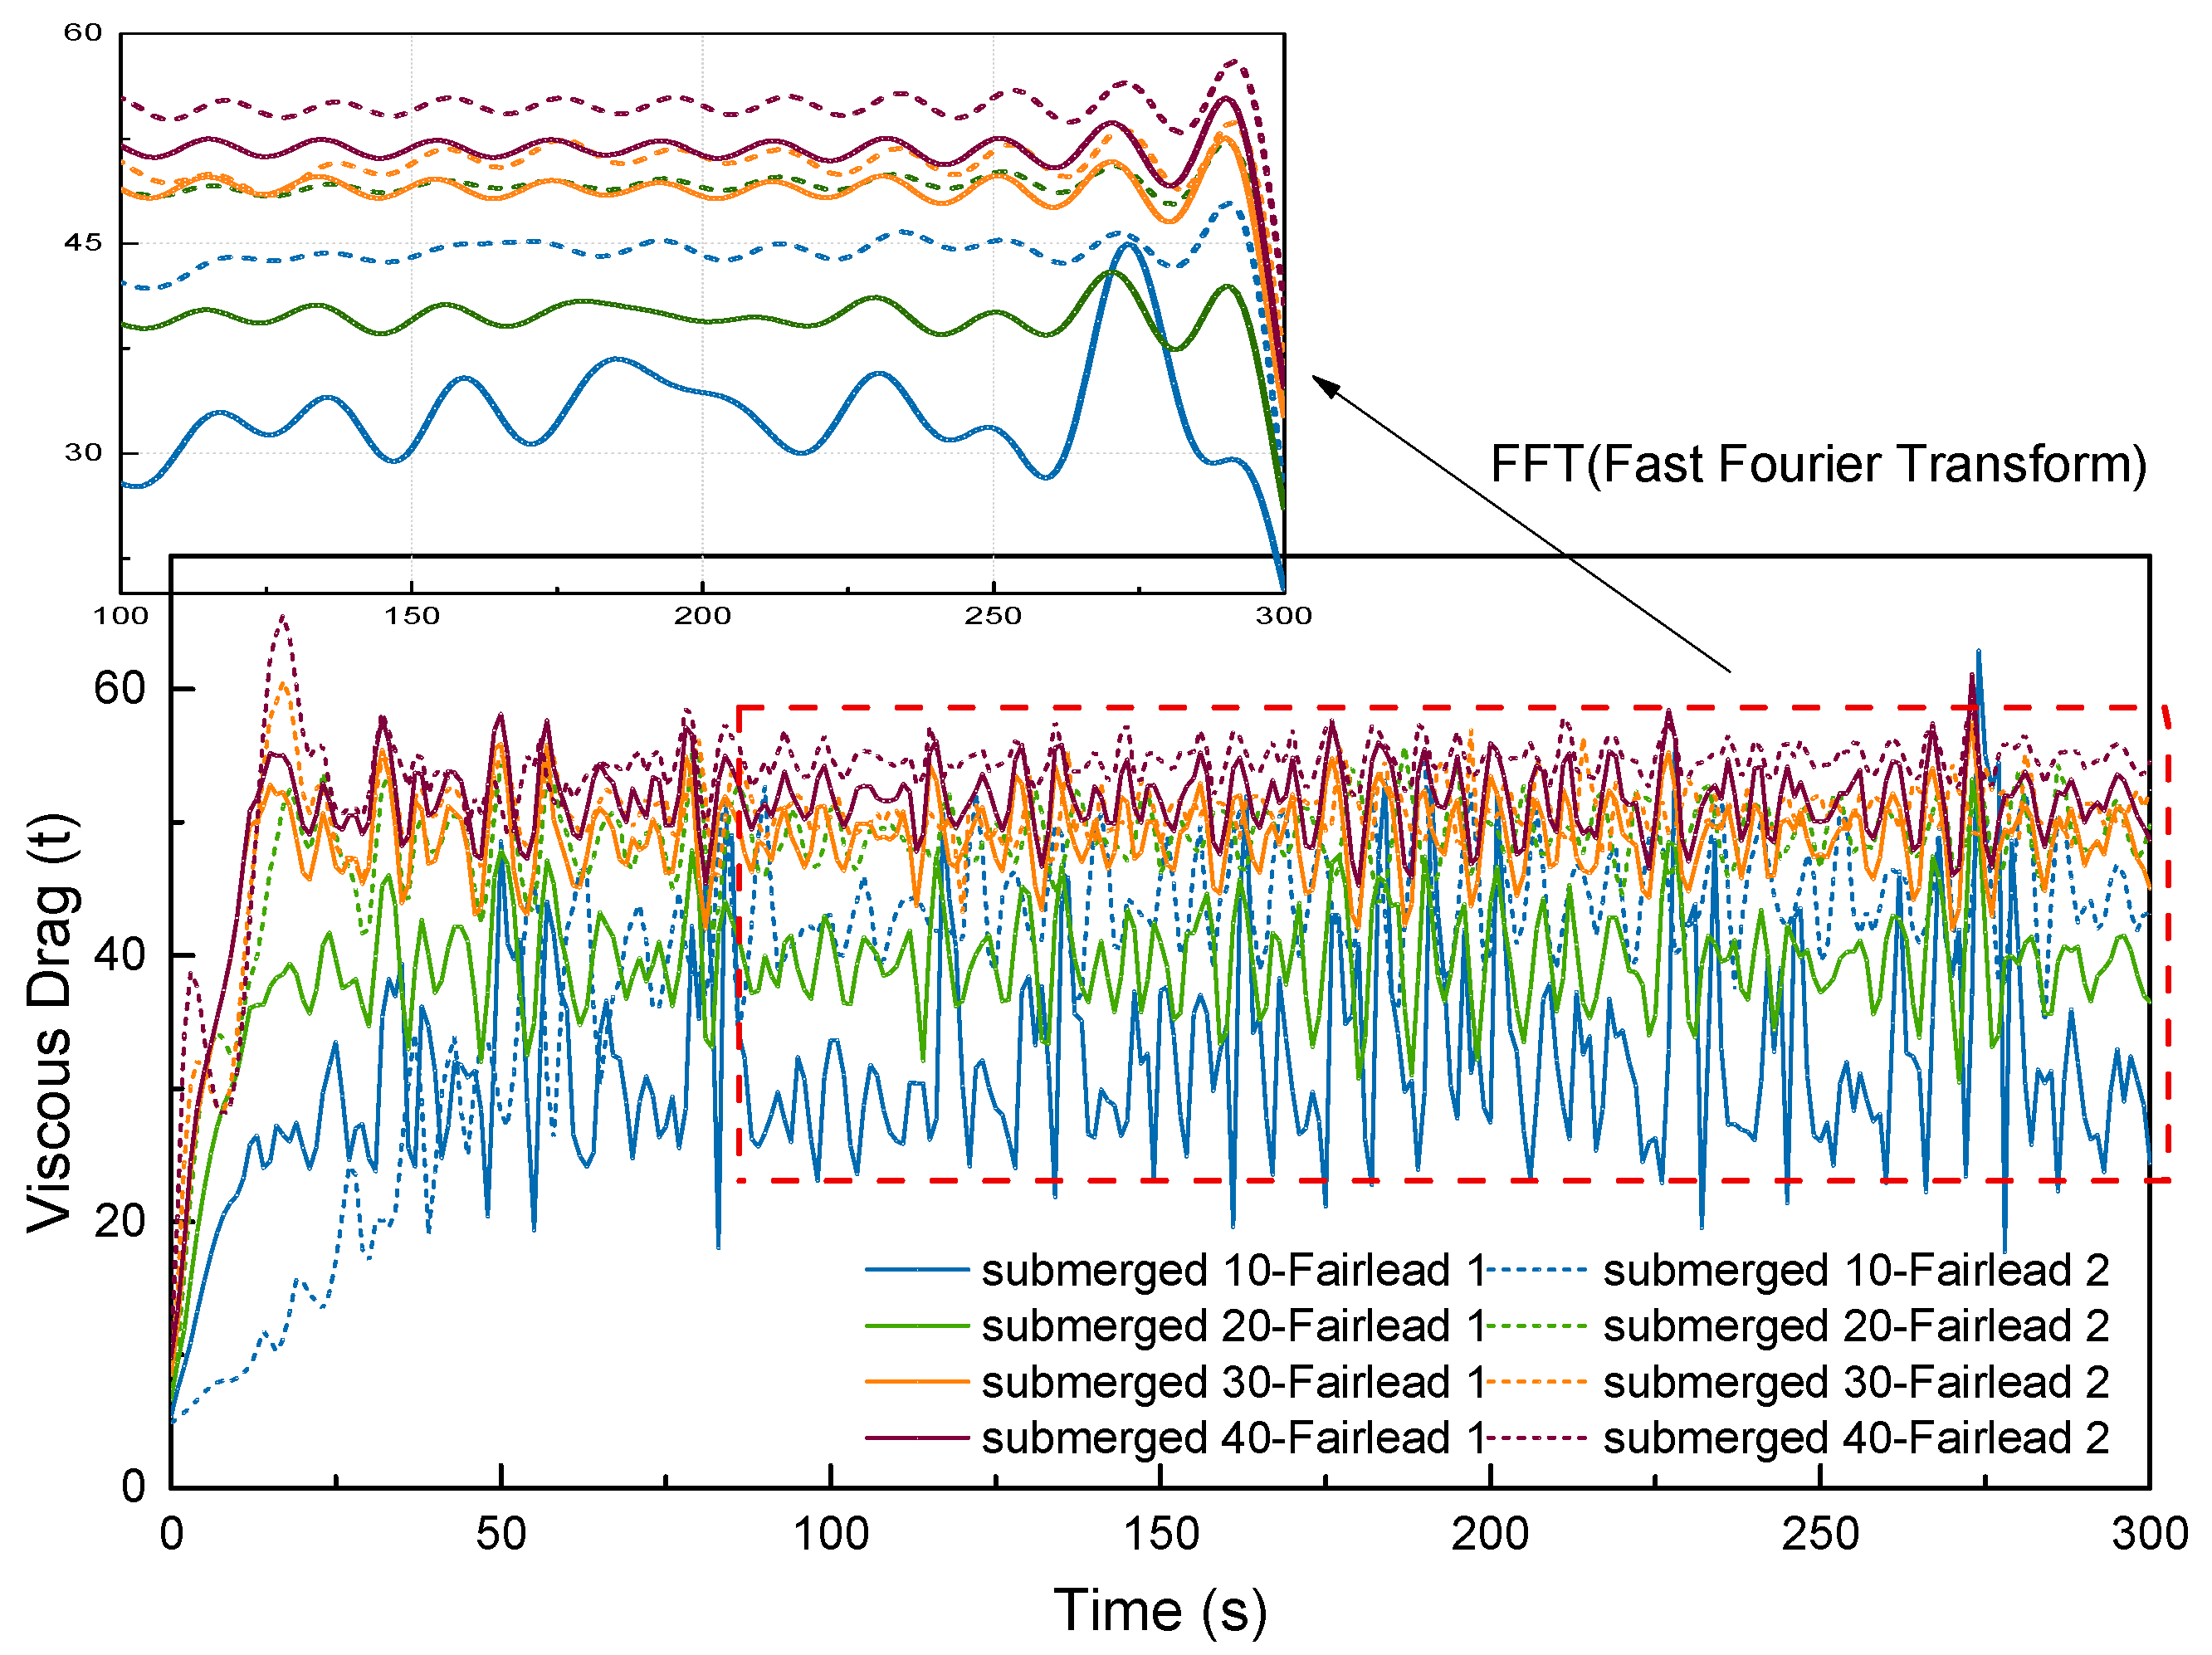
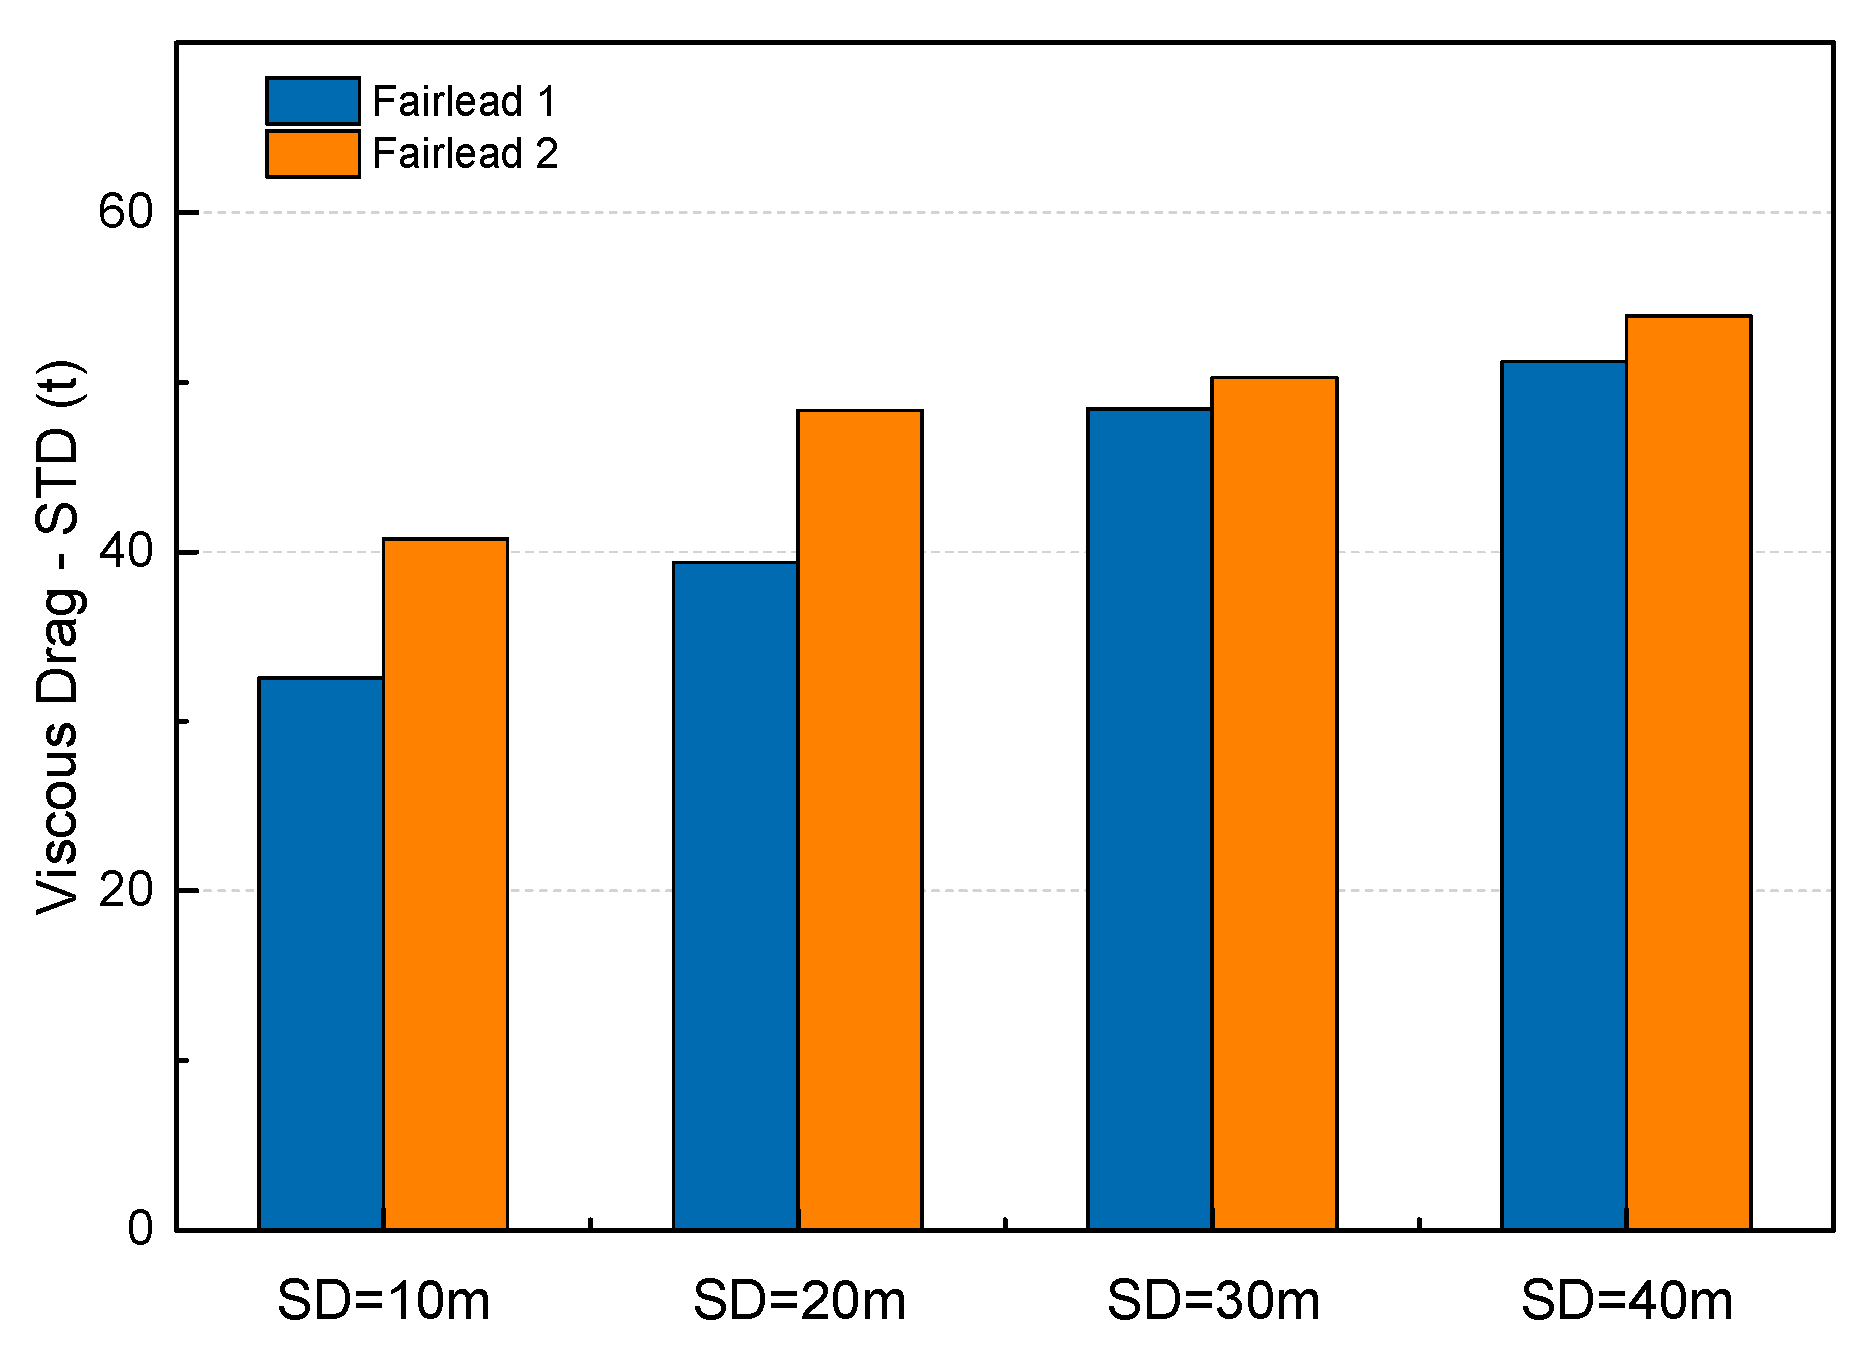
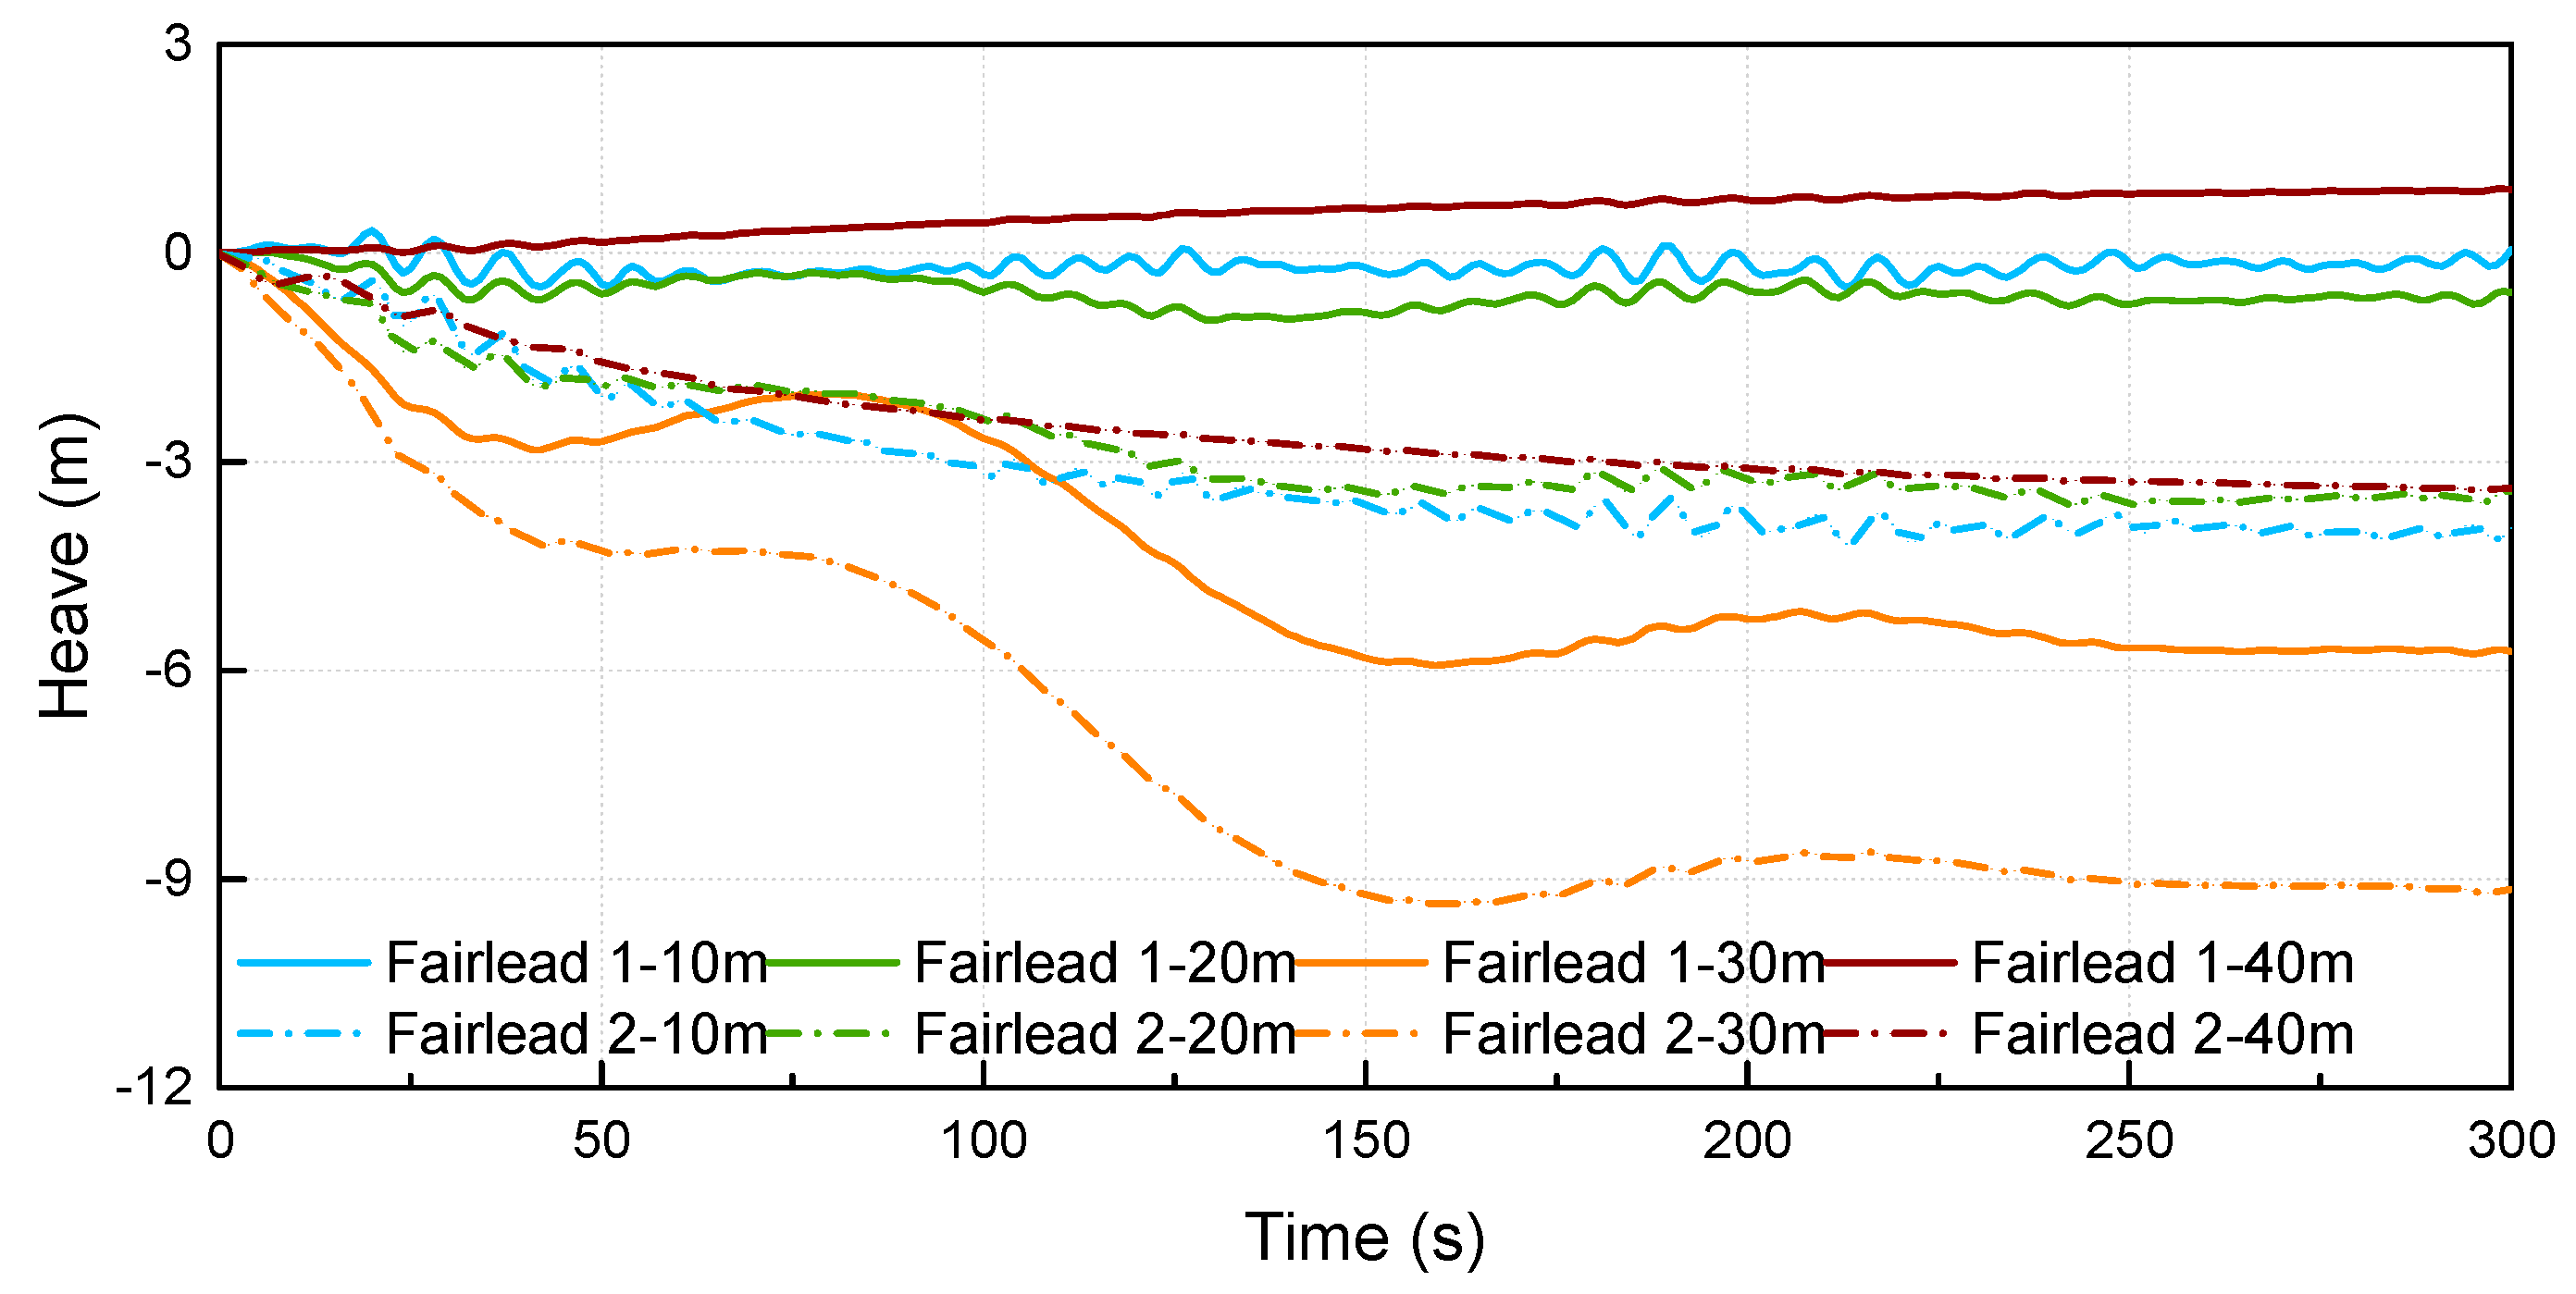
Thirdly, based on the fairlead positions, time domain simulations are conducted to estimate the surface and the submerged towing methods with respect to the resistance and dynamic responses. It suggests that higher mooring position is likely to result in larger viscous resistance. Deeper submerged depth is preferred when the lower motion amplitude is required. Fairlead 1 excels in two aspects: lower resistance and lower motion responses. The submerged towing should be performed with sufficient distance away from the seabed because the OIMM is likely to descend by a large distance.
Finally, it can be concluded that the numerical method by MOSES can be applied for the preliminary estimation of the towing operations for OIMM considering complex sea environment. More accurate and detailed estimation will require to consider the properties of the mooring line and the impacts of the tugboat in the system. These conclusions can provide recommendations and references for the estimation of the feasibility of the towing methods and on the optimization of the towing operation for OIMM and resembling structures.

Author Contributions

Conceptualization, H.D., P.Z. and C.L.; Methodology, R.H. and C.L.; Software, C.L. and R.H.; validation, H.D., P.Z. and C.L.; Formal Analysis, R.H. and C.L.; Writing-Original Draft Preparation, R.H. and C.L.; Writing-Review & Editing, C.L., R.H. and P.Z.; supervision, H.D. and P.Z; project administration, H.D. and P.Z; funding acquisition, H.D., P.Z. and C.L.

Funding

This research was funded by the National Natural Science Foundation of China (Grant Nos. 51679163 & 51779171), Innovation Method Fund of China (Grant No. 2016IM030100), Tianjin Municipal Natural Science Foundation (Grant No. 18JCYBJC22800) and State Key Laboratory of Coastal and Offshore Engineering (Grant No. LP1709).

Conflicts of Interest

The authors declare no conflict of interest.

References

  1. Assessment Wind Measurement Program North Sea. Available online: https://offshorewind.rvo.nl/file/view/31040402/assessment-wind-measurement-program-north-sea-dnv-gl (accessed on 6 March 2015).
  2. Ding, H.; Han, Y.; Zhang, P. Numerical simulation on floating behavior of buoyancy tank foundation of anemometer tower. Trans. Tianjin Univ. 2014, 20, 243–249. [Google Scholar] [CrossRef]
  3. Zhang, P.; Hu, R.; Ding, H.; Le, C. Preliminary design and hydrodynamic analysis on the offshore integrated anemometer mast during wet-towing. Structures, Safety, and Reliability. In Proceedings of the ASME 2018 37th International Conference on Ocean, Offshore and Arctic Engineering, American Society of Mechanical Engineers, Madrid, Spain, 17–22 June 2018. [Google Scholar]
  4. Ding, H.; Lian, J.; Li, A.; Zhang, P. One-step-installation of offshore wind turbine on large-scale bucket-top-bearing bucket foundation. Trans. Tianjin Univ. 2013, 19, 188–194. [Google Scholar] [CrossRef]
  5. Zhang, P.; Han, Y.; Ding, H.; Zhang, S. Field experiments on wet tows of an integrated transportation and installation vessel with two bucket foundations for offshore wind turbines. Ocean Eng. 2015, 108, 769–777. [Google Scholar] [CrossRef]
  6. Zhang, P.; Ding, H.; Le, C.; Zhang, S.; Huang, X. Preliminary analysis on integrated transportation technique for offshore wind turbines. In Proceedings of the ASME 2013 32nd International Conference on Ocean, Offshore and Arctic Engineering, American Society of Mechanical Engineers, Nantes, France, 9–14 June 2013. [Google Scholar]
  7. Jacobsen, T. Subsurface Towing of a Subsea Module. Master’s Thesis, Norwegian University of Science and Technology, Trondheim, Norway, 2010. [Google Scholar]
  8. Jacobsen, T.; Leira, B.J. Numerical and experimental studies of submerged towing of a subsea template. Ocean Eng. 2012, 42, 147–154. [Google Scholar] [CrossRef]
  9. Zhang, D.; Sun, W.; Fan, Z. Application of a newly built semi-submersible vessel for transportation of a tension leg platform. J. Mar. Sci. Appl. 2012, 11, 341–350. [Google Scholar] [CrossRef]
  10. Eriksson, H.; Kullander, T. Survey of Swedish Suppliers to a Floating Wind Turbine Unit Equipped with Pumps for Oxygenation of the Deepwater; BOX-WIN Technical Report no. 7, C101; University of Gothenburg: Goteborg, Sweden, 2013; ISSN 1400-383X. [Google Scholar]
  11. Jurewicz, J.M. Design and Construction of an Offshore Floating Nuclear Power Plant. Master’s Thesis, Massachusetts Institute of Technology, Cambridge, MA, USA, 2015. [Google Scholar]
  12. Kang, W.H.; Zhang, C.; Yu, J.X. Stochastic extreme motion analysis of jack-up responses during wet towing. Ocean Eng. 2016, 111, 56–66. [Google Scholar] [CrossRef]
  13. Li, C.; Liu, Y. Fully-nonlinear simulation of the hydrodynamics of a floating body in surface waves by a high-order boundary element method. In Proceedings of the ASME 2015 34th International Conference on Ocean, Offshore and Arctic Engineering, American Society of Mechanical Engineers, St. John’s, NL, Canada, 31 May–5 June 2015. [Google Scholar]
  14. Zhao, Z.; Tang, Y.; Wu, Z.; Li, Y.; Wang, Z. Towing Analysis of Multi-Cylinder Platform for Offshore Marginal Oil Field Development. In Proceedings of the ASME 2016 35th International Conference on Ocean, Offshore and Arctic Engineering, American Society of Mechanical Engineers, Busan, Korea, 30 June 2016. [Google Scholar]
  15. Ding, H.; Han, Y.; Le, C.; Zhang, P. Dynamic analysis of a floating wind turbine in wet tows based on multi-body dynamics. J. Renew. Sustain. Energy 2017, 9, 033301. [Google Scholar] [CrossRef]
  16. Kim, B.; Kim, T.W. Scheduling and cost estimation simulation for transport and installation of floating hybrid generator platform. Renew. Energy 2017, 111, 131–146. [Google Scholar] [CrossRef]
  17. Wang, Y.; Duan, M.; Liu, H.; Tian, R.; Peng, C. Advances in deepwater structure installation technologies. Underw. Technol. 2017, 34, 83–91. [Google Scholar] [CrossRef]
  18. Zelazny, K. A method of calculation of ship resistance on calm water useful at preliminary stages of ship design. Zesz. Nauk./Akad. Morska Szczec. 2014, 38, 125–130. [Google Scholar]
  19. Putra, I.N.; Susanto, A.D.; Suharyo, O.S. Comparative analysis results of towing tank and numerical calculations with harvald guldammer method. Int. J. Appl. Eng. Res. 2017, 12, 10637–10645. [Google Scholar]
  20. Veritas, D.N. Modelling and Analysis of Marine Operations. In Offshore Standard; DET NORSKE VERITAS (DNV): Akershus, Norway, 2014. [Google Scholar]
  21. Guidelines for Towage at Sea; China Classification Society: Beijing, China, 2012.
  22. MOSES. Reference Manual for Moses; Ultramarine Inc.: Houston, TX, USA, 2009. [Google Scholar]
  23. Faltinsen, O.M. Sea Loads on Ships and Offshore Structures; Cambridge University Press: New York, NY, USA, 1993. [Google Scholar]
  24. Newman, J.N. Wave effects on multiple bodies. Hydrodyn. Ship Ocean Eng. 2001, 3, 3–26. [Google Scholar]
  25. Berg, P.W.S. A Discussion of Technical Challenges and Operational Limits for Towing Operations. Master’s Thesis, Norwegian University of Science and Technology, Trondheim, Norway, 2017. [Google Scholar]
Figure 1. Offshore integrated meteorological mast and towing operation.
Jmse 07 00100 g001
Figure 2. Surface towing and submerged towing methods.
Jmse 07 00100 g002
Figure 3. Towing resistances by two method (MOSES and CCS code) under surface tow and submerged tow.
Jmse 07 00100 g003
Figure 4. Comparison between the towing speed under different sea loads varying with the towing force by MOSES.
Jmse 07 00100 g004
Figure 5. Comparison between the time history curves of the viscous drag force under different towing speeds for surface towing.
Jmse 07 00100 g005
Figure 6. Comparison between the time history curves of the viscous drag force under different towing speeds for submerged towing (submerged depth: 40 m).
Jmse 07 00100 g006
Figure 7. Comparison between the surface towing and the submerged towing under different towing speeds in terms of the viscous drag force and the towing force.
Jmse 07 00100 g007
Figure 8. Schematic view of the pitch and heave motion directions, the loading environments and the fairlead positions.
Jmse 07 00100 g008
Figure 9. Comparison between the time history curves of the viscous drag force for surface towing and subsurface towing in terms of the fairlead position (towing speed: 3 m/s).
Jmse 07 00100 g009
Figure 10. Comparison between the time history curves of the viscous drag force under different submerged depths in terms of the fairlead position (towing speed: 3 m/s).
Jmse 07 00100 g010
Figure 11. Statistical comparison of viscous drag force.
Jmse 07 00100 g011
Figure 12. Pitch motion versus fairlead positions under different submerged depths.
Jmse 07 00100 g012
Figure 13. Heave motion versus fairlead positions under different submerged depths.
Jmse 07 00100 g013
Table 1. Wind force of OIMM (meteorological mast).
Elevation/m90–8080–7070–6060–5050–4040–3030–2020–100–10
Area/m25.198.5510.7110.8213.6614.3917.1220.5633.09
Wind force/kN1.9233.1653.7994.8433.6494.2454.8755.8558.565
Note: The elevation is positive in vertical upward direction.
Table 2. Towing resistance by CCS code.
ItemsWave & Current/tWind Force/tTotal/t
Floating TankTower
Surface towing11.660.004.0915.75
Submerged 10 m20.285.583.8929.75
Submerged 20 m20.289.043.5832.90
Submerged 30 m20.2811.923.2035.40
Submerged 40 m20.2814.222.7237.22
Note: The submerged depth and blockage impacts are not considered here.
Table 3. Towing resistance by MOSES.
ItemsWind Force/tTowing Resistance/t
Surface towing5.3417.94
Submerged 10 m3.0132.56
Submerged 20 m2.3239.35
Submerged 30 m1.7348.42
Submerged 40 m1.5151.21

