1. Introduction
Cuspate forelands are accretionary landforms shaped by waves approaching from two opposing directions [
1]. In these coastal formations, the littoral sediment dynamic depends on the combined action of waves, wind, and longshore coastal currents. In particular, wave action causes cyclic variations of shoreline orientation and position [
2]. Although there is considerable literature on the long-term geomorphological evolution of this landform type [
3,
4,
5], deeper insights are necessary so as to understand coastal changes in these specific environments in both the short and medium terms.
The alternation of high-energy waves and fair-weather conditions are key drivers in beach morphodynamics. High-energy waves cause loss of sediment, which is generally transported seaward, whereas during mild wave conditions, sediment moves landwards, back to the beach, meaning the beach recovers its pre-storm state. Storm erosion and beach recovery are site specific, and depend on multiple hydrodynamic and morphological factors, including storm event duration frequency and energy [
6,
7,
8,
9,
10], pre-storm beach morphological state (e.g., [
11,
12]) and nearshore bathymetric configuration (e.g., [
13,
14]). Over last decades, several researches investigated the occurrence and energy of wave storm events driving beach morphodynamics (e.g., [
6,
15,
16,
17,
18,
19,
20]). Nevertheless, these findings need more corroboration by comprehensive observational studies over various coastal types’ landforms as cuspate forelands.
On coastal cuspate forelands, the dynamics of storm impact and recovery processes are complex due to their convex shape. The challenge of studying coastal cuspate forelands morphodynamics is not only related to spatial and temporal factors [
21,
22,
23], but also to their specific shape, as the cycle of beach erosion and recovery is driven by a multi-directional wave climate. Storm impacts and recovery processes are related to wave direction and foreland beach orientation (e.g., [
24]).
Maspalomas is a cuspate foreland at the southern end of Gran Canaria Island, with a convex shaped shoreline facing the Atlantic Ocean. Here, the main research was focused on the dune field dynamics over last decades, highlighting the general deficit of sediments, accelerated by anthropogenic factors like infrastructures and the increase of tourism [
25,
26,
27,
28,
29]. Yet, the recent field measurements of the dune system have shown a constant loss of sediment volume on the dunes [
27,
30] and modifications on the aeolian dynamics [
30,
31,
32]. Regarding historical shoreline change, previous studies described the evolution of Maspalomas cuspate foreland with the use of aerial photographs from 1961 and 2012. In the ’60s and ’70s, significant shoreline variation was observed (up to 300 m and 120 m at BT and MB, respectively) aggravated by anthropogenic disturbances. However, the coastline remained relatively stable in the next decades (1977–1998) [
27,
33,
34].
Nonetheless, there still needs to be a proper study which integrates wave analysis and geomorphological changes to determine the forcing of swell from the Atlantic Ocean on foreland sandy beaches [
35]. Maspalomas main sediment exchanges occur between the dune field, the beaches and the submerged area, whereas the system does not receive sediment inputs from other contiguous beaches due to an ineffective coastal drift and the absence of fluvial sources [
33]. In this context, being a poor source of sediment, the system response to storm waves is a crucial factor in the morphodynamical evolution of the cuspate foreland. For instance, severe cross-shore beach erosions with drastic geomorphological damages were caused by SW sever storm during the winter 2009/10. These storms induced intense beach erosion and shoreline retreat uncovering the rocky substrate pebble deposits, forming scarps with avalanching, and eroding the dunes in the backshore [
36].
The main goal of this work is to assess how bi-directional waves contribute to the morphological changes of Maspalomas cuspate foreland over months and over years, i.e. the identification of storms, directional longshore transport, beach morphological budget, and relationships among wave energy and shoreline change variability. The morphodynamic analysis of Maspalomas carried out in this work aims to deliver to researchers and coastal managers new insights of the evolution of cuspate forelands, for a better understanding of coastline evolution and management.
2. Study Site
The archipelago of the Canary Islands has a subtropical climate characterized by warm air temperatures over the year, with mild winters characterized by a mean air temperature of ~20 °C, low precipitation (less than 225 mm/year) and high sunshine (~2800 h/year) [
37]. The volcanic origin of the Canary Islands means their arid coastal systems are geologically diverse. [
33,
38].
Maspalomas is a wave-dominated cuspate foreland, whose coast extends for 6 km at the southern tip of the island of Gran Canaria, one of the Canary Islands, Spain (
Figure 1). Maspalomas consists of Maspalomas dunefield and two beaches, namely Maspalomas Beach (hereinafter, MB) and El Inglés Beach (hereinafter, IB) converging to the head of the cuspate, La Bajeta Tip (hereinafter, BT). Here, sediments are gradually disappearing, due to sand deficit mainly caused by both storm waves approaching from ENE-E and SW [
35], and anthropogenic disturbances of the aeolian sedimentary dynamics related to the surrounding touristic development since the early 1960´s [
27]. Sediment of the subaerial beaches is mainly sand, with a mean grain size of 2-3 φ.
Occurrence of wind direction is balanced between two opposing directions (E–NE and W), but the effective winds (> 5 m/s) for aeolian sand transport showing a clear dominance of the E-NE directions. The prevailing wind direction is determined by trade winds, which blow from the northeast between April and September. For the rest of the year, there are multi-directional winds [
39]. The tidal regime is semidiurnal meso-tidal, with a range of 1.8 m during neap tides and up to 2.6 m during spring tides. The wave regime shows a bidirectional pattern, mainly composed of SW oceanic swell and NE local sea-wind waves. The annual regime is characterized by significant offshore wave height (
Hs) ranging between 0.5 m and 1 m, and peak wave period (
Tp) between 4 and 8 s, with a NE prevailing wave direction. Usually, most storm waves come from the NE, although the highest were identified from the SW [
35].
Sediments on MB and IB present carbonate content ranging between 50–70% [
36]. The main output of sediments is related to seaward sand transport to sinking areas on the inner shelf and deeper seafloor [
36].
The Maspalomas (MB), El Inglés (IB) and La Bajeta Tip (BT) sandy stretches are the sedimentary transitional zones between the Maspalomas dune field and the sandbanks of the nearshore and adjacent insular shelf. They constitute the main stocks of sand for the Maspalomas dune field and at the same time the main receptacle area for sands resulting from dune erosion [
27,
33].
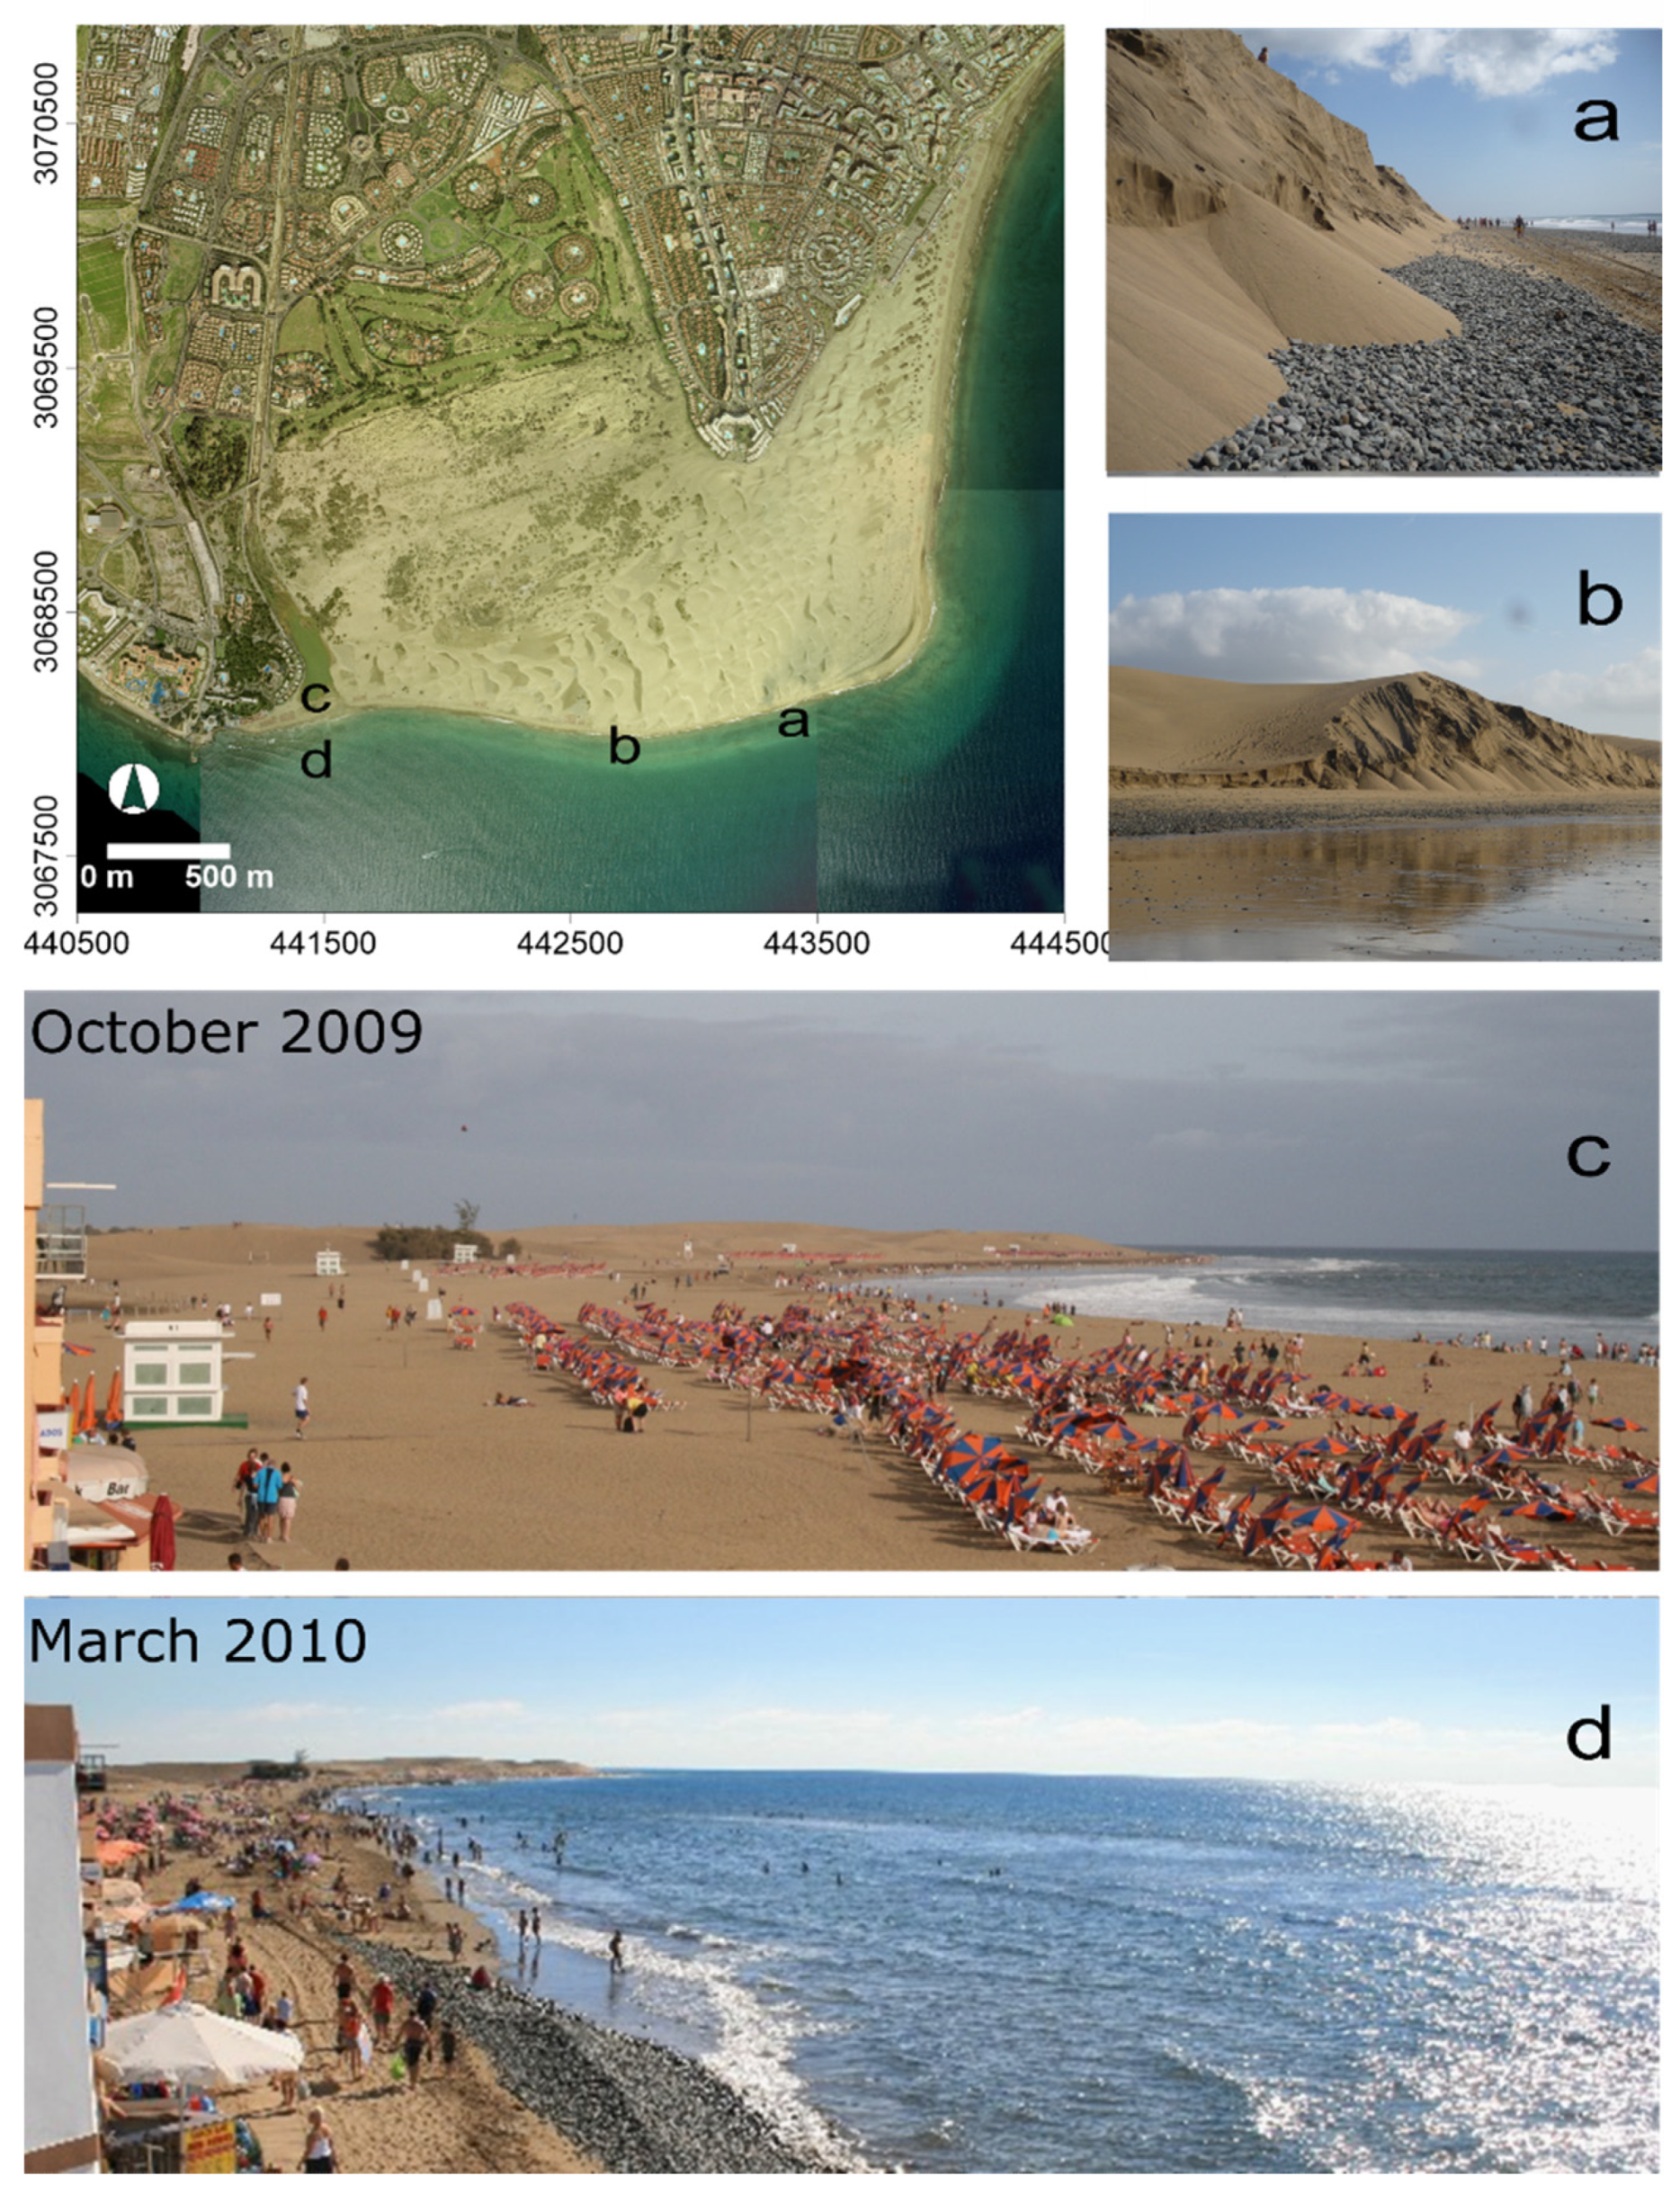
Maspalomas Beach (MB) is located in the SW of the foreland. It is a 2.5 km-long sandy stretch, limited at the western margin by an urbanized area and a human-altered coastal lagoon. The backshore dune field of its eastern part reaches up to 15 m height. To give a perspective of the study site,
Figure 2 shows some picture of the beach state pre- and post-storm events of winter 2009/10. After storm, pebbles typically appear in some sectors of MB.
El Inglés Beach (IB) is located in the NE part of the foreland, with a coastline extension of about 2 km backed by the dune field foredune. The dune field and the beaches do not contain artificial structures, but IB is delimited northward by small dams built in 2009. Maspalomas dune field (about 360.9 ha) acts as a coastal buffer and sand reservoir for the subaerial beaches.
La Bajeta Tip (BT), with a shoreline of approximately 1.5 km, is characterized by a complex dynamic, due to its exposure to waves and induced currents from several directions.
3. Methods
Following the main aims of this work, a detailed characterization of the morphological changes driven by hydrodynamics was performed. This section describes the collection of seasonal topo-morphology measurements of Maspalomas, along with the methodological approach for the morphodynamic analysis.
3.1. Hydrodynamics
Wave offshore conditions were retrieved from the wave database (
www.puertos.es), at the WANA grid point (27°30′ N; 15°30′ W) located about 25 km offshore Maspalomas cuspate foreland (
Figure 1). The dataset consisted of 3-hour periodicity series of
Hs,
Tp and wave direction (α) for 6 years (2005–2012). The data were used to characterize the wave climate monthly and seasonally, considering the autumn-winter interval between October and March, and the spring-summer period between April and September.
In this work, a wave storm is defined as a climatic event of
exceeding a threshold value of 2 m and duration (D) longer than 12 h, following Spanish Maritime Reports and Yanes et al. [
40]. Each storm was characterized in term of wave energy computing the storm power index PSI [
41,
42] as:
where
D is the duration of the storm conditions in hours and
Hs is the maximum storm significant wave height.
The numerical Coastal Modeling System model (SMC, [
43]) was applied to propagate storm waves towards the shore, and to calculate the storm wave-induced longshore currents at the study site. The model set up was calibrated with data collected by an ADCP during field campaigns performed on 2007, which aimed to measure wave-induced longshore current with a range of Hs 1m÷3m during 12 hours (one tidal cycle). The model was run with default setting, which resulted in reproducing the measured longshore current with an error of magnitude of 10
−2 m/s.
3.2. Topo-Bathymetric Survey Dataset
DGPS-RTK high-resolution beach topography survey programme was conducted at Maspalomas beaches during the 2006–2012 period. The surveys were performed mounting an RTK-GPS unit to an all-terrain vehicle (ATV) driving on the subaerial beach with alongshore trajectories down to the mean low tide level. In the meantime, cross-shore beach transects were retrieved by a human operator carrying an RTK-GPS unit on a backpack. More than 30,000 topographic points were collected during each survey. The vertical error assessed after in-situ calibration was less than 0.07 m [
43].
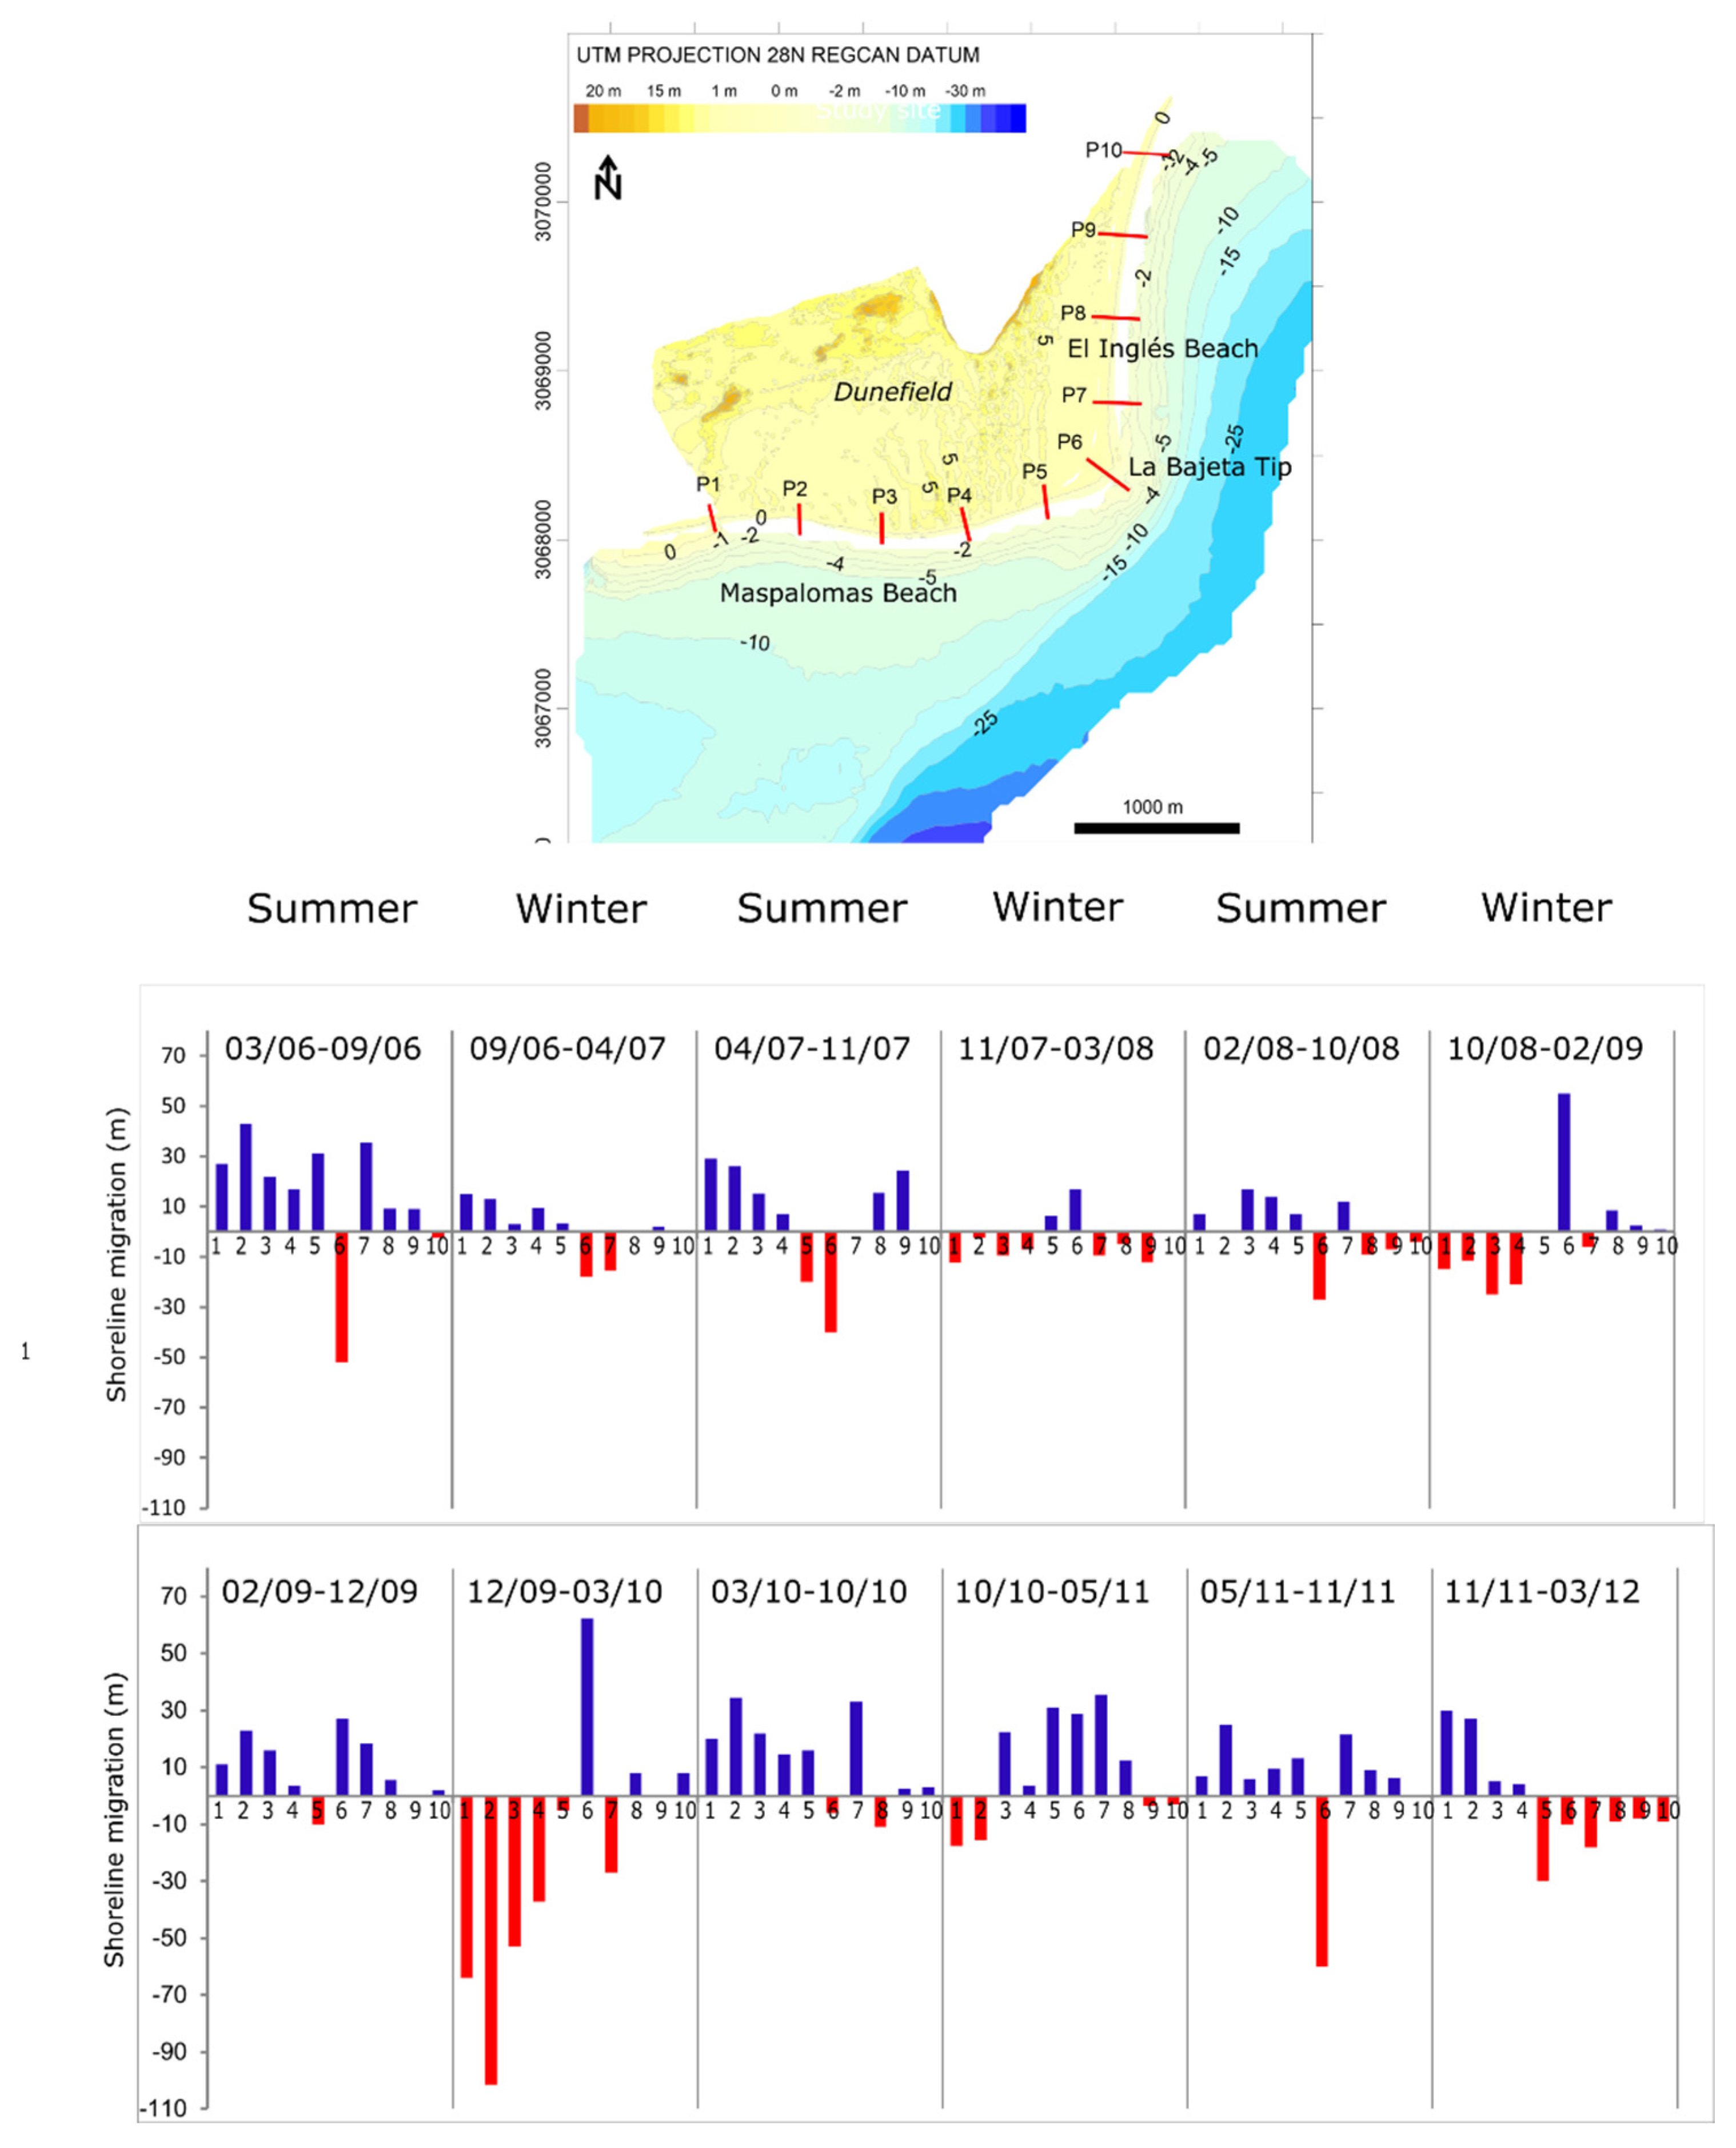
Ten beach profiles, equally spaced with an alongshore distance of 500 m, were selected for analyzing the cross-shore morphodynamics (
Figure 1). DEM measurements started in March 2006 and continued monthly during 2006, and seasonally from April 2007 until March 2012. In particular, surveys were performed at the start of spring and autumn to monitor coastal changes over the year. Echo-sounder bathymetry surveys were carried out from 2007 to 2009. The bathymetric maps were produced with a 2×2m spatial resolution and submeter accuracy [
33,
36].
In the subsequent data processing to obtain an integrated DEM of the Maspalomas cuspate foreland, both topographic and bathymetric data were referred to a common vertical reference frame to the UTM coordinates system and the geodesic net of Canary Islands (REGCAN).).
3.3. Data Analysis
From the RTK-DGPS field measurements, DEMs were calculated using Surfer software with a Kriging interpolation algorithm to produce a regular 1-m grid. Foreland morphodynamics were characterized by the quantification of seasonal topographic changes. This analysis was assessed by producing a set of 12 morphological maps, which were obtained from the difference between correlative surveyed. A DEM of Differences (DoD) was produced following the method implemented by Wheaton et al. [
44] over the six-year period.
Shoreline location was taken to be the cross-shore position of the Mean Sea Level (MSL), considered here at z = 0 m contour. From each DEM, the shoreline contour was extracted. Shoreline changes of the three sectors (MB, BT and IB) were estimated taking into account the shoreline position at the end of winters and summers. Over the dataset, shoreline movements were described in terms of advance, namely seaward displacements, and retreat, corresponding to landward displacements.
The volumetric changes, sediment budgets and shoreline migration were used to investigate the temporal evolution of the cuspate foreland, focusing on the seasonal and interannual role of storm waves. Finally, Pearson’s correlation coefficients were determined to analyze the linear relationship between shoreline changes and wave forces, in order to test the relationships between the seasonal variability and wave energy.
4. Results
4.1. Wave Climate
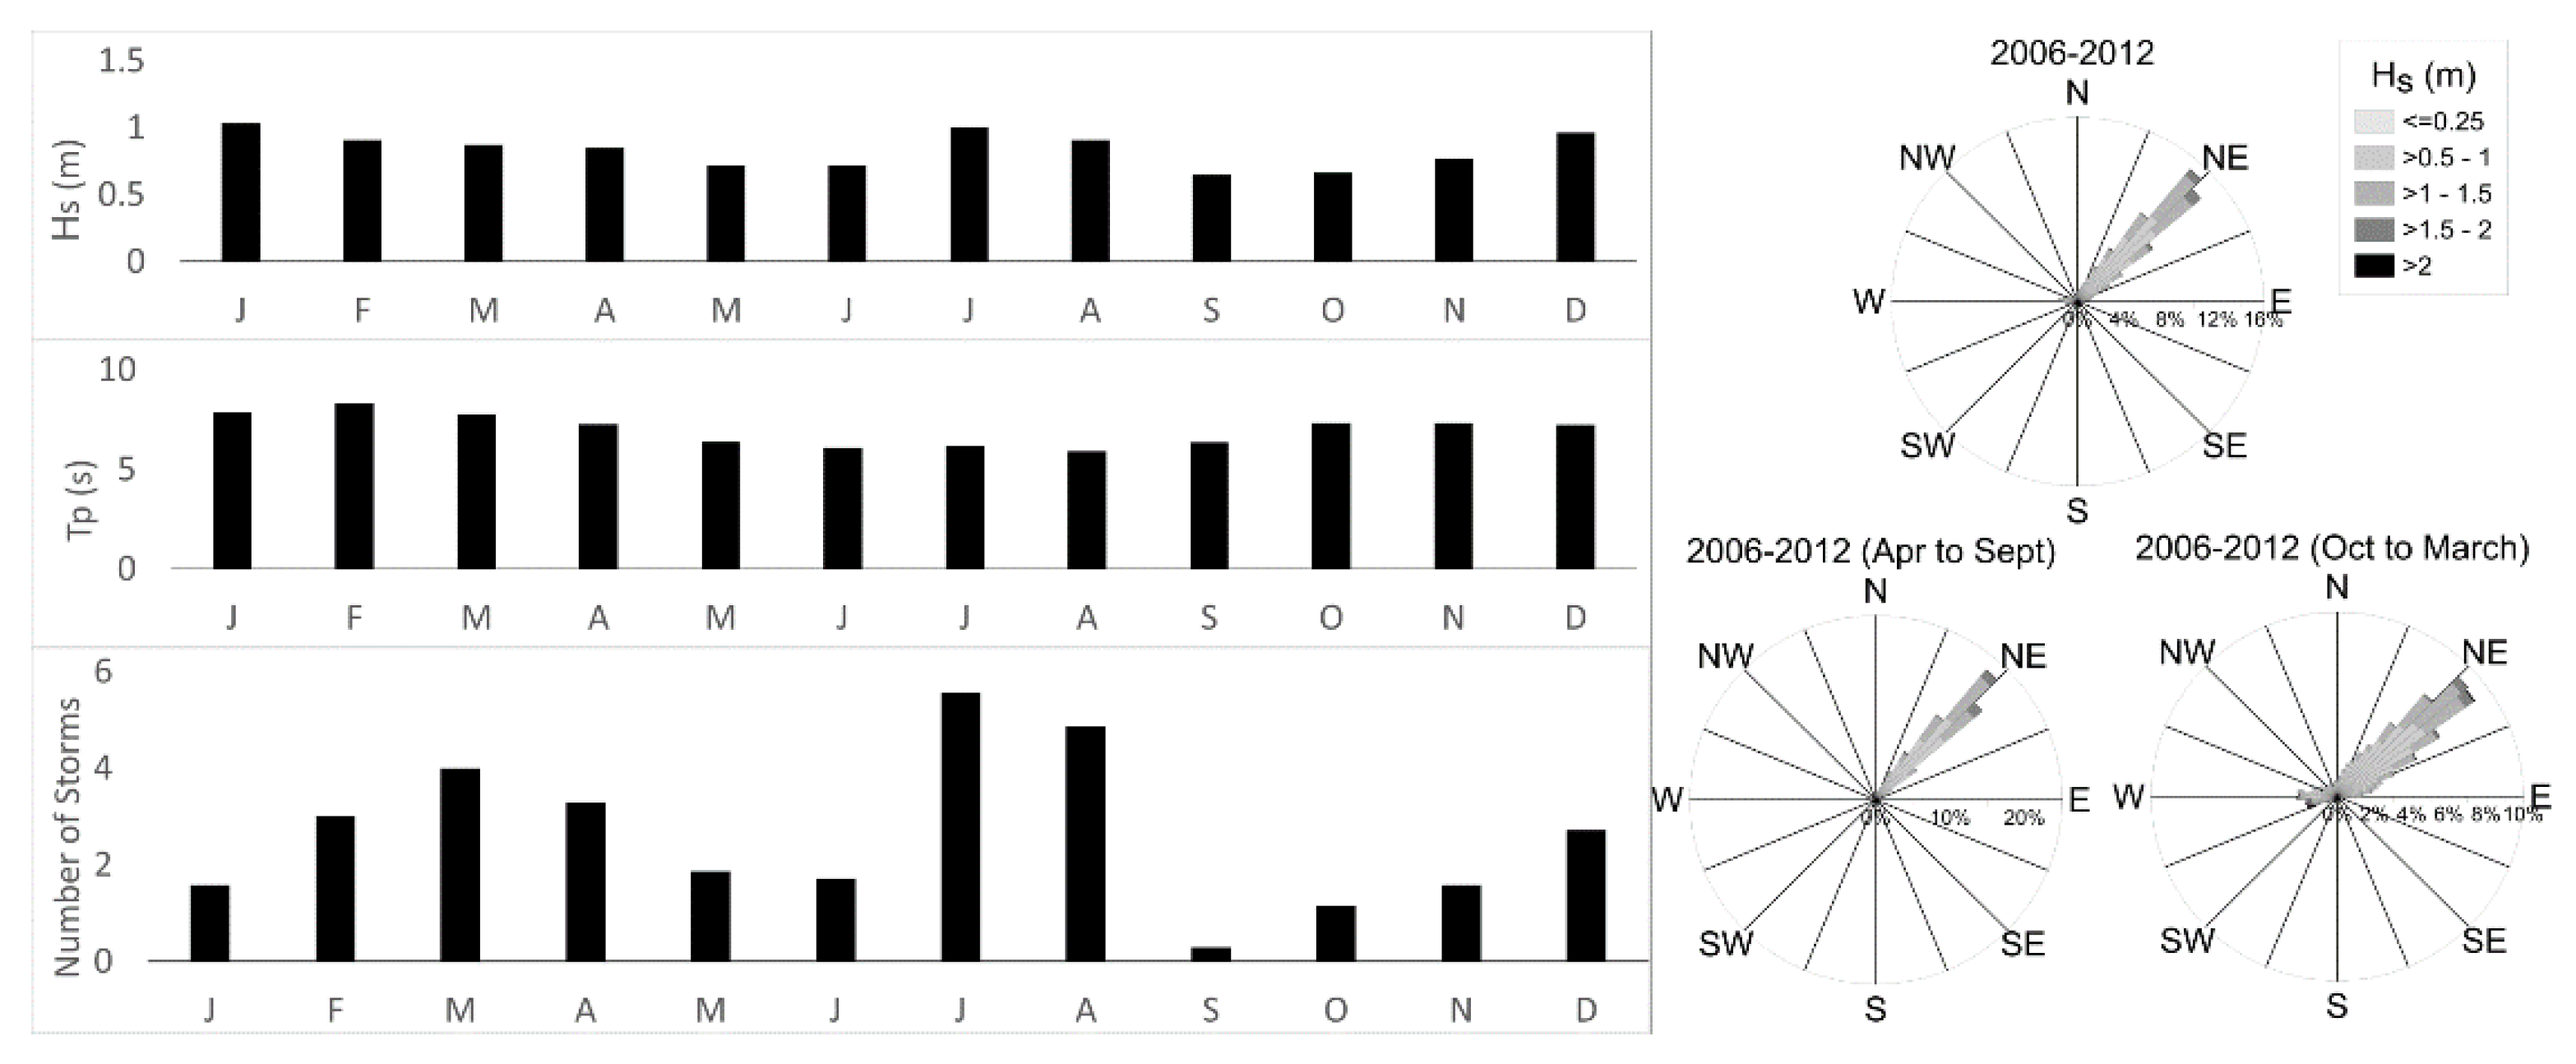
The highest seasonal average values of
Hs occurred during summers, whereas the longest peak periods happened during the winter, which corresponds to the strongest Atlantic swell waves (
Figure 3). Directional wave rises for the summer and winter periods show the wave seasonality, with waves mainly approaching from NNE to ENE (22.5–67.5°) during the year, and waves from SSW to WSW (225–250°) only occurring during autumn-winter. Therefore, spring-summer seasons were characterized by the permanent influence of trade winds, which determined a unidirectional wave regime, whereas a bidirectional wave regime was typical during autumn-winter.
112 storm events were recorded over the considered six years (
Table 1). About the 86% of storms were characterized by NE wave direction during trade winds, whereas the remaining percentage came from the II and III quadrants.
Results of wave regime show an interannual and seasonal variability of storm events (
Table 1). In general, the number of storm events were higher in spring-summer than during autumn-winter, except for 2006/2007, when PSI value was comparable between the two seasonal periods. The most energetic season was spring -summer of 2008/2009, although 2009/2010 had similar values of PSI. During these two years, the number of storms during autumn-winter period was the lowest.
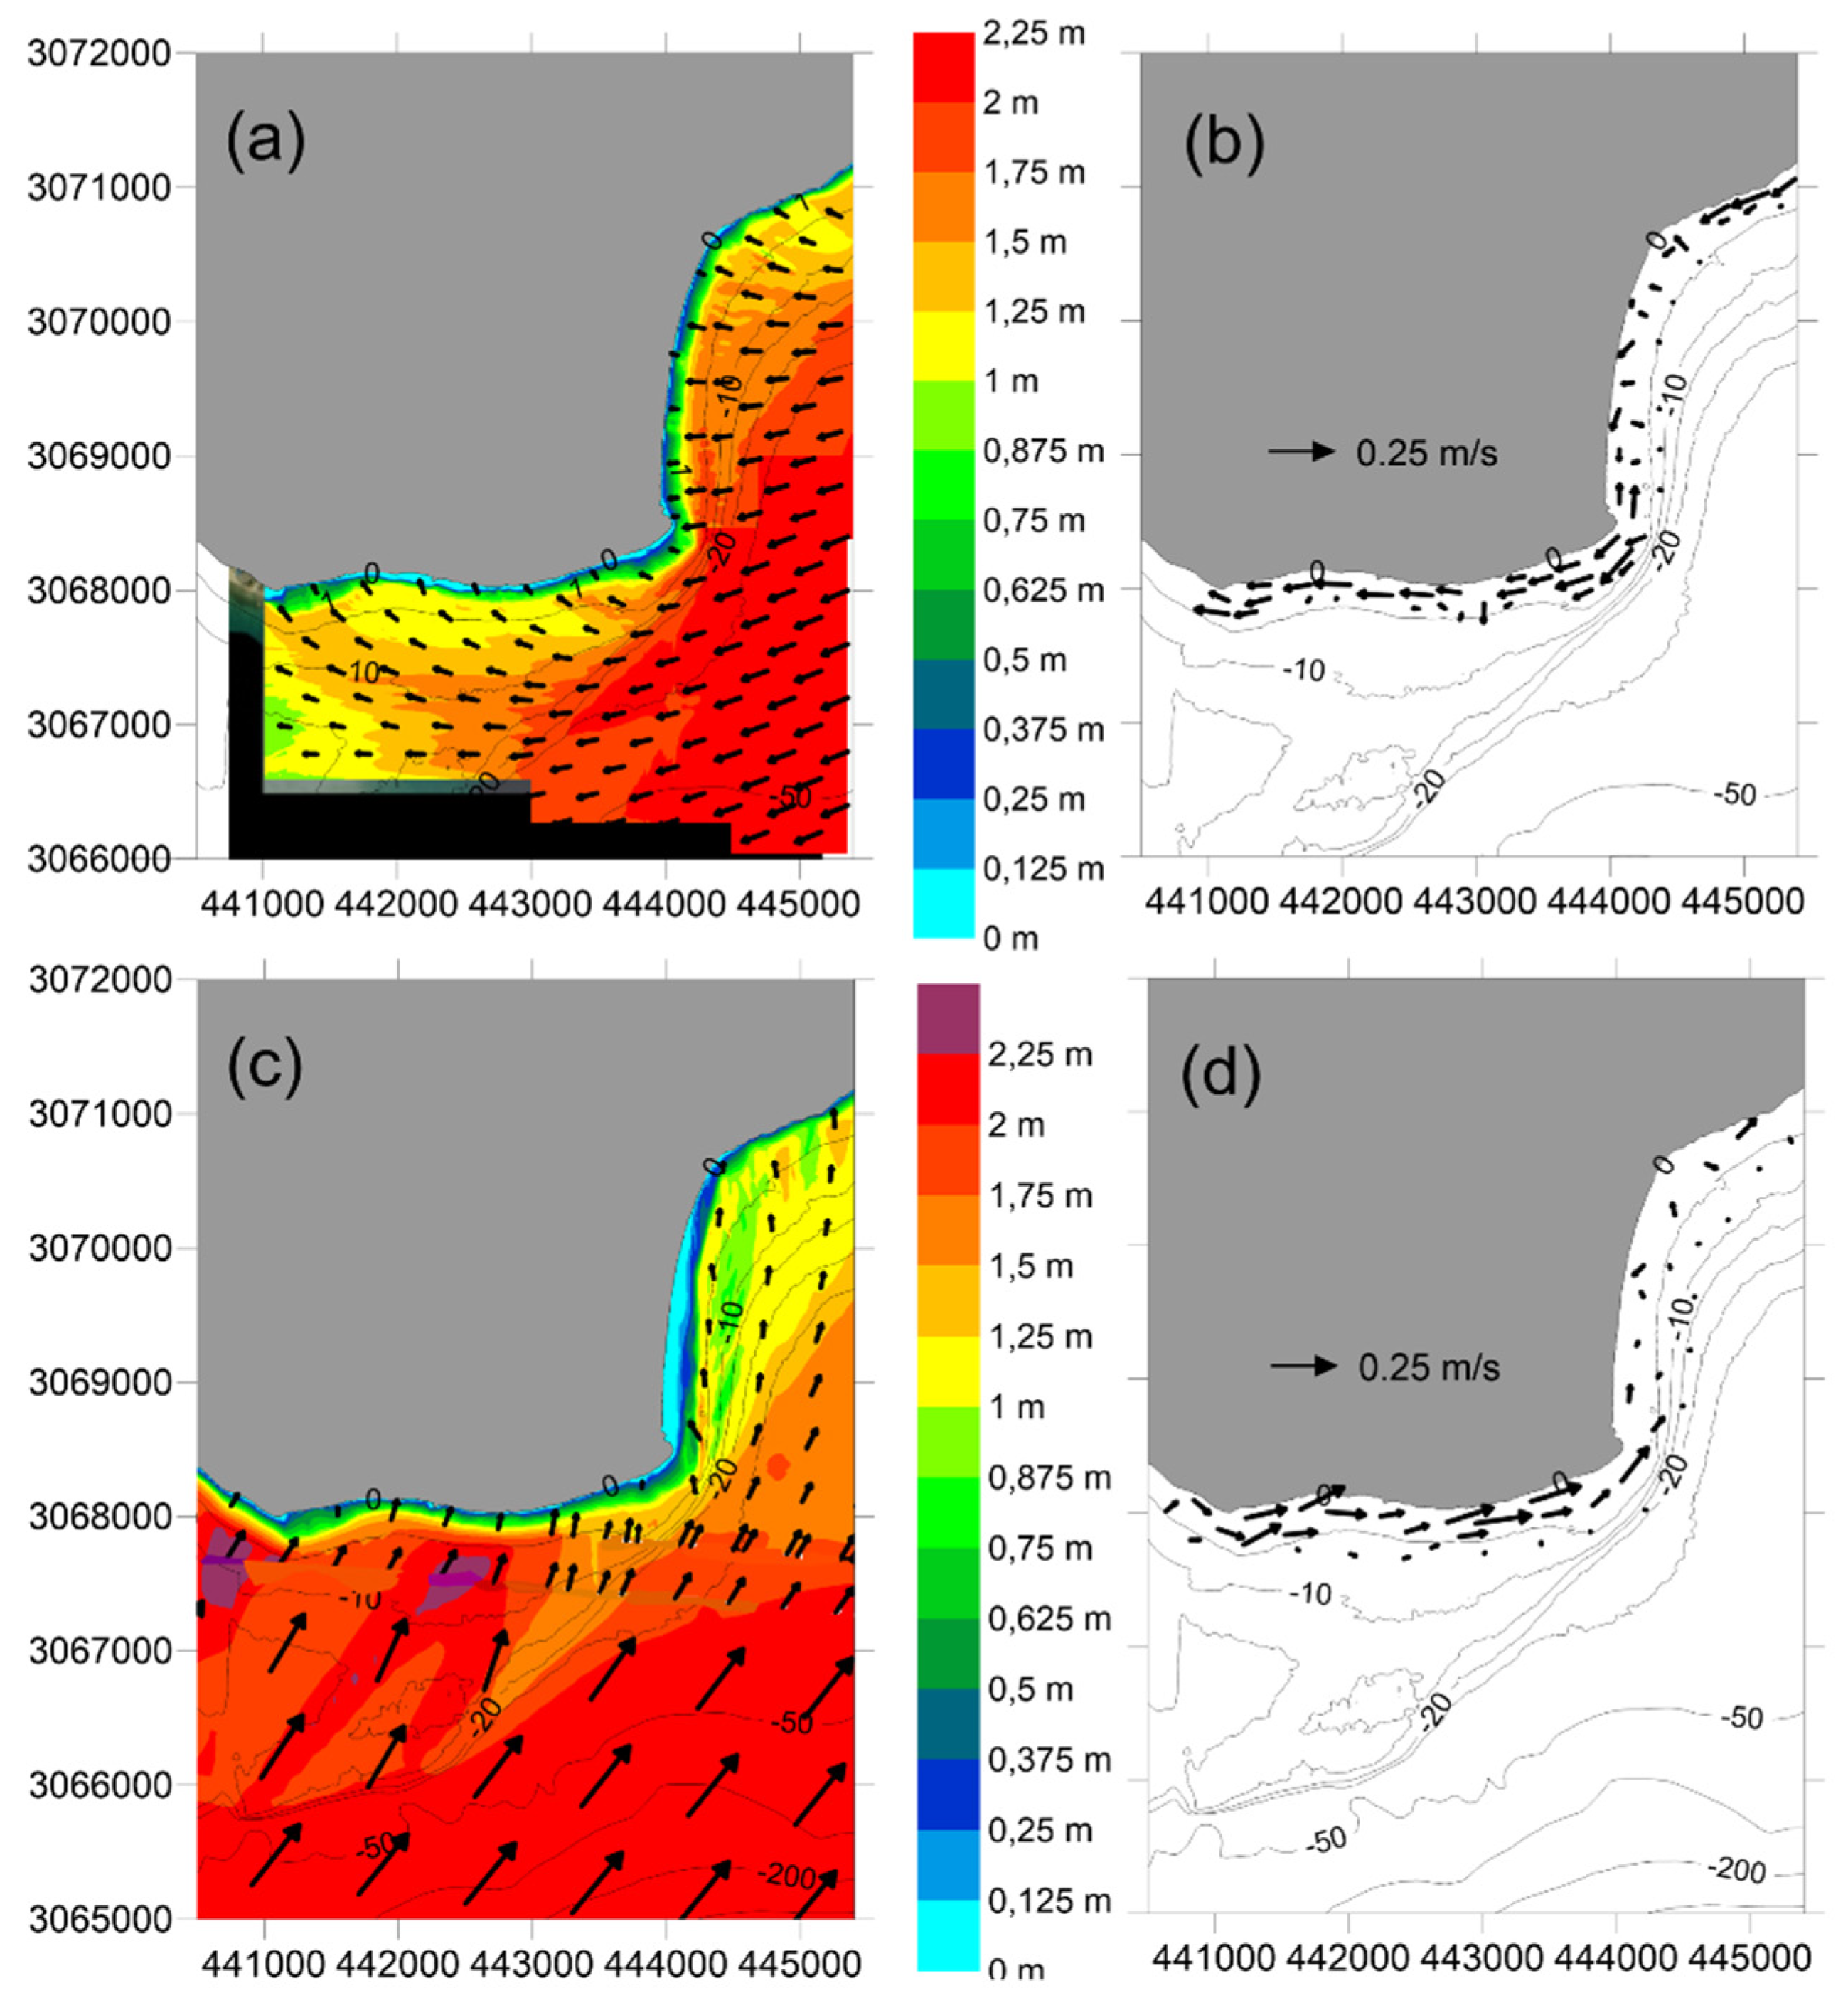
4.2. Wave-Induced Longshore Currents
The longshore current generated by incoming waves on Maspalomas cuspate foreland showed a strong dependence on the direction from which the waves approached the coastline. Storm waves coming from the NE affected IB and MB, generating intense wave-induced westward currents. However, storm waves coming from the SW generated forceful wave-induced eastward currents along MB, while the littoral current on IB was weaker (
Figure 4). With storm wave height of Hs = 2.25 m, the maximum values of longshore currents estimated by the SCM model were about 0.23 m/s and 0.20 m/s at BT and MB, respectively.
4.3. Morphodynamics Driven by Storm Impact
Seasonal to multiannual shore morphodynamics of the Maspalomas cuspate foreland demonstrated high variability on the spatial (alongshore) and temporal (seasonal) scales (
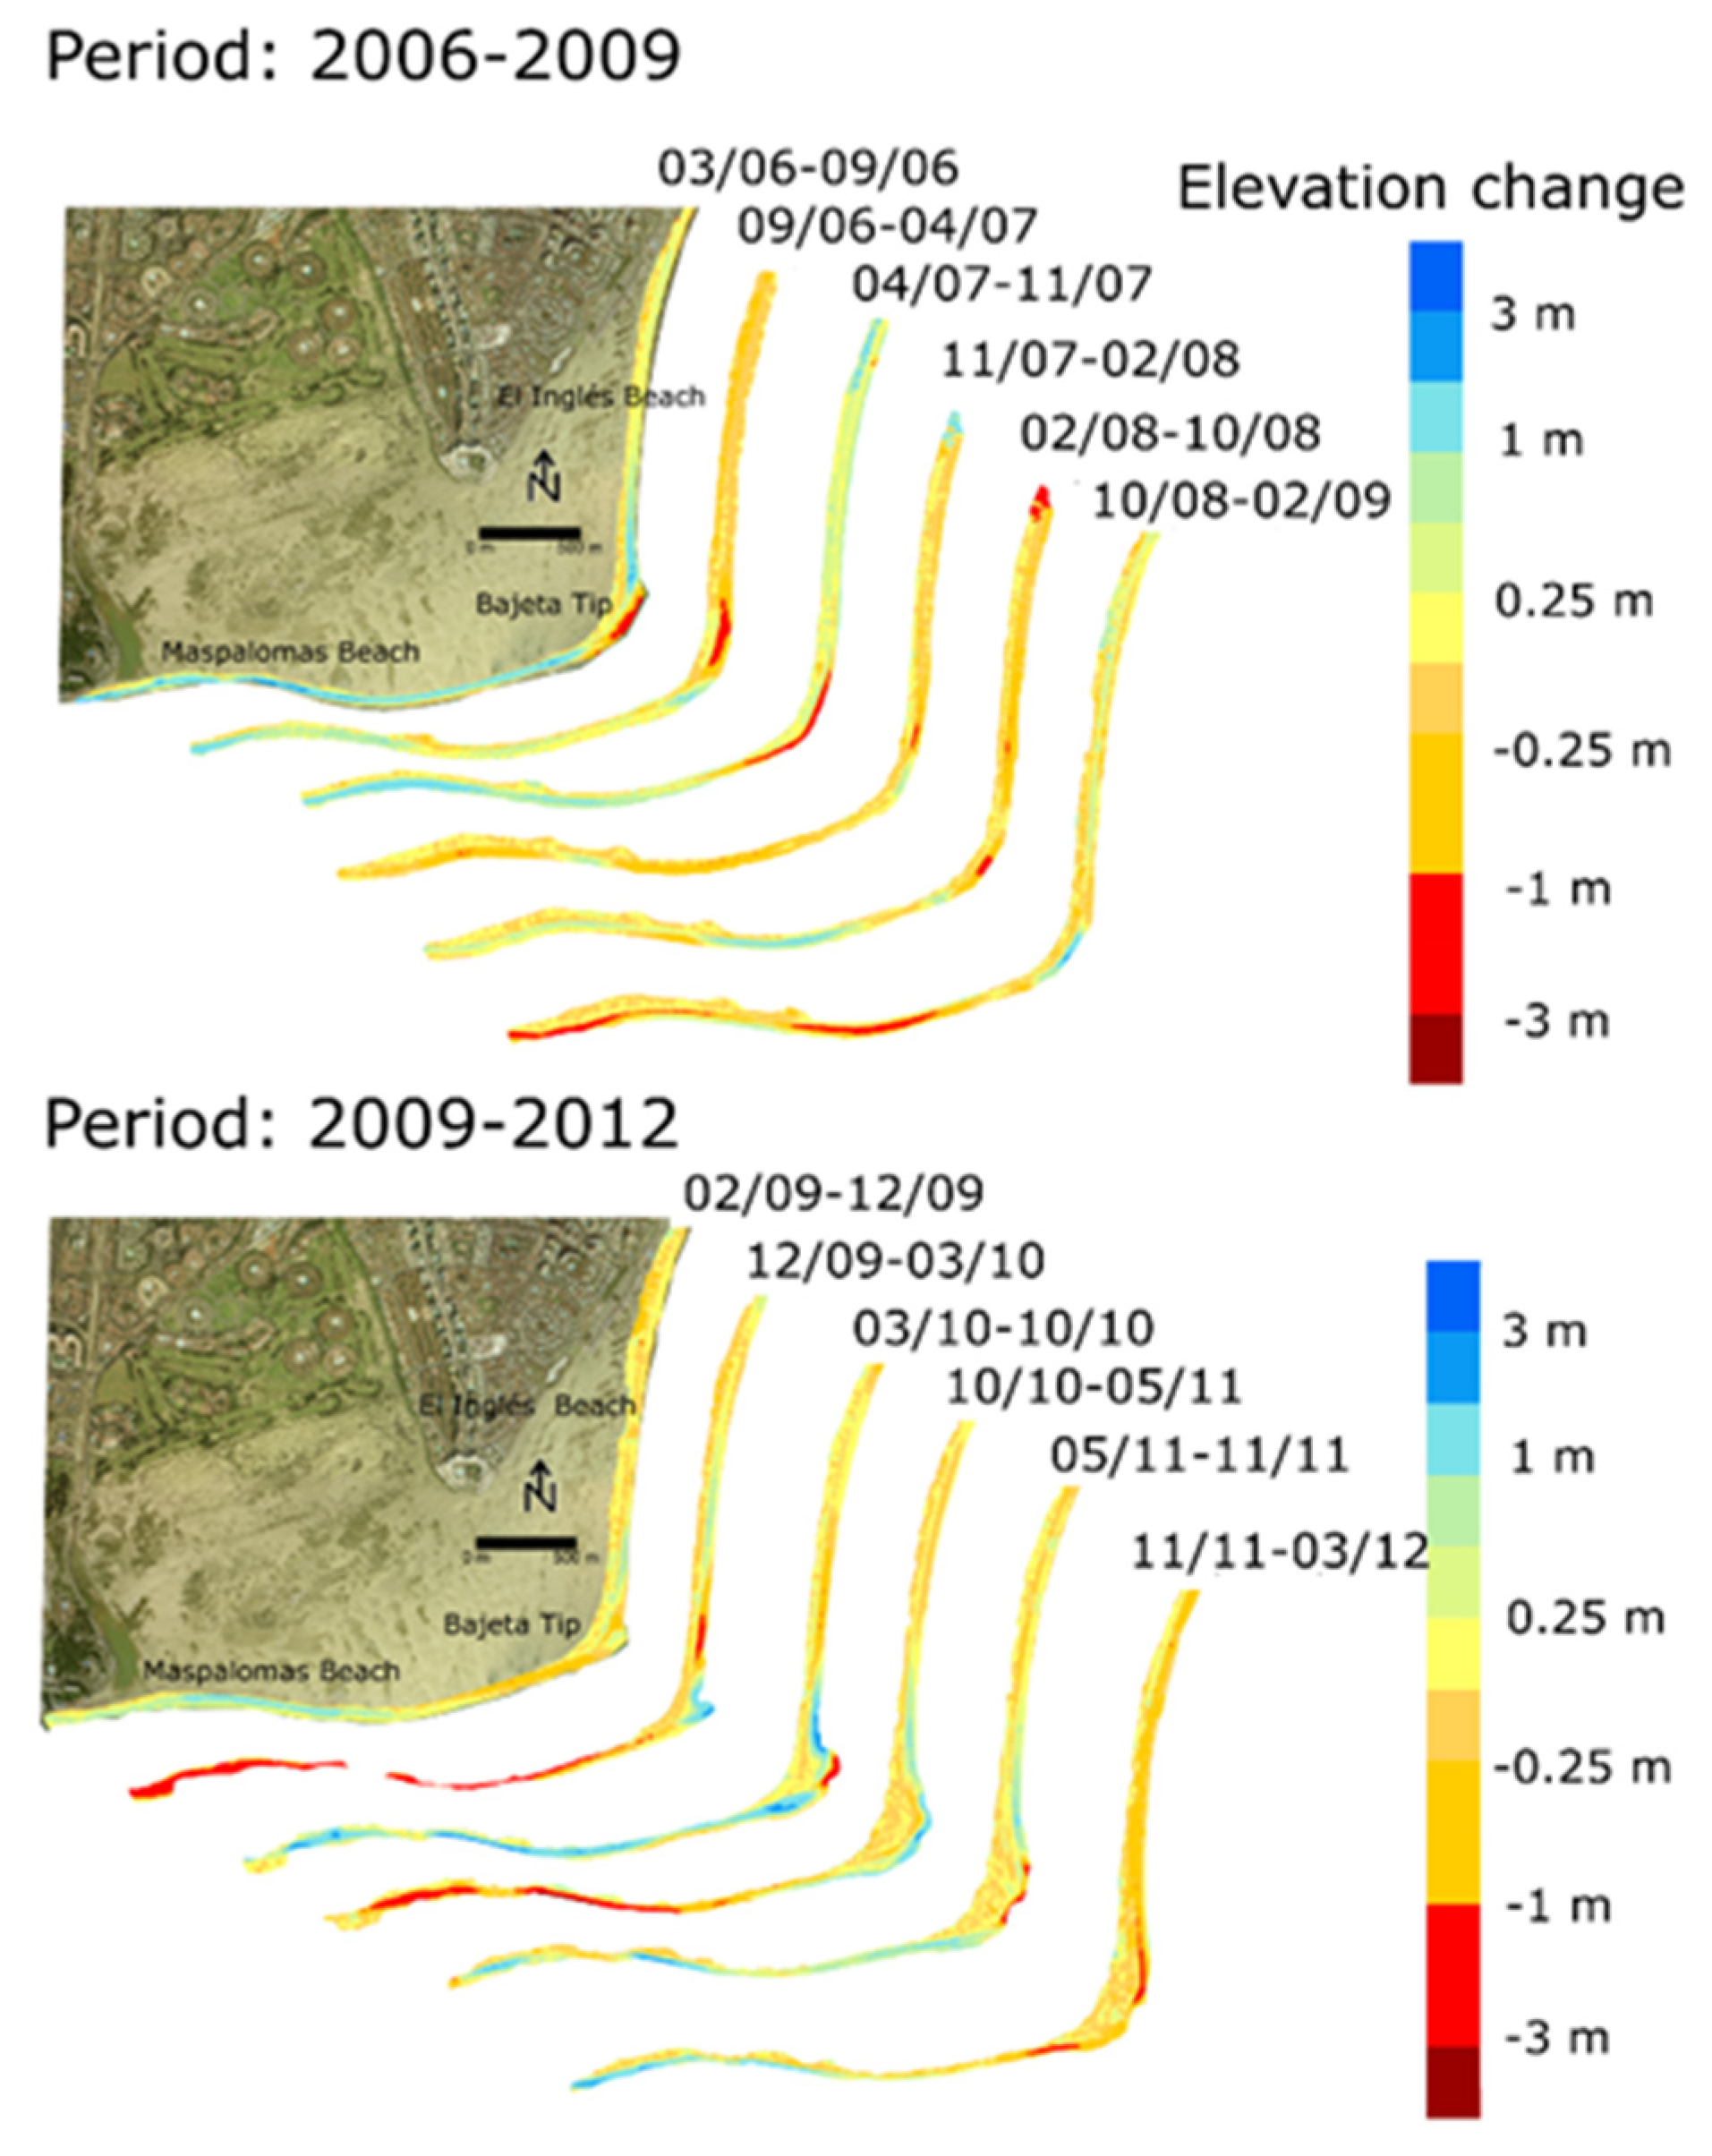
Figure 5). Cycles of erosion and accumulation were observed, with winters usually eroding the MB sector. After the winter storm season, a gradual post-storm recovery period followed, in which an accretionary sediment budget pattern was observed in the following months/seasons.
In general, the seasonality of the erosion/accretion cycles was related to variability in the sedimentary exchange between MB and BT: Erosion periods at MB coincided with accretion at BT. In contrast, minor changes were observed on IB, with net elevation within ±1 m. Larger variations were only observed on the northern and southern limits of IB, near the groin and close to BT, respectively.
Considering the periods in which only NNE-ENE storm events occurred (
Table 1), these events caused erosion on BT and accretion on MB. During periods that were characterized solely by SSW-WSW storm events, strong erosion on MB was observed (12/2009-03/2010). Periods with both NNE-ENE and SSW-WSW storm events were instead related to erosive and accretionary trends in MB and BT, with the main factor driving such changes being the total duration of the events. Thus, focusing on MB, longer NNE-ENE storm events seemed to induce a stable or accretionary period, while longer SSW-WSW storm events were related to erosive periods. On seasonal scale, it can also be observed that recovery periods on MB occurred mainly during trade winds (April to September), when NNE-ENE storm events were more frequent.
Seasonal morphodynamics showed that summer periods promoted accretionary behaviour on MB, while eroded the head of the cuspate foreland (BT). In contrast, MB was eroded during winter periods. An exception to this trend occurred during those winters without SW storms (e.g., 2007/2008 and 2011/2012 winters), when MB presented accretion of beach volume.
Shore morphodynamics showed periods with dominance of both longshore and cross-shore sediment transport. Dominance of longshore transport, with erosion of IB and accretion of BT and MB occurred for instance from March to October 2010, and similarly from May to November 2010. In contrast, dominance of cross-shore transport, with a generalized accretion of IB and MB, but erosion of BT, occurred from March to September 2006, and equally from April to November 2007 (
Figure 5).
4.4. Shoreline Variability
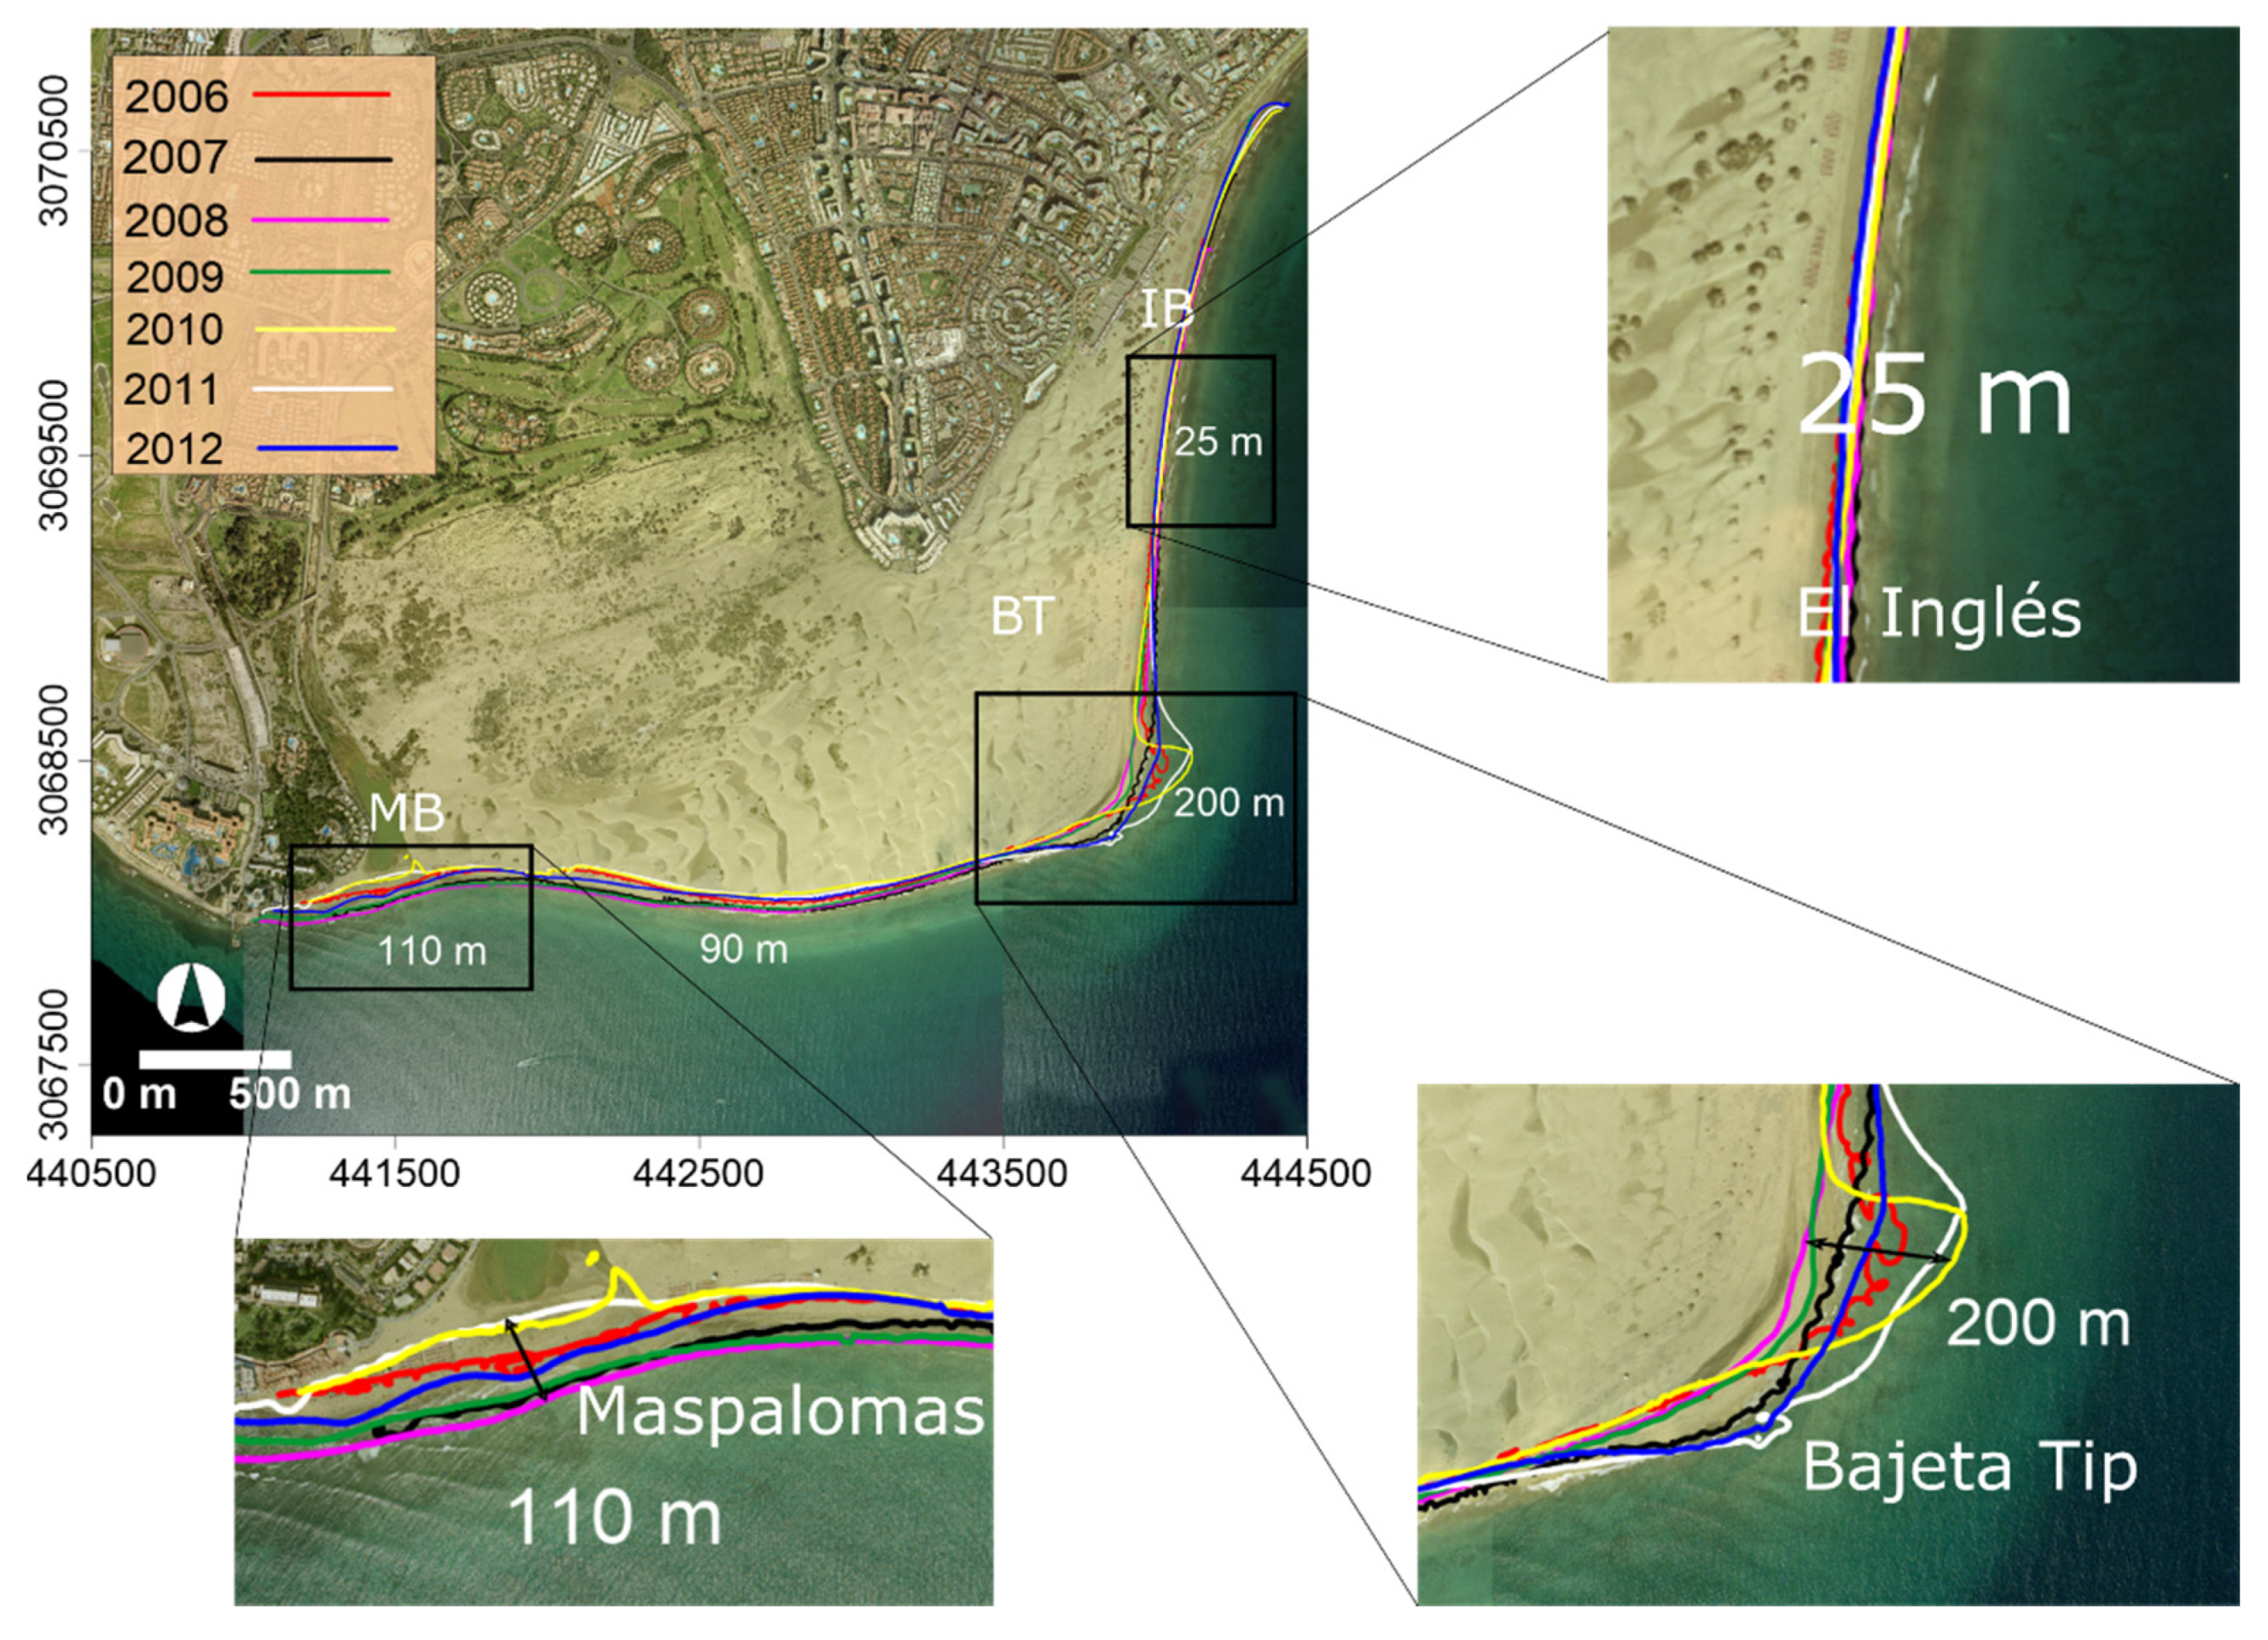
Multiannual shoreline analysis (
Figure 6) indicated that the coastline of the Maspalomas cuspate foreland was highly dynamic, with different behaviour depending on the considered sector. The shoreline of MB had significant variation, whereas IB shoreline was quite stable. It was observed that MB shoreline retreated about 110 m in the central part of the beach due to extreme storm events in winter 2009/10 (
Figure 6). This erosion pattern coincided with a shoreline progradation of around 62.5 m at BT. After 2009/10 autumn-winter period, considering that in the following periods the energy coming from the NE predominates, the MB shoreline gradually advanced till reaching its pre-storm morphological position on March 2012, last measurement available in this study (March 2012). Low sediment availability at the western and southern sectors of the foreland suggest that MB was particularly vulnerable to SW storms.
At IB, shoreline position was stable, with a null seasonal sedimentary trend (−4 to +3 m). In the spring-summer, when trade winds blow and NE storms were dominant, predominated accretion characterized the beach profiles, except for P6 located on BT. On the other hand, in autumn-winter periods, morphological responses were influenced by the occurrence of SW storms. Thus, a coastline retreat was registered on the profiles P1–P4, whereas shoreline advanced in P6 by a magnitude that was directly related to the energy of SW storms. Finally, annual shoreline variations at IB were very low over the year, with a null seasonal sedimentary trend (−4 to +3 m) (
Figure 7).
Profiles P1 and P2 on MB exhibited the highest variability of the whole cuspate foreland, with retreat values reaching up to 34 m per month, while P3 and P4 retreat were around 20 m. At BT, the profile P6 showed the highest seasonal progradation (up to 21 m). At IB, the range of progradation/retreat values at profiles between P7 and P10 was less than 5 m over the season, in agreement with the minor shoreline changes already observed from annual shoreline analysis.
4.5. Beach Erosion and Recovery Periods
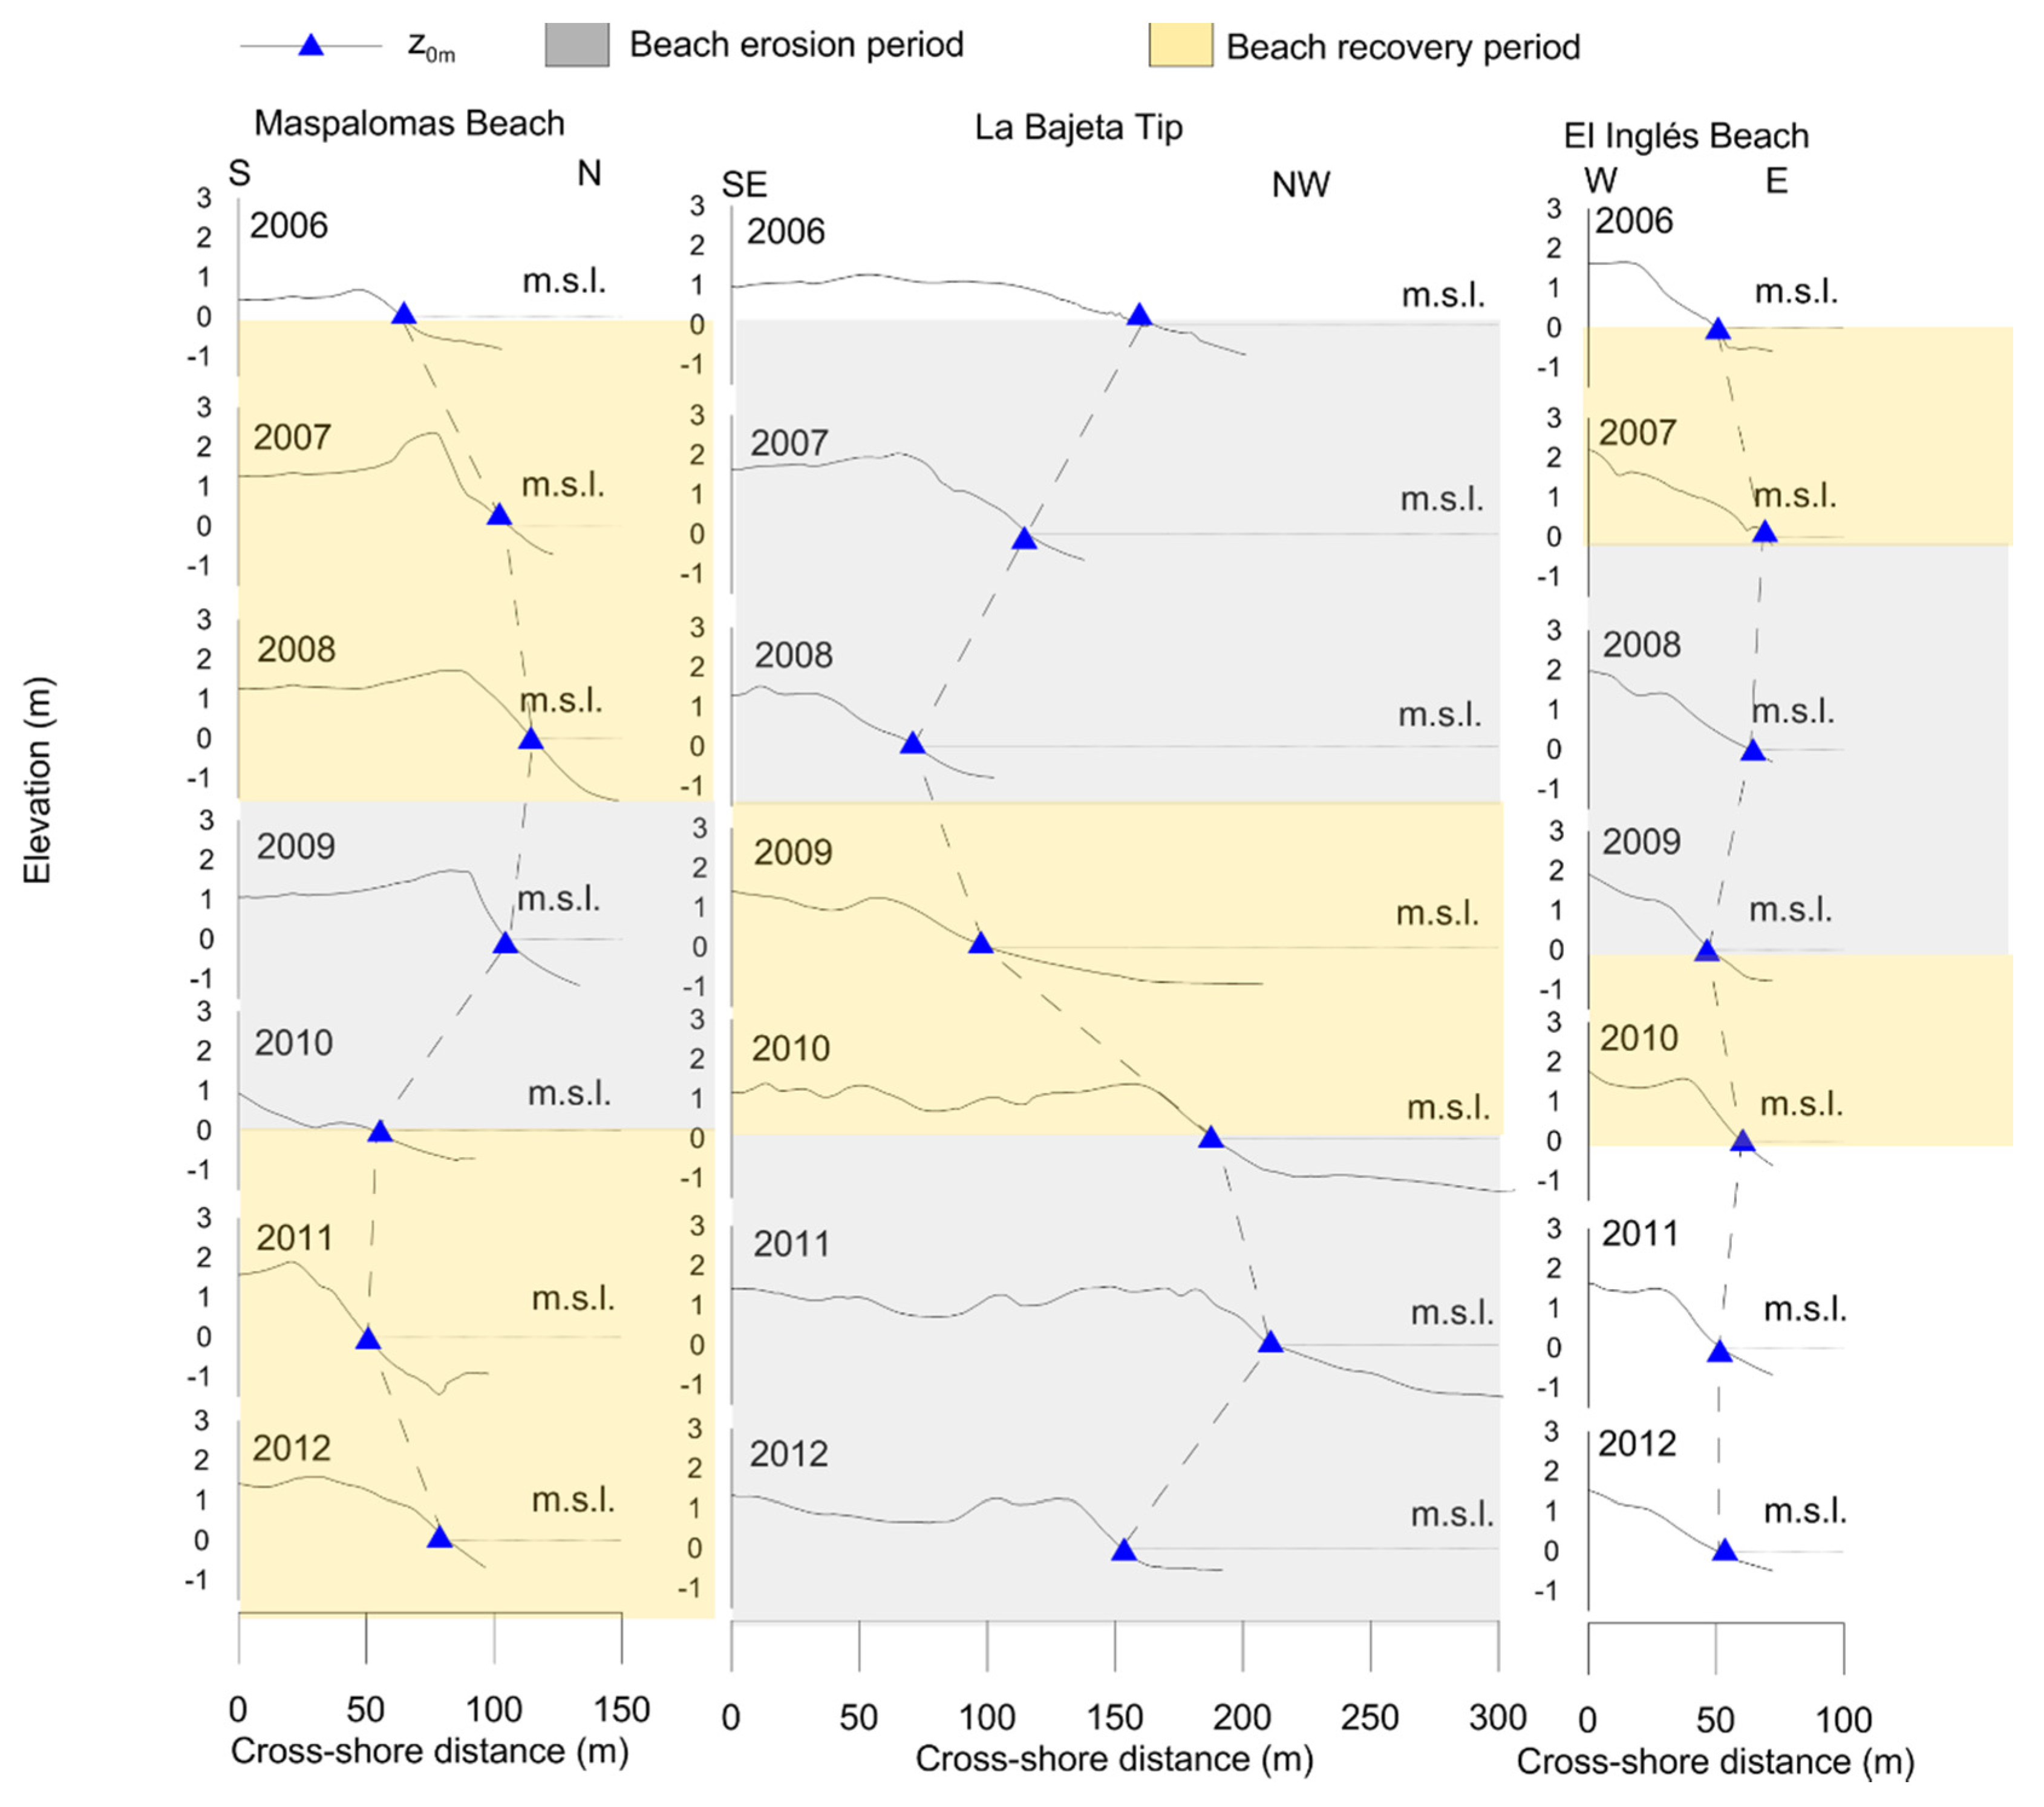
The morphological evolution of representative cross-shore profiles from each sector of the foreland (P1, P6 and P8) over the study period are shown in
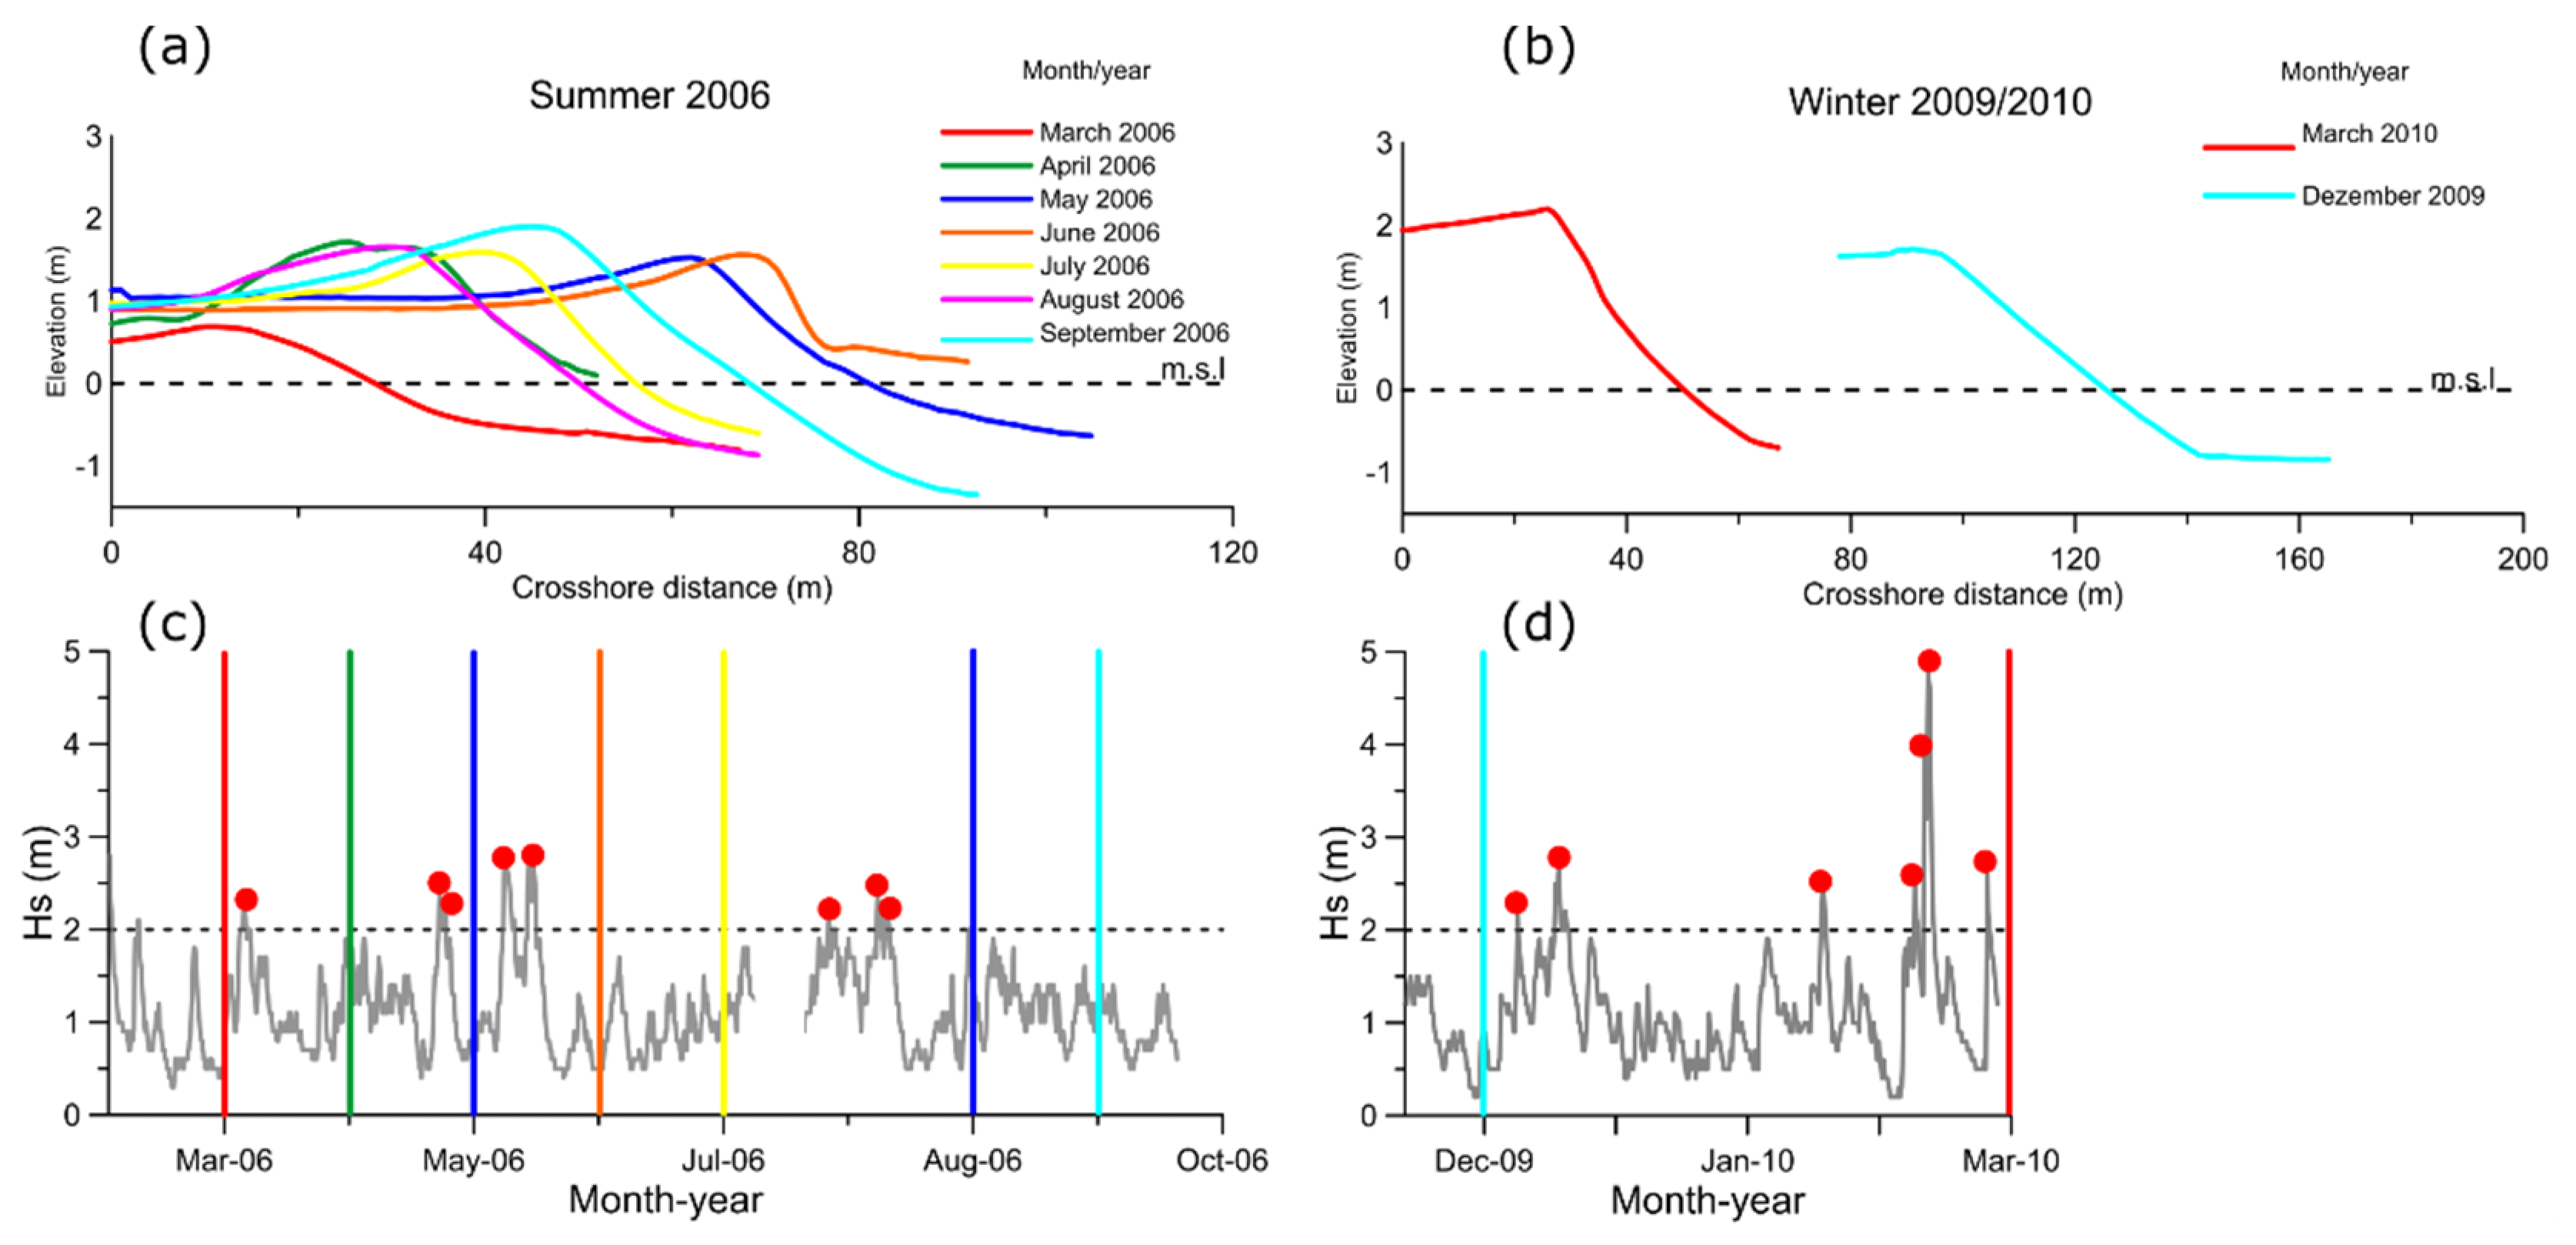
Figure 8. Regarding single beach profile, extreme events from SW determined the most significant changes on shape. In general, the eroded profile became smoother with lower berm crest and shorter beach width. During recovery periods, the beach face enlarged seaward both vertically and horizontally due to the increase of sand volume, restoring the beach berm elevation and increasing the slope of the beach face. For instance, the beach slope of MB ranged from 0.02 during erosive state (March 2006), to 0.1 at the end of recovery process (September 2006). For the same periods, beach slope at BT and IB ranged from 0.015 to 0.05 and from 0.05 to 0.08, respectively (
Figure 8).
During recovery periods, MB had a wider beach, with accretion mostly located on the upper part of the beach. This dynamic corresponded to landward displacement of the MSL line at BT. In general, the recovery process at MB occurred during spring-summer under the influence of high-energy events from NE (
Figure 9).
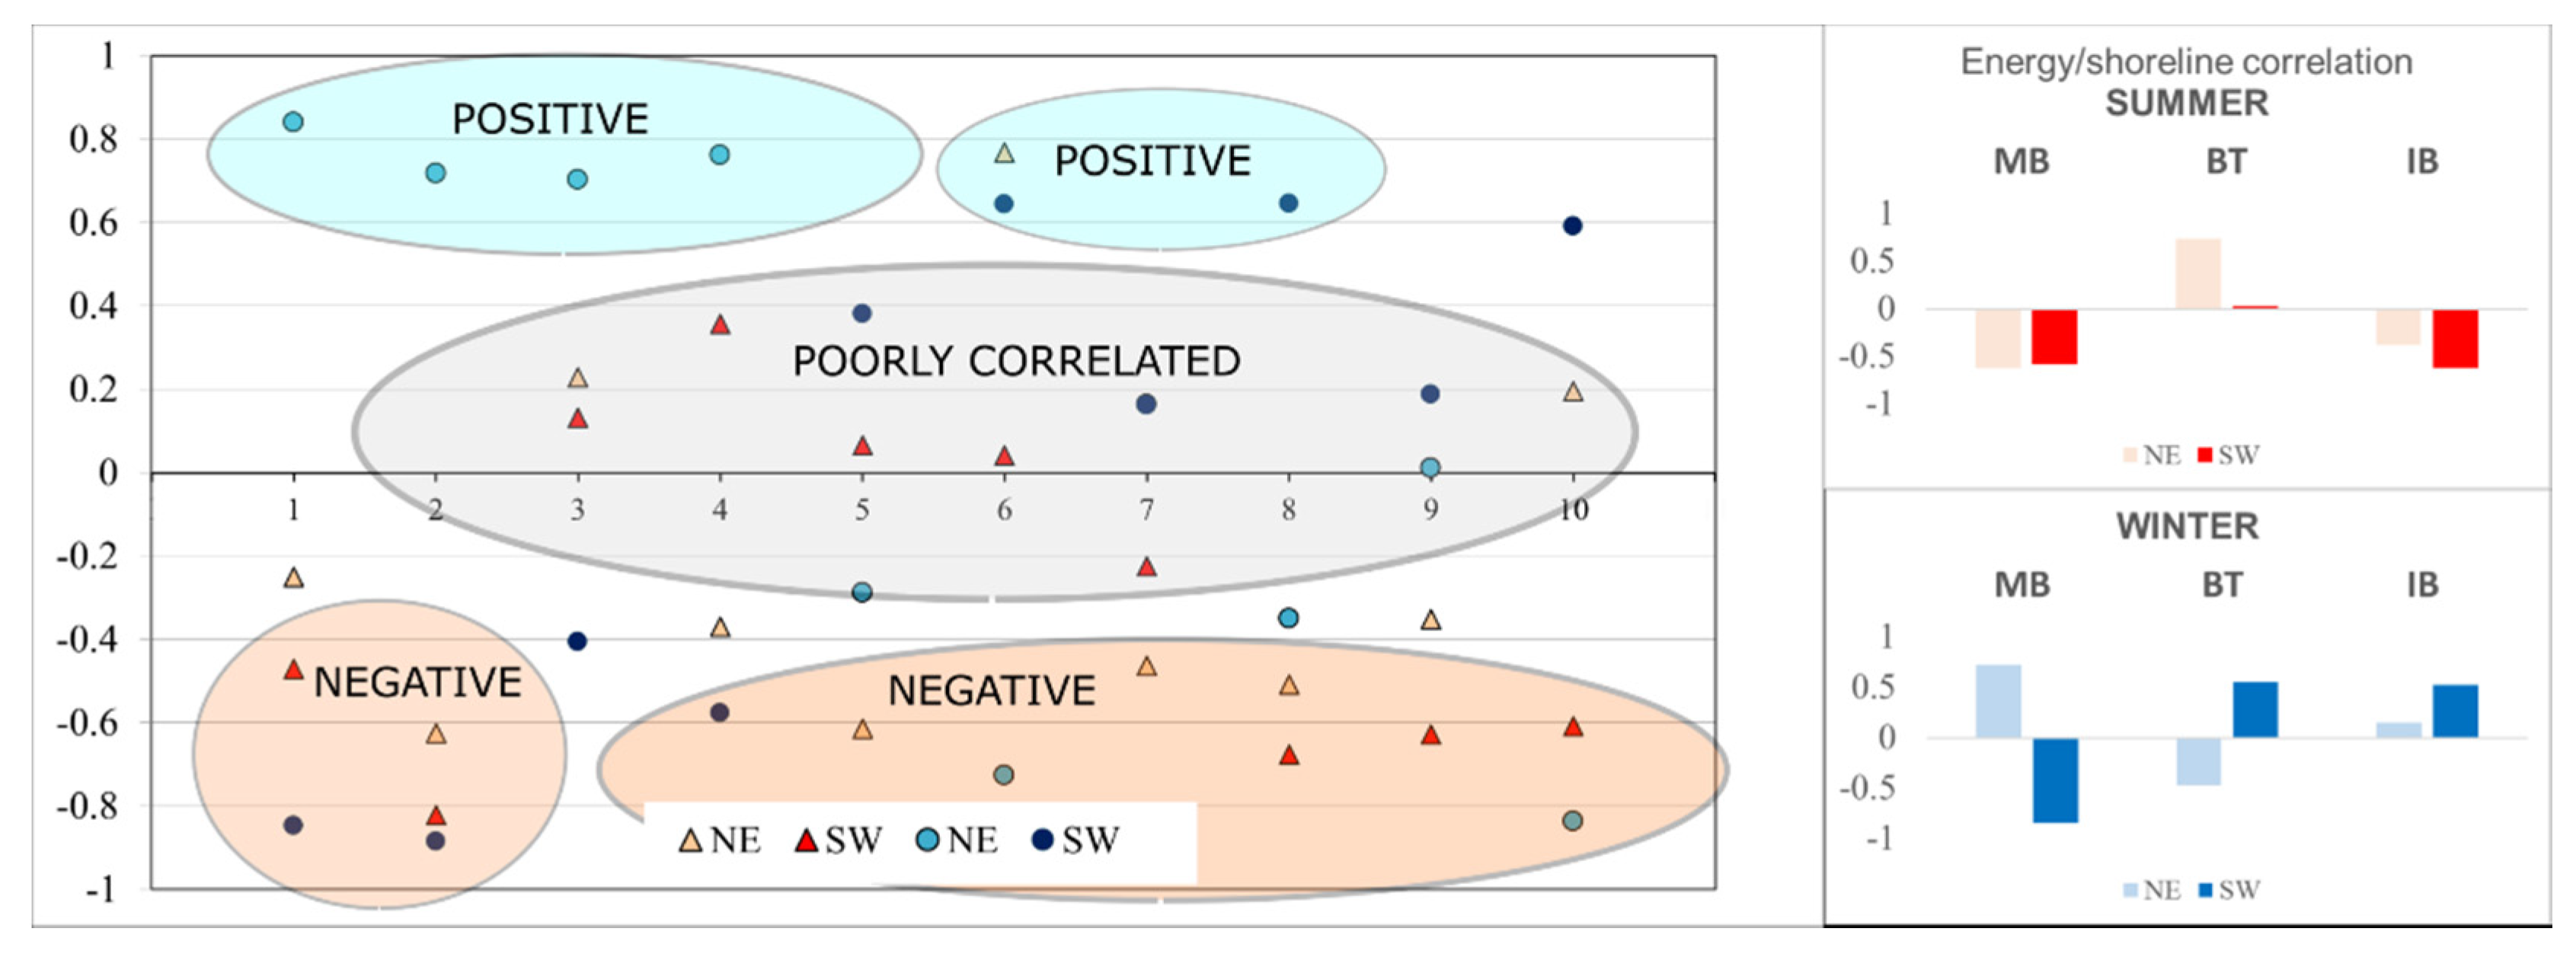
4.6. Correlation between Shoreline Migration and Wave Energy
The relation between storm parameters and rates of shoreline change was assessed by means of the Pearson correlation coefficient, which indicates the extent to which two variables are linearly related. Pearson correlation varies between ‒1 and 1, where highest positive value expresses that two variables are positively linearly related [
45].
When coupling storm wave approach direction to shoreline changes, different relationships can be observed depending on the beach sectors considered (
Figure 10). In general, correlation was found between the erosive processes (retreat of the shoreline) and the increase in the wave energy. The shoreline advances on MB sector (P1 to P4), and BT (P6) are correlated with NE storms, while advances at IB (P8–P10) with SW storms.
Wave energy increase promoted by SW storms during trade winds is related to shoreline retreat, especially in MB profiles (P1, P2 and P4). Here, an increase of wave energy, due to both SW storms during winters and NE storms during trade winds, also induced shoreline retreat (P2). Negative correlations are also observed in BT for NE storms during winters (P6) and for SW storms, as well as in IB for SW storms during trade winds (P8 to P10). The profile P10 of IB is also highly negative correlated with NE storms during trade winds. Pearson´s coefficients indicate that beach response is linear correlated to the wave climate in the western sector of MB (P1 and P2) and BT (P6).
5. Discussion
Wave seasonal characterization showed that SSW-WSW storm events occurring during autumn-winter, despite their rare occurrence, resulted in drastic sediment losses at Maspalomas cuspate foreland. Winter’s storms induced shoreline retreatment while summer conditions with energetic NE waves progressively rebuilding following the impact of storms at MB. Recovery analysis demonstrated how both longshore and cross-shore transport processes contribute. Trade wind season generally produces sediment accumulation, with progradation of the coastline, except on BT, in which high-energy periods of the NE determines shoreline retreat and induces alongshore transport alongshore towards the sectors of MB and BT.
Major seasonal variations occurred in the sectors of MB and BT, where values of the Shoreline Change Envelope (SCE) reached 110 and 200 m respectively. Similarly, BT showed higher seasonal recovery rates in comparison with MB and IB (up to 62, 43 and 24 m respectively). The shoreline changes observed over the monitored period was of the same magnitude of the variation found by previous studies [
28,
31]. Comparing shoreline recovery rates for other mesotidal high-energy beaches, we found seasonal rates from 11 to 29 m for seasonal (6 months) e.g., in Oregon [
46], or faster recovery rates 10–15 m/month [
47,
48]. On the other hand, some studies have also observed rapid subaerial recovery immediately following storms (e.g., [
49,
50,
51]).
Morphodynamic response to storm of Maspalomas cuspate foreland is very different than on other systems in Western Europe coastlines, where most of the energy held during winter periods and inverse relationship between wave energy and shoreline is more common [
13,
52,
53]. In Maspalomas, the coastline orientation, aridity, and the consequent lower vegetation growth together with the existence of constant and intense winds ensure the characteristics of their geomorphological processes, similarly to other coastal dune fields of Canary Islands [
29,
33].
Future works at Maspalomas cuspate foreland should combine synoptic measurements of eolian processes, subtidal bathymetry variation and subaerial beach surveys, in order to fully understand the sediment exchange between beach-dune system and nearshore sea bottom.
During the analysed period (2006–2012), we have verified that most damaging storms occurred in winter 2009/10, which corresponded to a negative North Atlantic Oscillation index (NAO, based on the surface sea-level pressure difference between the Subtropical High and the Subpolar Low). In February 2010, when a total of four SW energy storms occurred, the NAO index was negative (NAO Index winter 2009/2010= −2.54 and NAO Index February 2010= −2.69). Based on these observations, further studies could investigate to what extent climate index variability [
54] could help in predicting morphodynamic response and erosive-recovery cycle in Maspalomas cuspate foreland.
6. Conclusions
This study showed the morphodynamic analysis of a cuspate foreland (Maspalomas) over a period of six years. The data collected by the first multiannual seasonal monitoring program ever performed at Maspalomas were coupled to offshore and alongshore hydrodynamics to describe the influence of wave forcing on morphological changes. Particular emphasis was given to the role played by wave storms characteristics and occurrence in sediment transport processes.
Three beaches of Maspalomas cuspate foreland, namely Maspalomas Beach (MB), El Inglés Beach (IB) and La Bajeta Tip (BT), were considered. Over the observed six years period, the shoreline showed a trend of dynamic equilibrium at IB and BT, whereas an erosional trend at MB. Erosion and recovery rates differed among MB, IB and BT beaches in dependence on the annual number of storms, storm energy and wave approach direction. It was found that high-energy waves induce longshore currents along the coast of the cuspate foreland, rapidly moving and redistributing beach sediment over the shoreline. During spring-summer, trade winds generate an elevated number of NE storms, which induce littoral drift from IB to MB, bypassing BT and determining advance of MB shoreline. It was also observed that, in case of intense NE storm events, the tip of the cuspate foreland (BT) can also be affected by erosion, increasing the volume of sediment migrating towards MB shoreline. Storm waves approaching from SW occurred merely during autumn-winter of 2009/10 and 2010/2011 over the six years. However, these events induced significant and rapid beach profile erosion and shoreline retreat at MB, determining the beach erosional trend over the monitored period. In fact, despite their rare occurrence, SW storm events were found to be crucial in the sediment balance at MB, where beach configuration did not recover over the summer-spring period. On the other hand, during SW events, BT shoreline advanced due to the littoral drift generated by high-energy waves.
The main results of this study suggest that storm waves characteristics are the most important factor controlling sand net losses and shoreline variation at a cuspate foreland at seasonal scales. The number and frequency of storms determines the extent of erosion and the time for post storm recovery at seasonal scale, with both longshore and cross-shore transport accounting in the processes. On annual scale, the evolution of cuspate foreland shoreline is mainly driven by longshore transport component induced by wave-generated currents, moving sediment from both sides of the cuspate foreland to the converging head. Highest rate of alongshore transport towards the head was registered on the side of the cuspate exposed to the predominant storm wave approach.
The findings of this study improve the understanding of the littoral sediment dynamics of Maspalomas cuspate foreland, setting the groundwork for a potential long-term morphodynamics evolution model and management. The approach and analysis outlined in this work offer scope for future research at cuspate forelands, underlying the importance of designing monitoring program capable of assessing seasonal behaviour and storm response of the littoral. Besides, it is found that a broad description of hydrodynamic components must be considered to yield insight of sediment transport patterns on these complex landforms.
Author Contributions
Conceptualization, A.F.-B.; methodology, A.F.-B. and J.A.-C.; software, A.F.-B. and J.A.-C.; validation, A.F.-B. and J.A.-C.; formal analysis, A.F.-B. and J.A.-C.; investigation, A.F.-B., J.A.-C., S.A., L.P., R.P.M. and P.B.; resources, A.F.-B. and J.A.-C.; data curation, A.F.-B. and J.A.-C.; writing—original draft preparation, A.F.-B.; writing—review and editing, A.F.-B., J.A.-C., S.A., P.B.; visualization, A.F.-B., J.A.-C. and S.A.; supervision, J.A.-C., P.A.S., L.P. and R.P.M.; project administration, A.F.-B. and J.A.-C.; funding acquisition, A.F.-B., J.A.-C., P.B. and P.A.S.
Funding
This study was done within the framework of the “Observatorio Dunas de Maspalomas” research project, funding through support by Cabildo Insular de Gran Canaria. This work was financially supported by the CESAM (UID/AMB/50017/2019) to FCT/MCTES through national funds. A.F.-B. is awarded a Post-Doc Fellowship (REF: ED481B2016/141-0) by Xunta de Galicia.
Acknowledgments
We thank Puertos del Estado for providing wave database. The authors wish to thank all the colleagues that collaborated during fieldwork. This manuscript benefited significantly from the comments of Umberto Andriolo and two anonymous reviewers.
Conflicts of Interest
The authors declare no conflict of interest.
References
- Craig-Smith, S.J. Cuspate forelands. In Encyclopedia of Earth Sciences Series; Springer: Berlin, Germany, 2005. [Google Scholar]
- McNinch, J.E.; Luettich, R.A. Physical processes around a cuspate foreland: Implications to the evolution and long-term maintenance of a cape-associated shoal. Cont. Shelf Res. 2000, 20, 2367–2389. [Google Scholar] [CrossRef]
- Russell, R.J.; Zenkovich, V.P.; Steers, J.A.; Fry, D.G. Processes of Coastal Development. Geogr. Rev. 1968, 58, 685. [Google Scholar] [CrossRef]
- Coakley, J.P. The Origin and Evolution of a Complex Cuspate Foreland: Pointe-aux-Pins, Lake Erie, Ontario. Géogr. Phys. Quat. 2012, 43, 65. [Google Scholar] [CrossRef][Green Version]
- Brown, J.M.; Phelps, J.J.C.; Barkwith, A.; Hurst, M.D.; Ellis, M.A.; Plater, A.J. The effectiveness of beach mega-nourishment, assessed over three management epochs. J. Environ. Manag. 2016, 184, 400–408. [Google Scholar] [CrossRef] [PubMed]
- Ferreira, Ó. The role of storm groups in the erosion of sandy coasts. Earth Surf. Process. Landf. 2006, 31, 1058–1060. [Google Scholar] [CrossRef]
- Callaghan, D.P.; Nielsen, P.; Short, A.; Ranasinghe, R. Statistical simulation of wave climate and extreme beach erosion. Coast. Eng. 2008, 55, 375–390. [Google Scholar] [CrossRef]
- Karunarathna, H.; Pender, D.; Ranasinghe, R.; Short, A.D.; Reeve, D.E. The effects of storm clustering on beach profile variability. Mar. Geol. 2014, 348, 103–112. [Google Scholar] [CrossRef]
- Dissanayake, P.; Brown, J.; Wisse, P.; Karunarathna, H. Effects of storm clustering on beach/dune evolution. Mar. Geol. 2015, 370, 63–75. [Google Scholar] [CrossRef]
- Dissanayake, P.; Brown, J.; Wisse, P.; Karunarathna, H. Comparison of storm cluster vs isolated event impacts on beach/dune morphodynamics. Estuar. Coast. Shelf Sci. 2015, 164, 301–312. [Google Scholar] [CrossRef]
- Vousdoukas, M.I.; Almeida, L.P.M.; Ferreira, Ó. Beach erosion and recovery during consecutive storms at a steep-sloping, meso-tidal beach. Earth Surf. Process. Landf. 2012, 37, 583–593. [Google Scholar] [CrossRef]
- Coco, G.; Senechal, N.; Rejas, A.; Bryan, K.R.; Capo, S.; Parisot, J.P.; Brown, J.A.; MacMahan, J.H.M. Beach response to a sequence of extreme storms. Geomorphology 2014, 204, 493–501. [Google Scholar] [CrossRef]
- Corbella, S.; Stretch, D.D. Shoreline recovery from storms on the east coast of Southern Africa. Nat. Hazards Earth Syst. Sci. 2012, 12, 11–22. [Google Scholar] [CrossRef]
- Angnuureng, D.B.; Almar, R.; Senechal, N.; Castelle, B.; Addo, K.A.; Marieu, V.; Ranasinghe, R. Shoreline resilience to individual storms and storm clusters on a meso-macrotidal barred beach. Geomorphology 2017, 290, 265–276. [Google Scholar] [CrossRef]
- Almeida, L.P.; Vousdoukas, M.V.; Ferreira, Ó.; Rodrigues, B.A.; Matias, A. Thresholds for storm impacts on an exposed sandy coastal area in southern Portugal. Geomorphology 2012, 143–144, 3–12. [Google Scholar] [CrossRef]
- Roberts, T.M.; Wang, P.; Puleo, J.A. Storm-driven cyclic beach morphodynamics of a mixed sand and gravel beach along the Mid-Atlantic Coast, USA. Mar. Geol. 2013, 346, 403–421. [Google Scholar] [CrossRef]
- Sénéchal, N.; Gouriou, T.; Castelle, B.; Parisot, J.P.; Capo, S.; Bujan, S.; Howa, H. Morphodynamic response of a meso- to macro-tidal intermediate beach based on a long-term data set. Geomorphology 2009, 107, 263–274. [Google Scholar] [CrossRef]
- Masselink, G.; Scott, T.; Poate, T.; Russell, P.; Davidson, M.; Conley, D. The extreme 2013/2014 winter storms: Hydrodynamic forcing and coastal response along the southwest coast of England. Earth Surf. Process. Landf. 2016, 41, 378–391. [Google Scholar] [CrossRef]
- Scott, T.; Masselink, G.; O’Hare, T.; Saulter, A.; Poate, T.; Russell, P.; Davidson, M.; Conley, D. The extreme 2013/2014 winter storms: Beach recovery along the southwest coast of England. Mar. Geol. 2016, 382, 224–241. [Google Scholar] [CrossRef]
- Baptista, P.; Coelho, C.; Pereira, C.; Bernardes, C.; Veloso-Gomes, F. Beach morphology and shoreline evolution: Monitoring and modelling medium-term responses (Portuguese NW coast study site). Coast. Eng. 2014, 84, 23–37. [Google Scholar] [CrossRef]
- Clemmensen, L.B.; Bendixen, M.; Nielsen, L.; Jensen, S.; Schrøder, L. Coastal evolution of a cuspate foreland (Flakket, Anholt, Denmark) between 2006 and 2010. Bull. Geol. Soc. Denmark 2011, 59, 37–41. [Google Scholar]
- Burningham, H.; French, J.R. Travelling forelands: Complexities in drift and migration patterns. J. Coast. Res. 2014, 70, 102–108. [Google Scholar] [CrossRef]
- Hesp, P.A.; Ruz, M.H.; Hequette, A.; Marin, D.; Miot da Silva, G. Geomorphology and dynamics of a traveling cuspate foreland, Authie estuary, France. Geomorphology 2016, 254, 104–120. [Google Scholar] [CrossRef]
- Xhardé, R.; Long, B.F.; Forbes, D.L. Short-Term Beach and Shoreface Evolution on a Cuspate Foreland Observed with Airborne Topographic and Bathymetric LIDAR. J. Coast. Res. 2011, 62, 50–61. [Google Scholar] [CrossRef]
- Alonso; Alcántara-Carrió, J.; Cabrera, L. Tourist Resorts and their Impact on Beach Erosion at Sotavento Beaches, Fuerteventura, Spain. J. Coast. Res. 2002, 36, 1–7. [Google Scholar] [CrossRef]
- Alonso, I.; Sanchez, I.; Cabrera, L.; Benavides, A.; Alcantara-Carrio, J.; Usera, J. Decadal evolution of a coastal dune field and adjacent beaches at North of Fuerteventura (Canary Islands, Spain). J. Coast. Res. 2006, 39, 198–203. [Google Scholar]
- Hernández, L.; Alonso, I.; Sánchez-Pérez, I.; Alcántara-Carrió, J.; Montesdeoca, I. Shortage of Sediments in the Maspalomas Dune Field (Gran Canaria, Canary Islands) Deduced from Analysis of Aerial Photographs, Foraminiferal Content, and Sediment Transport Trends. J. Coast. Res. 2007, 234, 993–999. [Google Scholar] [CrossRef]
- Hernández, L.; Alonso, I.; Ruiz, P.; Pérez-Chacón, E.; Suárez, C.; Alcántara-Carrió, J. Decadal Environmental Changes on the Dune Field of Maspalomas (Canary Islands): Evidences of an Erosive Tendency. Litoral 2002 Chang. Coast EUROCOAST/EUCC 2002, 293–297. [Google Scholar]
- García-Romero, L.; Hernández-Cordero, A.I.; Fernández-Cabrera, E.; Peña-Alonso, C.; Hernández-Calvento, L.; Pérez-Chacón, E. Urban-touristic impacts on the aeolian sedimentary systems of the Canary Islands: Conflict between development and conservation. Island Stud. J. 2016, 11, 91–112. [Google Scholar]
- Vallejo, I.; Hernández Calvento, L.; Ojeda, J.; Mayer, P.; Gómez Molina, A. Caracterización morfométrica y balance sedimentario en el sistema de dunas de Maspalomas (Gran Canaria) a partir de datos LIDAR. Rev. Soc. Geol. Esp. 2009, 22, 57–65. [Google Scholar]
- Hernández-Cordero, A.I.; Hernández-Calvento, L.; Espino, E.P.C. Vegetation changes as an indicator of impact from tourist development in an arid transgressive coastal dune field. Land Use Policy 2017, 64, 479–491. [Google Scholar] [CrossRef]
- Smith, A.B.; Jackson, D.W.T.; Cooper, J.A.G.; Hernández-Calvento, L. Quantifying the role of urbanization on airflow perturbations and dunefield evolution. Earths Future 2017, 5, 520–539. [Google Scholar] [CrossRef]
- Fontán, A.; Alcántara-Carrió, J.; Correa, I.D. Combined beach - inner shelf erosion in short and medium term (Maspalomas, Canary Islands). Geol. Acta 2012, 10, 411–426. [Google Scholar]
- Alonso, I.; Montesdeoca, I.; Vivares, A.; Alcántara-Carrió, J. Aproximación a la modelización de la dinámica litoral de las playas de El Inglés y Maspalomas (Gran Canaria). Vector Plus 2001, 18, 17–27. [Google Scholar]
- Alcántara-Carrió, J.; Fontán, A. Factors controlling the morphodynamics and geomorphologic evolution of a cuspate foreland in a volcanic intraplate Island (Maspalomas, Canary Islands). J. Coast. Res. 2009, 56, 683–687. [Google Scholar]
- Fontán Bouzas, A.; Alcántara-Carrió, J.; Montoya Montes, I.; Barranco Ojeda, A.; Albarracín, S.; Rey Díaz de Rada, J.; Rey Salgado, J. Distribution and thickness of sedimentary facies in the coastal dune, beach and nearshore sedimentary system at Maspalomas, Canary Islands. Geo Mar. Lett. 2013, 33, 117–127. [Google Scholar] [CrossRef]
- Azorin-Molina, C.; Menendez, M.; McVicar, T.R.; Acevedo, A.; Vicente-Serrano, S.M.; Cuevas, E.; Minola, L.; Chen, D. Wind speed variability over the Canary Islands, 1948–2014: Focusing on trend differences at the land–ocean interface and below–above the trade-wind inversion layer. Clim. Dyn. 2018, 50, 4061–4081. [Google Scholar] [CrossRef]
- Sanjaume Saumell, E.; Gracia Prieto, F.J. Las Dunas en España; Sociedad Española de Geomorfología: Zaragoza, Spain, 2011; ISBN 9788461537808. [Google Scholar]
- Máyer Suárez, P.; Pérez-Chacón Espino, E.; Cruz Avero, N.; Hernández-Calvento, L. Características del viento en el campo de dunas de Maspalomas (Gran Canaria, islas canarias, España). Nimbus Rev. Climatol. Meteorol. Y Paisaje 2012, 30, 381–397. [Google Scholar]
- Yanes, A.; Marzol, M.V.; Romero, C. Characterization of sea storms along the coast of Tenerife, the Canary Islands. J. Coast. Res. 2006, 48, 124–128. [Google Scholar]
- Dolan, R.; Davis, R. Coastal Storm Hazards. J. Coast. Res. 1994, SI 12, 103–114. [Google Scholar]
- Mendoza, E.T.; Jimenez, J.A.; Mateo, J. A coastal storms intensity scale for the Catalan sea (NW Mediterranean). Nat. Hazards Earth Syst. Sci. 2011, 11, 2453–2462. [Google Scholar] [CrossRef]
- González, M.; Medina, R.; Gonzalez-Ondina, J.; Osorio, A.; Méndez, F.J.; García, E. An integrated coastal modeling system for analyzing beach processes and beach restoration projects, SMC. Comput. Geosci. 2007, 33, 916–931. [Google Scholar] [CrossRef]
- Wheaton, J.M.; Brasington, J.; Darby, S.E.; Sear, D.A. Accounting for uncertainty in DEMs from repeat topographic surveys: Improved sediment budgets. Earth Surf. Process. Landf. 2010, 35, 136–156. [Google Scholar] [CrossRef]
- Lury, D.A.; Fisher, R.A. Statistical Methods for Research Workers. Statistician 1972, 21, 229. [Google Scholar] [CrossRef]
- Ruggiero, P.; Kaminsky, G.M.; Gelfenbaum, G.; Voigt, B. Seasonal to Interannual Morphodynamics along a High-Energy Dissipative Littoral Cell. J. Coast. Res. 2005, 213, 553–578. [Google Scholar] [CrossRef]
- Senechal, N.; Coco, G.; Castelle, B.; Marieu, V. Storm impact on the seasonal shoreline dynamics of a meso- to macrotidal open sandy beach (Biscarrosse, France). Geomorphology 2015, 228, 448–461. [Google Scholar] [CrossRef]
- Phillips, M.S.; Harley, M.D.; Turner, I.L.; Splinter, K.D.; Cox, R.J. Shoreline recovery on wave-dominated sandy coastlines: The role of sandbar morphodynamics and nearshore wave parameters. Mar. Geol. 2017, 385, 146–159. [Google Scholar] [CrossRef]
- Birmemeier, W.A. The effects of the 19 December 1977 coastal storm on beaches in North Carolina and New Jersey. Shore Beach 1979, 47, 7–15. [Google Scholar]
- Kriebel, D.L. Beach Recovery Following Hurricane Elena. Coast. Sediments 1987, 1, 990–1005. [Google Scholar]
- List, J.H.; Farris, A.S.; Sullivan, C. Reversing storm hotspots on sandy beaches: Spatial and temporal characteristics. Mar. Geol. 2006, 226, 261–279. [Google Scholar] [CrossRef]
- Garnier, E.; Ciavola, P.; Spencer, T.; Ferreira, O.; Armaroli, C.; McIvor, A. Historical analysis of storm events: Case studies in France, England, Portugal and Italy. Coast. Eng. 2018, 134, 10–23. [Google Scholar] [CrossRef]
- Davidson, M.A.; Turner, I.L.; Splinter, K.D.; Harley, M.D. Annual prediction of shoreline erosion and subsequent recovery. Coast. Eng. 2017, 130, 14–25. [Google Scholar] [CrossRef]
- Castelle, B.; Dodet, G.; Masselink, G.; Scott, T. A new climate index controlling winter wave activity along the Atlantic coast of Europe: The West Europe Pressure Anomaly. Geophys. Res. Lett. 2017, 44, 1384–1392. [Google Scholar] [CrossRef]
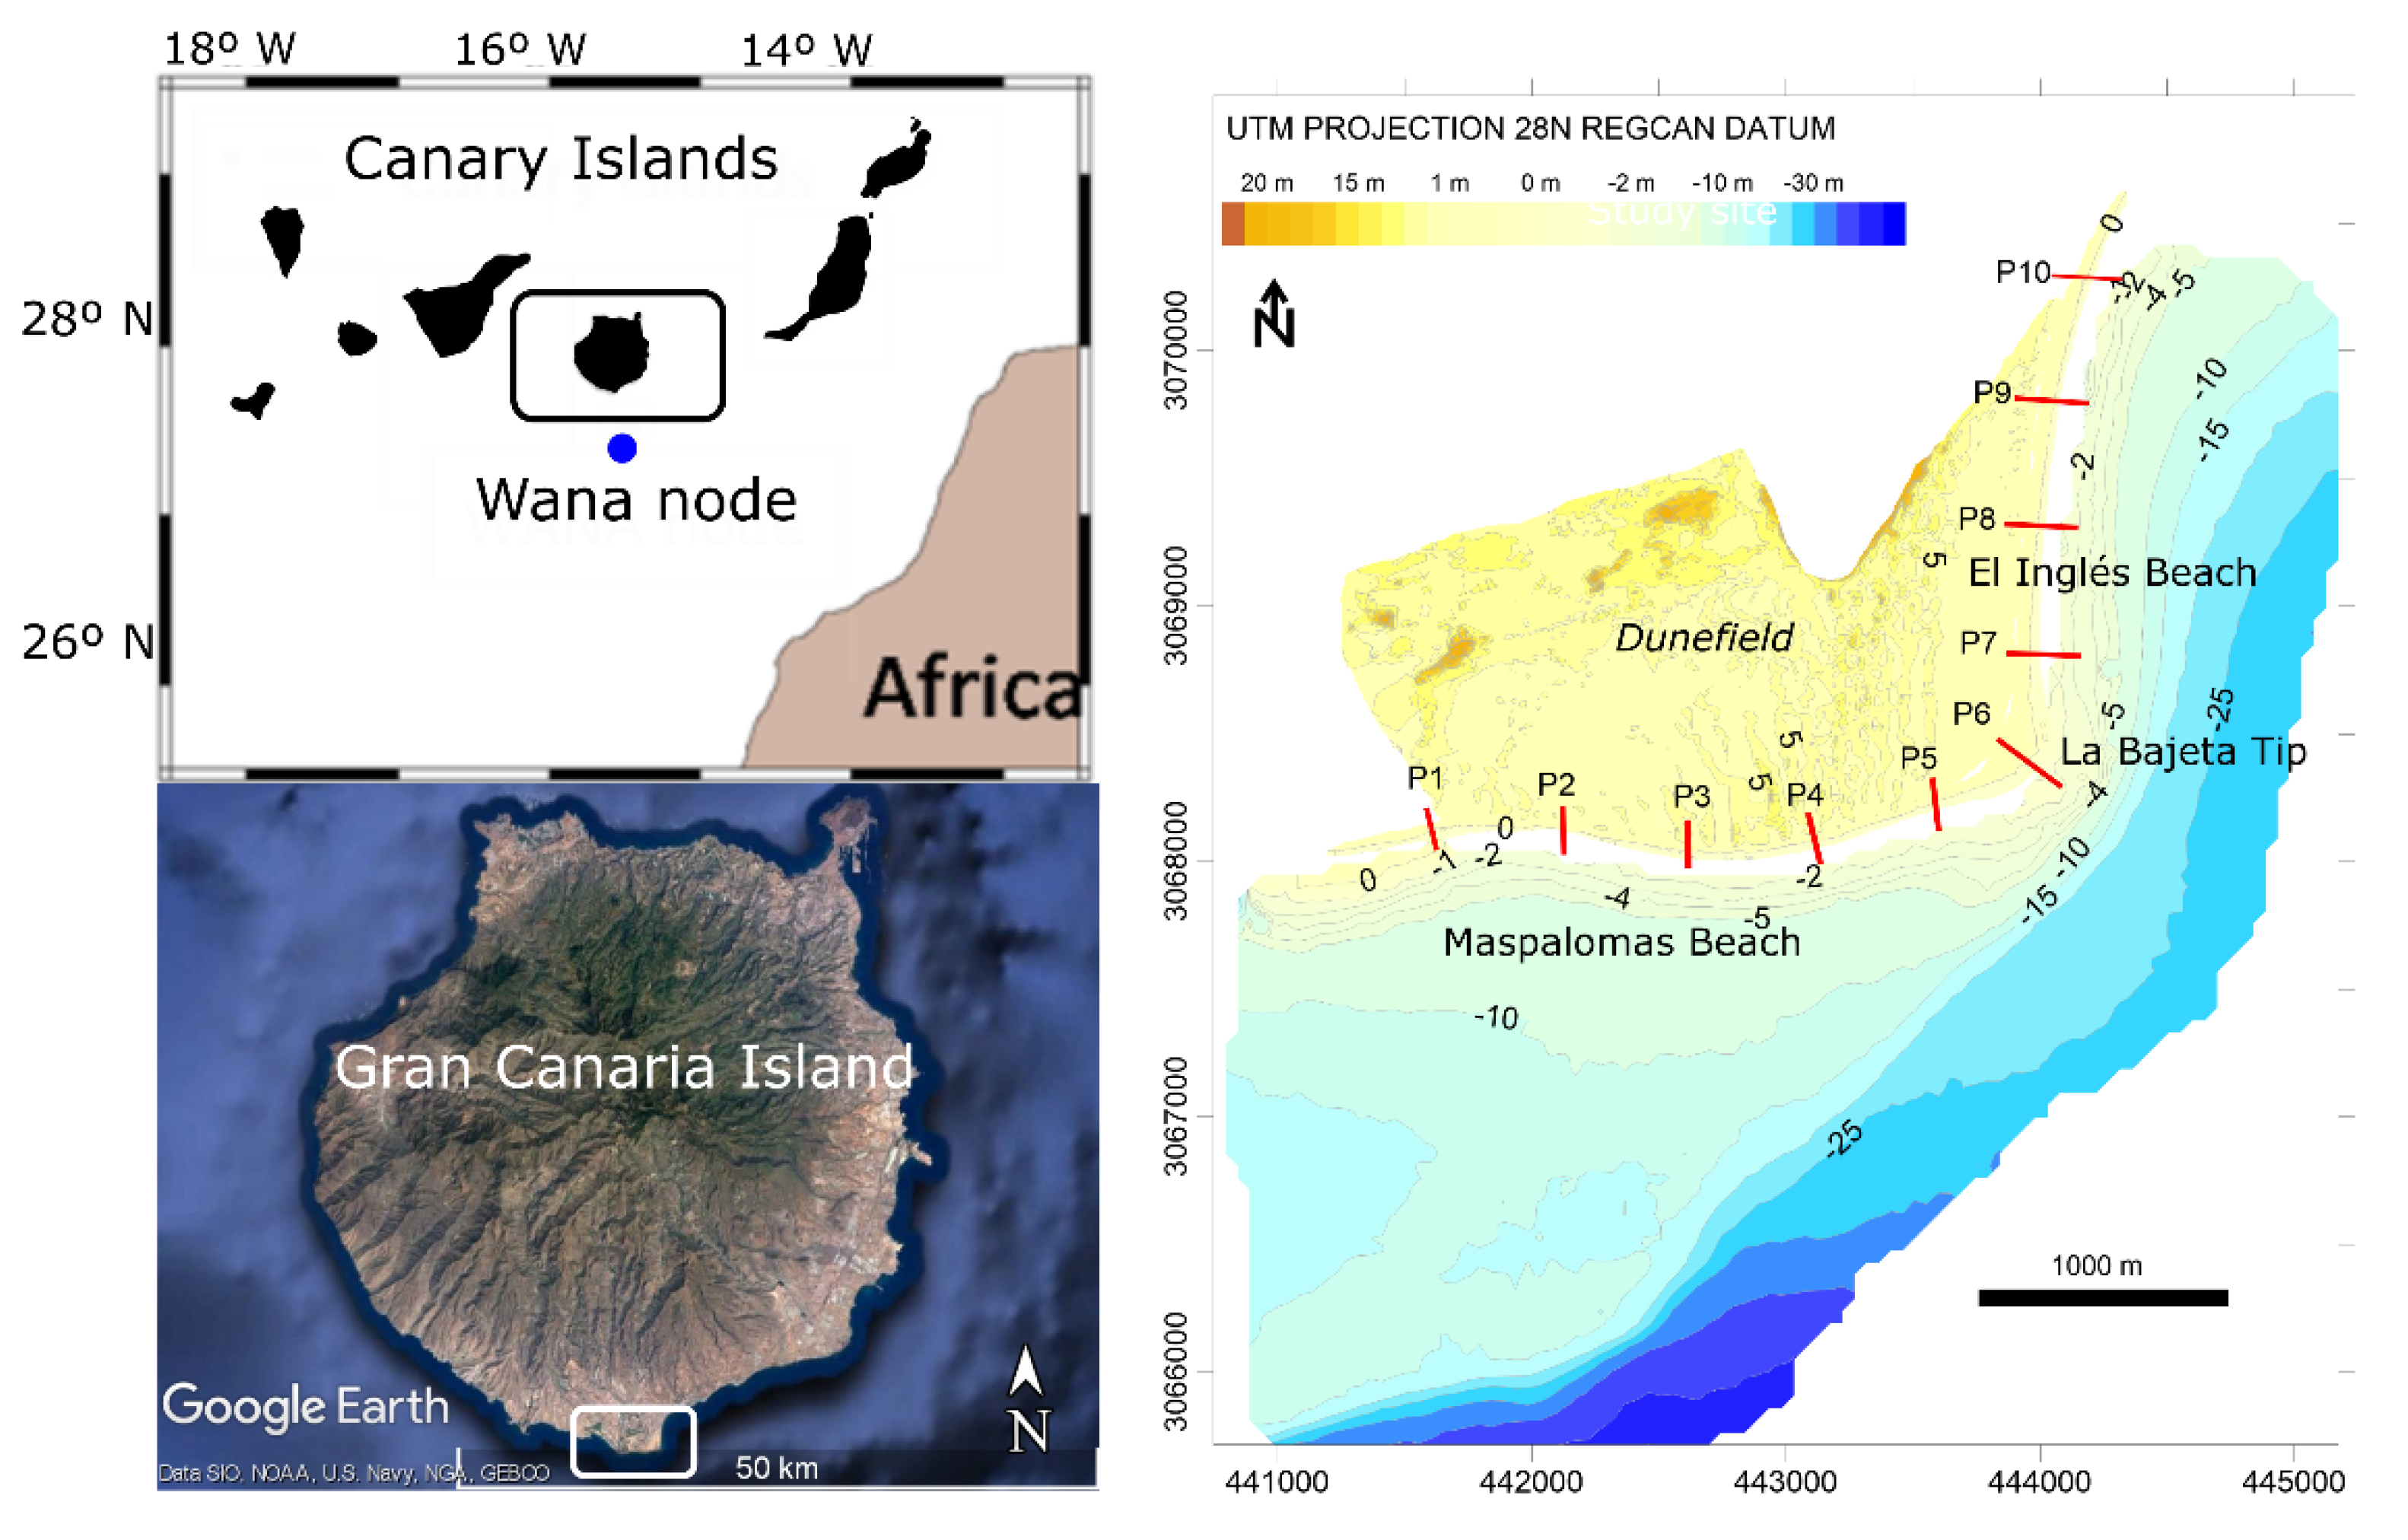
Figure 1.
Location of study site. Canary Islands archipelago and Gran Canaria Island (
upper left). Maspalomas cuspate foreland in the south of Gran Canaria Island (
lower left). Beaches location and topo-bathymetric map (
right) with cross-shore profiles (red lines) considered for the analysis (adapted from [
36], 2013).
Figure 2.
Beach and dunes erosion due to high-energy storm waves of Winter 2009/10. (a), dune avalanching (b), eroded dune front (c) Pre-storm beach (October 2009) and (d) Post-storm beach showing shoreline retreat after 17th February 2010.
Figure 2.
Beach and dunes erosion due to high-energy storm waves of Winter 2009/10. (a), dune avalanching (b), eroded dune front (c) Pre-storm beach (October 2009) and (d) Post-storm beach showing shoreline retreat after 17th February 2010.
Figure 3.
Characterization of the wave data series (2006-2012). The bar graphs represent respectively, monthly-averaged wave conditions (Hs and Tp) and storm occurrence. Wave roses show mean annual (upper), summer (lower left) and winter (lower right) wave regimes.
Figure 3.
Characterization of the wave data series (2006-2012). The bar graphs represent respectively, monthly-averaged wave conditions (Hs and Tp) and storm occurrence. Wave roses show mean annual (upper), summer (lower left) and winter (lower right) wave regimes.
Figure 4.
Wave forcing and wave-induced currents on Maspalomas foreland from SMC model. Wave height (a) and wave-induced currents (b) for NE storm waves of Hs of 2.25 m and Tp of 8 s. Wave height (c) and wave-induced currents (d) for SW storm waves of Hs of 2.25 m and Tp of 9 s.
Figure 4.
Wave forcing and wave-induced currents on Maspalomas foreland from SMC model. Wave height (a) and wave-induced currents (b) for NE storm waves of Hs of 2.25 m and Tp of 8 s. Wave height (c) and wave-induced currents (d) for SW storm waves of Hs of 2.25 m and Tp of 9 s.
Figure 5.
Morphodynamic changes of Maspalomas foreland from DEM comparison for the periods 2006–2009 (top) and 2009–2012 (bottom). Topographic changes are characterized by twelve maps, six map for each three-years interval.
Figure 5.
Morphodynamic changes of Maspalomas foreland from DEM comparison for the periods 2006–2009 (top) and 2009–2012 (bottom). Topographic changes are characterized by twelve maps, six map for each three-years interval.
Figure 6.
Multi-annual shoreline positions (2006–2012). Maspalomas, La Bajeta Tip and El Inglés sectors are magnified to show the magnitude of the maximum Shoreline Change Envelope (SCE).
Figure 6.
Multi-annual shoreline positions (2006–2012). Maspalomas, La Bajeta Tip and El Inglés sectors are magnified to show the magnitude of the maximum Shoreline Change Envelope (SCE).
Figure 7.
Profile location (top) and seasonal shoreline migration deduced from cross-shore profiles 1 to 10 (bottom), P1–P4 correspond to MB, P5–P7 to BT and P8–P10 to IB. Positive values for seaward migration (shoreline advance) and negative values for landward migration (shoreline retreat).
Figure 7.
Profile location (top) and seasonal shoreline migration deduced from cross-shore profiles 1 to 10 (bottom), P1–P4 correspond to MB, P5–P7 to BT and P8–P10 to IB. Positive values for seaward migration (shoreline advance) and negative values for landward migration (shoreline retreat).
Figure 8.
Beach erosion and recovery in Maspalomas Beach (Profile 1), La Bajeta Tip (Profile 6) and El Inglés Beach (Profile 8).
Figure 8.
Beach erosion and recovery in Maspalomas Beach (Profile 1), La Bajeta Tip (Profile 6) and El Inglés Beach (Profile 8).
Figure 9.
Evolution of Maspalomas Beach profile during erosion and recovery periods, March to September 2006 (a) and December 2009 to March 2010 (b). Significant wave height series March to September 2006 (c) and December 2009 to March 2010 (d) with storms highlighted in red dots and vertical lines in corresponding colours for each field survey.
Figure 10.
Linear correlation (Pearson’s coefficients) between shoreline variation and storm energy. Triangle and circles are the summer and winter periods, respectively (left). Energy and shoreline correlation (Pearson’s coefficients) for each beach and periods (right).
Figure 10.
Linear correlation (Pearson’s coefficients) between shoreline variation and storm energy. Triangle and circles are the summer and winter periods, respectively (left). Energy and shoreline correlation (Pearson’s coefficients) for each beach and periods (right).
Table 1.
Wave storms characterization, in terms of number of occurrences, Power Storm Index (PSI) and approach direction over the monitored period 2006/2012.
Table 1.
Wave storms characterization, in terms of number of occurrences, Power Storm Index (PSI) and approach direction over the monitored period 2006/2012.
| Years Interval | Season | Number of Storms | PSI Total | N. Storms
NNE to ENE/SSW to WSW/ESE | PSI
NNE to ENE/SSW to WSW/ESE |
|---|
| (2006–2007) | Spring - Summer | 7 | 1149 | 6/1/0 | 1007/142/0 |
| Autumn - Winter | 10 | 1448 | 9/0/1 | 1396/0/52 |
| (2007–2008) | Spring - Summer | 14 | 1904 | 14/0/0 | 0/0/0 |
| Autumn - Winter | 2 | 222 | 0/0/0 | 0/0/0 |
| (2008–2009) | Spring - Summer | 16 | 2536 | 14/1/1 | 2464/72/0 |
| Autumn - Winter | 4 | 408 | 4/0/0 | 408/0/0 |
| (2009–2010) | Spring – Summer | 15 | 2392 | 15/0/0 | 2392/0/0 |
| Autumn - Winter | 5 | 1021 | 0/5/0 | 0/1021/0 |
| (2010–2011) | Spring - Summer | 14 | 2164 | 14/0/0 | 2164/0/0 |
| Autumn - Winter | 9 | 1552 | 5/4/1 | 969/444/0 |
| (2011–2012) | Spring – Summer | 7 | 903 | 7/0/0 | 903/0/0 |
| Autumn - Winter | 9 | 1907 | 9/0/0 | 1907/0/0 |
| 2006/2012 | | 112 | 17607 | 97/11/2 | 13611/1679/52 |
© 2019 by the authors. Licensee MDPI, Basel, Switzerland. This article is an open access article distributed under the terms and conditions of the Creative Commons Attribution (CC BY) license (http://creativecommons.org/licenses/by/4.0/).

 ,
, 


