Article

Probabilistic Comparison of Static and Dynamic Failure Criteria of Scour Protections

1
Marine Energy Research Group, CIIMAR-Interdisciplinary Centre of Marine and Environmental Research, 4400-465 Porto, Portugal
2
Hydraulics, Water Resources and Environmental Division, Department of Civil Engineering, Faculty of Engineering of the University of Porto, 4400-465 Porto, Portugal
*
Author to whom correspondence should be addressed.
J. Mar. Sci. Eng. 2019, 7(11), 400; https://doi.org/10.3390/jmse7110400
Submission received: 10 September 2019 / Revised: 4 November 2019 / Accepted: 5 November 2019 / Published: 7 November 2019
(This article belongs to the Section Ocean Engineering)

Abstract

:
The present paper provides a reliability assessment of scour protections applicable to both the static and dynamic stability design. As a case study, Horns Rev 3 hindcast data is used to simulate different failure criteria for an exemplary scour protection suitable for an offshore monopile foundation. The results show that the probability of failure is influenced by several factors, namely the wave friction factor, the definition of the acceptable damage number or the formulations used to calculate the bed shear-stress. The reliability assessment also indicates that annual probabilities of failure, associated to each criterion, might be comparable with the values presented in reliability standards for marine structures. Based on the results, this paper highlights future recommendations to improve the reliability-based design and analysis of scour protections for offshore foundations.

1. Introduction

In offshore wind turbines, the foundation costs typically can range from 20 to 35% of the overall venture, for example, References [1,2]. A part of these costs is related to the scour protection, which affects the capital expenditures (CAPEX) and the operation and maintenance expenditures (OPEX). Scour protections are an indispensable part for many offshore wind turbines, namely the ones with monopile foundation, focused in this research. Therefore, the optimization of the scour protections is a key contribution to increase the sector’s competitiveness. A recently proposed optimisation lies in the use of dynamically stable scour protections.
Dynamic scour protections allow for movement of the armour layer stones, without exceeding a pre-defined acceptable damage number. This design enables smaller stones when compared to statically stable protections. The static scour protections fail when wave and currents induced shear stress surpasses the critical shear stress [3], while the dynamic failure occurs when the maximum acceptable exposed area of the filter layer is exceeded [4]. According to Reference [4], dynamic scour protections can be designed by defining a pre-determined acceptable damage number (S3Daccept). In References [4,5], it was found, through physical modelling, that dynamic scour protections could be achieved for S3Daccept ≤ 1. Still the authors recognized that further research should be carried out for a proper generalization of this limit. Moreover, it was also found that statically stable scour protections could be obtained for a damage number (S3D) lower than 0.25. Dynamic scour protections were successfully tested in References [6,7,8].
However, there are very few comparative studies regarding the reliability and safety assessment of statically and dynamically stable scour protections. Moreover, the influence of the failure criteria in the reliability of the protection has not been thoroughly addressed for these types of design. A reason for this is the fact that the majority of the design techniques for scour in waves and current environment have a remarked empirical nature [8]. The literature shows a lack of studies performed on the probabilistic design and reliability (safety) assessment of scour protections at marine environments [9] but several works have been performed for scour under current alone, for example, References [10,11]. Recently, reliability design and analysis of scour protections for offshore wind foundations has been addressed in References [9,12]. Both researches, outline the fact that the design choices on empirical variables, such as the failure criteria or the wave friction factor, have an influence on the evaluation of the reliability. However, in other areas of maritime engineering, reliability methods are already common in the design of several structures, unlike scour protections, such as ships [13] and offshore platforms [14]. These techniques are also becoming more frequent in coastal engineering [15], namely in rubble-mound structures as breakwaters, which have similar behaviour to scour protections. The traditional design of scour protections is mainly based on characteristic values of the hydrodynamic loads, for example, the significant wave height (Hs) associated to a specific return period (Tr) [3]. Also, the lack of data, concerning the sea-state or current time series limits the probabilistic assessment of the protections’ safety, commonly designed for a lifetime of 20 years [16]. Therefore, a pure reliability assessment is rarely performed in these components of offshore wind foundations. This topic remains a knowledge gap that is yet to be deeply understood, before a proper reliability methodology is implemented in practical case studies.
Performing the reliability analysis of scour protections enables the quantification of the protection’s safety, usually expressed as a probability of failure (Pf) that accounts for the uncertainty of the environmental loads and the protections’ features. Moreover, this could be extended to design the scour protection based on a pre-determined probability of failure. This was recently proposed in Reference [9], which concluded that more knowledge and a deeper discussion was required on the impact of the design choices on the output of the probabilities of failure. In Reference [9], preliminary conclusions indicate that reliability analysis could be used to optimise the mean diameter of the armour stones, thus providing a potential contribution to cost savings without compromising the systems’ safety.
This paper performs the reliability study of a scour protection inspired in the case study of Horns Rev 3 offshore wind farm [16], with the sea-state data being modelled with non-parametric bi-variate version of the Kernel Density Estimation Method. Monte-Carlo simulations are used to understand the influence of the failure criteria and the wave friction factor in the protection’s reliability. These aspects are recognized in the literature [17] as two important sources of influence in the protection’s reliability. The probability of failure is computed for the statically stable and the dynamically stable criterion proposed in References [3,4], respectively. The main goal of this research is to determine whether both criteria provide a similar measure of safety for the protection and to discuss the influence of the wave friction factor (fw), opening the way for future research and discussion on the application of reliability design in similar rubble-mound armoured structures.

2. Materials and Methods

2.1. Failure Criteria

2.1.1. Statically Stable Scour Protections

The stability of the armour layer typically implies the definition of the thickness of the scour protection and the mean stone diameter (D50) used for the rock material. The present study is focused on the latter. In statically stable scour protections, the armour stones are not allowed to move [3]. Therefore, one must ensure that the wave and current induced shear-stress (τwc) does not exceed the minimum shear-stress necessary for movement to occur, that is, the so-called critical shear-stress (τcr). The critical shear-stress was originally introduced by Reference [18] and is obtained with Equation (1).
g ( ρ s ρ w ) D 50 θ c r = τ c r
which depends on the Shields critical parameter (θcr), the median diameter of the rock material (D50), the gravitational acceleration (g), the density of the sediments (ρs) and the water’s density (ρw). A comprehensive review of the methods available to perform a statically stable design is provided in Reference [5]. This work is focused on the methodology presented in Reference [3].
Assuming that τcr is the maximum shear-stress that can occur on the top layer without failure, then the critical shear-stress can be interpreted as the resistance of a static scour protection. If the wave- and current-induced shear-stress overcomes the resistance of the protection, then failure is assumed to occur. This interpretation leads to Equation (2), which can be seen as a failure criterion for static stability according [3].
τ w c < τ c r
According to Reference [3], for a current-induced (τc) and a wave-induced shear-stress (τw), the combined shear-stress (τwc) is obtained from Equation (3).
τ w c = 83 + 3.569 × τ c + 0.765 × τ w
Assuming that a scour protection is designed according to Equations (1) and (3), it is possible to define the ultimate limit state function f(.) of the scour protection as in Equation (4).
f ( τ c r ; τ w ; τ c ) = τ c r τ w c
Note that if the limit state function is negative or null then the scour protection fails, since movement is occurring in the top layer. Conversely for positive values of f(.) the static stability is ensured. An important aspect of the present approach is the fact the wave- and current-induced shear-stress is dependent on the formulation adopted for the friction factor (fw). While the proposed approach computes the current friction factor as in Reference [19], the wave friction factor can be obtained as in References [20,21,22,23], depending on the orbital bottom velocity (Um), the wave period (T) and the bed roughness (ks) computed as 2.5D50. The different approaches for the wave friction factor influence the wave-induced shear-stress, eventually leading to different probabilities of failure. Figure 1 shows that for a common Dn50 of 0.40 m a maximum variation of roughly 30% is obtained for τw. Equation (3) was obtained by regression with the best results being obtained for the formulation of fw presented in Reference [23] (also see Reference [3]). In the present case, Dn50 is the nominal median stone diameter, defined as 0.84D50 and applied in References [3,4]. However, the formulation [23] is only applicable to values of the wave stroke to the bed roughness ratio, A/ks, between 0.2 and 10, where A = UmT/(2π). Therefore, the analysis of other formulations is of greater importance for practical cases.
Figure 1 provides a comparison between the waves induced shear-stress for the referred approaches used to obtain fw. The example is established for Hs = 6.5 m, Tp = 11.2 and Um calculated as in Reference [24], assuming a JONSWAP spectrum, with a peak enhancement factor, γ = 3.3. It can be seen that for an increasing D50, the lower limit tends to the formulation given by Reference [22], while the upper limit tends to Reference [20]. However, note that for small values of D50 the upper and lower limits of fw tend to References [21,23], respectively. The adopted formulations concern to rough turbulent flow (see Reference [22] for further details on the flow regime).
Not only this has an effect on τw and τwc but it also leads to differences in the wave boundary layer thickness (δ), which is used to obtain τwc in alternative approaches to Equation (3) (e.g., References [21,22,23]). For example, the maximum bed shear-stress (τwcmax) can be obtained as in Reference [21] and use it instead of Equation (3), as an input to Equation (4). Then, the limit state function f(.) can be simulated by using the τwcmax instead of the τwc proposed by Reference [3].
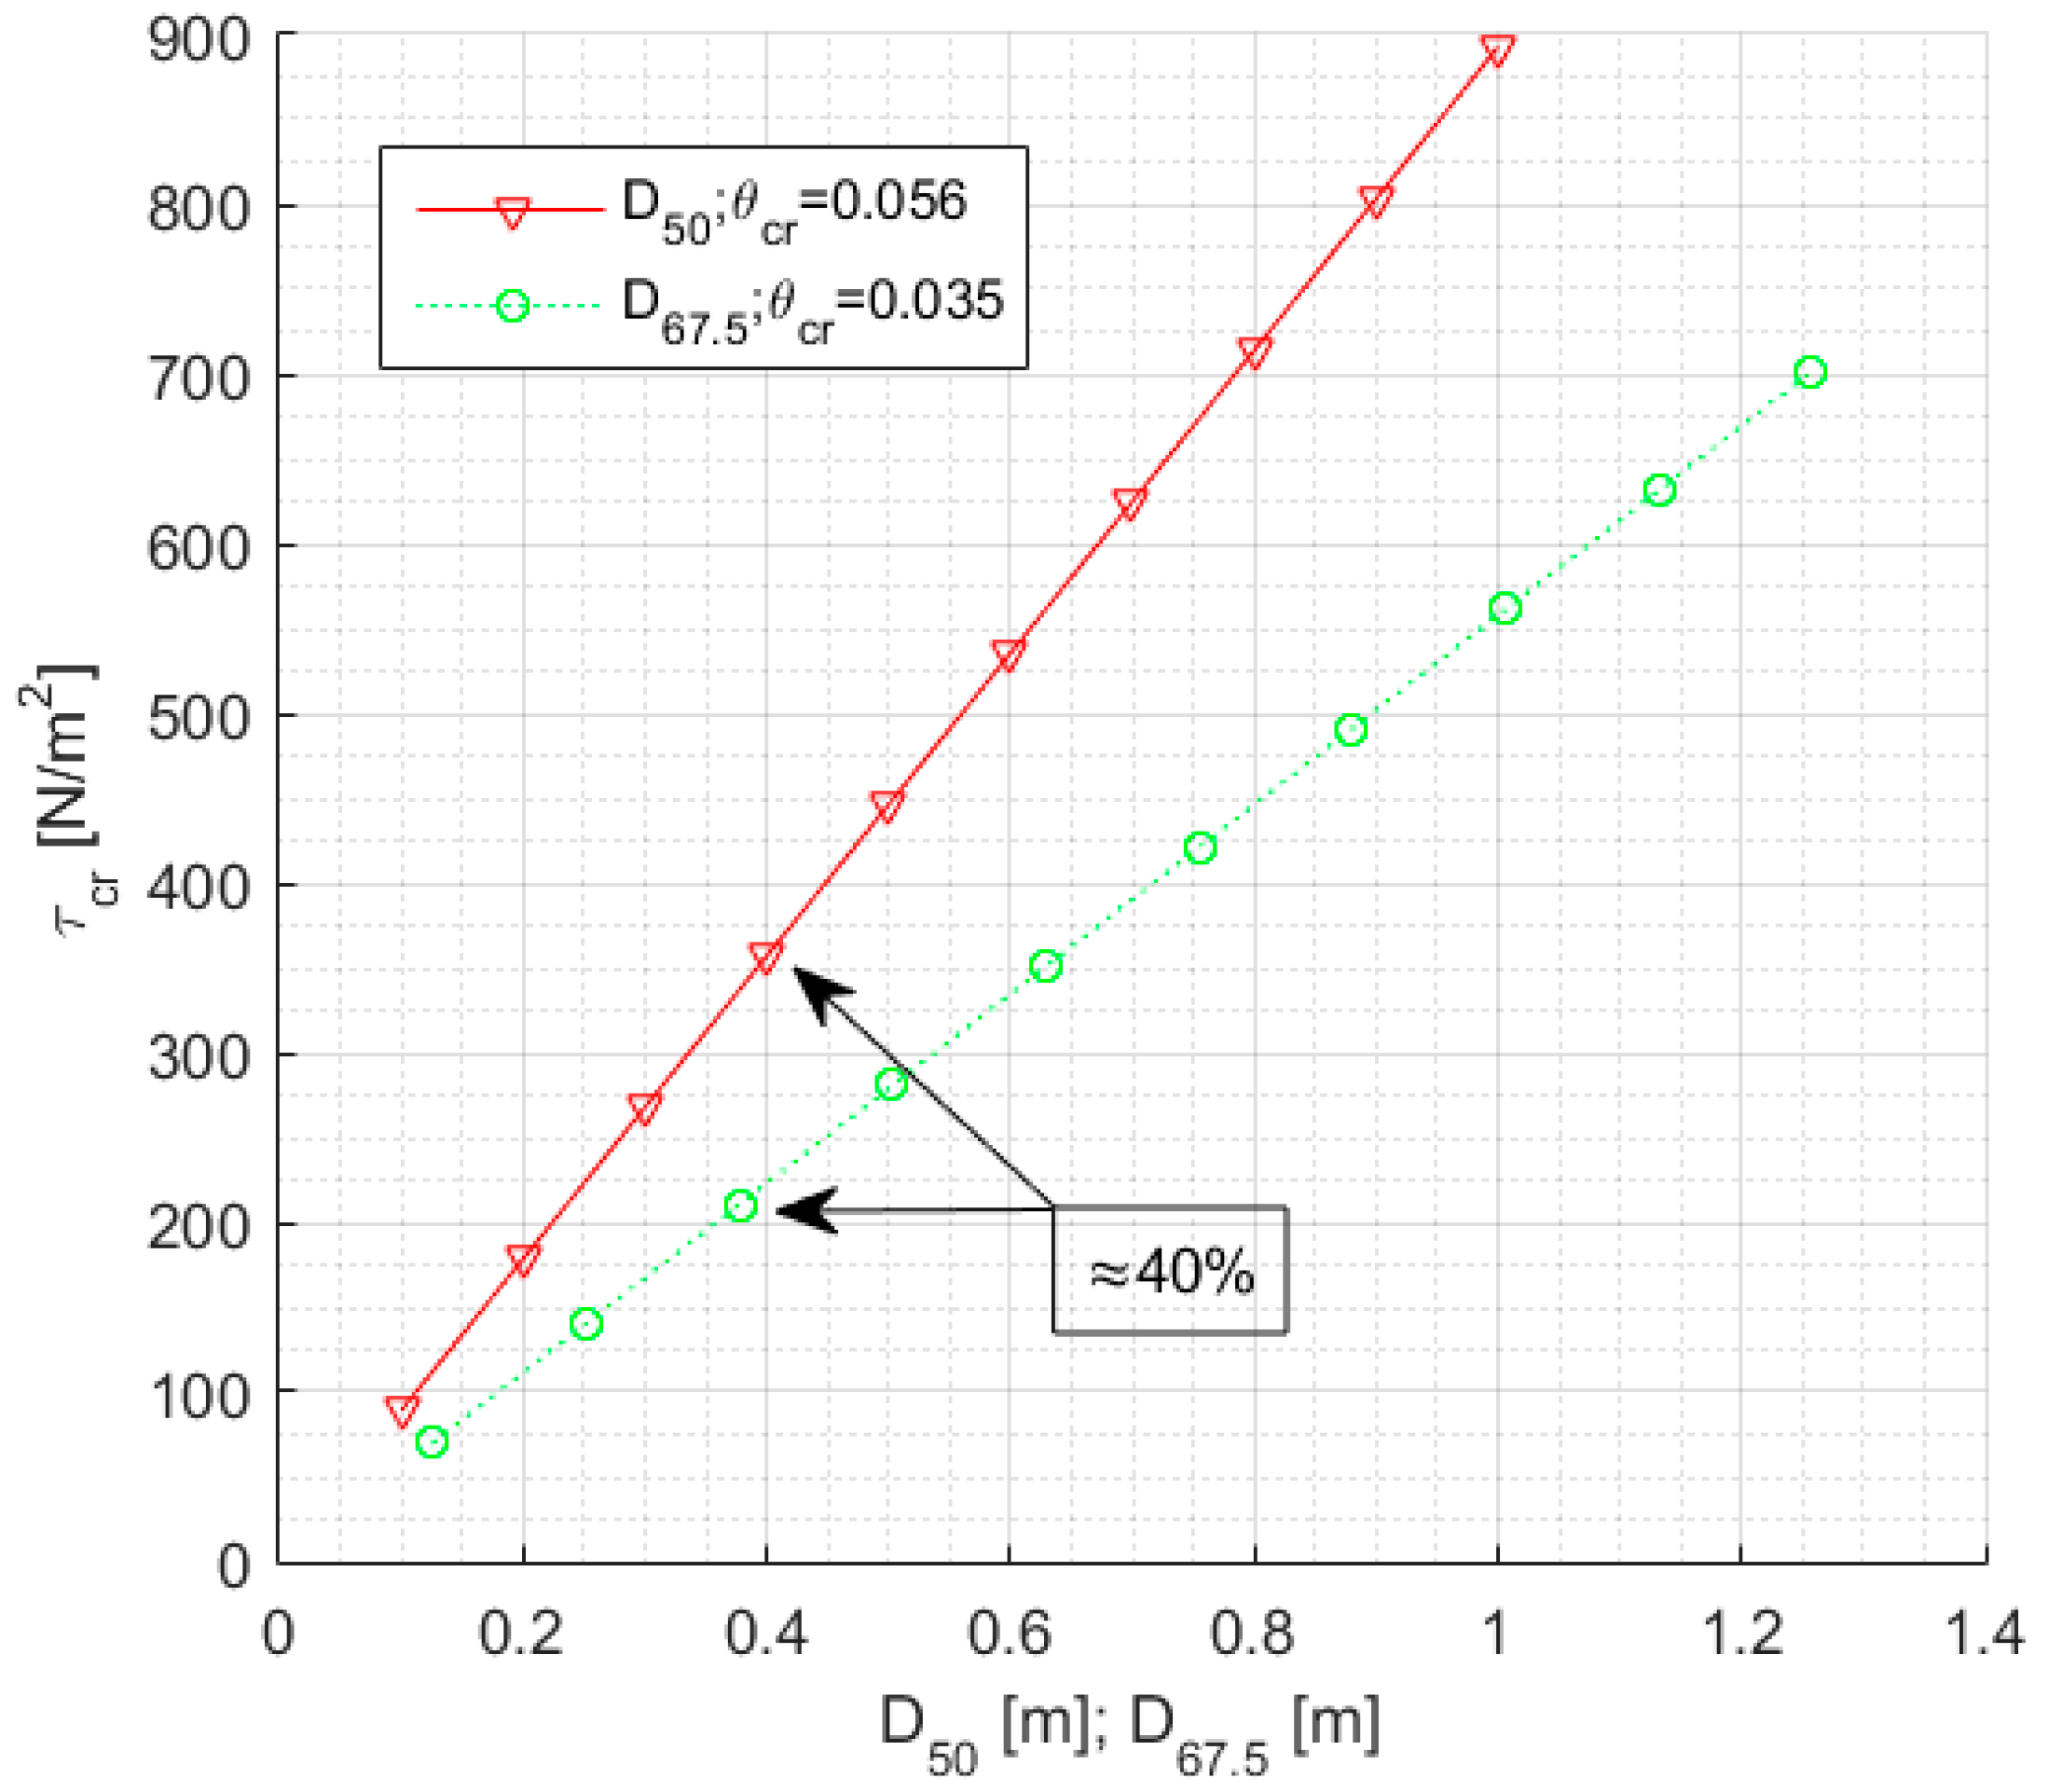
Another important difference concerns the calculation of τcr. While typical approaches use Equation (1), the procedure proposed by Reference [3] recommends the use of D67.5 instead of D50. This is justified by the fact that the stones of the armour layer with a smaller grading tend to move faster than those of a scour protection with a wide grading. Reference [3] states that in wide graded scour protections the smaller stones are better sheltered thanks to the larger stones, thus it recommends that the critical bed shear-stress is obtained with D67.5. Recently, References [25,26] conducted a physical model study, concluding that wide graded scour protections provide high stability against wave loading, thus being suitable for a dynamically stable design. Although using D67.5 increases the resistance parcel (τcr), the approach proposed in Reference [3] considers θcr = 0.035 instead of 0.056, which contributes to a decrease in the critical shear-stress. Figure 2 computes the critical shear-stress for both situations.
Figure 2 shows that the critical shear-stress according to Reference [3] leads to lower values than the ones given by Equation (1). For the same value of θcr, calculating the critical bed-shear stress with D67.5, leads to larger values of τcr than the ones obtained with D50. However, using θcr equal to 0.035 leads to smaller values of τcr than using θcr equal to 0.056 even if D67.5 is considered instead of D50. Figure 2 shows that τcr evaluated as in Reference [3] leads to smaller values of the protection’s “resistance” to the initiation of movement. Therefore, contributing to a conservative assessment of the probability of failure. Note, however, that the D50 is still considered in the failure criteria, by means of the bottom roughness (ks), if the ultimate limit state function is evaluated with critical shear-stress according to References [21,22]. Then it seems reasonable that Equation (1) is directly applied, that is, with D50 and θcr = 0.056.

2.1.2. Dynamically Stable Scour Protections

The majority of the design methodologies for statically stable scour protections are based on the bed shear-stress evaluation, namely, the ones concerning the dimensionless stone diameter (D*), for example, References [27,28]. However, in dynamic scour protections, since a certain degree of movement is allowed, the threshold of motion cannot be considered a suitable criterion to define failure. In this case, it is possible to adopt the damage number (S3D) proposed in Reference [4].
In Reference [4], an extensive data set of 85 scour tests is presented, concerning a physical model study at a Froude scale of 1/50. This study proposed a predictive formula (Equation (5)) for the non-dimensional damage number of at the scour protection, which provided close estimations to the damage number directly derived from the bathymetric measurements in the model (S3Dmeas). Further details on the methodology to analyse and calculate S3Dmeas, are given by Reference [4]. In this study, it was considered that the failure of the scour protection occurred if the exposed area of the filter layer is equal or greater than 4D502. This criterion had already been in used in References [3,29]. The approach proposed in Reference [4] enables one to obtain the dimensionless predicted damage number for a certain scour protection (S3Dpred) with Equation (5).
S 3 D p r e d N b 0 = a 0 U m 3 T m 1 , 0 2 g d ( s 1 ) 3 2 D n 50 2 + a 1 ( a 2 + a 3 ( U c w s ) 2 ( U c + a 4 U m ) 2 d g D n 50 3 2 )
where N is the number of waves in a considered storm, Uc is the depth-averaged current velocity, s is the ratio between sediment’s density (ρs) and water density (ρw), g is the gravitational acceleration, d is the water depth, Um is the orbital bottom velocity and ws is the sediments’ fall velocity. Tm-1,0 is the energy spectral wave period, which for a JONSWAP spectrum, with γ = 3.3 can be obtained from the peak period (Tp) as Tm-1,0 = m-1/m0 = 1.107Tp. In Equation (5) b0, a0, a2 and a3 are equal to 0.243, 0.00076, −0.022 and 0.0079, respectively. The constants a1 (Equation (6)) and a4 (Equation (7)) depend on the existence of following or opposing waves and current. Ur stands for the Ursell number.
a 1 = { 0 f o r U c g D n 50 < 0.92 and   waves   following   current 1 f o r U c g D n 50 0.92 or   waves   opposing   current
a 4 = { 1 for waves   following   current U r 6.4 for waves   opposing   current
Despite the reasonable agreement between the predicted and the measured damage number, the test conditions performed by Reference [4] did not include a wide range regarding the water depth (d) or the mean diameter of the armour stones. Later on, References [6,7,30] applied Equation (5) to a wider range of the same variables, concluding that increasing departures from the best fit line (S3Dmeas = S3Dpred) could be noticed. A discussion for possible reasons leading to this is provided in Reference [17], including the influence of the analysis performed on the bathymetric measurements.
In Reference [4], it was found that for S3D between 0.25 and 1 there was movement of the armour layer stones without failure, that is, dynamic stability was achieved. For S3D below 0.25 no movements occurred (statically stable scour protection). The study also reported that dynamic scour protections were obtained for S3D > 1 (also see Reference [5]). However, a transition zone was reported for which dynamic profiles were developed in some cases whereas failure occurred in others.
Often in practical real situations, there is no bathymetric data that enables the assessment of the actual damage number at a scour protection. Moreover, in design cases, the interest lies in finding the proper D50 associated to the previously defined acceptable damage. Typically, the acceptable damage number is previously defined and Equation (5) is solved in order to D50. Then, physical modelling activities are used to assess if the damage number in the model is in agreement with the acceptable one. In order to calculate the reliability assessment of a dynamic scour protection around a monopile, through Equation (5), one can assume the acceptable damage number (S3Daccept) and then compare it with the predicted damage number for the loading conditions acting on the protection. If the predicted damage number exceeds the acceptable level, then risk mitigation measures must be taken, since failure of the protection may occur. This leads to the limit state function for dynamic scour protections in Equation (8).
f ( U m ; U c ; T m 1 , 0 ; D n 50 ; ρ s ; ρ w ; d ; g ; w s ) = S 3 D a c c e p t S 3 D p r e d
Similarly, to the limit state function presented in Equation (4), if negative or null values are obtained in Equation (8), then failure is considered to occur. Note however, that such event, does not necessarily means that there is an actual failure in terms of the filter layer exposure. There is a failure in the sense that the design criterion is not being respected as it should [9].
In the present study, S3Daccept = 0.25 and S3Daccept = 1 are assumed as reasonable limits for no movement and movement without failure at the armour layer. However, the authors recognize that the influence of S3Daccept should be further analysed, since it affects the probability of failure for the same range of predicted damage numbers. In addition, the literature shows that the transition between dynamic stability and failure occurrence is not clear in some cases. Nevertheless, assuming S3Daccept = 1 seems a conservative choice, because for the tested range in References [4,6] no failure occurred below this limit and still some dynamic profiles were developed above it. The damage number derived as in Reference [4] can be interpreted as the number of layers of armour stones that have been removed from the top layer. Thus, for scour protections with different armour layer thicknesses the reference value S3Daccept may require a proper adjustment. In Reference [4], scour protections with an armour thickness of 2.5Dn50 and 3Dn50 were tested. For an exposure of the filter layer, approximately values of 2.5 and 3 should be defined as the minimum value for filter exposure and potential failure. However, Reference [4] reported failure below that level. Since the exposure of 4D502 was formerly identified by visual observation, uncertainties can be present in the proposed assessment. Alternatively, the scour protection may indeed fail before the armour layer thickness is completely removed over the 4D502.
In addition to the reduction of the median diameter employed in the protection, the dynamic approach poses some advantages in comparison with the static approach [3]. On one hand, it does not require the assumption of a specific formulation for the bed shear-stress calculation, which is also applicable to the friction factor. On the other hand, the modifications made to Equation (1) by Reference [3] are not relevant, because [4] does not imply the direct calculation of τcr.
However, some uncertainties can be identified in the dynamic approach. An extensive discussion of those is given in Reference [17]. The choice made regarding S3Daccept is not always evident and it may depend on prior evaluation through a physical model study. This choice is also very much dependent on the designer’s experience in scour protections. Also, Equations (6) and (7) only account for following or opposing waves and current, while a static criterion based on the combined maximum wave and current induced shear-stress (τwcmax) provided for example by Reference [22] is able to account for different angles between flow components. Also, the definition of N, that is, the storm duration in number of waves, influences the predicted damage number. In Reference [6], several tests were performed until 5000 and 7000 waves and it was concluded that the damage rate tends to decrease with the increasing number of waves, eventually leading to a stabilization. However, it was not possible to prove beyond doubt that damage stabilization was indeed occurring. In References [25,26] tests are performed until 9000 waves, still it was not possible to prove that stabilization occurred. The present study concerns to N = 3000 waves as applied in Reference [4].

2.2. Non-Parametric Probability of Failure

In order to obtain the probability of failure, the Monte-Carlo simulation was applied to Equations (5) and (8). For details on the Monte-Carlo simulation method, Reference [31] is recommended. If one generates random values of the variables encompassed in the ultimate limit state functions previously defined, for example, Uc, Tm-1,0 or Um, then Equations (5) and (8) can be calculated for each set of generated values. Noticing that for f(.) ≤ 0 the scour protection fails, that is, the top layer is eroded, then the probability of failure can be obtained with Equation (9), where n is equal to the number of simulations performed and I(.) is an indicator function equal to 1 if f(X) ≤ 0 or 0 if f(X) > 0. X is the vector of random variables used to compute each ultimate limit state function.
P f = # ( f ( X ) 0 ) n = 1 n I ( f ( X ) ) n
The accuracy of Pf depends on the number of simulations performed. In this study, the simulations were conducted for several sizes of n, between 1000 and 1,000,000, to analyse the minimum number of simulations required for Pf to stabilize.

3. Case Study

The case study used to exemplify the reliability assessment of scour protections is based on the environmental conditions at Horns Rev 3 offshore wind farm. Details on this case study are available in References [16,32,33].
Horns Rev 3 is located in the Danish sector of the North Sea, 20–35 km north-west of Blåvands Huk and 45–60 km from the city of Esbjerg [16]. This area is relatively shallow and the water depth ranges closely from 10 to 20 m. The local seabed is dominated by non-cohesive sands [32]. The position for hindcast modelling corresponds to the following coordinates: Latitude of 55.725 °N and Longitude of 7.750 °E. The available database resulted in a total of 90,553 pairs of significant wave height and peak period. This corresponds to an hourly output resolution within the period of 01-01-2003 to 01-05-2013, that is, 124 months [16]. The water depth at the referred coordinates was considered to be d = 18 m.
Due to the complexity of scour phenomena and the associated met-ocean conditions, it is practically impossible to build a full probabilistic model for reliability assessment. Instead it is common to select the most important correlations and the dominant variables, in terms of loads calculations [34]. The challenges of building a full probabilistic model to assess the reliability of scour protections are discussed in Reference [17]. In marine and offshore structures, the wave height is often considered as the dominant variable and its correlation with the wave period should be addressed for a proper joint model of the sea-states. Here the non-parametric bi-variate Kernel Density Estimation Method (BKDE) was applied in order to simulate the significant wave height (Hs) and the peak period (Tp), which are further used to compute the variables included in Equations (5) and (8), for example, Um or Tm-1,0. The Kernel density estimation has been consistently applied to describe statistical properties of oceanic waves, for example, References [35,36] used it for wave heights and periods and [37] applied it to extreme significant wave heights. This method was implemented with the “MASS R” package [38].
In Figure 3, the hindcast data concerning Hs and Tp is provided, as well as a random sample of 10,000 pairs of (Hs; Tp). A visually good agreement is found between the sample and the random generation. Since the same sample is used to generate the random variable, this does not lead to differences in the failure probability assessed with the static or the dynamic approach. The same data series are used in both cases.
The depth-averaged current velocity was considered as an independent variable from the wave height and period. This is a model simplification, because when currents are imposed to waves, their characteristics tend to change, namely the wave period. Only characteristic values, such as the average flow velocity, were available from Reference [16]. Therefore, the marginal distribution of Uc was modelled with a Weibull distribution, with an equivalent mean of 0.40 m/s and a standard deviation of 0.20 m/s. In order to consider the cases “following” and “opposing” currents to waves, a random angle of 0° or 180° was associated to each generated value of the current velocity.
The information available in References [33,39] suggests a possible configuration for the scour protections with D50 = 0.40 m and 0.35 m, respectively. In this case, the D50 is assumed as 0.40 m and the nominal mean diameter is calculated as Dn50 = 0.84D50 as in Reference [40]. In order to simulate the variability of the stone’s diameter, a triangular distribution was assumed between 0.179 and 0.621 and centred in D50, so that D15 and D85 are equal to 0.30 m and 0.50 m, respectively, as mentioned in Reference [39]. This corresponds to a uniformity parameter of the protection’s sediments equal to 1.67, which is within the range tested in References [3,4]. The density of the rock material was considered deterministic and equal to ρs = 2650 kg/m3. Other deterministic variables are considered, namely N = 3000 waves, ρw = 1025 kg/m3 and g = 9.81 m/s2.

4. Results and Discussion

4.1. Reliability Assessment

4.1.1. Statically Stable Scour Protections

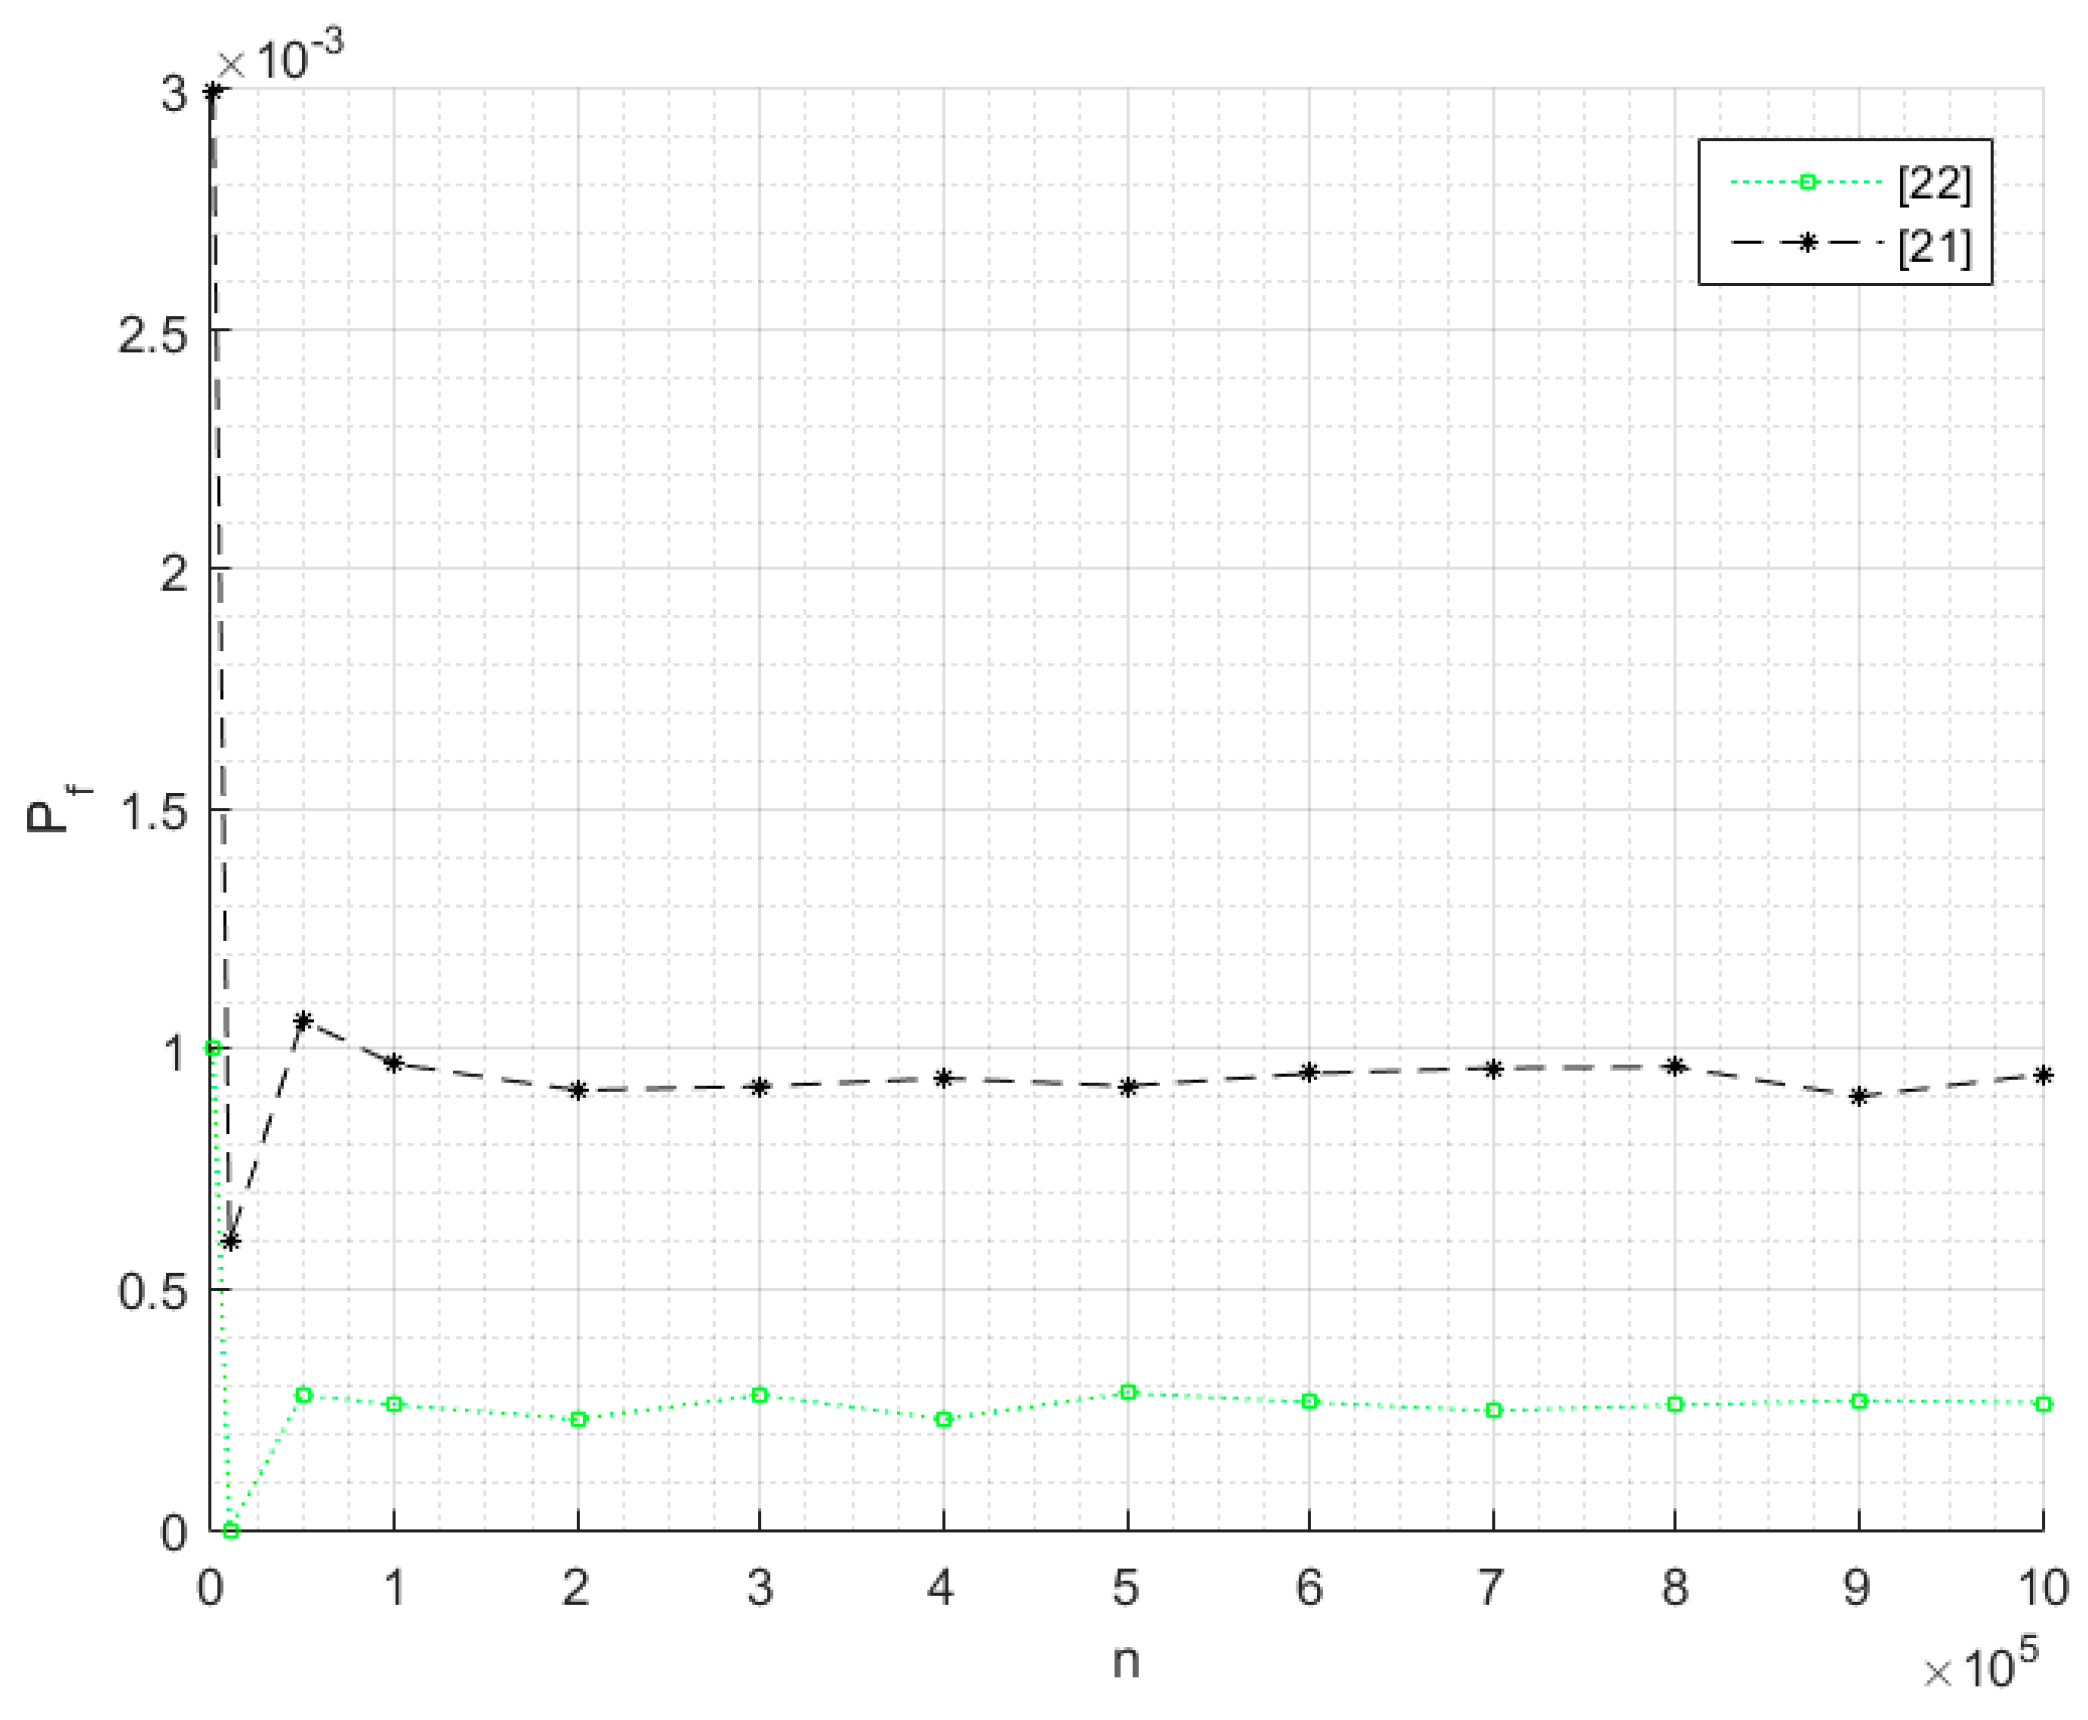
In order to assess the influence of the wave friction factor in the probability of failure, for the statically stable criterion proposed in Reference [3], the wave induced shear-stress was computed according to the formulations presented in References [21,22], which gave the highest and the lowest wave induced shear-stress respectively, for the example presented in Figure 1, D50 = 0.40 m.
Figure 4 presents the probability of failure obtained with both calculations of fw. It is possible to conclude that the wave friction factor significantly influences the probability of failure. The probability of failure given according to Reference [22] is clearly in the order of 10−4. However, if the wave friction factor from Reference [21] is used, then the probability of failure increases. Although Pf is still in the same order of magnitude, since 10−4 is close to the order 10−3. This is in agreement with Figure 1, where it was seen that for D50 = 0.40 m, the fw defined according to Reference [21] gives a wave induced shear-stress, which is roughly 30% higher than the one provided in Reference [22]. Note that for a larger D50, the influence of fw increases due to increasing disparities in the wave induced shear-stress, which is also reflected in τwc.
The wave friction factor from Reference [23] was not used to estimate the probabilities of failure, as wave data occasionally presented a ratio of A/ks smaller than the minimum of 0.2, for which the formulation is developed. Moreover, in Reference [5] it was concluded that [20] provided unexpectedly high values of τw as the wave period tended to 0 s. Therefore, this formulation was also excluded from the analysis.
In Figure 4, the probability of failure seems to be stable for a small number of simulations. Regardless of the wave friction factor, n = 200,000 simulations seems to be enough to stabilize Pf. The most significant fluctuations occur below the 100,000 simulations.
When using Equation (3), with the maximum combined wave and current induced shear-stress (τwcmax) as computed in References [21,22], the probability of failure increases and is very much dependent on the amplification factor (α), used to obtain the amplified bed shear-stress at the protection, due to the presence of the pile. In References [3,4,5], it was also noted that the formulation used to obtain τwc and the value of α were major contributions for the differences between the required D50, computed with the approach presented in Reference [3], when compared with the traditional design, for example, References [21,22].
In Reference [5] it is noted that the difficulty of knowing the amplified bed shear-stress often leads to an oversized D50 and that improvements could be made, with other approaches, as the one presented in Reference [3]. In this study it is observed that traditional approaches lead to higher values of the probability of failure. Those values might indeed be conservative, because in Reference [3] statically stable scour protections were obtained with a lower D50 when compared with the approaches adopted in References [21,22].
Table 1 compares the probabilities of failure with varying amplification factors. The probabilities are higher when [21] is employed, due to the effect of the wave friction factor. Typically, α = 4 is used for steady current and α = 2.2 to 2.5 is used for waves [3]. Note that the order of magnitude of Pf may change depending on the value of α. The probabilities from Reference [21], are alarming when compared with typical values found for other offshore systems, for example, References [41,42]. This is also indicative on the very conservative perspective inherent to this approach, when compared with the optimized approach from Reference [5].
However, Table 1 covers a low range of amplification factors and further research should be performed to better assess the influence of this parameter in the probability of failure of statically stable scour protections. In fact, the proper values for α in waves and current combined are yet to be fully defined [43]. In addition, the values presented concern to the hindcast of 124 months. If those values are converted to an equivalent annual probability of failure (Pf0), then Pf decreases.
The probabilities of failure can be converted into annual probabilities of failure (Pf0), based on the simplification that the failure of a scour protection is a continuous time-stochastic process, with failure events being independent from each other and following a Poisson process, according to Reference [44]. This leads to Table 2, which can be compared with the reference values provided in standards such as [45,46]. These standards indicate that Pf0 may vary from 10−4 to 10−6, depending on the existence of life losses and the systems’ redundancy. Regarding the results reported for the reliability of static scour protections (Table 2), the main point is that the optimized approached from Reference [3] is giving reasonably low values.
Considering an offshore wind turbine as an unmanned structure and the scour protection as a system without redundancy, for which there is no prior warning to failure, then Pf0 according to Reference [45] should be lower than 10−5. Table 2 shows that the annual reference values obtained from Reference [3] are in the order of 10−5.
Therefore, the approach proposed in Reference [3] might be considered safe, in the case studied. However, the discussion on the acceptable probability of failure for scour protections in offshore wind foundations is not systematically addressed in the literature. Moreover, no specific guidelines or standards exist for this exact purpose. In this sense, the values provided in this work, also open the way for further discussion of this aspect.

4.1.2. Dynamically Stable Scour Protections

The reliability assessment of dynamic scour protections was performed with the failure criteria defined by Equation (8). Previously, it was seen that physical models showed that an acceptable damage number of 0.25 corresponded to the static stability of the scour protection. Assuming this is the case, then similar results are expected for the probability of failure given by Equations (5) and (8) with S3Daccept = 0.25.
The probabilities of failure calculated for the data set and the annual probabilities are given in Table 3. For S3Daccept = 0.25, the probability of failure is in the same order of magnitude (10−3) as the one provided by the traditional approach given in Reference [22], for an amplification factor α = 3 and α = 4 (see Table 1). When converting this probability of failure to annual values, Pf0 is in the order of (10−4), slightly above the values given for the criteria in the static approach in Reference [3] (see Table 2).
In Table 3, since the dynamic approach proposed in Reference [4] is designed to allow for some movement of the armour stones, it seems reasonable that the probabilities are smaller than the ones obtained with the criteria proposed in Reference [3]. This occurs because the dynamic design criteria is not as restrictive as the static one. It is interesting to note that Pf0 for S3Daccept = 0.25 is in the order of 10−4, which is above the 10−5 for unmanned structures and without redundancy, for which there is no prior warning before failure. Therefore, to design or to assess the reliability of a static scour protection it is recommended that the static approach is followed rather than the dynamic approach based on Equation (8) with S3Daccept = 0.25.
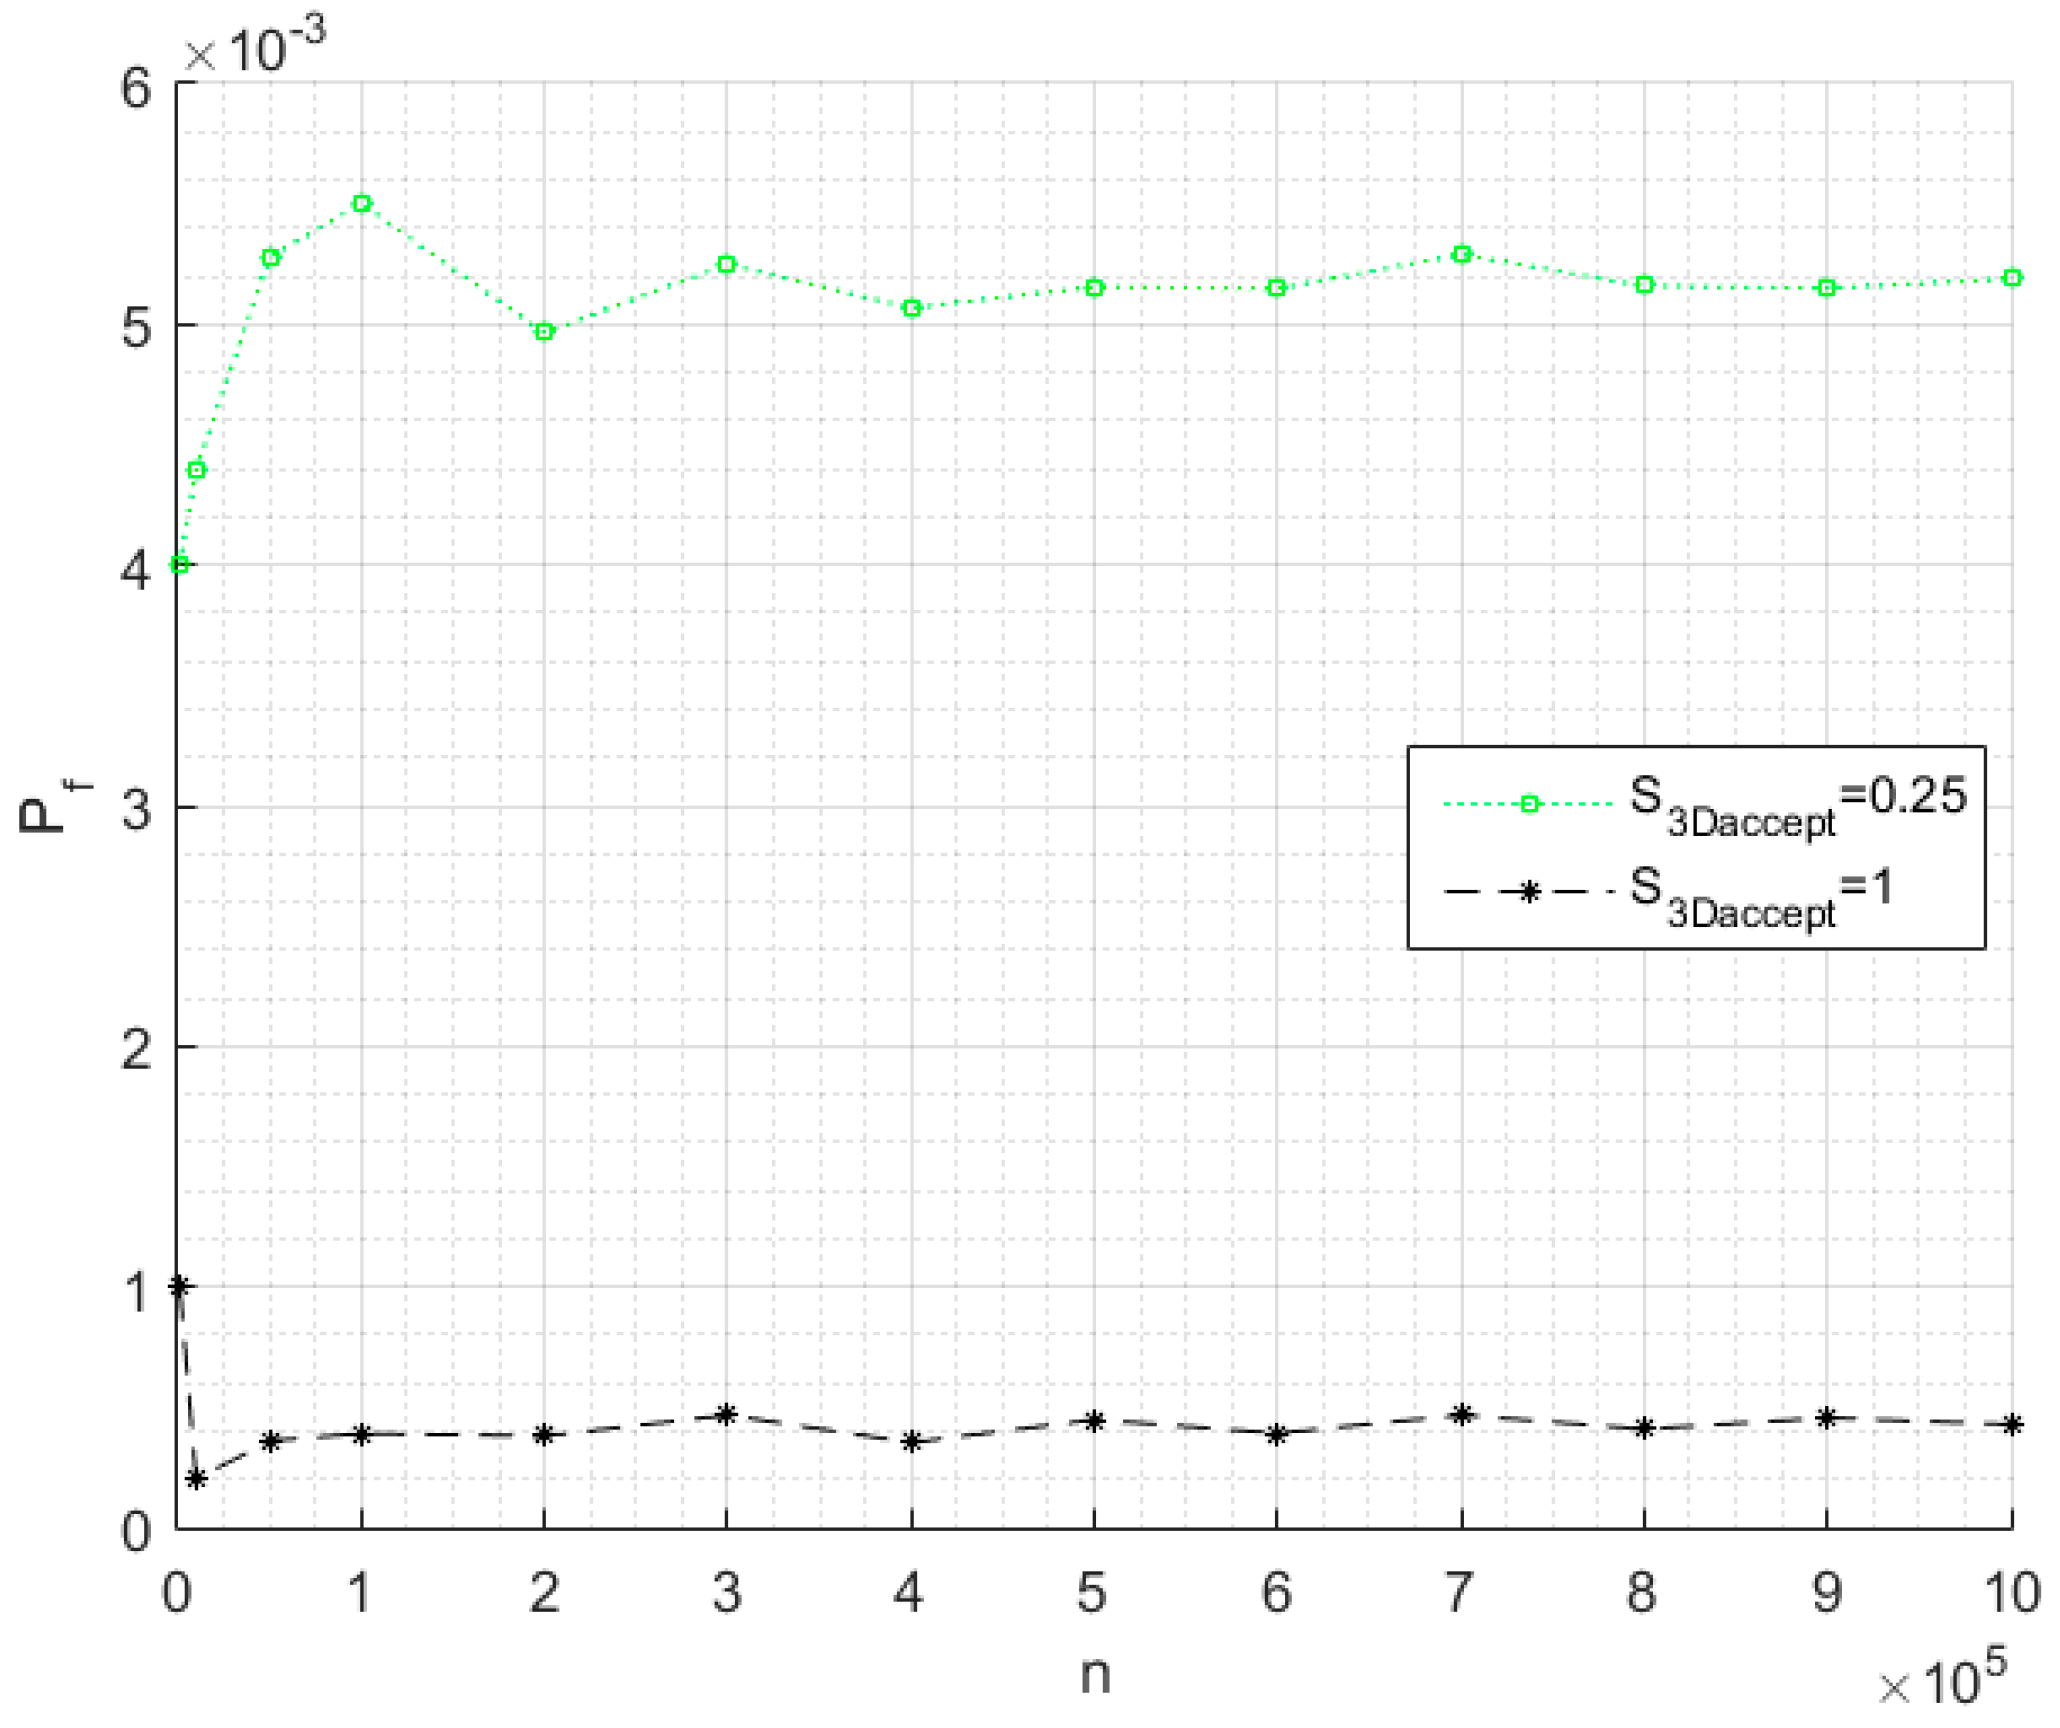
Figure 5 shows the probabilities of failure (Pf) for an acceptable damage number equal to 0.25 and equal 1, considering the same D50 = 0.40 m. The probability of failure is fairly stabilized after n = 200,000. Of course, when attempting to design a dynamic scour protection, the aim is to reduce the size of the armour stone, for example, by lowering the D50. Therefore, the most accurate comparison in terms of reliability, should be performed for a statically stable (D50) and S3Daccept = 0.25 and a dynamically stable (D50*) and the S3Daccept = 1.
Using a smaller acceptable damage number, for the same D50, leads to a more conservative criterion, thus increasing the probability of failure. Several sizes of D50 were tested for the same simulation conditions, in order to analyse which reduced diameter could be used for S3Daccept = 1, without exceeding the probability of failure given by the conservative limit of S3Daccept = 0.25. A D50 could be reduced to D50* = 0.25 m for S3Daccept = 1 and still maintaining the probability of failure equal to 5 × 10⁻³, which is very close the value reported in Table 3 (D50 = 0.40 m; S3Daccept = 0.25; Pf = 5.2 × 10⁻³).
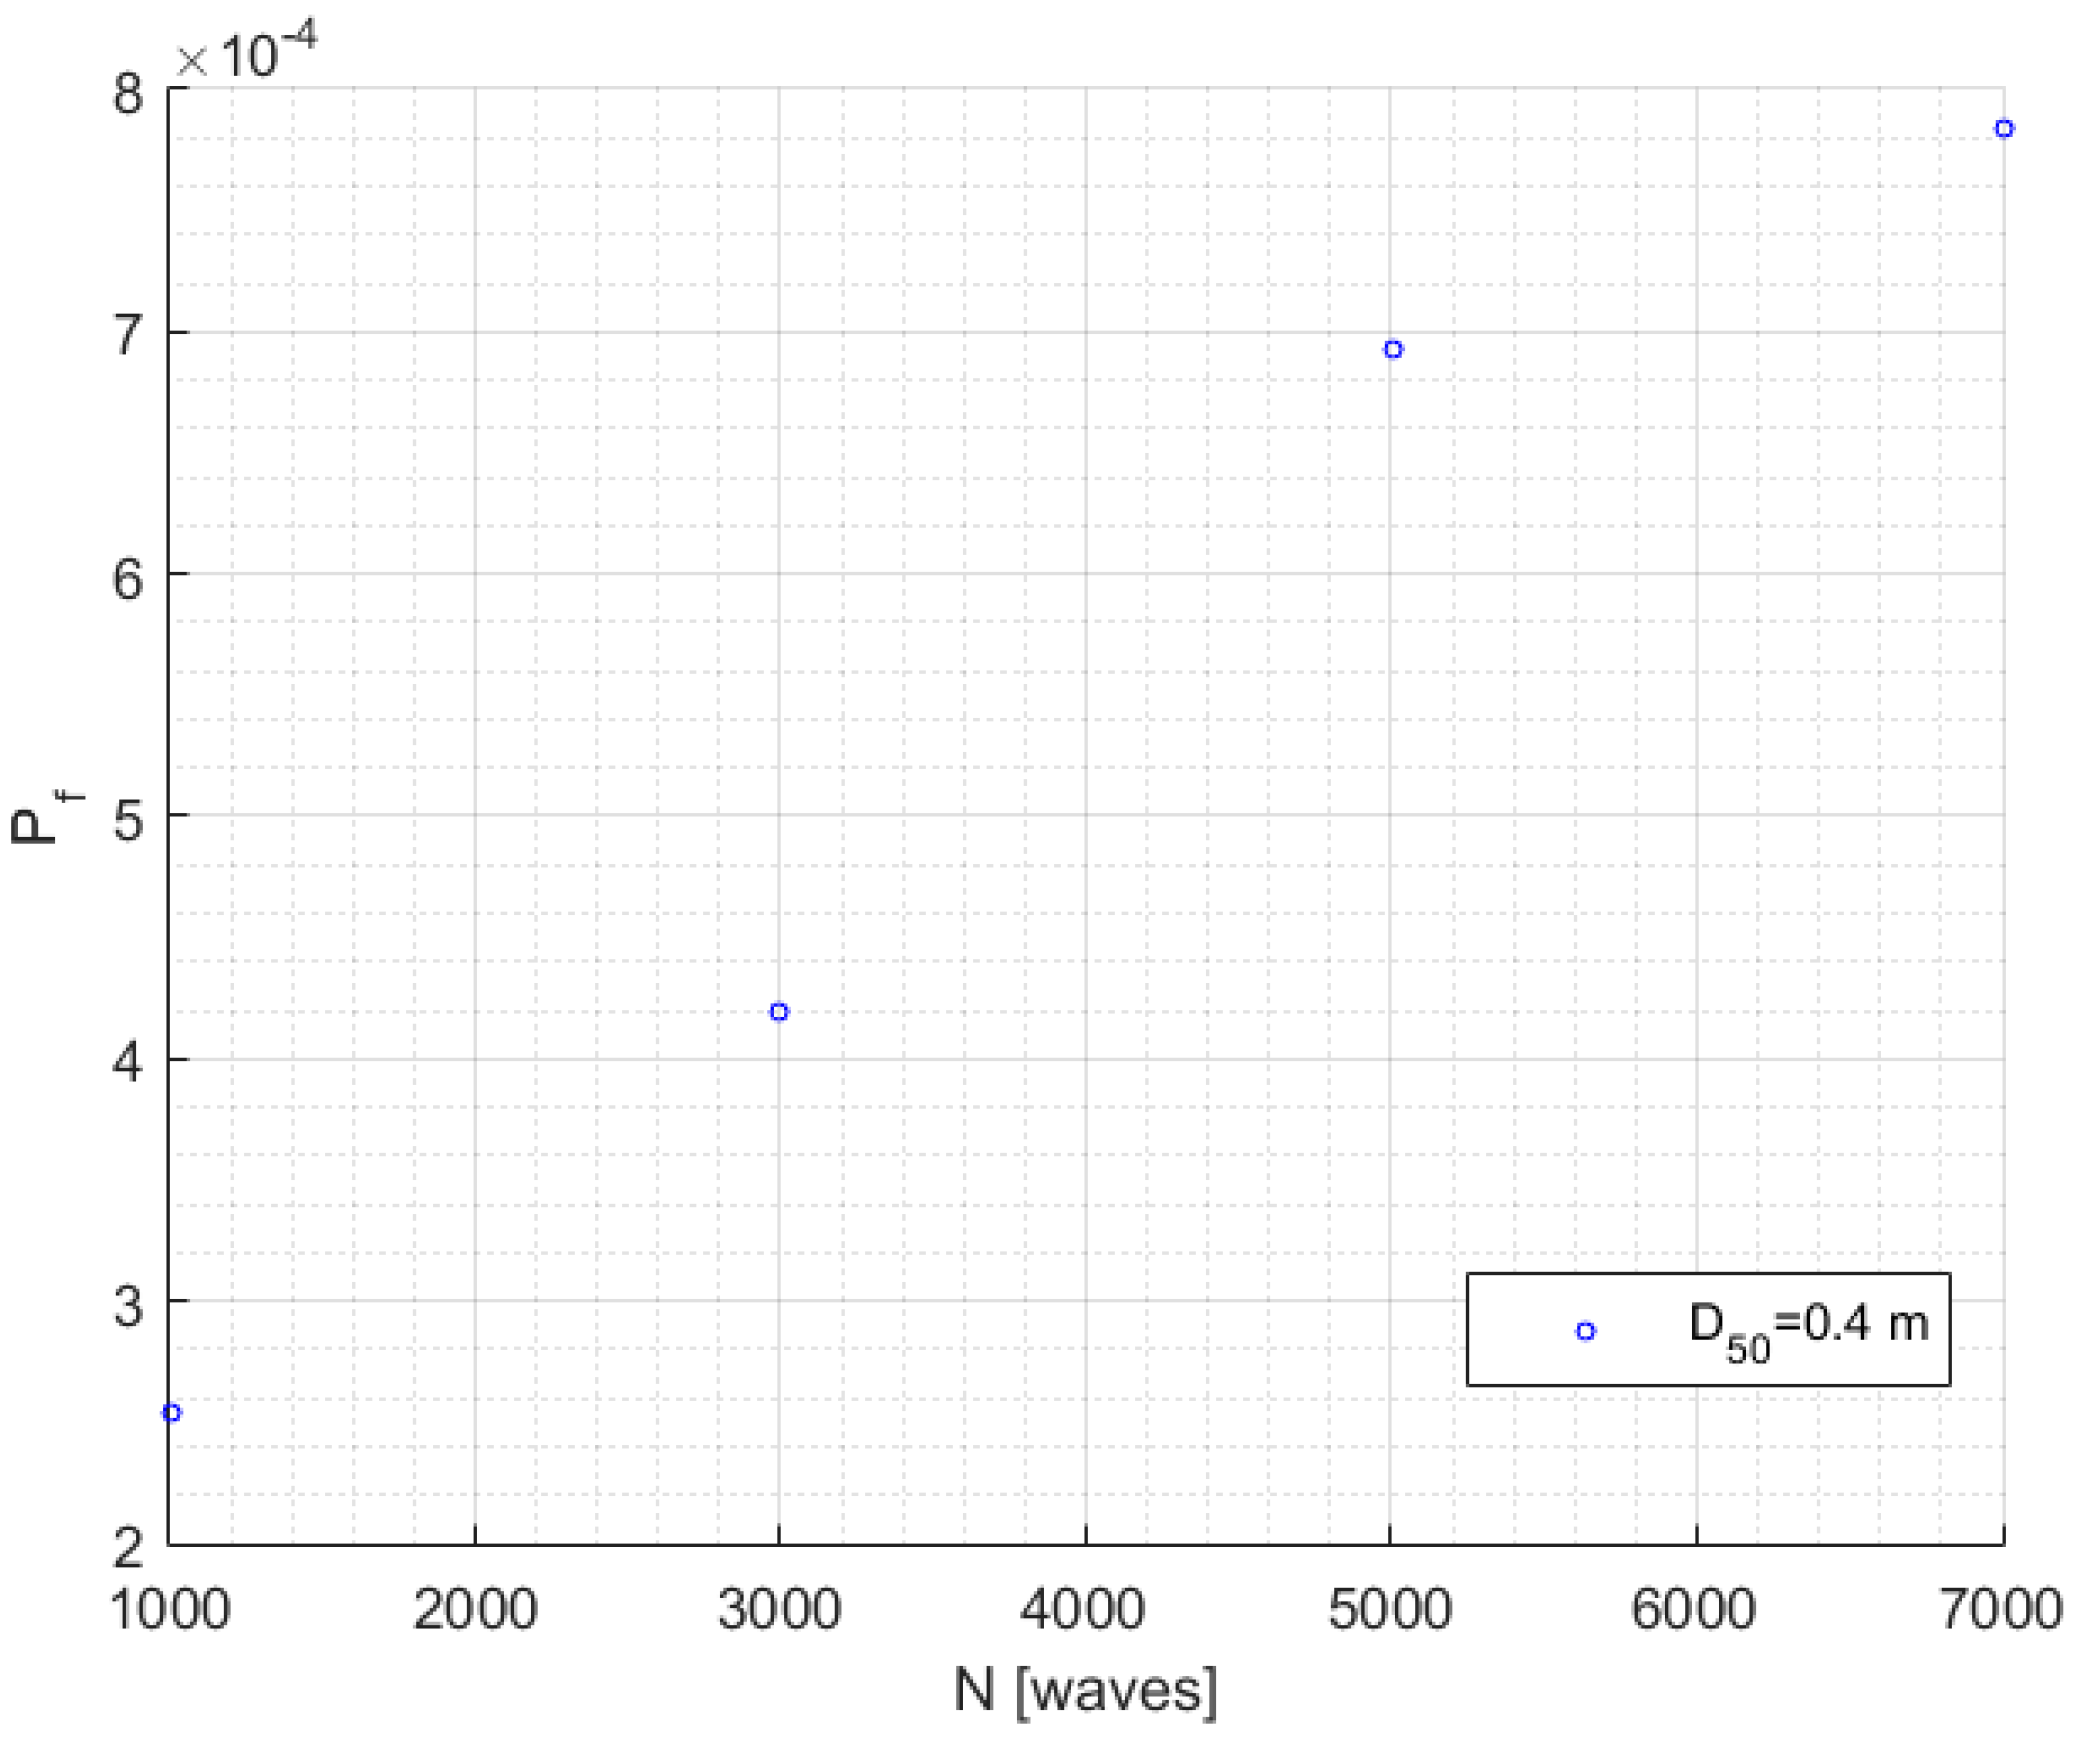
The probability of failure of the scour protection using S3Daccept = 1 and D50 = 0.40 m was calculated for N = 1000, 3000, 5000 and 7000 waves, that is the same number of waves tested in References [4,6]. The results respectively showed that Pf increases with N, that is, Pf = 2.5 × 10⁻⁴ for N = 1000, Pf = 4.2 × 10⁻⁴ for N = 3000 waves, Pf = 6.9 × 10⁻⁴ for 5000 waves and Pf = 7.8 × 10⁻⁴ for 7000 waves (Figure 6). This aspect was identified in References [9,17] as potentially having an effect on the probability of failure, which is hereby shown as being the case. For the present case study, although varying within a considerable range, it is interesting to note that the magnitude of Pf remained within the order of 10−4. This highlights the importance of performing a reliability assessment for a proper definition of a design storm, which is yet to be addressed extensively in the literature.

5. Conclusions

The present paper presents a methodology to quantify the reliability of scour protections, using the probability of failure as a measure of safety. The application to a case study inspired in the met-ocean conditions of Horns Rev 3 was performed. The reliability assessment compared two failure criteria, one for statically stable scour protections, as presented in References [3] and one for dynamic scour protections [4].
In static scour protections, the results showed that the wave friction factor, the calculation of the combined wave- and current-induced shear-stress and the amplification factor considerably affect the probability of failure of the scour protection. The results are in agreement with the former research presented in References [9,12], which concluded that the order of Pf may change depending on these variables. From a practical point of view, the reliability assessment is still much dependent on the designer’s choices and experience, since no mandatory guidance on the amplification factor and the method used to combine wave- and current-induced stresses is given in the literature. Moreover, the present research did not focus on other important influences, as the calculations and assumptions related with the bottom roughness or the wave orbital velocity. The sensitivity of the probability of failure to these is a crucial aspect of future developments in reliability analysis of scour protections. The optimized statically stable design [3] led to annual probabilities of failure, which are comparable to the ones provided in offshore wind standards, such as [45,46]. However, these standards are not specifically developed for the application of rip-rap scour protections for offshore wind foundations. Nevertheless, they can be seen as a starting point for the discussion on what it could be acceptable safety level of similar marine rubble-mound structures. The results shown for both static and dynamic criteria do not fall far from the probabilities of failure often discussed in other similar structures, for example, in References [47,48].
When the static stability criterion is compared with the dynamic one for an acceptable damage number of 0.25, the probability of failure is not the same, for the same D50. In dynamic scour protections, it was found that increasing the acceptable damage number from 0.25 to 1 leads to a decrease in the probability of failure, for the same size of D50. This occurs, because a higher level of damage is considered as acceptable, thus making the failure criteria less restrictive. It was also found that, for S3Daccept = 1 the D50 could be reduced from 0.40 m to D50* = 0.25 m without increasing the probability of failure.
If a static scour protection is being designed, then it is recommended to use the static approach [3], rather than the dynamic one [4] with S3Daccept = 0.25. As an alternative, the traditional quantification of the wave-current-induced shear stress can be performed through [21,22], which leads to a statically stable design that can be seen as more conservative. These methodologies are very restrictive, as they do not allow for any movement, thus providing higher values of Pf. However, the dynamic criterion enables the reduction of D50 towards a dynamically stable protection and still holding an annual probability of failure that is in the order of 10−4 to 10−5, depending on the acceptable damage number.
The present work showed that reliability methodologies can provide useful insights on the safety associated to the several design choices and criteria adopted for scour protections. Moreover, a contribution is made on highlighting knowledge gaps, namely the definition of the acceptable probability of failure and the influence of the failure criteria, that need further assessment to move the reliability based design of scour protections towards the same mature level as in other fields of offshore engineering, for example, References [41,42,49].

Author Contributions

Authors that contributed in the conceptualization: T.F.-F., F.T.-P. and P.R.-S.; methodology: T.F.-F. and J.C.; formal analysis and validation: T.F.-F. and J.C., writing—original draft preparation: T.F.-F., F.T.-P. and P.R.-S.; writing—review and editing, T.F.-F.

Funding

This work is supported by the project POCI-01-0145-FEDER-032170 (ORACLE project), funded by the European Fund for Regional Development (FEDER), through the COMPETE2020, the Programa Operacional Competitividade e Internacionalização (POCI) and FCT/MCTES through national funds (PIDDAC).

Acknowledgments

T. Fazeres-Ferradosa acknowledges Francisco Fazeres (ULSAM) for the support to his research studies and for the enlightening discussions on survival and reliability analysis.

Conflicts of Interest

The authors declare no conflict of interest.

Nomenclature

#number of times [−]
Awave stroke [m]
airegression coefficients [−]
b0regression coefficient [−]
dwater depth [m]
D*dimensionless grain size [−]
D50median stone diameter [m]
D15stone diameter for which 15% is finer by weight [m]
D67.5stone diameter for which 67.5% is finer by weight [m]
D85stone diameter for which 85% is finer by weight [m]
Dn50nominal median stone diameter [m]
flimit state function [−]
fwwave friction factor [−]
gthe gravitational acceleration m/s2
Hssignificant wave height [m]
Iindicator function equal to 0 or 1 [−]
ksbottom roughness [m]
Nnumber of waves [waves]
nnumber of simulations [simulations]
Pfprobability of failure [−]
Pf0annual probability of failure [−]
sspecific density ratio [−]
S3Ddamage number [−]
S3Dacceptacceptable damage number [−]
S3Dmeasmeasured damage number [−]
S3Dpredpredicted damage number [−]
Twave period [s]
Tm-1,0Energy wave period [s]
Tpwave peak period [s]
Trreturn period [years]
Ucdepth-averaged current velocity [m/s]
Umwave orbital velocity [m/s]
UrUrsel number [−]
wsfall velocity of sediments [m/s]
Xvector of random variables [−]
αamplification factor [−]
γJONSWAP peak enhancement factor [−]
δwave boundary layer thickness [m]
θShields critical parameter [−]
ρsdensity of the sediments or rock material [kg/m3]
ρwdensity of water [kg/m3]
τccurrent induced shear-stress [N/m2]
τcrcritical shear-stress [N/m2]
τwwave induced shear-stress [N/m2]
τwccombined wave and current induced shear-stress [N/m2]
τwcmaxmaximum wave and current induced shear-stress [N/m2]

References

  1. Bhattacharya, S. Challenges in Design of Foundations for Offshore Wind Turbines. Eng. Technol. Ref. 2014, 1–9. [Google Scholar] [CrossRef]
  2. Matutano, C.; Negro, V.; López-Gutiérrez, J.-S.; Esteban, M.D. Scour prediction and scour protections in offshore wind farms. Renew. Energy 2013, 57, 358–365. [Google Scholar] [CrossRef] [Green Version]
  3. De Vos, L.; De Rouck, J.; Troch, P.; Frigaard, P. Empirical design of scour protections around monopile foundations. Coast. Eng. 2011, 58, 540–553. [Google Scholar] [CrossRef]
  4. De Vos, L.; De Rouck, J.; Troch, P.; Frigaard, P. Empirical design of scour protections around monopile foundations. Part 2: Dynamic approach. Coast. Eng. 2012, 60, 286–298. [Google Scholar] [CrossRef]
  5. De Vos, L. Optimisation of Scour Protection Design for Monopiles and Quantification of Wave Run-Up—Engineering the Influence of an Offshore Wind Turbine on Local Flow Conditions. Ph.D. Thesis, University of Ghent, Ghent, Belgium, 2008. [Google Scholar]
  6. Schoesitter, P.; Audenart, S.; Baelus, L.; Bolle, A.; Brown, A.; das Neves, L.; Fazeres-Ferradosa, T.; Haerens, P.; Taveira-Pinto, F.; Troch, P.; et al. Feasibility of a dynamically stable rock armour layer scour protection for offshore wind farms. In Proceedings of the International Conference on Ocean, Offshore and Artic Engineering, San Francisco, CA, USA, 8–13 June 2014. [Google Scholar]
  7. Whitehouse, R.; Brown, A.; Audenaert, S.; Bolle, A.; Schoesitter, P.; Haerens, P.; Baelus, L.; Troch, P.; das Neves, L.; Fazeres-Ferradosa, T.; et al. Optimising scour protection stability at offshore foundations. In Proceedings of the 7th International Conference on Scour and Erosion, Pearth, Australia, 2–4 December 2014. [Google Scholar]
  8. Fazeres-Ferradosa, T.; Taveira-Pinto, F.; Reis, M.T.; das Neves, L. Physical modelling of dynamic scour protections: Analysis of the Damage Number. Proc. Inst. Civ. Eng. Marit. Eng. 2018, 171, 11–24. [Google Scholar] [CrossRef]
  9. Fazeres-Ferradosa, T.; Taveira-Pinto, F.; Romão, X.; Vanem, E.; Reis, T.; das Neves, L. Probabilistic Design and Reliability Analysis of Scour Protections for Offshore Windfarms. Eng. Fail. Anal. 2018, 91, 291–305. [Google Scholar] [CrossRef]
  10. Muzzammil, M. A reliability-based assessment of bridge pier scour in non-uniform sediments. J. Hydraul. Res. 2009, 47, 372–380. [Google Scholar] [CrossRef]
  11. Briaud, J.; Gardoni, P.; Yao, C. Statistical, risk and reliability analyses of bridge scour. J. Geotech. Geoenvironmental Eng. 2014, 140, 1–10. [Google Scholar] [CrossRef]
  12. Fazeres-Ferradosa, T.; Taveira-Pinto, F.; Romão, X.; Reis, M.T.; Neves, L.D. Reliability assessment of offshore dynamic scour protections using copulas. Wind Eng. 2019, 43, 506–538. [Google Scholar] [CrossRef]
  13. Bai, Y.; Jing, W.-L. Chapter 34—Reliability of Ship Structures. In Marine Structural Design, 2nd ed.; Bai, Y., Jin, W., Eds.; Butterworth-Heinemann: Oxford, UK, 2016; pp. 627–644. [Google Scholar] [CrossRef]
  14. Clark, C.E.; Dupont, B. Reliability-based design optimization in offshore renewable energy systems. Renew. Sustain. Energy Rev. 2018, 97, 390–400. [Google Scholar] [CrossRef]
  15. Koç, M.L.; Balas, C.E. Reliability analysis of a rubble mound breakwater using the theory of fuzzy random variables. Appl. Ocean Res. 2013, 39, 83–88. [Google Scholar] [CrossRef]
  16. DMI. Horns Rev 3 Offshore Wind Farm—Metaocean; DMI—Danish Metereological Institute & Orbicon A/S: Copenhagen, Denmark, 2013. [Google Scholar]
  17. Fazeres-Ferradosa, T.; Taveira-Pinto, F.; Rosa-Santos, P.; Chambel, J. A review of reliability analysis of offshore scour protections. Proc. Inst. Civ. Eng. Marit. Eng. 2019, 172, 104–117. [Google Scholar] [CrossRef]
  18. Shields, A.F. Application of Similarity Principles and Turbulence Research to Bed-Load Movement; Mitteilungen der Preussischen Versuchsanstalt f€ur Wasserbau und Schiffbau: Berlin, Germany, 1936; Volume 26, pp. 5–24. [Google Scholar]
  19. Liu, Z. Sediment Transport; Aalborg Universitet: Aalborg, Denmark, 2001. [Google Scholar]
  20. Nielsen, P. Coastal Bottom Boundary Layers and Sediment Transport: Advanced Series on Ocean Engineering; World Scientific: Singapore, 1992; Volume 4. [Google Scholar]
  21. Fredsøe, J.; Deigaard, R. Mechanics of Coastal Sediment Transport—Advanced Series on Ocean Engineering; World Scientific: Singapore, 1992; Volume 3. [Google Scholar]
  22. Soulsby, R. Dynamics of Marine Sands: A Manual for Practical Applications; Thomas Telford: London, UK, 1997. [Google Scholar]
  23. Dixen, M.; Hatipoglu, F.; Sumer, B.M.; Fredsøe, J. Wave boundary layer over a stone-covered bed. Coast. Eng. 2008, 55, 1–20. [Google Scholar] [CrossRef]
  24. Wiberg, P.L.; Sherwood, C.R. Calculating wave-generated bottom orbital velocities from surface-wave parameters. Comput. Geosci. 2008, 34, 1243–1262. [Google Scholar] [CrossRef]
  25. Schendel, A.; Goseberg, N.; Schlurmann, T. Experimental study on the performance of coarse grain materials as scour protection. In Proceedings of the Coastal Engineering Proceedings—34th International Conference on Costal Engineering, Seoul, Korea, 15–20 June 2014. [Google Scholar]
  26. Schendel, A.; Goseberg, N.; Schlurmann, T. Erosion Stability of Wide-Graded Quarry-Stone Material under Unidirectional Current. J. Waterw. Port Coast. Ocean Eng. 2016, 142, 1–19. [Google Scholar] [CrossRef]
  27. Hoffmans, G.; Verheij, H. Scour Manual; CRC Press: Rotterdam, The Netherlands, 1997. [Google Scholar]
  28. Whitehouse, R. Scour at Marine Structures: A Manual for Practical Applications; Institution of Civil Engineers: London, UK, 1998. [Google Scholar]
  29. Den Boon, J.H.; Sutherland, J.; Whitehouse, R.; Soulsby, R.; Stam, C.J.M.; Verhoeven, K.; Høgedal, M.; Hald, T. Scour behaviour and scour protection for monopile foundations of offshore wind turbines. In Proceedings of the European Wind Energy Conference & Exhibition, London, UK, 22–25 November 2004. [Google Scholar]
  30. Loosveldt, N.; Vannieuwenhuyse, K. Experimental Validation of Empirical Design of a Scour Protection around Monopiles under Combined Wave and Current Loading. Master’s Thesis, Ghent University, Ghent, Belgium, 2012. [Google Scholar]
  31. Fajardo, F.; Perez, J.; Alsina, M.; Marques, J.R. Simulation Methods for Reliability and Availability of Complex Systems; Springer: New York, NY, USA, 2010. [Google Scholar]
  32. Kristensen, H.; Gurieff, H.L.B.; Steer, J.; Richardt, N. Horns Rev 3 Results Report—Geo Investigation; Rambøll og Energinet: Copenhagen, Denmark, 2013. [Google Scholar]
  33. Energinet. Horns Rev 3 Offshore Wind Farm—Marine Mammals—Technical Report 043; Energinet, Orbicon A/S, BioConsult SH GmbH & Co.KG: Copenhagen, Denmark, 2014. [Google Scholar]
  34. Vanem, E. Joint statistical models for significant wave height and wave period in a changing climate. Mar. Struct. 2016, 49, 180–205. [Google Scholar] [CrossRef]
  35. Ferreira, J.; Soares, C.G. Modelling bivariate distributions of significant wave height and mean wave period. Appl. Ocean Res. 2002, 24, 31–45. [Google Scholar] [CrossRef]
  36. Wist, H.T.; Myrhaug, D.; Rue, H. Statistical properties of successive wave heights and successive wave periods. Appl. Ocean Res. 2004, 26, 114–136. [Google Scholar] [CrossRef] [Green Version]
  37. Muraleedharan, G.; Lucas, C.; Martins, D.; Soares, C.G.; Kurup, P. On the distribution of significant wave height and associated peak periods. Coast. Eng. 2015, 103, 42–51. [Google Scholar] [CrossRef]
  38. Venables, W.; Ripley, B. Modern Applied Statistics with S, 4th ed.; Springer: New York, NY, USA, 2002. [Google Scholar]
  39. Vattenfall. 2017. Available online: https://corporate.vattenfall.dk/globalassets/danmark/vores_vindmoller/horns_rev_3/hr3_nyhedsbrev_01.pdf (accessed on 1 November 2018).
  40. CIRIA; CUR; CETMEF. The Rock Manual: The Use of Rock in Hydraulic Engineering, 2nd ed.; CIRIA: London, UK, 2007. [Google Scholar]
  41. Rendón-Conde, C.; Heredia-Zavoni, E. Reliability assessment of mooring lines for floating structures considering statistical parameter uncertainties. Appl. Ocean Res. 2015, 52, 295–308. [Google Scholar] [CrossRef]
  42. Montes-Iturrizaga, R.; Heredia-Zavoni, E. Reliability analysis of mooring lines using copulas to model statistical dependence of environmental variables. Appl. Ocean Res. 2016, 59, 564–576. [Google Scholar] [CrossRef]
  43. Saruwatari, A.; Yoneko, Y.; Tajima, Y. Effects of wave, tidal current and ocean current coexistance on the wave and current predictions in the Tsugaru Strait. In Proceedings of the Coastal Engineering Proceedings, Seoul, Korea, 15–20 June 2014. [Google Scholar]
  44. Gidwani, R. Deriving Transition Probabilities for Decision Models. March 2016. Available online: https://www.hsrd.research.va.gov/for_researchers/cyber_seminars/archives/1096-notes.pdf (accessed on 12 July 2018).
  45. DNV. Classification Notes. N30.6—Structural Reliability Analysis of Marine Structures; Det Norske Veritas: Oslo, Norway, 1992. [Google Scholar]
  46. DNVGL. DNVGL—ST-0262—Lifetime Extension of Wind Turbines; Det Norske Veritas AS: Oslo, Norway, 2017. [Google Scholar]
  47. Mase, H.; Yasuda, T.; Reis, M.T.; Karunarathna, H.; Yang, J. Stability formula and failure probability analysis of wave-dissipating blocks considering wave breaking. J. Ocean Eng. Mar. Energy. 2015, 1, 45–54. [Google Scholar] [CrossRef]
  48. Galiatsatou, P.; Makris, C. Optimized Reliability Based Upgrading of Rubble Mound Breakwaters in a Changing Climate. J. Mar. Sci. Eng. 2018, 6, 92. [Google Scholar] [CrossRef]
  49. Weller, S.; Thies, P.; Gordelier, T.; Johanning, L. Reducing Reliability Uncertainties for Marine Renewable Energy. J. Mar. Sci. Eng. 2015, 3, 1349–1361. [Google Scholar] [CrossRef] [Green Version]
Figure 1. Wave induced shear-stress for different formulations of the wave friction factor, as function of the stone mean diameter D50 (Hs = 6.5 m, Tp = 11.2 s). Methodology adapted from [20,21,22,23].
Jmse 07 00400 g001
Figure 2. Critical shear-stress computed with D67.5 and θcr = 0.035 instead D50 and θcr = 0.056.
Jmse 07 00400 g002
Figure 3. Random 10,000 pairs of Hs and Tp and hindcast data for Horns Rev 3 offshore wind farm.
Jmse 07 00400 g003
Figure 4. Probability of failure depending on the wave friction factor used to obtain τw and τwc. Methodology adapted from [21,22].
Jmse 07 00400 g004
Figure 5. Probability of failure for different values of the acceptable damage number.
Jmse 07 00400 g005
Figure 6. Probability of failure depending on the number of waves used to the damage number.
Jmse 07 00400 g006
Table 1. Probabilities of failure according to different formulations for τwc and with different α (n = 200,000). Methodology adapted from [3,21,22].
αTraditional Approach [21]Traditional Approach [22]Static Approach [3]
fw [21]fw [22]
23 × 10−41 × 10−59 × 10−42 × 10−4
31 × 10−22 × 10−3
43 × 10−27 × 10−3
Table 2. Annual probabilities of failure according to different formulations for τwc and with different α (n = 200,000). Methodology adapted from [3,21,22].
αTraditional Approach [21]Traditional Approach [22]Static Approach [3]
fw [21]fw [22]
22.9 × 10−51 × 10−68.7 × 10−51.9 × 10−5
39.7 × 10−41.9 × 10−4
42.9 × 10−36 × 10−4
Table 3. Stabilized probability of failure and annual probabilities of failure for the dynamic approach.
S3DacceptPfPf0
0.255.2 × 10−34.8 × 10⁻⁴
14.2 × 10−44.07 × 10−5