Article

Energy and Exergy Analyses of Forced Draft Fan for Marine Steam Propulsion System during Load Change

Faculty of Engineering, University of Rijeka, Vukovarska 58, 51000 Rijeka, Croatia
*
Author to whom correspondence should be addressed.
J. Mar. Sci. Eng. 2019, 7(11), 381; https://doi.org/10.3390/jmse7110381
Submission received: 25 September 2019 / Revised: 20 October 2019 / Accepted: 25 October 2019 / Published: 28 October 2019

Abstract

:
A forced draft fan, used for the supply of combustion air into the steam generator of the conventional liquefied natural gas (LNG) carrier was analyzed from the aspect of energy and exergy. The power delivered from the induction motor to the fan was calculated using the manufacturer’s data. The most significant impact on the fan energy power losses is from the air temperature difference between the fan outlet and inlet. The fan energy power losses are inversely proportional to the fan energy efficiency, and the values are between 19.9% and 63.4%, for the entire range of observed steam system loads. The fan exergy destruction depends primarily on the driving power and on the air mass flow rate. At higher loads, an important influence on the fan exergy destruction is from the air pressure at the fan outlet. The exergy efficiency change of the analyzed fan, for the range of observed steam system loads, is directly proportional to the rate of change in the air mass flow, whereas the obtained values of exergy efficiency are between 5.10% and 53.93%. The impact of ambient temperature on the fan exergy destruction and exergy efficiency exhibits is different than in most other steam system components. A change in ambient temperature of 10 °C causes a change in the exergy efficiency of the forced draft fan less than 0.5% in the entire range of observed steam loads.

Graphical Abstract

1. Introduction

For many years, fans are indispensable devices in the energy processing industry and in power plants. In addition to other uses, fans are also used for the supply of combustion air into steam generators, which is also the main purpose of the fan analyzed in this paper. Without a proper and timely supply of air, the steam generator operation would be at least difficult or even impossible. In general, fans can be divided into two main types: axial fans and radial (centrifugal) fans [1,2]. Both fan types were investigated from various aspects by a large number of scientists and experts.
For an axial flow fan, Ye et al. [3] provided a numerical simulation of the pressure pulsation and transient flow field using a computational fluid dynamics (CFD) analysis. The approximate entropy and the sample entropy models can be used to identify the abnormal blade deviation at all observed operating points.
The influence of the blade installation angle for windward axial fans on the performance of an air-cooled power plant was investigated by He et al. [4,5]. The blade installation angle of the axial fans is modified off the design case to obtain a new power plant performance, which is compared to the design value at a prevailing wind angle and five different designated wind speeds. It was found that the alternation of the blade installation angle for the windward fans changes the performance of the fan array. The net power of the power plant and the thermal efficiency of the closed Rankine cycle are influenced by the alternation of the blade angle in axial fans.
Energy dissipation in the blade tip region of an axial fan was investigated by Bizjan et al. [6]. The authors analyzed two different rotor blade tip designs: a standard design with straight blade tips and a modified design with swept-back tip winglets. The comparison of integral sound parameters indicated a significant noise level reduction for the modified blade tip design. The analysis presented a novel experimental method based on simultaneous measurements of local flow velocity and pressure.
Nowadays, turbofan engines are commonly used for the propulsion of passenger aircrafts [7]. The fans in these engines are axial flow fans driven by gas turbine [8]. In order to reduce the specific fuel consumption of these engines, Huang et al. [9] and Lu et al. [10] presented upgrades with air-driven axial flow fans by increasing the bypass ratio.
The widespread use of centrifugal (radial) fans in engineering has resulted in many different geometrical designs in order to meet the application requirements [11]. The application ranges from large scale industrial dryers and air conditioning units to smaller scale blowers for augmenting heat transfer in portable electronics.
An integrated performance analysis for a backward-inclined centrifugal fan was presented by Lin and Tsai [12]. Their analysis proposed two modification alternatives based on flow visualization at each operating point, after having verified the successful enhancement of fan performance via numerical calculation.
The effect of the axial gap between the inlet nozzle and impeller on efficiency and flow pattern in centrifugal fans was investigated by Gholamian et al. [13].
Chunxi et al. [14] numerically and experimentally analyzed the performance of a centrifugal fan with an enlarged impeller. The authors made comparisons for the fan operating with the original impeller and with two larger impellers, where the outlet diameter increased by 5% and 10%. The internal characteristics were obtained by numerical simulation, which indicated a larger volute loss in the fan with larger impeller. The experimental results showed that the flow rate, total pressure rise, shaft power and sound pressure level increased, while the efficiency decreased in the fan with a larger impeller.
Fernández Oro et al. [15] presented a numerical methodology for the assessment of relative and absolute deterministic flow structures in the analysis of impeller-tongue interactions in centrifugal fans. The studied squirrel cage fan is a small centrifugal fan with a twin impeller configuration. This type of squirrel cage fan is often used as blowers in automobile applications or as small-scale industrial equipment.
An experimental and numerical study of a small forward–curved centrifugal fan was presented by Lin and Huang [16], while a similar investigation of a miniature centrifugal fan was presented by Tsai and Wu [17]. Both investigations were based on the results of the experimental setup and numerical analysis. The results showed the capabilities of the design, analysis, manufacturing and measurement of small-scale centrifugal fans.
The centrifugal fan based on a flap-adjustment has been investigated by Chen et al. [18] through theoretical, experimental and finite element methods. To obtain a centrifugal fan with improved performance, the authors carried out a comparative analysis of aerodynamic performances which included an adjusted blade angle, total pressure, efficiency, system-efficiency, adjustment-efficiency and the energy-saving rate.
Recently, researchers have been intensively involved in studying and analyzing the noise produced by various types of fans, along with the means for noise reduction.
Paramasivam et al. [19] presented the tonal noise prediction in a small high-speed centrifugal fan with experimental validation. A CFD analysis was performed using a 3-D detached eddy simulation (DES) to compute the unsteady flow field in the fan. The calculated time history of the surface data from the CFD is used in the Ffowcs Williams-Hawkings (FW-H) solver to predict the far field noise levels.
The direct noise prediction and control of a large low-speed radial fan was presented by Sanjose and Moreau [20]. By adding a thin filter on the bellmouth removes the large turbulent structures ingested by the fan and improves the flow-field uniformity at the fan inlet along with a significant noise reduction and occurrence of additional pressure losses.
The unsteady fan flow field, its characteristics and influences on noise prediction and noise generation was investigated by Trabelsi et al. [21] for an axial fan. The same fan flow field and its influences on noise were investigated by Wolfram and Carolus [22] and Zhang et al. [23] for a radial (centrifugal) fan.
The experimental study of noise reduction for an industrial forward-curved blade centrifugal fan was presented by Datong et al. [24]. The aim of different experimental tests was to validate whether the effects of different modifications to fan performance and noise are additive as well as to find a good impeller-volute matching to reduce the centrifugal fan noise without the loss of performance. The experimental results showed that a good coupled modification not only could reduce the fan noise, but could also advance the fan performance and extend its operating range.
Zhang et al. [25] investigated vane sweep effects on fan interaction noise. For fan broadband noise, the backward sweep succeeds in reducing the sound power level for a wide range of frequencies. Due to the statistical average effect, the efficiency relies much on the shape of the turbulence spectrum.
A numerical optimization with the aim of reducing vibration noise of a centrifugal fan volute was performed by Zhang et al. [26]. The results showed that the proposed vibration noise optimization method can effectively reduce vibration noise in the fan and a maximum noise reduction value of 7.3 dB was obtained.
Several authors investigated the causes which lead to the failure of fans and its components. Nurbanasari et al. [27] presented a damage analysis of the forced draft fan blade in a coal fired power plant. There were two main locations of blade damage, at the root of the blade and at the third of the blade height. A visual inspection, metallographic analysis, chemical composition and hardness tests were carried to find the exact cause of the failure. The failure at the third of the blade height is due to external particles colliding on the leading edge of the blades, which causes erosion and a notch. The notch acted as an initial crack. The failure at the root of the blade was caused by broken fragments of other damaged blades.
Trebuna et al. [28] analyzed the causes of radial fan failure. The numerical and experimental methods were used for identifying the reasons for fan failure. The authors analyzed residual stresses in the rotating wheel of the fan and performed measurements of vibration diagnostic parameters in running fans.
Many fans, as the one analyzed in this study, are driven by induction motors. Likewise, in power plants, fans driven by induction motors are also used for air supply systems of buildings and are responsible for significant power consumption [29]. A detailed CFD analysis of the fan electrical drive was presented by Ding et al. [30].
Large scale fans are irreplaceable components in the energy processing industry and in power plants. It is therefore necessary to analyze them properly in order to understand the optimal operating parameters both for fans as single components and for entire plants.
Viorel-Mihai and Ioan [31] analyzed the vibrations in the flue gases exhaust fan of a cogeneration power plant. Comparing the measured vibrations to those obtained by a mathematical model, they revealed a hidden connection near one of the cassettes with coil springs. This hidden connection, which was unintentionally created during cassettes mounting, was responsible for a mechanical asymmetry.
Wang et al. [32] analyzed a power-saving control strategy for reducing the total pressure in the primary air fan of a coal-fired power plant. The proposed power-saving control strategy was applied to a 1000 MW commercial power plant. The industrial-scale experiments demonstrated that the power consumption of the primary air fan reduced by as much as 465 kW for a load of 500 MW, representing a fan power reduction of 15% relative to the conventional control strategy.
Wang et al. [33] investigated ash fouling on the blades of an induced fan in a 330 MW coal-fired power plant with ultra-low pollutants emission. Sulfates enrichment and high humidity in flue gases were two key factors that gave rise to the formation of massive fouling deposits on the fan blades. The accurate monitoring of ammonia concentrations at the outlet of the selective catalytic reduction (SCR) reactor and the adequate design of the temperature drop of flue gases in the low-temperature economizer should be carried out in coal-fired power plants with an ultra-low pollutant emission.
While performing energy and exergy analyses of power plants, a small number of authors presented an analysis of fans as integral components of power plants. This kind of analysis, not only for fans, but also for the other plant components is usually presented on the highest plant load, and rarely at partial loads [34]. In power plants, fans are used for different tasks. Therefore, their dimensions, driving power and operating parameters can vary greatly.
One of the few papers in which the exergy analysis of fans is studied along with other power plant components is authored by Uysal et al. [35]. In the observed power plant, two fans were used for the supply of combustion air to the steam generator. The authors presented exergy destruction and exergy efficiencies of both fans for the highest power plant load. The exergy efficiency of Fan1 was 63.16%, while the used power was 1360 kW. At the same highest plant load, the exergy efficiency of Fan2 was 75.64%, while the used power was 1320 kW.
The above-referenced research focused mainly on the analysis of fan geometry and design, air flow characteristics, fan vibrations, noise and fouling as well as on the possibilities for the improvement of fan performance and efficiency. However, the analysis of fan performance, including energy and exergy efficiency, especially under fan load variations, has been neglected in the literature. This paper presents an advancement over the existing research since it brings an analysis of the energy and exergy performance and efficiency of a forced draft fan under load variations in a marine steam propulsion system. Furthermore, this paper investigates the factors impacting the fan performance, such as the air temperature difference between the fan inlet and outlet, the air mass flow rate and the ambient temperature. This paper presents a method for determining fan exergy and energy efficiencies by calculating specific air enthalpies and entropies from the measurements of fan temperatures and pressures and obtaining the fan power from the measurements of induction motor currents, all for a wide range of marine steam propulsion loads. The observed steam propulsion system operates on a conventional liquefied natural gas (LNG) carrier and the observed forced draft fan is used for the supply of combustion air to the steam generator.

2. Energy and Exergy Analyses

Energy and exergy analyses are widely used methods for the investigation of processes [36,37], power plants [38,39,40], industrial plants [41,42] or their components. [43,44].
In marine applications, these analyses can be used for the investigation of the entire ship energy systems, with examples described in [45] for a chemical tanker or in [46] for a cruise ship, both with diesel-engine propulsion.
In the propulsion of LNG carriers, steam systems are still the dominant ones. Energy and exergy analyses can be used for the investigation of the entire systems [47] or several components of those systems [48,49], for which operation dynamics must comply with various requirements.
Along with the above mentioned, energy and exergy analyses can be used in the research of waste heat recovery systems in marine plants, as presented by Koroglu and Sogut [50], or for the investigation of ocean thermal energy conversion systems along with the operation dynamics, as performed by Ikegami et al. [51].
The specificity of energy and exergy analyses of a system or component is that no data or details about the component inner structure are needed (black box analyses). The only necessary data for the analysis are the energy or exergy inputs and outputs, which are composed of the inlet and outlet fluid streams and the mechanical work generated or consumed by the analyzed component.
The biggest advantage of energy and exergy analyses is that the necessary calculations are fast. Moreover, complex components of power plants or systems can be easily analyzed, improved and tracked in real-time.
The biggest disadvantage of the analyses is the inability to inspect the internal structure of the observed component and secondly, the analyses need measured data during the exploitation, which is not always easily available, especially for new plants and systems with protected proprietary data.

3. Specifications and Operating Characteristics

The analyzed forced draft fan is driven by an induction motor and used in the marine steam propulsion system of a LNG carrier for combustion air supply to the steam generator [52]. The fan is a radial (centrifugal) type, with inlet vanes for the control of the air mass flow rate. The fan cross-section along with the connections to the induction motor is presented in Figure 1. The main parts of the analyzed forced draft fan, along with the used materials are presented in Figure 1. The operating parameters and characteristics of the forced draft fan are presented in Table 1.
The forced draft fan is driven by an induction motor with a squirrel cage rotor. A necessary input parameter of the forced draft fan energy and exergy analyses is the power of the induction motor, which is directly distributed to the forced draft fan. The power is calculated from the measurements of an alternating current in the induction motor, for the entire range of observed steam system loads. The losses in the power transmission from the induction motor to the forced draft fan (losses in the coupling, element 14 from Figure 1 and losses in the roller bearing, element 9 from Figure 1) are neglected. The main operating characteristics of the forced draft fan induction motor are presented in Table 2.

4. Mathematical Description and Equations

4.1. General Equations for Energy and Exergy Analyses

Compared to the exergy analysis, the energy analysis has a different origin in the definition since it is defined according to the first law of thermodynamics [53,54]. For any control volume in the steady state, with no leakages of the mass flow rate, the standard mass balance equation is [55]:
i = 1 n ( m ˙ i ) IN = i = 1 k ( m ˙ i ) OUT
while the overall balance of energy is defined, according to [56,57], as:
{ Q ˙ + P + i = 1 n [ m ˙ i · ( h i + c i 2 2 + g · z i ) ] } IN = { Q ˙ + P + i = 1 k [ m ˙ i · ( h i + c i 2 2 + g · z i ) ] } OUT
where (n) is the total number of fluid flow streams which enters into the observed control volume, while (k) is the total number of fluid flow streams which exits the observed control volume. In Equation (2), the potential and kinetic energies are generally disregarded, because their influences on the overall process are small [58]. Therefore, the overall energy balance equation for a control volume with disregarded potential and kinetic energy is [59]:
Q ˙ IN + P IN + i = 1 n ( m ˙ i · h i ) IN = Q ˙ OUT + P OUT + i = 1 k ( m ˙ i · h i ) OUT
The energy power of a fluid flow stream can be defined by knowing the fluid stream mass flow rate as well as the fluid stream pressure and temperature (necessary for calculation of fluid stream specific enthalpy). Therefore, the energy power of a fluid flow stream is [60]:
E ˙ en , i = m ˙ i · h i
The definition of energy efficiency depends on the type and characteristics of the observed control volume, system or plant [61]. For general use, without knowledge about details of the control volume, system or plant, the energy efficiency can be defined as in [62], by using the equation:
η en = Cumulative   energy output Cumulative energy input
The definition of exergy analysis is derived from the second law of thermodynamics [63], which means that unlike the energy analysis-exergy analysis is dependable on the ambient state (temperature and pressure) in which the observed control volume, process or plant operates [64]. This exergy analysis definition allows that any control volume, system or plant can be investigated for changing ambient conditions [65].
The overall exergy balance equation, valid for any control volume, system or plant can be found in the literature [66,67,68,69] and is written as:
X ˙ heat + i = 1 n ( m ˙ i · ε i ) IN = P + i = 1 k ( m ˙ i · ε i ) OUT + E ˙ ex , D
The heat exergy transfer at the temperature T is defined according to [70,71] as:
X ˙ heat = ( 1 T 0 T ) · Q ˙
The exergy power of a fluid flow stream is defined similarly as the energy power of the fluid flow stream, from the fluid stream mass flow rate and the fluid stream pressure and temperature. These are necessary for the calculation of the stream specific enthalpy and of the stream specific exergy. In the calculation of the stream specific exergy, the ambient parameters (pressure and temperature) in which the fluid flow stream operates must be known. The exergy power of the fluid flow stream is defined according to [72,73] as:
E ˙ ex , i = m ˙ i · ε i
where the definition of specific exergy can be found in [74,75] and is expressed by the equation:
ε i = ( h i h 0 ) T 0 · ( s i s 0 )
The general definition of exergy efficiency for a control volume, system or a plant can be found in [76] and is expressed by the equation:
η ex = Cumulative   exergy output Cumulative   exergy input
These general equations along with energy and exergy balances are used for the analysis of the forced draft fan.

4.2. Energy And Exergy Analyses of The Forced Draft Fan

For the analyzed forced draft fan, all the inputs and outputs are presented in Figure 2. The inputs are the electrical drive power and the air at the fan inlet (marked in Figure 2 with number 1), while the output is only one—the air at the fan outlet (marked in Figure 2 with number 2). The air specific enthalpies and specific entropies were calculated from the measured pressures and temperatures at the forced draft fan inlet and outlet by NIST REFPROP 9.0 software (National Institute of Standards and Technology-U.S. Department of Commerce, Gaithersburg, MD, USA) [77].
The air mass flow rate balance (Equation (11)) as well as the energy and exergy balances of the forced draft fan (Table 3) are defined according to the nomenclature from Figure 2.
Air mass flow rate balance:
m ˙ 1 = m ˙ 2   ( no   leakage   occurs )
The exergy analysis of the forced draft fan (or any control volume) requires a definition of the ambient state, which is irrelevant for the energy analysis. The ambient state in the present analysis (air pressure and temperature outside the engine room) is a pressure of 0.1 MPa (1 bar) and a temperature of 25 °C (298.15 K).
The definition of the ambient state must be explained in detail. First of all, several researchers proposed the above definition of the ambient state [81,82,83]. Moreover, this definition of the ambient state results with a certain temperature difference between the engine room air and ambient air (due to the heat from machinery operation). This temperature difference causes that the specific exergy of the air inside the engine room (at the fan inlet − ε 1 ) is not zero, which means that the engine room air is a part of the fan exergy power input (Equation (16)). The specific exergy of the engine room air ( ε 1 ) is equal to zero only when the pressure and temperature of that air are equal to the ambient state (according to the specific exergy definition, Equation (9)). In that case, the fan exergy power input (Equation (16)) would include only the electrical drive power.
The exergy analysis of the forced draft fan could also be performed by defining the ambient state as identical to the state of the engine room air (at the fan inlet) for each observed steam system load. This definition would result with a fan exergy power input equal to the electrical drive power only since the specific exergy of the engine room air ( ε 1 ) would be zero. In other words, the exergy power of the air flow stream at the fan inlet would be neglected. Therefore, this definition of the ambient state is avoided.

4.3. Shaft Power Calculation

The shaft power produced by the alternating current (AC) electrical motor is defined by the equation [84]:
P = η em · U · I · P F · 3 1000
where the shaft power P is obtained in (kW). The root-mean-square (RMS) value of the induction motor stator voltage is constant and equal to U = 440 V. The induction motor efficiency has a low variance relative to the load. These variations are not taken into account during a power calculation, and the produced power is calculated with an average efficiency of ηem = 96%.
PF is the power factor of the induction motor. The change in the power factor is given by the induction motor manufacturer, as listed in Table 2. The analyzed induction motor (product code: 3GCA 312 510-ADA, manufacturer: ABB) [52] has only three power factor values with regard to the induction motor stator current. These three values of a power factor are insufficient for the calculation of the power factor in the entire operating range. Therefore, a second-order polynomial is derived (power factor in relation to stator current) for the observed induction motor, which approximates the values in the entire operating range (Figure 3). The derived polynomial is:
P F = 7.6947 · 10 6 · I 2 + 4.8030163 · 10 3 · I + 9.27393044 · 10 2
where I is the RMS value of the induction motor stator current (A).

5. Forced Draft Fan-Measurement Equipment and Data

The measurement data for the required operating parameters (pressures, temperatures and mass flow rates) for the air flow streams in the forced draft fan are presented in Table 4 relative to the main propulsion propeller speed. The main propulsion propeller speed is proportional to the system load: A higher propulsion propeller speed indicates a higher system load and vice versa. The analysis of the forced draft fan is presented in relation to the main propulsion propeller speed as the intention was to observe the fan operation dynamics during load variations in the marine propulsion system.
The majority of the measurement data were obtained using the existing equipment, which was mounted on the forced draft fan inlet and outlet. This measurement equipment is a constituent part of the control and regulation system inside the marine steam propulsion power plant. The RMS value for the induction motor stator current was measured with an independent ammeter for all of the observed loads. The independent ammeter is the only measurement device that is not a standard part of the control and regulation system. The specifications of the used measurement equipment are presented in Appendix A, at the end of the paper.
The only variable of the induction motor that needs to be measured during the observed operating range is the RMS value for the induction motor current. The results of those measurements, along with the calculated power factors for all of the observed propulsion propeller speeds, are presented in Table 5.
The specific enthalpies and specific entropies of air at the fan inlet and outlet are calculated by using the measured values of pressure and temperature. The NIST REFPROP software offers several possibilities for the calculation of air properties. In this study, air was selected as a mixture of nitrogen, oxygen and argon. The NIST REFPROP software calculated all the air properties from two known variables (pressure and temperature in this case). The main properties of air necessary for the energy and exergy analyses of the forced draft fan are presented in Table 6.

6. Results and Discussion

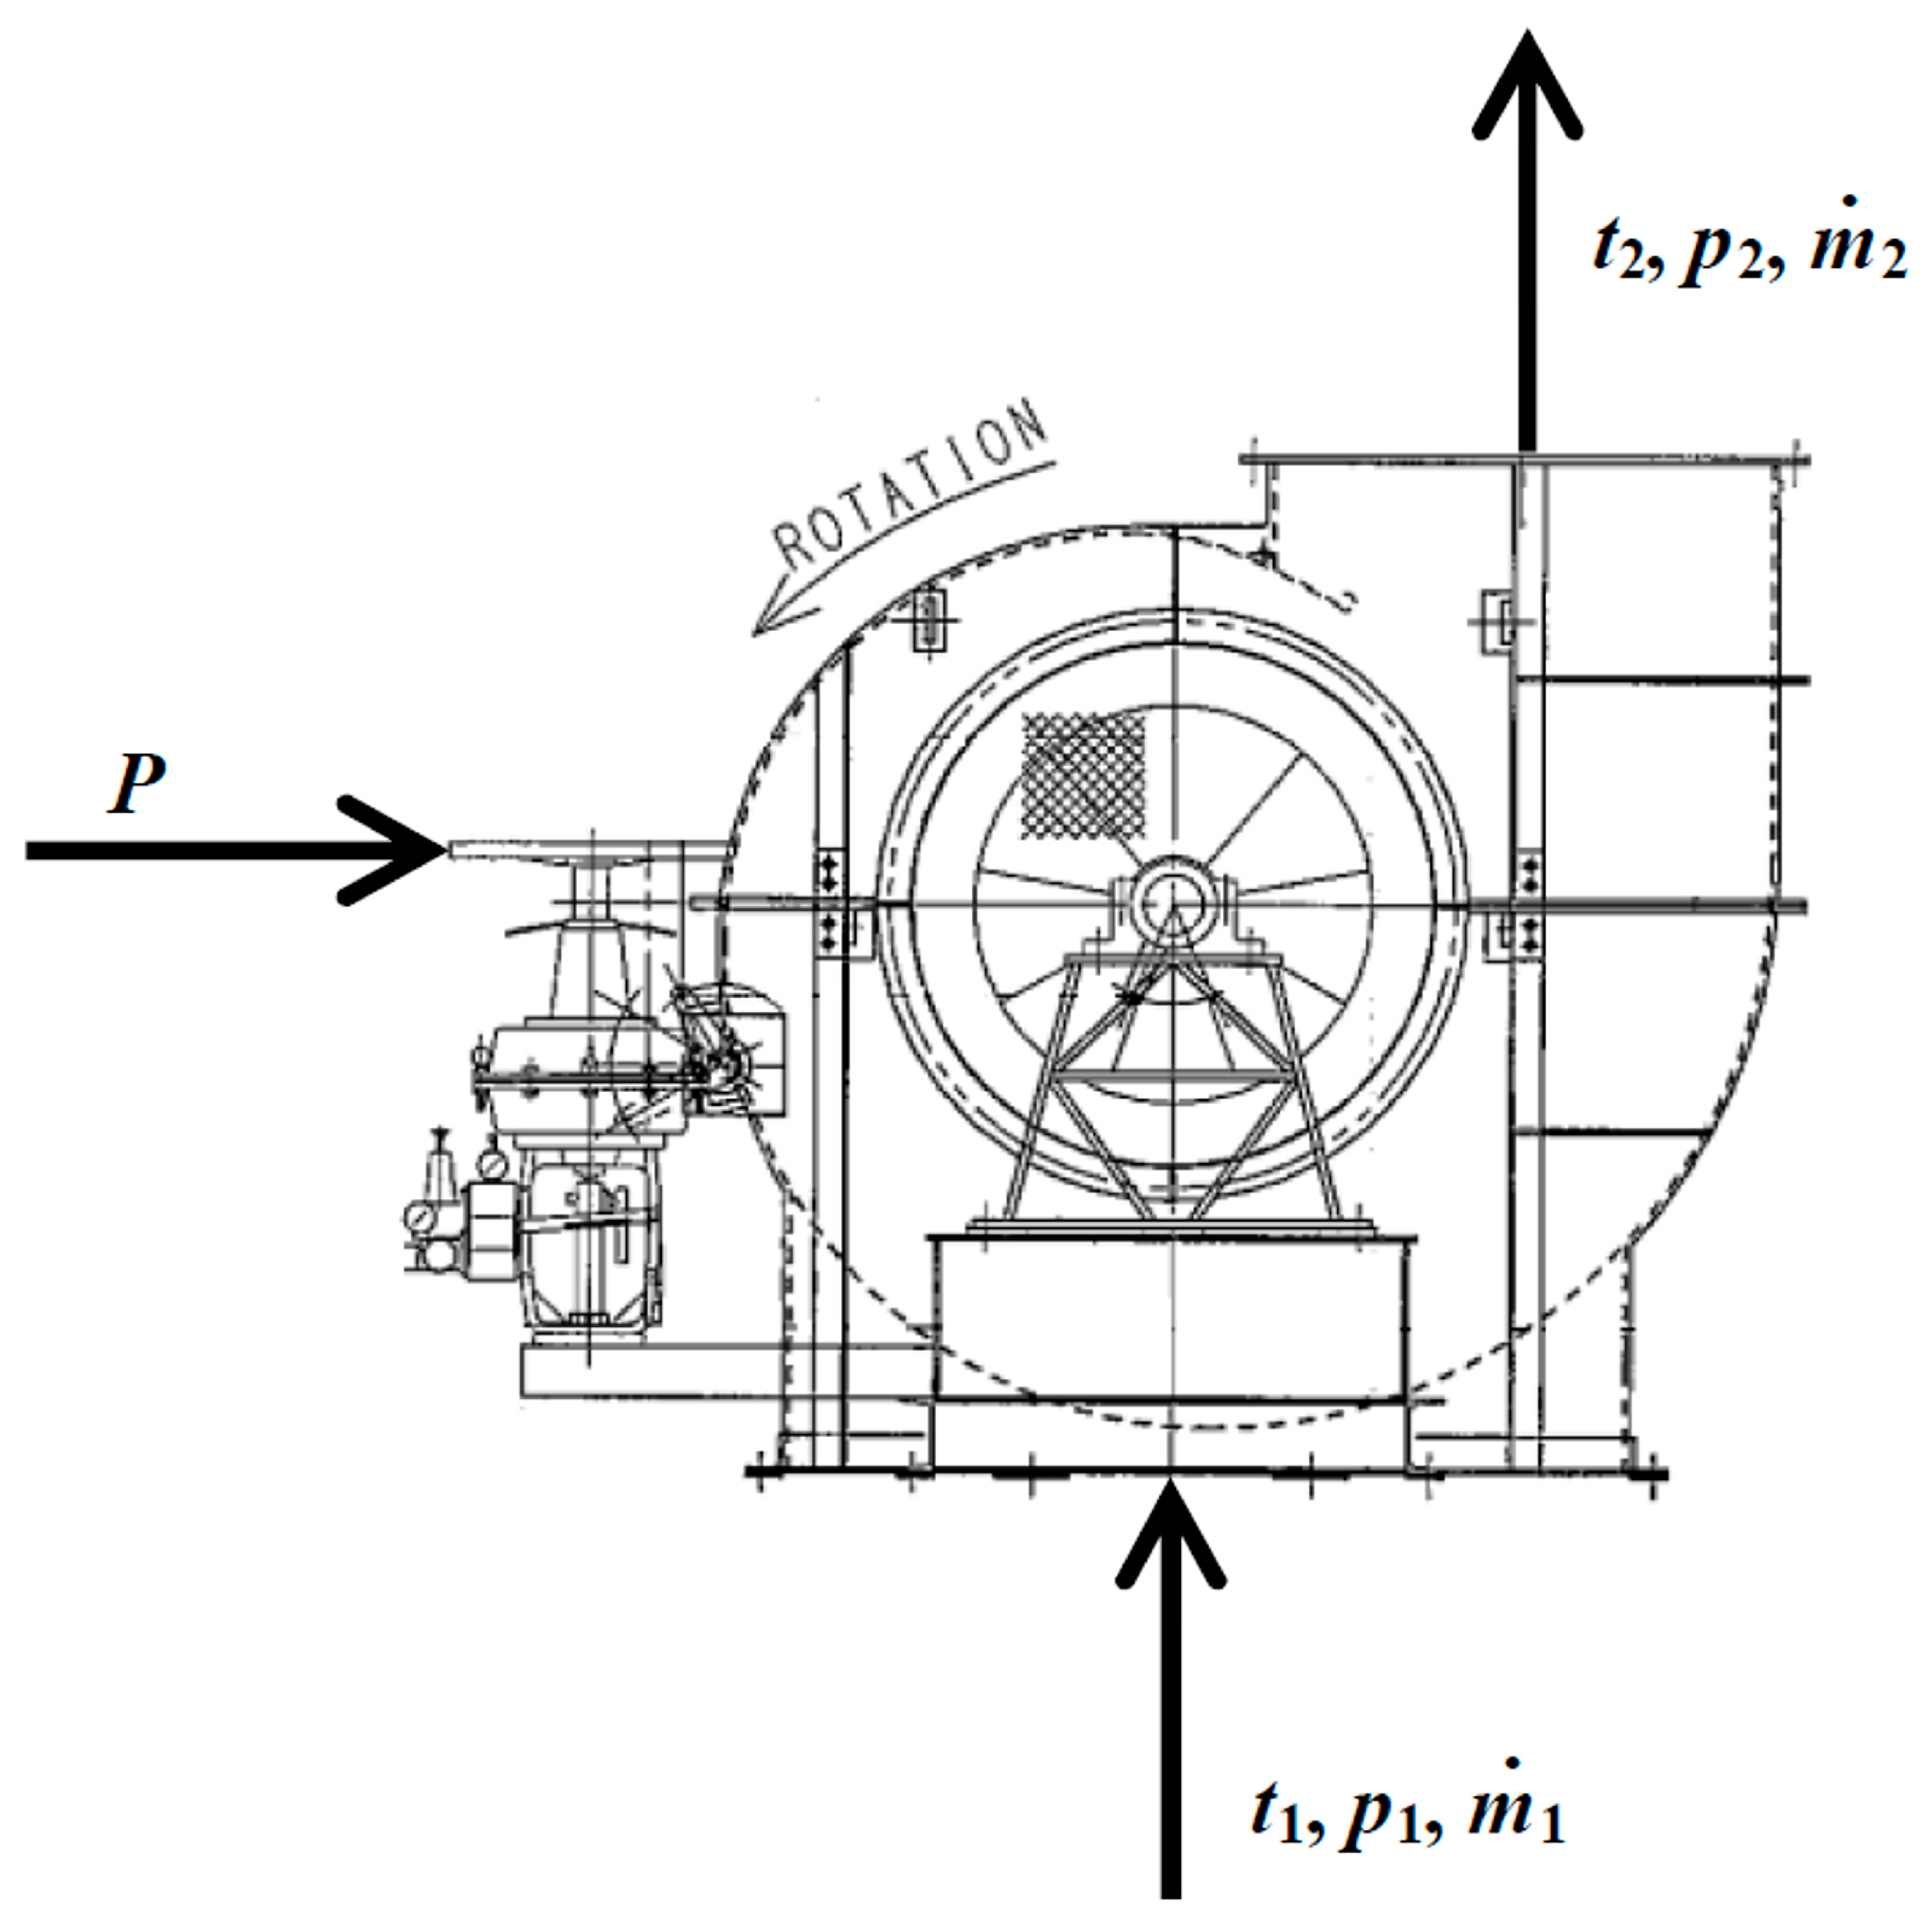
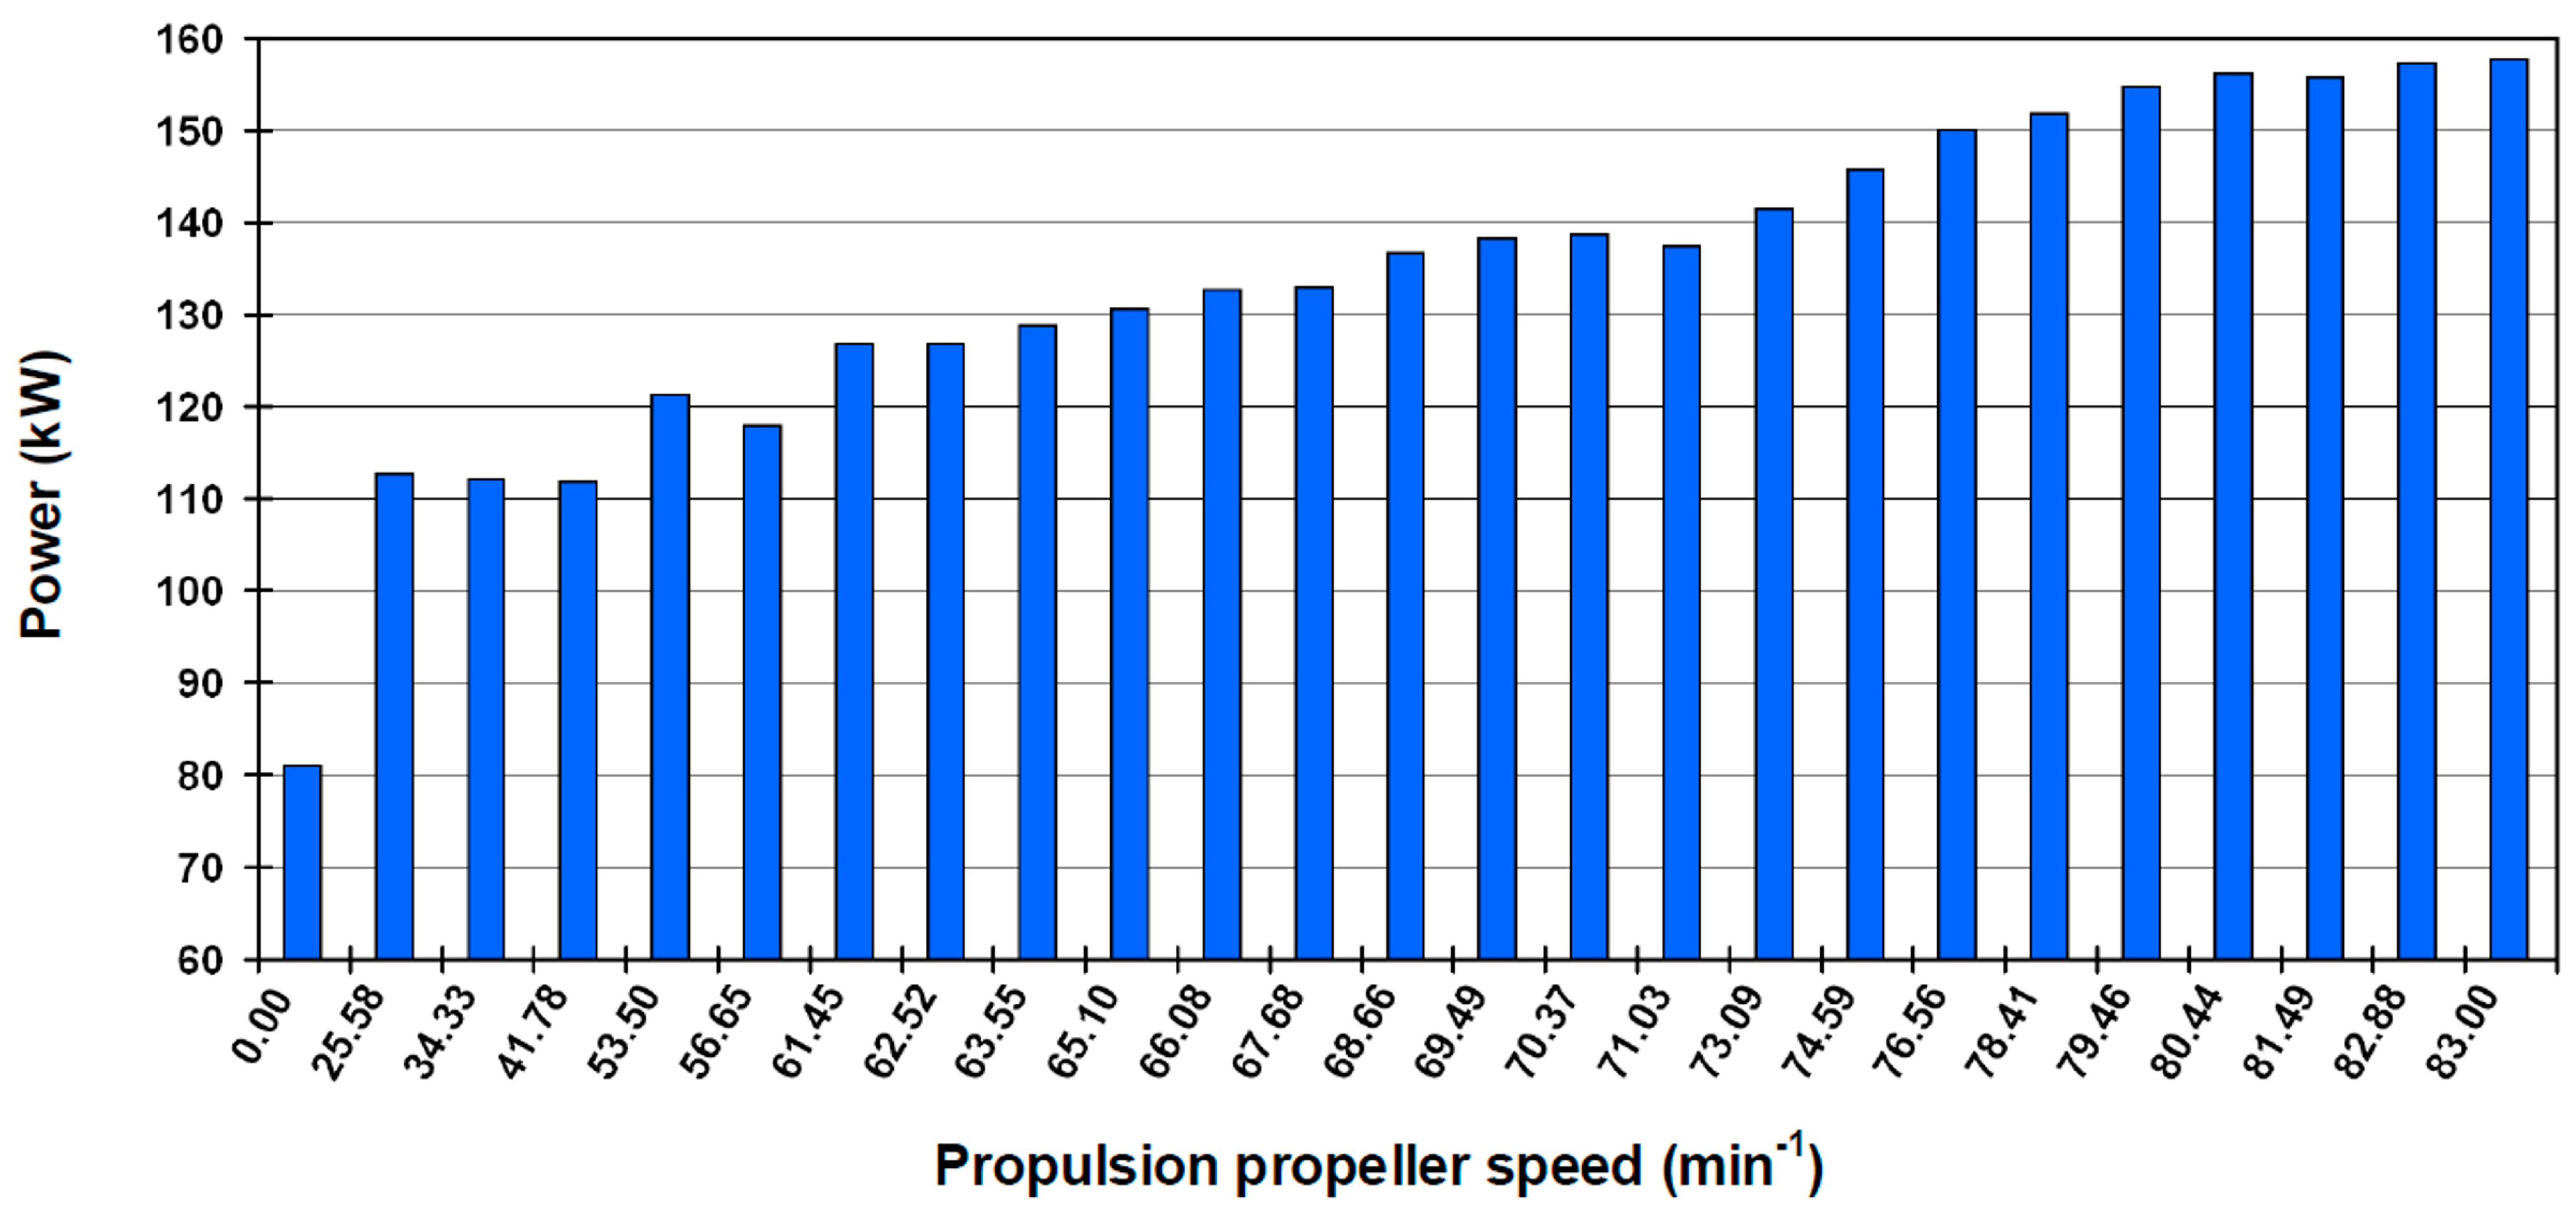
One of the essential elements for the energy and exergy analyses of the forced draft fan is the power produced by the electrical drive and distributed to the forced draft fan. The fan driving power varies according to the system load and is calculated by Equations (20) and (21) along with the measured current from Table 5. The driving power is determined for all of the observed propulsion system loads (propulsion propeller speed) and the results are presented in Figure 4.
When comparing the calculated results for the forced draft fan driving power (Figure 4), with the measured current from Table 5, it can be noticed that the fan driving power is directly proportional to the induction motor current. During the steam system startup (propulsion propeller speed of 0.00 min−1), the fan driving power is 80.99 kW and increases almost continuously during an increase in the steam system load. At the highest system load (83.00 min−1), the fan driving power is equal to 157.63 kW. The presented change in the fan driving power is expected because an increase in the steam system load simultaneously increases the fuel amount into the steam generator. An increase in the fuel consumption leads to an increase in the air mass flow rate supplied to the steam generator by the forced draft fan in order to maintain complete combustion. The higher air mass flow rates through the forced draft fan necessitate higher power consumptions in the fan drive. This fact is justified with the simultaneous change of the forced draft fan power consumption and the change in the air mass flow rate, as shown in Figure 4 and Table 4.
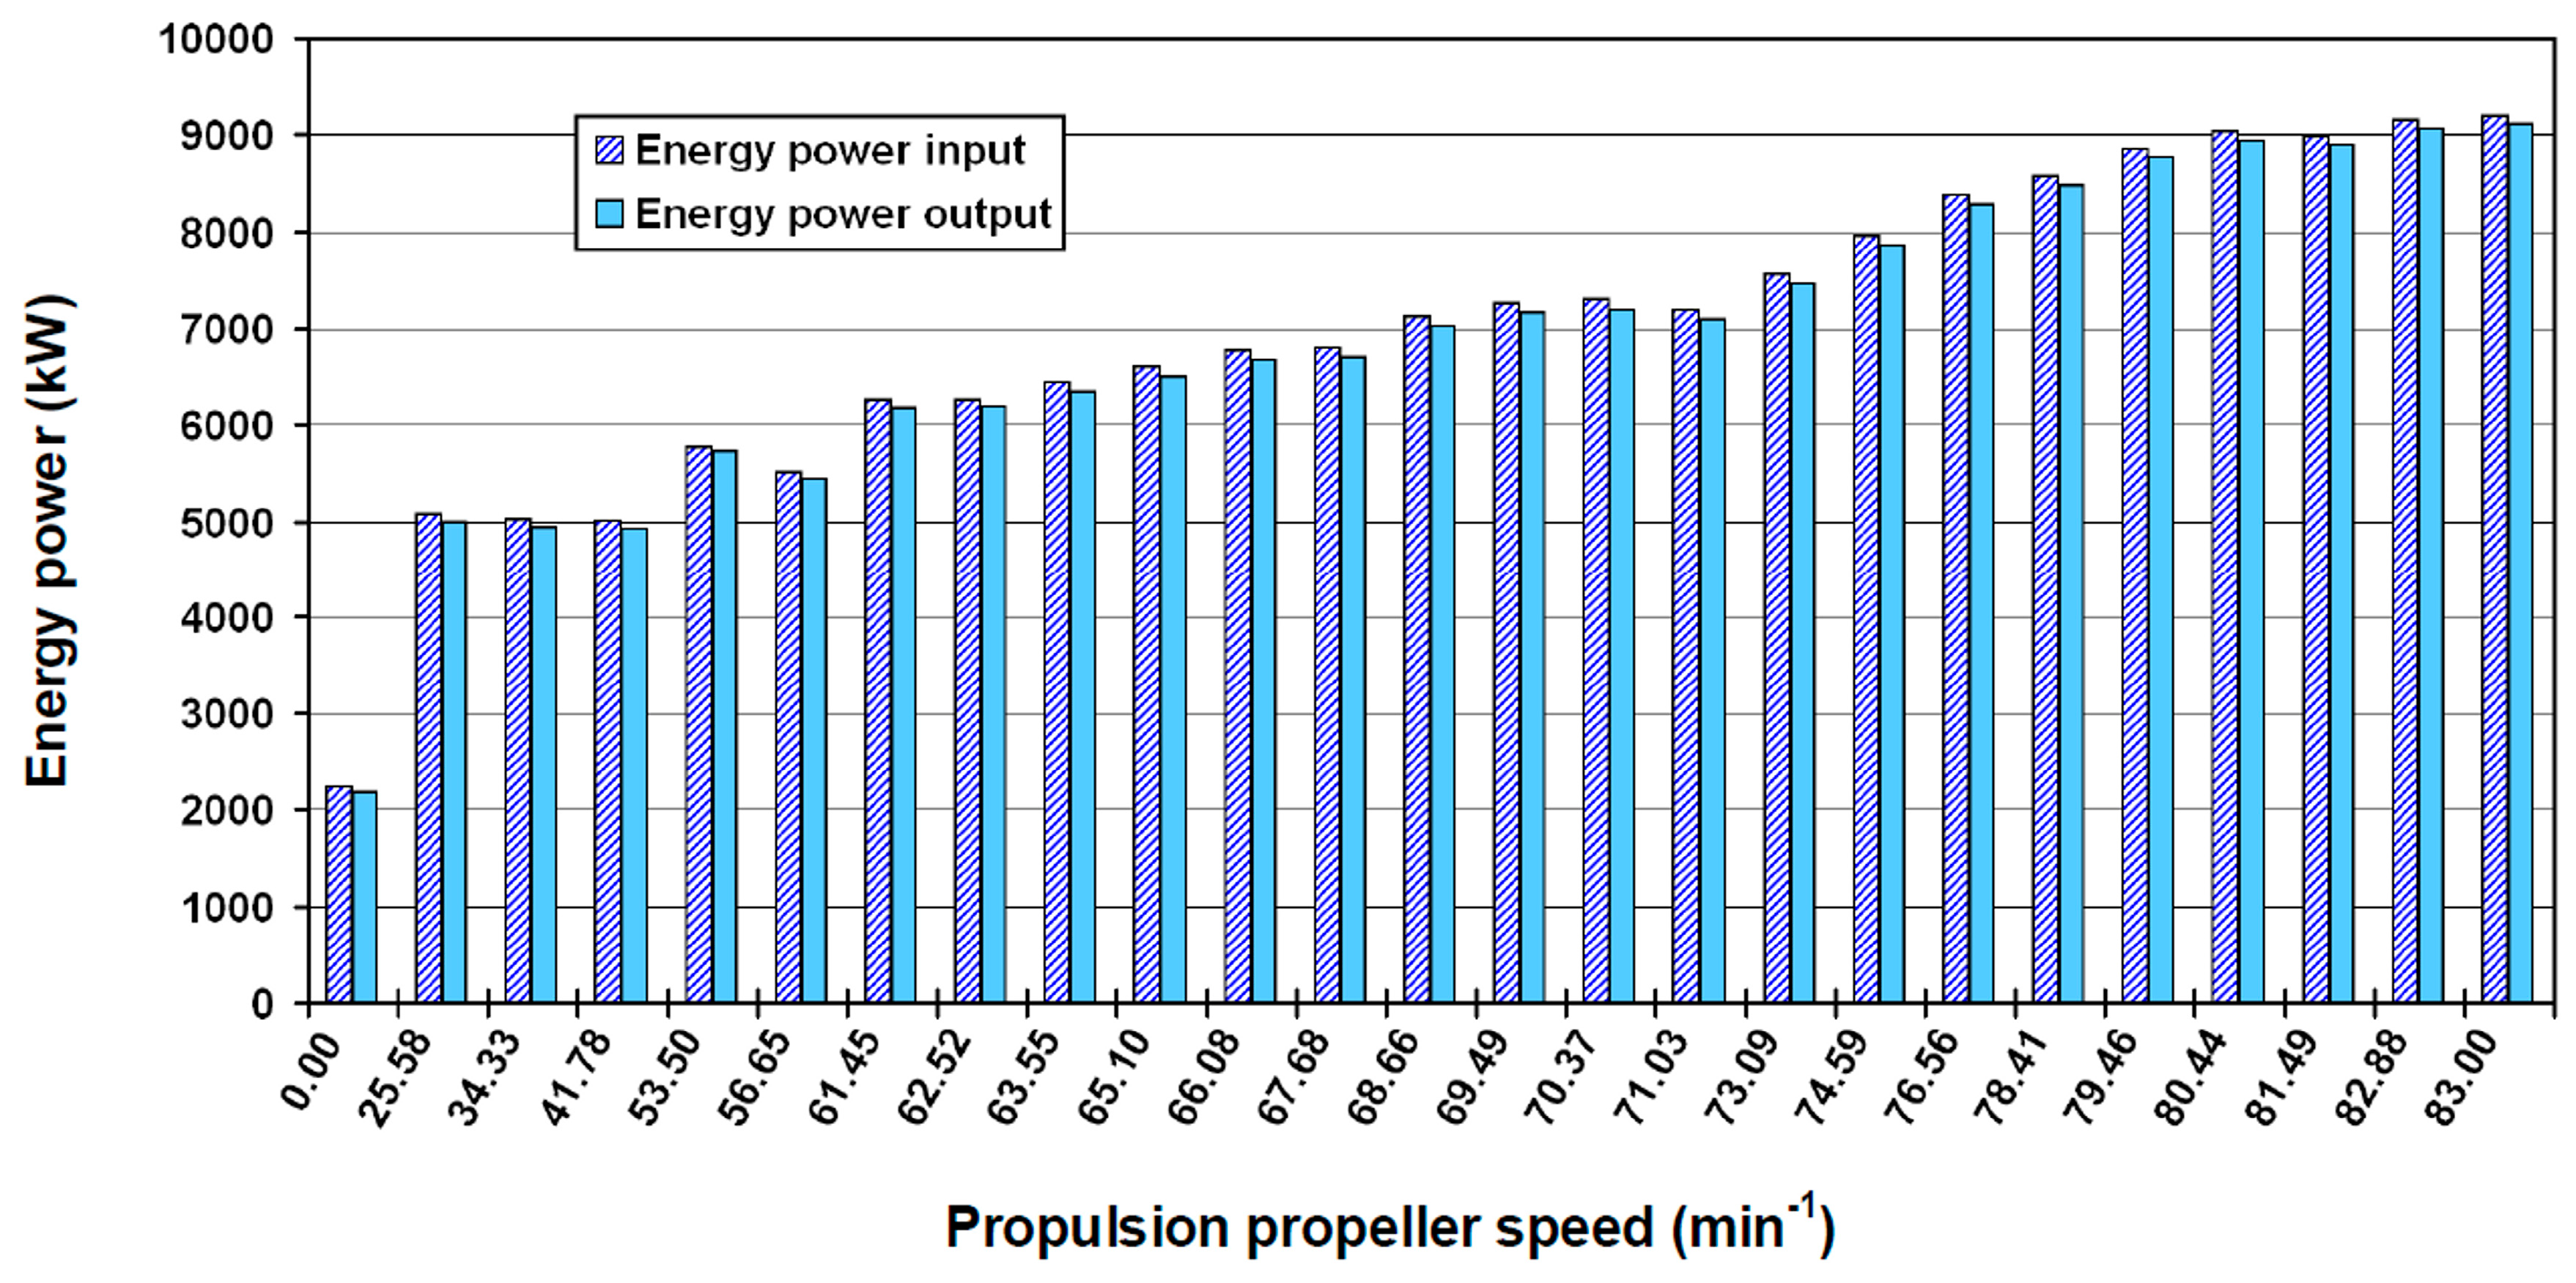
The energy power input and output of the forced draft fan, calculated by Equations (12) and (13), for the observed steam system loads, are presented in Figure 5. The fan power input and output increase (almost continuously with some variations) during an increase in the steam system load. The difference between the energy power input and output represents the fan energy power loss, which is of a much lower scale than the entire energy power input and output, as shown in Figure 5.
The lowest values of the fan energy power input and output can be seen during the steam system startup: 2239 kW for energy power input and 2182 kW for energy power output. An increase in the steam system load results with an almost continuous increase in the fan energy power input and output. Hence, the highest values of fan energy power input and output are obtained at the highest observed system load (propulsion propeller speed of 83.00 min−1) and are equal to 9192 kW for the energy power input and 9117 kW for the energy power output.
For all of the observed steam system loads, it can be concluded that the energy power input and output of the forced draft fan are well balanced since the difference between those two is small. Therefore, the energy power losses are low in the entire operating range. Unfortunately, a low energy power loss does not lead to high energy efficiency in the analyzed forced draft fan.
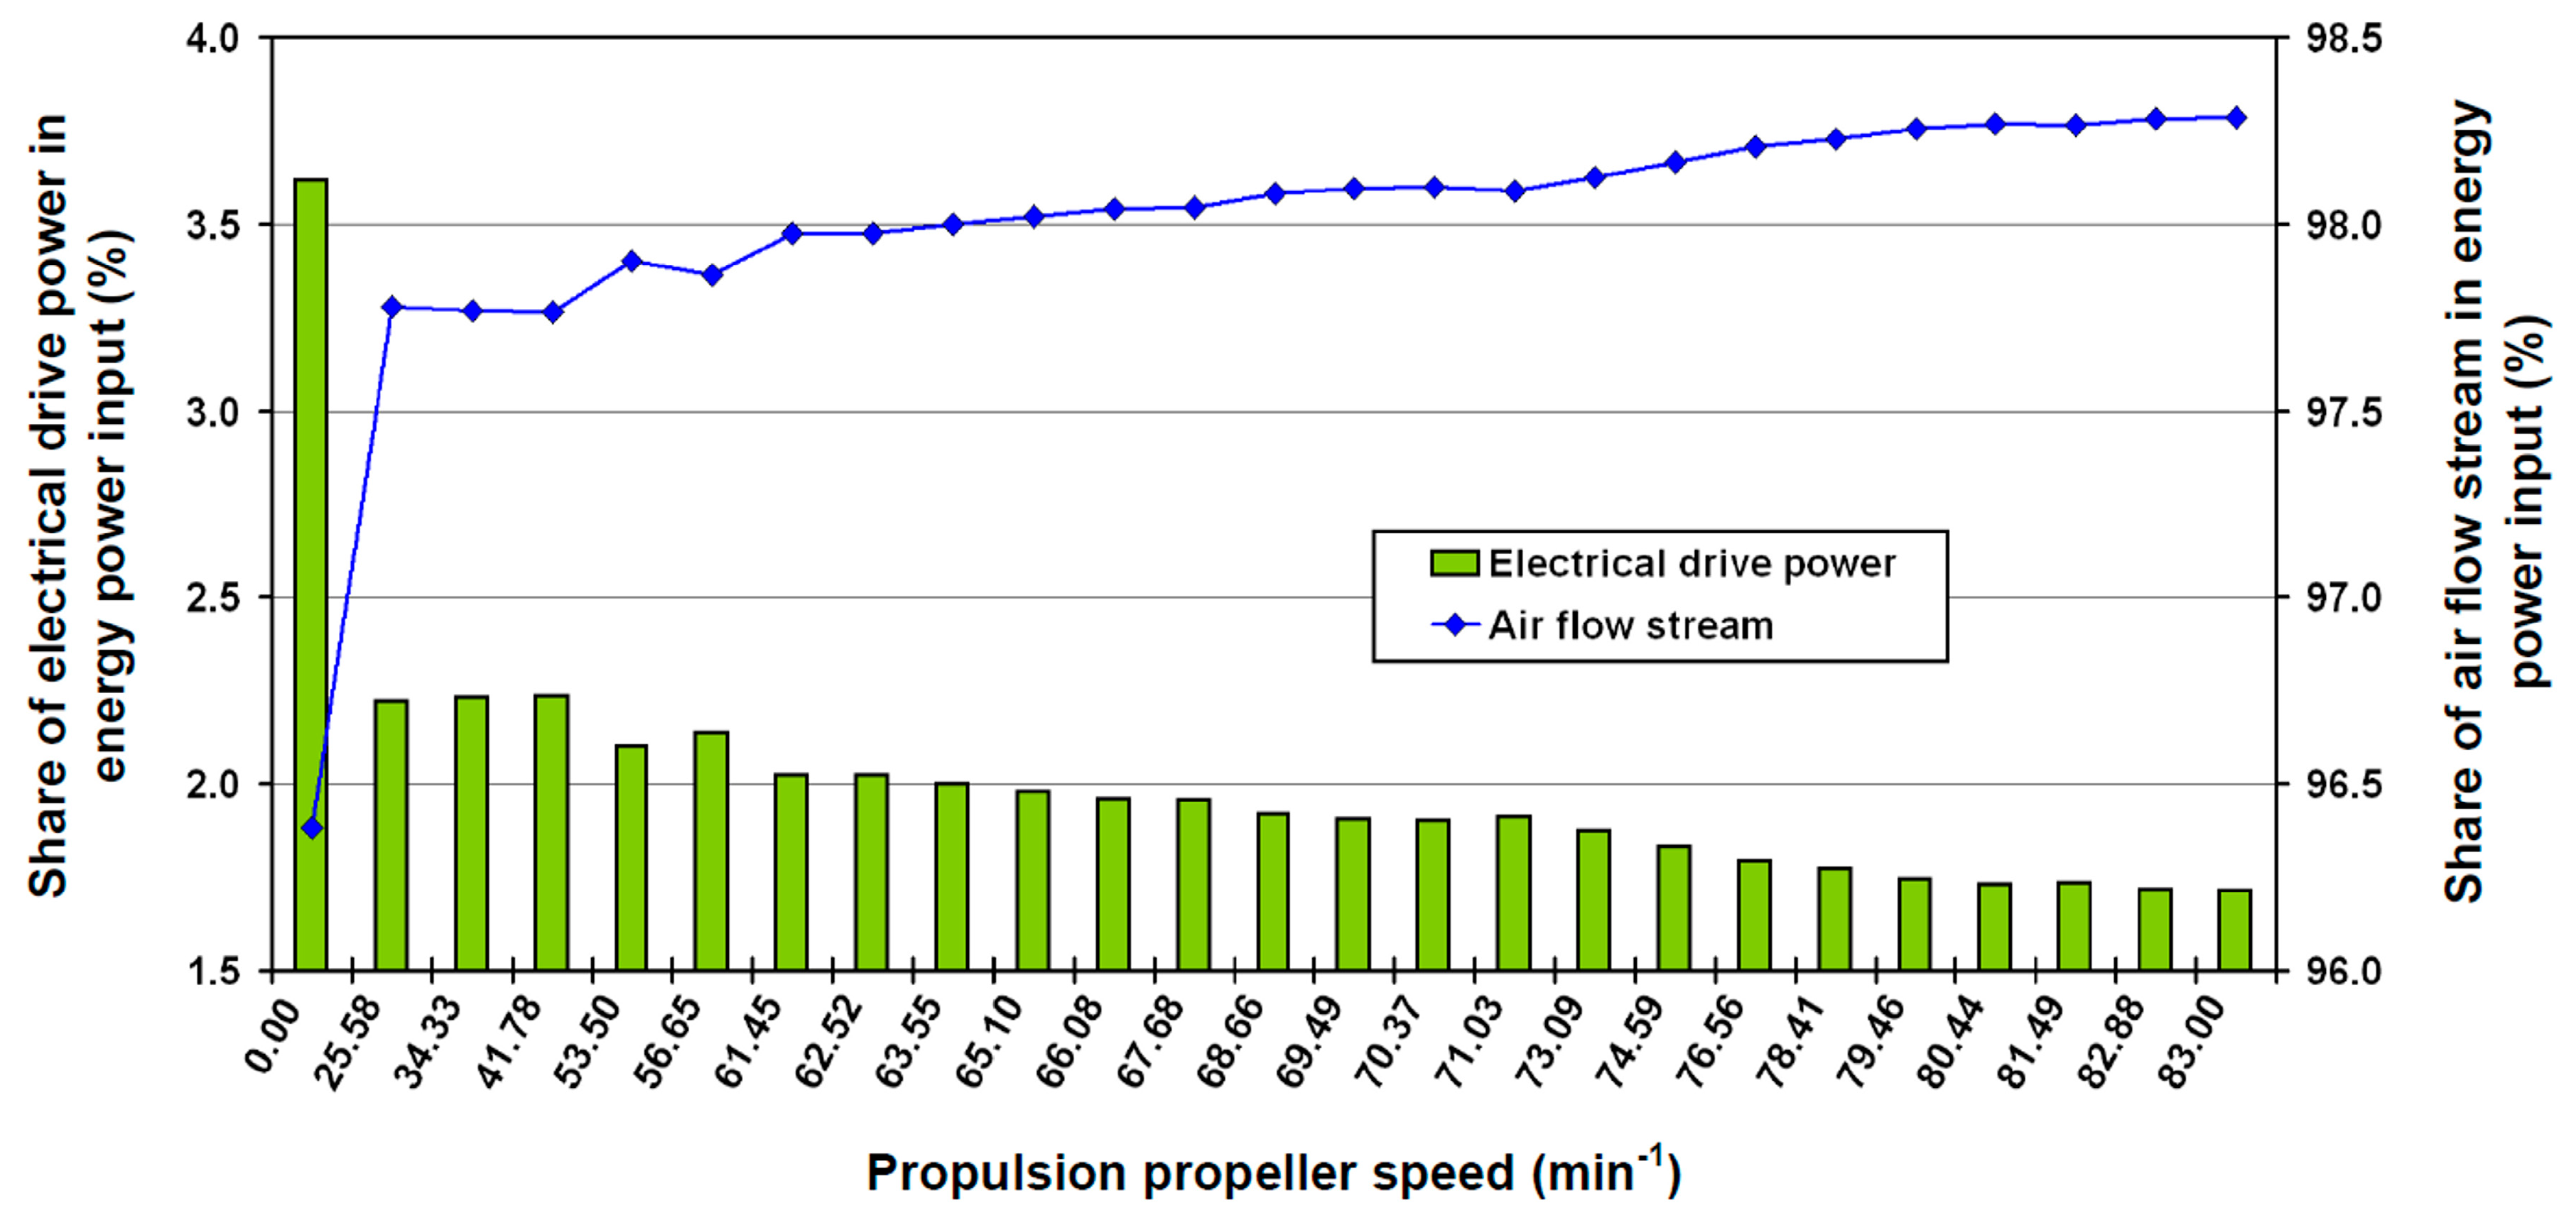
The energy power input of the forced draft fan (Equation (12)) consists of two components: The first part is the energy power of the air flow stream (product of air mass flow rate and specific enthalpy), while the second part is the power delivered to the fan. It is of interest to analyze the shares of these two components in the fan energy power input and to compare them against the fan exergy power input, which also consists of exergy power of the air flow stream and power delivered by the induction motor drive.
Figure 6 shows that the air flow stream takes a dominant share in the fan energy power input (from 96.38% for the lowest, up to 98.29% for the highest observed steam system load). Except at the steam system startup (propulsion propeller speed of 0.00 min−1), the electrical drive power represents a share lower than 2.5% in the energy power input for all of the steam system loads.
During steam system startup, the share of electrical drive power in the energy power input is the highest (3.62%) due to the lowest air mass flow rate through the fan (4.80 kg/s, Table 4). At the first, the higher system load (propulsion propeller speed of 25.58 min−1), the share of electrical drive power share reduced to 2.22% due to a significant increase in the air mass flow rate through the fan (from 4.80 kg/s at 0.00 min−1 up to 11.24 kg/s at 25.58 min−1). At the highest steam system load (propeller speed of 83.00 min−1), the air mass flow rate through the forced draft fan is the highest (Table 4) and the share of electrical drive power in the energy power input is the lowest with 1.71%.
The conclusion drawn from Figure 6 is that an increase in the steam system load (along with some minor deviations) increases the air flow stream share (due to increase in the air mass flow rate) and simultaneously decreases the electrical drive power share in the fan energy power input. Likewise, it should be highlighted that the influence of the electrical drive power on the forced draft fan energy power input is minor when compared to the air flow stream.
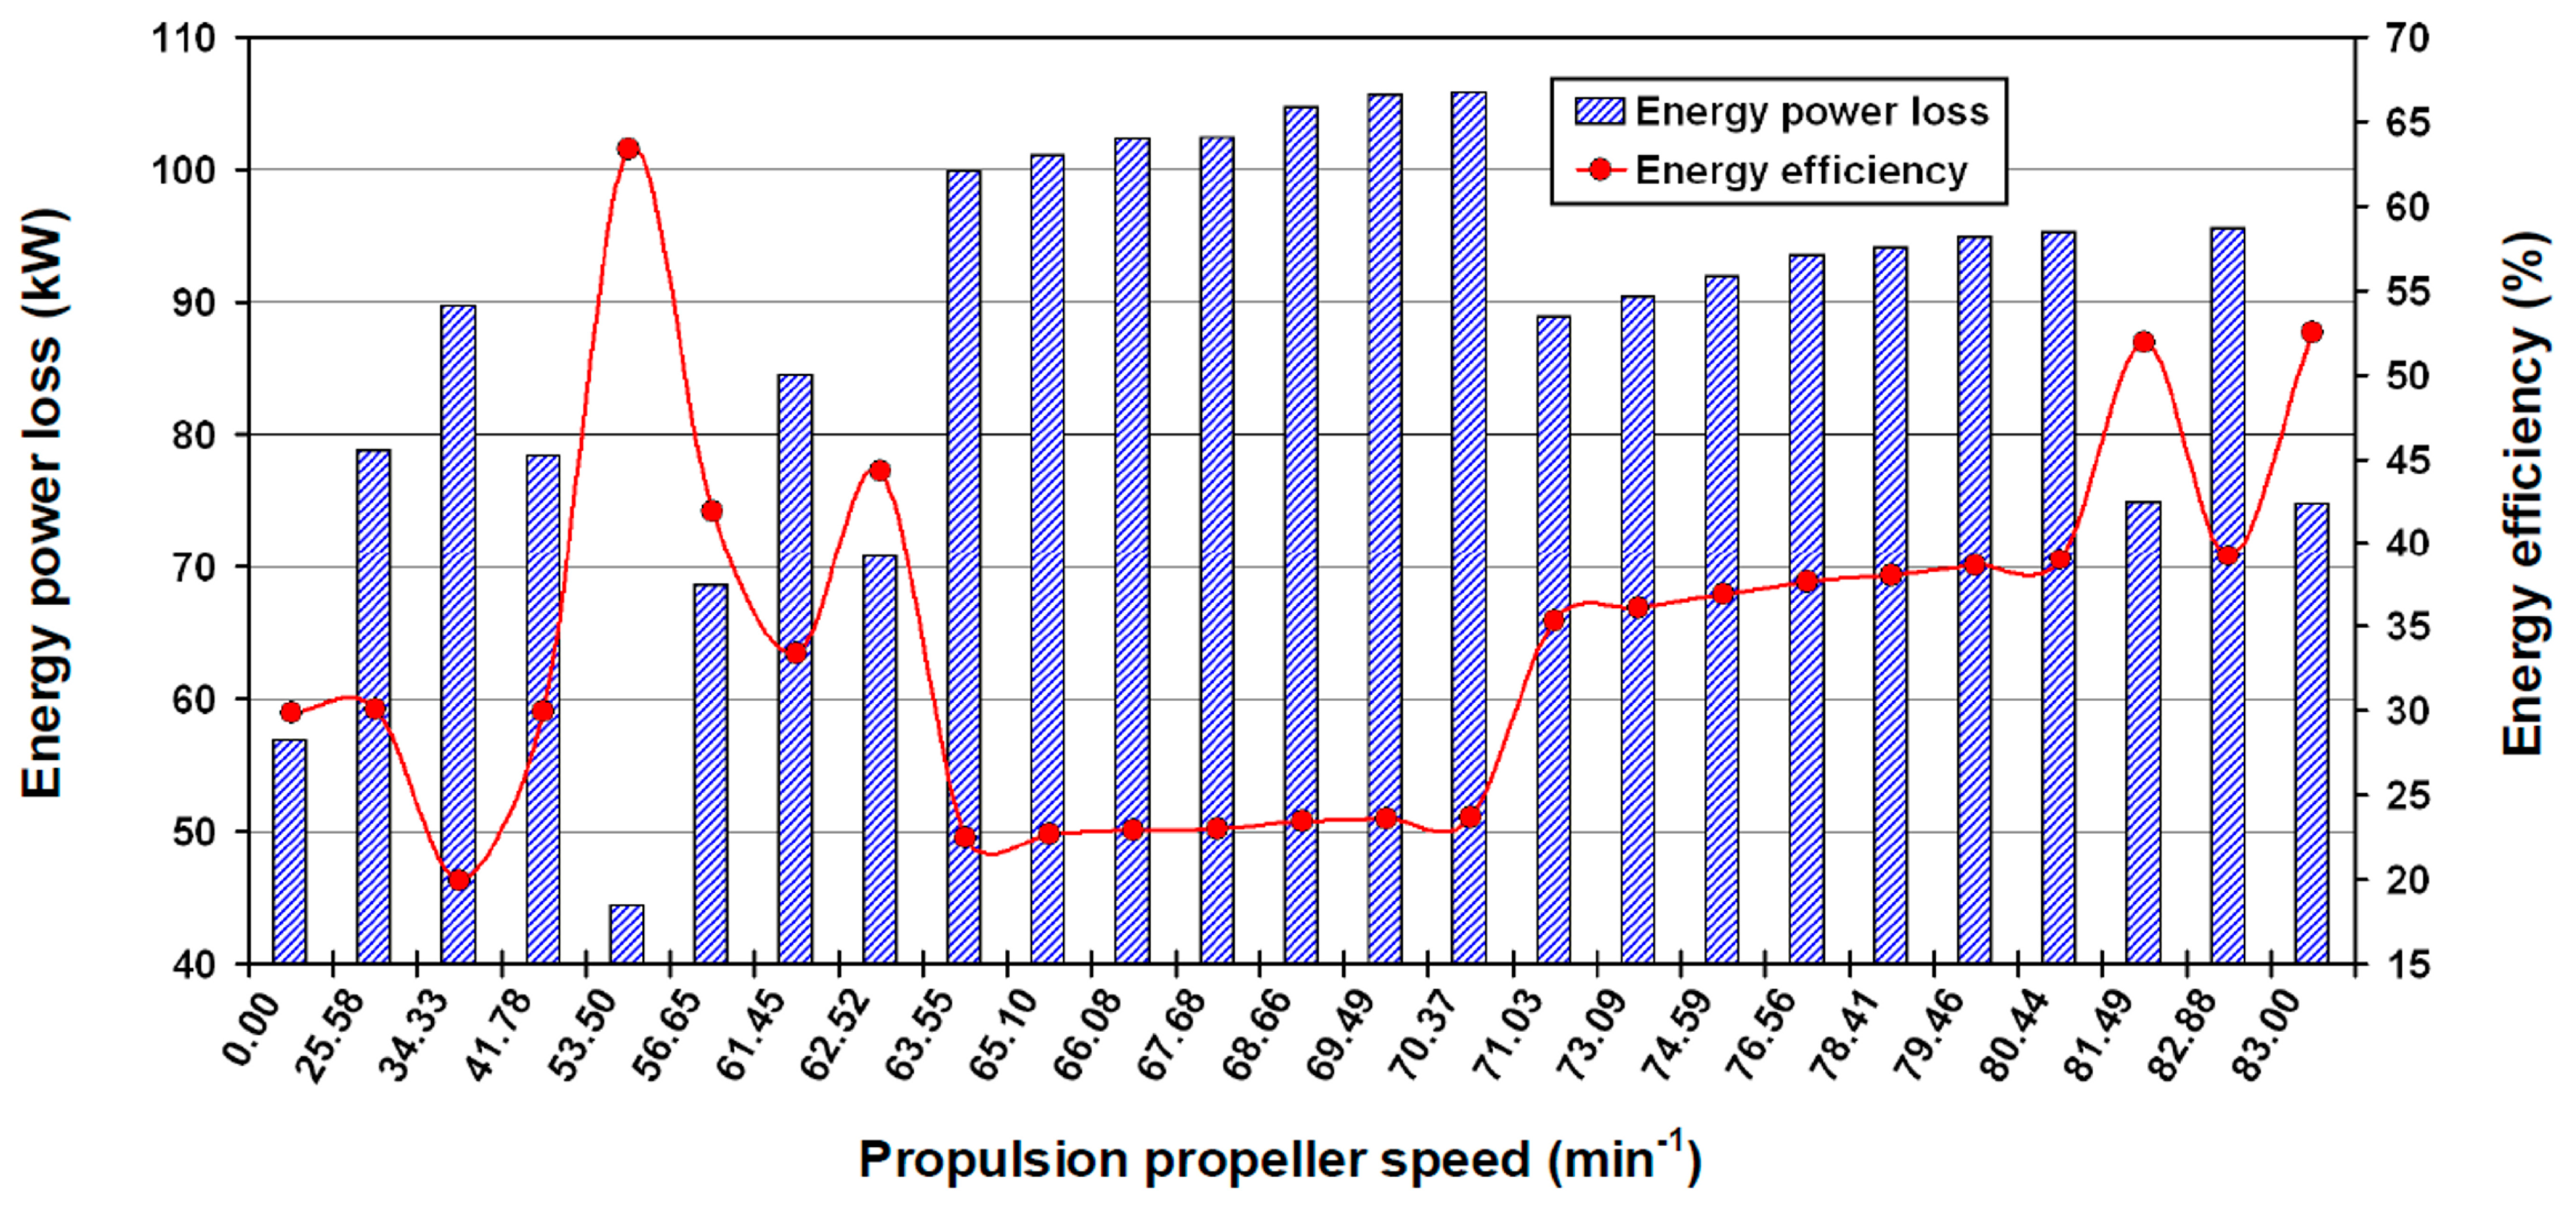
The energy power loss, calculated by Equation (14), and the fan energy efficiency of the forced draft fan, calculated by Equation (15), are shown in Figure 7 for all of the observed steam system loads. The fan energy power loss and energy efficiency have no monotonic trends during an increase in the steam system load. It is therefore essential to identify the variable (or more of them) which has the strongest influence on the fan energy power loss and energy efficiency of the forced draft fan.
According to Equation (14), the fan energy power loss depends on four variables: air mass flow rate, driving power and air specific enthalpies at the fan inlet and outlet. The forced draft fan is a device whose primary purpose is increasing the air velocity (not the air pressure). This fact can be seen from the small pressure differences between the fan outlet and inlet, as listed in Table 4. Therefore, the air pressure cannot significantly affect the fan energy power loss. The air mass flow rate almost continuously increases with an increase in the steam system load (Table 4). The power consumption of the forced draft fan (Figure 4) follows the trend of the air mass flow rate. Therefore, neither the air mass flow rate nor the fan driving power can have the largest impact on the fan energy power loss. The largest impact on the fan energy power loss is from the air temperature, precisely the air temperature difference between the fan inlet and outlet. The higher air temperature differences result in lower energy power loss and vice versa.
The lowest energy power loss of the forced draft fan is 44.4 kW for the propulsion propeller speed of 53.50 min−1 (Figure 7), where the air temperature difference between the fan outlet and inlet is 6 °C (Table 4). When observing the propulsion propeller speeds between 63.55 min−1 and 70.37 min−1, it can be seen that the highest energy power losses of the forced draft fan are between 99.9 kW and 105.8 kW, while the air temperature difference is 2 °C (Table 4). For the highest steam system loads, the fan energy power loss varies significantly. At 81.49 min−1 and 83.00 min−1 the fan energy power losses are 74.9 kW and 74.8 kW, with an air temperature difference of 4 °C. At 82.88 min−1 the fan energy power loss is 95.5 kW and the air temperature difference between fan outlet and inlet is 3 °C.
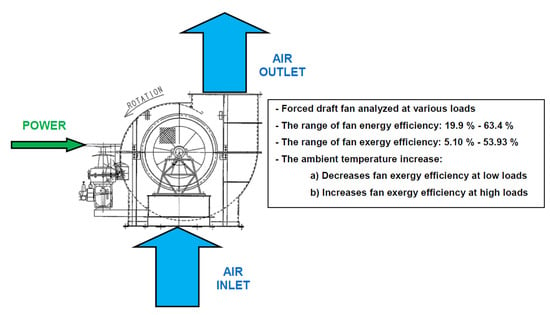
The energy efficiency of the analyzed forced draft fan has the opposite behavior to the energy power loss, meaning that when the fan energy power loss increases, the energy efficiency decreases and vice versa. In the observed range of steam system loads, the fan energy efficiency ranges from 19.9% (at 34.33 min−1) to 63.4% (at 53.50 min−1). At the highest steam system load (83.00 min−1), the forced draft fan energy efficiency is 52.5%, which is important since, at this system load, LNG carriers operate for the major part of the time. It can be concluded that, on average, the energy efficiency of the analyzed forced draft fan is below 40% for in the low to middle range of system loads. The fan energy efficiency increases to 50%, on average, only at the highest steam system loads (from 81.49 min−1 to 83.00 min−1).
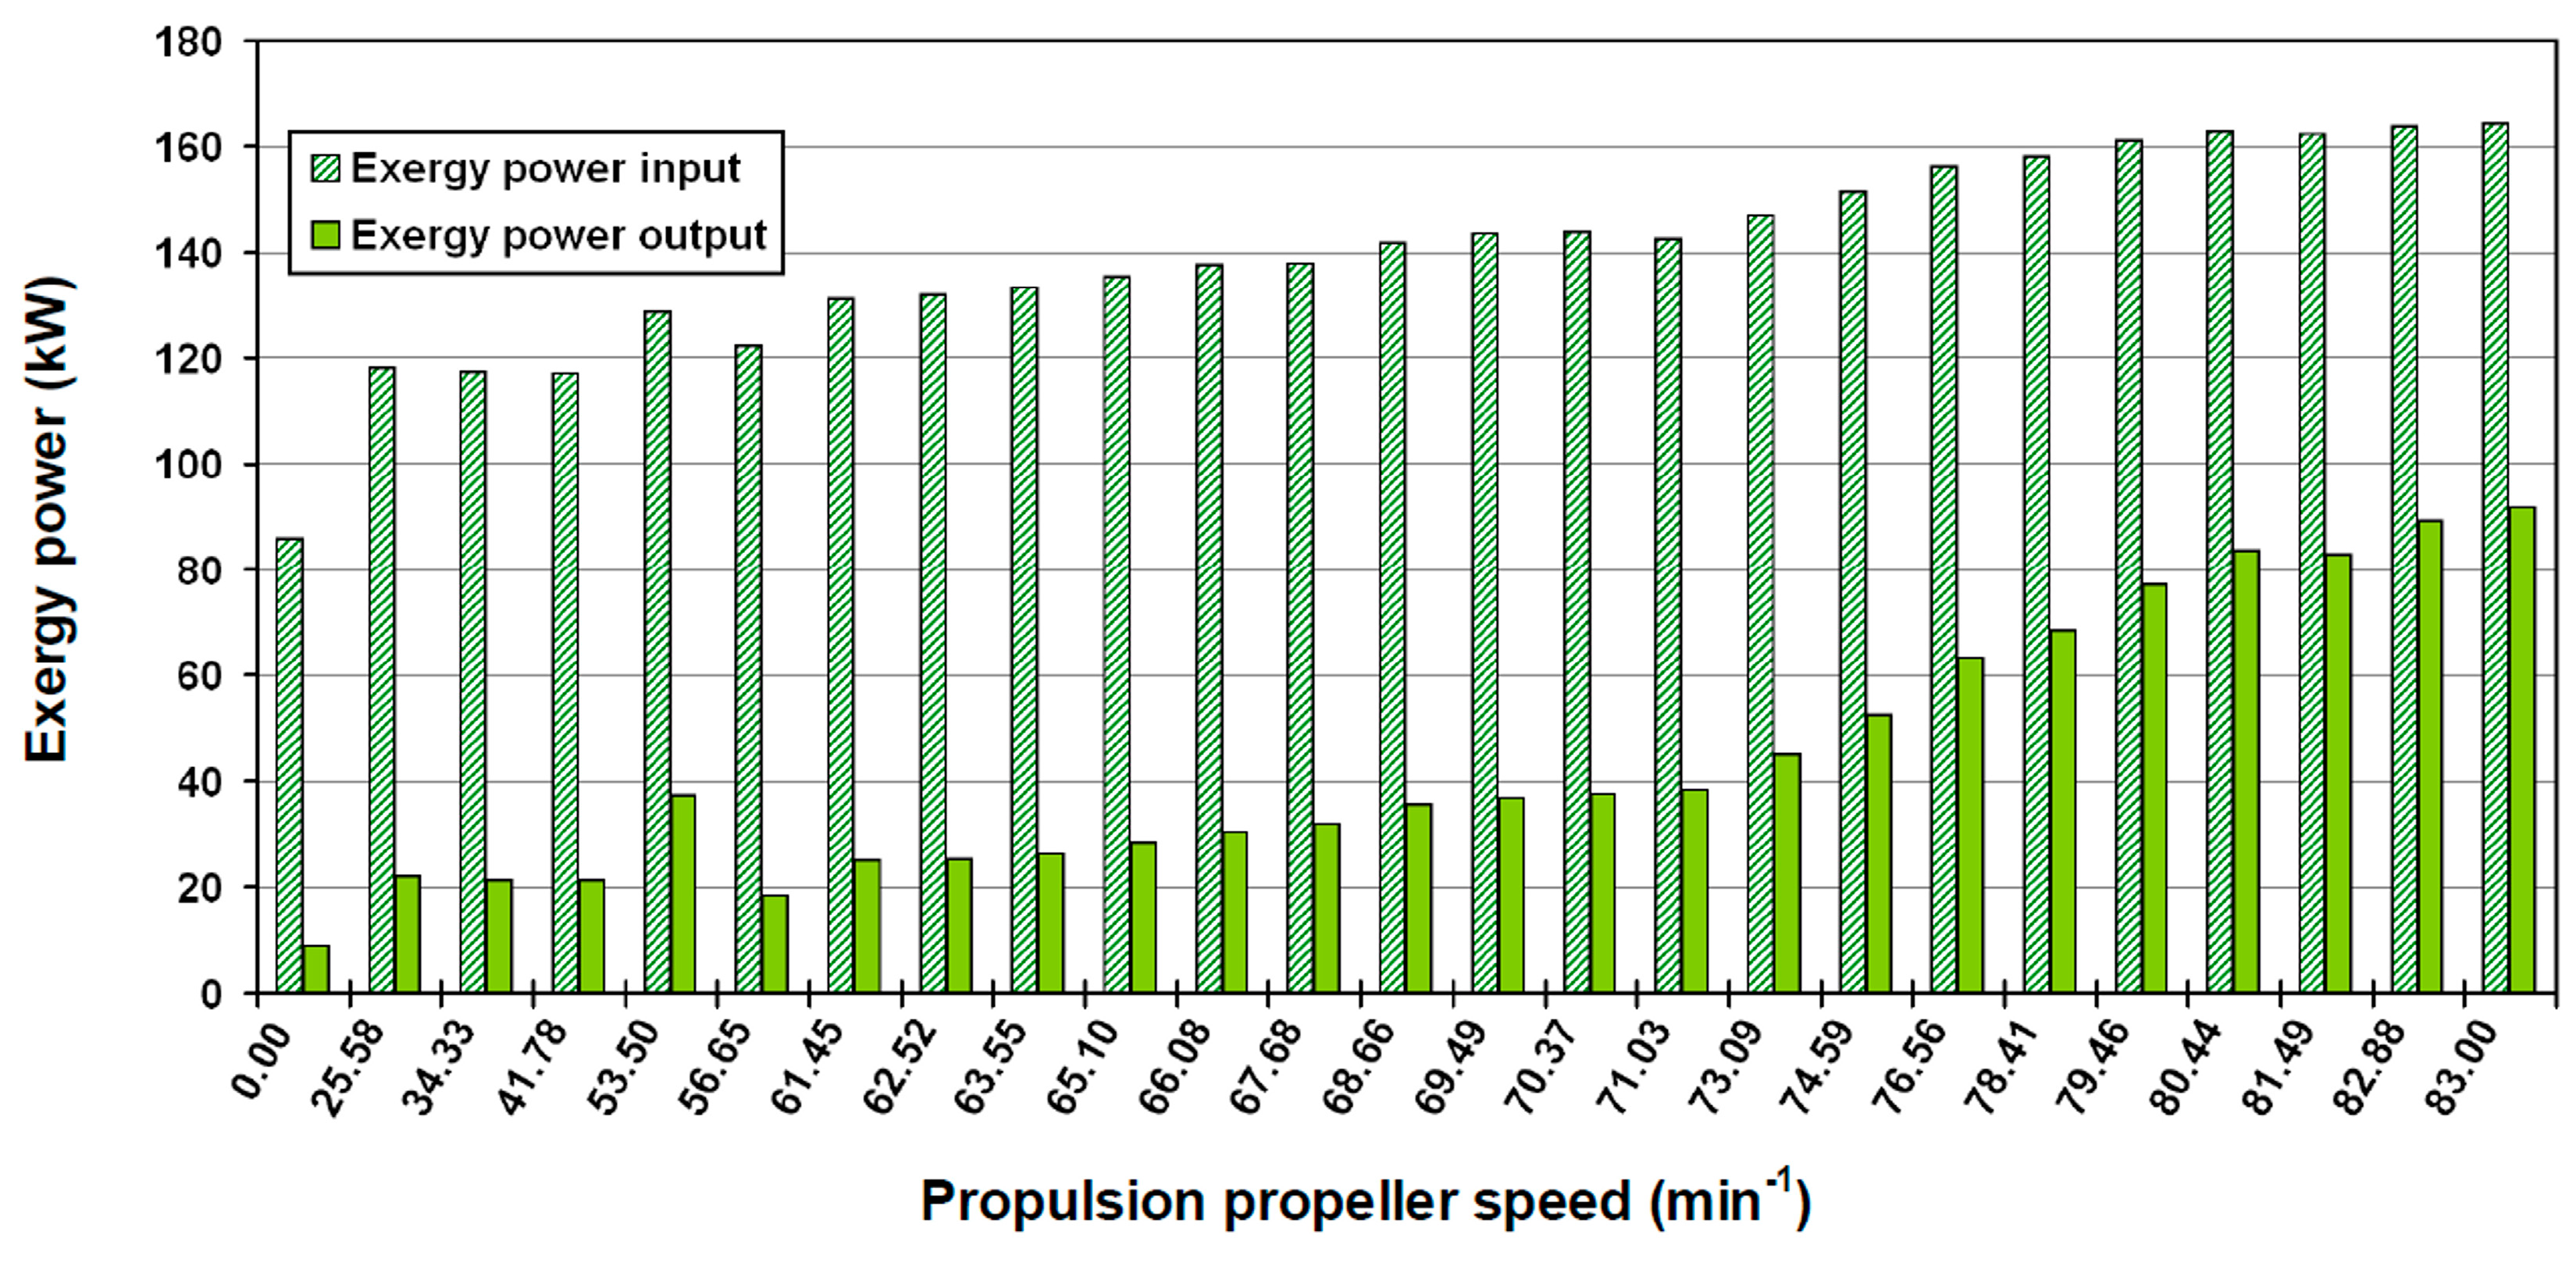
The exergy power input (Equation (16)) and the exergy power output of the forced draft fan (Equation (17)) are presented in Figure 8, for the observed range of steam system loads. During an increase in the steam system load, both the exergy power input and output increase almost continuously. When compared to the energy power input and output, which are in the scale of thousands of kW (Figure 5), the exergy power input is up to 170 kW, while the exergy power output is lower than 100 kW. The cause of this is in the values of air specific enthalpies (fan energy power input and output) and air specific exergies (fan exergy power input and output). The air specific enthalpies are from 438.5 kJ/kg (fan inlet) to 454.65 kJ/kg (fan outlet) while the air specific exergies are from 0.32 kJ/kg (fan inlet) to 4.44 kJ/kg (fan outlet). The values of air specific exergy (at fan inlet and outlet) are small, but not zero, because of how the ambient state was defined (Section 4.2.).
The lowest exergy power input of the forced draft fan is 85.8 kW and occurs for a propulsion propeller speed of 0.00 min−1, while the highest fan exergy power input of 164.2 kW occurs at the highest system load (83.00 min−1). The lowest values of exergy power input and output are obtained for propeller speed of 0.00 min−1, while the highest values of exergy power input and output are obtained for propeller speed of 83.00 min−1.The lowest exergy power output is 8.9 kW, while the highest exergy power output is 91.6 kW. The exergy power output is not influenced by the electrical drive power since it contains only the exergy power of the air flow stream (Equation (17)).
The highest variation in the fan exergy power input and output occurs between the propulsion propeller speeds of 41.78 min−1 and 56.65 min−1. The main reason for the sudden increase from 41.78 min−1 to 53.50 min−1 is a significant increase in the electrical drive power, from 111.93 kW to 121.25 kW. The exergy power input of the air flow stream increases by only 2.28 kW between these two propeller speeds, mostly because the air mass flow rate increases from 11.09 kg/s to 12.75 kg/s (Table 4). The increase in the air mass flow rate is the main reason for the fan exergy power output increase between propeller speeds of 41.78 min−1 and 53.50 min−1. However, it should be noted that the air temperature increase at the fan outlet, which is from 45 °C to 50 °C, also influences the observed increase in the fan exergy power output.
A notable decrease in the fan exergy power input is noticed from 53.50 min−1 to 56.65 min−1. This is mainly caused by the decrease of electrical drive power from 121.25 kW to 117.91 kW. Between these two propeller speeds, the exergy power input of the air flow stream shows a decrease of 2.96 kW, caused mostly by the decrease in air mass flow rate from 12.75 kg/s to 12.28 kg/s (Table 4). Between propeller speeds of 53.50 min−1. and 56.65 min−1, the decrease in fan exergy power output is caused by the decrease of air temperature at the fan outlet, from 50 °C to 44 °C, while the decrease of air mass flow rate has an important, but not primary influence.
The exergy power loss (exergy destruction) of the forced draft fan represents the difference between the exergy power input and exergy power output. From Figure 8, it can be seen that, in general, the differences between the fan exergy power input and output decreases, during the increase of the propeller speed (along with some deviations at lower steam system loads). Therefore, the lowest exergy power loss (the lowest exergy destruction) is expected to occur at the highest propulsion propeller speeds.
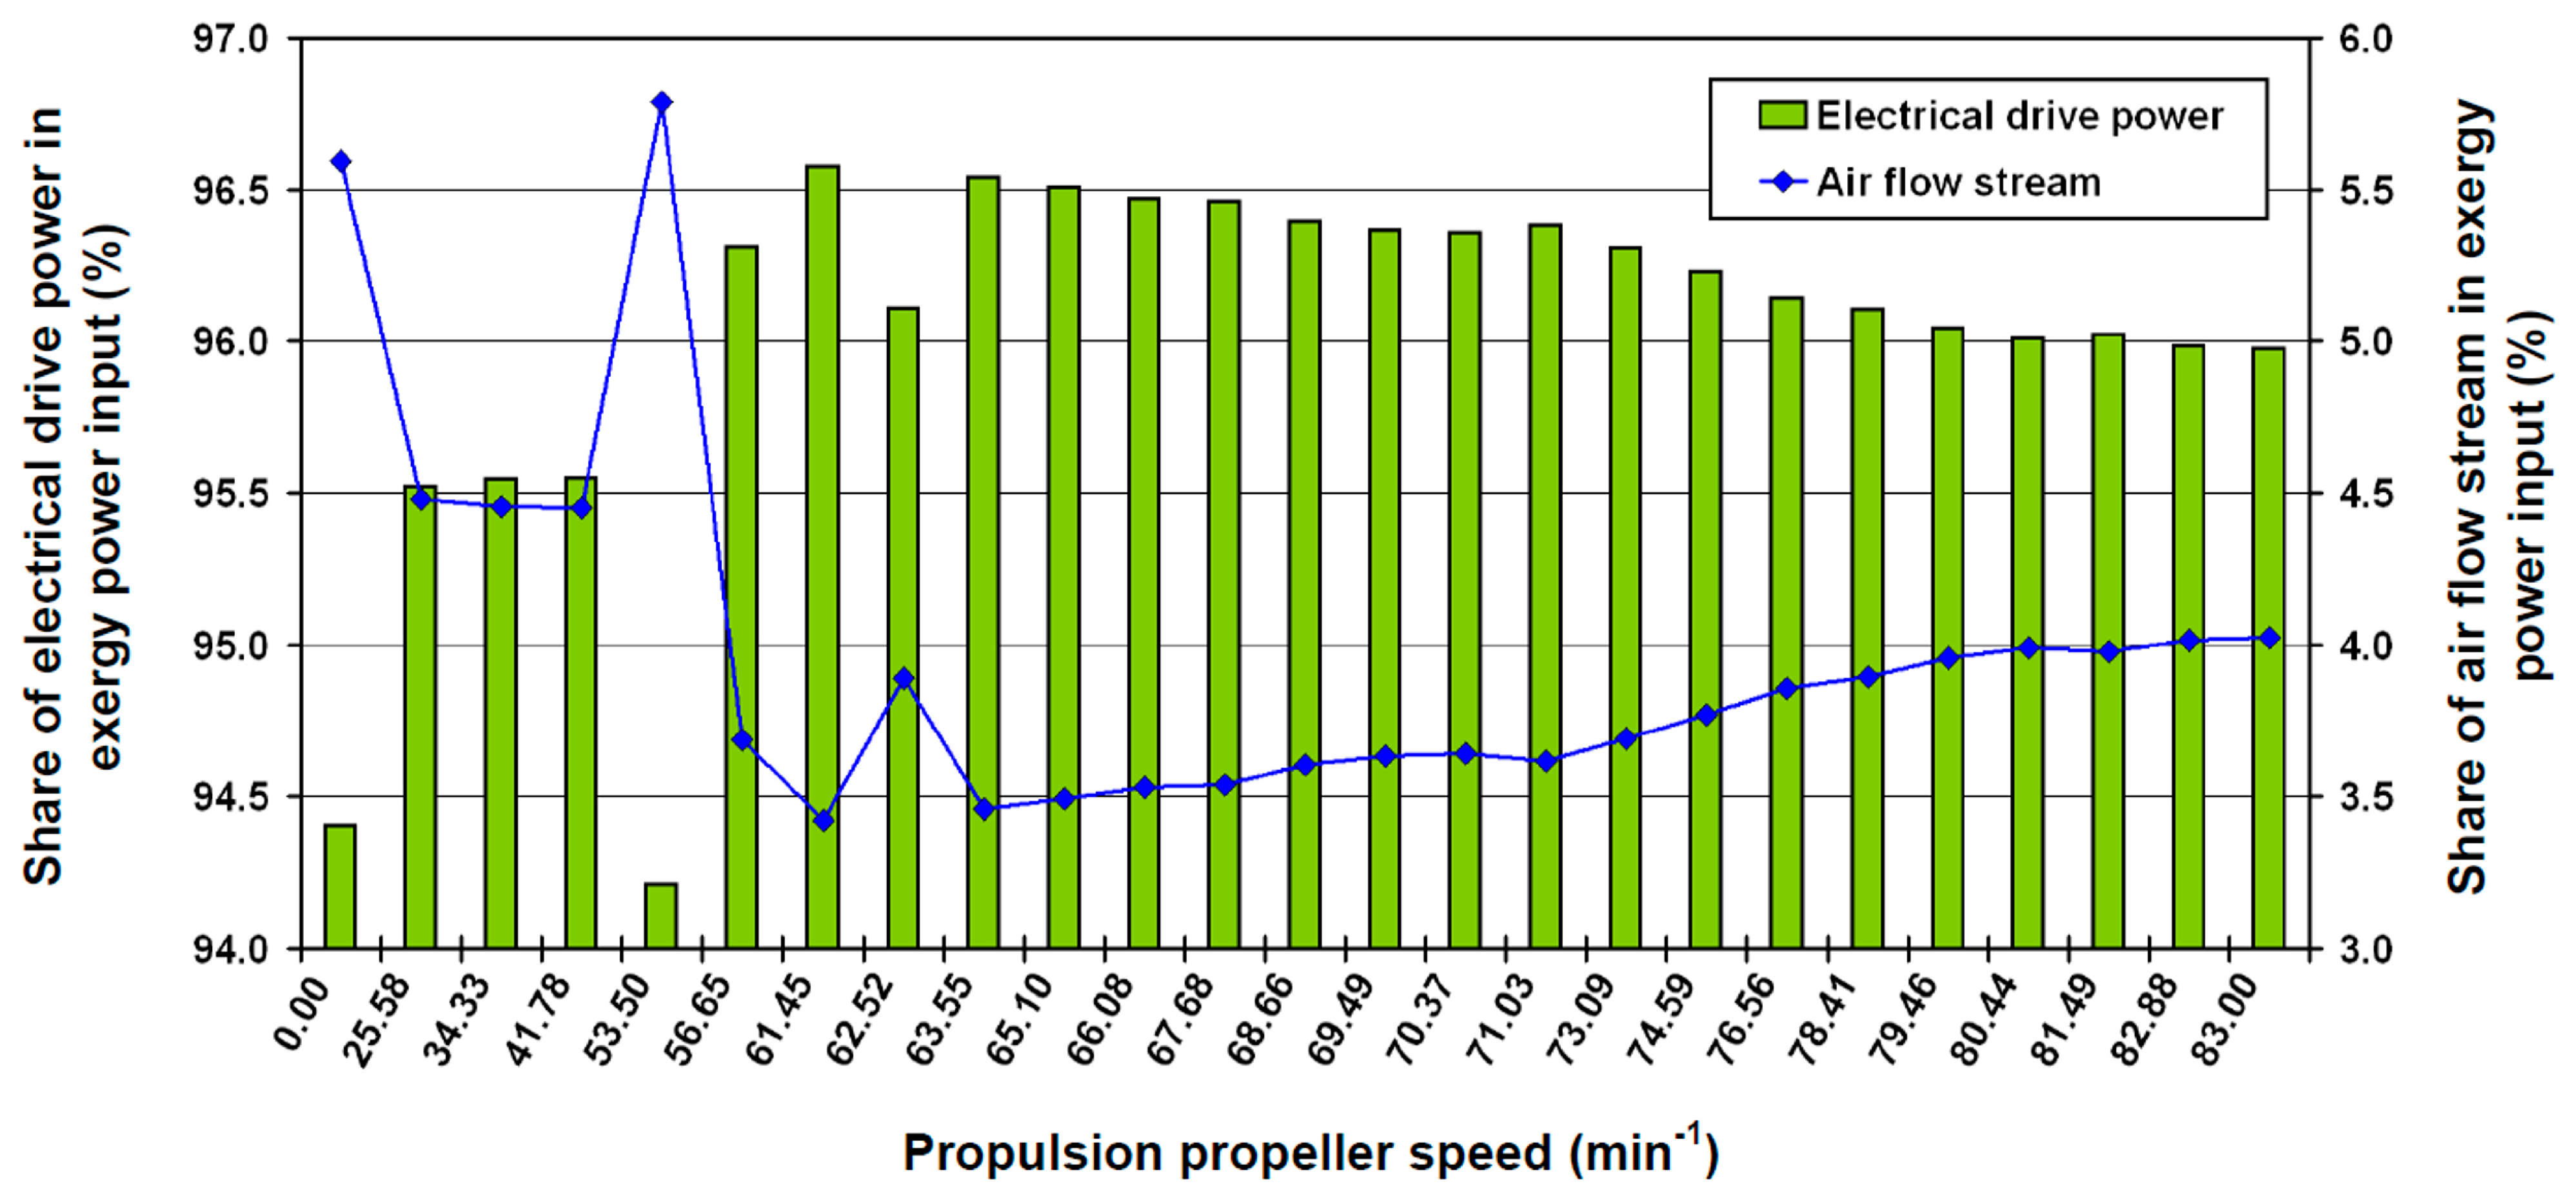
Similar to the energy power input, the exergy power input is also composed of two parts (Equation (16)): the electrical drive power and the exergy power of the air flow stream. The shares of electrical drive power and air flow exergy power in the exergy power input are presented in Figure 9, for the entire range of observed steam system loads.
From Figure 9, it can be clearly seen that the dominant share in the exergy power input is from the electrical drive power (between 94.21% and 96.58%) for the entire range of steam system loads. Due to the small values of air specific exergy at the fan inlet (between 0.32 kJ/kg and 1 kJ/kg), the exergy power of the air flow stream represents a smaller share in exergy power input, from 3.42% to 5.79%.
At low propulsion propeller speeds (under 63.55 min−1), the shares of electrical drive power and air flow exergy power in the fan exergy power input exhibit abrupt changes, which are caused by the changes in the air mass flow rates. In the range of propulsion propeller speeds from 63.55 min−1 to 83.00 min−1, the share of air flow exergy power shows a continuous increase, while the share of electrical drive power share shows a continuous decrease. Again, these trends are for the major part influenced by the change in the air mass flow rate.
When comparing the shares of electrical drive power and air flow stream in the energy power input (Figure 6) and exergy power input (Figure 9), it is clear that they are inversely proportional. In the fan energy power input, the dominant share is from the air flow stream while in the fan exergy power input, the dominant share is from the electrical drive power. The reasons for this inverse proportionality are found in the values of air specific enthalpy (required for fan energy power input calculation) and in the values of air specific exergy (required for fan exergy power input calculation). The values of air specific enthalpy are much higher than the values of air specific exergy.
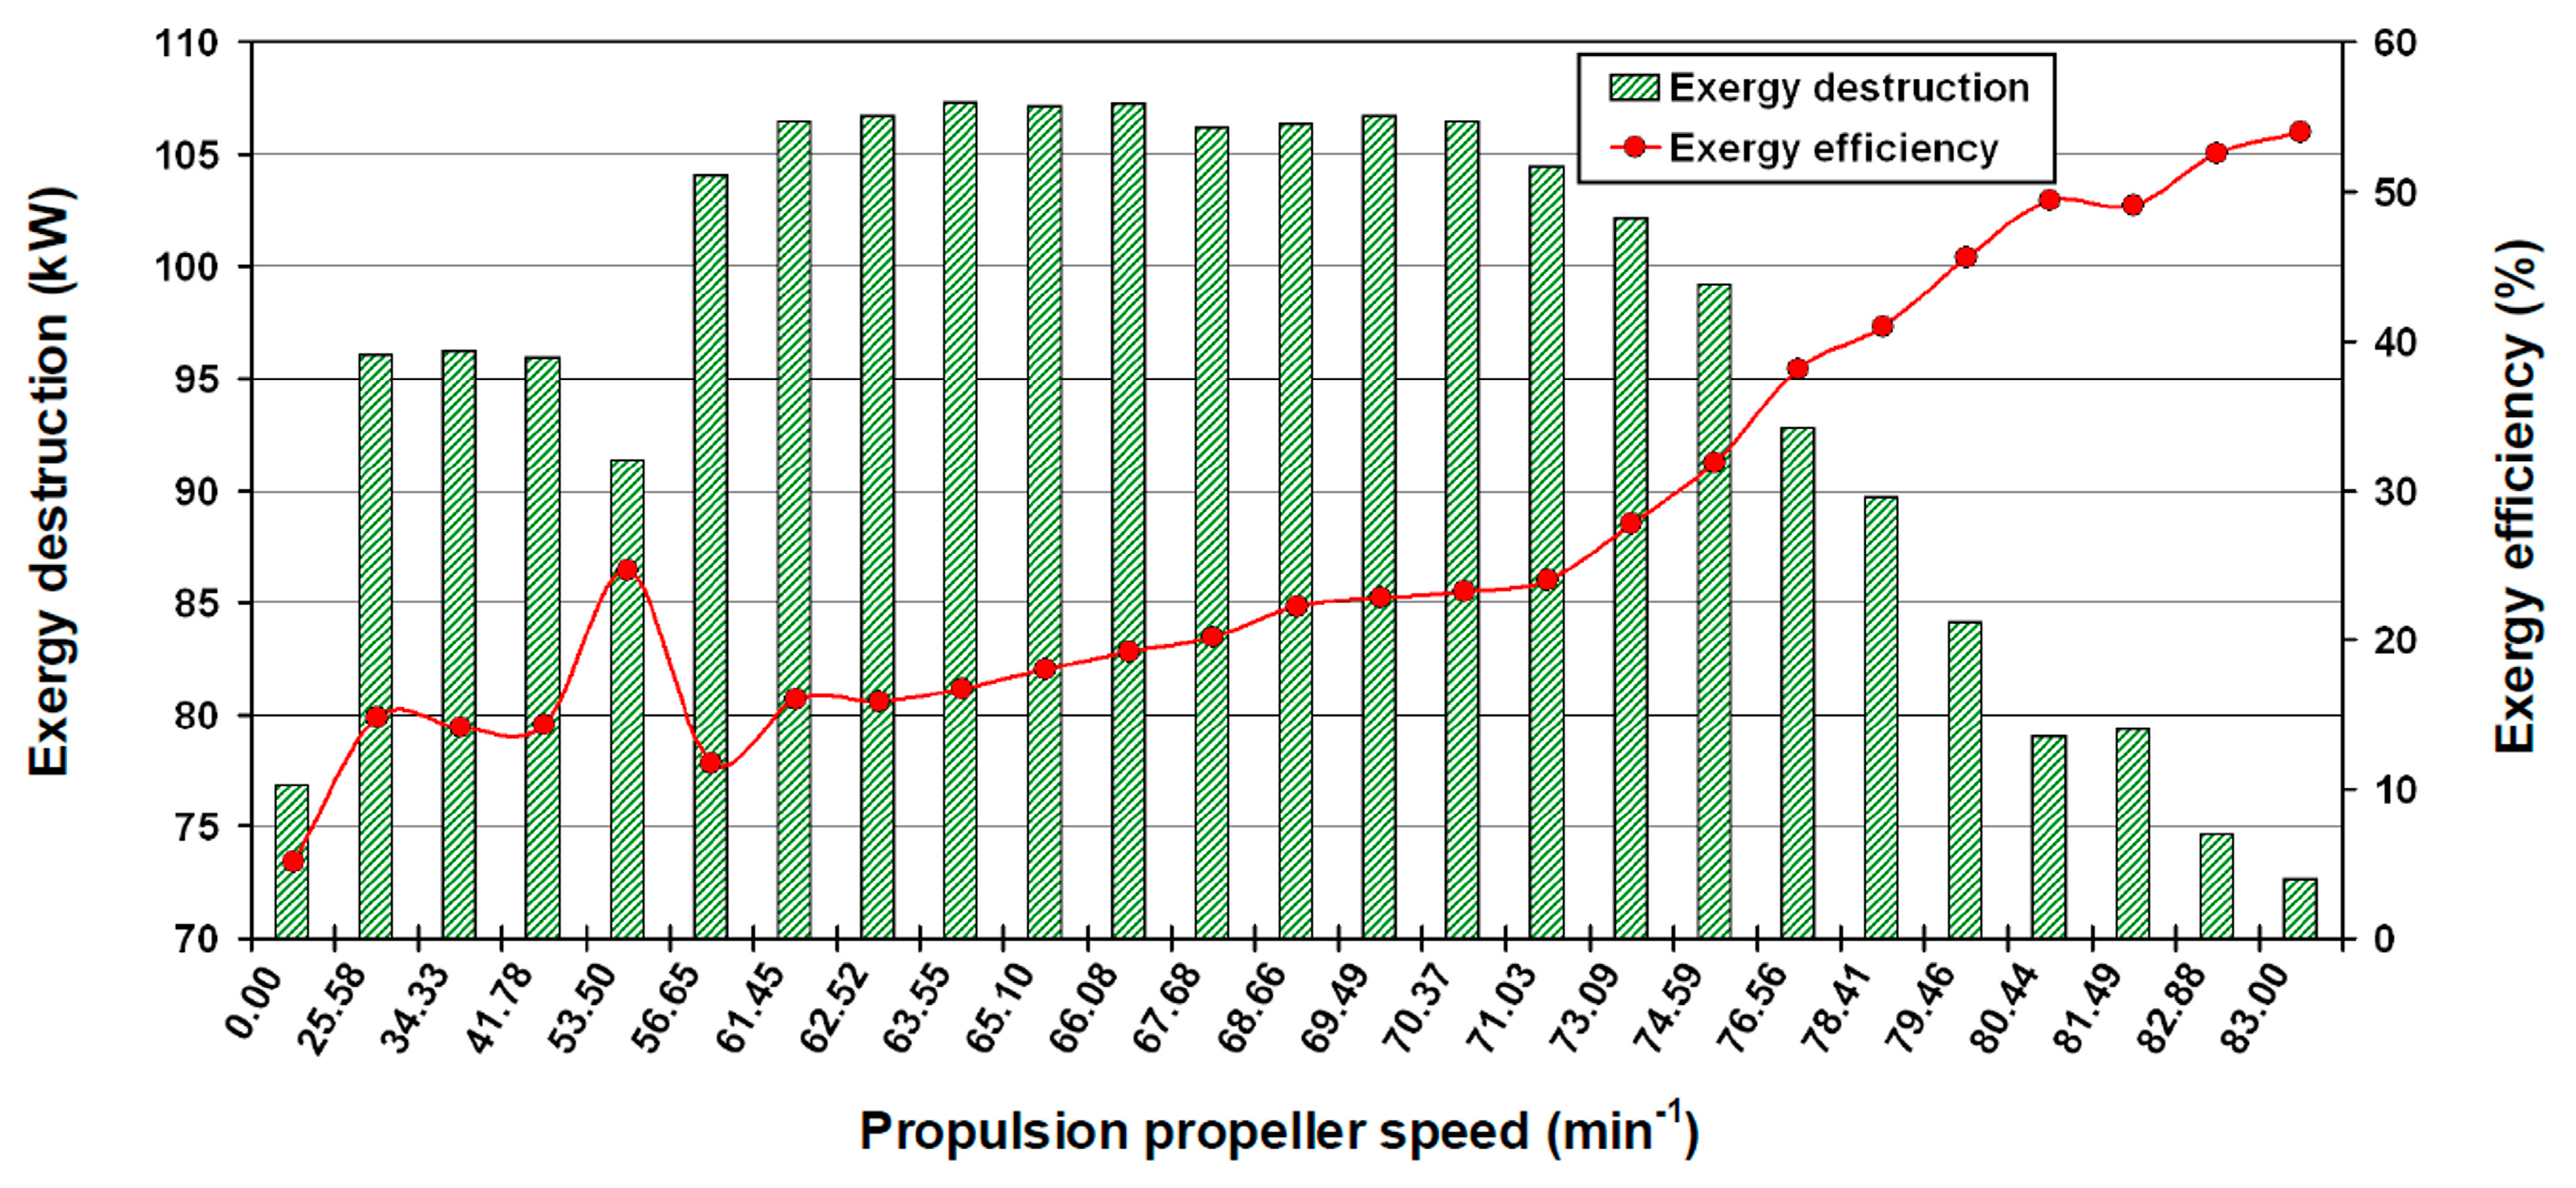
The exergy power loss or exergy destruction (Equation (18)) and the exergy efficiency of the forced draft fan (Equation (19)) are presented in Figure 10 for the entire range of propulsion propeller speeds.
The exergy destruction depends primarily on the current of the induction motor and on the air mass flow rate. For higher propulsion propeller speeds, the exergy destruction is also influenced by the air pressure at the fan outlet (Table 4).
The highest exergy destruction of 107.3 kW occurs for propulsion propeller speed of 63.55 min−1, while the lowest exergy destruction of 72.6 kW occurs for the highest propulsion propeller speed of 83.00 min−1. In the entire range of steam system loads, the average exergy destruction is 95.95 kW.
It is important to explain the decrease of exergy destruction in the range of propulsion propeller speeds from 71.03 min−1 to 83.00 min−1. In this load range, the air mass flow rate and the fan driving power increase almost continuously. The air temperature and pressure at the fan inlet are constant in that load range, while the air temperature at the fan outlet is almost constant, as reported in Table 4. The term m ˙ 1 · ( ε 1 ε 2 ) reduces the exergy destruction when the system load increases since the air pressure at the fan outlet continuously increases. An exception occurs between propulsion propeller speeds of 80.44 min−1 and 81.49 min−1 where the fan exergy destruction slightly increases. The continuous increase of air pressure at the fan outlet, with almost constant air temperature, causes a continuous increase in the outlet air specific exergy. Along with the increase in air mass flow rate, the increase in air specific exergy at the fan outlet causes the term m ˙ 1 · ( ε 1 ε 2 ) to increase faster than the fan driving power, which reduces the fan exergy destruction (Equation (18)) in the range of propeller speeds from 71.03 min−1 to 83.00 min−1.
In general, the exergy efficiency of a steam system component is inversely proportional to the exergy destruction. An increase in exergy destruction results with a decrease in exergy efficiency and vice versa. The change in exergy efficiency is directly proportional to the change of the air mass flow rate and, therefore, directly proportional to change of fan driving power for all of the observed steam system loads. An increase in the air mass flow rate leads to a simultaneous increase in the fan driving power, which causes an increase in the fan exergy efficiency. Conversely, a decrease in the air mass flow rate causes a decrease in the fan exergy efficiency. The lowest fan exergy efficiency is 5.10% and occurs for the lowest air mass flow rate of 4.80 kg/s (driving power 80.99 kW) when the propulsion propeller speed is 0.00 min−1, at the steam system startup. The highest fan exergy efficiency is 53.93% and occurs for the highest air mass flow rate of 20.60 kg/s (driving power 157.63 kW) when the propulsion propeller speed is 83.00 min−1.
This direct dependence between the exergy efficiency and the air mass flow rate (or driving power) is best seen between propulsion propeller speeds of 80.44 min−1 and 82.88 min−1. Between propulsion propeller speeds of 80.44 min−1 and 81.49 min−1, a slight decrease in the fan exergy efficiency (from 49.43% down to 49.06%) can be seen in Figure 10. This decrease occurs because the air mass flow rate decreases from 20.23 kg/s to 20.11 kg/s, while the fan driving power decreases from 156.18 kW to 155.71 kW.
When the propulsion propeller speed increases from 81.49 min−1 to 82.88 min−1, the fan exergy efficiency increases from 49.06% to 52.54%. This is caused by the increase in the air mass flow rate from 20.11 kg/s to 20.50 kg/s, while the fan driving power increases from 155.71 kW to 157.25 kW.
It can be concluded that the highest fan exergy efficiency can be obtained for the highest air mass flow rate and the highest fan driving power. A similar conclusion can be drawn for the fan energy efficiency (Figure 7). From the viewpoint of energy and exergy efficiency, the forced draft fan is a well-balanced device because, generally, the highest efficiencies are achieved for the highest steam system load, where the major part of LNG carrier operation is expected.
Compared against similar fans used in land-based steam power plants [35,85], the analyzed forced draft fan achieves significantly lower energy and exergy efficiency at the highest observed load. Future research on forced draft fans for marine applications should be focused on the possibilities for increasing its energy and exergy efficiency.
In the energy and exergy analyses of land-based steam power plants, several authors investigated on the influence of ambient temperature on the exergy destruction and exergy efficiency of steam plant components. A change in ambient temperature has no influence on the energy power loss or energy efficiency of the steam plant component [53]. Ahmadi and Toghraie [58], Aljundi [81], Kopac and Hilalci [82] and Ameri et al. [86] investigated the influence of ambient temperature on several land-based steam plant components. In general, they concluded that a change in ambient temperature has a low impact on the exergy destruction and exergy efficiency of most components in steam power plants. The only exception is the steam condenser, for which exergy destruction and exergy efficiency showed that they are influenced by ambient temperature.
Orović et al. [59] found that heat exchangers used in steam power plants (not only steam condensers) can be very sensitive to a change of ambient temperature, from the exergy aspect. For the analyzed steam air heater, the authors found that an increase in ambient temperature of 10 °C reduces the heat exchanger exergy efficiency by 5%, on average.
The general conclusion is that an increase in ambient temperature causes an increase in exergy destruction and a decrease in exergy efficiency to most of the components in steam power plants. As a general rule of thumb, a change in ambient temperature of 10 °C causes a change of 1% in the exergy efficiency of the steam power plant component.
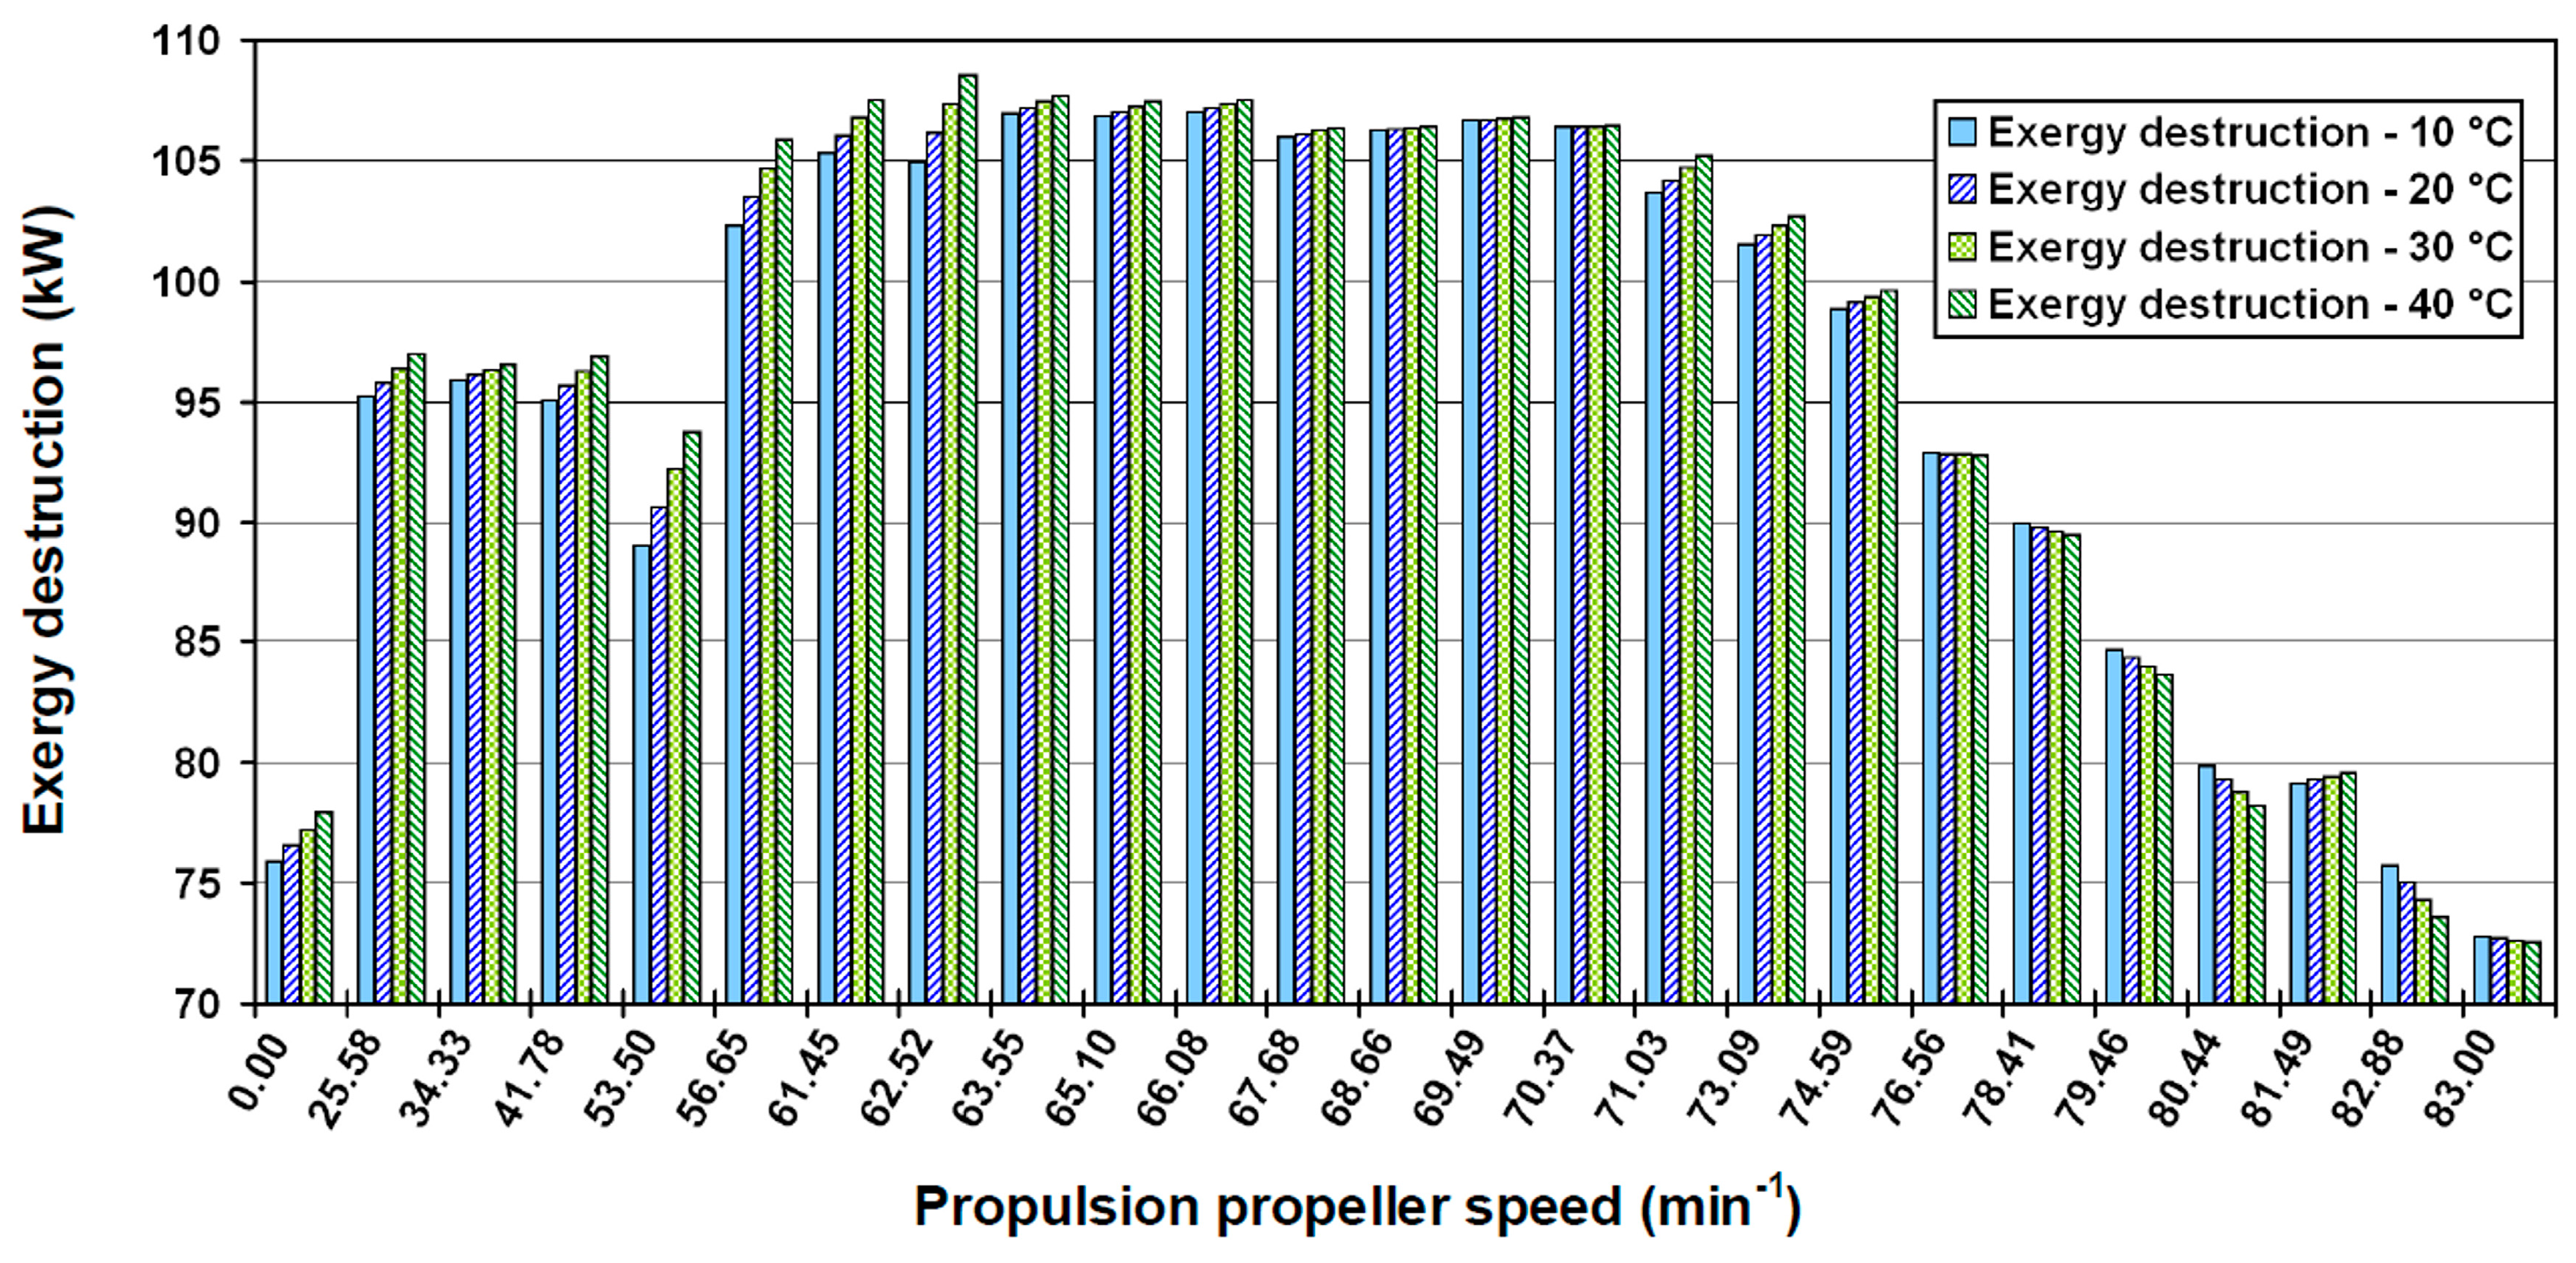
The influence of ambient temperature on the exergy destruction and exergy efficiency of the analyzed forced fan draft is also studied in this paper.
The influence of ambient temperature on the exergy destruction of the forced draft fan is shown in Figure 11. It can be noticed that, unlike other steam plant components, the forced draft fan exhibits a different behavior in terms of exergy destruction with respect to the ambient temperature.
For low and middle propulsion propeller speeds (from 0.00 min−1 to 74.59 min−1), the fan exergy destruction increases with an increase in the ambient temperature. In this range of steam system loads, the lowest fan exergy destruction is 75.85 kW and occurs for ambient temperature of 10 °C (0.00 min−1). On the other hand, the highest fan exergy destruction is 108.53 kW and occurs for ambient temperature of 40 °C (62.52 min−1). In this range of steam system loads, the average exergy destructions are: 100.74 kW for ambient temperature of 10 °C and 102.20 kW for ambient temperature of 40 °C. An increase in ambient temperature of 10 °C causes an increase of exergy destruction by 0.49 kW on average, in the range of low to middle steam system loads.
For high propulsion propeller speeds (from 76.56 min−1 to 83.00 min−1), the change in exergy destruction is very interesting. In this load range, fan exergy destruction decreases with an increase in ambient temperature, with the exception at propeller speed of 81.49 min−1. This is an unusual change for most of steam plant components and must be explained in detail.
The fan exergy destruction is calculated from Equation (18). In this equation, for a given steam system load and regardless of the ambient temperature, two terms remain constant: the air mass flow rate and the fan driving power. When the ambient temperature changes, the air specific exergy at the fan inlet and outlet also changes. Both of these two specific exergies achieve highest values for the lowest ambient temperatures, at 10 °C. An increase in the ambient temperature causes a decrease in both specific exergies. The rate of decrease in the specific exergies during the increase of ambient temperature defines the change in the exergy destruction.
For low and middle propulsion propeller speeds (from 0.00 min−1 to 74.59 min−1), an increase in ambient temperature of 10 °C causes a decrease in air specific exergy at the fan outlet ( ε 2 ) larger than the decrease in air specific exergy at the fan inlet ( ε 1 ). Therefore, from Equation (18), the term m ˙ 1 · ( ε 1 ε 2 ) increases with an increase in ambient temperature, which leads to a larger exergy destruction, in the range of propeller speeds between 0.00 min−1 and 74.59 min−1.
At higher propulsion propeller speeds, from 76.56 min−1 to 83.00 min−1, a different trend is detected. An increase in ambient temperature of 10 °C causes a decrease in air specific exergy at the fan outlet ( ε 2 ) smaller than the decrease in air specific exergy at the fan inlet ( ε 1 ). Therefore, from Equation (18), the term m ˙ 1 · ( ε 1 ε 2 ) decreases with an increase in ambient temperature, which leads to a smaller exergy destruction, in the range of propeller speeds between 76.56 min−1 and 83.00 min−1. At high steam system loads, the only exception occurs at the propulsion propeller speed of 81.49 min−1 where an increase in ambient temperature leads to an increase in exergy destruction, same as in the range of low to middle steam system loads.
In the range of high propeller speeds (from 76.56 min−1 to 83.00 min−1), the average exergy destruction is 82.10 kW at ambient temperature of 10 °C, while it is 81.37 kW at ambient temperature of 40 °C. Thus, an increase in ambient temperature of 10 °C causes an average decrease of fan exergy destruction by 0.25 kW.
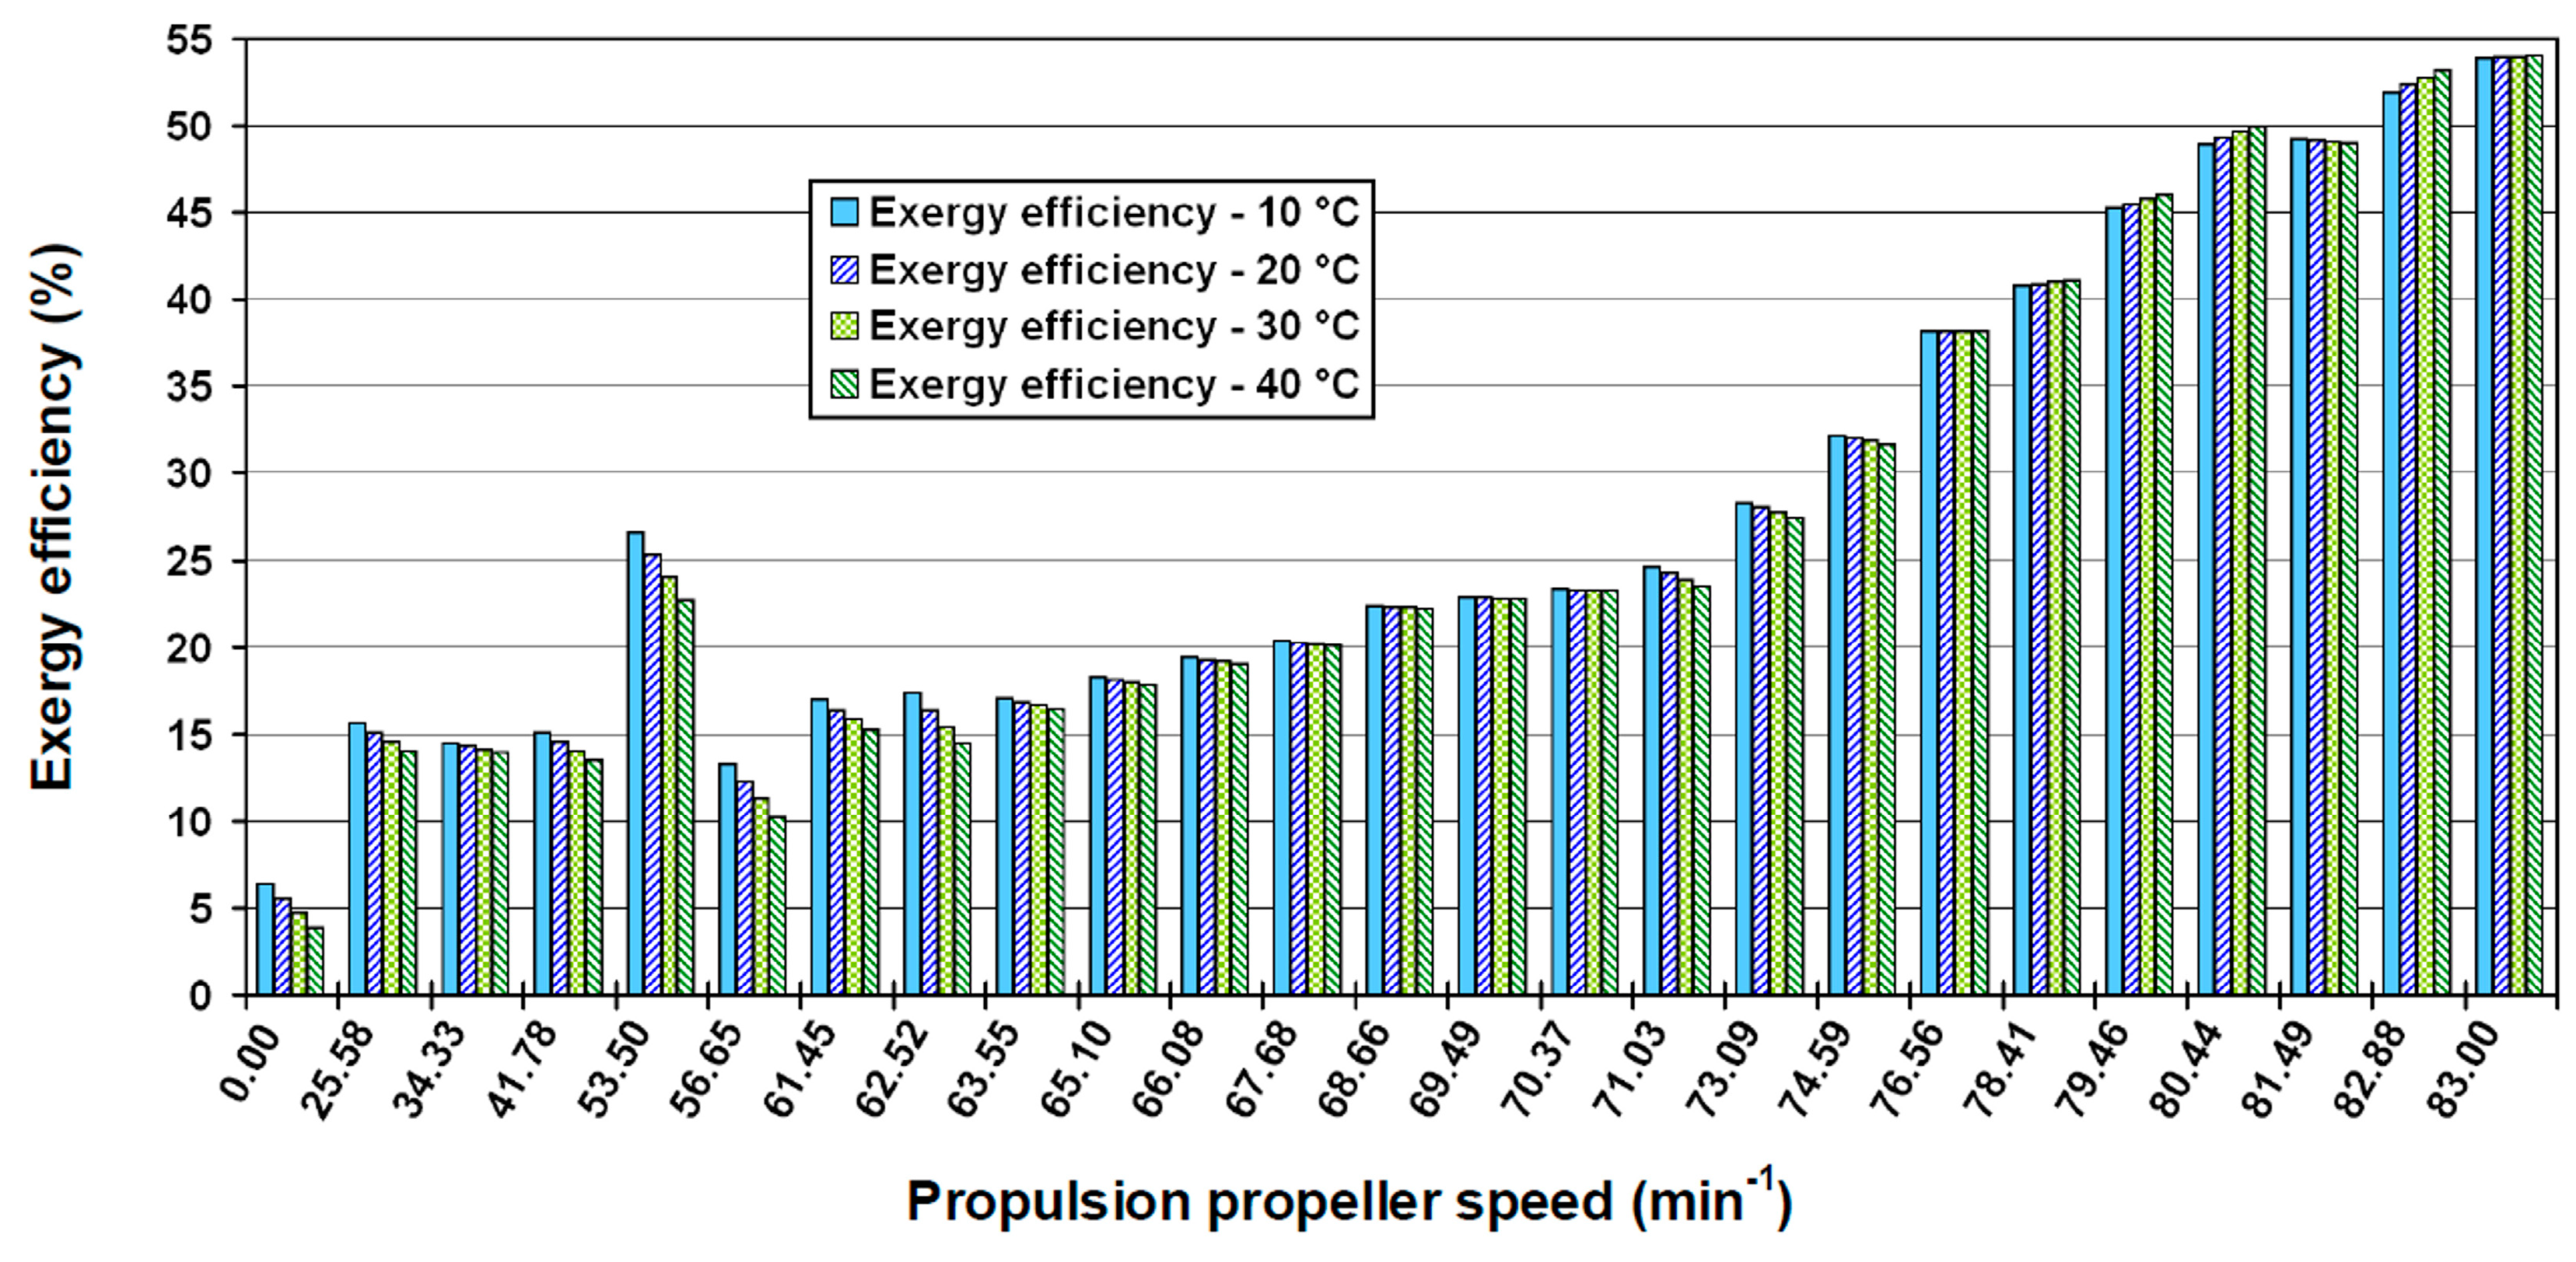
For the analyzed forced draft fan, during a change in ambient temperature, the exergy efficiency is inversely proportional to the exergy destruction, as shown in Figure 12.
In the range of propulsion propeller speeds from 0.00 min−1 to 74.59 min−1, an increase in ambient temperature causes a decrease in the exergy efficiency of the forced draft fan. In this load range, the lowest fan exergy efficiency is 3.86% and occurs for propulsion propeller speed of 0.00 min−1 and ambient temperature of 40 °C. On the other hand, the highest fan exergy efficiency is 32.15% and occurs for propulsion propeller speed of 74.59 min−1 and ambient temperature of 10 °C. In the range of low to middle steam system loads, the average exergy efficiency is 19.66% for ambient temperature of 10 °C and 18.43% for ambient temperature of 40 °C. An increase in the ambient temperature of 10 °C causes a decrease in the fan exergy efficiency by 0.41%, on average.
In the range of high steam system loads, between propulsion propeller speeds of 76.56 min−1 and 83.00 min−1, an increase in ambient temperature causes an increase in the exergy efficiency for almost all of the observed steam system loads. The lowest fan exergy efficiency is 38.12% and is obtained for the propulsion propeller speed of 76.56 min−1 and ambient temperature of 10 °C. On the other hand, the highest fan exergy efficiency is 54.00% and is obtained for the propulsion propeller speed of 83.00 min−1 and ambient temperature of 40 °C. The average exergy efficiency is 46.86% when ambient temperature is 10 °C and 47.33% when ambient temperature is 40 °C. An increase in ambient temperature of 10 °C causes an increase in fan exergy efficiency by 0.16%, on average, in the range of high steam system loads. The only exception is seen at the propulsion propeller speed of 81.49 min−1.
Therefore, it can be concluded that a change in ambient temperature does not have a significant influence on the exergy efficiency of the forced draft fan. A change in ambient temperature of 10 °C causes a change in fan exergy efficiency smaller than 0.5%, in the entire range of steam system loads.

7. Conclusions

This paper presented the energy and exergy analyses of a forced draft fan, used for the supply of combustion air to the steam generator of a marine steam propulsion system which operates on a conventional LNG carrier.
The forced draft fan is driven by an induction motor and the power delivered to the fan is calculated using the manufacturer’s data. This was extended onto the entire range of observed steam system loads. The power of the electrical drive depends on the alternating current delivered to the induction motor and the driving power increases with an increase in the steam system load. The increase in the power consumption of the forced draft fan leads to an immediate increase in the air mass flow rate through the observed fan. The analyzed forced draft fan achieves well balanced energy power inputs and outputs, which suggests low energy power losses. However, low energy power losses do not result with high energy efficiency in the forced draft fan.
The most significant impact on the fan energy power loss is caused by the air temperature difference between the fan outlet and inlet. The higher air temperature differences result in lower fan energy power losses and vice versa. The lowest fan energy power loss is 44.4 kW, while the highest energy power loss is 105.8 kW, for the observed range of steam system loads. The fan energy efficiency exhibits behavior opposite to the fan energy power loss. When the fan energy power loss increases, the energy efficiency simultaneously decreases and vice versa. In the observed range of steam system loads, the fan energy efficiency is in the range from 19.9% to 63.4%. For the highest steam system load, the fan energy efficiency is equal to 52.5%.
The electrical drive power presents a dominant share in the exergy power input of the forced draft fan, while the exergy power of the air flow stream has a low share. The fan exergy power output contains only the exergy power of the air flow stream and is not influenced by the electrical drive power. The exergy destruction of the forced draft fan depends primarily on the electrical drive power and on the air mass flow rate. At higher steam system loads, the fan exergy destruction is also influenced by the air pressure at the fan outlet. The lowest fan exergy destruction is 72.6 kW, while the highest is 107.3 kW. The exergy efficiency of the analyzed forced draft fan is directly proportional to the air mass flow rate and to the fan driving power. The lowest fan exergy efficiency is only 5.10% and occurs at steam system startup, while the highest exergy efficiency is equal to 53.93% and occurs at the highest steam system load.
The exergy destruction and the exergy efficiency of the forced draft fan with respect to ambient temperature exhibit different behavior than most steam plant components. In the range of low to middle steam system loads, an increase in ambient temperature causes an increase in fan exergy destruction and a respective decrease in exergy efficiency. In the range of high steam system loads, an increase in ambient temperature causes a decrease in exergy destruction and an increase in exergy efficiency. The reasons to these trends are found in the different rates of change in the air specific exergy at the fan inlet and outlet, when a change occurs in the ambient temperature. The ambient temperature does not have a significant impact on the exergy efficiency of the analyzed fan.
The analyzed forced draft fan, which operates in a marine steam propulsion system, achieves significantly lower energy and exergy efficiencies when compared to similar fans in conventional land-based steam power plants. Further research will be focused on the investigation of techniques and possibilities for the improvement of the energy and exergy efficiency in marine forced draft fans, especially for the highest loads, at which marine steam propulsion systems usually operate.

Author Contributions

Conceptualization, V.M., P.B., N.A. and I.L.; data curation, V.M.; formal analysis, V.M., P.B., N.A. and I.L.; investigation, V.M. and P.B.; methodology, V.M., P.B., N.A. and I.L.; supervision, V.M., N.A. and I.L.; validation, V.M. and P.B.; writing–original draft, V.M.; writing–review & editing, V.M., P.B., N.A. and I.L.

Funding

This research received no external funding.

Acknowledgments

The authors would like to extend their appreciations to the LNG carrier ship-owner for conceding measuring equipment and for all help during the exploitation measurements. This research has been supported by the Croatian Science Foundation under the project IP-2018-01-3739, CEEPUS network CIII-HR-0108, European Regional Development Fund under the grant KK.01.1.1.01.0009 (DATACROSS) and University of Rijeka scientific grant uniri-tehnic-18-275-1447.

Conflicts of Interest

The authors declare no conflicts of interest.

Nomenclature

Abbreviations:
ACAlternating Current
CFDComputational Fluid Dynamics
DCDirect Current
LNGLiquefied Natural Gas
RMSRoot-Mean-Square
SCRSelective Catalytic Reduction
Latin Symbols:
cvelocity, m/s
E ˙ stream flow power, kW
gacceleration of gravity, m/s2
h specific enthalpy, kJ/kg
Icurrent, A
m ˙ mass flow rate, kg/s or kg/h
ppressure, MPa or bar
Ppower, kW
PFpower factor, -
Q ˙ heat transfer, kW
s specific entropy, kJ/kg·K
Ttemperature, °C or K
Uvoltage, V
X ˙ heat heat exergy transfer, kW
zelevation, m
Greek symbols:
ε specific exergy, kJ/kg
η efficiency, -
Subscripts:
0ambient conditions
Ddestruction
emelectrical motor
enenergy
exexergy
iindex of fluid flow stream
INinlet (input)
OUToutlet (output)
PLpower loss

Appendix A

Measuring equipment main characteristics and specifications
Propulsion propeller speed:
Table A1. Kyma Shaft Power Meter (KPM-PFS)—reproduced from [87].
AccuracyAbsoluteRelative
Torque< ± 0.5%< ± 0.5%
Thrust< ± 5.0%< ± 5.0%
Revolution< ± 0.1%< ± 0.1%
Driving power *< ± 0.5%< ± 0.5%
* Driving power is calculated from torque and revolutions.
Air mass flow rate-forced draft fan inlet and outlet:
Table A2. Yamatake JTD930A-Differential Pressure Transmitter—reproduced from [88].
Measuring Range:35 kPa–700 kPa
Setting span:−100 kPa–700 kPa
Operating pressure range:2.0 kPa–14 MPa
Air temperature- forced draft fan inlet and outlet:
Table A3. Greisinger GTF 401-Pt100-Immersion probe—reproduced from [89].
Measuring range:from −50 °C up to +400 °C
Response time:approx. 10 s
Standard:DIN class B
Error ranges:± (0.30 + 0.00500) |Temp in °C|
Air pressure-forced draft fan inlet and outlet:
Table A4. Yamatake JTG940A-Pressure Transmitter—reproduced from [90].
Measuring range:35 kPa–3500 kPa
Setting span:−100 kPa–3500 kPa
Operating pressure range:2.0 kPa–3500 kPa
Forced draft fan electrical drive current:
Table A5. Fluke a3002 FC Wireless AC/DC Current Module—reproduced from [91].
Maximum AC:600 A
Maximum DC:1000 A
Current accuracy:DC: 0.5% + 3 Digits
AC: 1% + 3 Digits
Operating temperature:from −10 °C up to +50 °C

References

  1. Bloch, H.P. Petrochemical Machinery Insights; Elsevier Inc.: Amsterdam, The Netherlands, 2017. [Google Scholar]
  2. Dixon, S.L.; Hall, C.A. Fluid Mechanics and Thermodynamics of Turbomachinery, 6th ed.; Elsevier Inc.: Amsterdam, The Netherlands, 2010. [Google Scholar]
  3. Ye, X.; Ding, X.; Zhang, J.; Li, C. Numerical simulation of pressure pulsation and transient flow field in an axial flow fan. Energy 2017, 129, 185–200. [Google Scholar] [CrossRef]
  4. He, W.; Dai, Y.; Zhu, S.; Han, D.; Yue, C.; Pu, W. Influence from the blade installation angle of the windward axial fans on the performance of an air-cooled power plant. Energy 2013, 60, 416–425. [Google Scholar] [CrossRef]
  5. He, W.; Dai, Y.; Han, D.; Yue, C.; Pu, W. Influence from the rotating speed of the windward axial fans on the performance of an air-cooled power plant. Appl. Ther. Eng. 2014, 65, 14–23. [Google Scholar] [CrossRef]
  6. Bizjan, B.; Milavec, M.; Širok, B.; Trenc, F.; Hočevar, M. Energy dissipation in the blade tip region of an axial fan. J. Sound Vib. 2016, 382, 63–72. [Google Scholar] [CrossRef]
  7. Lu, J.; Lu, F.; Huang, J. Performance Estimation and Fault Diagnosis Based on Levenberg–Marquardt Algorithm for a Turbofan Engine. Energies 2018, 11, 181. [Google Scholar] [CrossRef]
  8. Sharanabasaweshwara, A.A.; Syed Firasat, A. Parametric Study of a Turbofan Engine with an Auxiliary High-Pressure Bypass. Int. J. Turbomach. Propuls. Power 2019, 4, 2. [Google Scholar] [CrossRef]
  9. Huang, G.; Xiang, X.; Xia, C.; Lu, W.; Li, L. Feasible Concept of an Air-Driven Fan with a Tip Turbine for a High-Bypass Propulsion System. Energies 2018, 11, 3350. [Google Scholar] [CrossRef]
  10. Lu, W.; Huang, G.; Xiang, X.; Wang, J.; Yang, Y. Thermodynamic and Aerodynamic Analysis of an Air-Driven Fan System in Low-Cost High-Bypass-Ratio Turbofan Engine. Energies 2019, 12, 1917. [Google Scholar] [CrossRef]
  11. Stafford, J.; Walsh, E.; Egan, V. A study on the flow field and local heat transfer performance due to geometric scaling of centrifugal fans. Int. J. Heat Fluid Flow 2011, 32, 1160–1172. [Google Scholar] [CrossRef]
  12. Lin, S.C.; Tsai, M.L. An integrated performance analysis for a backward-inclined centrifugal fan. Comput. Fluids 2012, 56, 24–38. [Google Scholar] [CrossRef]
  13. Gholamian, M.; Rao, G.K.M.; Panitapu, B. Effect of axial gap between inlet nozzle and impeller on efficiency and flow pattern in centrifugal fans, numerical and experimental analysis. Case Stud. Ther. Eng. 2013, 1, 26–37. [Google Scholar] [CrossRef] [Green Version]
  14. Chunxi, L.; Ling, W.S.; Yakui, J. The performance of a centrifugal fan with enlarged impeller. Energy Convers. Manag. 2011, 52, 2902–2910. [Google Scholar] [CrossRef]
  15. Fernández Oro, J.M.; Pereiras García, B.; González, J.; Argüelles Díaz, K.M.; Velarde-Suárez, S. Numerical Methodology for the Assessment of Relative and Absolute Deterministic Flow Structures in the Analysis of Impeller-Tongue Interactions for Centrifugal Fans. Comput. Fluids 2013, 86, 310–325. [Google Scholar] [CrossRef]
  16. Lin, S.C.; Huang, C.L. An integrated experimental and numerical study of forward–curved centrifugal fan. Exp. Ther. Fluid Sci. 2002, 26, 421–434. [Google Scholar] [CrossRef]
  17. Tsai, B.J.; Wu, C.L. Investigation of a miniature centrifugal fan. Appl. Ther. Eng. 2007, 27, 229–239. [Google Scholar] [CrossRef]
  18. Chen, G.; Xu, W.; Zhao, J.; Zhang, H. Energy-Saving Performance of Flap-Adjustment-Based Centrifugal Fan. Energies 2018, 11, 162. [Google Scholar] [CrossRef]
  19. Paramasivam, K.; Rajoo, S.; Romagnoli, A.; Yahya, W.J. Tonal noise prediction in a small high speed centrifugal fan and experimental validation. Appl. Acoust. 2017, 125, 59–70. [Google Scholar] [CrossRef]
  20. Sanjose, M.; Moreau, S. Direct noise prediction and control of an installed large low-speed radial fan. Eur. J. Mech. B 2017, 61, 235–243. [Google Scholar] [CrossRef] [Green Version]
  21. Trabelsi, H.; Abid, M.; Taktak, M.; Fakhfakh, T.; Haddar, M. Effect of the aerodynamic force modeling on the tonal noise prediction model for axial fan: Sensitivity and uncertainty analysis. Appl. Acoust. 2017, 117, 61–65. [Google Scholar] [CrossRef]
  22. Wolfram, D.; Carolus, T.H. Experimental and numerical investigation of the unsteady flow field and tone generation in an isolated centrifugal fan impeller. J. Sound Vib. 2010, 329, 4380–4397. [Google Scholar] [CrossRef]
  23. Zhang, J.; Chu, W.; Zhang, H.; Wu, Y.; Dong, X. Numerical and experimental investigations of the unsteady aerodynamics and aero-acoustics characteristics of a backward curved blade centrifugal fan. Appl. Acoust. 2016, 110, 256–267. [Google Scholar] [CrossRef]
  24. Qi, D.; Mao, Y.; Jun, L.; Yuan, M. Experimental study on the noise reduction of an industrial forward-curved blades centrifugal fan. Appl. Acoust. 2009, 70, 1041–1050. [Google Scholar] [CrossRef]
  25. Zhang, W.; Wang, X.; Jing, X.; Liang, A.; Sun, X. Three-dimensional analysis of vane sweep effects on fan interaction noise. J. Sound Vib. 2017, 391, 73–94. [Google Scholar] [CrossRef]
  26. Zhang, J.; Chu, W.; Zhang, J.; Lv, Y. Vibroacoustic Optimization Study for the Volute Casing of a Centrifugal Fan. Appl. Sci. 2019, 9, 859. [Google Scholar] [CrossRef]
  27. Nurbanasari, M.; Kristyadi, T.; Purwanto, T.S.; Maulana, A.; Fadilah, R.R. Damage analysis of the forced draft fan blade in coal fired power plant. Case Stud. Eng. Fail. Anal. 2017, 8, 49–56. [Google Scholar] [CrossRef]
  28. Trebuna, F.; Šimcák, F.; Bocko, J.; Trebuna, P. Identification of causes of radial fan failure. Eng. Fail. Anal. 2009, 16, 2054–2065. [Google Scholar] [CrossRef]
  29. Vaccarini, M.; Carbonari, A.; Casals, M. Development and calibration of a model for the dynamic simulation of fans with induction motors. Appl. Ther. Eng. 2017, 111, 647–659. [Google Scholar] [CrossRef] [Green Version]
  30. Ding, S.; Liu, J.; Zhang, L. Fan characteristics of the self-support components of rotor ends and its performance matching. Int. J. Heat Mass Transf. 2017, 108, 1917–1923. [Google Scholar] [CrossRef]
  31. Viorel-Mihai, N.; Ioan, C. The vibrations’ study to the burn gas exhaust fan from a thermoelectric power plant. Appl. Math. Model. 2017, 43, 454–463. [Google Scholar] [CrossRef]
  32. Wang, Y.; Ma, Z.; Shen, Y.; Tang, Y.; Ni, M.; Chi, Y.; Yan, J.; Cen, K. A power-saving control strategy for reducing the total pressure applied by the primary air fan of a coal-fired power plant. Appl. Energy 2016, 175, 380–388. [Google Scholar] [CrossRef]
  33. Wang, Y.; Tan, H.; Dong, K.; Liu, H.; Xiao, J.; Zhang, J. Study of ash fouling on the blade of induced fan in a 330 MW coal-fired power plant with ultra-low pollutant emission. Appl. Ther. Eng. 2017, 118, 283–291. [Google Scholar] [CrossRef]
  34. Kowalczyk, T.; Ziółkowski, P.; Badur, J. Exergy Losses in the Szewalski Binary Vapor Cycle. Entropy 2015, 17, 7242. [Google Scholar] [CrossRef]
  35. Uysal, C.; Kurt, H.; Kwak, H.Y. Exergetic and thermoeconomic analyses of a coal-fired power plant. Int. J. Ther. Sci. 2017, 117, 106–120. [Google Scholar] [CrossRef]
  36. Bühler, F.; Van Nguyen, T.; Kjær Jensen, J.; Müller Holm, F.; Elmegaard, B. Energy, exergy and advanced exergy analysis of a milk processing factory. Energy 2018, 162, 576–592. [Google Scholar] [CrossRef] [Green Version]
  37. Taner, T. Optimisation processes of energy efficiency for a drying plant: A case of study for Turkey. Appl. Ther. Eng. 2015, 80, 247–260. [Google Scholar] [CrossRef]
  38. Naserbegi, A.; Aghaie, M.; Minuchehr, A.; Alahyarizadeh, G.H. A novel exergy optimization of Bushehr nuclear power plant by gravitational search algorithm (GSA). Energy 2018, 148, 373–385. [Google Scholar] [CrossRef]
  39. Serrano-Sanchez, C.; Olmeda-Delgado, M.; Petrakopoulou, F. Exergy and Economic Evaluation of a Hybrid Power Plant Coupling Coal with Solar Energy. Appl. Sci. 2019, 9, 850. [Google Scholar] [CrossRef]
  40. Siddiqui, M.E.; Taimoor, A.A.; Almitani, K.H. Energy and Exergy Analysis of the S-CO2 Brayton Cycle Coupled with Bottoming Cycles. Processes 2018, 6, 153. [Google Scholar] [CrossRef]
  41. Ahmadi, G.; Toghraie, D.; Akbari, O.A. Energy, exergy and environmental (3E) analysis of the existing CHP system in a petrochemical plant. Renew. Sustain. Energy Rev. 2019, 99, 234–242. [Google Scholar] [CrossRef]
  42. Yilmaz, F. Thermodynamic performance evaluation of a novel solar energy based multigeneration system. Appl. Ther. Eng. 2018, 143, 429–437. [Google Scholar] [CrossRef]
  43. Mrzljak, V.; Poljak, I.; Žarković, B. Exergy Analysis of Steam Pressure Reduction Valve in Marine Propulsion Plant on Conventional LNG Carrier. Int. J. Marit. Sci. Technol. 2018, 65, 24–31. [Google Scholar] [CrossRef]
  44. Blažević, S.; Mrzljak, V.; Anđelić, N.; Car, Z. Comparison of energy flow stream and isentropic method for steam turbine energy analysis. Acta Polytech. 2019, 59, 109–125. [Google Scholar] [CrossRef]
  45. Baldi, F.; Johnson, H.; Gabrielii, C.; Andersson, K. Energy and Exergy Analysis of Ship Energy Systems—The Case study of a Chemical Tanker. Int. J. Thermodyn. 2015, 18, 82–93. [Google Scholar] [CrossRef]
  46. Baldi, F.; Ahlgren, F.; Van Nguyen, T.; Thern, M.; Andersson, K. Energy and Exergy Analysis of a Cruise Ship. Energies 2018, 11, 2508. [Google Scholar] [CrossRef]
  47. Koroglu, T.; Sogut, O.S. Conventional and Advanced Exergy Analyses of a Marine Steam Power Plant. Energy 2018, 163, 392–403. [Google Scholar] [CrossRef]
  48. Mrzljak, V.; Senčić, T.; Žarković, B. Turbogenerator Steam Turbine Variation in Developed Power: Analysis of Exergy Efficiency and Exergy Destruction Change. Model. Simul. Eng. 2018, 2018, 2945325. [Google Scholar] [CrossRef]
  49. Mrzljak, V.; Poljak, I.; Prpić-Oršić, J. Exergy analysis of the main propulsion steam turbine from marine propulsion plant. Shipbuild. Theory Pract. Nav. Archit. Mar. Eng. Ocean Eng. 2019, 70, 59–77. [Google Scholar] [CrossRef]
  50. Koroglu, T.; Sogut, O.S. Advanced exergy analysis of an organic Rankine cycle waste heat recovery system of a marine power plant. J. Ther. Eng. 2017, 3, 1136–1148. [Google Scholar] [CrossRef]
  51. Ikegami, Y.; Yasunaga, T.; Morisaki, T. Ocean Thermal Energy Conversion Using Double-Stage Rankine Cycle. J. Mar. Sci. Eng. 2018, 6, 21. [Google Scholar] [CrossRef]
  52. Author Name Ono, Y.; Uchida, I.; Nakano, K. Main Boiler (MB-4E-KS) Forced Draft Fan, H. No. 1728/29/30 Shipyard & Machinery Works, Internal LNG Carrier Documentation; Mitsubishi Heavy Industries, Ltd.: Nagasaki, Japan, 2004. [Google Scholar]
  53. Valencia, G.; Fontalvo, A.; Cárdenas, Y.; Duarte, J.; Isaza, C. Energy and Exergy Analysis of Different Exhaust Waste Heat Recovery Systems for Natural Gas Engine Based on ORC. Energies 2019, 12, 2378. [Google Scholar] [CrossRef]
  54. Adibhatla, S.; Kaushik, S.C. Energy, exergy, economic and environmental (4E) analyses of a conceptual solar aided coal fired 500 MWe thermal power plant with thermal energy storage option. Sustain. Energy Technol. Assess. 2017, 21, 89–99. [Google Scholar] [CrossRef]
  55. Mrzljak, V.; Poljak, I.; Medica-Viola, V. Thermodynamical analysis of high-pressure feed water heater in steam propulsion system during exploitation. Shipbuild. Theory Pract. Nav. Archit. Mar. Eng. Ocean Eng. 2017, 68, 45–61. [Google Scholar] [CrossRef]
  56. Poljak, I.; Orović, J.; Mrzljak, V. Energy and exergy analysis of the condensate pump during internal leakage from the marine steam propulsion system. Sci. J. Mar. Res. 2018, 32, 268–280. [Google Scholar] [CrossRef]
  57. Yildirim, E.; Altuntas, O.; Mahir, N.; Karakoc, T.H. Energy, exergy analysis, and sustainability assessment of different engine powers for helicopter engines. Int. J. Green Energy 2017, 14, 1093–1099. [Google Scholar] [CrossRef]
  58. Ahmadi, G.R.; Toghraie, D. Energy and exergy analysis of Montazeri Steam Power Plant in Iran. Renew. Sustain. Energy Rev. 2016, 56, 454–463. [Google Scholar] [CrossRef]
  59. Orović, J.; Mrzljak, V.; Poljak, I. Efficiency and Losses Analysis of Steam Air Heater from Marine Steam Propulsion Plant. Energies 2018, 11, 3019. [Google Scholar] [CrossRef]
  60. Mrzljak, V.; Prpić-Oršić, J.; Senčić, T. Change in steam generators main and auxiliary energy flow streams during the load increase of LNG carrier steam propulsion system. Sci. J. Mar. Res. 2018, 32, 121–131. [Google Scholar] [CrossRef]
  61. Ameri, M.; Mokhtari, H.; Mostafavi Sani, M. 4E analyses and multi-objective optimization of different fuels application for a large combined cycle power plant. Energy 2018, 156, 371–386. [Google Scholar] [CrossRef]
  62. Mrzljak, V.; Poljak, I.; Medica-Viola, V. Dual fuel consumption and efficiency of marine steam generators for the propulsion of LNG carrier. Appl. Ther. Eng. 2017, 119, 331–346. [Google Scholar] [CrossRef]
  63. Kanoğlu, M.; Çengel, Y.A.; Dincer, I. Efficiency Evaluation of Energy Systems; Springer Briefs in Energy; Springer: Berlin/Heidelberg, Germany, 2012. [Google Scholar] [CrossRef]
  64. Sadi, M.; Arabkoohsar, A. Exergoeconomic analysis of a combined solar-waste driven power plant. Renew. Energy 2019, 141, 883–893. [Google Scholar] [CrossRef]
  65. Szargut, J. Exergy Method—Technical and Ecological Applications; WIT Press: Southampton, UK, 2005. [Google Scholar]
  66. Elsafi, A.M. Exergy and exergoeconomic analysis of sustainable direct steam generation solar power plants. Energy Convers. Manag. 2015, 103, 338–347. [Google Scholar] [CrossRef]
  67. Ahmadi, G.; Toghraie, D.; Akbari, O.A. Technical and environmental analysis of repowering the existing CHP system in a petrochemical plant: A case study. Energy 2018, 159, 937–949. [Google Scholar] [CrossRef]
  68. Lorencin, I.; Anđelić, N.; Mrzljak, V.; Car, Z. Exergy analysis of marine steam turbine labyrinth (gland) seals. Sci. J. Mar. Res. 2019, 33, 76–83. [Google Scholar] [CrossRef]
  69. Nazari, N.; Heidarnejad, P.; Porkhial, S. Multi-objective optimization of a combined steam-organic Rankine cycle based on exergy and exergo-economic analysis for waste heat recovery application. Energy Convers. Manag. 2016, 127, 366–379. [Google Scholar] [CrossRef]
  70. Ahmadi, G.; Toghraie, D.; Azimian, A.; Ali Akbari, O. Evaluation of synchronous execution of full repowering and solar assisting in a 200 MW steam power plant, a case study. Appl. Ther. Eng. 2017, 112, 111–123. [Google Scholar] [CrossRef]
  71. Regulagadda, P.; Dincer, I.; Naterer, G.F. Exergy analysis of a thermal power plant with measured boiler and turbine losses. Appl. Ther. Eng. 2010, 30, 970–976. [Google Scholar] [CrossRef]
  72. Taner, T.; Sivrioglu, M. Energy-exergy analysis and optimisation of a model sugar factory in Turkey. Energy 2015, 93, 641–654. [Google Scholar] [CrossRef]
  73. Mrzljak, V.; Poljak, I.; Mrakovčić, T. Energy and exergy analysis of the turbo-generators and steam turbine for the main feed water pump drive on LNG carrier. Energy Convers. Manag. 2017, 140, 307–323. [Google Scholar] [CrossRef]
  74. Ahmadi, G.; Toghraie, D.; Ali Akbari, O. Solar parallel feed water heating repowering of a steam power plant: A case study in Iran. Renew. Sustain. Energy Rev. 2017, 77, 474–485. [Google Scholar] [CrossRef]
  75. Tan, H.; Shan, S.; Nie, Y.; Zhao, Q. A new boil-off gas re-liquefaction system for LNG carriers based on dual mixed refrigerant cycle. Cryogenics 2018, 92, 84–92. [Google Scholar] [CrossRef]
  76. Mitrović, D.; Živković, D.; Laković, M.S. Energy and Exergy Analysis of a 348.5 MW Steam Power Plant. Energy Sources 2010, 32, 1016–1027. [Google Scholar] [CrossRef]
  77. Lemmon, E.W.; Huber, M.L.; McLinden, M.O. Reference Fluid Thermodynamic and Transport Properties-REFPROP; Version 8.0, User’s Guide; NIST: Gaithersburg, MD, USA, 2007.
  78. Cengel, Y.; Boles, M. Thermodynamics an Engineering Approach, 8th ed.; McGraw-Hill Education: New York, NY, USA, 2015. [Google Scholar]
  79. Erdem, H.H.; Akkaya, A.V.; Cetin, B.; Dagdas, A.; Sevilgen, S.H.; Sahin, B.; Teke, I.; Gungor, C.; Atas, S. Comparative energetic and exergetic performance analyses for coal-fired thermal power plants in Turkey. Int. J. Ther. Sci. 2009, 48, 2179–2186. [Google Scholar] [CrossRef]
  80. Moran, M.; Shapiro, H.; Boettner, D.D.; Bailey, M.B. Fundamentals of Engineering Thermodynamics, 7th ed.; John Wiley and Sons, Inc.: Hoboken, NJ, USA, 2011. [Google Scholar]
  81. Aljundi, I.H. Energy and exergy analysis of a steam power plant in Jordan. Appl. Ther. Eng. 2009, 29, 324–328. [Google Scholar] [CrossRef]
  82. Kopac, M.; Hilalci, A. Effect of ambient temperature on the efficiency of the regenerative and reheat catalagzi power plant in Turkey. Appl. Ther. Eng. 2007, 27, 1377–1385. [Google Scholar] [CrossRef]
  83. Li, J.; Wang, K.; Cheng, L. Experiment and optimization of a new kind once-through heat recovery steam generator (HRSG) based on analysis of exergy and economy. Appl. Ther. Eng. 2017, 120, 402–415. [Google Scholar] [CrossRef]
  84. Hughes, A. Electric Motors and Drives—Fundamentals, Types and Applications, 3rd ed.; Elsevier Ltd.: Amsterdam, The Netherlands, 2006. [Google Scholar]
  85. Hafdhi, F.; Khir, T.; Ben Yahyia, A.; Ben Brahim, A. Energetic and exergetic analysis of a steam turbine power plant in an existing phosphoric acid factory. Energy Convers. Manag. 2015, 106, 1230–1241. [Google Scholar] [CrossRef]
  86. Ameri, M.; Ahmadi, P.; Hamidi, A. Energy, exergy and exergoeconomic analysis of a steam power plant: A case study. Int. J. Energy Res. 2009, 33, 499–512. [Google Scholar] [CrossRef]
  87. Kyma Shaft Power Meter: Continuous Measurement of Torque, Power and Revolutions. Available online: https://kyma.no/wp-content/uploads/2019/03/KPM-Kyma-Shaft-Power-Meter-brochure1.pdf (accessed on 27 October 2019).
  88. Yamatake JTD Series of Differential Pressure Transmitters. Available online: http://www.krtproduct.com/krt_Picture/sample/1_spare%20part/yamatake/Fi_ss01/SS2-DST100-0100.pdf (accessed on 27 October 2019).
  89. Greisinger Handheld Instrument: Temperature Infrared – Pt100 Measuring Probe. Available online: https://www.greisinger.de/files/upload/en/produkte/kat/k16_011_EN_oP.pdf (accessed on 27 October 2019).
  90. Yamatake JTG Series Of Pressure Transmitters. Available online: http://www.industriascontrolpro.com/fichat/SS2-DST400-0100.pdf (accessed on 27 October 2019).
  91. Fluke Wireless AC/DC Current Clamp. Available online: https://dam-assets.fluke.com/s3fs-public/a3002fc_cmeng0000.pdf (accessed on 27 October 2019).
Figure 1. The cross section of the forced draft fan with main parts and used materials.
Jmse 07 00381 g001
Figure 2. The operating parameters of the forced draft fan with induction motor necessary for energy and exergy analyses.
Jmse 07 00381 g002
Figure 3. Polynomial for the induction motor power factor relative to the induction motor current.
Jmse 07 00381 g003
Figure 4. Calculated power of the electrical drive with respect to the steam system load.
Jmse 07 00381 g004
Figure 5. Energy power input and output of the forced draft fan with respect to the steam system load.
Jmse 07 00381 g005
Figure 6. The shares of electrical drive power and air flow stream in the energy power input of the forced draft fan.
Jmse 07 00381 g006
Figure 7. Energy power loss and energy efficiency of the forced draft fan with respect to the steam system load.
Jmse 07 00381 g007
Figure 8. Exergy power input and output of the forced draft fan with respect to the steam system load.
Jmse 07 00381 g008
Figure 9. The shares of electrical drive power and air flow stream in the exergy power input of the forced draft fan.
Jmse 07 00381 g009
Figure 10. Exergy destruction and exergy efficiency of the forced draft fan with respect to the steam system load.
Jmse 07 00381 g010
Figure 11. Exergy destruction of the forced draft fan with respect to the ambient air temperature.
Jmse 07 00381 g011
Figure 12. Exergy efficiency of the forced draft fan with respect to the ambient air temperature.
Jmse 07 00381 g012
Table 1. Operating parameters and characteristics of the forced draft fan.
Maximum Capacity1330 m3/min
Maximum pressure increase5.6 kPa
Suction temperature50 °C
Maximum speed1788 min−1
Fan moment of inertia220 kg · m2
Inlet vane torque320 Nm
Noise100 dB at 1.0 m (with anti-noise wall)
Fan mass3100 kg
Anti-noise wall mass240 kg
Table 2. Main operating characteristics of the forced draft fan induction motor.
3-Phase, Squirrel Cage Induction Motor
Load Characteristics:Load (%)Current (A)Power Factor
-501810.71
752380.8
1002950.84
Maximum rated output185 kW-
Rated voltage440 V
Rated frequency60 Hz
Maximum rated speed1788 min−1
Maximum rated current295 A
No-load current116 A
Maximum nominal torque989 Nm
Speed at minimum torque1350 min−1
Maximum starting time from hot18 s
Maximum starting time from cold32 s
The ambient temperature45 °C
Cooling systemSelf-ventilated
Noise75 dB
Moment of inertia3.5 kg · m2
Motor total mass970 kg
Table 3. Equations of the forced draft fan energy and exergy balances.
VariableEnergy Balance [78]Exergy Balance [79]
EquationEquation NumberEquationEquation Number
Power input E ˙ en , IN = m ˙ 1 · h 1 + P (12) E ˙ ex , IN = m ˙ 1 · ε 1 + P (16)
Power output E ˙ en , OUT = m ˙ 2 · h 2 (13) E ˙ ex , OUT = m ˙ 2 · ε 2 (17)
Power loss (destruction) E ˙ en , PL = E ˙ en , IN E ˙ en , OUT = = m ˙ 1 · h 1 + P m ˙ 2 · h 2 = = m ˙ 1 · ( h 1 h 2 ) + P (14) E ˙ ex , D = E ˙ ex , IN E ˙ ex , OUT = = m ˙ 1 · ε 1 + P m ˙ 2 · ε 2 = = m ˙ 1 · ( ε 1 ε 2 ) + P (18)
Efficiency [35,80] η en = m ˙ 2 · h 2 m ˙ 1 · h 1 P (15) η ex = m ˙ 2 · ε 2 m ˙ 1 · ε 1 P (19)
Table 4. Measurement data for air flow streams at fan inlet and outlet with regard to propeller speed.
Propulsion Propeller Speed
(min−1)
Air at the Forced Draft Fan Inlet (1*)Air at the Forced Draft Fan Outlet (2*)
Temperature (°C)Pressure (MPa)**Mass Flow Rate
(kg/h)
Temperature (°C)Pressure
(MPa)
Mass Flow Rate (kg/h)
0.00500.100017277.75550.1005117277.75
25.584240466.88450.1015440466.88
34.334240037.02440.1015540037.02
41.784239920.58450.1014939920.58
53.504445879.12500.1022845879.12
56.654044208.90440.1010744208.90
61.453950399.64420.1015450399.64
62.524050266.98440.1014450266.98
63.553951811.38410.1016551811.38
65.103953086.68410.1017753086.68
66.083954501.66410.1018754501.66
67.683954698.94410.1019754698.94
68.663957363.30410.1021457363.30
69.493958474.62410.1021858474.62
70.373958754.70410.1022258754.70
71.033957865.86420.1022557865.86
73.093960840.72420.1025860840.72
74.593964056.60420.1029264056.60
76.563967504.14420.1034567504.14
78.413969049.62420.1036869049.62
79.463971468.28420.1040671468.28
80.443972818.82420.1043872818.82
81.493972399.96430.1042972399.96
82.883973807.20420.1046473807.20
83.003974167.02430.1046974167.02
* Air flow streams numeration refers to Figure 2; ** Air pressure variations at the fan inlet are negligibly small.
Table 5. Measured stator current for the fan induction motor along with the calculated power factors (Equation (21)) for the entire range of steam system loads (propulsion propeller speeds).
Propulsion Propeller Speed (min−1)Current (A)Power Factor (-)Propulsion Propeller Speed (min−1)Current (A)Power Factor (-)
0.00162.60.67069.49236.00.798
25.58203.60.75270.37236.50.798
34.33202.80.75071.03234.90.796
41.78202.60.75073.09240.20.802
53.50214.40.76974.59245.70.808
56.65210.20.76276.56251.40.814
61.45221.40.77978.41253.80.816
62.52221.40.77979.46257.60.819
63.55224.00.78380.44259.60.821
65.10226.30.78681.49259.00.821
66.08228.90.78982.88261.10.822
67.68229.30.78983.00261.60.823
68.66234.00.795---
Table 6. Main properties of air from [77] for energy and exergy analyses of the forced draft fan.
Air (N2 + O2 + Ar)
Triple Point Temperature:−213.4 °C
Boiling point temperature:−194.25 °C
Acentric factor:0.0335
Critical point characteristicsTemperature:−140.62 °C
Pressure:3.786 MPa
Density:342.68 kg/m3
Molar mass:28.965 kg/kmol
Range of applicabilityMinimum temperature:−213.4 °C
Maximum temperature:1726.9 °C
Maximum pressure:2000 MPa

