Article

Prediction of Seabed Scour Induced by Full-Scale Darrieus-Type Tidal Current Turbine

1
State Key Laboratory of Hydraulic Engineering Simulation and Safety, Tianjin University, Tianjin 300350, China
2
First R&D Services, A-08-16 M Suites, 283 Jalan Ampang, Kuala Lumpur 50450, Malaysia
3
School of Engineering, University of Plymouth, Plymouth PL4 8AA, UK
4
School of Natural and Built Environment, Architecture, Civil & Structural Engineering and Planning, Queen’s University Belfast, David Keir Building, Stranmillis Road, Belfast BT9 5AG, UK
*
Author to whom correspondence should be addressed.
J. Mar. Sci. Eng. 2019, 7(10), 342; https://doi.org/10.3390/jmse7100342
Submission received: 28 July 2019 / Revised: 19 September 2019 / Accepted: 25 September 2019 / Published: 30 September 2019
(This article belongs to the Section Ocean Engineering)

Abstract

:
Scour induced by a Darrieus-type tidal current turbine was investigated by using a joint numerical and experimental method with emphasis on the scour process of a full-scale turbine. This work proposes a new numerical method to estimate turbine scour developments, followed by model validation through experimental data in the initial stage. The small-scale numerical model was further extended to a full-scale model for the prediction of turbine scour. The numerical model consists of (1) k- ω turbulence closure, (2) a sediment transport model, and (3) a sediment slide model. The transient-state model was coupled with a morphologic model to calculate scour development. A dynamic mesh updating technique was implemented, enabling the autoupdate of data for the grid nodes of the seabed at each time step. Comparisons between the numerical results and the experimental measurements showed that the proposed model was able to capture the main features of the scour process. However, the numerical model underestimated about 15–20% of the equilibrium scour depth than experimental data. An investigation of the temporal and spatial development of seabed scour around a full-scale Darrieus-type tidal current turbine is demonstrated. This work concludes that the proposed numerical model can effectively predict the scour process of tidal current turbines, and the rotating rotor has a significant impact on the equilibrium scour depth for full-scale turbines.

1. Introduction

Tidal current energy is a kind of clean and pollution-free marine renewable energy that can be extracted by a tidal current turbine. Scour around turbine is an important engineering issue that causes structural instability [1]. Numerous tidal current turbine projects have been carried out to harness marine energy in the past few years [2]. However, little is known about the interaction between seabed scour and turbine devices, and most previous studies have focused mainly on the hydrodynamic performance of turbines [3].
Predictions about scour depth and profiles are important to reduce the risk of turbine structural instability induced by scour. The support structure for tidal current turbines can be categorized into four main types: a gravity structure, monopile structure, jacket structure, and floating structure [4]. Of these four types, the monopile structure is a common type for tidal current turbine projects. The mechanism of turbine scour is similar to local scour in piles [5]. Seabed scour is caused by the constant change of flow around a foundation pile: (1) the flow contracts at the side of the foundation; (2) sustained downflow exists in front of the monopile foundation; (3) a horseshoe vortex is formed in front of the foundation; and (4) lee-wake vortices occur downstream. These flow changes work together to cause seabed scour. As time goes by, the downflow near the bottom of the scour hole decreases as the scour hole depth increases. Scour equilibrium is obtained when the magnitude of downflow ahead of the cylinder can no longer dislodge sediment at the surface of the scour hole [6].
Turbine scour is more profound under the turbines than around the piles for similar flow conditions due to the influence of a rotating rotor. The impact of a rotor on turbine scour has been emphasized by many researchers. Wang et al. [7] measured the slipstream characteristics of ocean stream turbines and suggested that the height of tip clearance should be at least one turbine diameter to decrease its impact on the seabed. Hill et al. [8] found that equilibrium scour depth was much deeper when the rotor was installed upstream compared to downstream installation. Zhang et al. [9] carried out a series of model tests for horizontal axis tidal current turbine scour and proposed an empirical model for scour depth prediction. Sun et al. [10] proposed semiempirical equations for temporal scour depth of Darrieus-type tidal current turbines based on experiments. Besides the aforementioned experimental works, computational fluid dynamic (CFD) simulation is also a great tool for scour prediction. Chen and Lam [11] studied slipstreams between turbines and seabeds using OpenFOAM (open source CFD software) and found that tip clearance was an important parameter in predicting horizontal axis turbine scour depth. Roulund et al. [12] coupled the flow model with a morphologic model to calculate scour at piles. Their results showed that equilibrium scour depth obtained from CFD simulation was 15–30% smaller than experimental data due to the unsteady effects of flow not being taken into account.
The aforementioned experimental studies of turbine scour mainly used small-scale models. No full-scale experiment for turbine scour has been used due to the limitation of experimental conditions and the high cost. However, numerical simulation is a good tool to predict the scour process for large-scale turbines at a relatively low cost. Some full-scale simulation works have been used to predict the hydrodynamics of tidal current turbines or the scour process. Ettema et al. [13] discussed the scale effect in pier-scour experiments and illustrated that local scour depth in a laboratory may be proportionately greater than the depths occurring in actual projects, and they suggested that CFD modeling be used to reduce the scale effects. Huang et al. [14] conducted a 3D CFD model to examine scale effects on turbulent flow and sediment scour. Dai and Lam [15] proposed a 1-MW full-scale turbine model and completed a numerical investigation for its power coefficient and structural loading. Penny et al. [16] conducted full-scale testing of the SCHOTTEL tidal turbine at Queen’s University Belfast’s tidal site and found that the maximum system efficiency of the turbine reached 35% in flows up to 2.5 m/s. Gonzalez-Gorbeña et al. [17] presented a study for the optimization of an instream tidal energy converter array layout and showed that large amounts of energy extraction may cause significant erosion. Burkow and Griebel [18] proposed a full three-dimensional numerical simulation model for scour at a rectangular obstacle and compared the scaled-up numerical model to a small-scale experimental model. Zhang et al. [19] developed a mathematical model in the FLOW-3D package to numerically investigate the fluid–structure interaction and its induced scour around full-scale horizontal-axis tidal current turbines. However, a limited study focused on scour induced by Darrieus-type tidal current turbines, especially full-scale turbines. To promote scour prediction in full-scale Darrieus-type tidal current turbines, a 3D CFD model and experiments were conducted to examine the temporal and spatial development of full-scale turbines.
This paper presents the progress made in the numerical simulations of turbine scour. Sediment transport and slide models using user-defined function (UDF) code associated with the fluid flow model in FLUENT (commercial CFD software) were implemented to simulate the actual scour process. After validation through experimental data, seabed scour induced by full-scale turbines was studied in detail.

2. Methodology

Seabed scour is a complex physical process around a Darrieus-type tidal current turbine. The scour depth depends on the size of a foundation pile and the influence of complex flow fields induced by a rotating rotor. The interaction between the turbine’s hydrodynamics and local scour around the foundation was a key factor to investigate in this project. To investigate this factor, a CFD model was proposed. In this project, the computation of tidal current turbine scour was performed using the commercial package FLUENT 2018. Scale-down physical model tests and scale-up numerical simulations were carried out together for model validation. Finally, the validated model was used to investigate the seabed scour induced by a full-scale tidal current turbine. Figure 1 shows the research framework of this project.

2.1. Hydrodynamic Model

The hydrodynamic model includes geometry creation, grid generation, boundary condition setting, turbulence model selection, and result extraction, as presented in the following sections.

2.1.1. Governing Equations

The flow conditions around turbines can be calculated through a finite-volume numerical model that solves incompressible Reynolds-averaged Navier–Stokes equations [12], as shown in Equation (1):
ρ U i t + ρ U i U j x j = p x i + x j [ ( μ + μ t ) ( U i x j + U j x i ) ] ,
in which ρ is the fluid density, U i is the ith component of velocity, p is the dynamic pressure, μ is the dynamic viscosity, μ t is the turbulent viscosity, and μ t is calculated by a turbulence model, as detailed in the following section Semi-implicit method for pressure-linked equation(A SIMPLE). algorithm [20] was used to calculate the flow conditions. A SIMPLE algorithm is a kind of pressure-based solver, wherein the constraint of mass conservation of the velocity field is achieved by solving a pressure equation. Pressure–velocity coupling is achieved by using face flux equations to derive an additional condition for pressure by reformatting the continuity equation [21], as given by Equation (2), where Jf is the mass flux through face. In addition, we used a second-order upwind scheme for spatial discretization:
f N f a c e s J f A f = 0 .
In the SIMPLE algorithm, the pressure field is calculated and the velocity field is corrected to satisfy the continuity equation [21], as given by
ρ t + ( ρ U i ) x j = 0 .

2.1.2. Turbulence Model

The k- ω model [22] was selected as the turbulence model to resolve the unknown Reynolds stress terms: the k- ω model shows great performance for shear flow spreading, as proven by the previous studies of Roulund et al. [11] and Baykal et al. [23]. Specifically, the shear stresses transport (SST) k- ω model, which was proposed by Menter [24], combines the positive features of both the k- ω and k- ε turbulence models and was chosen for the simulation. More specifically, the k- ω turbulence model can accurately predict the near-wall region. In contrast, the k- ε turbulence model can accurately predict the far field. A blending function, F, was applied to combine both models. The factor of the blending function for the k- ω model reduces to zero at the boundary layer, and the k- ε model replaces the k- ω model to predict the free stream region.
Actually, three versions of the k- ω model are the original k- ω model, the k- ω BSL (Baseline) model, and the k- ω SST model. Menter [24] has compared flow past a NACA 4412 airfoil calculated by these three models. The results showed that the SST k- ω model gave the most accurate results for the tested adverse pressure gradient flow cases. Hence, the SST k- ω model was chosen to simulate the flow field with strong adverse pressure effects in this study.

2.1.3. Boundary Conditions

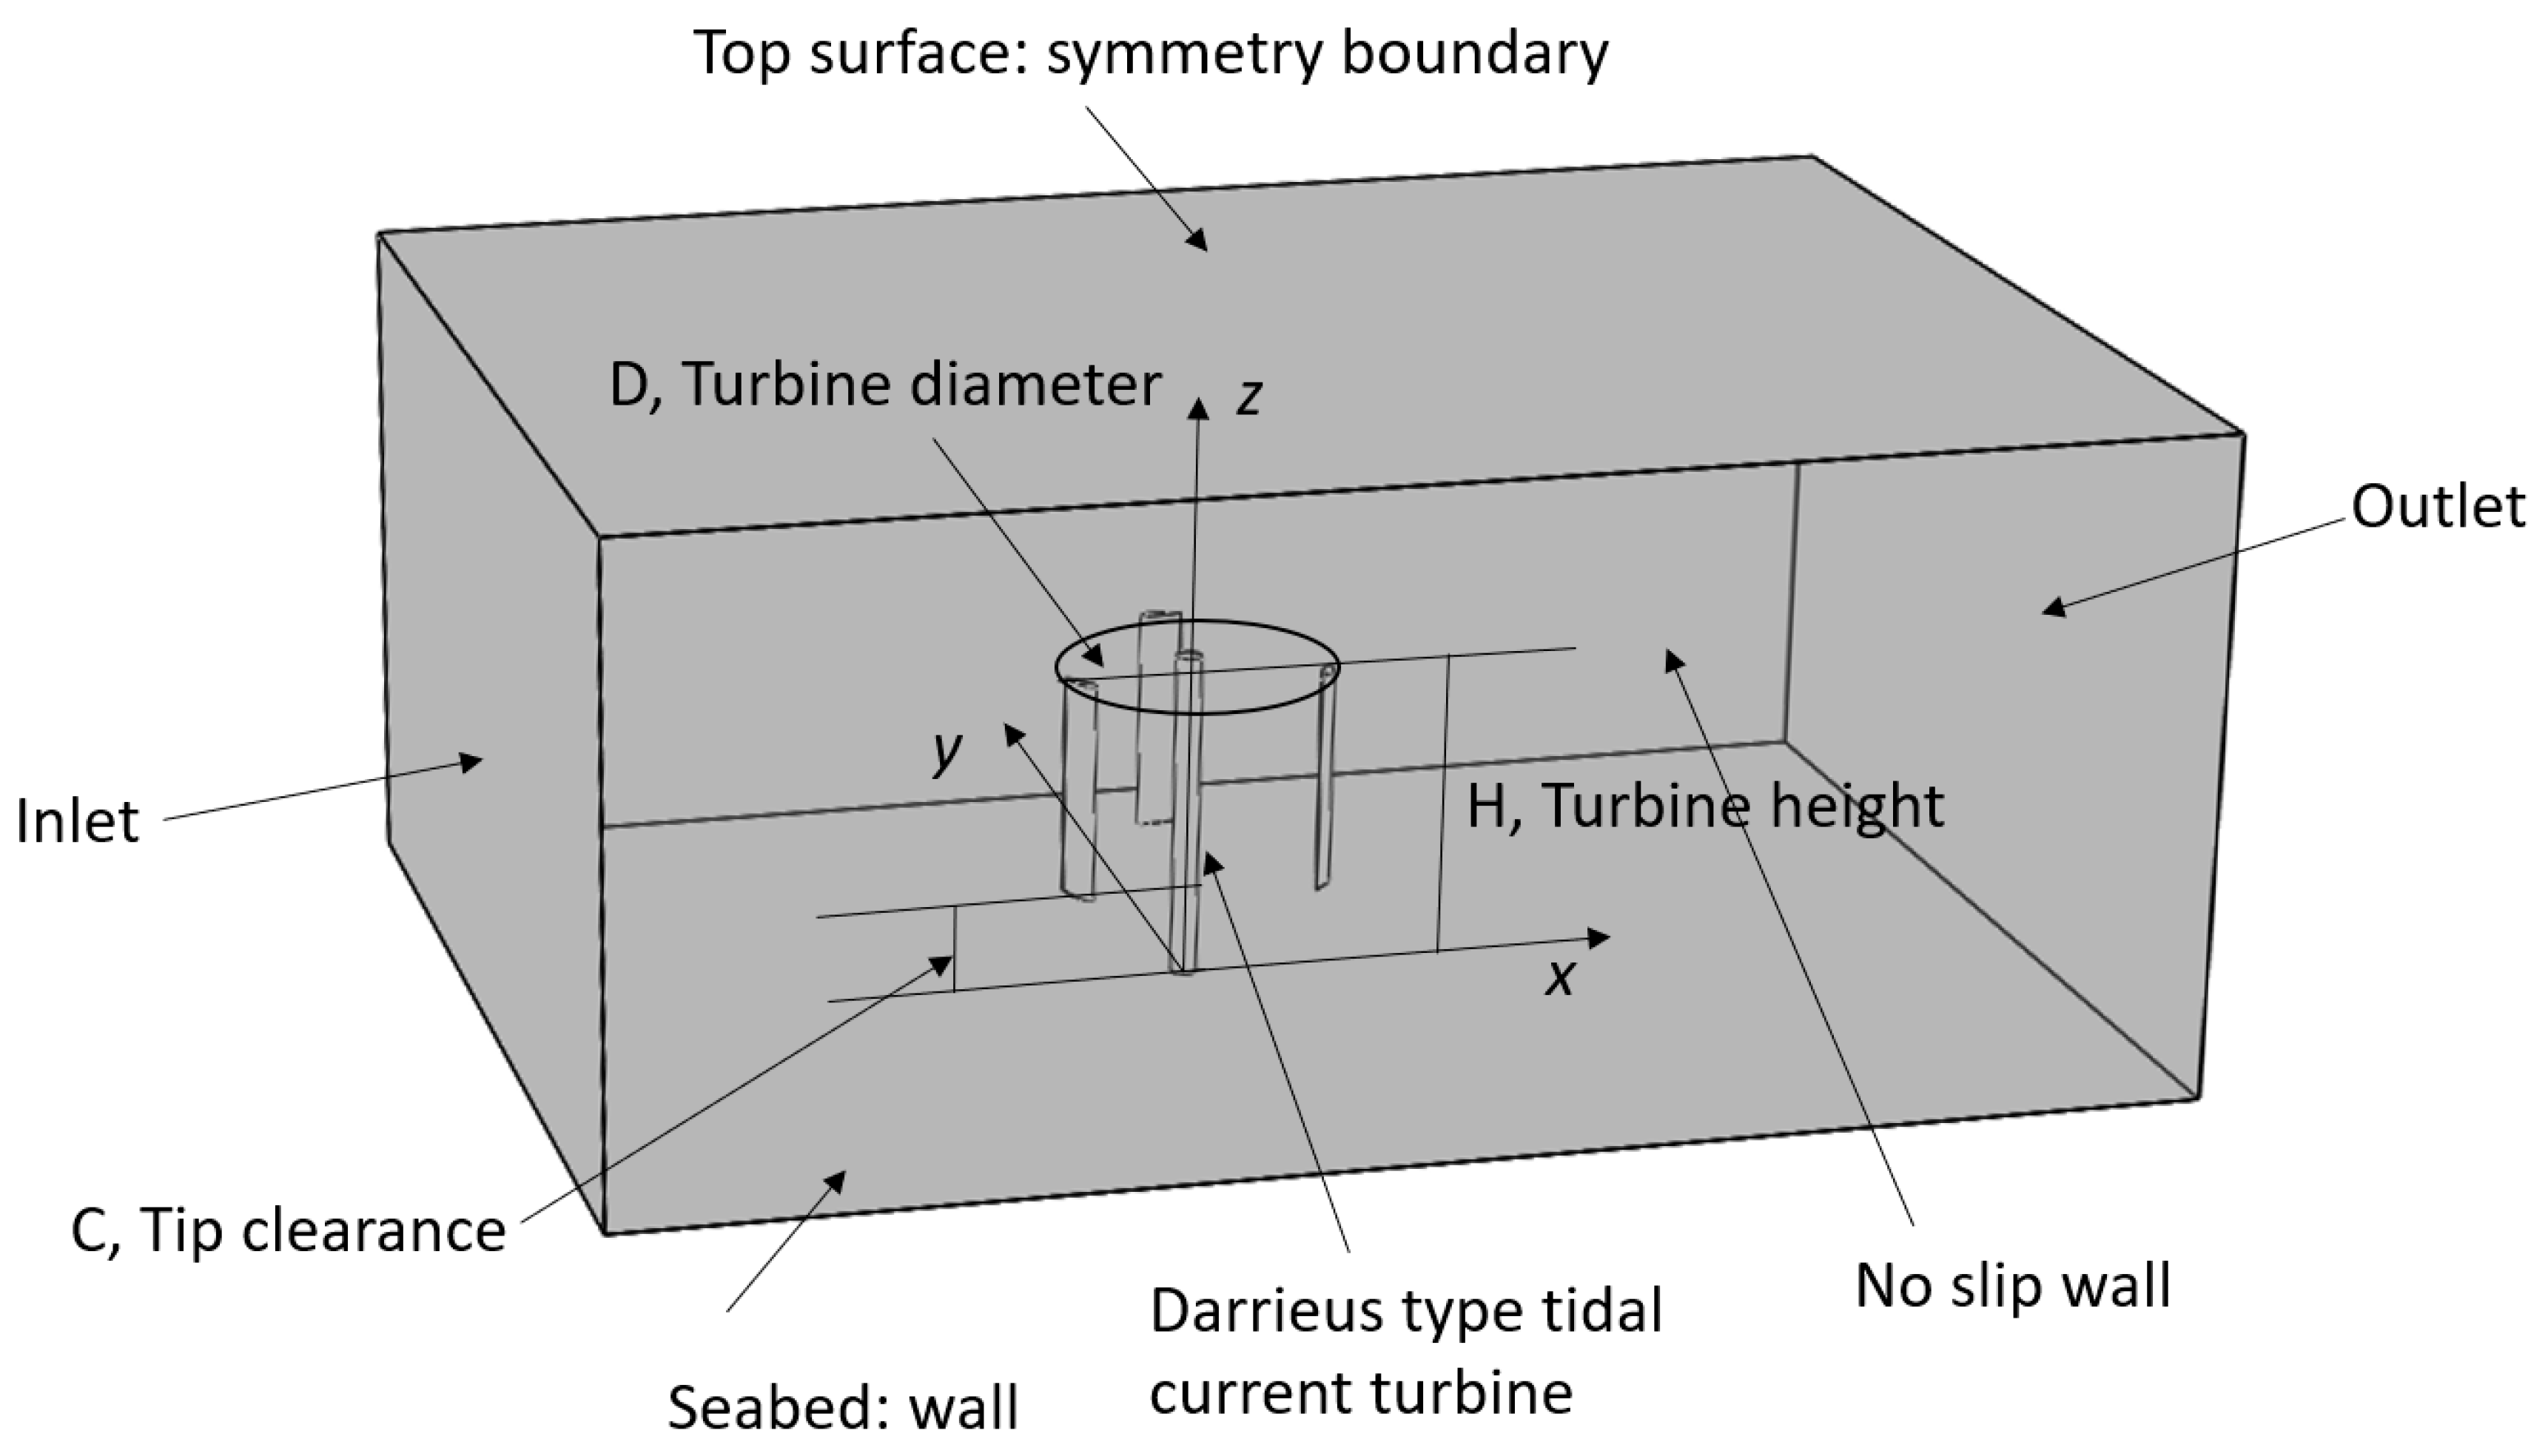
The boundaries of the computational domain are inlet, outlet, symmetry boundaries, and walls, which can be seen in Figure 2:
(1)
Inlet and outlet boundary conditions: For the inlet boundary, the uniform velocity inlet condition was used, and the initial pascal pressure was set as 0. The outlet boundary pressure outlet was applied for all quantities. The turbulence intensity at the inlet/outlet boundaries was 5% for medium intensity as a default value, which is suggested in Fluent Help [21];
(2)
Symmetry boundaries: The symmetry boundary was applied to simulate the free surface condition. At the symmetry boundaries, Neumann conditions were applied for variables in the k- ω turbulence model. It was assumed that a “lid” was on the top surface. The symmetry boundary condition is an effective method to simulate the free surface, and it has been applied in many scour simulations, such as in References [12] and [23];
(3)
Walls: The sides of the computational domain, surfaces of foundation, and turbine blades were set as no-slip wall boundaries. The roughness height was set as zero to simulate a smooth surface. The sediment bottom was set as a rough wall boundary. The roughness height of the sediment bottom was set as 2.5, which can simulate the true sediment bed (as suggested by Roulund) [12].
In the current study, it was assumed that the effects of link rods between the blade and monopile on the velocity and turbulence intensity around the turbines were negligible. The dimensions of the computational domain were 4.5D, 4D, and 3H in the x, y, and z directions, respectively. The flow direction was from -x to x. D is turbine rotor diameter, and H is turbine height.

2.1.4. Computational Mesh

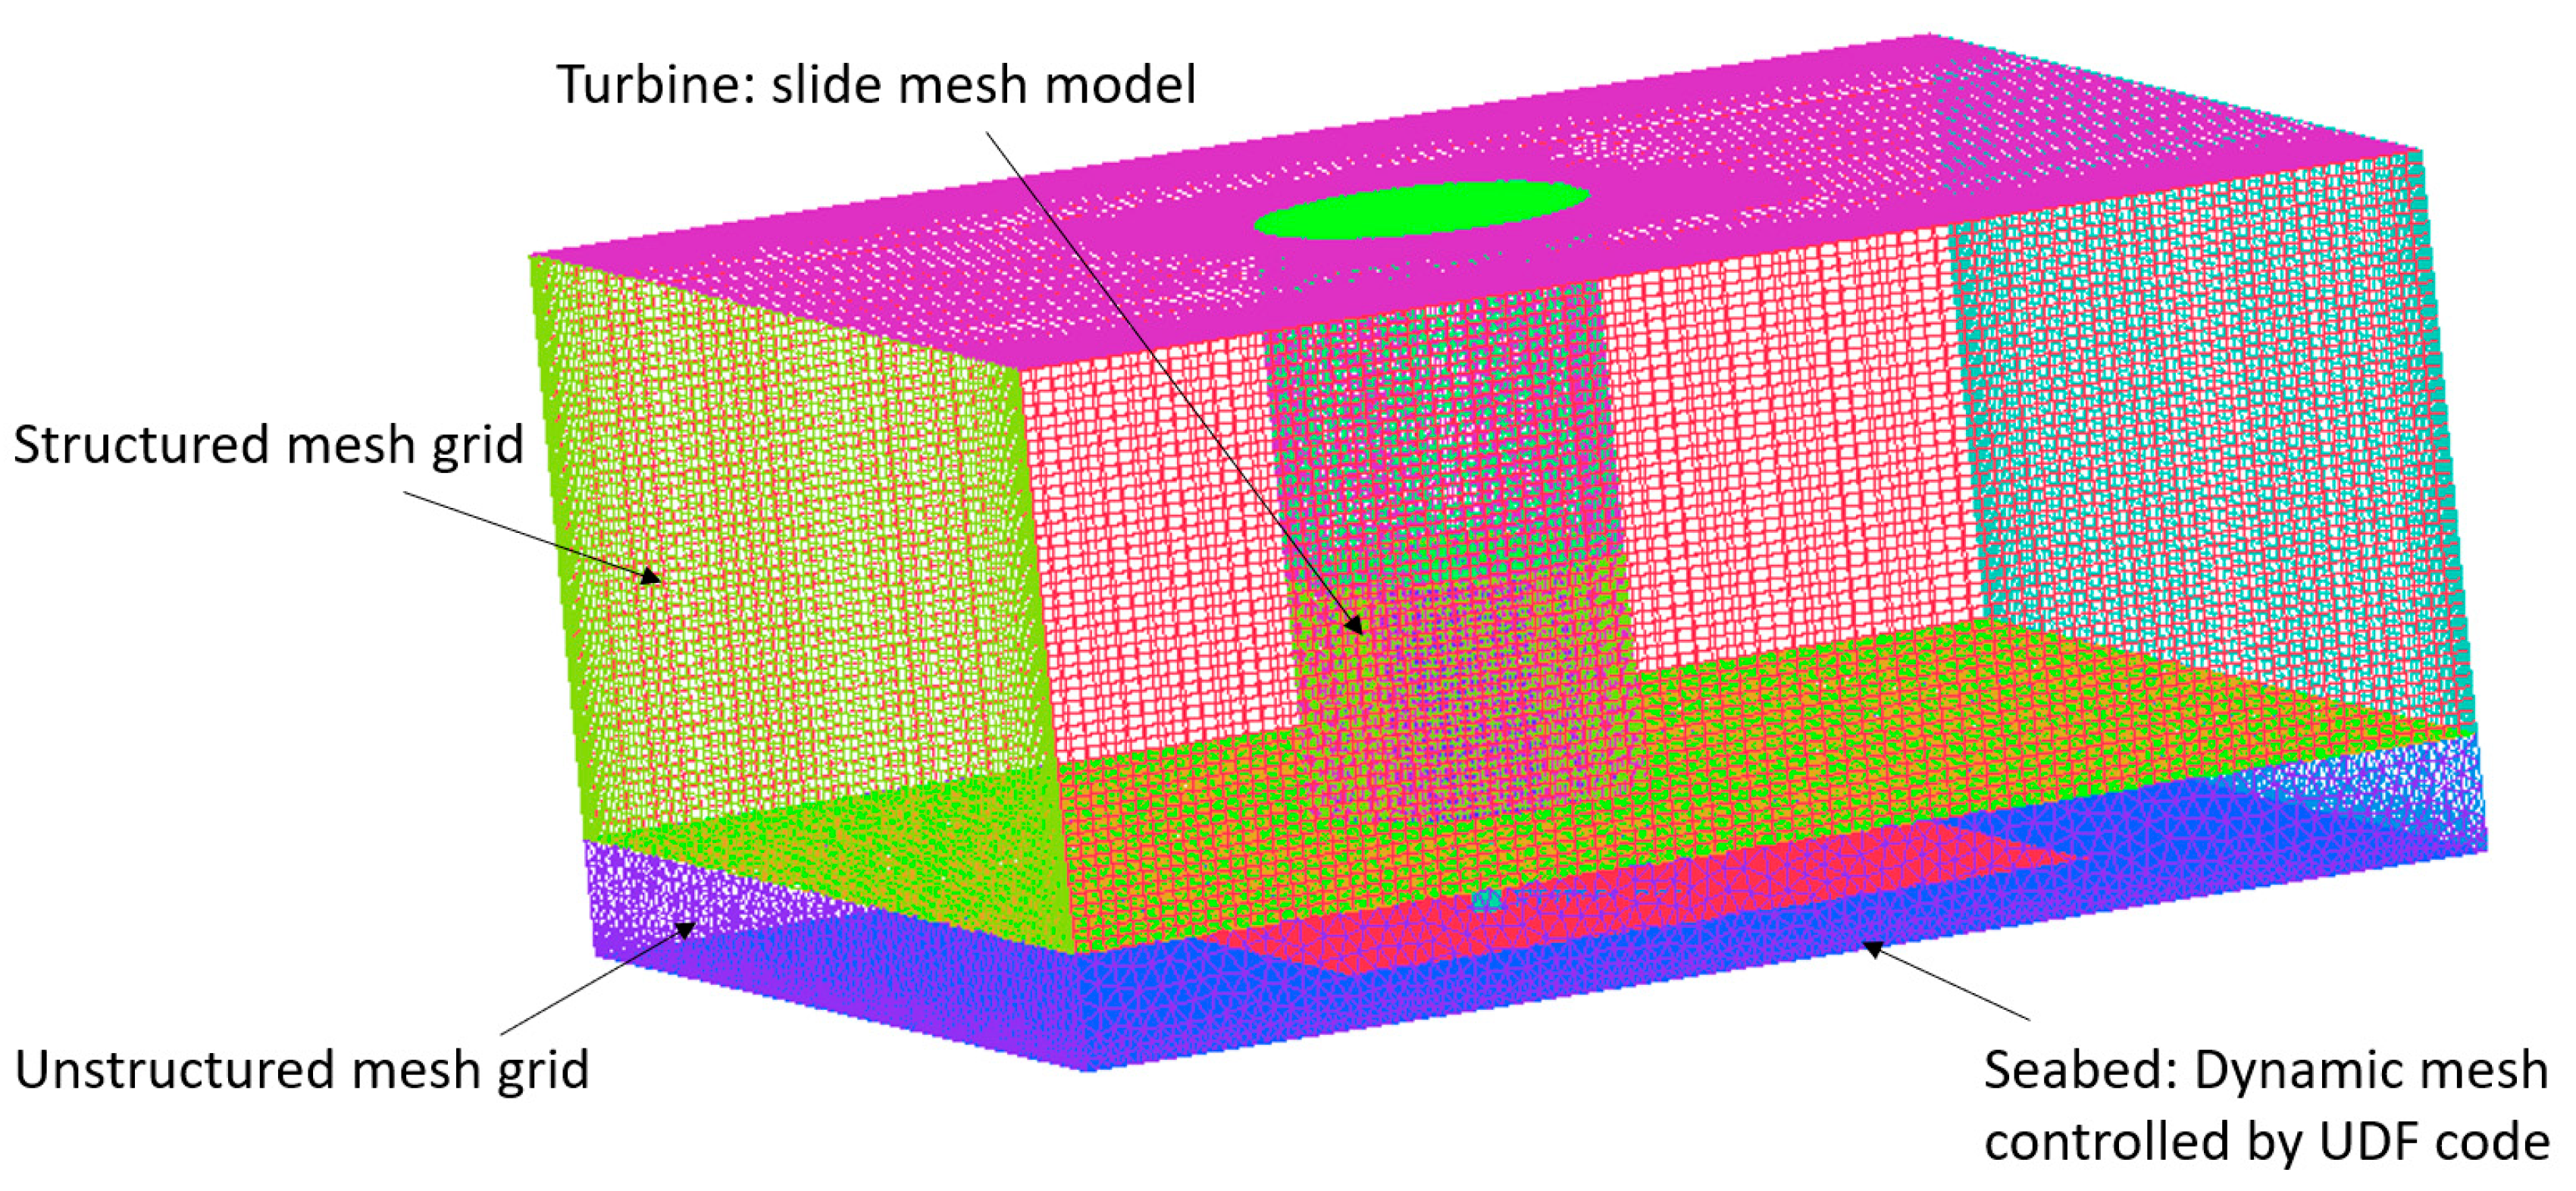
The grid meshing of the numerical model was completed using an ICEM preprocessor. The overall mesh can be seen in Figure 3. A suitable mesh setting is important to ensure the accuracy of a CFD calculation. The overall mesh combined the advantages of structured grids (upper domain contains turbine rotor) and unstructured grids (lower domain between rotor and seabed). The upper structured grids can speed up the numerical calculation. The lower unstructured grids can better adapt the complicated geometry to update the bed boundary data under a scour process during the solving process.
The blade surface was set as moving mesh corresponding to its adjacent cell zone. The sliding mesh modeling technique was used to simulate the rotating rotor. In this model, the computational domain consists of the rotating part and the stationary part, which is shown in Figure 4a. The transient relative motion was used to predict the true transient interaction of the flow between a stator and rotor passage. The interface position was updated at each time step, changing the relative positions of the grids on each side of the interface. The rotational motion was simulated by allowing the rotating part to rotate at a constant angular velocity.
The grid resolution close to the rotor wall needed to be further refined in order to ensure the accurate prediction of flow at the boundary layer. Hence the rotor mesh density was higher than the stator mesh density. The grid pattern of the blade boundary layer is shown in Figure 4b.

2.1.5. Grid Independence Analysis

The total cell numbers in the CFD mesh can influence the predictions due to the numerical approximations using RANS (Reynolds-averaged Navier-Stokes) equations. However, the increase of mesh density also requires more computational power. Hence, the grid independence test is important to obtain a suitable cell number of mesh for particular cases. A grid independent analysis was conducted to investigate the sensitivity of the grid to the change in Cp values. The turbine power coefficient Cp is given by
C p = T ω 0.5 ρ A V 3 ,
where T is turbine torque, ω is turbine rotational velocity, ρ is the density of water, A is the swept area of the rotor, and V is free stream flow velocity. Table 1 shows the cases of grid independence tests on the mesh grid numbers and Cp values to reach grid independence. The results show that Case 1 with 1,285,567 cells had a Cp value of 16.4%. The Cp value increased to 18.8% for Case 2 with an additional 394,087 cells, and the Cp value increased to 19.7% for Case 3 with an additional 367,024 cells. After Case 3, the validation of results was insignificant with further increases in the cell number. Therefore, Case 3 with 2,046,678 cells was the selected grid-independent case.

2.2. Morphological Model

The flow field can be calculated through the aforementioned hydrodynamic model, and this section gives a brief description of the morphological model that describes the sediment movement during the scour process.

2.2.1. Sediment Transport Model

The judgment of sediment incipience is the first stage in simulating turbine scour. The three main methods are [25] (1) judged by critical shear stress, (2) judged by critical velocity, and (3) judged by critical power. In our sediment transport model, the first method was chosen by considering the influences of turbulent flow. For no-slip wall conditions, ANSYS Fluent uses the properties of the flow adjacent to the wall/fluid boundary to predict the shear stresses on the fluid at the wall. The sediment particles are initiated when the bed shear stress is higher than a designated value. The sediment incipient shear stress   τ b , c r can be calculated as [26]
τ b , c r = ρ g ( s 1 ) d 50 θ c r ,
where   τ b , c r is critical shear stress; s is the relative density of the sediment particle;   d 50 is the medium diameter of the sediment particle; and   θ c r is the critical Shields number. Equation (6) is
θ c r = { 0.24 D * 1 ,   D * 4 0.14 D * 0.64 ,   4 D * 10 0.04 D * 0.1 ,   10 D * 20 0.13 D * 0.29 ,   20 D * 150 0.055 ,   D * > 150 ,
where D * = d 50 [ ( s 1 ) g / v 2 ] 1 / 3 .
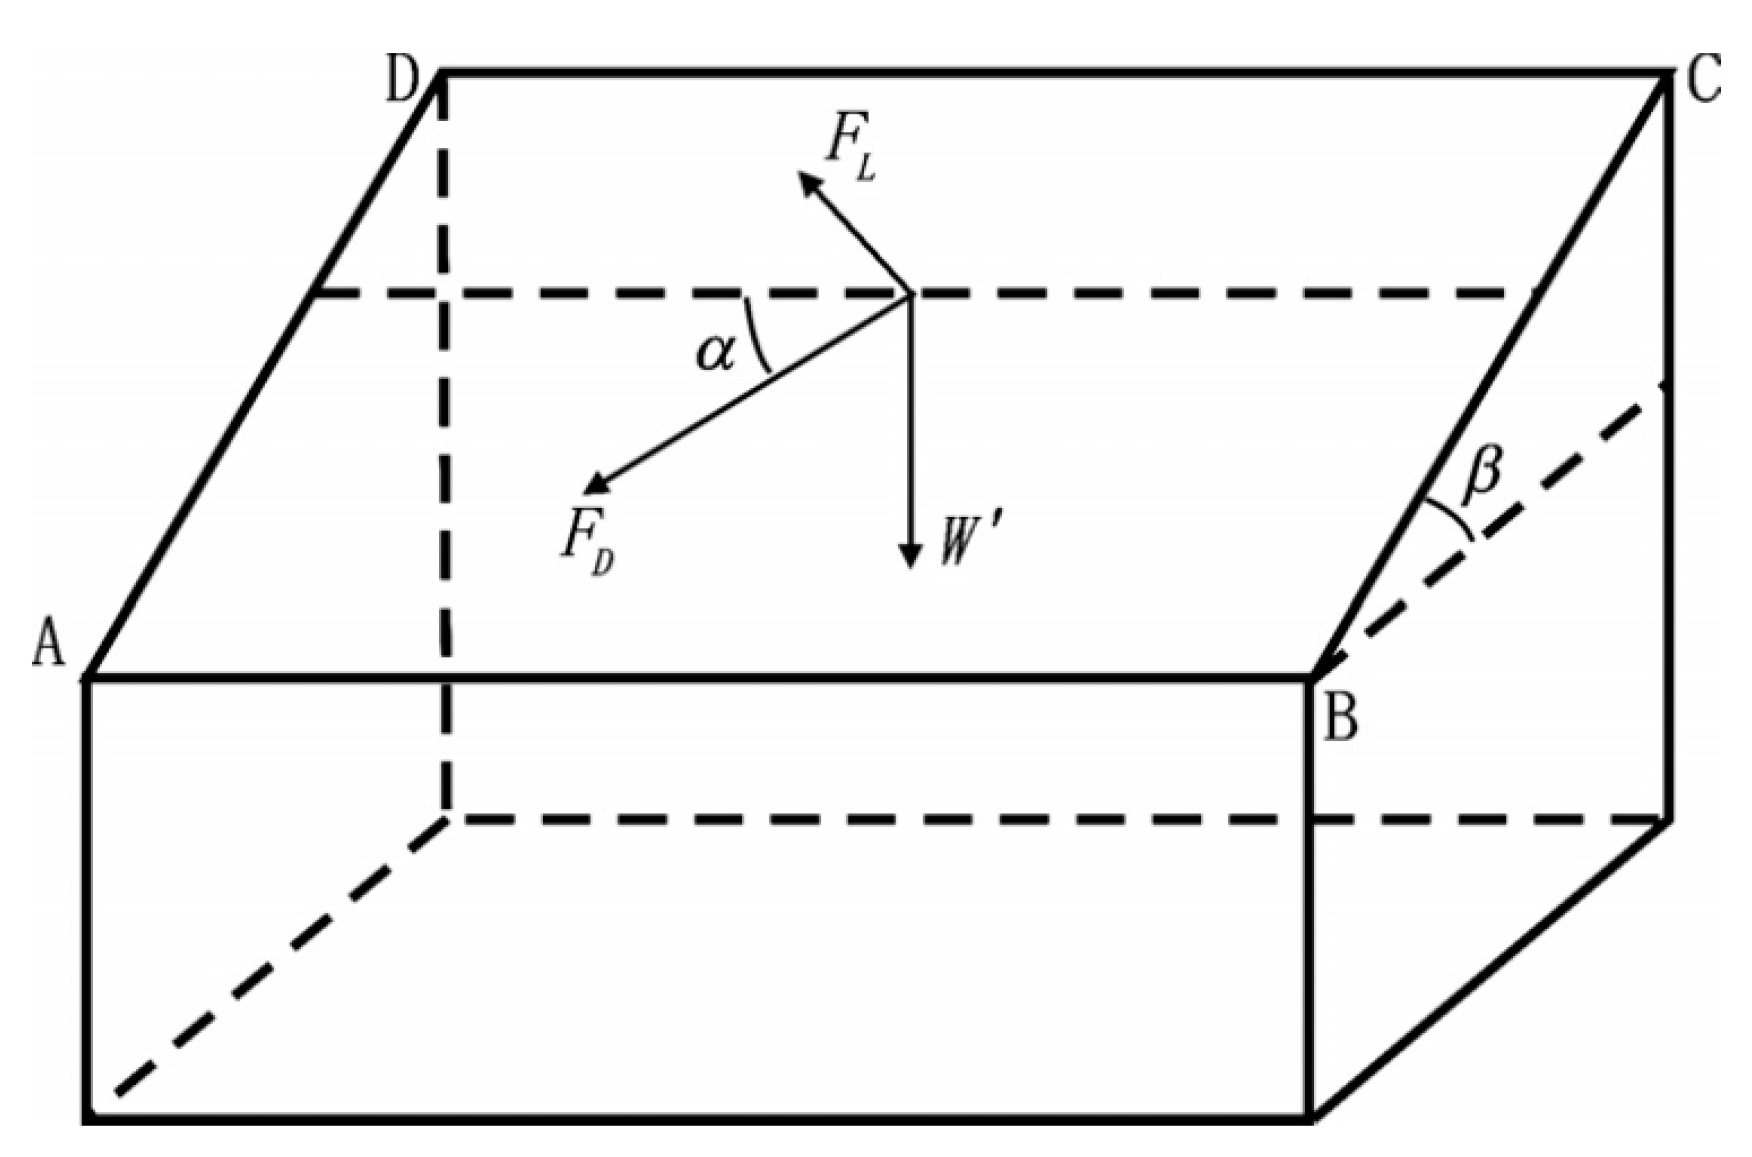
However, the riverbed is not always flat. The slope correction for critical shear stress is of importance. The critical shear stress on the slope can be calculated by the following equation [26]:
τ b , c r τ b , c r = { ( 1 + C L C D tan φ ) ( cos 2 β sin 2 β cot 2 φ ) } { C L C D cos β + sin β sin α cot 2 φ + cot φ cos 2 β sin 2 β cot 2 φ + ( C L C D ) 2 sin 2 β + 2 C L C D sin β sin α cos β + sin 2 β sin 2 α cot 2 φ } 1
where φ is the bed slope angle of repose; C L is the lift coefficient; C D is the drag coefficient; C L / C D is taken as a general empirical value of 0.85 [27]; α is the angle between the horizontal axis of the slope and the flow direction; and β is the angle between the slope and the horizontal plane. The slope model can be seen in Figure 5.
The second stage of our sediment transport model is sediment transport rate. The sediment transport rate considering the seabed inclination angle can be calculated as [28]
q b i = q 0 τ i | τ | C q 0 h x i ,
where   q 0 is the sediment transport rate of the planar single-width volume; h is the vertical height of the seabed; τ is seabed shear stress; and τ i is the shear stress component in the x i direction. The second section of q b i is a correction of slope. The empirical coefficient C was suggested to be 1.5–2.3 by Brørs [28]. In this project, C = 1.5, and q 0 can be expressed as [28]
q 0 = { 12 g ( s 1 ) d s 3 θ ( θ θ c r ) ,   θ > θ c r 0 ,   θ θ c r .
Based on the equilibrium of sediment transport, the transient variations of seabed elevations can be derived in terms of the transport rates:
h t = 1 1 n q b i x i ,
where h is seabed elevation, and n is the void ratio of sediment. By computing the abovementioned equations, the transient elevation change of the seabed boundary can be updated according to h in real time. The sediment mass conservation is not controlled in the proposed model. The scour hole around the pile was simulated, and the sand deposition was neglected in this project.

2.2.2. Sand Slide

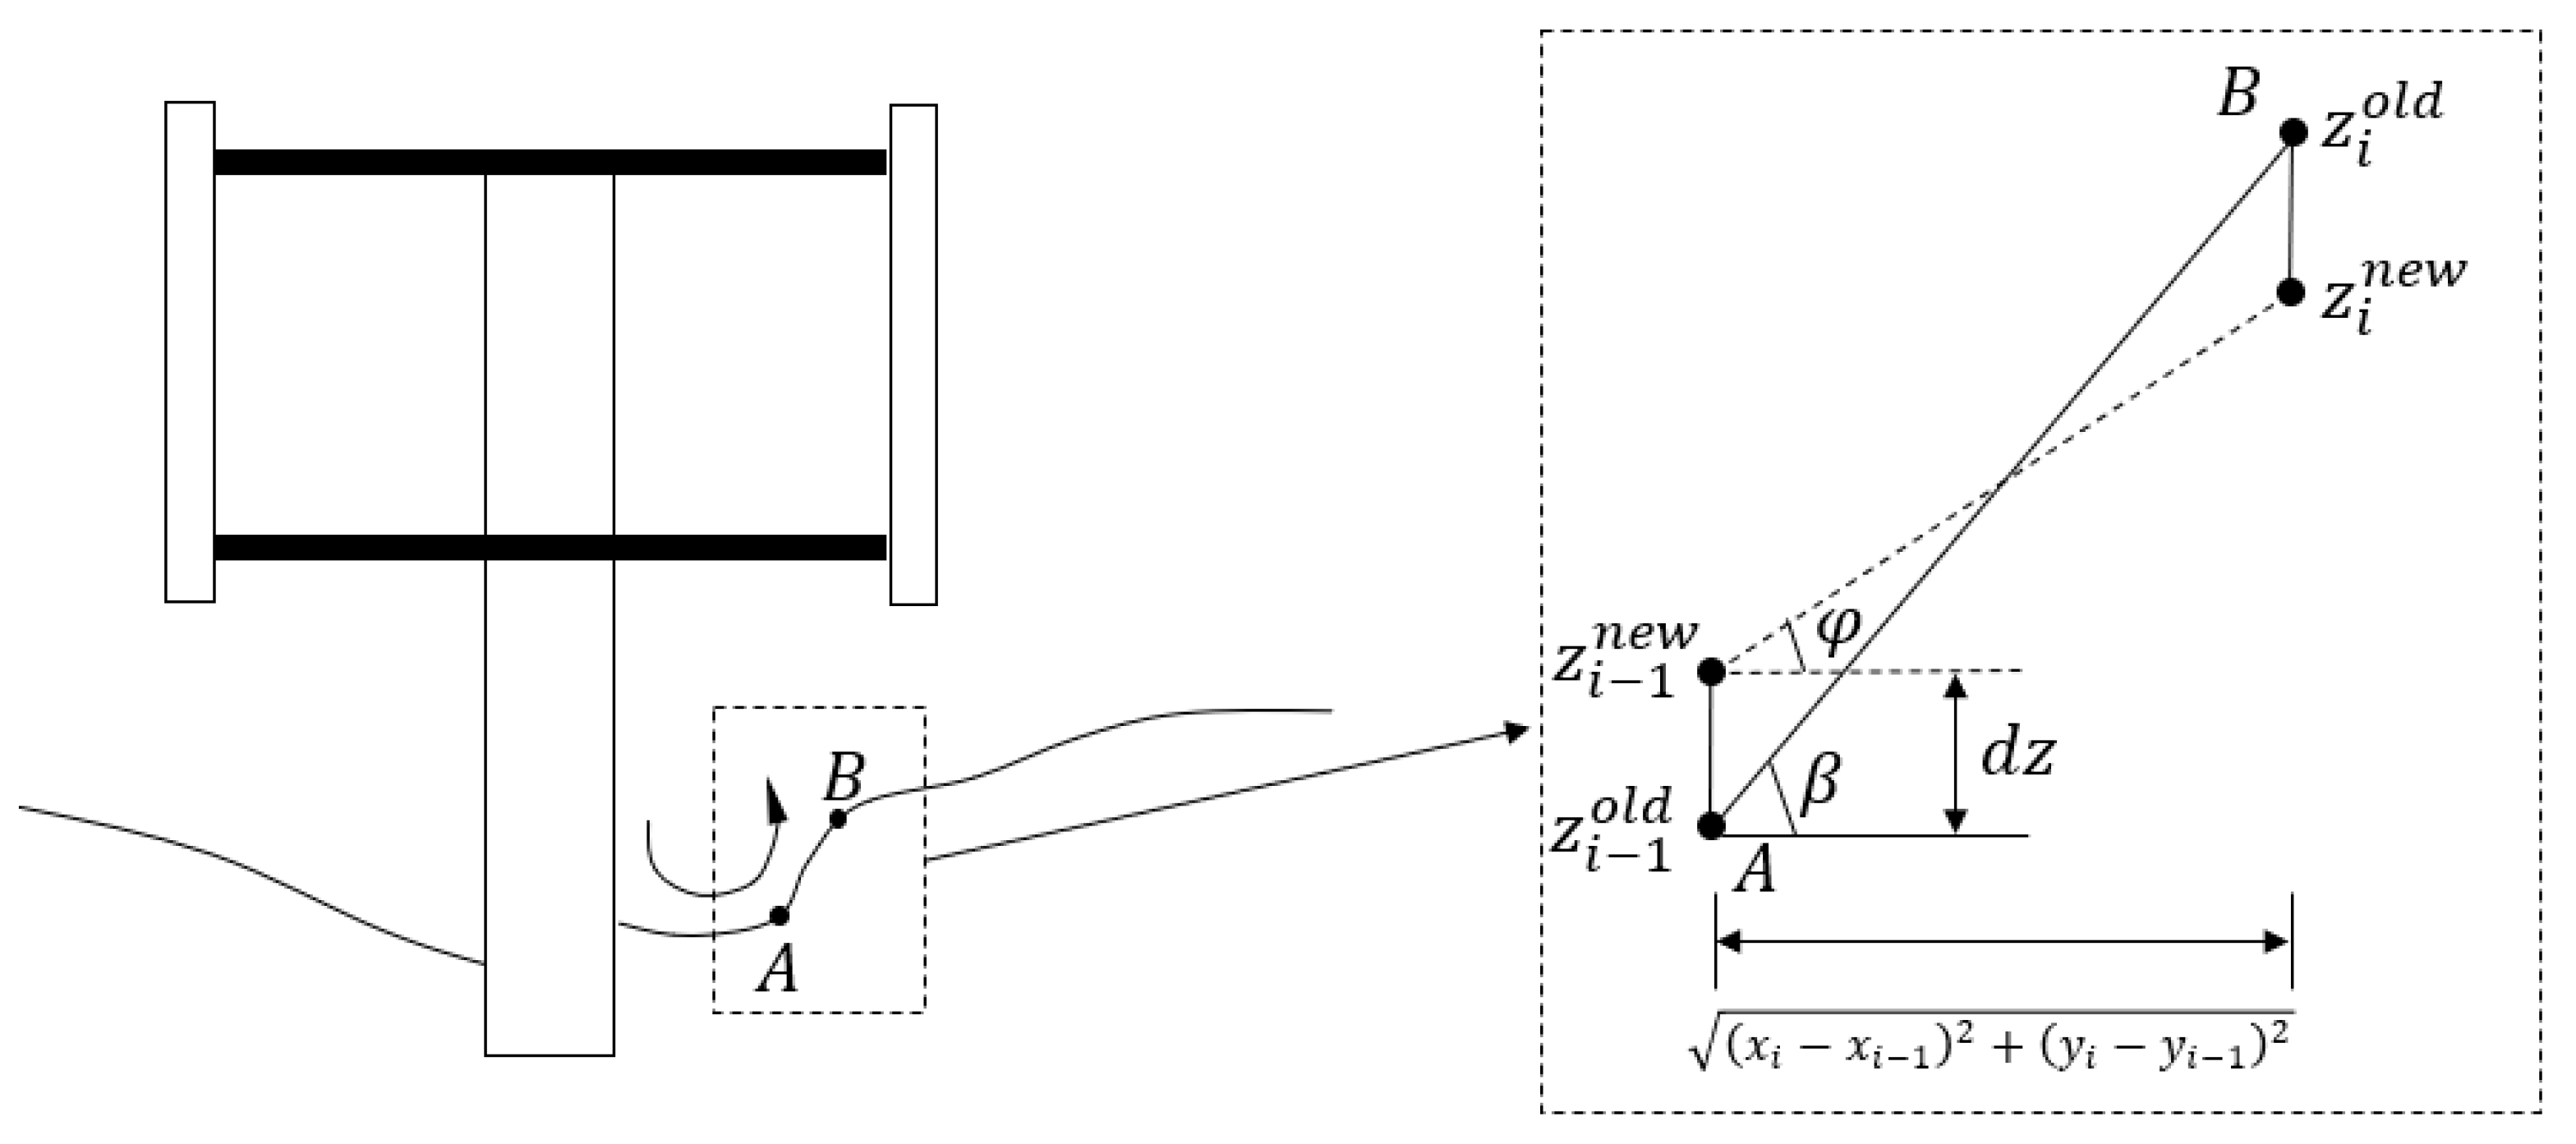
Previous research [29] has pointed out that the collapse of a seabed occurs when the local bed slope exceeds the angle of repose. As a result, shear failures occur at these locations. Roulund [12] and Liang [30] proposed two different sand slide models to solve this problem. This project extended Liang’s sand slide model from 2D scour to 3D scour simulations. Figure 6 shows a diagram of the sand slide model. The 3D sand slide model works as follows:
(1)
Update the seabed elevation change based on the sediment transport model at each time step. After that, scan all the nodes and center points of the mesh grid on the seabed boundary;
(2)
If the angle β between grid node A( x i 1 , y i 1 , z i 1 ) and grid node B( x i , y i , z i ) is greater than the bed slope angle of repose φ , then the model raises or reduces the z coordinate of grid node A and B, making sure the slope angle is less than φ . The vertical displacements of A and B are the same, which ensures the conservation of sediment in the scour process. Equation (11) is
d z = 1 2 ( x i x i 1 ) 2 + ( y i y i 1 ) 2 ( tan β tan φ ) ;
(3)
Repeat the above process 6–10 times, ensuring all of the inclination angles are under φ .

2.2.3. Updating Strategy

Dynamic meshing updating technology is used to simulate the seabed change at each time step. The procedure in the computations is as follows:
(1)
Calculate the flow field;
(2)
Calculate the sediment transport due to bed load;
(3)
Update the seabed boundary;
(4)
Check the sand slide and use the sand slide model to correct the slope angle;
(5)
Turn to the next time step and return to step 1.
The morphologic time step in the calculation is 0.01 s initially and gradually rises to 0.1 s as the scour speed decreases. This is to improve computing efficiency. Over time, the bed shear stress becomes less as the scour hole gets deeper. Finally, the bed shear stress in the scour hole is under critical shear stress, and the seabed profile has an insignificant change over time. This means that turbine scour achieves equilibrium.

2.3. Experimental Setup

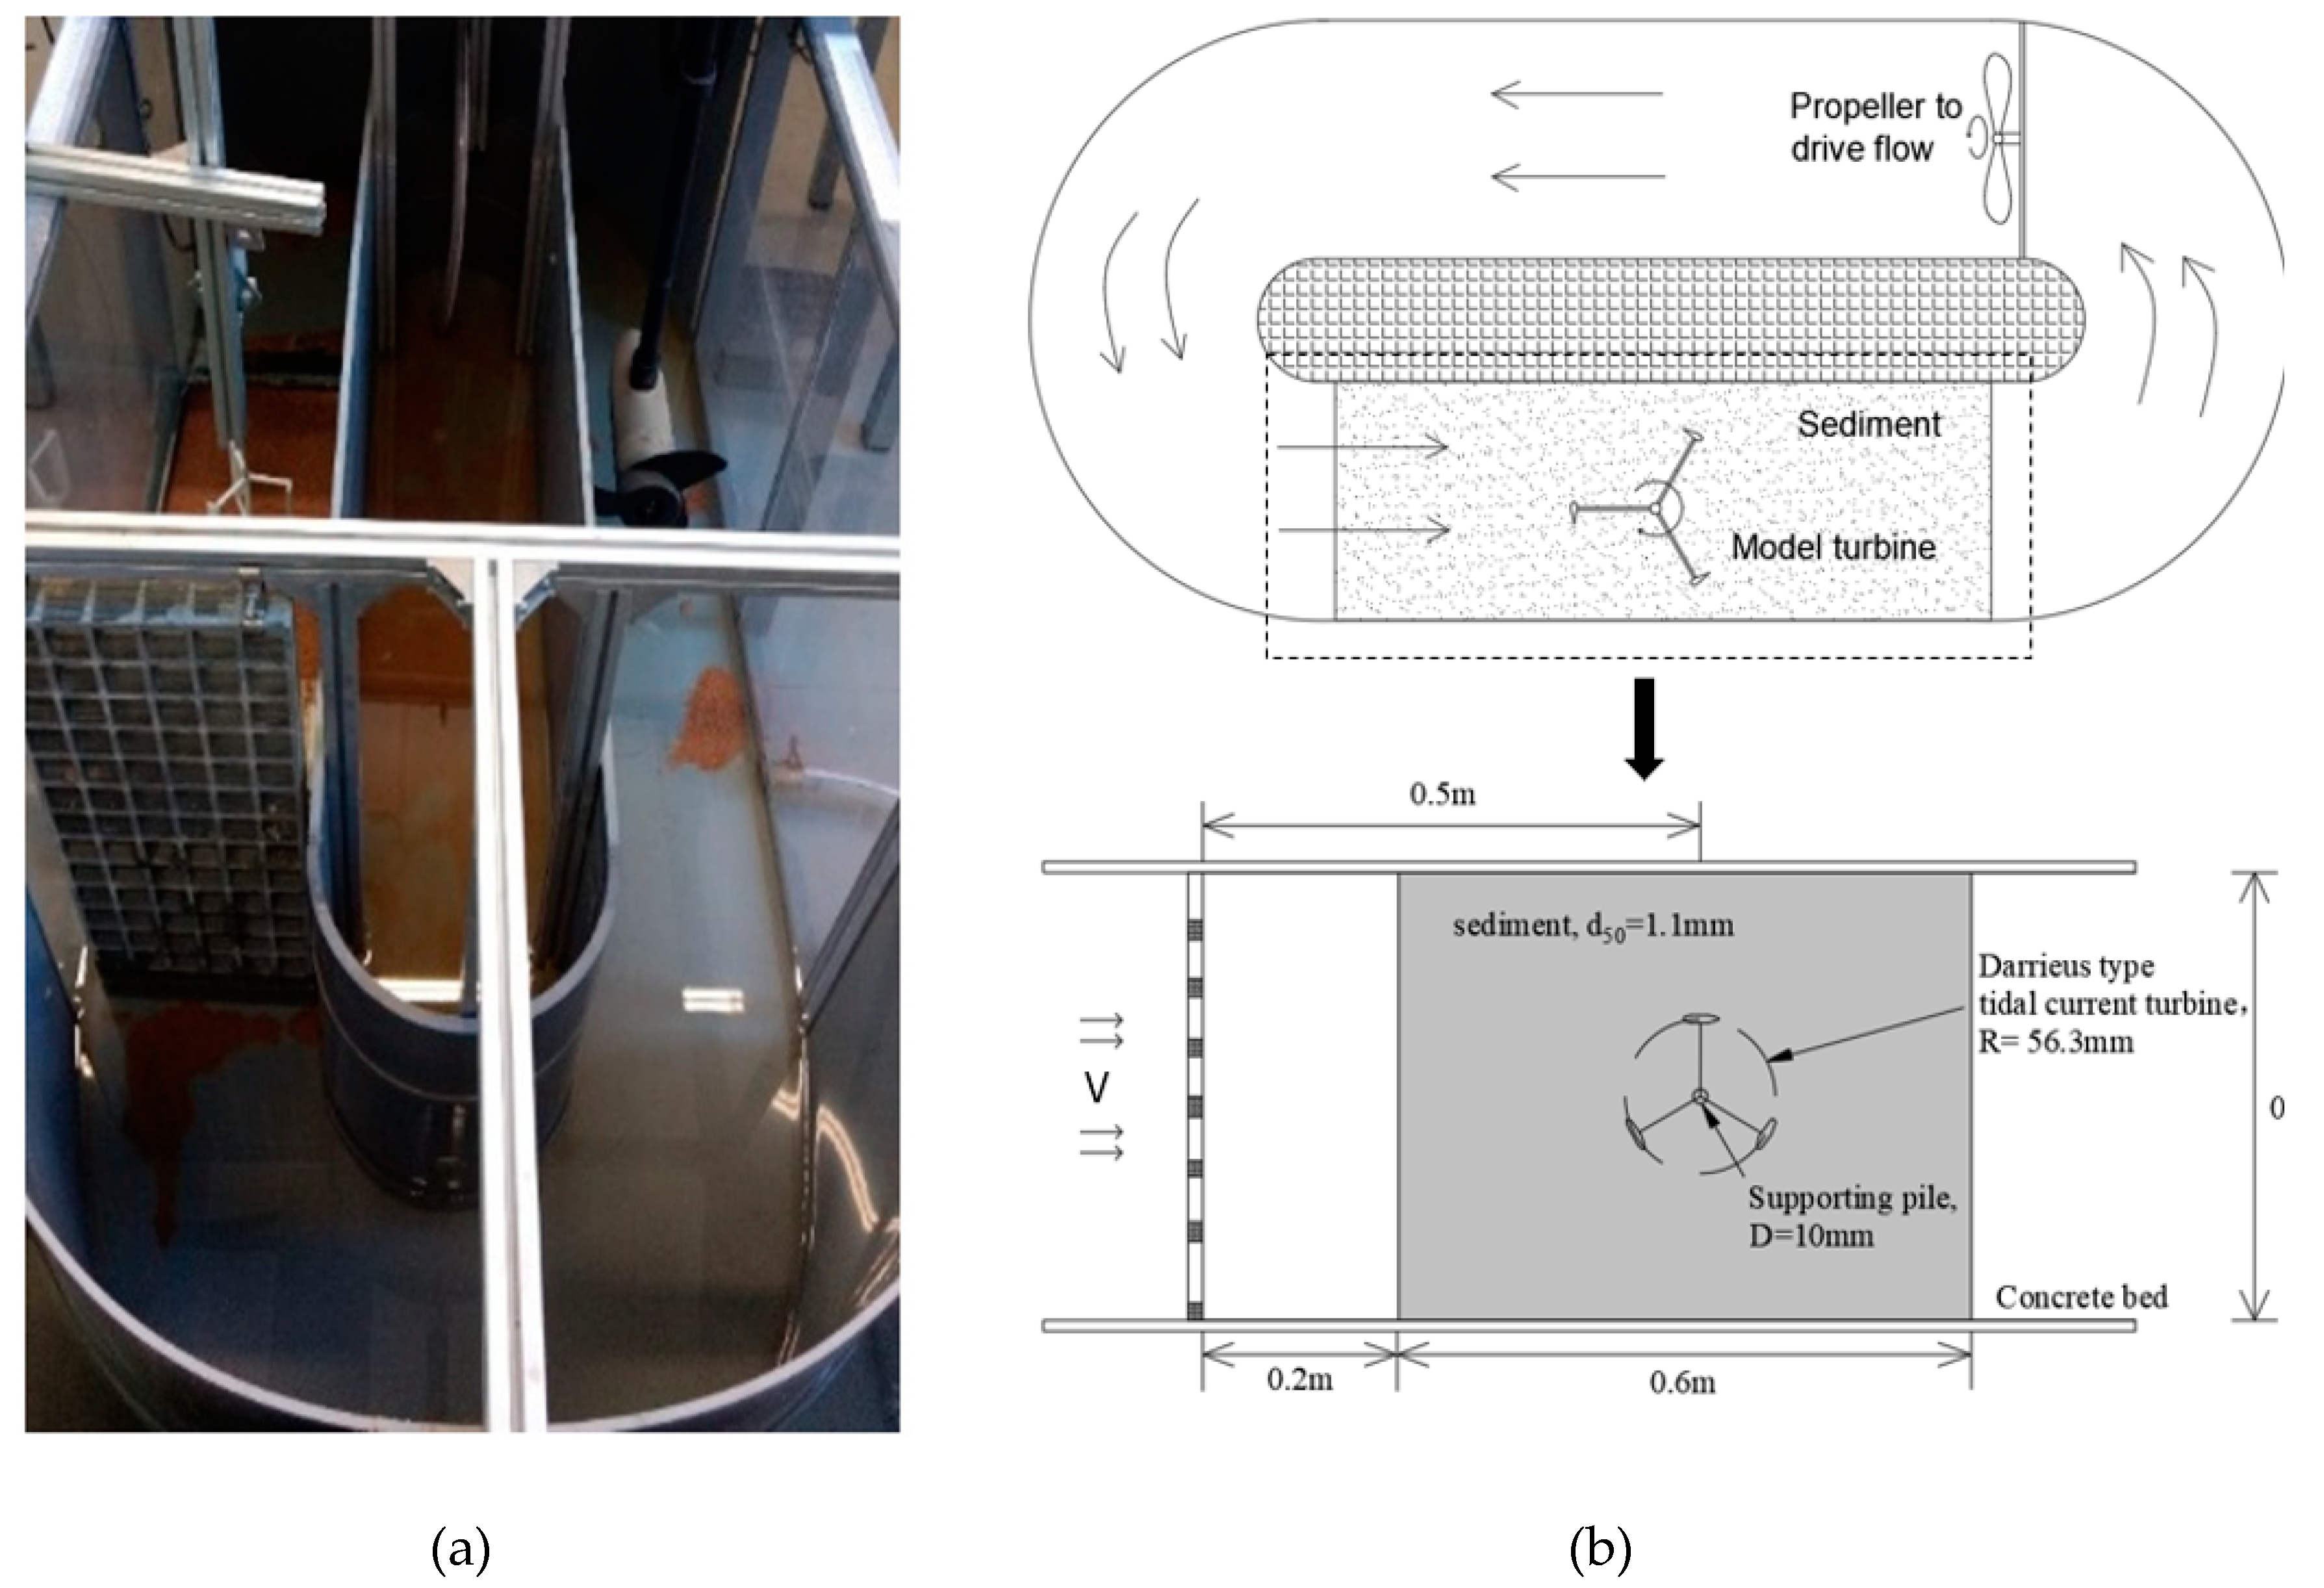
Experiments on scaled-down Darrieus-type tidal current turbines were carried out in a recirculating flume to validate the proposed turbine scour model. This flume was a purpose-made horizontal recirculating flume with water driven by a propeller, which was different from a traditional vertical recirculating flume driven by a pump [31]. The experimental installation is shown in Figure 7. The maximum scour depth of each test was measured by laser distance meter. As discussed in Section 3, the experimental data on the maximum scour depth at different tip clearances were used for analysis and validation. The main experimental parameters can be found in Table 2. More details of the experimental setup are elaborated on in the paper in Reference [10].

3. Numerical Test and Application of Turbine Scour

3.1. Numerical Model Setup

Two groups of test cases were computed to test the numerical scour model and its implementation, as illustrated in Table 3. All of the turbine modes were scaled up based on the experimental turbine models. Hydrodynamic conditions such as inlet velocity and rotational speed were set under the same Froude number ( F r = V / ( g L ) 0.5 ). A Froude number is commonly used in fluid mechanics. In general, it is difficult to meet Froude similarities together with another common similarity criterion, the Reynolds number ( Re = ρ L V / μ ). For free surface gravity flow around marine structures, Froude similitude is often selected in scaled lab experiments [14]. In this project, the Reynolds number of turbine wake induced by Darrieus-type turbine models was around 25,640. Rajaratnam [32] has suggested that the effect of viscosity could be neglected as long as the Reynolds number is more than 10,000. The Reynolds number in the turbine scour tests was high enough to neglect the viscosity.
As seen in Table 3, two groups of numerical test cases were simulated. The first group had two scour models (T1 and T2). Model T1 was a pile scour model without a turbine rotor. This model was aimed toward validating the numerical scour model with a comparison of Melville’s experiment of scour at piers [33]. In Melville’s experiment, a pile was installed at the center of a water flume under a steady current. The main parameters in the T1 model were set up the same as in Melville’s experiment. The 5.08-cm diameter pile was installed inside, the medium diameter of the sand ( d 50 ) was designed at 0.385 mm, and the average flow velocity was set to be 0.25 m/s. The flow field and equilibrium scour shapes were chosen to act as validation. Model T2 was a turbine scour model, including a rotating rotor with the same pile diameter as model T1. This model was aimed at investigating the impact of a rotating rotor on seabed scour compared to single-pile scour. On the other hand, this model could also validate the scour model, including the simulation of the turbine’s hydrodynamics.
The second group had four CFD models with different tip clearances from C/H = 0.25 to C/H = 1.0 (T3–T6). This group was also aimed at validating the numerical model. The scour results of these turbine models were used for comparison with the experimental model tests, as presented in Section 2.3. The scales of the numerical models in this group were 100 times bigger than the experimental setup, which was the same scaling ratio as Huang’s research [14]. The scale-up models can also investigate the scale effects of turbine scour. To simulate real seabed conditions, we chose the sediment diameter as 8.0 mm, which was medium-sized, as illustrated in Zhang’s research [19].

3.2. Model Validation through First Group

This section shows the flow field and equilibrium scour profile of test models in group 1. Through a comparison with Melville’s experiment [33], the proposed numerical scour model was approved as effective and accurate.

3.2.1. Flow Field Validation

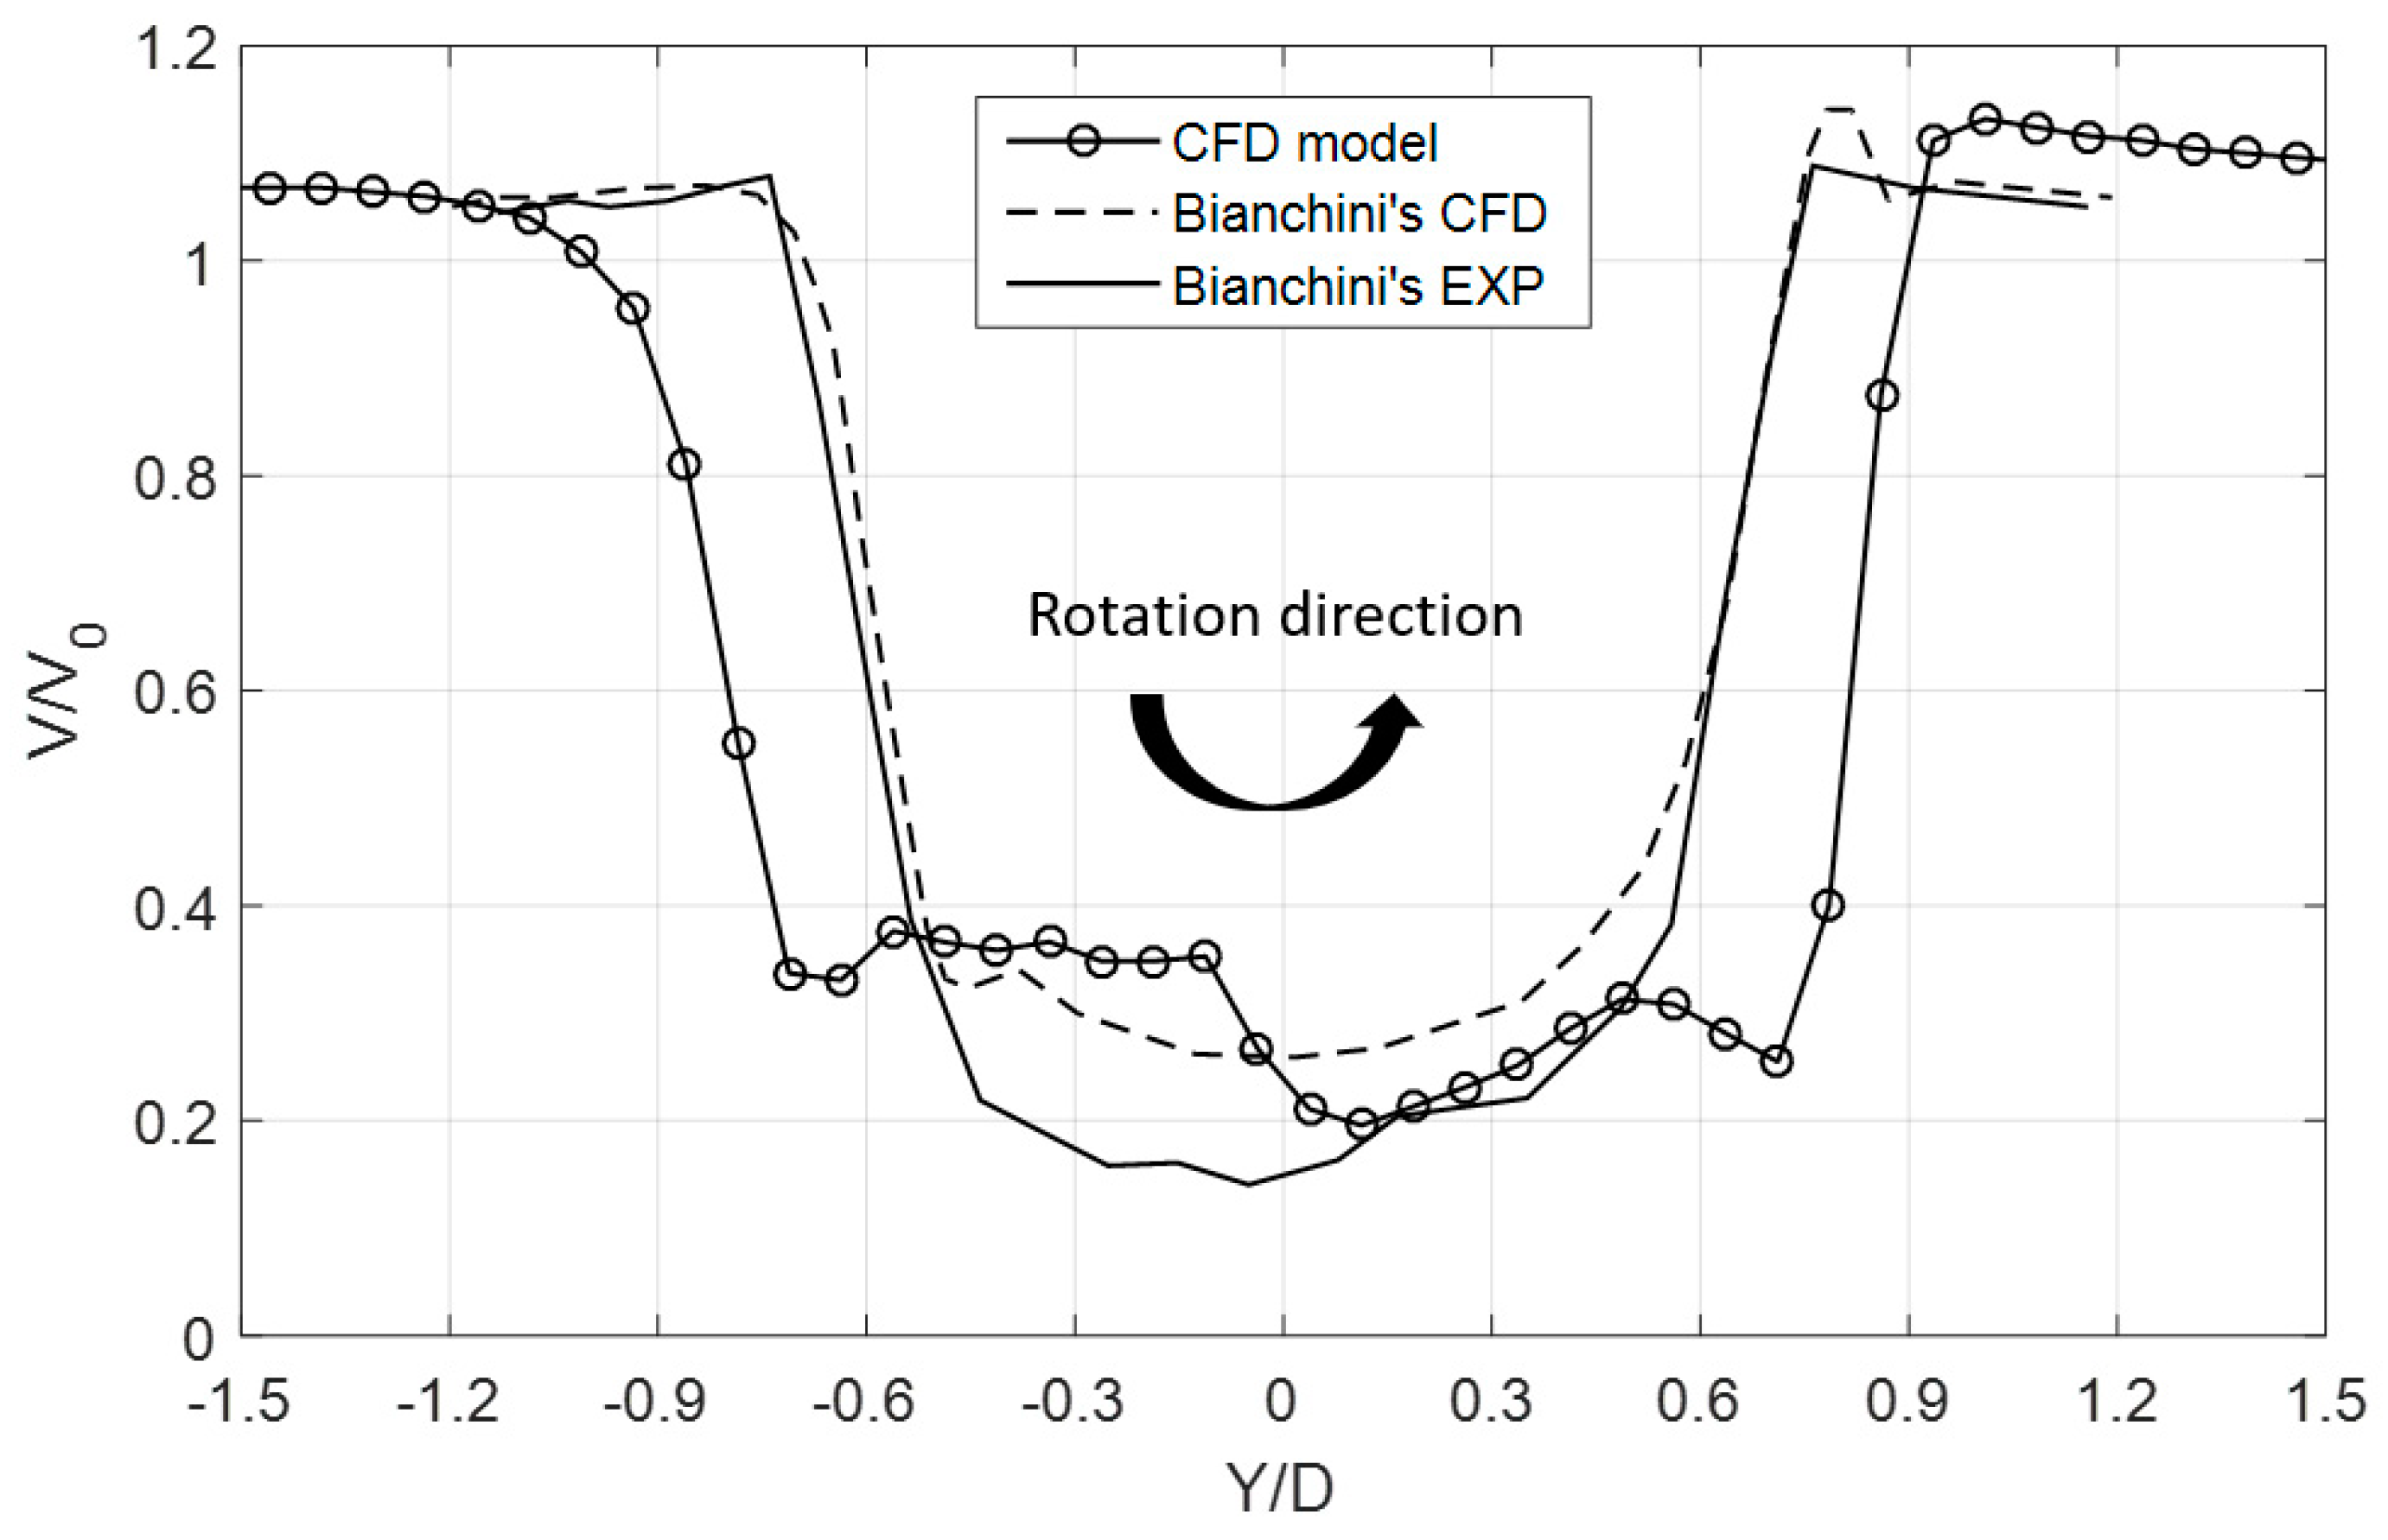
Experimental results and numerical simulations of wake of Darrieus-type wind turbines investigated by Bianchini et al. [34] were used in this study to validate the flow simulation around the turbine in model T2. The dimensionless axial velocities near the turbine efflux plane are shown in Figure 8. The computational results had good agreement with Bianchini’s experimental and numerical simulation results. With turbine wake, the efflux velocity shows a little increase on the sides but decreases significantly right behind the turbine. However, the low-velocity region of tidal current turbine wake is wider than wind turbine wake. This may be due to water having a higher density than air and a stronger turbine disturbance underwater. Tidal current turbines can capture more energy and disturb more section areas of fluid than wind turbines can. The flow mixture in tidal current turbine wake is more intense. Comparisons between wakes from wind turbines and tidal current turbines show a little mismatch, but limited experimental data on Darrieus-type tidal current turbine wake are available. Despite this, these two types of turbines have analogous work mechanisms with different types of fluid. Hence, the efflux velocity can show almost the same flow trend.
On the basis of the validation, the simulation results of the proposed hydrodynamic model had reasonable agreement with the experimental results. This model could be accepted for flow precalculation of turbine scour.

3.2.2. Scour Shape Validation

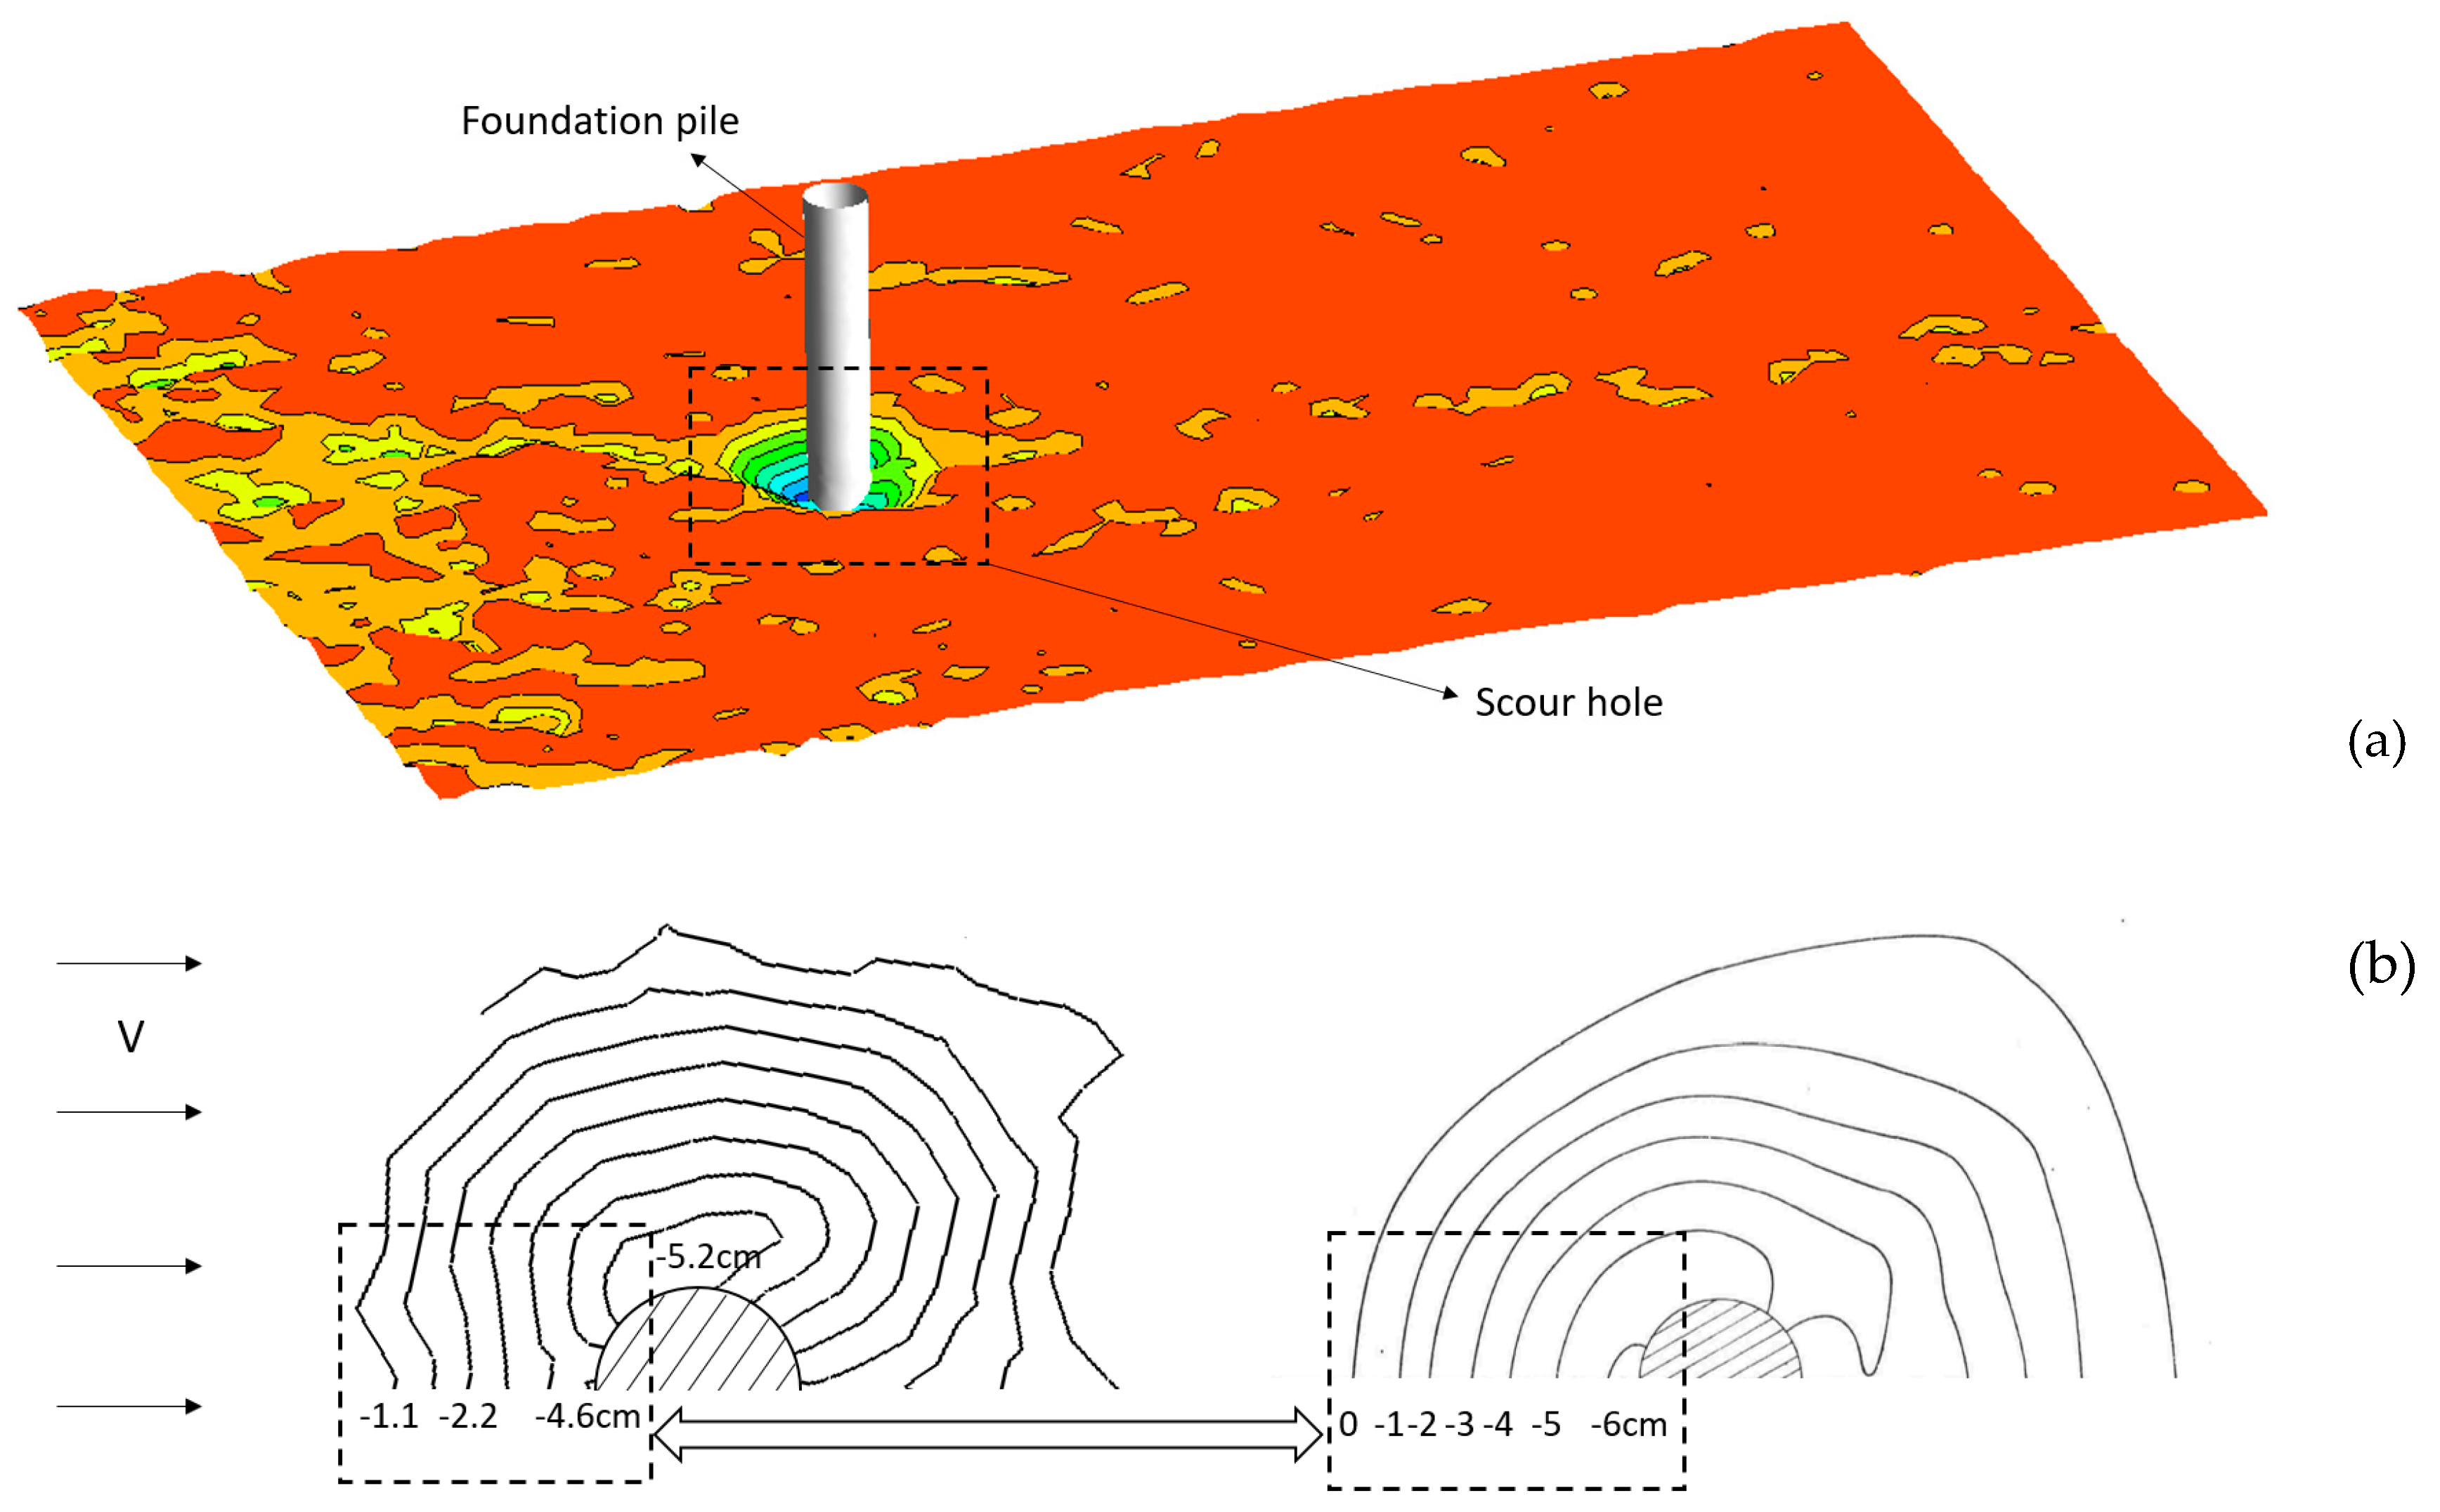
On the basis of the numerical and experimental results, the topographic contours of the local scour shapes after scour equilibrium of model T1 are shown in Figure 9. A scour hole around the foundation pile can be seen in Figure 9. The maximum scour depth occurred at the sides of the foundation. This result agrees well with pile scour experiments [33] and turbine scour experiments. In the CFD model, the horizontal length of the scour hole was 2D, 2D, and 2.5D upstream, downstream, and on the side of the pile, respectively. The horizontal extent of the scour hole was a little smaller than the experimental data, especially for downstream length.
In the simulation results, the maximum scour depth in model T1 was 5.2 cm (1.02D), and the width of the scour hole was about 1.5D. In Melville’s experiment, the maximum scour depth was 6 cm (1.18D), and the width of the scour hole was about 1.8D. The numerical model underestimated the equilibrium scour depth at about 13% compared to the experimental data with the same model setup. This phenomenon showed the same trend as Roulund’s CFD simulation [12]. The equilibrium scour depth obtained from that simulation was 15% smaller than the experimental scour depth. The reason was that in the iteration process in transient analysis, the seabed updates after the calculation of bed shear stress. Unsteady effects such as the fluctuating components of the horseshoe vortex and lee-wake vortex flows are not taken into account. These unsteady effects can also intensify the scour level [25]. In addition, the longitudinal length of the scour hole in the numerical results was also smaller than the experimental data due to the neglected impact of lee-wake vortex, which was the main reason for the scour hole being extended behind the foundation pile.
Flow fields around rotating turbines are more complicated compared to the flow conditions of scour around a single pile. To validate the scour depth around turbines with rotating rotors, the topographic contours of the local scour shapes after scour equilibrium of model T2 are shown in Figure 10. The model T2 was set up by adding the rotating rotor on the foundation pile, as shown in Figure 10a. In model T2, the horizontal length of the scour hole was 2.5D, 4D, and 3D upstream, downstream, and on the side of the pile, respectively. The horizontal extent of the scour hole was a little larger than the scour at the single pile. The maximum scour depth was 7.8 cm, which was about 50% deeper than the scour at the single pile in model T1. This result reflects the impact of turbine rotors on seabed scour. This phenomenon of deeper scour depth induced by turbine scour than scour at piles was also mentioned in a turbine scour experiment, as discussed in Section 3.3. The experimental data also showed a slightly larger than 50% deeper scour hole when the turbine was installed 0.5H above the seabed.
In summary, from the simulation results, all of the topographic bed features observed were captured:
(i)
A semicircular shape (in plan view) of the upstream part of the scour hole with a slope equal to the angle of repose;
(ii)
The formation of a gentler slope on the downstream side of the scour hole;
(iii)
A maximum scour depth occurring on the near sides of the foundation pile.
The maximum scour depth simulated by the proposed turbine scour model had good agreement with the experimental data. The accuracy of the proposed scour simulation should be acceptable from the viewpoint of scour depth. However, note that the maximum scour depth calculated by the present numerical model was about 15% smaller than the experimental data, since unsteady effects were neglected. Hence, the maximum scour depth of full-scale turbines as discussed in Section 4 may be conservative.

3.3. Model Validation through Second Group

This section shows the equilibrium scour profile of test models in group 2. After a comparison to a scale-down turbine scour experiment, the proposed numerical scour model was approved as effective and accurate to calculate scale-up models.

3.3.1. Scour Depth Validation

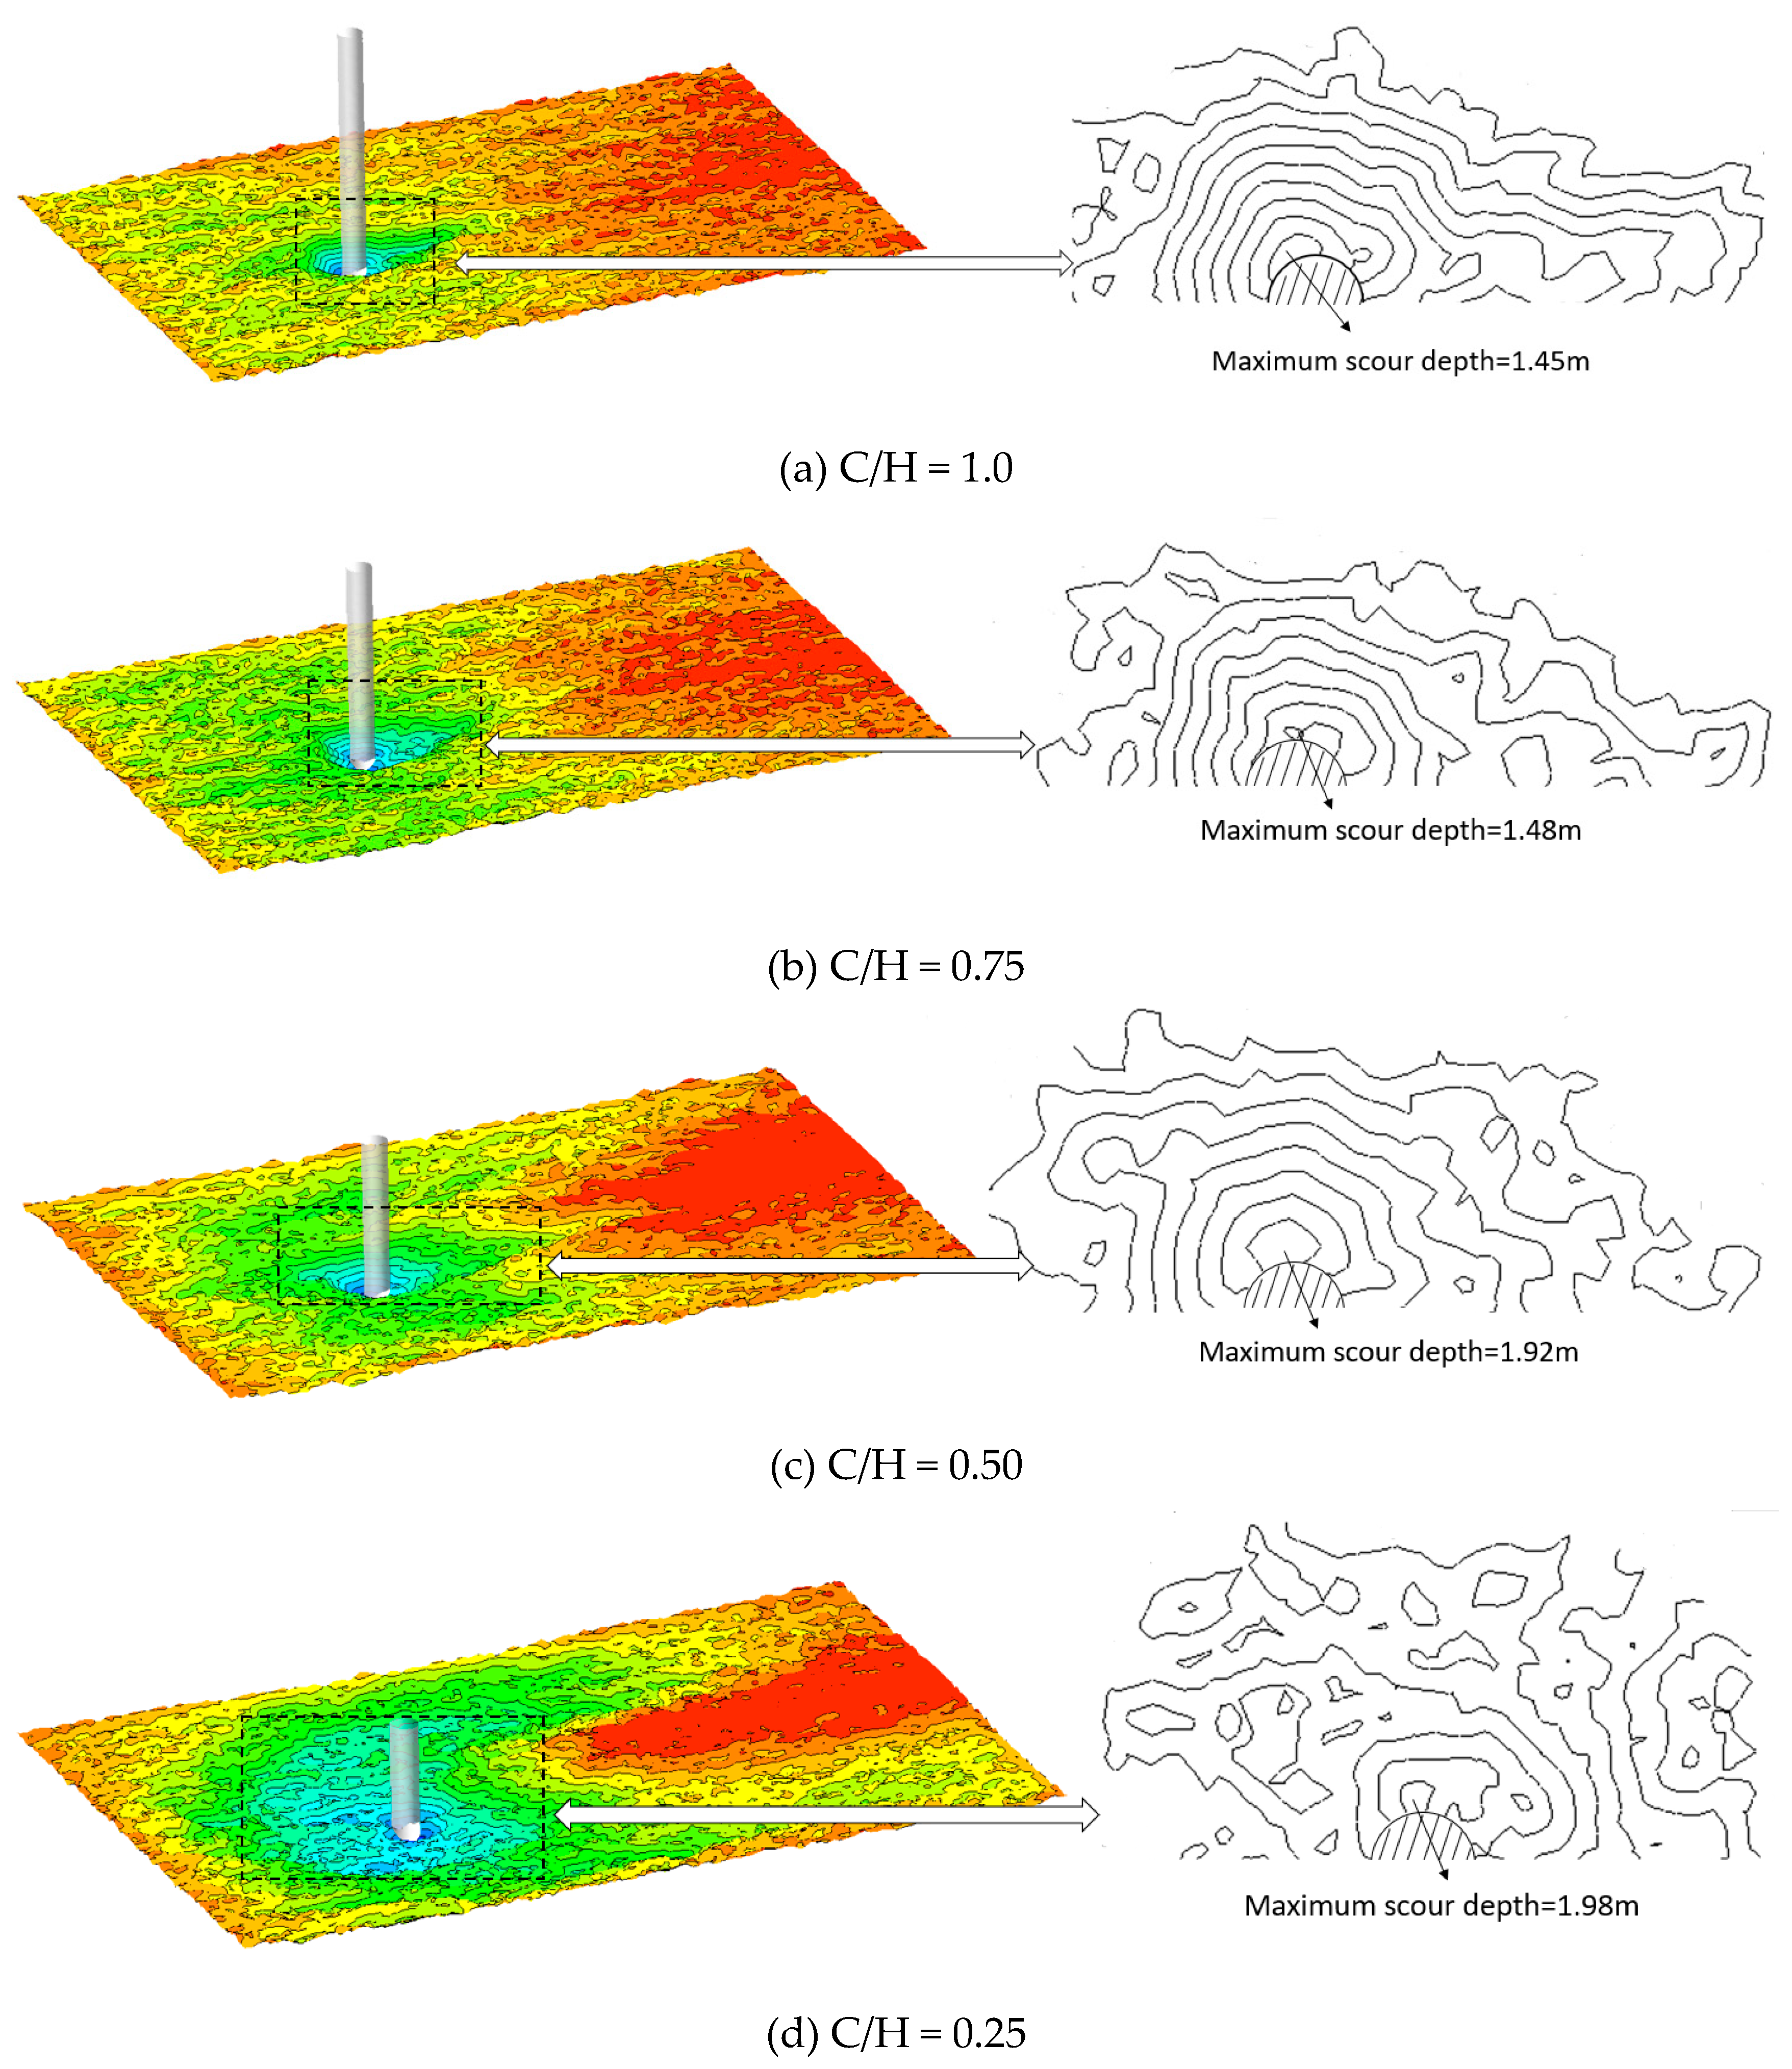
In model group 2, the main variable was tip clearance, from C/H = 0.25 to 1.0, since tip clearance is one of the main factors influencing bed velocity, as investigated in References [11] and [35]. The topographic contours of equilibrium scour shapes of model group 2 are shown in Figure 11. It can be seen that the maximum scour depth occurred at the sides of the foundation. Generally, a lower tip clearance causes a deeper and wider scour hole.
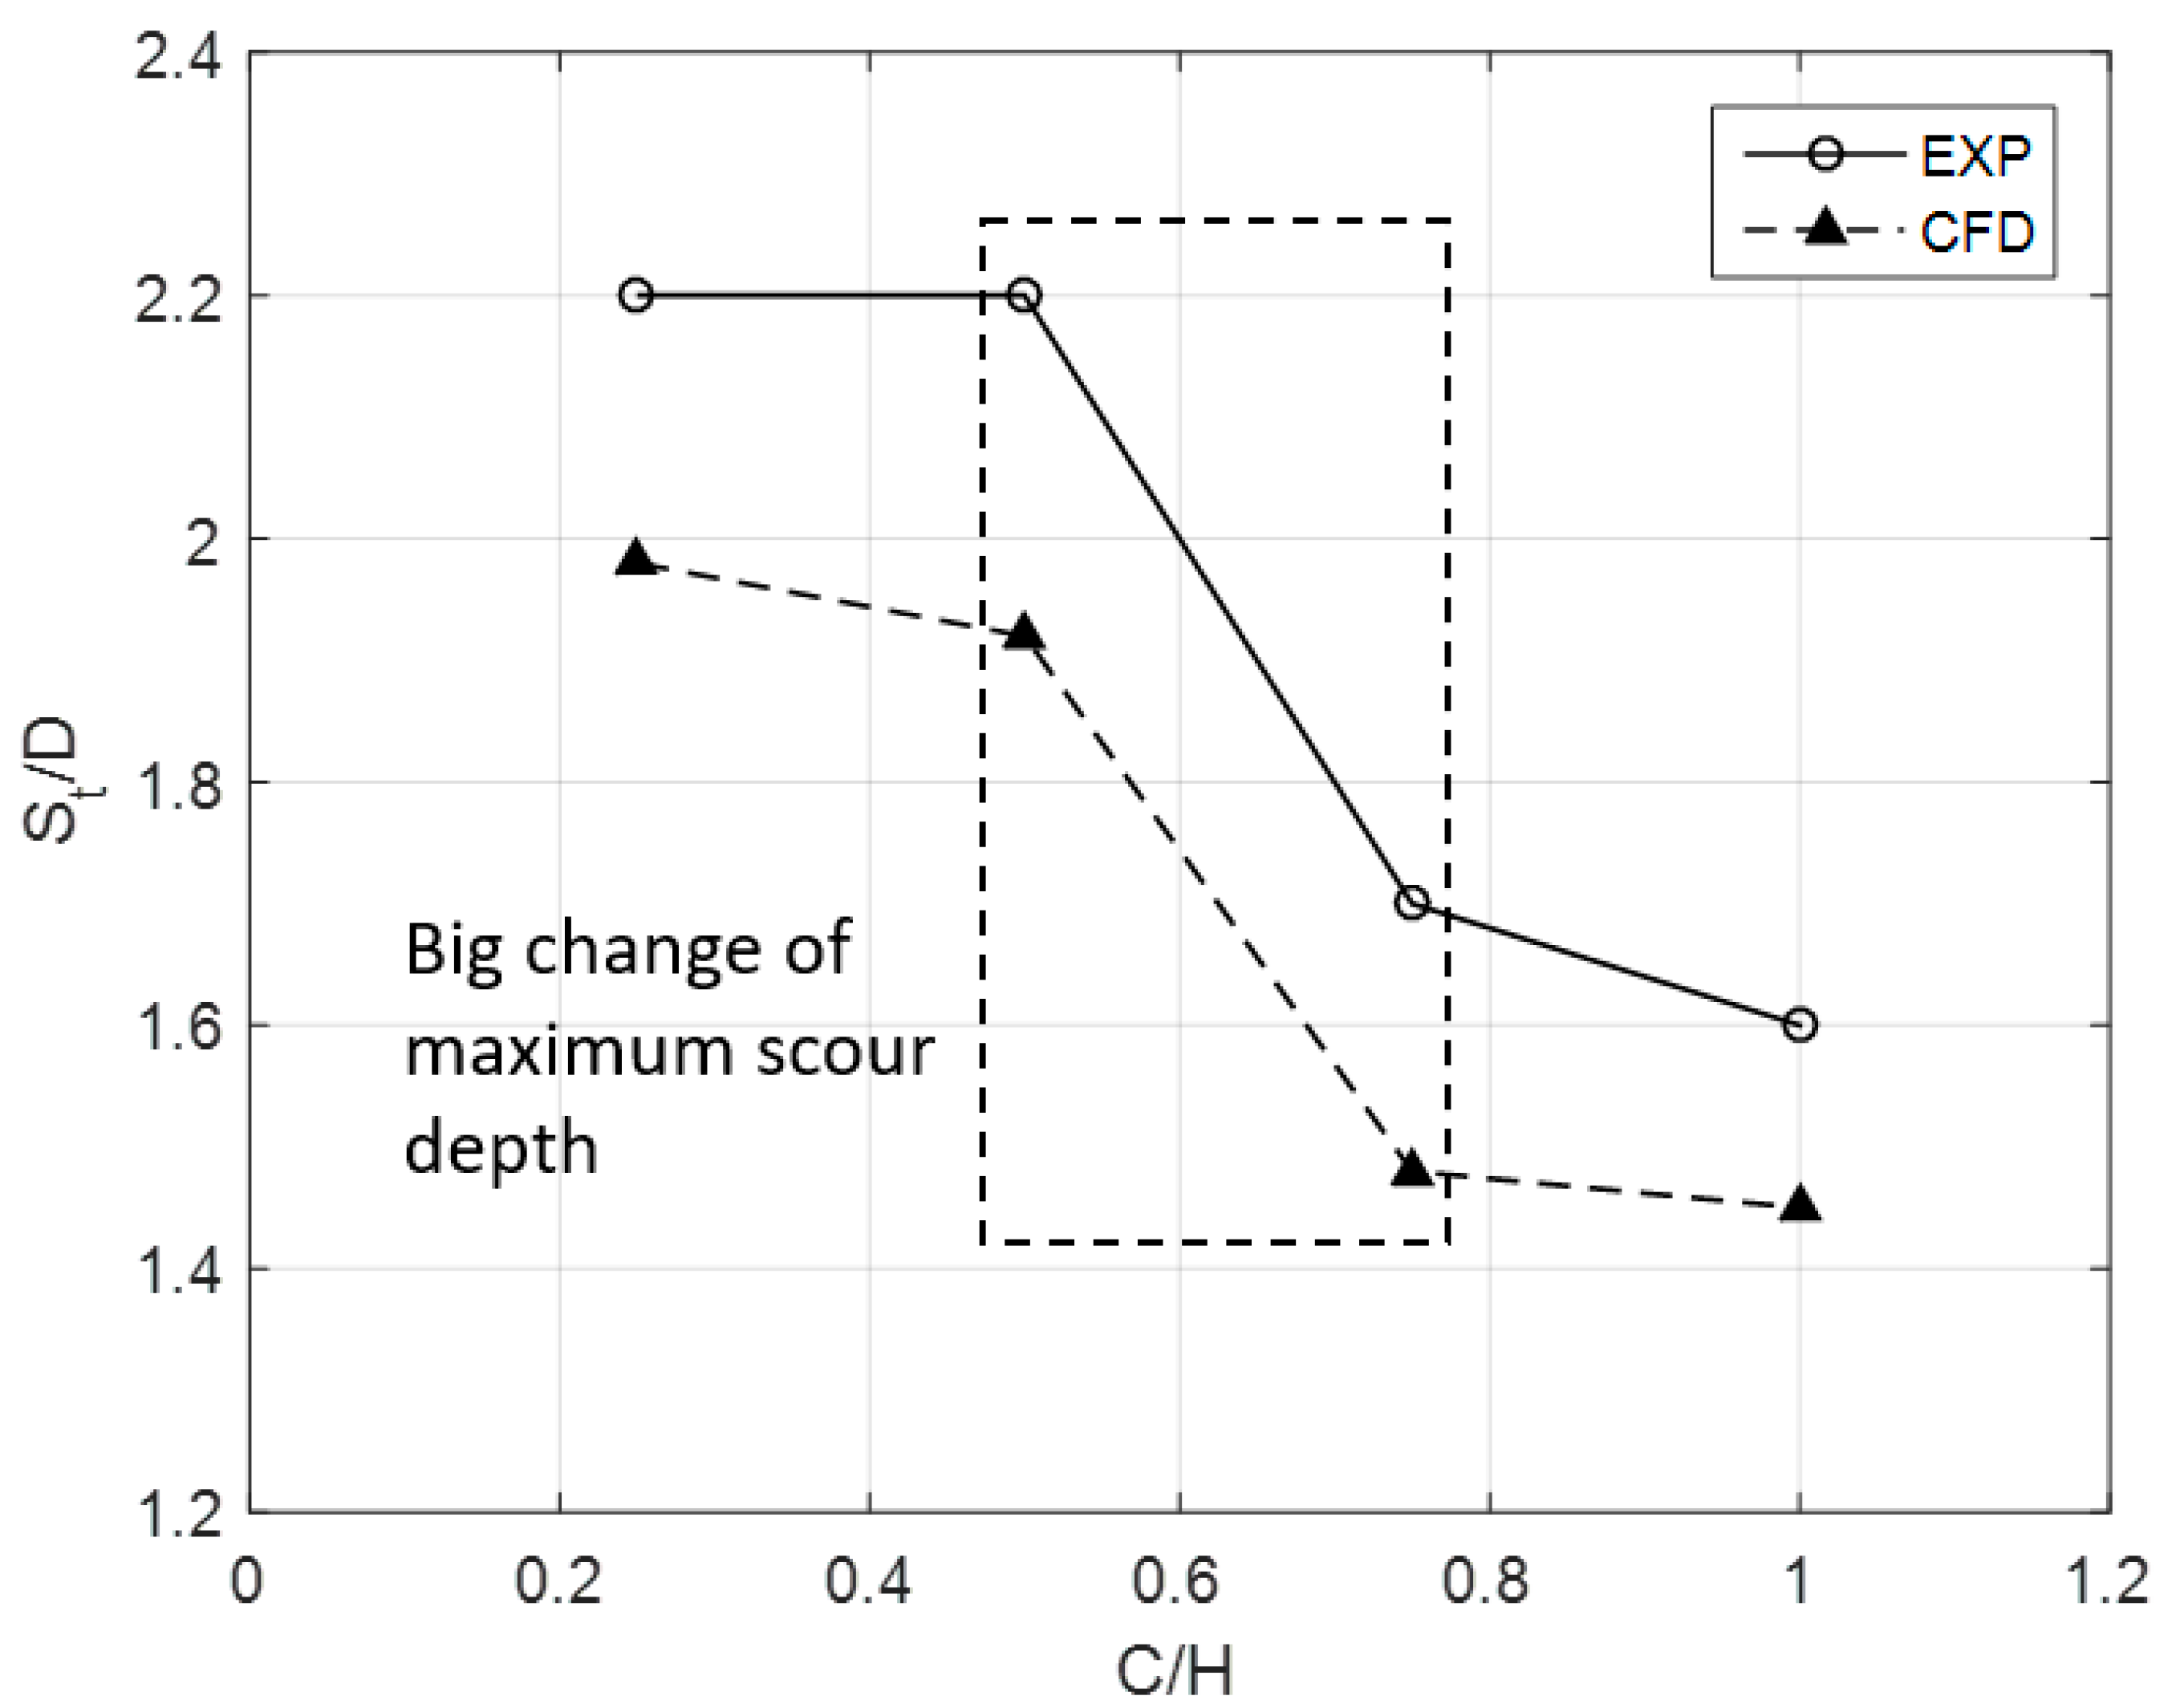
A comparison of maximum scour depths between the experiments and CFD simulations is shown in Figure 12. The scour depth St is nondimensionalized by pile diameter D. The errors between the CFD and experimental results were under 15%. Big changes in scour depth between cases of C/H = 0.5 and C/H = 0.75 occurred in the experimental and numerical results. This may have been due to the installation of a turbine rotor high enough off the seabed. The scour hole was mainly induced by accelerated flow in between the rotor and seabed. However, when the turbine was installed close to the seabed (C/H < 0.5), the flow suppression effects due to the existence of the turbine rotor and the increase in turbulence intensity around the tip regions jointly affected the increase in the scour level. Hence, the scour depth showed a big jump from C/H = 0.75 to C/H = 0.5.
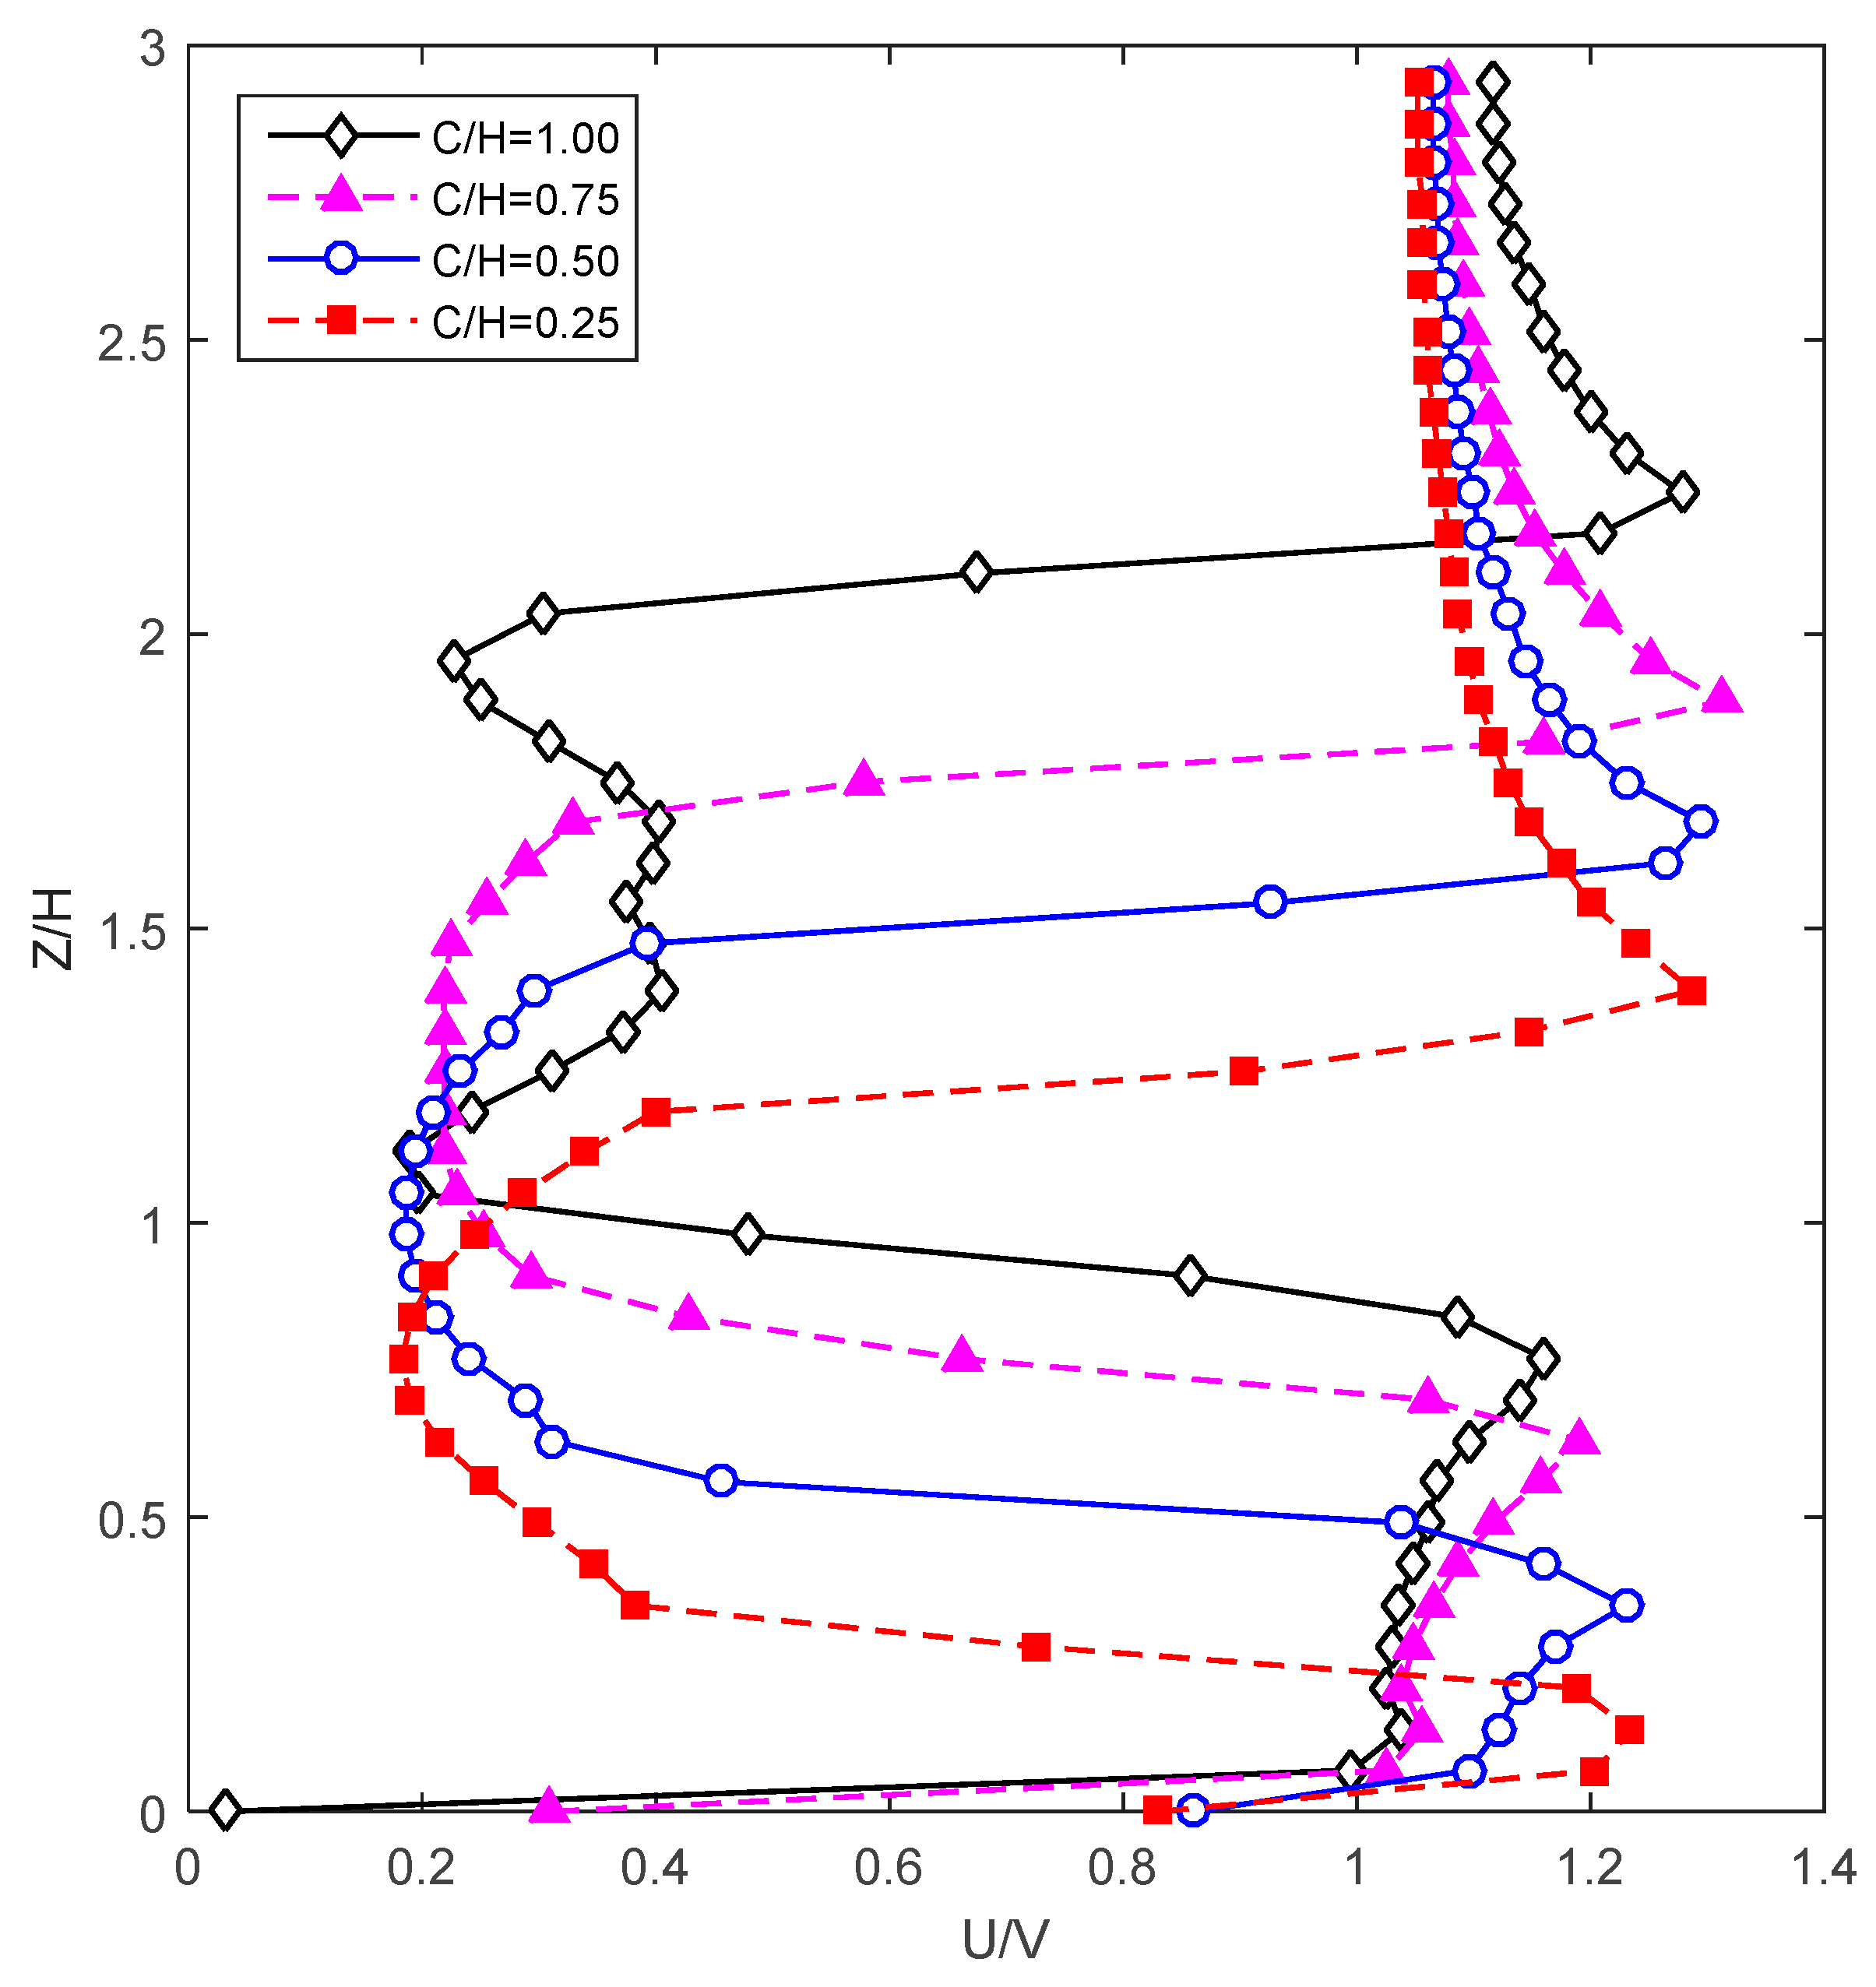
The proposed model was able to capture the change in the averaged flow velocity. The accelerated flow further increased the final scour depth. A smaller tip clearance can cause a deeper scour hole. To explain this phenomenon, the flow velocity under the turbine rotor at line (x = −2D, y = 0) from C/H = 0.25–1.0 is shown in Figure 13, where D is the diameter of the turbine foundation pile. In Figure 13, flow velocity U is divided by inlet velocity V on the x axis, and vertical height Z is divided by turbine height H on the y axis. It can be seen that the flow velocity decays in the region adjacent to the blade height of the rotor were due to energy extraction, and increases in the region immediately above and below the turbine were due to blockage effects. Blockage effects occur due to the incoming flow diverting the obstructed fluid to the upper and lower sides of the rotor. The diverted flow accelerates around the rotor to balance the flow mass conservation. The acceleration ratio of the flow velocity at slipstream between the turbine rotor and the seabed was about 10–20%. In slipstream, the maximum flow velocity occurs close to the tip of the rotor. The faster flow rate approaching the seabed can be reached at a lower tip clearance. This is one of the main reasons why scour holes are deeper at a lower tip clearance.

3.3.2. Scour Profile Validation

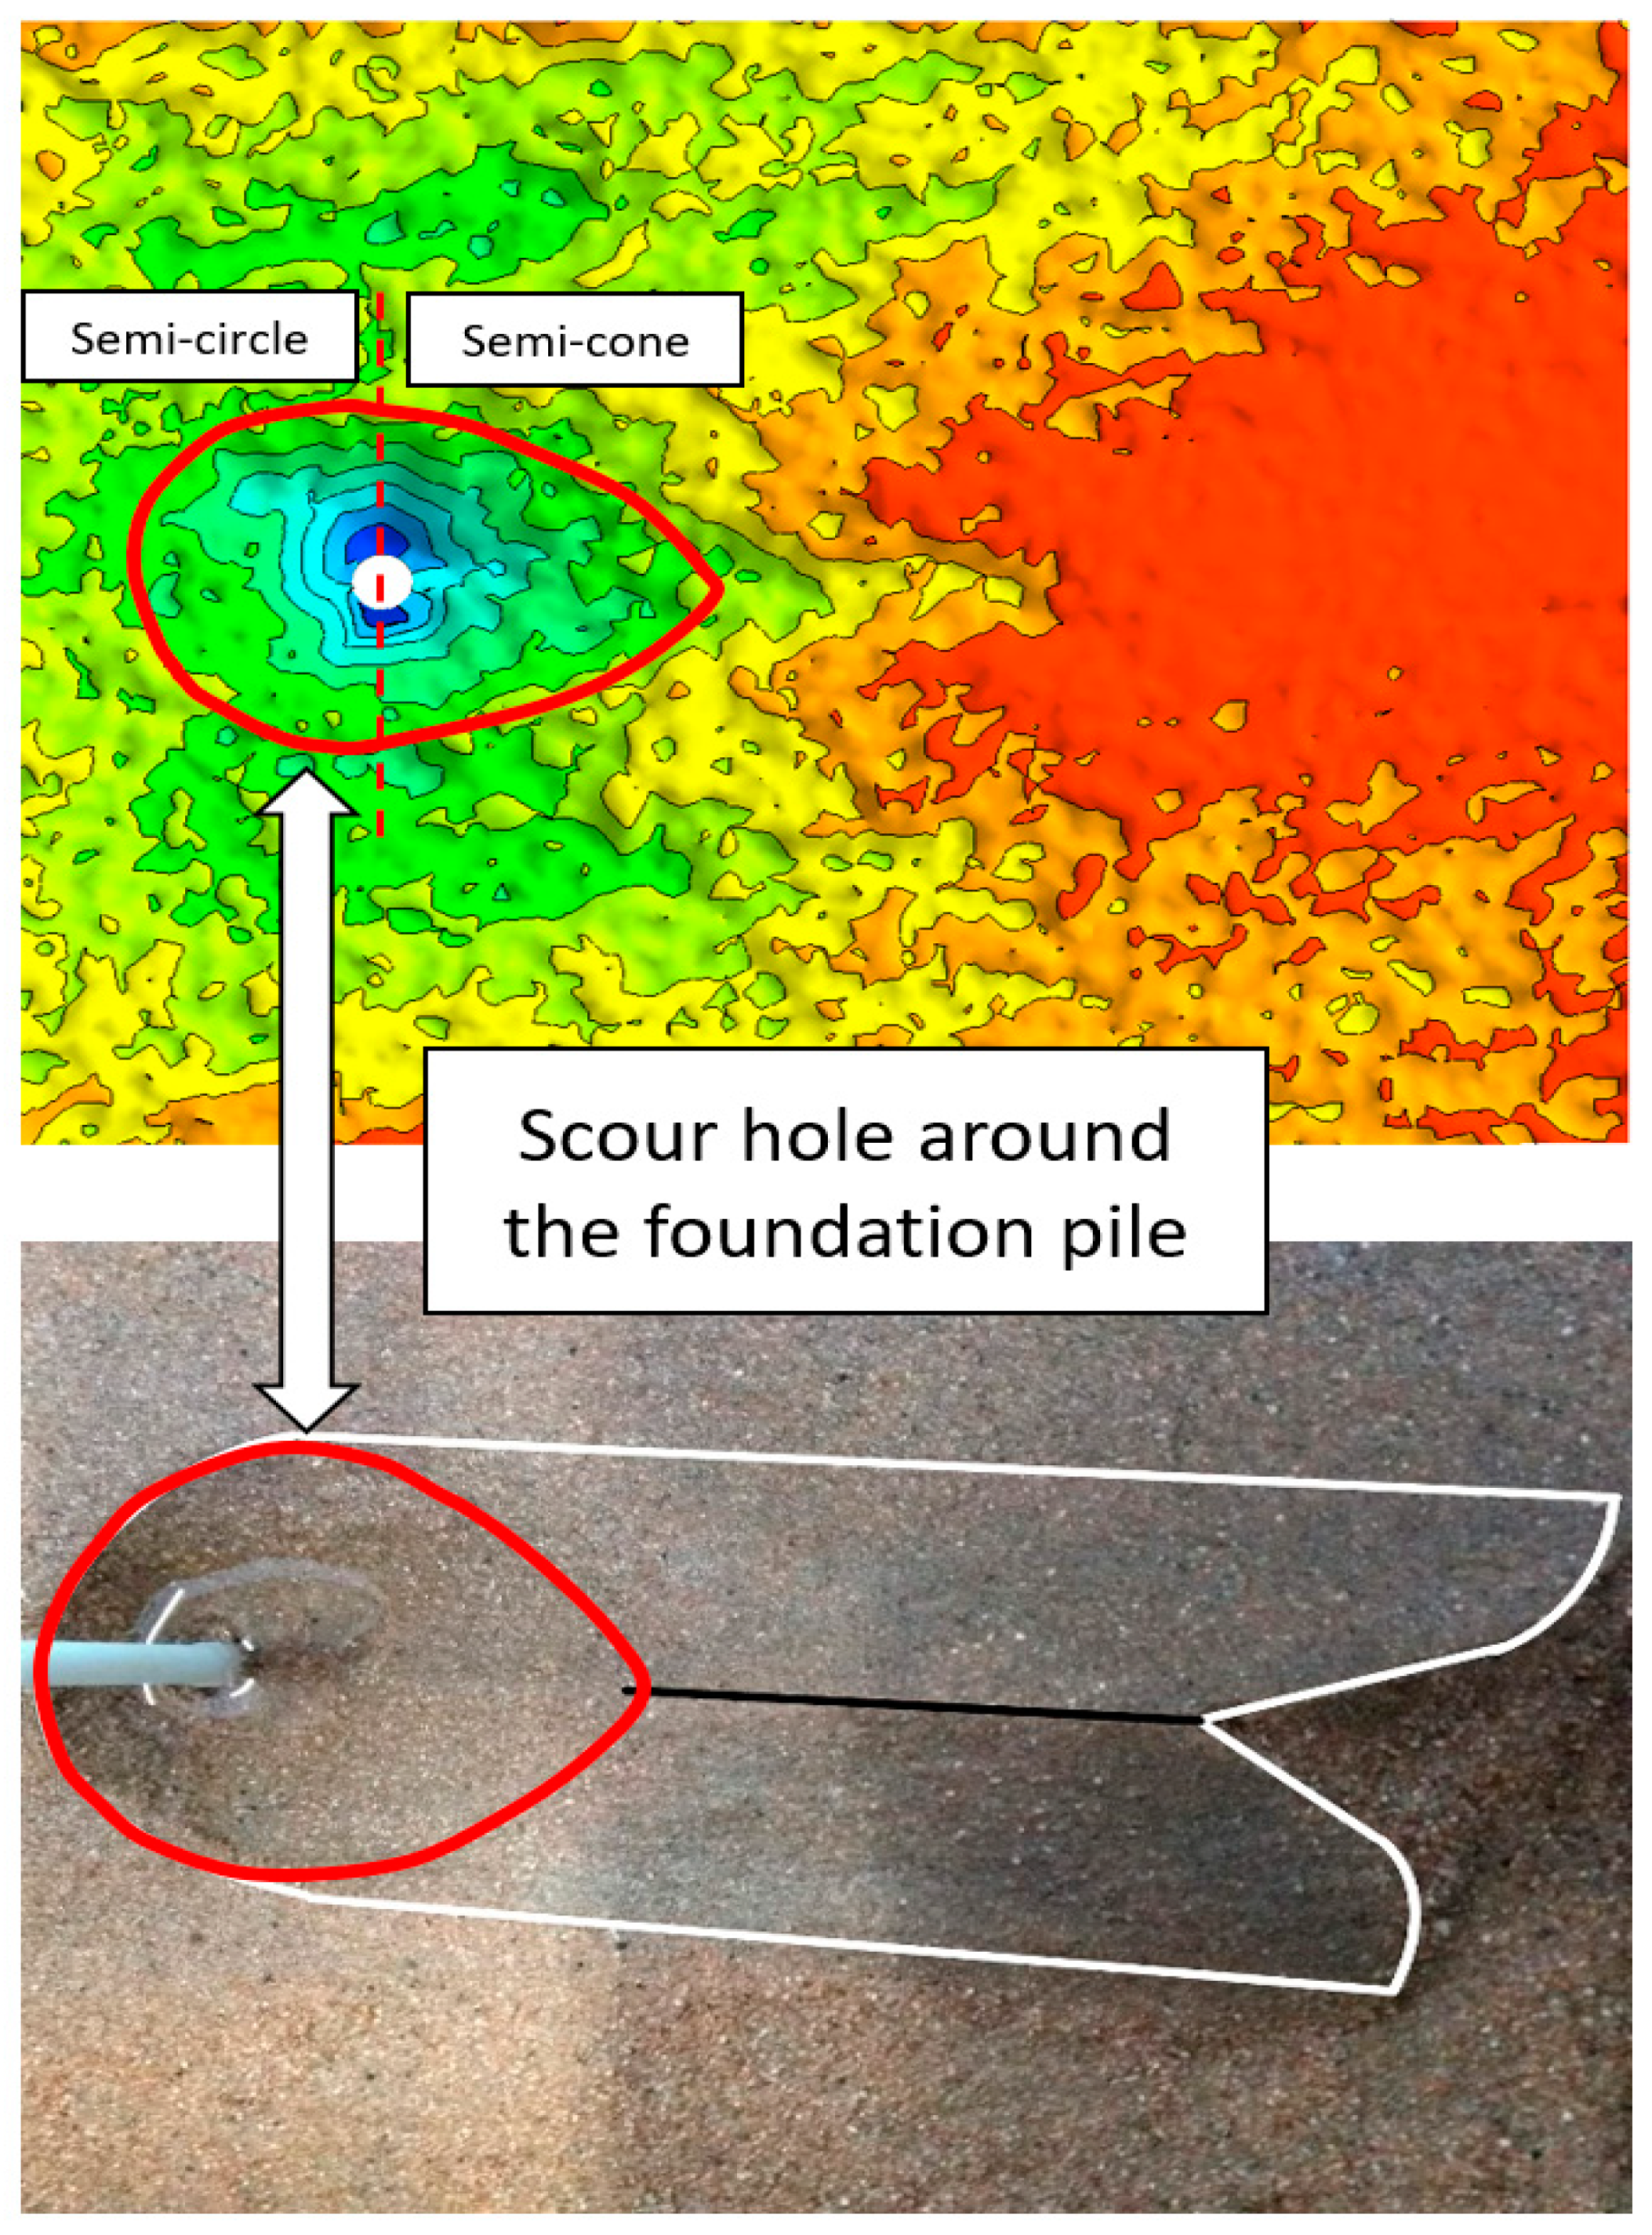
The topographic contours of turbine scour shapes at C/H=0.5 were chosen to validate the simulation scour profile results. As seen in Figure 14, an outline of a scour hole is illustrated with a red line. The scour hole showed a similar outline: a semicircle upstream and a semicone downstream of the pile. However, the simulated scour width and longitudinal length were relatively lower than in the experimental data. The scour width was 3D in the simulation and 4D in the experiment, and the longitudinal length downstream was 5.5D in the simulation and 8D in the experiment. The proposed scour model could not simulate the sand dune formed behind the turbine.

3.4. Error Analysis of the Proposed Model

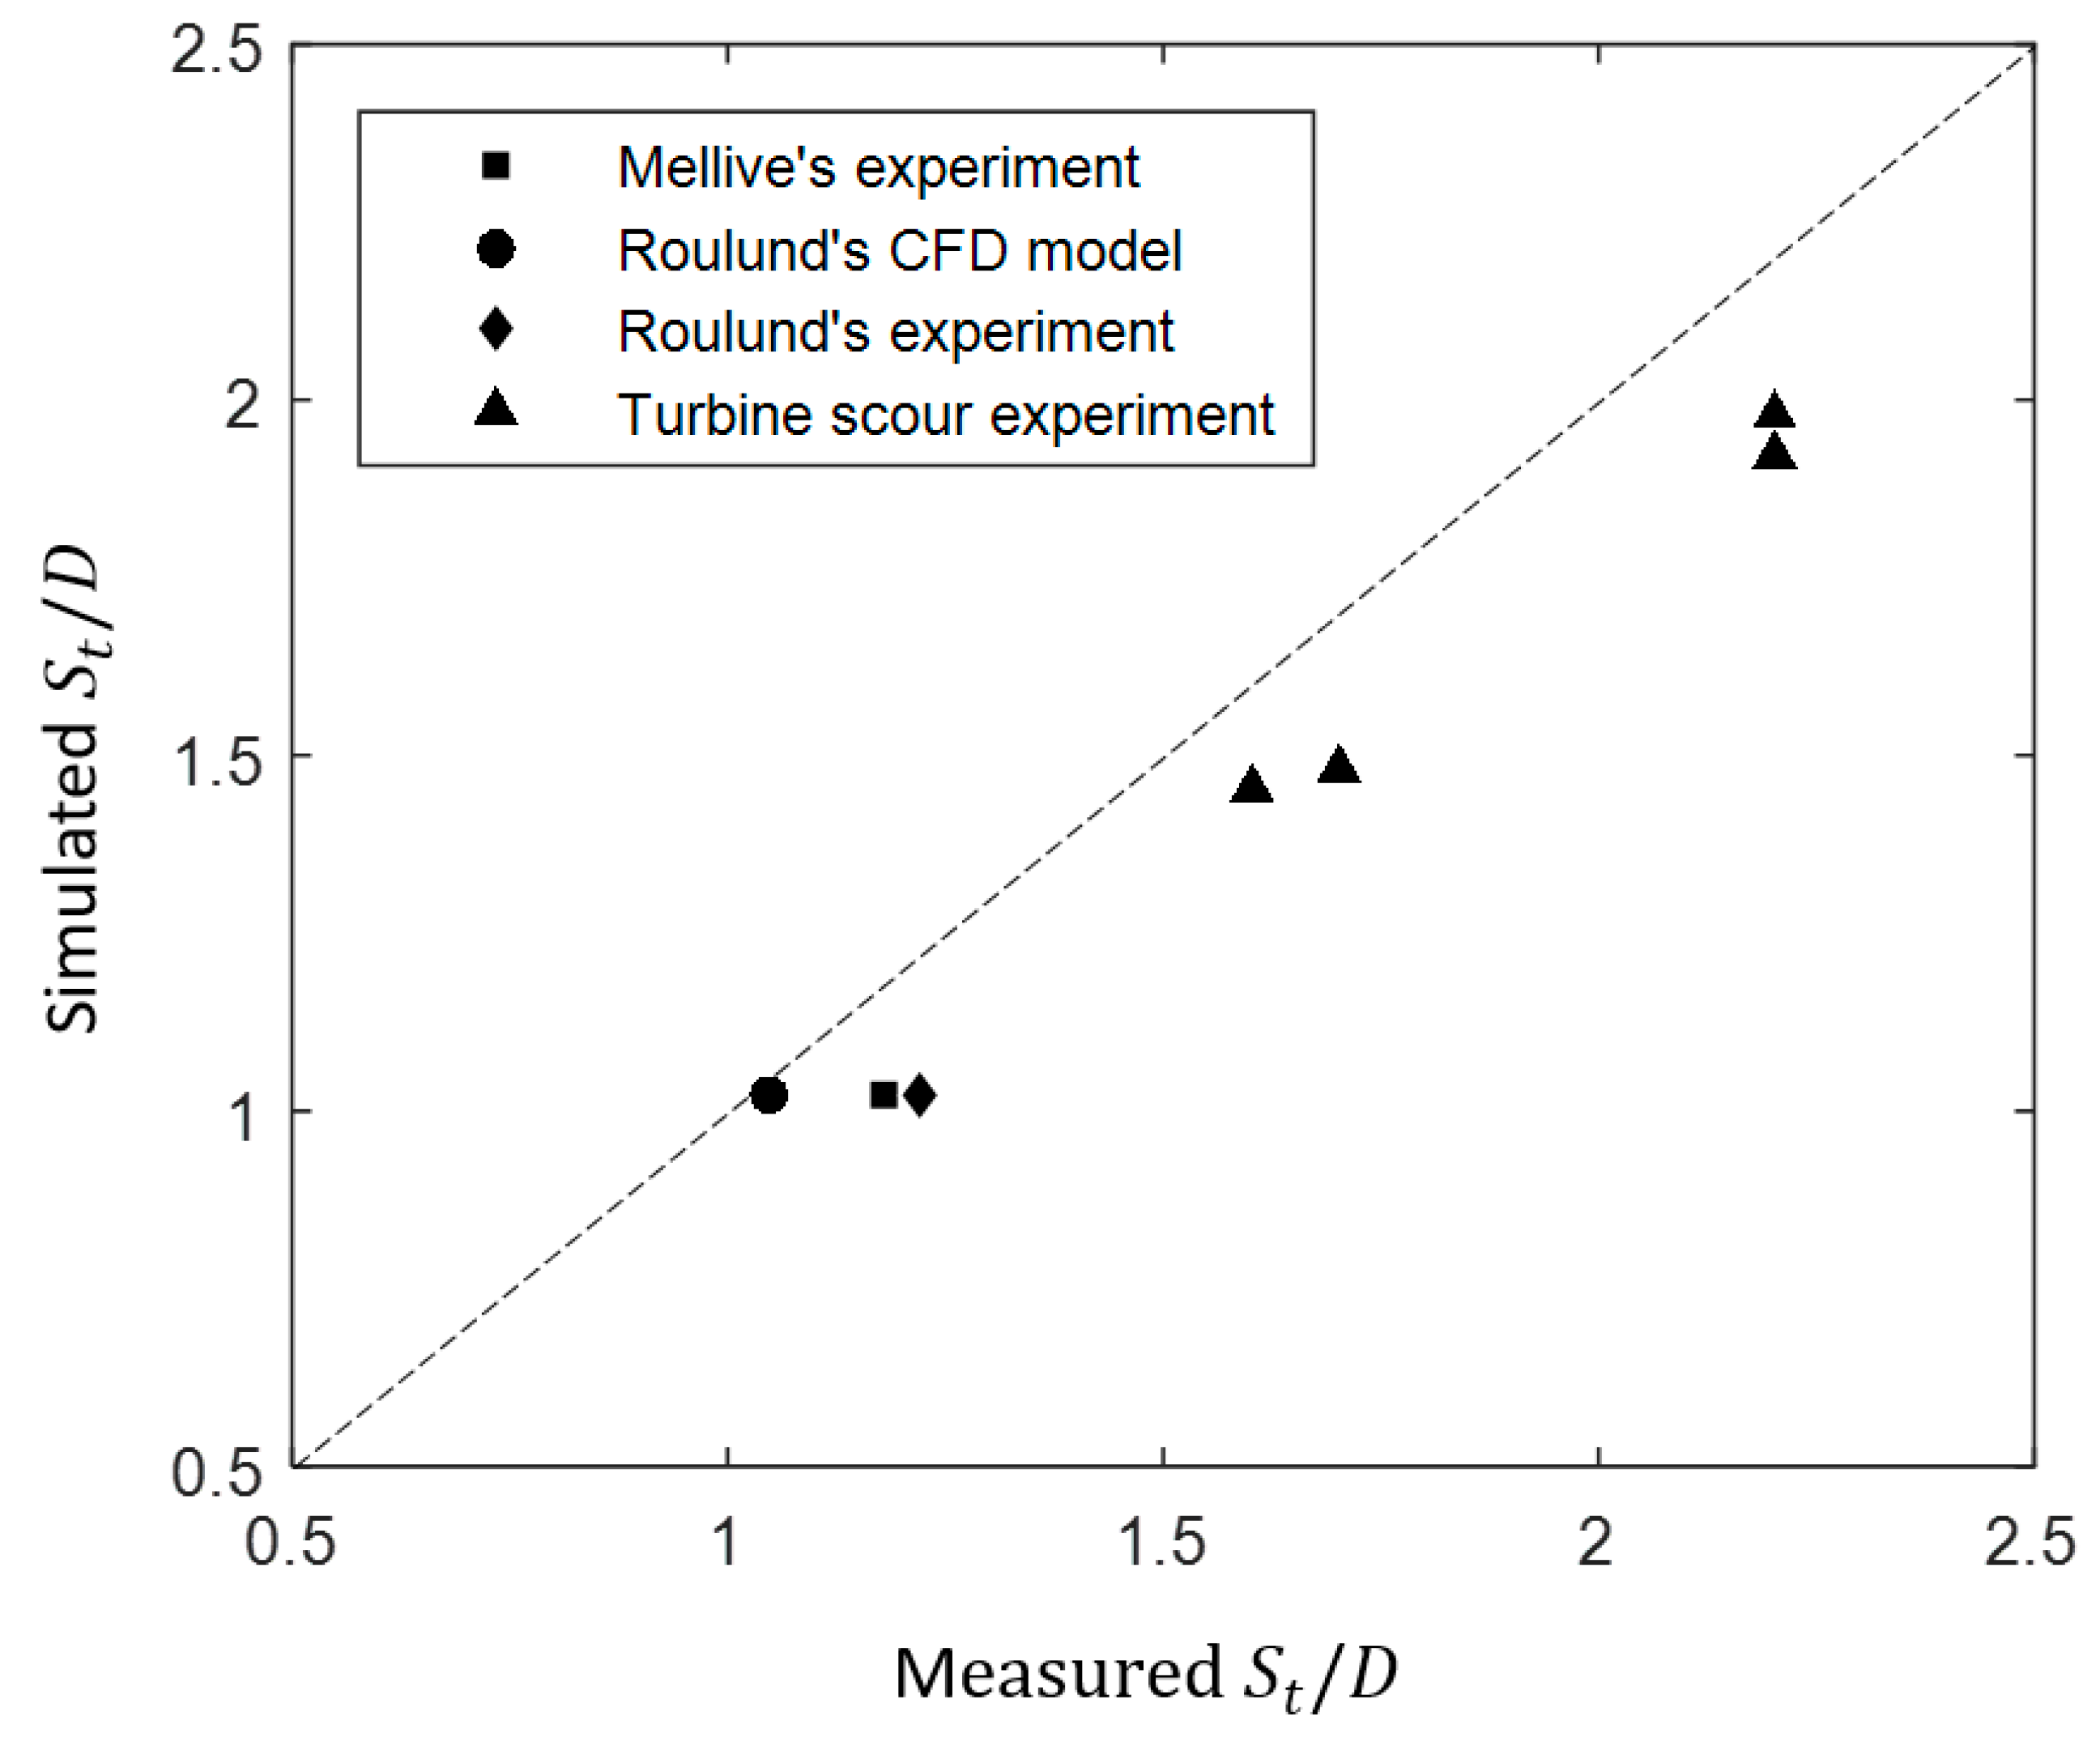
The quantitative comparisons between the proposed CFD model and the experimental data are shown in this section. The simulated tidal turbine scour depth was compared to the experimental measurements, as shown in Figure 15. The scour depth was normalized by the pile’s diameter. A maximum variation of 18% occurred in the results from Roulund’s experiment [12]. Generally, the proposed CFD model underestimated the seabed scour depth of tidal current turbines under an 18% error range. Based on the experimental results from Melville [33], Roulund et al. [12], and the current tests of turbine scour, statistical functions using the correlation coefficient (R), mean absolute error (MAE), root mean squared error (RSME), and scatter index (SI) (Equations (12)–(15)) were calculated to evaluate the accuracy of the proposed model.
R 2 = i = 1 M ( O i O ¯ ) ( P i P ¯ ) i = 1 M ( O i O ¯ ) 2 i = 1 M ( P i P ¯ ) 2 ,
M A E = 1 M i = 1 M | P i O i O i | ,
R M S E = ( i = 1 M | P i O i | 2 M ) 1 / 2 ,
S I = ( 1 / M ) i = 1 M ( ( P i P ¯ ) ( O i O ¯ ) ) 2 ( 1 / M ) i = 1 M O i ,
where O i is the experimental value, P i is the simulated value, O ¯ is the average experimental value, P ¯ is the average simulated value, and M is the amount of experimental data. The specific value of error analysis of the proposed model is listed in Table 4. It can be seen that the maximum scour depth predicted by the proposed model fit well with the experimental data with a little underestimation.
In conclusion, the proposed numerical model could simulate the scour process and final scour hole profiles around the turbine with reasonable agreement. The maximum scour depth was a little lower than in the experiment, since unsteady effects were neglected with an unsteady effect. The hydrodynamic model used the RANS model to simulate the flow field and then calculate the seabed shear stresses as the initial input for the morphologic model. In the morphologic model, the seabed was updated at each time step using the dynamic meshing method. This model could capture the main factors for turbine scour and simulate the scour process with a low computational cost and an effective calculated performance.
However, this model had its own shortcomings. It could not consider unsteady factors such as vortex systems. In the proposed CFD model, the calculation of sediment transport only considers steady-flow conditions. The hydrodynamic model uses turbulence intensity to express the oscillating flow components. The oscillation flow components are not brought into the calculation of seabed scour in the morphological model. The vortex system can promote turbine scour in reality. Therefore, the scour depth calculated by the CFD model reached an equilibrium depth faster than in the experiment. The scour depth was also more shallow in the CFD results than in the experiment.
On the other hand, the proposed model neglected the suspended sediments. This is because the suspended sediments showed little impact on local scour around the foundation pile. Local scour around the turbine is mainly caused by downflow and a horseshoe vortex around the pile. The suspended sediments can be taken away by tidal currents and deposited downstream.

4. Numerical Investigation of Full-Scale Turbine Scour

A numerical investigation of the proposed full-scale turbine, in terms of the temporal and spatial development of seabed scour, was undertaken using the developed computational methodology and models. The dimensions of the proposed full-scale turbine are shown in Table 5.

4.1. Maximum Scour Depth

Maximum scour depth is one of the main factors for turbine scour prediction and protection. The equilibrium scour hole around a full-scale turbine was simulated using the proposed model, as shown in Figure 16. Figure 16 shows the topographic contours of the local scour shapes. The maximum scour depth was 1.96D, which was about 11% less than the scale-down experiment of C/H = 0.5.
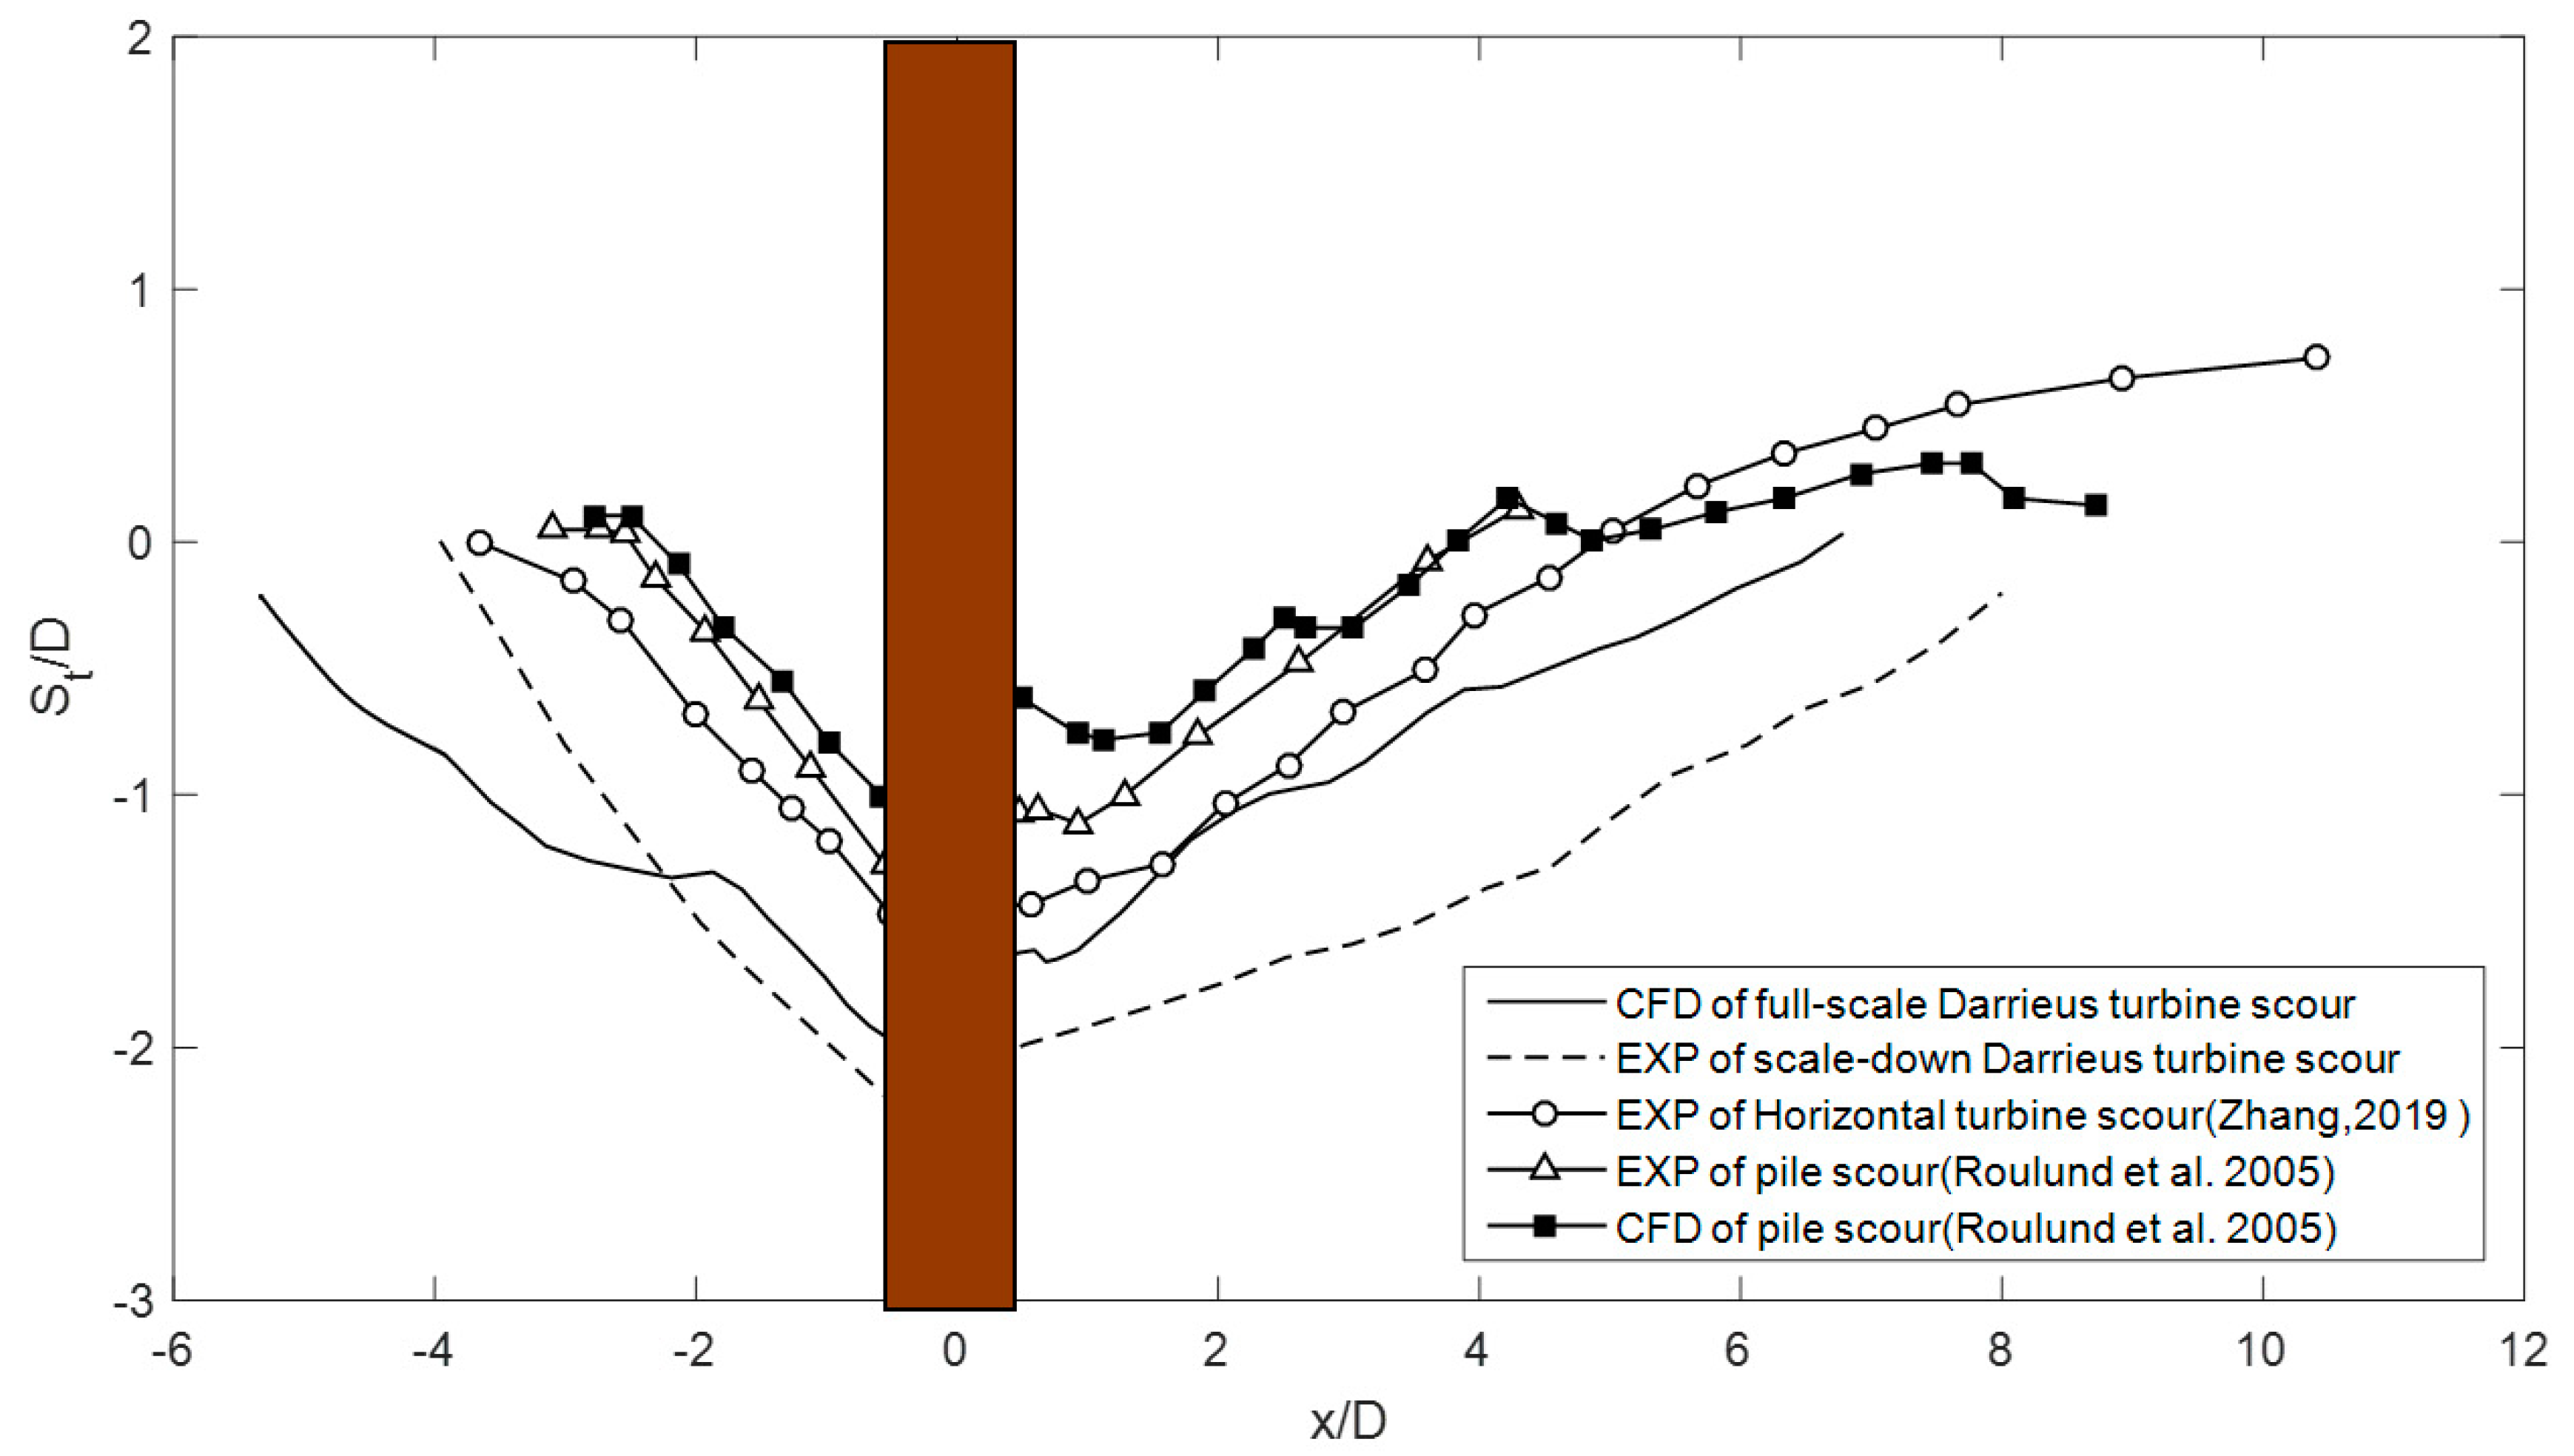
To further discuss the maximum scour depth and scour hole profiles, a comparison of scour-hole profiles along the upstream-downstream symmetry line of different types of scour is shown in Figure 17. The experimental and CFD data of scour at piers measured by Roulund et al. [12] and the experimental data measured by Zhang et al. [9] were selected for comparison. It can be seen that the simulated maximum scour depth (1.96D) was 27% deeper than horizontal-axis turbine scour depth (1.42D) and 34% deeper than the experimental data of scour depth around a single pile (1.3D).
The results show that scour depth around tidal current turbines was deeper than scour at piles. This was due to the flow acceleration at slipstream between the rotor and seabed. Furthermore, scour induced by Darrieus turbines is also deeper than scour induced by horizontal-axis turbines with the same flow conditions. This is because Darrieus turbines have more flow-contract block degrees with bigger cross-sectional areas above the seabed. Hence, the flow between Darrieus-type turbines and the seabed has a higher speed compared to a horizontal-axis turbine.
Both CFD results of scour depth around piles and scour around tidal current turbines showed about 15% less than scour depth from the experimental data. It should be noticed that real scour depth around full-scale turbines may be more than 1.96D, as simulated by the proposed model.

4.2. Horizontal Extent of Scour Hole

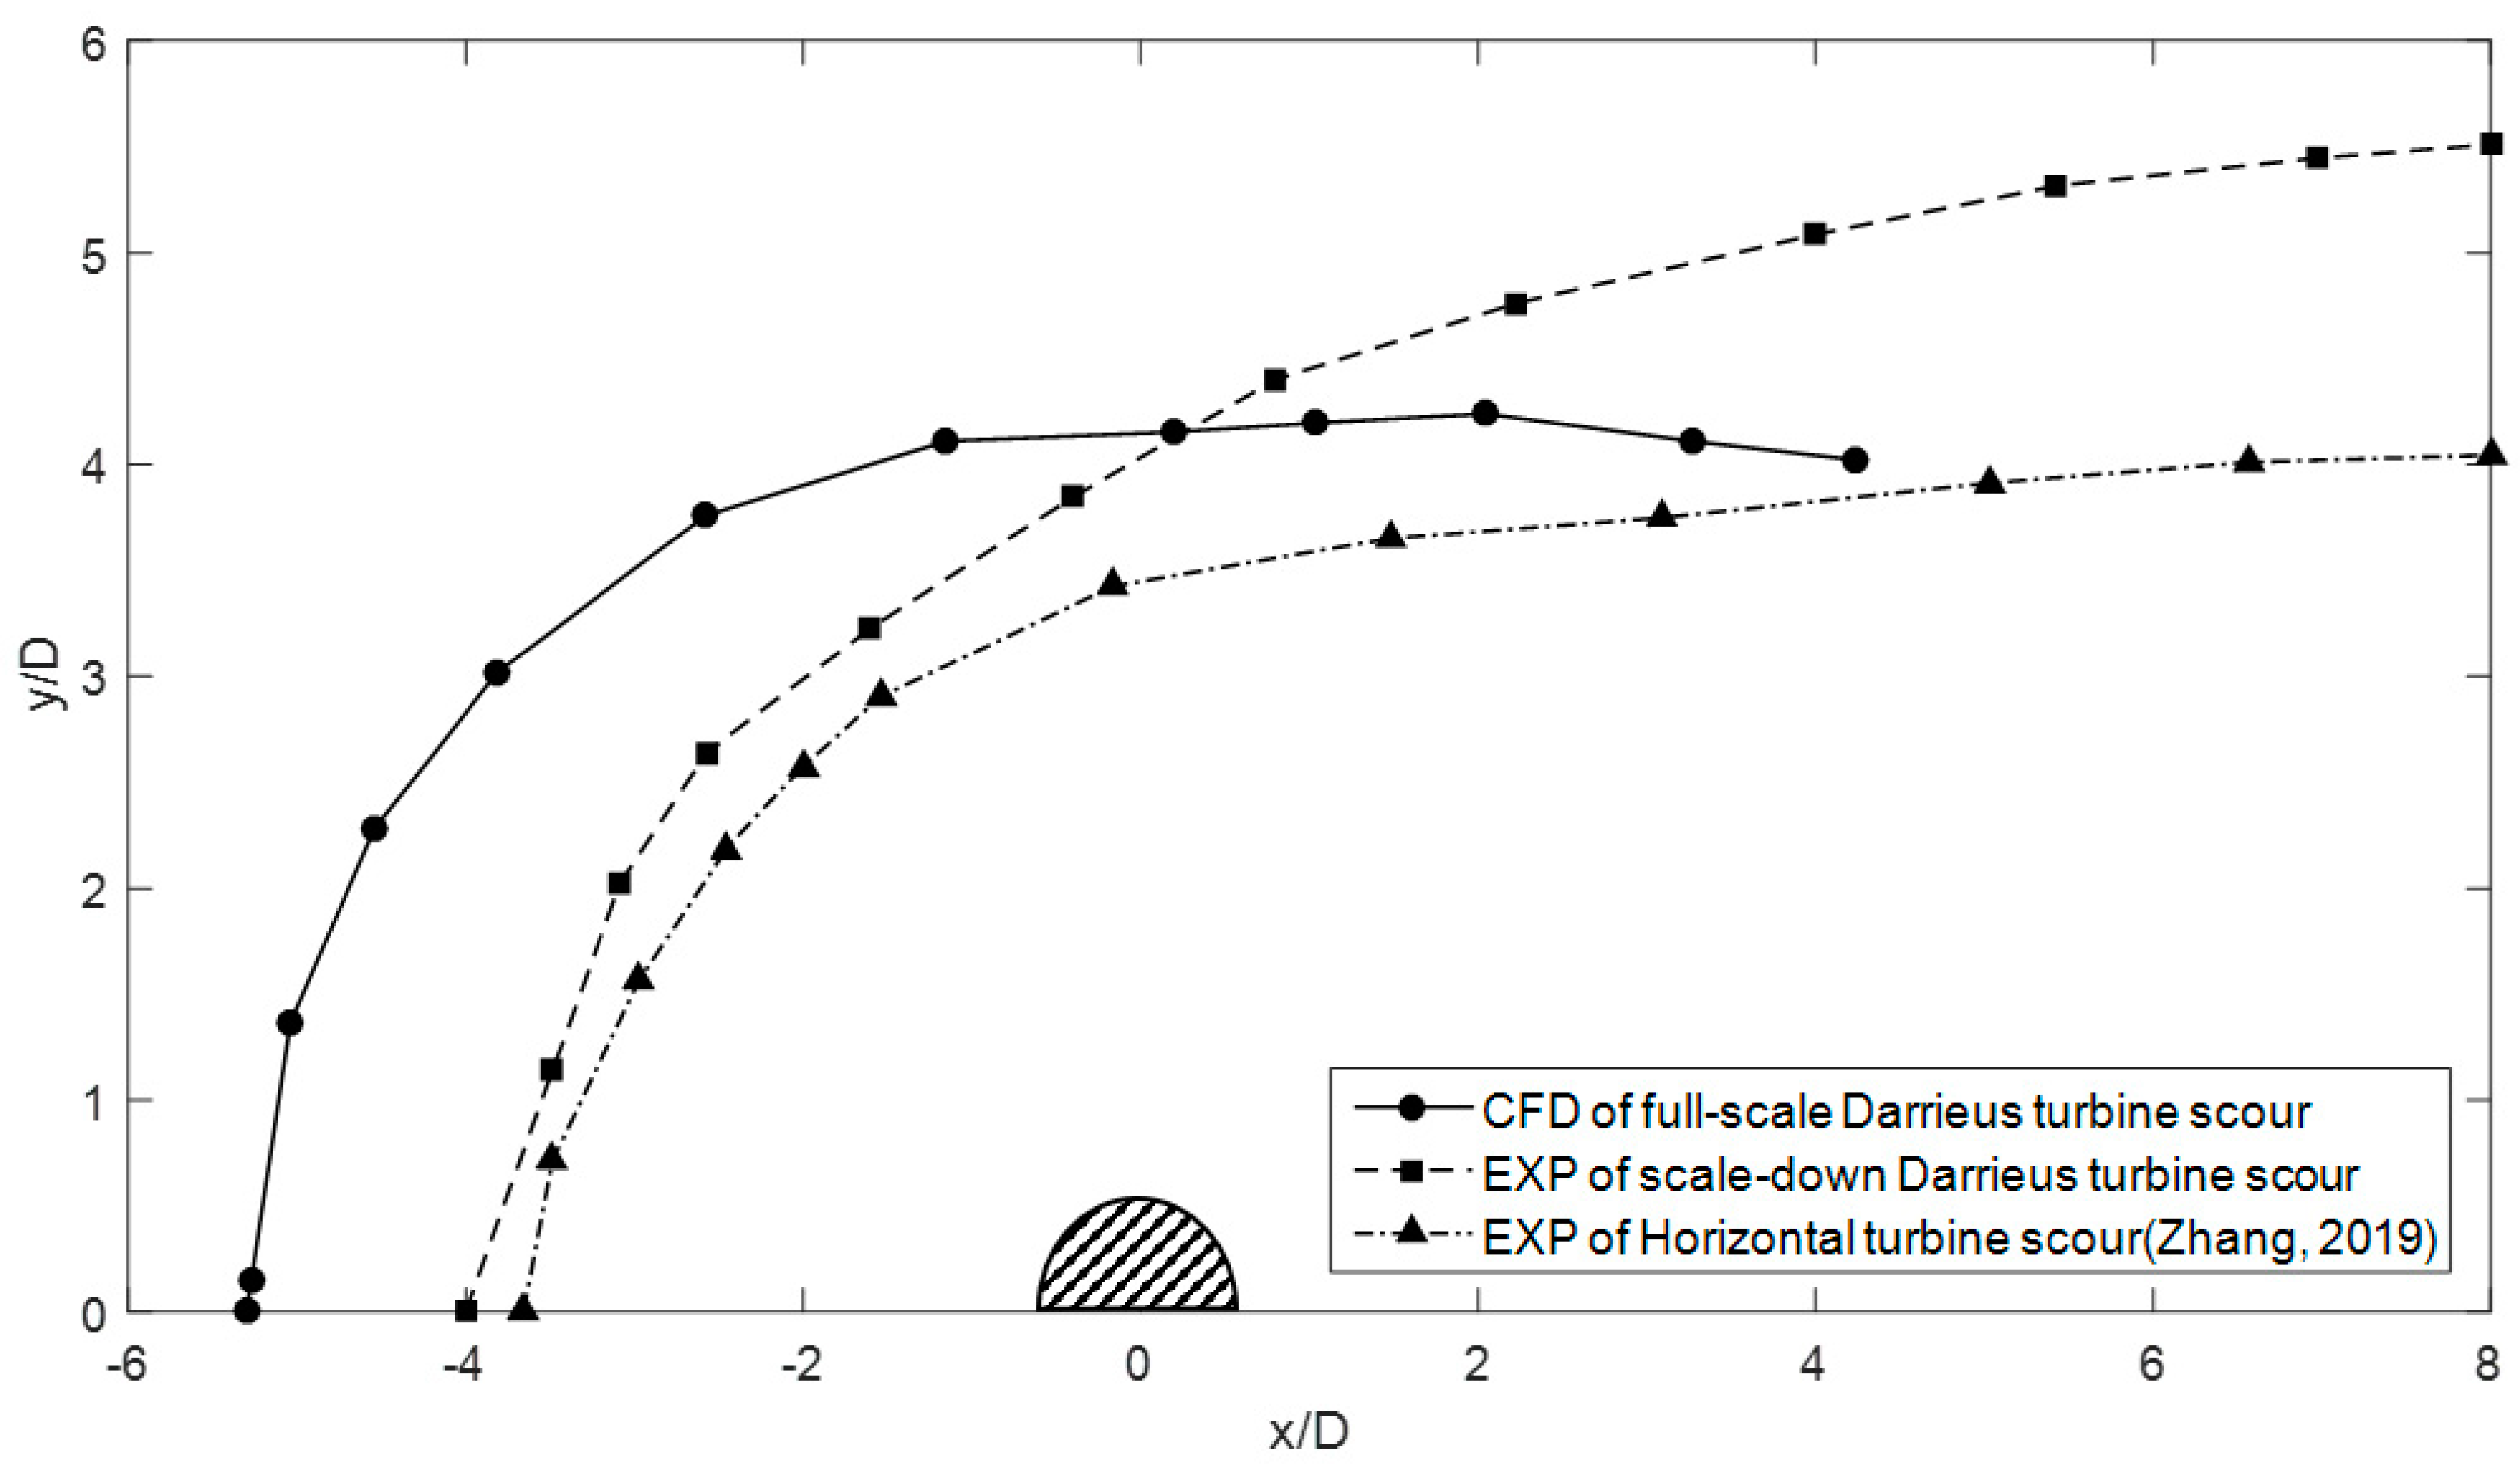
The horizontal extent of a scour hole is also important for the stability of marine structures. A comparison of scour hole edges between Darrieus-type turbines and horizontal-axis turbines is shown in Figure 18. It can be seen that the scour hole width of the full-scale turbine was about 4D. The scour hole length upstream was about 6D, and the scour hole length downstream was about 6D. As a comparison, the scour hole width of the scale-down experiment was 4D. The hole lengths upstream and downstream were 4D and 8D, respectively. As discussed in Section 3.3.2, the smaller scour hole length downstream was obtained due to the unsteady effects of the wake vortex being neglected in the numerical model. However, the simulated scour hole had a bigger size upstream, interestingly.
The turbine diameter was 27 m in the full-scale turbine model for this case. The influence of the rotor-swept area covered up to a 6D distance around the turbine foundation. Hence, the bigger scour hole around the full-scale turbine was greatly affected by flow suppression of the rotating rotor. Hahn et al. [36] once investigated clear-water scour due to short vertical (pressure flow) contraction in a laboratory channel. Their results showed that a scour hole was caused right below an obstacle. In our model, the operating rotor acted like an obstacle above the seabed. Hence, the turbine scour is a composition of local scour at the foundation pile and suppression scour below the rotor. This can explain why the horizontal extent of the scour hole of the simulated full-scale turbine model was more than in other tests.

4.3. Temporal Development of Scour Depth

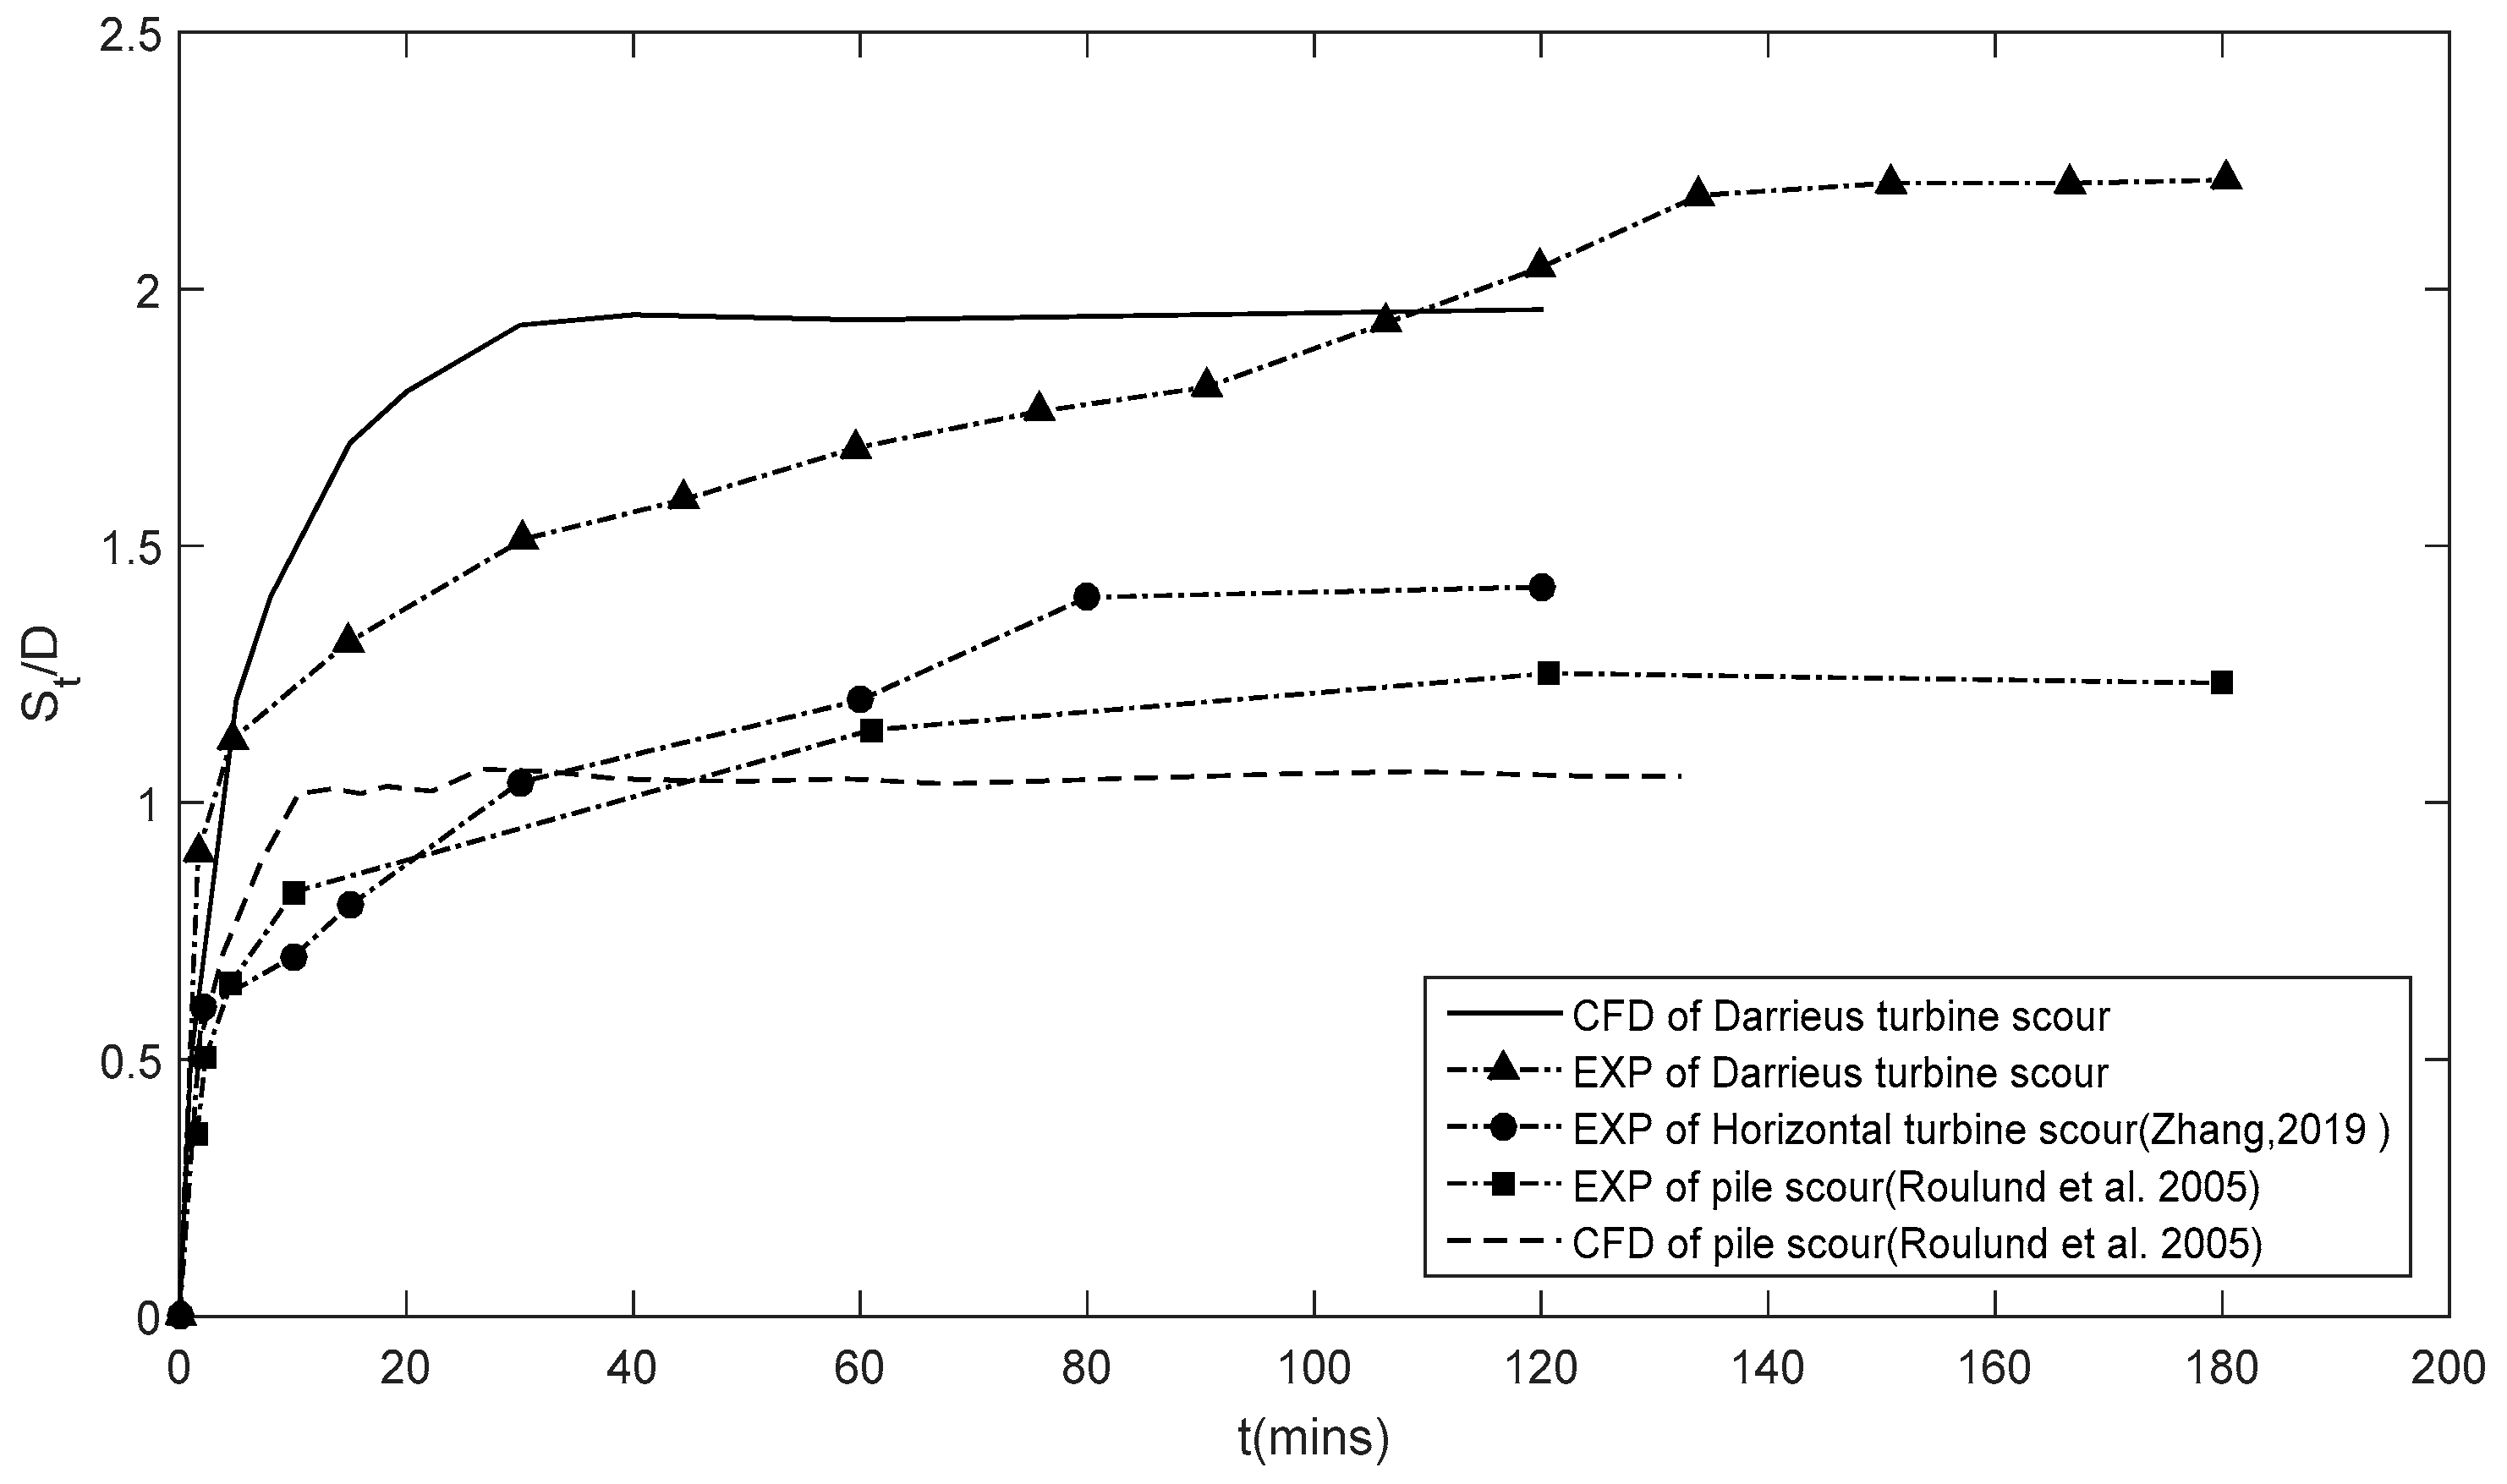
The temporal development of scour depth of the full-scale turbine is studied in this section. As shown in Figure 19, the scour process can be classified in three stages: (1) an initial stage, where the scour depth develops quickly in the first 5 mins due to the action of downflow and a horseshoe vortex; (2) a developing stage, where after the initial stage, the scour depth develops with gradually diminishing speed until equilibrium; and (3) an equilibrium stage, where the scour depth no longer increases evidently and remains at an almost constant depth. For the proposed full-scale turbine model, the seabed scour reached equilibrium after about 30 mins, and the final depth was 1.96D. However, the equilibrium scour time and final scour depth were less than in the turbine scour experiment. This is the deficiency of the CFD model and also appeared in Roulund’s CFD model [12] for scour at piers. The RANS turbulence model cannot capture the vortex at a high Reynolds number. It uses turbulence intensity to represent the flow’s instability. However, this unstable factor is not used for the calculation of seabed shear stress. Therefore, our morphologic model could not consider these unsteady factors. However, the vortex system can promote turbine scour in reality. The scour depth calculated by the CFD model reached equilibrium depth faster than in the experiment. The scour depth was also more shallow in the CFD results than in the experiment.

4.4. Turbine Scour Mechanism

The turbine scour mechanism is further explained in this section based on the aforementioned discussion. Generally, turbine scour starts with an increase of flow speed around the turbine supporting pile. Large bed shear stress on both sides of the pile is caused by fluid acceleration, and sediment is washed away. The removal of sediment results in shallow holes around the piles. The energy of the horseshoe vortex is enhanced, along with growth of the scour hole, which in turns expands the scour hole. As the scour hole deepens, a weaker horseshoe vortex and lower bed shear stress exist inside the scour hole. Finally, the flow energy is insufficient to reach critical shear stress to transport the sediment.
This phenomenon is much like scour at piles. However, the existence of a rotating turbine provides a more challenging and complicated mechanism, with blockage effects and disturbance. Blockage effects lead to flow suppression passing through the narrow region in between the tip and the seabed, and turbine disturbance is due to tip vortices. This can increase the horizontal and vertical extent of a scour hole. This phenomenon was discussed in Section 3 and Section 4. Our main findings of a turbine’s impact on seabed scour can be concluded as follows.
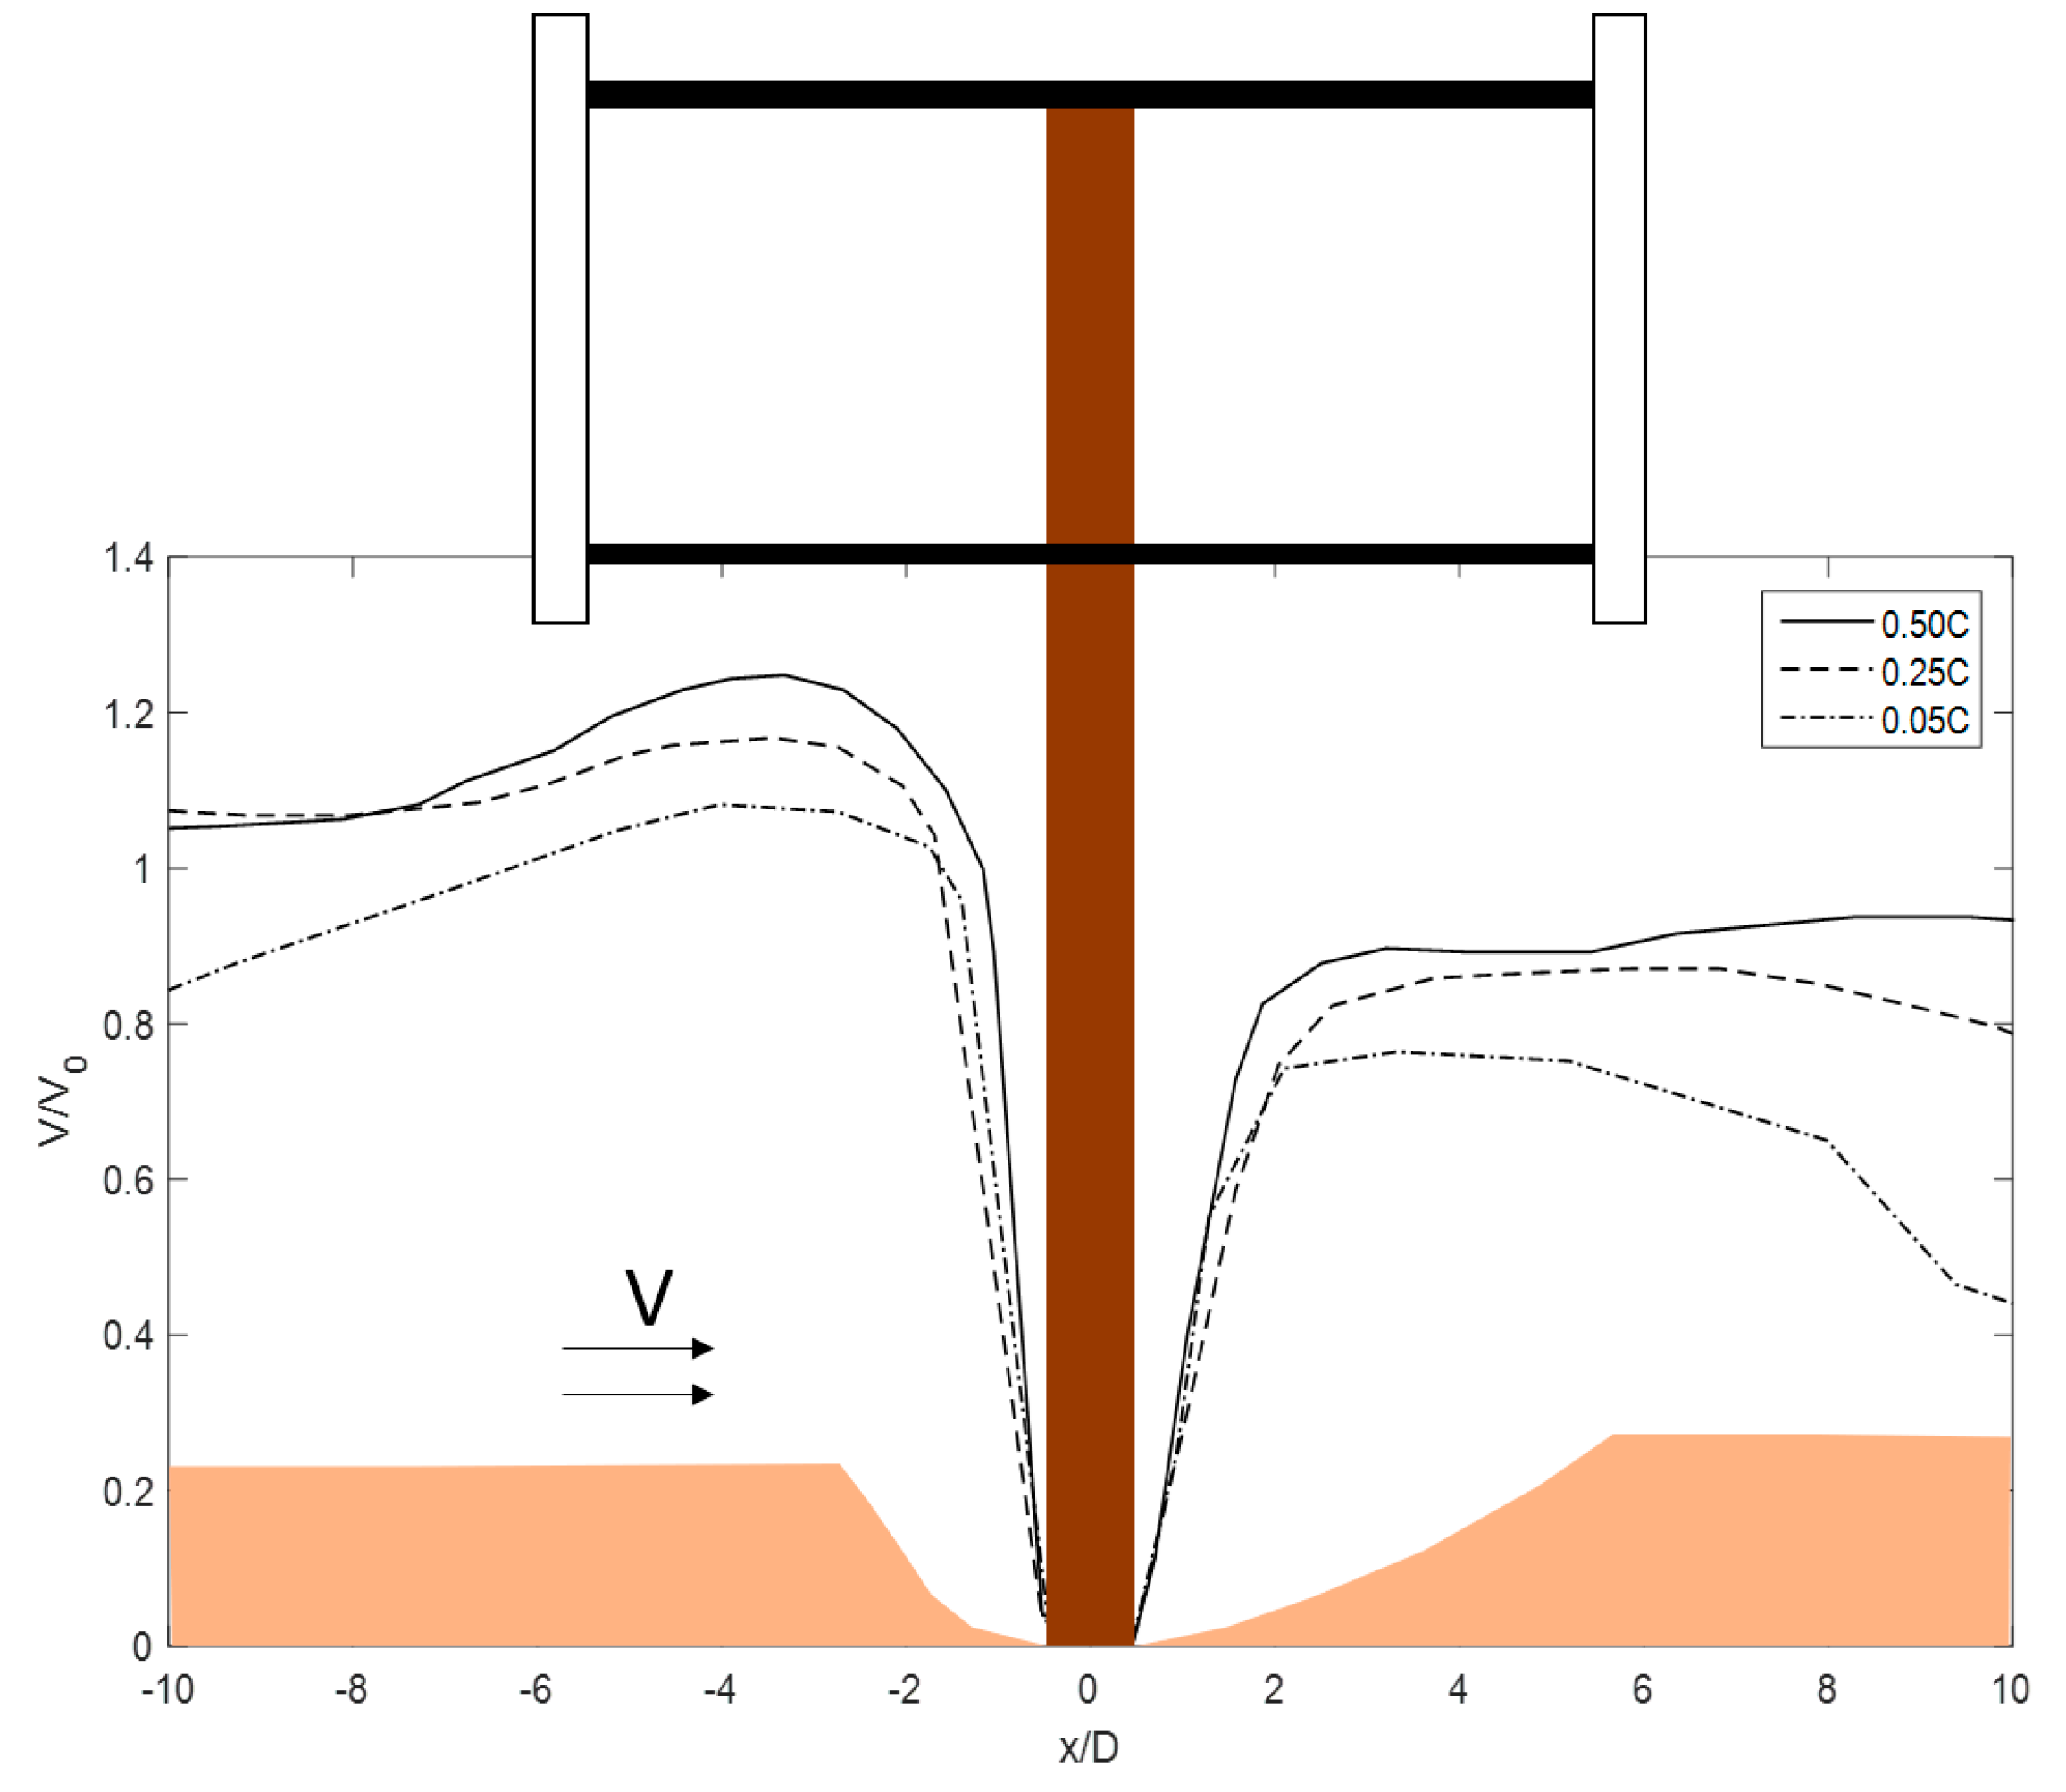
First, the rotor obstructs the incoming flow. The obstructed fluid moves to the upper and lower sides of the rotor and accelerates flow velocity around the rotor based on flow mass conservation. On the basis of a forerunner’s study, the maximum scour depth increases with the averaged incoming flow velocity in clear-water scour conditions [6]. To discuss the contract effect of a turbine’s rotor, the axial velocity of different layers between the turbine and the seabed of a full-scale turbine model is shown in Figure 20. The axial velocity shows about a 20% increment at location -4D along the x axis. The axial velocity near the seabed is less than the initial velocity due to the boundary layer effect. However, the fluid at each layer below the turbine has a higher axial velocity than at the same level before the turbine. Chen and Lam [11] once studied the axial velocity at slipstream between a horizontal-axis tidal current turbine and the seabed, and their results showed that axial velocity increased about 5% of initial flow, which is less than the Darrieus-type turbine in this project. This suggests that the impact of Darrieus-type turbines on scour hole development is greater than that of horizontal-axis turbines.
Second, the impact of a turbine rotor on scour depth is more intense with lower tip clearance. As seen in Figure 13 and Figure 14, the maximum scour depth was 1.45D, 1.48D, 1.92D, and 1.98D for C/H = 1.0, 0.75, 0.5, and 0.25, respectively (simulated by the CFD model). The acceleration ratio of flow velocity at slipstream between the turbine rotor and the seabed was about 10–20%. The faster flow rate approaching the seabed could be reached at a lower tip clearance. This is one of the main reasons why a scour hole is deeper at a lower tip clearance.
Third, the proposed turbine scour model underestimated the final scour depth at rates of about 15–20%, as discussed in Section 3. This is because downflow and the vortex systems are two main reasons for local scour around foundation piles. Our model could simulate the flow velocity change around a rotating turbine and at slipstream below the turbine, but transient vortex shedding cannot be simulated by RANS models. On the basis of the comparison between the CFD model and the experimental data, we found that about 80% of turbine scour depth was caused by the change in flow velocity, and unsteady effects such as the fluctuating components of a horseshoe vortex and lee-wake vortex flows occupied about 20% of the turbine scour’s impact factors.

5. Conclusions

A study of seabed scour around a Darrieus-type tidal current turbine with a commercial CFD code for a hydrodynamic model and a user-defined function for a morphologic model was carried out. The obtained simulation results were in good agreement with experiments. After validation, the seabed scour of full-scale tidal current turbines was simulated using the proposed CFD model. The equilibrium scour depth, scour profiles, and temporal development of scour depth were investigated. The conclusions are the following:
(1) The maximum scour depth of the proposed full-scale turbine was 1.96D, and the edge of the scour hole was 4D along the y axis, -6D upstream, and 6D downstream (results of the numerical simulation). Compared to scale-down experiments, the CFD result of scour depth was about 15% smaller and the scour hole length downstream was shorter due to the neglect of unsteady factors, such as the horseshoe vortex and lee-wake vortices;
(2) The scour hole upstream was much wider than in the experiment. For full-scale turbines, scour is a composition of local scour at the foundation pile and suppressed flow-induced scour below the rotor caused by the contraction effect of the rotor. This situation causes a greater horizontal and vertical extent of the scour hole;
(3) The temporal development of scour depth showed that a quick scour occurred at the initial stage, and equilibrium conditions were reached after about 30 mins of simulation. This time was a little shorter than in the experiment. In addition, the scour hole was 27% deeper than the horizontal axis turbine scour depth of 1.42D and 34% deeper than in the experimental data of scour depth around piles of 1.3D after equilibrium.
This project first proposed a numerical model to simulate full-scale Darrieus-type tidal current turbines. It was proven that the proposed simulation method is a good and reliable tool to predict and discuss the spatial development of the scour process induced by tidal current turbines. It must be noted that the CFD model produces relatively conservative results of scour depth. The correction of existing empirical models of scour depth around Darrieus-type tidal current turbines by using the proposed numerical model and a flow analysis will be the next emphasis in future work.

Author Contributions

W.H.L.’s long-term research series is on ship propeller jet wake-induced scour and tidal turbine wake scour; C.S. and W.H.L. contributed to proposing the numerical simulation to investigate the scour by full-scale tidal turbines; and C.S. wrote the manuscript with revisions, recommendations, and validations from W.H.L., M.D., and G.H.

Funding

This research was funded by the Natural Science Foundation of Tianjin City (18JCYBJC21900) and the Science Fund for Creative Research Groups of the National Natural Science Foundation of China (Grant No. 51621092). The APC was funded by the Natural Science Foundation of Tianjin City (18JCYBJC21900).

Acknowledgments

The authors wish to extend their gratitude to the School of Civil Engineering at Tianjin University for laboratory space; to Queen’s University Belfast, the University of Plymouth, the University of Oxford, the Dalian University of Technology, the University of Malaya (HIR ENG47), Universiti Teknologi Malaysia, and Southern University College for their past support; and to the professional bodies EI, IEI, IET, BCS, IEM, IEAust, ASCE, ECUK, SCUK, BEM, FEANI, AFEO, MINDS, and academy AAET for membership support and available resources.

Conflicts of Interest

The authors declare no conflicts of interest.

References

  1. Sumer, M.B. Mathematical modelling of scour: A review. J. Hydraul. Res. 2007, 45, 723–735. [Google Scholar] [CrossRef]
  2. Melikoglu, M. Current status and future of ocean energy sources: A global review. Ocean Eng. 2018, 148, 563–573. [Google Scholar] [CrossRef]
  3. Musa, M.; Hill, C.; Sotiropoulos, F.; Guala, M. Performance and resilience of hydrokinetic turbine arrays under large migrating fluvial bedforms. Nat. Energy 2018, 3, 839–846. [Google Scholar] [CrossRef]
  4. Chen, L.; Lam, W.H. Methods for predicting seabed scour around marine current turbine. Renew. Sustain. Energy Rev. 2014, 29, 683–692. [Google Scholar] [CrossRef]
  5. Sun, C.; Lam, W.H.; Cui, Y.; Zhang, T.; Jiang, J.; Guo, J.; Ma, Y.; Wang, S.; Tan, T.H.; Chuah, J.H.; et al. Empirical model for Darrieus-type tidal current turbine induced seabed scour. Energy Convers. Manag. 2018, 171, 478–490. [Google Scholar] [CrossRef] [Green Version]
  6. Breusers, H.N.C.; Nicollet, G.; Shen, H.W. Local Scour Around Cylindrical Piers. J. Hydraul. Res. 1977, 15, 211–252. [Google Scholar] [CrossRef]
  7. Wang, D.; Atlar, M.; Sampson, R. An experimental investigation on cavitation, noise, and slipstream characteristics of ocean stream turbines. Proc. Inst. Mech. Eng. Part A J. Power Energy 2007, 221, 219–231. [Google Scholar] [CrossRef]
  8. Hill, C.; Musa, M.; Chamorro, L.P.; Ellis, C. Local Scour around a Model Hydrokinetic Turbine in an Erodible Channel. J. Hydraul. Eng. 2014, 140, 04014037. [Google Scholar] [CrossRef]
  9. Zhang, T.; Lam, W.H.; Cui, Y.; Jang, J.; Sun, C.; Guo, J.; Ma, Y.; Wang, S.; Lam, S.S. Tip-Bed Velocity and Scour Depth of Horizontal-Axis Tidal Turbine with Consideration of Tip Clearance. Energies 2019, 12, 2450. [Google Scholar] [CrossRef]
  10. Sun, C.; Lam, W.H.; Lam, S.S.; Dai, L.M.; Hamill, G. Temporal Evolution of Seabed Scour Induced by Darrieus-Type Tidal Current Turbine. Water 2019, 11, 896. [Google Scholar] [CrossRef]
  11. Chen, L.; Lam, W.H. Slipstream between marine current turbine and seabed. Energy 2014, 68, 801–810. [Google Scholar] [CrossRef]
  12. Roulund, A.; Sumer, B.M.; Fredsoe, J.; Michelsen, J. Numerical and experimental investigation of flow and scour around a circular pile. J. Fluid Mech. 2005, 534, 351–401. [Google Scholar] [CrossRef]
  13. Ettema, R.; Melville, B.W.; Barkdoll, B. Scale Effect in Pier-Scour Experiments. J. Hydraul. Eng. 1998, 124, 639–642. [Google Scholar] [CrossRef]
  14. Huang, W.; Yang, Q.; Xiao, H. CFD modeling of scale effects on turbulence flow and scour around bridge piers. Comput. Fluids 2009, 38, 1050–1058. [Google Scholar] [CrossRef]
  15. Dai, Y.M.; Lam, W. Numerical study of straight-bladed Darrieus-type tidal turbine. Proc. Inst. Civ. Eng. Energy 2009, 162, 67–76. [Google Scholar] [CrossRef]
  16. Jeffcoate, P.; Starzmann, R.; Elsaesser, B.; Scholl, S.; Bischoff, S. Field measurements of a full scale tidal turbine. Int. J. Mar. Energy 2015, 12, 3–20. [Google Scholar] [CrossRef] [Green Version]
  17. Neill, S.P.; Litt, E.J.; Couch, S.J.; Davies, A.G. The impact of tidal stream turbines on large-scale sediment dynamics. Renew. Energy 2009, 34, 2803–2812. [Google Scholar] [CrossRef]
  18. Burkow, M.; Griebel, M. A full three dimensional numerical simulation of the sediment transport and the scouring at a rectangular obstacle. Comput. Fluids 2016, 125, 1–10. [Google Scholar] [CrossRef]
  19. Zhang, J.S.; Gao, P.; Zheng, J.H.; Wu, X.G.; Peng, Y.X.; Zhang, T.T. Current-Induced seabed scour around a pile-supported horizontal-axis tidal stream turbine. J. Mar. Sci. Technol. 2015, 23, 929–936. [Google Scholar]
  20. Patankar, S.V. Numerical heat transfer and fluid flow. In Series in Computational Methods in Mechanics and Thermal Sciences; Taylor & Francis: Didcot, UK, 1980. [Google Scholar]
  21. Fluent User Manual. In Fluent User’s Guide; Fluent Inc.: Lebanon, PA, USA, 2003.
  22. Wilcox, D.C. Turbulence Modelling for, C.F.D., 2nd ed.; DCW Industries: La Canada, CA, USA, 1993. [Google Scholar]
  23. Baykal, C.; Sumer, B.M.; Fuhrman, D.R.; Jacobsen, N.G.; Fredsøe, J. Numerical investigation of flow and scour around a vertical circular cylinder. Philos. Trans. R. Soc. A Math. Phys. Eng. Sci. 2014, 373, 20140104. [Google Scholar] [CrossRef]
  24. Menter, F.R. Two-equation eddy-viscosity turbulence models for engineering applications. AIAA J. 1994, 32, 1598–1605. [Google Scholar] [CrossRef] [Green Version]
  25. Chien, N.; Wan, Z. Mechanics of Sediment Transport; Science Press: Beijing, China, 1983; ISBN 978-0-7844-0400-3. [Google Scholar]
  26. Lagasse, P.F.; Zevenbergen, L.W.; Spitz, W.J.; Arneson, L.A. Stream Stability at Highway Structures, 4th ed.; National Technical Information Service: Springfield, VA, USA, 2012. [Google Scholar]
  27. Nagata, N.; Hosoda, T.; Nakato, T.; Muramoto, Y. Three-dimensional numerical model for flow and bed deformation around river hydraulic structures. J. Hydraul. Eng. 2005, 131, 1074–1087. [Google Scholar] [CrossRef]
  28. Brørs, B. Numerical modeling of flow and scour at pipelines. J. Hydraul. Eng. 1999, 125, 511–523. [Google Scholar] [CrossRef]
  29. Xiong, W.; Cai, C.S.; Kong, B.; Kong, X. CFD simulations and analyses for bridge-scour development using a dynamic-mesh updating technique. J. Comput. Civ. Eng. 2014, 30, 04014121. [Google Scholar] [CrossRef]
  30. Liang, D.; Cheng, L.; Li, F. Numerical modeling of flow and scour below a pipeline in currents: Part, I.I. Scour simulation. Coast. Eng. 2005, 52, 43–62. [Google Scholar] [CrossRef]
  31. Ballio, F.; Radice, A.; Dey, S. Temporal scales for live-bed scour at abutments. J. Hydraul. Eng. 2009, 136, 395–402. [Google Scholar] [CrossRef]
  32. Rajaratnam, N. Erosion by plane turbulent jets. J. Hydraul. Res. 1981, 19, 339–358. [Google Scholar] [CrossRef]
  33. Melville, B.W. Local Scour at Bridge Sites. Ph.D. Thesis, School of Engineering, University of Auckland, Auckland, New Zealand, 1975. [Google Scholar]
  34. Bianchini, A.; Balduzzi, F.; Ferrara, G.; Ferrari, L.; Persico, G.; Dossena, V.; Battisti, L. Detailed Analysis of the Wake Structure of a Straight-Blade H-Darrieus Wind Turbine by Means of Wind Tunnel Experiments and Computational Fluid Dynamics Simulations. J. Eng. Gas Turbines Power 2018, 140, 032604. [Google Scholar] [CrossRef]
  35. Kolekar, N.; Banerjee, A. Performance characterization and placement of a marine hydrokinetic turbine in a tidal channel under boundary proximity and blockage effects. Appl. Energy 2015, 148, 121–133. [Google Scholar] [CrossRef]
  36. Hahn, E.M.; Lyn, D.A. Anomalous contraction scour? Vertical-contraction case. J. Hydraul. Eng. 2010, 136, 137–141. [Google Scholar] [CrossRef]
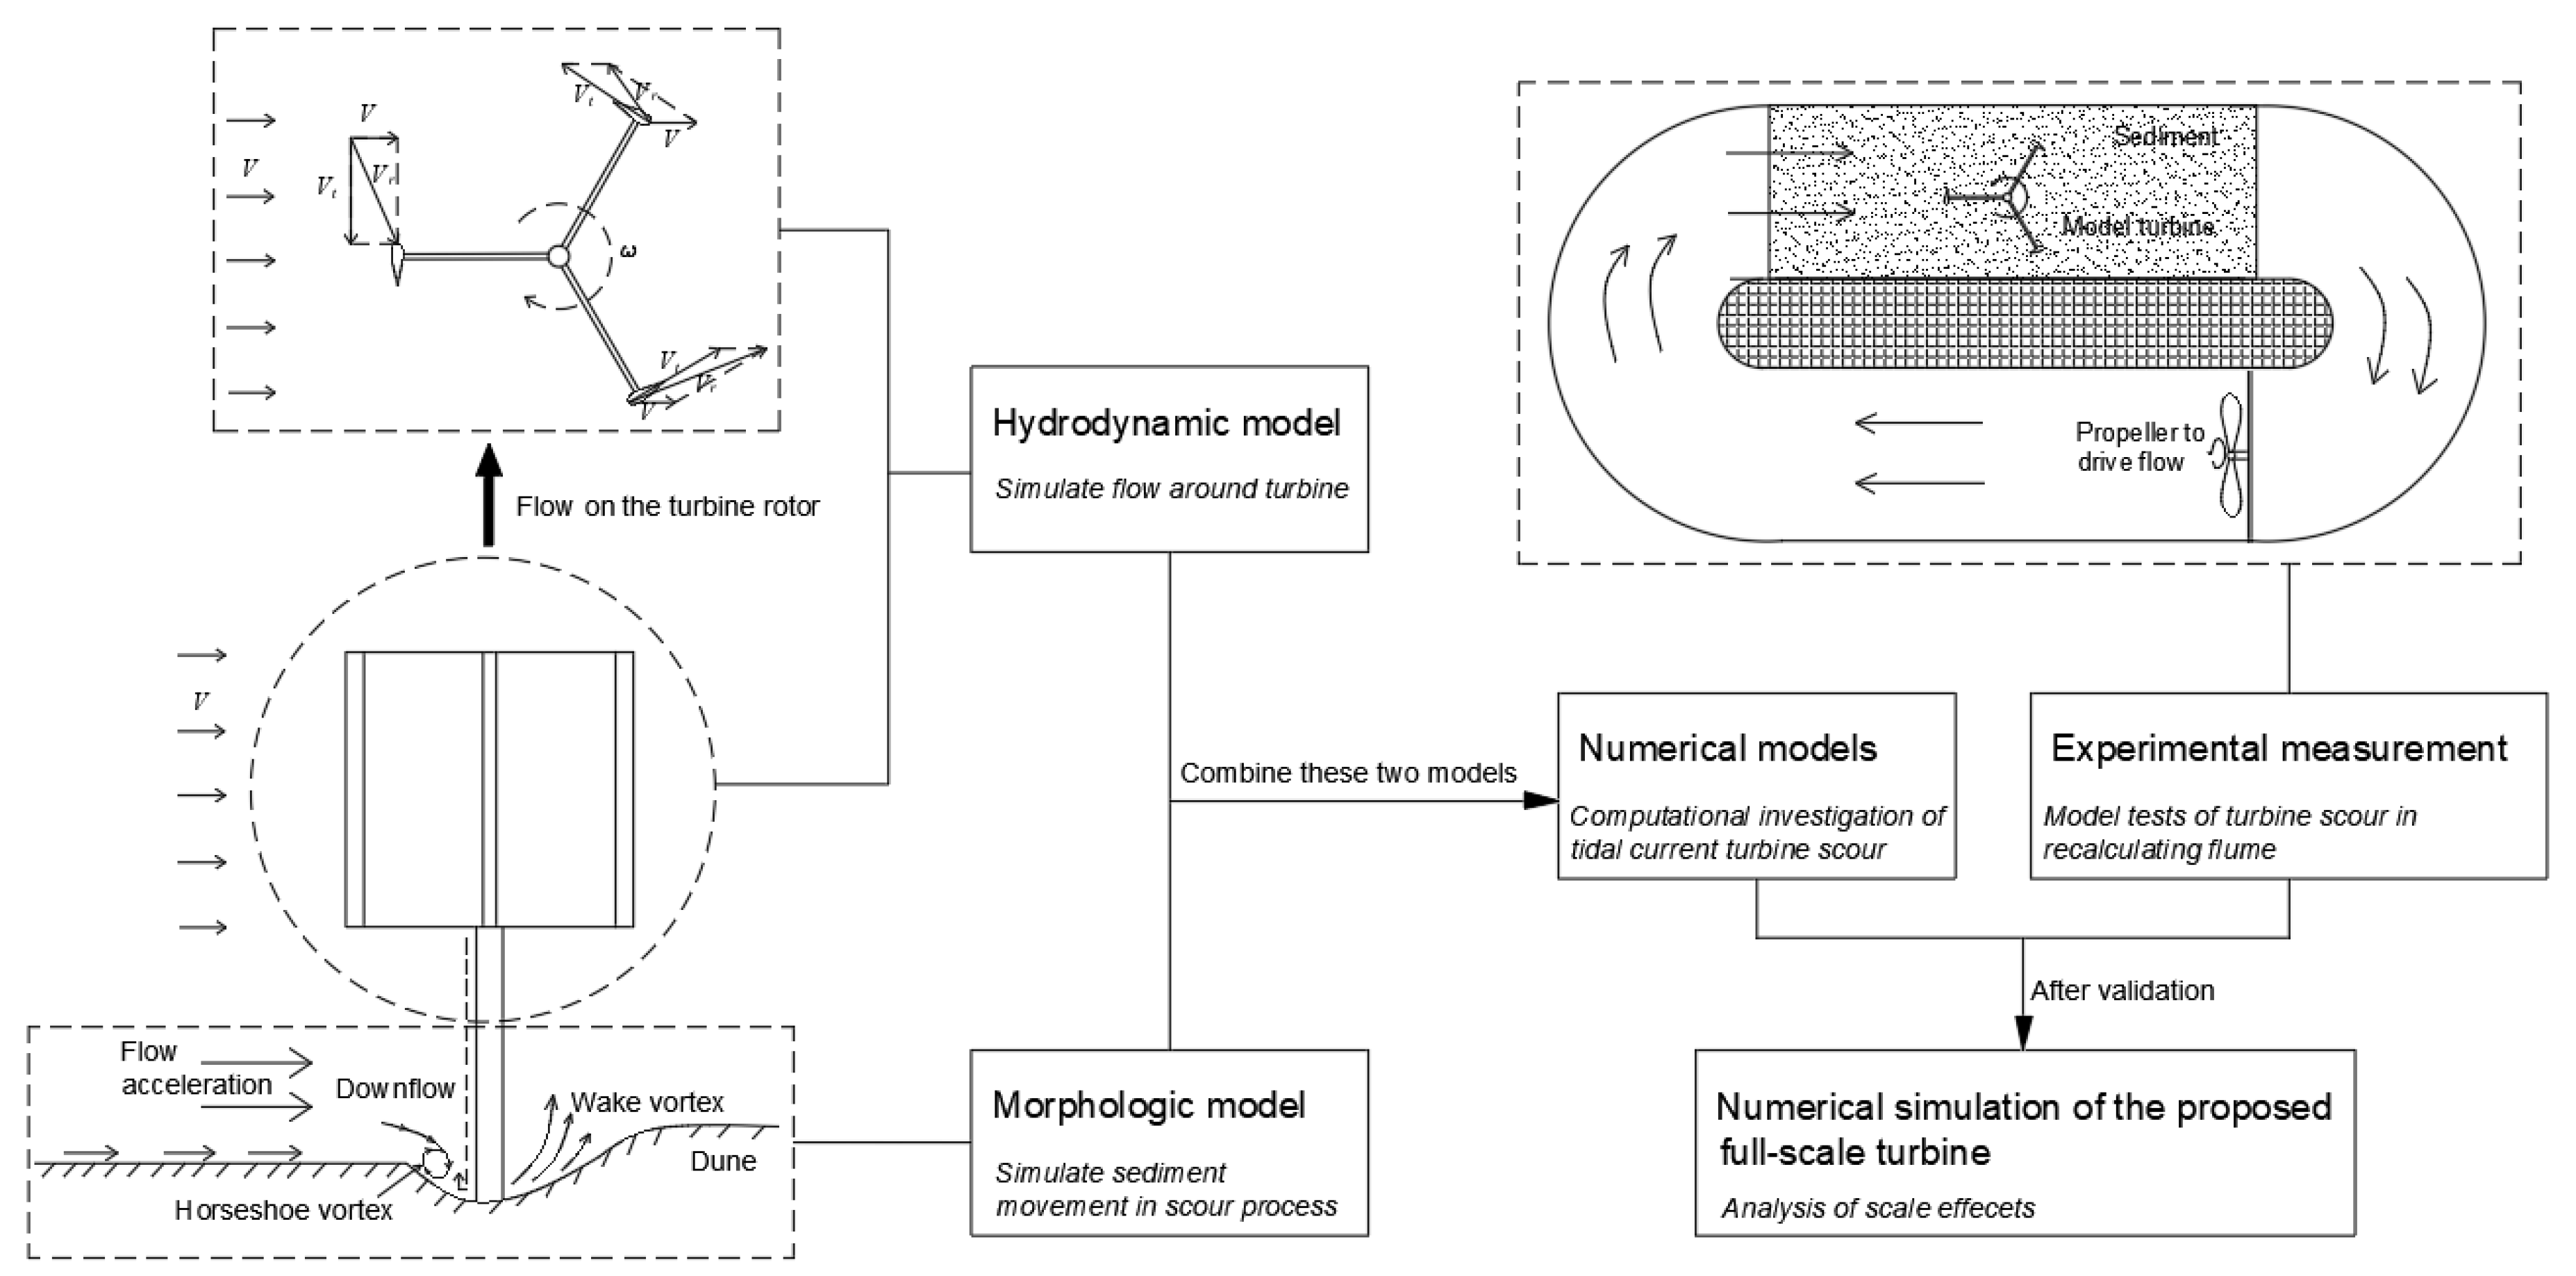
Figure 1. The research frame of this project.
Jmse 07 00342 g001
Figure 2. Boundaries of computational fluid dynamic (CFD) model.
Jmse 07 00342 g002
Figure 3. Computational domain of 3D turbine model.
Jmse 07 00342 g003
Figure 4. Computational grids around turbine rotor: (a) structured mesh grids at section surface z = 1.0H; (b) refined mesh close to rotor wall.
Jmse 07 00342 g004
Figure 5. Slope model.
Jmse 07 00342 g005
Figure 6. Illustration sketch of sand slide model.
Jmse 07 00342 g006
Figure 7. Experimental setup of turbine scour tests: (a) overall setup of experimental installation [9]; (b) design diagrams of experiment.
Jmse 07 00342 g007
Figure 8. A comparison of dimensionless efflux velocity in the wake of Darrieus-type tidal current turbines and wind turbines.
Jmse 07 00342 g008
Figure 9. The topographic contour of the local scour shapes after scour equilibrium of model T1 and Mellive’s experimental result: (a) the seabed profiles after scour equilibrium simulated by the proposed scour model; (b) contour map of the equilibrium scour hole simulated by a numerical model (left), and contour map of equilibrium scour hole in the experiment (right).
Jmse 07 00342 g009
Figure 10. The topographic contours of the local scour shapes after scour equilibrium of model T2: (a) the seabed profiles after scour equilibrium simulated by the proposed scour model; (b) contour map of scour hole simulated by numerical model T1 (left), and contour map of scour hole simulated by numerical model T2 (right).
Jmse 07 00342 g010
Figure 11. Equilibrium scour profiles with foundation piles for different tip clearances: (a) C/H = 1.0; (b) C/H = 0.75; (c) C/H = 0.5; and (d) C/H = 0.25. The maximum scour depth was 1.45 m, 1.48 m, 1.92 m, and 1.98 m for C/H = 1.0, 0.75, 0.5, and 0.25, respectively. The pile diameter was 1.0 m. The flow moves from left to right.
Jmse 07 00342 g011
Figure 12. A comparison of equilibrium scour depth between the experiment and numerical simulations at different tip clearances.
Jmse 07 00342 g012
Figure 13. A comparison of flow velocity at line (x = −2D, y = 0) against vertical height from C/H = 0.25–1.0.
Jmse 07 00342 g013
Figure 14. A comparison of equilibrium scour depth between the experiment and numerical simulations at different tip clearances.
Jmse 07 00342 g014
Figure 15. A comparison of simulated scour depth and corresponding experimental data.
Jmse 07 00342 g015
Figure 16. Equilibrium scour profiles around full-scale turbine: the maximum scour depth is 1.96D.
Jmse 07 00342 g016
Figure 17. Scour-hole profiles along the upstream–downstream symmetry line.
Jmse 07 00342 g017
Figure 18. Half-plan view of scour hole edge around tidal current turbine’s foundation pile.
Jmse 07 00342 g018
Figure 19. Temporal development of scour depth.
Jmse 07 00342 g019
Figure 20. Dimensionless axial component velocity at different layers of a full-scale turbine.
Jmse 07 00342 g020
Table 1. Grid independence tests by comparing different mesh numbers with Cp values.
VariablesCase 1Case 2Case 3 (Selected)Case 4
Mesh grid numbers1,285,5671,679,6542,046,6782,442,236
Cp16.4%18.8%19.7%19.9%
Additional cells-394,087367,024395,558
Validation-14.6%4.8%1.0%
Table 2. Experimental parameters.
ParametersValues
Rotor radius R (mm)56.3
Rotor height H (mm)87.5
Chord length c (mm)20.4,
Dimensionless tip clearance C/H0.25, 0.5, 0.75, 1
Monopile diameter D (mm)10
Rotational   speed   ω (rpm)110
Depth of water h (m)0.3
Width of flume b (m)0.35
Sediment   diameter   d 50 (mm)1.1
Mean   current   velocity   V (m/s)0.23
Table 3. Setup of numerical scour models.
NumberScale-Up Ratio Based on Physical ModelsTip Clearance, (C/H)Sediment Diameter (mm)Inlet Velocity (m/s)Rotational Speed (rpm)
T15.08-0.3850.25-
T25.080.50.3850.2515
T31000.258.02.311
T41000.58.02.311
T51000.758.02.311
T61001.08.02.311
Table 4. Error analysis of CFD turbine scour model. MAE: mean absolute error; RMSE: root mean squared error; SI: scatter index.
Statistical Functions R 2 MAERMSESI
Value0.980.110.120.05
Table 5. Numerical setup of full-scale turbine model.
ParametersValues
Rotor radius R(m)13.5
Rotor height H (m)21
Chord length c (m)4.9
Dimensionless tip clearance C/H0.5
Monopile diameter D (m)2.4
Rotational   speed   ω (rpm)14
Sediment   diameter   d 50 (mm)8
Mean   current   velocity   V (m/s)3.0