Coastal Defence Integrating Wave-Energy-Based Desalination: A Case Study in Madagascar


Abstract
1. Introduction
2. Materials and Methods
2.1. Objectives and Approach
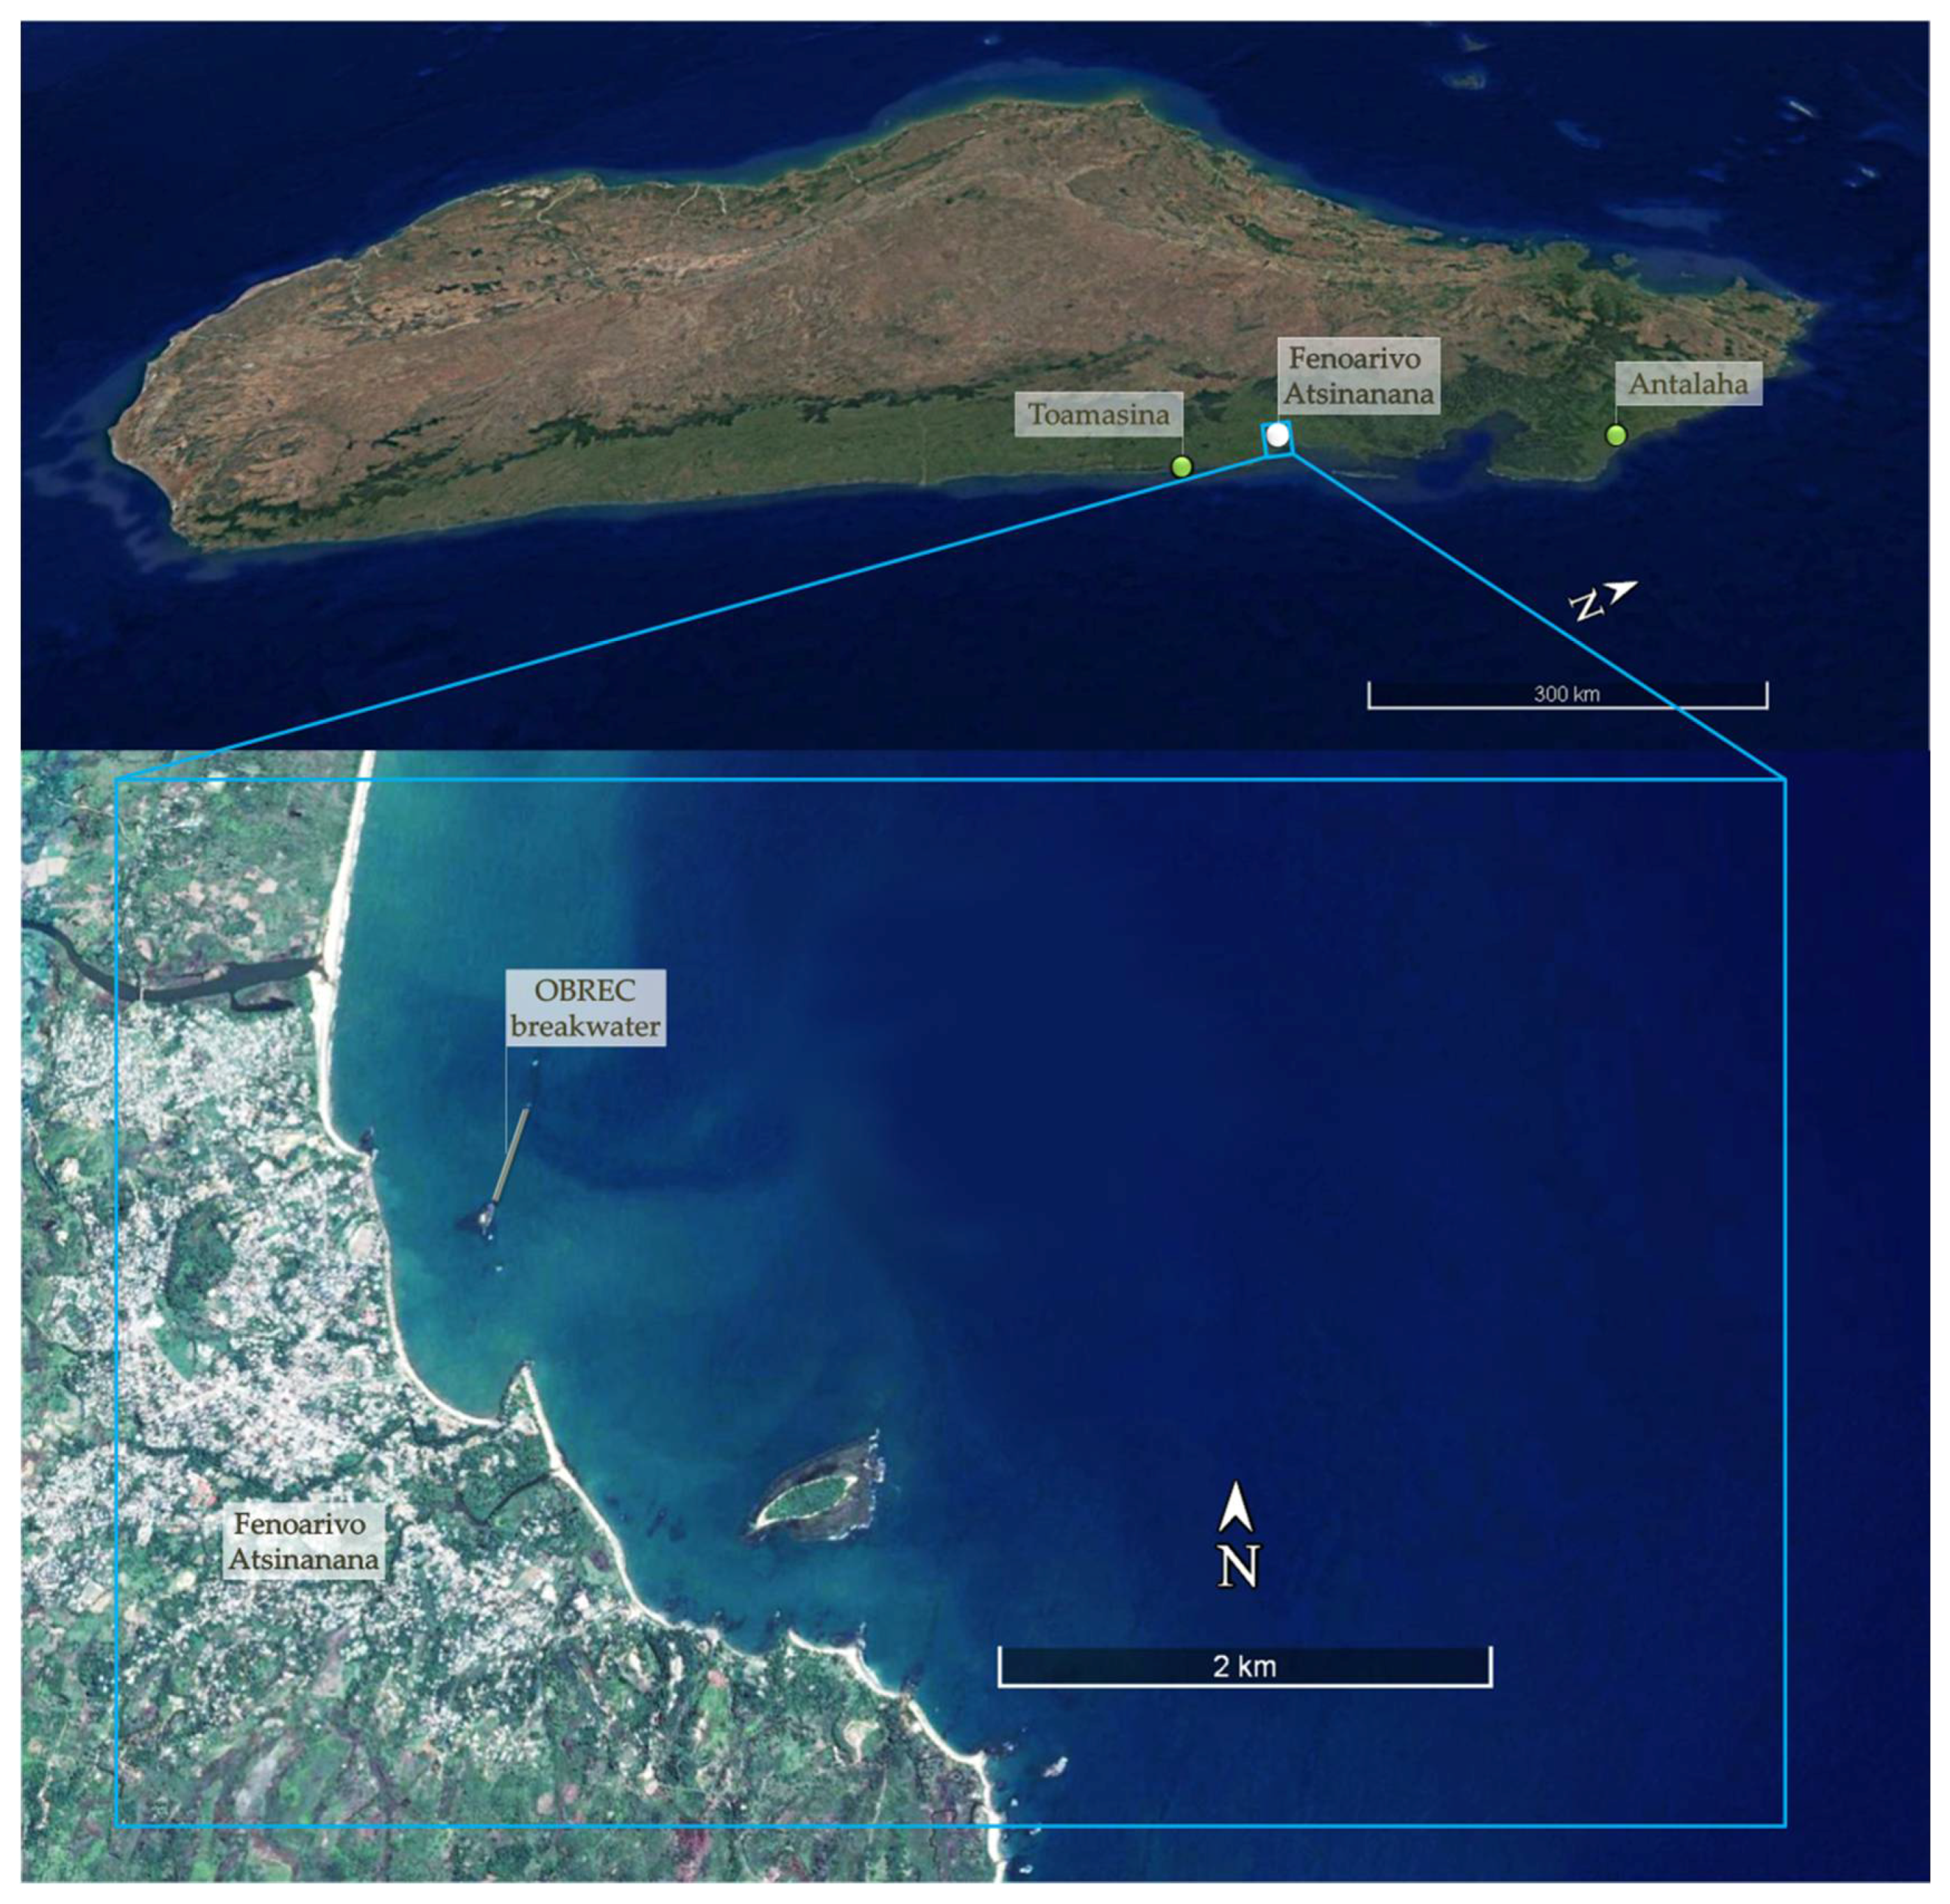
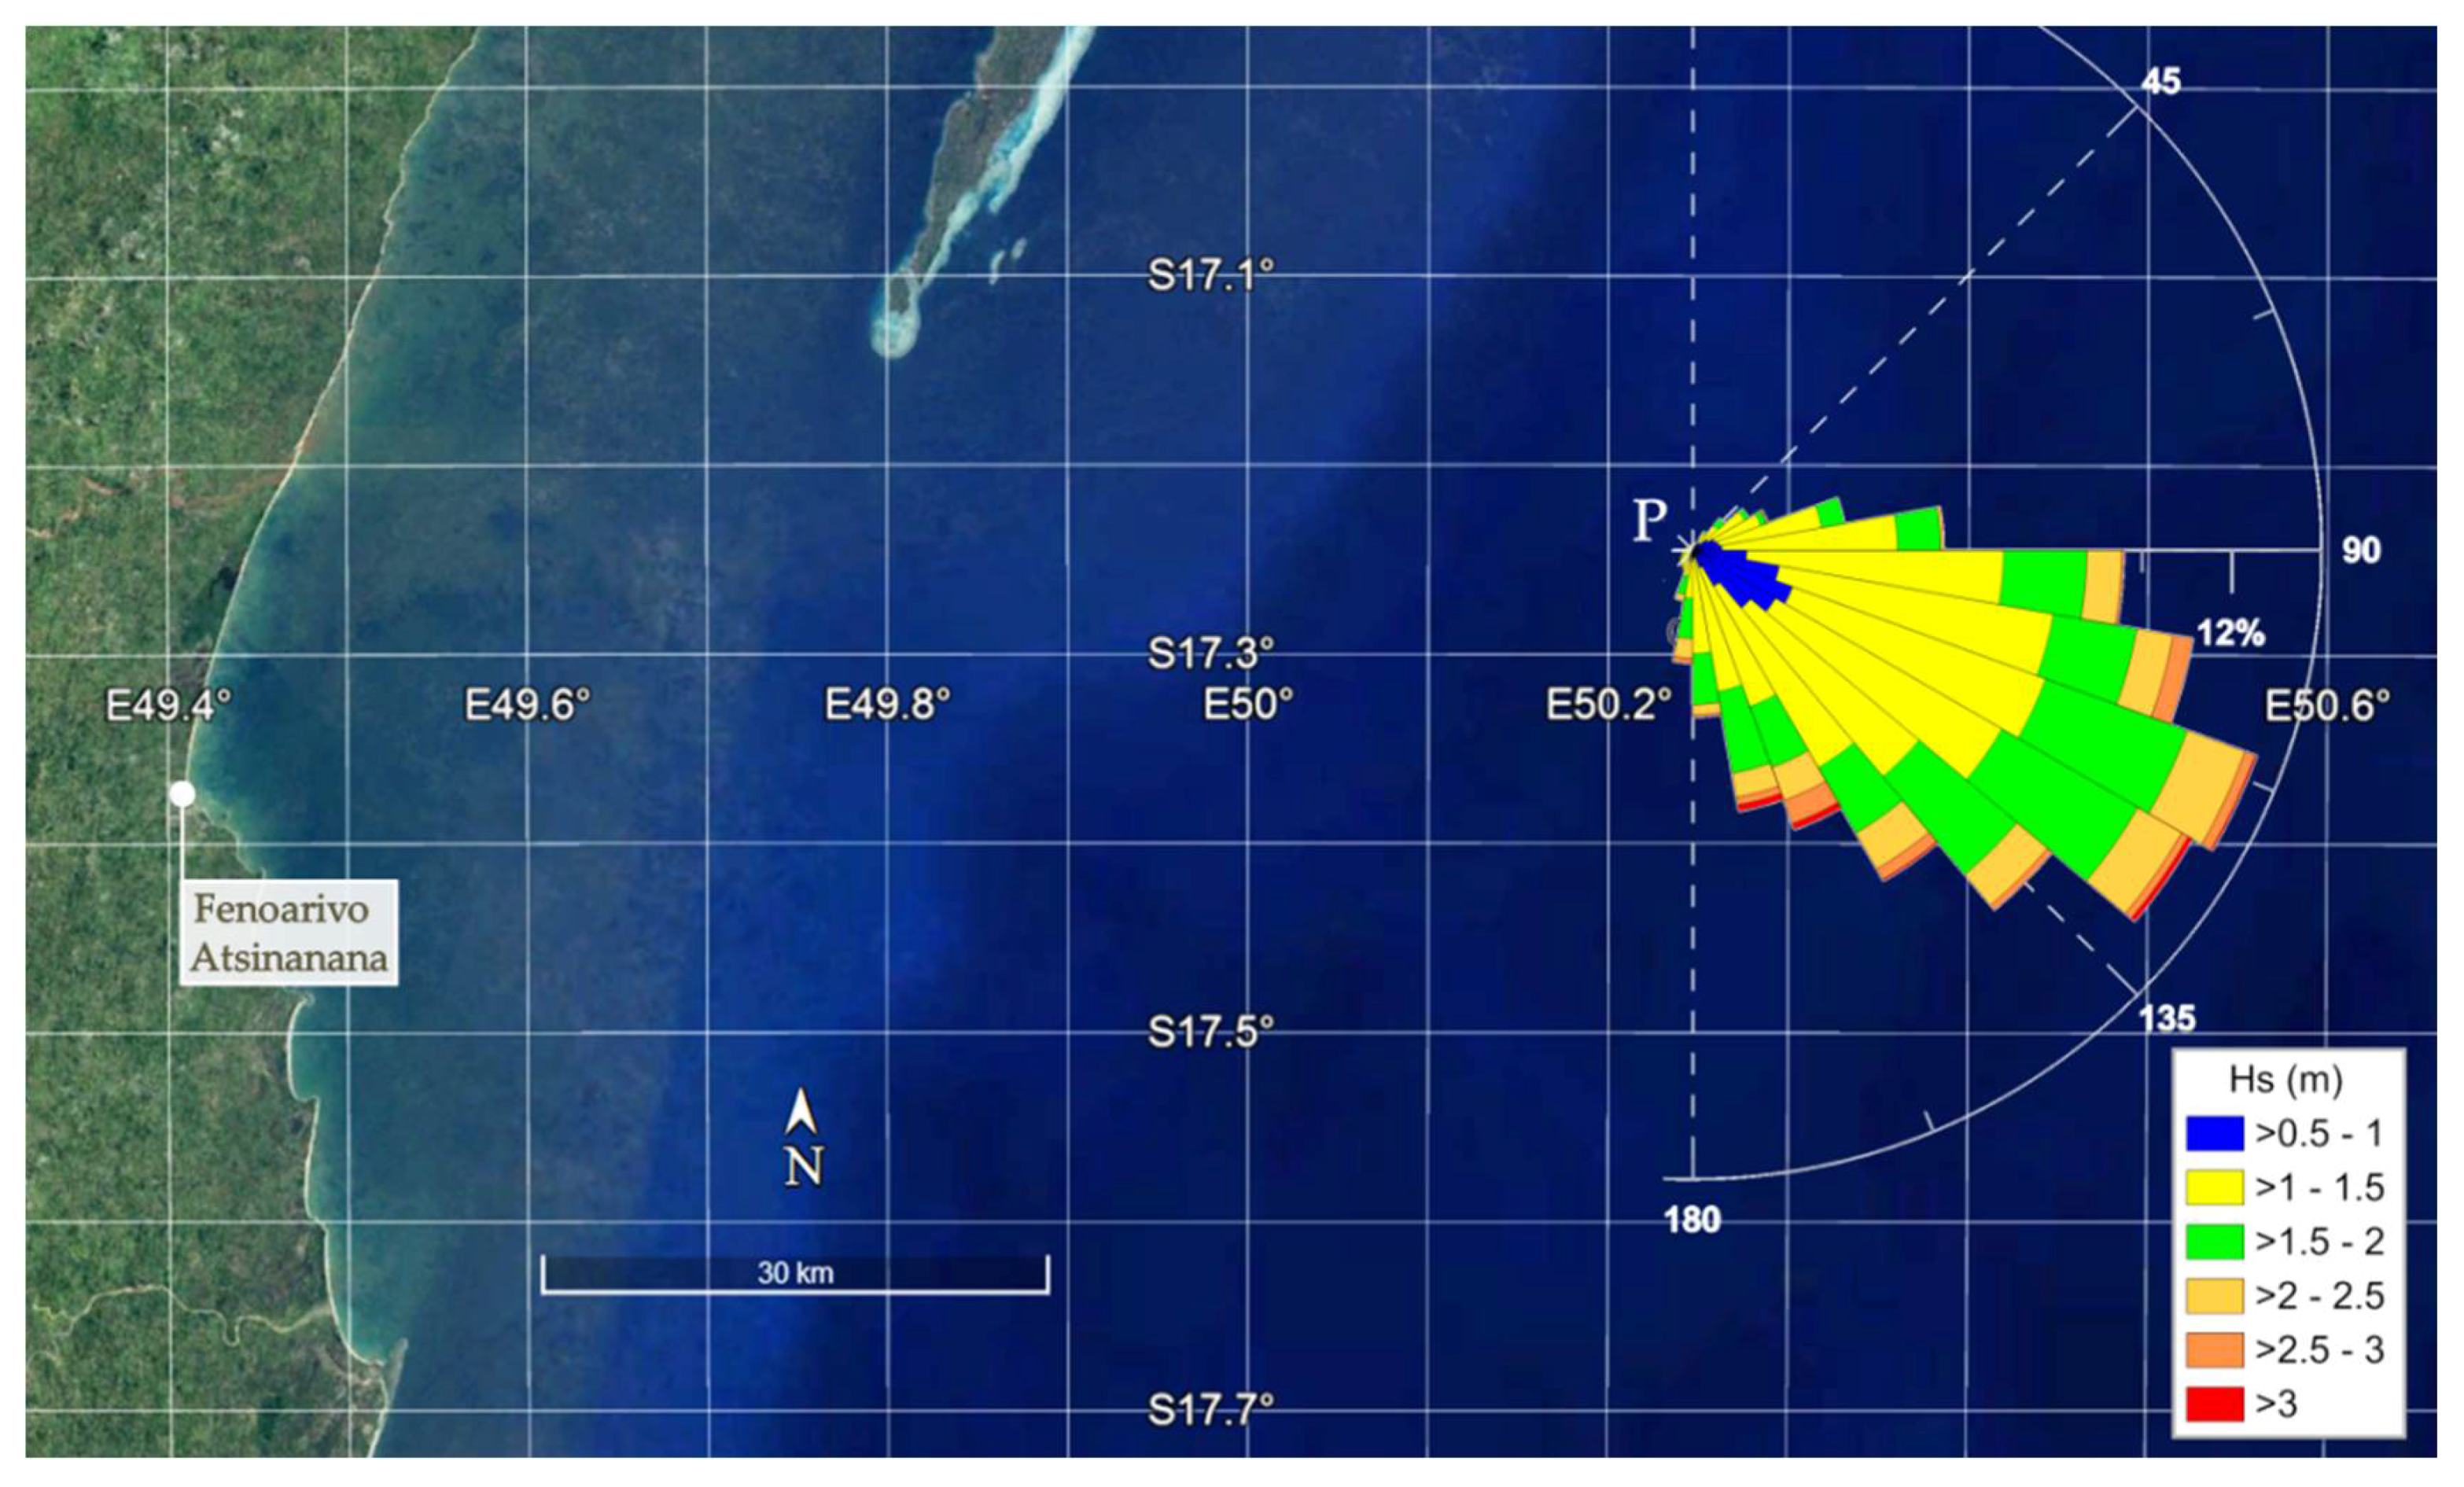
2.2. Area Overview
- the analyzed main breakwater integrating the desalination modules is designed to connect the two natural reefs, for a length of 500 m, as shown in Figure 1;
- the orientation is 15.0° N, i.e., approximately orthogonal to the main wave sector, as discussed below;
- the average depth is 5 m;
- the connection to the electric grid and the water network is provided by bottom-set service lines. If a secondary breakwater is required (to create the port basin), it could be equipped with these services.
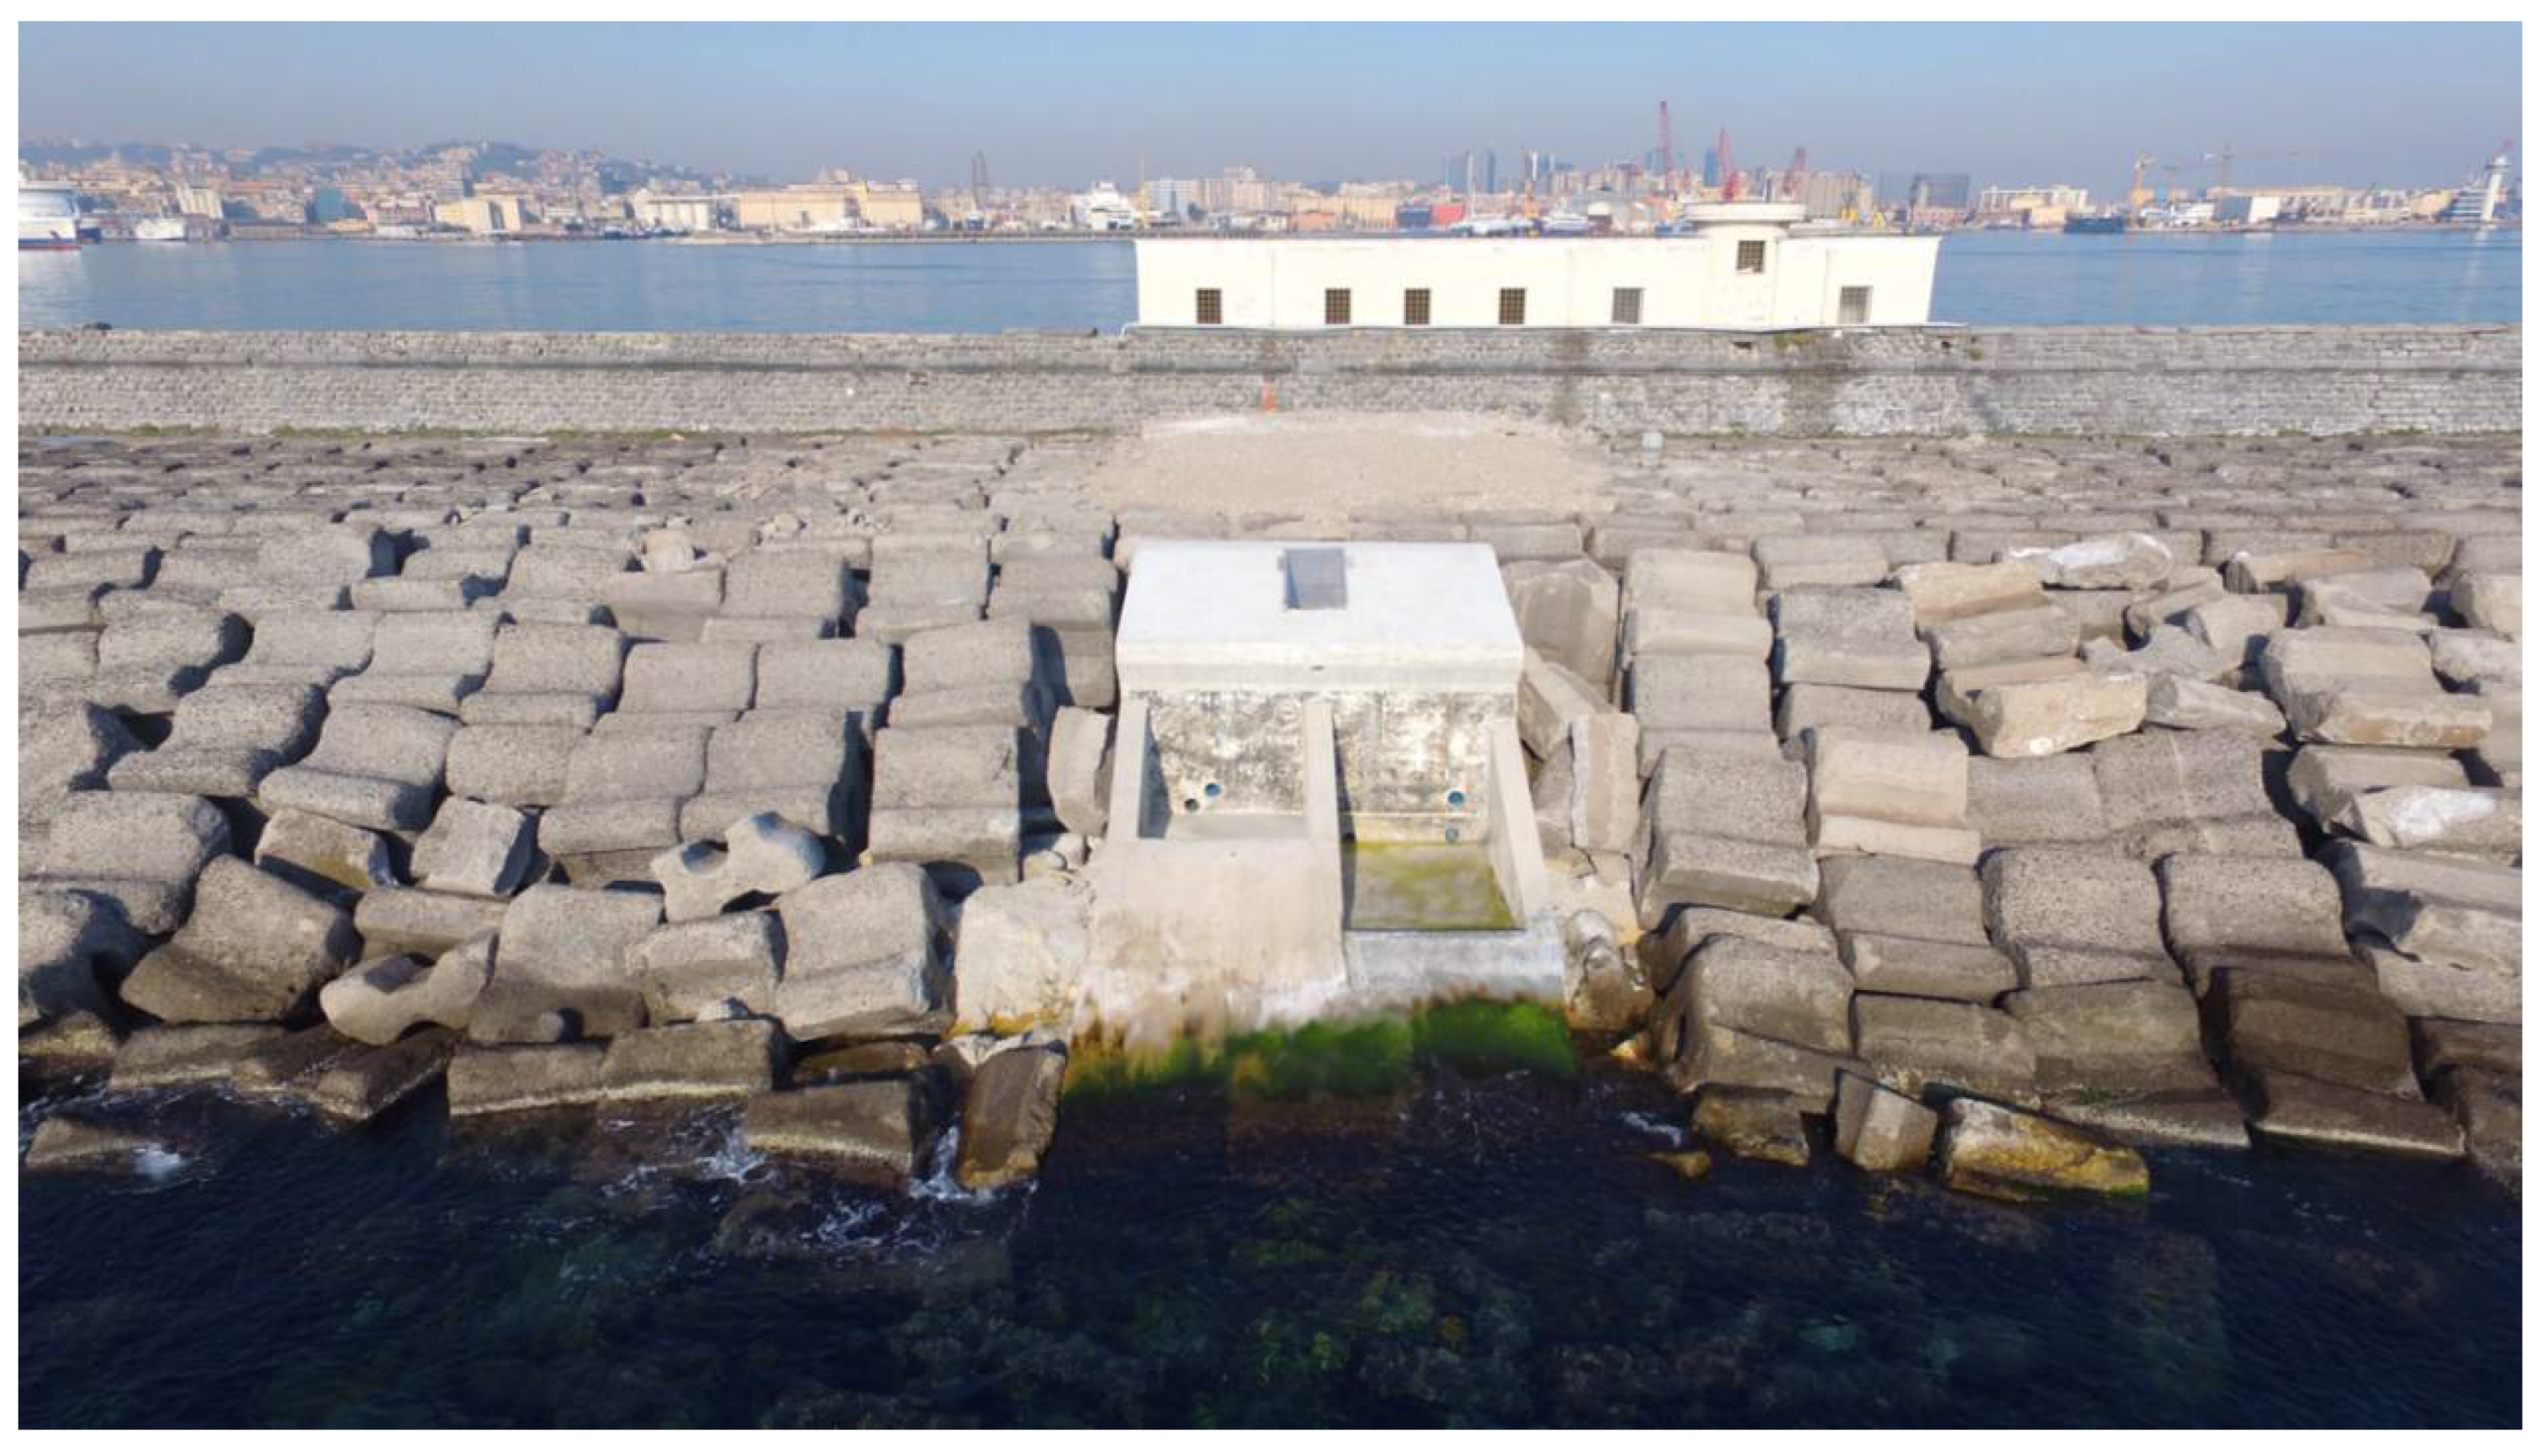
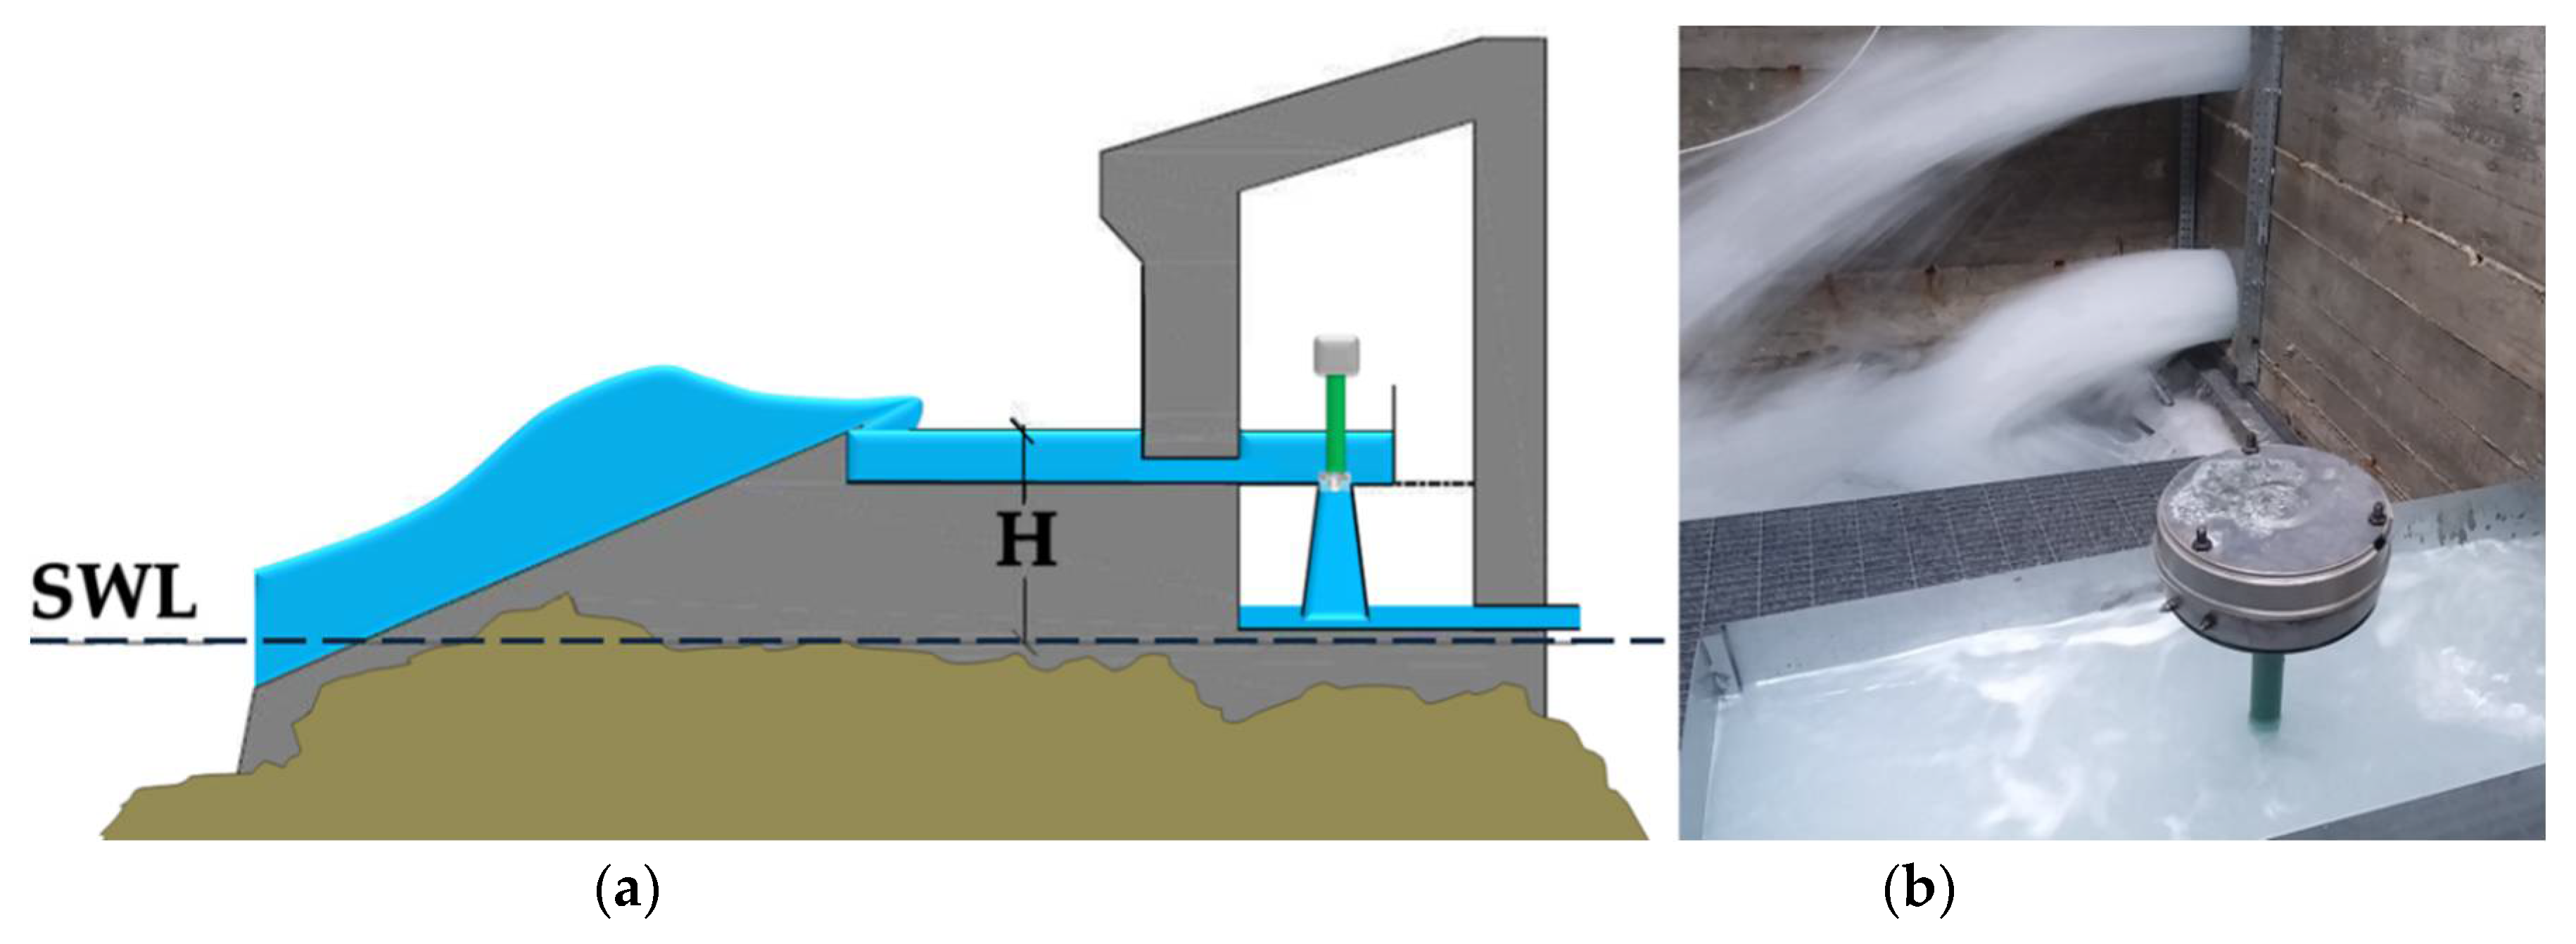
2.3. Overtopping Breakwater for Wave Energy Conversion
2.4. Wave Climate
2.4.1. Wave Dataset
2.4.2. Wave Propagation
2.5. Performance Analysis
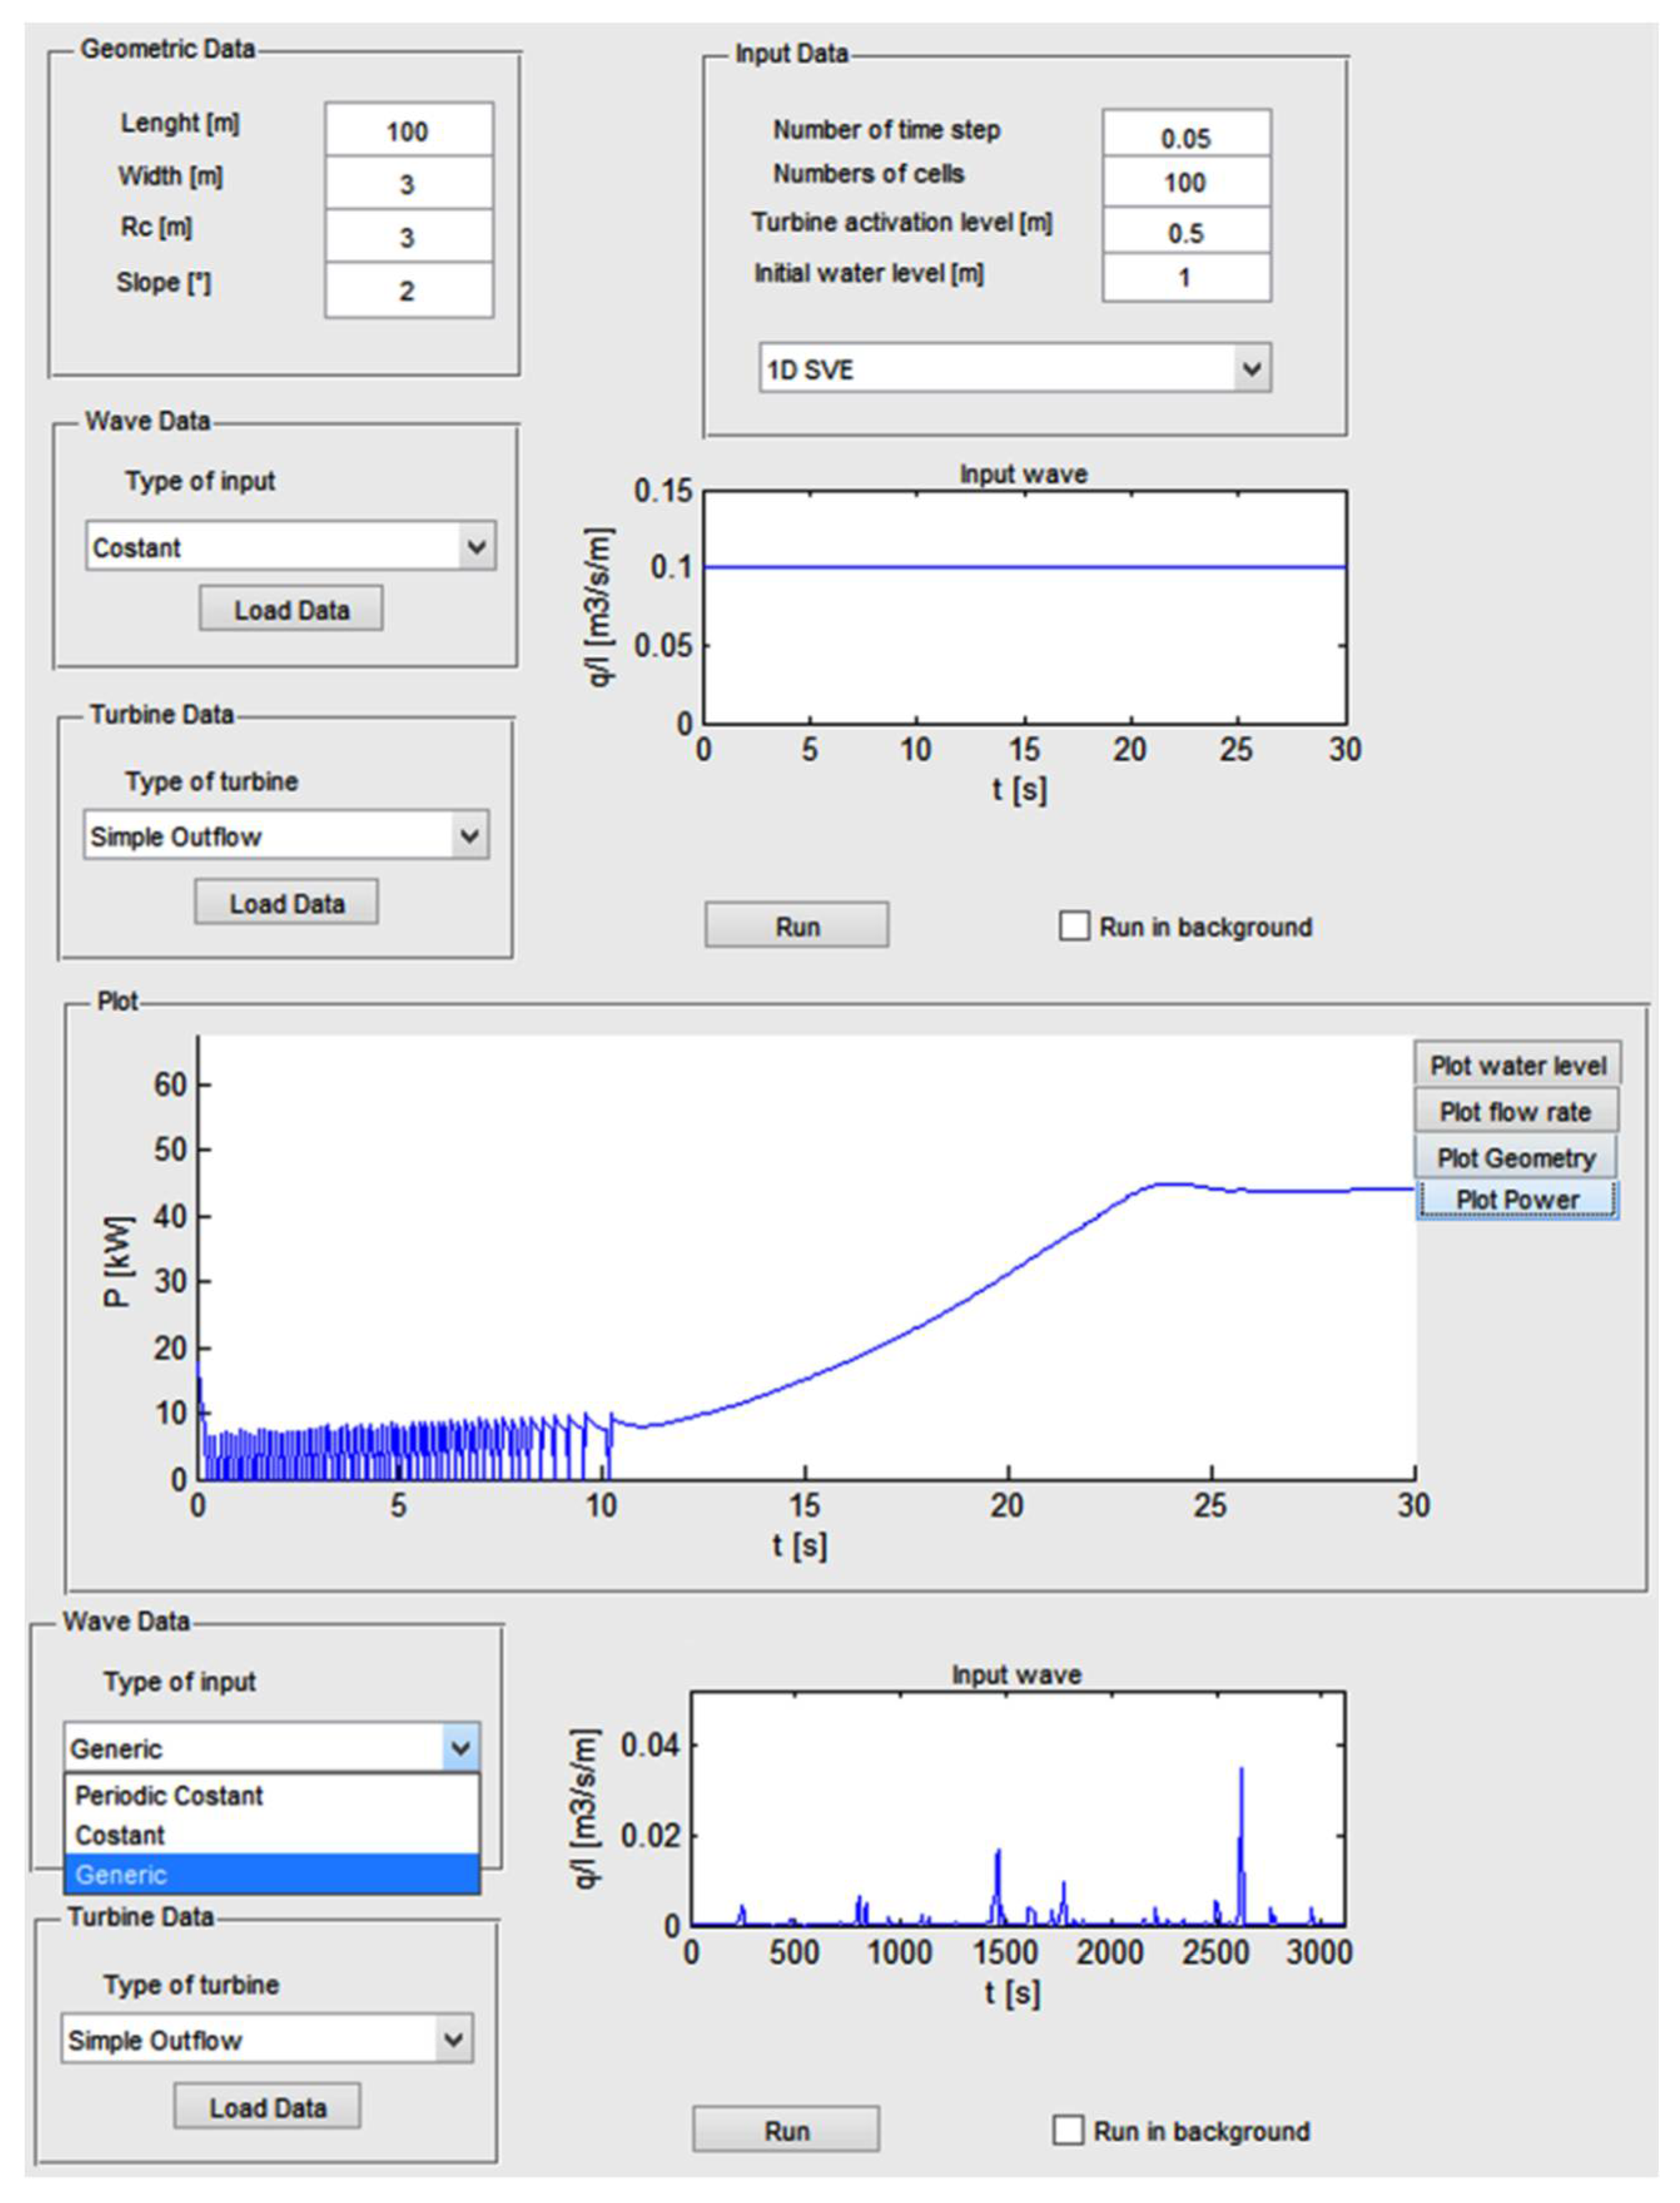
2.5.1. Energy Production
- wave characteristics of sea states;
- tentative geometry of the device;
- tentative turbine configuration.
- QRESERVOIR is the flow through the turbines;
- QIN is the total overtopping flow rate, as provided by Iuppa et al. [35];
- QREAR is the overtopping flow rate at the rear side of the structure;
- QOVERFLOW is the outgoing reflected flow when the reservoir is saturated.
- is the efficiency of the ramp, i.e., the rate of total incident power overtopping the crests;
- represents the efficiency of the reservoir, in terms of the potential energy stored or lost to overflow in the reservoirs;
- refers to turbine efficiency, as potential energy is transformed into kinetic energy by the turbines and is related to start/stop penalties;
- defines the electromechanical efficiency, as power take-off and generator efficiency and inverter losses.
2.5.2. Freshwater Production
- The overtopping water is accumulated in the reservoir through the wave overtopping principle and creates a head difference between the water inside the reservoir and the mean sea water level. The head difference generates a flow, which runs a turbine in order to produce electricity. From the bottom of the engine room, a percentage of 10–15% of the total outflow is then redirected for pre-treatment by a small pump operating at about 2 bar, while the remaining water returns directly to the sea.
- The electricity produced by the turbines is stabilized. Moreover, only a percentage of the total amount of electricity produced is consumed by the producer. In fact, in storm conditions, i.e., when the energy production is greater than the electricity required to run the desalination system, the power is exported to the grid or collected in a storage system.
- The water is pre-treated to remove all suspended solids and all the constituents that can cause fouling. Pre-treatment is based on filtration and chemical addition. Alternative pre-treatment could be achieved by the use of a beach drainage technique, for which the sand acts as a natural filter, while dewatering of the swash zone is achieved for beach erosion control [39,40,41,42].
- The produced electricity supplies the energy for the pre-treatment and the high pressure (60–65 bar) pumping system, the reverse osmosis process and the post-treatment unit.
- Desalination produces two streams: one with low concentrations of salts and one with higher salt concentrations than the feed water. This second stream is traditionally called brine. Normally, the “recovered” brine is about 40–50% of the total feedwater driven into the RO system.
- Connected to the RO system there is an energy recovery device, including a flow control centre including concentrated and recycled valves. Such machines are designed to recover the hydraulic energy of the pressurized water flow. The average efficiency values are around 40–60%.
- The last step for the water is post-treatment, in which the water is prepared for distribution. The processes include:
- ○
- Remineralization with lime materials and carbon dioxide;
- ○
- PH adjustment to a range of 6.8 to 8.1;
- ○
- Disinfection using bromide- and iodide-based products.
- A motor voltage of 220 V instead of the original 380 V, to be compatible with the output voltage of the OBREC pico-turbines;
- An increased value of energy consumption, moving from the proposed 1.9 kWh/mc to 2.1 kWh/mc, i.e., a 10% increase in order to provide a more conservative estimation of fresh water outflow.
3. Results
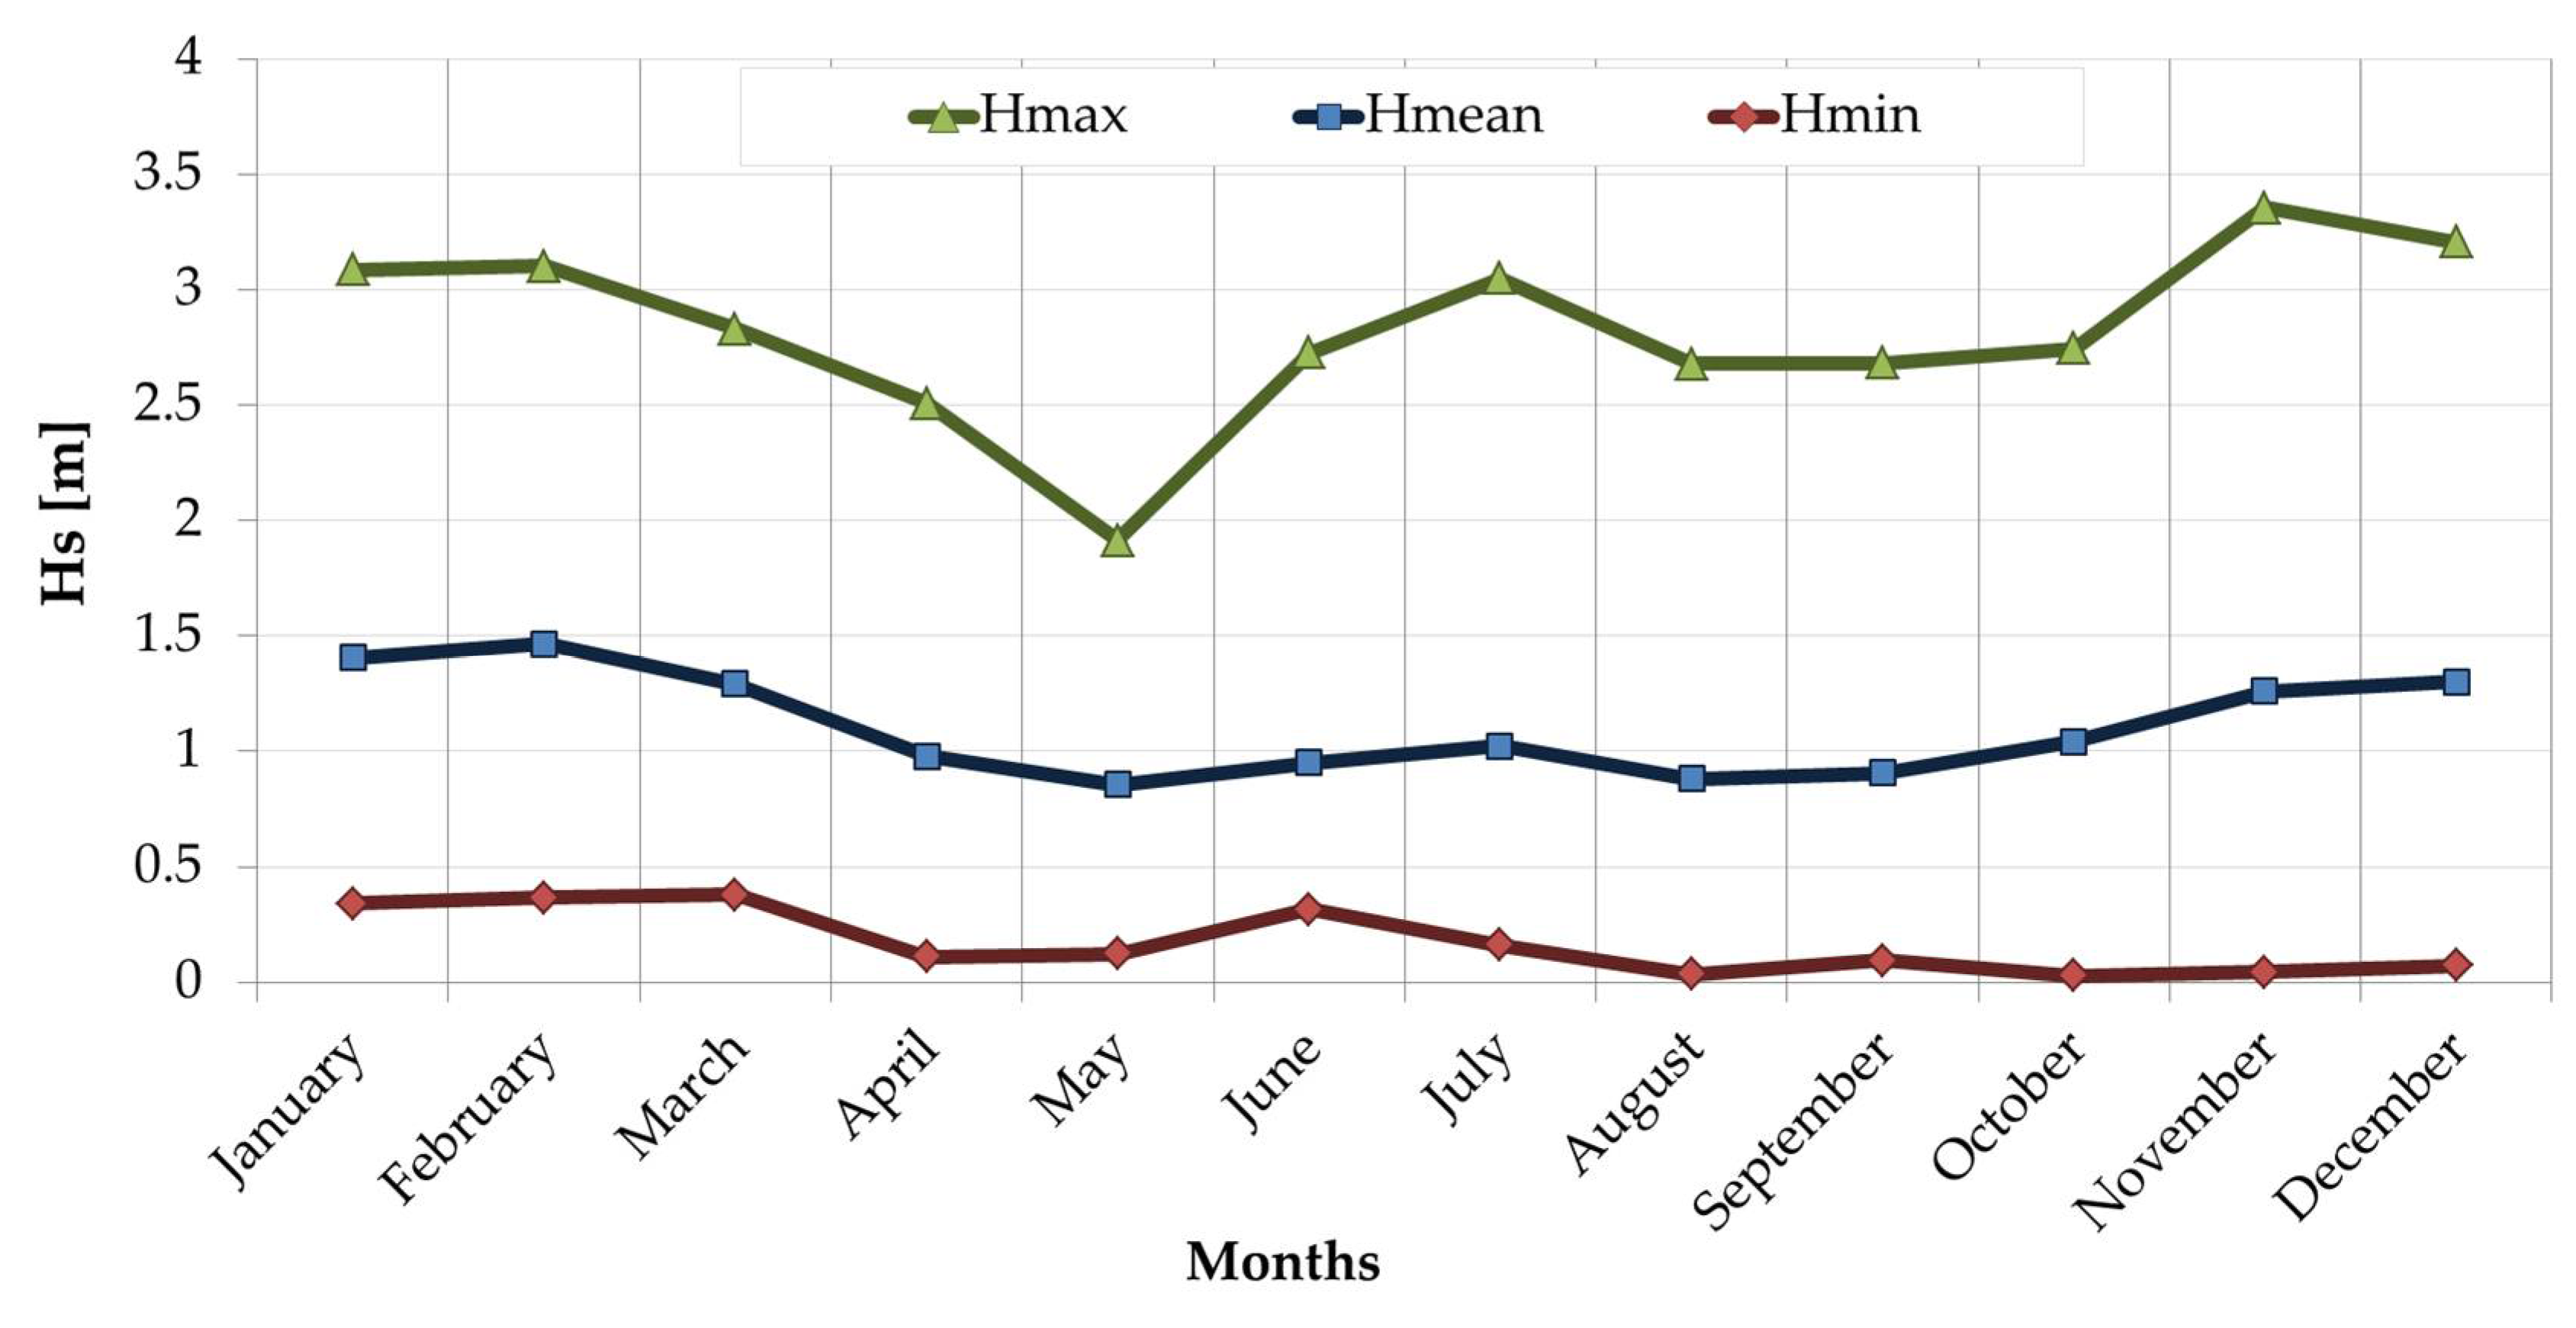
3.1. Offshore Wave Power
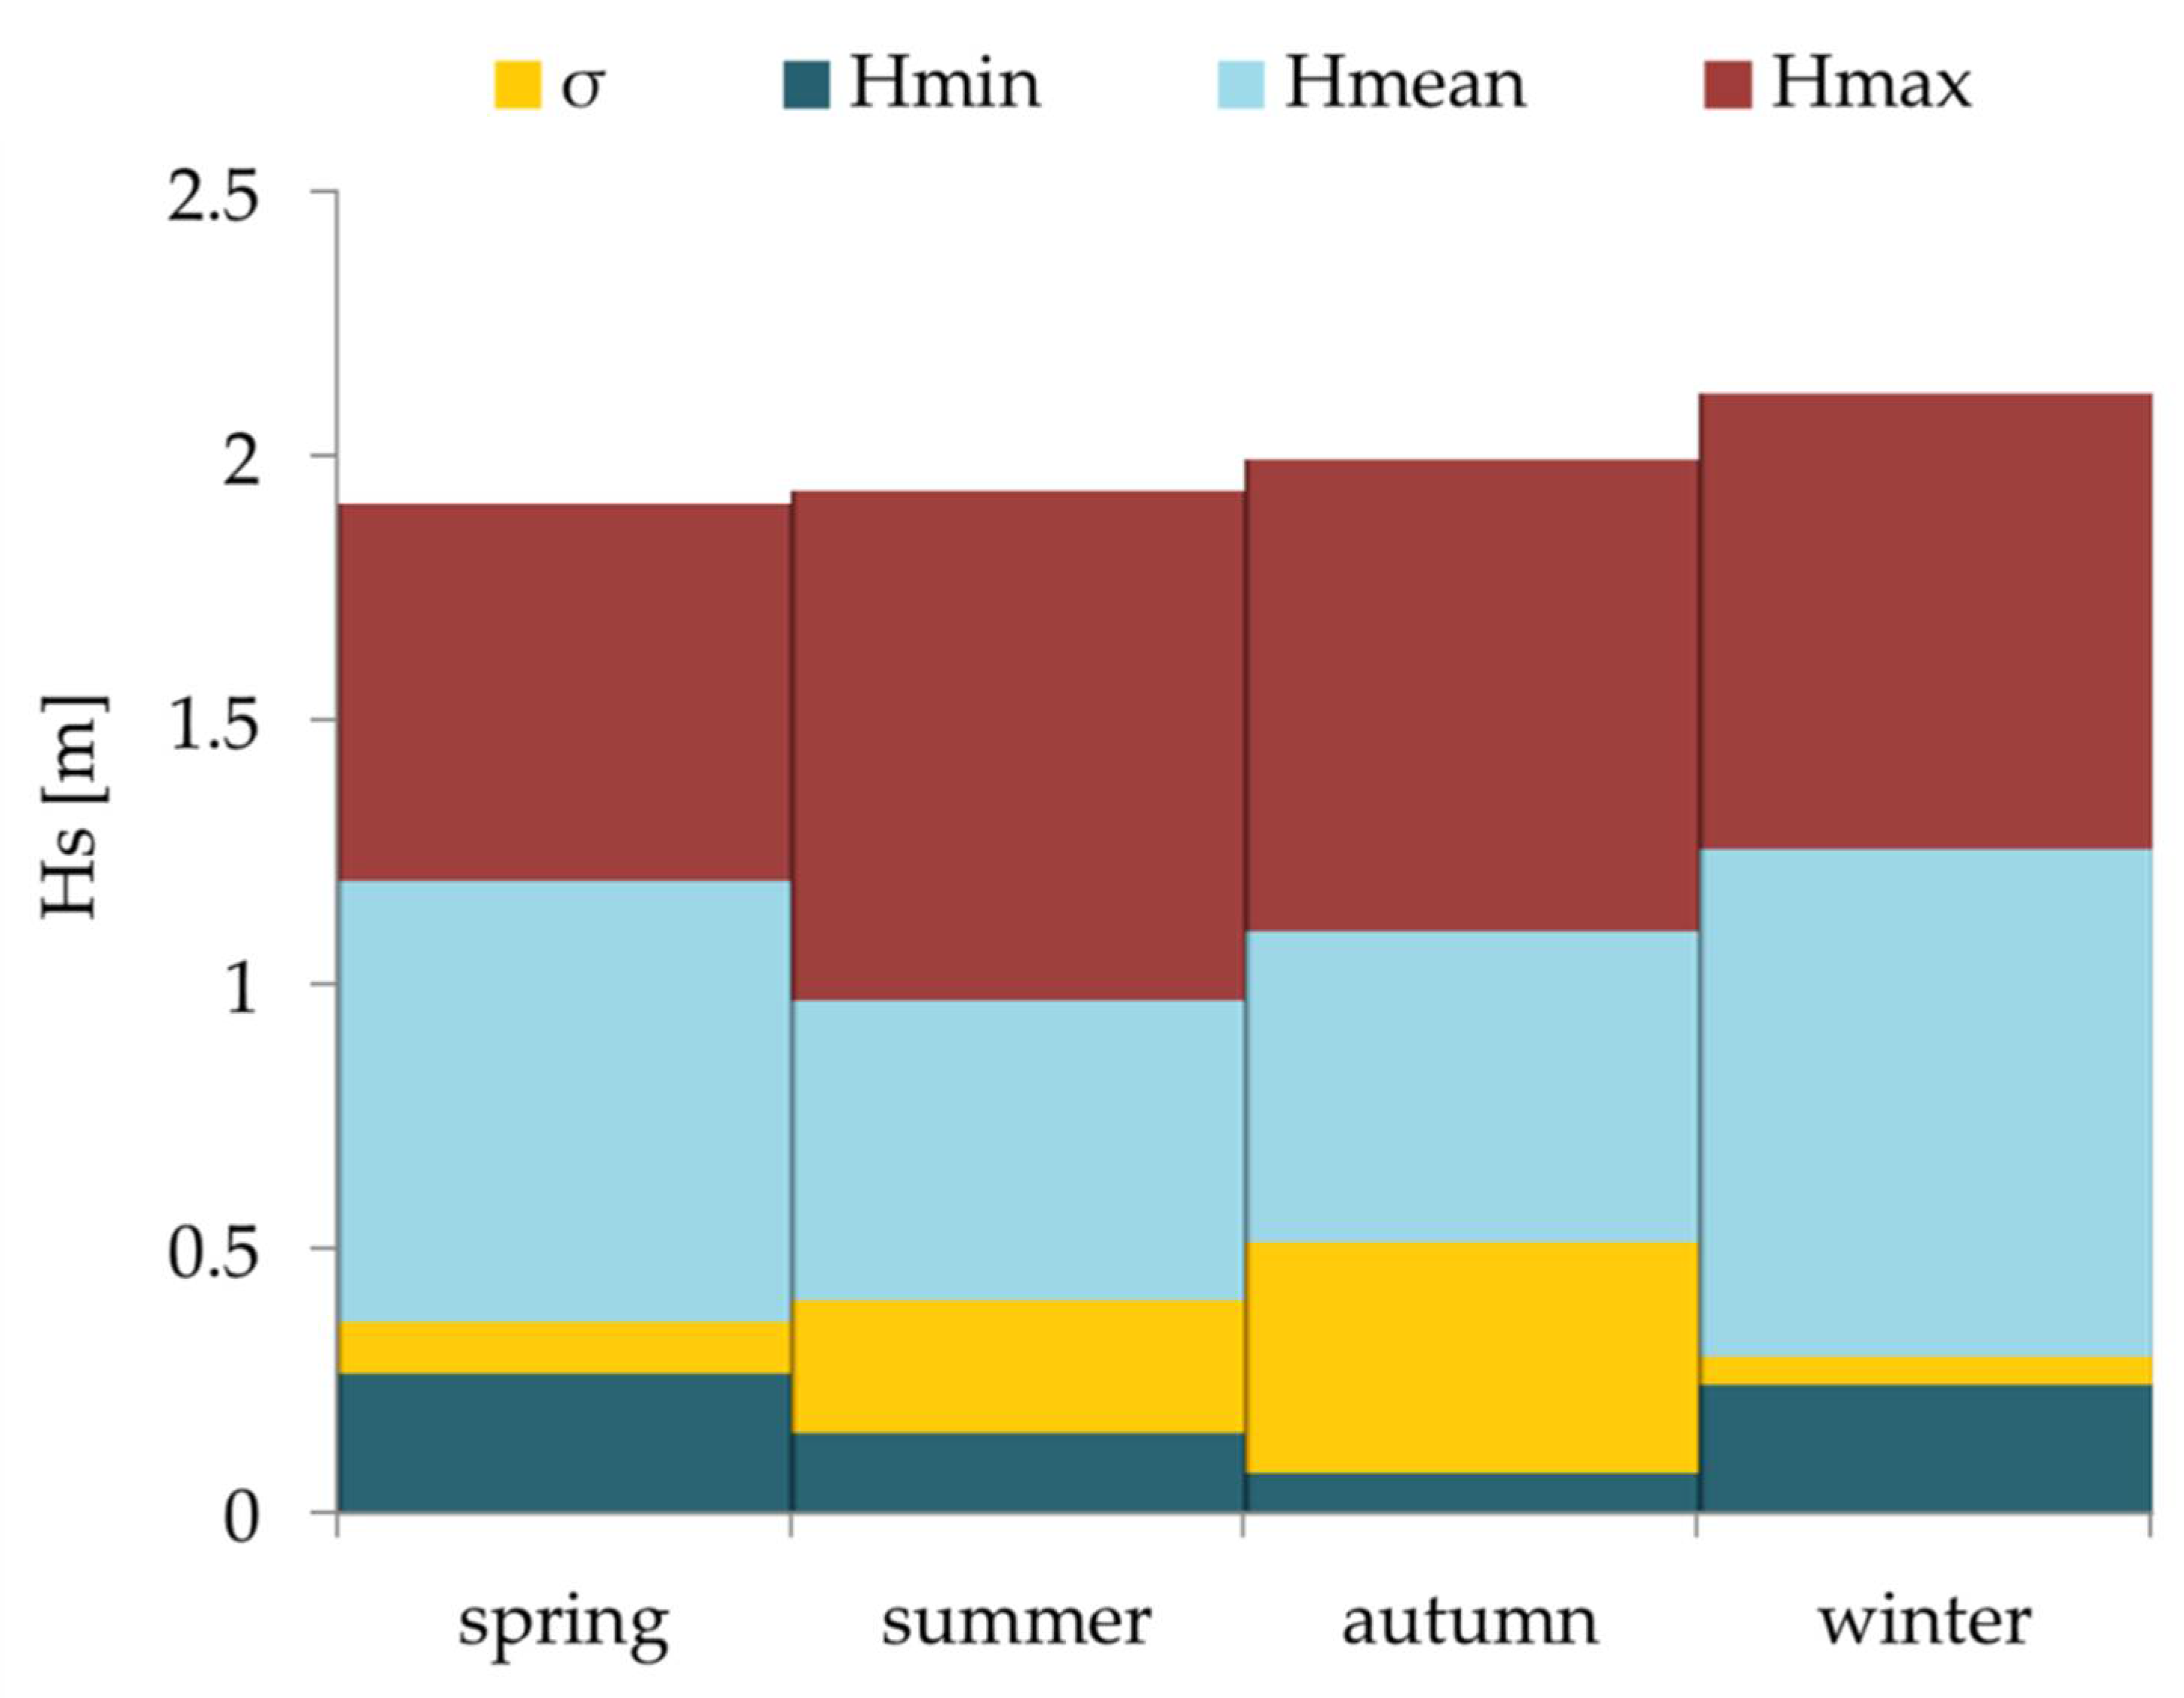
3.2. Inshore Wave Pattern at the Study Site
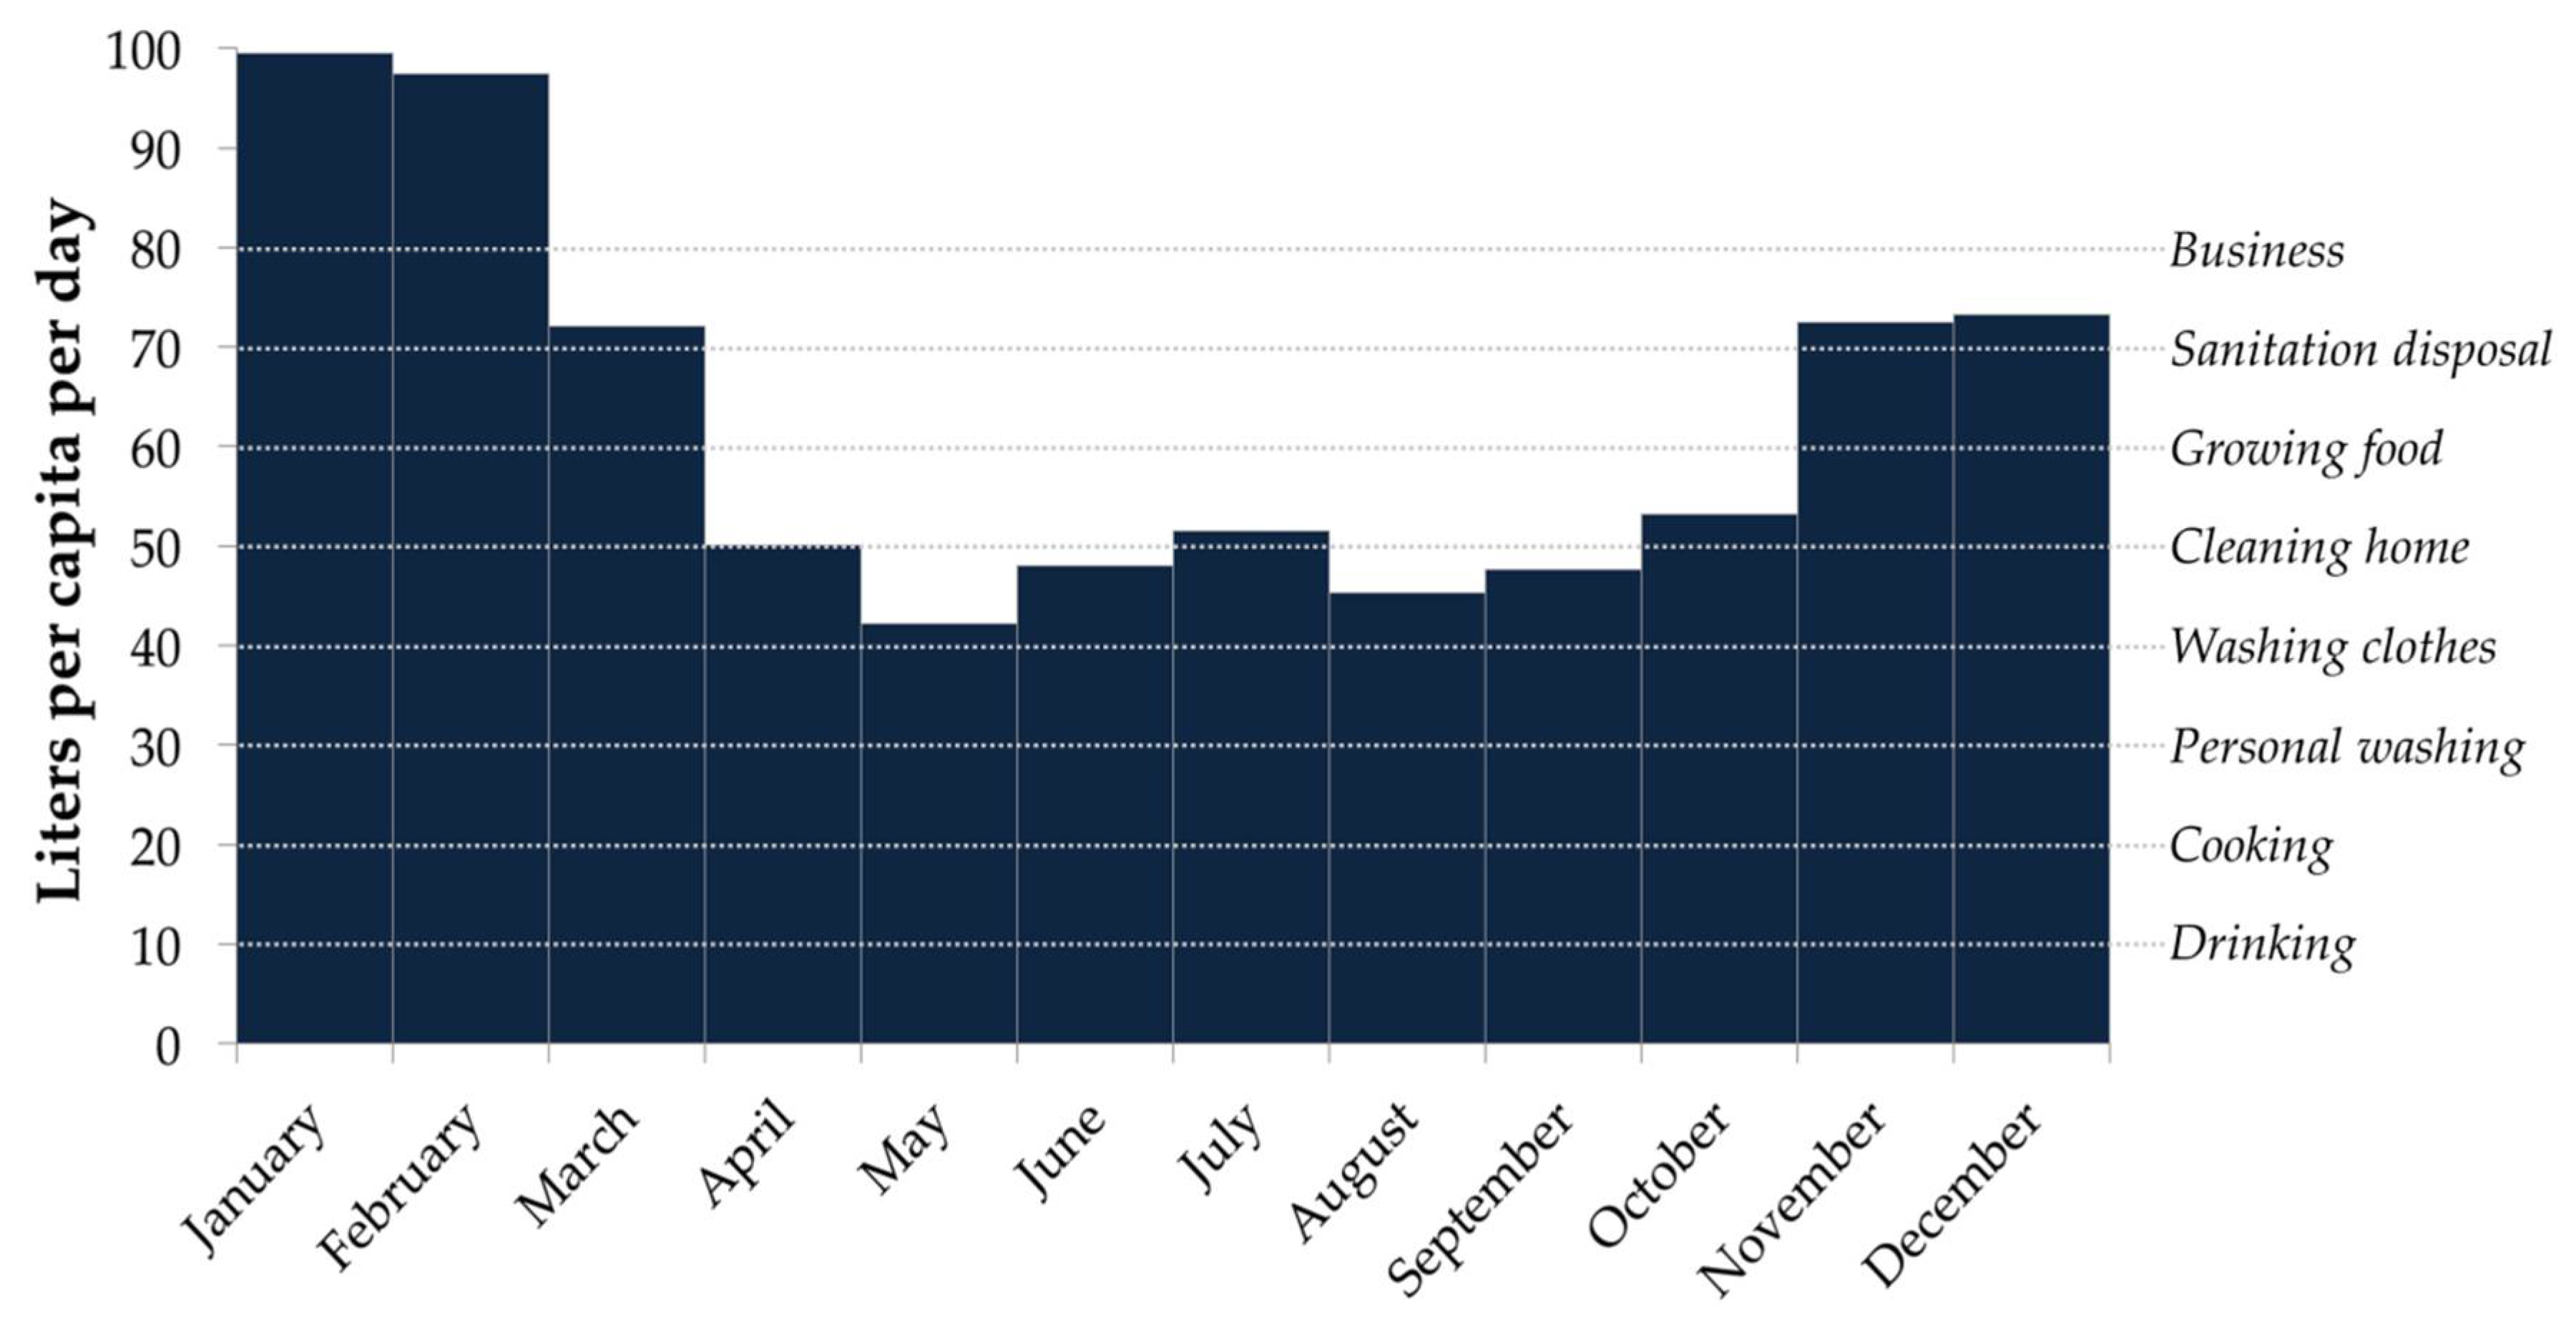
3.3. Wave-to-Wire Production and Freshwater Outflow
4. Additional Considerations
5. Conclusions
Author Contributions
Acknowledgments
Conflicts of Interest
References
- Gilau, A.M.; Small, M.J. Designing cost-effective sea water reverse osmosis system under optimal energy options for developing countries. In Proceedings of the International Conference on Renewable Energy for Developing Countries, Washington, DC, USA, 5–7 April 2006; p. 1. [Google Scholar]
- International Desalination Association. Available online: http://idadesal.org/desalination-101/desalination-by-the-numbers/ (accessed on 10 April 2018).
- Eltawil, M.A.; Zhengming, Z.; Yuan, L. Renewable energy powered desalination systems: Technologies and economics-state of the art. In Proceedings of the 12th International Water Technology Conference, Alexandria, Egypt, 27–30 March 2008; pp. 27–30. [Google Scholar]
- Mathioulakis, E.; Belessiotis, V.; Delyannis, E. Desalination by using alternative energy: Review and state-of-the-art. Desalination 2007, 203, 346–365. [Google Scholar] [CrossRef]
- Miller, S.; Shemer, H.; Semiat, R. Energy and environmental issues in desalination. Desalination 2015, 366, 2–8. [Google Scholar] [CrossRef]
- Shouman, E.R.; Sorour, M.H.; Abulnour, A.G. Economics of Renewable Energy for Water Desalination in Developing Countries. J. Eng. Sci. Technol. Rev. 2015, 8, 227–231. [Google Scholar] [CrossRef]
- El-Samanoudi, M.A.; Abd-Rabbo, M.F.; Sarhan, A.A.; Attia, M. Impact of Water Desalination Technologies on Environmental Development. In Proceedings of the Seventh International Water Technology Conference Egypt, Cairo, Egypt, 1–3 April 2003; Volume 1. [Google Scholar]
- Drioli, E.; Ali, A.; Macedonio, F. Membrane operations for process intensification in desalination. Appl. Sci. 2017, 7, 100. [Google Scholar] [CrossRef]
- Water Desalination Using Renewable Energy. Available online: https://iea-etsap.org/E-TechDS/PDF/I12IR_Desalin_MI_Jan2013_final_GSOK.pdf (accessed on 10 April 2018).
- Davies, P.A. Wave-powered desalination: Resource assessment and review of technology. Desalination 2005, 186, 97–109. [Google Scholar] [CrossRef]
- Pleass, C.M. The use of Wave Powered Seawater Desalination Systems. In Proceedings of the International Symposium on Wave and Tidal Energy, Canterbury, UK, 27–29 September 1974. [Google Scholar]
- Hicks, D.C.; Mitcheson, G.R.; Pleass, C.M.; Salevan, J.F. Delbouy: Ocean wave-powered seawater reverse osmosis desalination systems. Desalination 1989, 73, 81–94. [Google Scholar] [CrossRef]
- Charcosset, C. A review of membrane processes and renewable energies for desalination. Desalination 2009, 245, 214–231. [Google Scholar] [CrossRef]
- Sharmila, N.; Jalihal, P.; Swamy, A.K.; Ravindran, M. Wave powered desalination system. Energy 2004, 29, 1659–1672. [Google Scholar] [CrossRef]
- AquaEnergy, The AquaBuoy Wave Energy Converter. 2006. Available online: http://aquaenergygroup.com (accessed on 14 November 2006).
- The CETO Wave Energy Converter. Available online: http://www.cornwallislesofscillygrowthprogramme.org.uk/growth-story/ceto-wave-energy/ (accessed on 10 April 2018).
- Ocean Motion International WavePump Performance Test, FINAL REPORT. 2013. Available online: http://oceanmotionintl.com/wp-content/uploads/2014/09/A.3.pdf (accessed on 10 April 2018).
- Alkaisi, A.; Mossad, R.; Sharifian-Barforoush, A. A review of the water desalination systems integrated with renewable energy. Energy Procedia 2017, 110, 268–274. [Google Scholar] [CrossRef]
- Ali, A.; Tufa, R.A.; Macedonio, F.; Curcio, E.; Drioli, E. Membrane technology in renewable-energy-driven desalination. Renew. Sustain. Energy Rev. 2018, 81, 1–21. [Google Scholar] [CrossRef]
- Abdel-Aal, E.A.; Farid, M.E.; Hassan, F.S.; Mohamed, A.E. Desalination of Red Sea water using both electrodialysis and reverse osmosis as complementary methods. Egypt. J. Pet. 2015, 24, 71–75. [Google Scholar] [CrossRef]
- What We Do. Available online: http://wateraid.com (accessed on 21 October 2017).
- Faure, M.; Rakotomalala, O.; Pelon, R. Economic Contributions from Industrial Mining in Madagascar: Research Summary (English); World Bank Group: Washington, DC, USA, 2015. [Google Scholar]
- Contestabile, P.; Di Lauro, E.; Buccino, M.; Vicinanza, D. Economic assessment of Overtopping BReakwater for Energy Conversion (OBREC): A case study in Western Australia. Sustainability 2016, 9, 51. [Google Scholar] [CrossRef]
- Contestabile, P.; Ferrante, V.; Vicinanza, D. Wave Energy Resource along the Coast of Santa Catarina (Brazil). Energies 2015, 8, 14219–14243. [Google Scholar] [CrossRef]
- Contestabile, P.; Ferrante, V.; Di Lauro, E.; Vicinanza, D. Prototype Overtopping Breakwater forWave EnergyConversion at Port of Naples. In Proceedings of the 26th International Conference ISOPE, Rhodes, Greece, 26 June–2 July 2016; pp. 616–621. [Google Scholar]
- Vicinanza, D.; Contestabile, P.; Nørgaard, J.; Lykke Andersen, T. Innovative rubble mound breakwaters for overtopping wave energy conversion. Coast. Eng. 2014, 88, 154–170. [Google Scholar] [CrossRef]
- European Centre for Medium-Range Weather Forecasts. Available online: http://www.ecmwf.int/ (accessed on 10 April 2018).
- Goda, Y. Random Waves and Design of Maritime Structures, 2nd ed.; World Scientific: Singapore, 2000. [Google Scholar]
- Contestabile, P.; Lauro, E.D.; Galli, P.; Corselli, C.; Vicinanza, D. Offshore Wind and Wave Energy Assessment around Malè and Magoodhoo Island (Maldives). Sustainability 2017, 9, 613. [Google Scholar] [CrossRef]
- ABP Marine Environmental Research Ltd. Atlas of UK Marine Renewable Energy Resources: Technical Report; Report No. R.1106 Prepared for the UK Department of Trade and Industry; ABP Marine Environmental Research Ltd.: Southampton, UK, 2004. [Google Scholar]
- MIKE 21. Available online: http://www.mikepoweredbydhi.com/products/mike-21 (accessed on 10 April 2018).
- Holthuijsen, L.H.; Booij, N.; Herbers, T.H.C. A prediction model for stationary, short-crested waves in shallow water with ambient currents. Coast. Eng. 1989, 13, 23–54. [Google Scholar] [CrossRef]
- The General Bathymetric Chart of the Oceans. Available online: http://www.gebco.net/ (accessed on 10 April 2018).
- Navionics. Available online: http://www.navionics.com/ (accessed on 10 April 2018).
- Iuppa, C.; Contestabile, P.; Cavallaro, L.; Foti, E.; Vicinanza, D. Hydraulic performance of an innovative breakwater for overtopping wave energy conversion. Sustainability 2016, 8, 1226. [Google Scholar] [CrossRef]
- Electway-Store. Available online: http://www.electway.net/upload/file/1362219611.pdf (accessed on 10 March 2018).
- Van der Bruggen, B.; Vandecasteele, C. Distillation vs. membrane filtration: Overview of process evolutions in seawater desalination. Desalination 2002, 143, 207–218. [Google Scholar] [CrossRef]
- Buros, O.K. The ABCs of Desalting; International Desalination Association: Topsfield, MA, USA, 2000; p. 30. [Google Scholar]
- Contestabile, P.; Aristodemo, F.; Vicinanza, D.; Ciavola, P. Laboratory Study on a Beach Drainage System. Coast. Eng. 2012, 66, 50–64. [Google Scholar] [CrossRef]
- Ciavola, P.; Vicinanza, D.; Aristodemo, F.; Contestabile, P. Large-scale morphodynamic experiments on a beach drainage system. J. Hydraul. Res. 2011, 49, 523–528. [Google Scholar] [CrossRef]
- Ciavola, P.; Contestabile, P.; Aristodemo, F.; Vicinanza, D. Beach sediment mixing under drained andundrained conditions. J. Coast. Res. 2013, 65, 1503–1508. [Google Scholar] [CrossRef]
- Ciavola, P.; Vicinanza, D.; Fontana, E. Beach drainage as a form of shoreline stabilization: Case studies in Italy. In Proceedings of the 31st International Conference, Hamburg, Germany, 31 August–5 September 2008; Volume 5, pp. 2646–2658. [Google Scholar]
- Suez Water Technologies. Available online: http://engg.suezwatertechnologies.com/products/configurator (accessed on 10 March 2018).
- Folley, M.; Suarez, B.P.; Whittaker, T. An autonomous wave-powered desalination system. Desalination 2008, 220, 412–421. [Google Scholar] [CrossRef]
- Swallow, J.; Fieux, M.; Schott, F. The boundary currents east and north of Madagascar: 1. Geostrophic currents and transports. J. Geophys. Res. Oceans 1988, 93, 4951–4962. [Google Scholar] [CrossRef]
- Schott, F.; Fieux, M.; Kindle, J.; Swallow, J.; Zantopp, R. The boundary currents east and north of Madagascar: 2. Direct measurements and model comparisons. J. Geophys. Res. Oceans 1988, 93, 4963–4974. [Google Scholar] [CrossRef]
- Rossby, C.G. Relation between variations in the intensity of the zonal circulation of the atmosphere and the displacements of the semi-permanent centers of action. J. Mar. Res. 1939, 2, 38–55. [Google Scholar] [CrossRef]
- Platzman, G.W. The Rossby wave. Q. J. R. Meteorol. Soc. 1968, 94, 225–248. [Google Scholar] [CrossRef]
- Jamart, B.M.; Nihoul, J.C.J. (Eds.) Mesoscale/synoptic Coherent Structures in Geophysical Turbulence; Elsevier: Amsterdam, The Netherlands, 1989; Volume 50. [Google Scholar]
- World Population Review. Available online: http://worldpopulationreview.com/countries/madagascar-population/cities/ (accessed on 10 April 2018).
- African Development Bank Group. Available online: https://www.afdb.org/fileadmin/uploads/afdb/Documents/Project-and-Operations/Madagascar_-_The_Grand_Sud_Rural_Potable_Water_and_Sanitation_Project_-_Appraisal_Report.pdf (accessed on 10 March 2018).
- World Healt Organization. Available online: http://www.who.int/water_sanitation_health/publications/2011/WHO_TN_09_How_much_water_is_needed.pdf?ua=1 (accessed on 10 April 2018).
- Leijon, J.; Boström, C. Freshwater production from the motion of ocean waves—A review. Desalination 2018, 435, 161–171. [Google Scholar] [CrossRef]
- Vicinanza, D.; Nørgaard, J.H.; Contestabile, P.; Andersen, T.L. Wave loadings acting on overtopping breakwater for energy conversion. J. Coast. Res. 2013, 65, 1669–1674. [Google Scholar] [CrossRef]
- Buccino, M.; Stagonas, D.; Vicinanza, D. Development of composite sea wall wave energy converter system. Renew. Energy 2015, 81, 509–522. [Google Scholar] [CrossRef]
- Iuppa, C.; Cavallaro, L.; Foti, E.; Vicinanza, D. Potential wave energy production by different wave energy converters around Sicily. J. Renew. Sustain. Energy 2015, 7, 1–16. [Google Scholar] [CrossRef]
- Abanades, J.; Greaves, D.; Iglesias, G. Coastal defence using wave farms: The role of farm-to-coast distance. Renew. Energy 2014, 75, 572–582. [Google Scholar] [CrossRef]
- Abanades, J.; Greaves, D.; Iglesias, G. Wave farm impact on beach modal state. Mar. Geol. 2015, 361, 126–135. [Google Scholar] [CrossRef]
- Abanades, J.; Flor-Blanco, G.; Flor, G.; Iglesias, G. Dual wave farms for energy production and coastal protection. Ocean Coast. Manag. 2018, 160, 18–29. [Google Scholar] [CrossRef]
- Azzellino, A.; Contestabile, P.; Ferrante, V.; Lanfredi, C.; Vicinanza, D. Strategic environmental assessment to evaluate WEC projects in the perspective of the environmental cost-benefit analysis. In Proceedings of the International Offshore and Polar Engineering Conference, Maui, HI, USA, 19–24 June 2011; ISOPE: Maui, HI, USA, 2011; pp. 709–715. [Google Scholar]


| Equipment | Specification |
|---|---|
| Recovery | 45% |
| Number of membranes | 16 |
| Nominal product flow | 9.085 m3/h |
| Motor power | 380 VAC, 3 phases, 50 Hz |
| Control circuit | 220 V, single phase, 50 Hz |
| Power consumption | 1.9 kWH/m3 |
| Month | Hs,mean | Hs,max | Hs,min | σH | Tm,mean | Tm,max | σT | Pmean |
|---|---|---|---|---|---|---|---|---|
| (m) | (m) | (m) | (m) | (s) | (s) | (s) | (kW) | |
| January | 1.87 | 3.09 | 0.46 | 0.30 | 8.28 | 9.40 | 0.60 | 18.67 |
| February | 1.95 | 3.10 | 0.49 | 0.32 | 8.27 | 9.70 | 0.58 | 19.63 |
| March | 1.72 | 2.83 | 0.50 | 0.21 | 8.10 | 9.47 | 0.66 | 14.59 |
| April | 1.30 | 2.51 | 0.15 | 0.30 | 8.02 | 9.77 | 0.69 | 8.77 |
| May | 1.14 | 1.91 | 0.16 | 0.28 | 7.71 | 9.36 | 0.63 | 6.50 |
| June | 1.26 | 2.73 | 0.42 | 0.18 | 7.74 | 9.46 | 0.74 | 8.76 |
| July | 1.36 | 3.05 | 0.21 | 0.27 | 8.33 | 10.43 | 0.86 | 11.38 |
| August | 1.17 | 2.68 | 0.04 | 0.36 | 8.15 | 9.96 | 0.82 | 8.52 |
| September | 1.20 | 2.68 | 0.13 | 0.24 | 8.05 | 9.61 | 0.69 | 9.20 |
| October | 1.39 | 2.75 | 0.04 | 0.40 | 8.42 | 10.59 | 0.87 | 12.10 |
| November | 1.68 | 3.35 | 0.06 | 0.49 | 8.46 | 10.81 | 0.83 | 17.87 |
| December | 1.73 | 3.21 | 0.10 | 0.42 | 8.34 | 10.34 | 0.74 | 18.31 |
| Mean | 1.48 | 2.82 | 0.23 | 0.32 | 8.15 | 9.91 | 0.72 | 12.86 |
| σ | 0.29 | 0.38 | 0.18 | 0.09 | 0.24 | 0.51 | 0.10 | 4.73 |
| Month | Hs,mean | Hs,max | Hs,min | σH | Tm,mean | Tm,max | σT | Pmean |
|---|---|---|---|---|---|---|---|---|
| (m) | (m) | (m) | (m) | (s) | (s) | (s) | (kW) | |
| January | 1.58 | 2.12 | 2.50 | 0.27 | 7.62 | 8.65 | 0.54 | 9.95 |
| February | 1.52 | 2.09 | 2.47 | 0.29 | 7.57 | 8.84 | 0.54 | 9.12 |
| March | 1.40 | 1.92 | 2.27 | 0.22 | 7.40 | 8.69 | 0.62 | 7.31 |
| April | 1.07 | 1.71 | 2.01 | 0.30 | 7.33 | 8.88 | 0.60 | 4.58 |
| May | 0.92 | 1.31 | 1.54 | 0.21 | 7.13 | 8.73 | 0.65 | 3.30 |
| June | 1.03 | 1.86 | 2.19 | 0.18 | 7.05 | 8.46 | 0.65 | 4.24 |
| July | 1.08 | 2.02 | 2.38 | 0.27 | 7.55 | 9.55 | 0.78 | 5.46 |
| August | 0.96 | 1.93 | 2.27 | 0.31 | 7.49 | 9.23 | 0.76 | 4.35 |
| September | 0.97 | 1.84 | 2.17 | 0.17 | 7.43 | 8.85 | 0.63 | 4.58 |
| October | 1.11 | 1.86 | 2.19 | 0.31 | 7.66 | 9.69 | 0.83 | 5.76 |
| November | 1.31 | 2.27 | 2.68 | 0.47 | 7.73 | 9.90 | 0.78 | 8.40 |
| December | 1.34 | 2.13 | 2.51 | 0.33 | 7.57 | 9.33 | 0.62 | 8.18 |
| Mean | 1.19 | 1.92 | 2.27 | 0.28 | 7.46 | 9.07 | 0.67 | 6.27 |
| σ | 0.23 | 0.25 | 0.29 | 0.08 | 0.21 | 0.46 | 0.10 | 2.22 |
| Description | Units | Value |
|---|---|---|
| Length of breakwater | [m] | 500 |
| Effective module average power | [kW] | 2.31 |
| Average overtopping water | [m3/yr] | 725,328,011 |
| Number of OBREC modules | [–] | 50 |
| Total energy production | [MWh/yr] | 1012.5 |
| Power consumption | [kWh/m3] | 2.1 |
| Water treated | [m3/yr] | 87,662,338 |
| Water post-treated (desalinated) | [m3/yr] | 482,143 |
| Inhabitants | [–] | 21,036 |
| Yearly outflow per capita | [m3/pc/yr] | 22,919.89 |
| Litres per capita per day | [L/pc/day] | 62.79 |
© 2018 by the authors. Licensee MDPI, Basel, Switzerland. This article is an open access article distributed under the terms and conditions of the Creative Commons Attribution (CC BY) license (http://creativecommons.org/licenses/by/4.0/).
Share and Cite
Contestabile, P.; Vicinanza, D. Coastal Defence Integrating Wave-Energy-Based Desalination: A Case Study in Madagascar. J. Mar. Sci. Eng. 2018, 6, 64. https://doi.org/10.3390/jmse6020064
Contestabile P, Vicinanza D. Coastal Defence Integrating Wave-Energy-Based Desalination: A Case Study in Madagascar. Journal of Marine Science and Engineering. 2018; 6(2):64. https://doi.org/10.3390/jmse6020064
Chicago/Turabian StyleContestabile, Pasquale, and Diego Vicinanza. 2018. "Coastal Defence Integrating Wave-Energy-Based Desalination: A Case Study in Madagascar" Journal of Marine Science and Engineering 6, no. 2: 64. https://doi.org/10.3390/jmse6020064
APA StyleContestabile, P., & Vicinanza, D. (2018). Coastal Defence Integrating Wave-Energy-Based Desalination: A Case Study in Madagascar. Journal of Marine Science and Engineering, 6(2), 64. https://doi.org/10.3390/jmse6020064