Article

Impact of Cyclone Track Features and Tidal Phase Shift upon Surge Characteristics in the Bay of Bengal along the Bangladesh Coast

1
Institute of Water and Flood Management, Bangladesh University of Engineering and Technology, Dhaka 1000, Bangladesh
2
Department of Civil Engineering, The University of Tokyo, Tokyo 113-8656, Japan
*
Author to whom correspondence should be addressed.
J. Mar. Sci. Eng. 2017, 5(4), 52; https://doi.org/10.3390/jmse5040052
Submission received: 15 October 2017 / Revised: 8 November 2017 / Accepted: 14 November 2017 / Published: 17 November 2017
(This article belongs to the Section Physical Oceanography)

Abstract

:
The impact of cyclone track features (e.g., cyclone translation speed, cyclone path and cyclone landfall crossing angle) in combination with tidal phase shift upon surge characteristics have been investigated at the Bay of Bengal along the Bangladesh coast. A two-dimensional hydrodynamic model in a horizontal direction (2DH) coupled with a storm-surge model has been employed for the study. Numerical experiments with three different cyclone translation speeds show that when the surge height is directly forced by the cyclonic wind speed especially within the RWM (Radius of Maximum Wind), faster translation speed produces reduced surge height as the cyclone gets less time to force the water. On the other hand, at locations outside the RMW, surge waves travel as a propagating long wave where higher surges are produced by faster moving cyclones. It is found that surge arrival times are more and more affected by tidal phase when cyclone translation speed is reduced. Analysis of seven hypothetical parallel cyclone paths show that local bathymetry and complex coastline configurations strongly influence the surge height and surge arrival time along the Bangladesh coast. From the analyses of cyclone landfall crossing angles at the Khulna and Chittagong coasts, it is observed that surge durations are the smallest at both the coasts when the coastline crossing angles are the smallest.

1. Introduction

Cyclonic storm surges are considered as one of the deadliest and costliest natural disasters and they are sometimes referred as “the sea’s greatest killers” [1]. Recent experiences of Hurricane Harvey and Hurricane Irma genuinely validate such a statement. Many of the coastal zones around the world, including megacities, are vulnerable to the impacts of accelerated global sea-level rise and other coastal implications of climate change, such as changing storm frequency [2]. In addition, those areas located in deltas are susceptible to natural subsidence, which can be aggravated by anthropogenic activities [3]. Number of fatalities and property damage caused by a cyclonic storm surge event are not only related to category of cyclone or height of abnormal surge waves. The socioeconomic characteristics of coastal residents, population density, cyclone warning system, location and number of cyclone shelters, livestock shelters may also significantly contribute to the vulnerability of the residents to cyclones [4].
Disasters due to cyclonic storm surges that form in the Bay of Bengal are a great concern for Bangladesh. Although only 5–6% of the global total cyclones form in the Bay of Bengal, they account for about 80–90% of the global loss in terms of life and property caused by cyclones [4,5]. An estimated total of 775,303 people died in the coastal and offshore islands of Bangladesh during a period of 222 years (1775–1997) due to cyclones and storm surges [6]. Deaths and destruction during the cyclones in Bangladesh are primarily attributed to abnormal surge waves [7]. The overall concave shape of the Bay of Bengal, the funnel shape of the Meghna Estuary, the large continental shelf adjacent to the Bangladesh coastline, high tidal range, flat topography of the land area and complex coastlines with innumerable inlets from land to the Bay are the distinct physical features behind abnormal storm surges along the Bangladesh coast [4]. The reduction in the number of fatalities during Cyclone Sidr in November 2007 compared with the cyclones during 1970 and 1991 indicates a significant improvement in the storm surge resilience of Bangladesh. However, the estimated loss caused by Cyclone Sidr was 1.7 billion USD, which is the highest compared to any previous cyclones [8]. According to [9], the sea-level rise projections induced by climate change may increase the high-risk area (more than 1 m flooding) by 25% in many parts of the Bangladesh coast.
The present study focuses on the cyclone track features and tidal phase shift upon surge characteristics in the Bay of Bengal along the Bangladesh coast. This study is an extension of the earlier works by Hussain and Tajima [10]. The authors focused on the nature of surge–tide interactions at the Bay of Bengal along the Bangladesh coast using a two-dimensional nonlinear shallow water model coupled with a storm surge model. The authors showed that, due to the nonlinear interaction of surge wave and tide, during the ebb tides, the calculated total surge height of the surge–tide interaction model was higher compared to the total surge height obtained by superimposing surge height that is separately calculated with mean water level over the local tidal water level; the opposite occurs during high tide. They also established that during the low tidal water level along the coast, the speed of surge propagation is substantially slower compared with the high tidal water level due to the combined effect of shallow water depth and bottom friction. As the tidal range along the Bangladesh coast widely varies from western part (2 m) to eastern part (7 m), the extent of surge modulations also varies along the coast. The authors employed two previous cyclone events: Cyclone 1991 at the Chittagong coast and Cyclone Sidr at the Khulna coast to investigate the impact of tide upon surge characteristics: surge height, surge arrival time and surge duration. The present study aims to focus on the impact of three cyclone track features: cyclone translation speed, cyclone path and cyclone landfall crossing angle, in combination with tidal phase shift upon surge characteristics. Figure 1 shows the coastal zone of Bangladesh and the two previous cyclone tracks: Cyclone 1991 and Cyclone Sidr, which are investigated in this paper.
The storm surge problem in the Bay of Bengal has generated the interest of many researchers for the past few decades. Flather [11] suggested that, for Cyclone 1991, the timing of cyclone landfall and its coincidence with high tide determined the worst affected area by flooding. As-Salek and Yasuda [12,13] and As-Salek [14] focused on different storm surge related issues at the Meghna Estuary primarily regarding the Cyclone of 1991. The tide–surge interaction in the Meghna Estuary was investigated by As-Salek and Yasuda [15], where the authors concluded that (i) the peak surge can develop in any tidal phase, and the tidal phase that develops near the time of local peak tide travels at the highest rate; (ii) the cyclone that makes landfall before the arrival of the tidal peak produces a higher and shorter-duration surge compared with the cyclone that makes landfall after the tidal peak.
According to Kim et al. [16], the conventional method (e.g., superposition of surge over tide, which are both independently calculated) has the possibility of overestimating the total water level. Thus, the nonlinear interaction between tide and surge may become important for determining the highest surge height. Several studies [17,18,19] investigated the tide–surge interaction in the southern North Sea and the River Thames. The authors showed that the pattern of interaction causes positive surge peaks to avoid times of high tidal water; however, they are most likely to occur during the rising tide. However, studies by Murty et al. [20], Katsura et al. [21] and As-Salek and Yasuda [15] suggest that the surge peak in the Meghna Estuary can occur even at the time of high tidal water.
Rego and Li [22] made a systematic investigation of storm surge along the coast of Louisiana by using the fully nonlinear Finite-Volume Coastal Ocean Model (FVCOM). The authors focused on the impact of wind intensity, radius of maximum wind (RMW), tidal timing, forward speed and inflow angle upon flooded volume and surge height. The study showed that slower moving storm produces lower peak surges that travel far inland, whereas a faster hurricane moves swiftly across the shoreline, generating higher surges that flood a narrower section of the coast. They concluded that a cyclone’s forward speed is a significant parameter and varying a storm’s forward motion may account for variations in flooded volumes equivalent to an upgrade or downgrade of about 1 category on the Saffir–Simpson scale, which represents a larger impact than tidal timing, amplitude, or wind inflow angle.
Thus, an in-depth understanding of the complex interactions among cyclone intensity, which are represented by the lowest pressure and maximum wind speed, forward movement of a cyclone, storm size, bathymetry, coastline shape and tidal phase, is necessary because these interactions produce varying storm surge height and flooding duration for any storm [23,24,25,26,27].

2. The Numerical Model and Its Applicability

The details of the storm surge computation model being employed in the present paper and its validity for the present study area can be found in Hussain and Tajima [10], Tajima et al. [8] and Shibayama et al. [28]. Among these, Tajima et al. [8] and Shibayama et al. [28] applied inundation data collected after Cyclone Sidr of 2007 to validate the numerical model. On the other hand, Hussain and Tajima [10] used the observed water level data at Hiron Point and Chittagong during Cyclone Sidr obtained online from the University of Hawaii Sea Level Center (UHSLC) to validate the model. These studies have confirmed the reasonable hindcast skills of the model for reproducing peak surge heights along the Bangladesh coast. Apart from these, Tajima et al. [29] employed the same model for Typhoon Haiyan at the Philippines and obtained good agreement between observed [30] and computed values of peak surge heights near San Pedro Bay during Typhoon Haiyan.
Long-term tidal water level measurement data are scarce in the Meghna Estuary and at the Northern Bay of Bengal area. Thus, the offshore ocean tidal water level at the southern boundary of the computation domain has been obtained using the NAO.99b model [31]. This model calculates the pure ocean tide with respect to the ocean floor based on five years of TOPEX/POSEIDON altimetry data and the long-period ocean tide map of Takanezawa et al. [32]. This model represents short-period tide values from 16 major constituents and 33 minor constituents and long-period tide values from seven constituents. It has a spatial resolution of 0.5° × 0.5°. After obtaining tidal water levels at the southern boundary, subsequent tidal propagation towards the Bangladesh coast is calculated using a two-dimensional horizontal (2DH) tidal model that is based on nonlinear shallow water equations. The 2DH model employs an alternating direction implicit (ADI) scheme for computational stability and adopts a spherical coordinate system to ensure accuracy during wide-area calculations. This model has a spatial resolution of 30 arc seconds, and the time step of computation is 10 s.
For storm surge computations, the time-varying wind and pressure field is obtained using extensively employed simple parametric typhoon models. A similar set of models has been applied by Tajima et al. [29] and by Bricker et al. [33] and Kim et al. [34] in the case of Typhoon Haiyan. Several studies utilize a numerical weather prediction model e.g., WRF (Weather Research and Forecasting) [35] or CReSS (Cloud Resolving Storm Simulator) [36] for the direct computation of the wind and pressure field during a cyclone event [37] instead of using parametric equations. Storm surge tracks have been obtained from the archive of Joint Typhoon Warning Center (JTWC) best track data. In the present cyclone model, pressure fields are estimated based on Myer’s [38] model. The time-varying radius of the maximum wind (RMW) is obtained as a function of central pressure following the relationship based on previous typhoon data [39]. Next, the estimated pressure field is applied to the “super gradient wind” model of Mitsuya and Fujii [40] to calculate the wind field. Spatial distributions of the wind-induced shear stress are obtained as functions of the wind velocity and the air–sea drag coefficient estimated as a function of wind speed using Oey et al.’s [41] formula. This formula ensures avoiding overestimation of wind-induced shear stress due to very high wind velocity [42]. The maximum value of the estimated friction velocity is set to 2.2 m/s [43].
General Bathymetric Chart of the Oceans (GEBCO) 30 arc-second free source data [44] is employed to obtain the bathymetry of the Meghna Estuary. It has reasonably acceptable resolution and is considered to be comparatively new (first released in January 2009 and updated in October 2010) because the measured bathymetry data in the Meghna Estuary date to 1997. The present model utilizes a modified and updated GEBCO data where the coastline inaccuracies are rectified by Taguchi et al. [45] using Advanced Land Observing Satellite’s Phased Array L-band Synthetic Aperture Radar (ALOS-PALSAR) satellite images from April 2011. The most dynamic parts of the Meghna Estuary, from the east coast of Hatiya Island to the Sandwip Channel are covered by these satellite images. The computation domain along with Bathymetry of northern Bay of Bengal is shown in Figure 2.
The present storm surge model does not consider the interaction of wave and current as the grid resolution of the model is not fine enough to appropriately represent the nearshore breaking phenomena. However, the influence of wave radiation stress on the increase in surge water level is only about 4% of the entire surge elevation [34]. The contribution of wave setup in the target area is very weak; thus, this setup is not included in this study.

3. Numerical Experiment Conditions

As previously mentioned, two past cyclonic events are considered in this study: Cyclone 1991 and Cyclone Sidr. A summary of the cyclone parameters of these two base cases are provided in Table 1. In addition to the base cases, storm surges have been calculated at different phases of an entire tidal cycle at one-hour intervals. Numerical experiments are conducted by shifting the input values of the central pressure of the cyclone track over a duration of 13 h at one-hour intervals to cover different phases of an entire tidal cycle. At each tidal phase, the storm surge has been simultaneously calculated with tide to ensure the possible interactions between storm surge and tide, which are termed “surge–tide interaction runs”. The pure astronomical tide (termed “tide only runs”) and pure surge without tidal effect (termed “meteorology only runs”) are also calculated. The procedure to investigate the surge–tide interaction phenomena is similar to the procedure that was previously applied by Johns et al. [46] at the Bay of Bengal along the Orissa coast.
Faster and slower tracks are generated compared to the base cases to find out the impact of cyclone translation speed upon surge characteristics. Here, for the base case, the track of only Cyclone Sidr has been considered. The tracks being investigated are termed as “base”, “faster” and “slower” cases. To investigate the combined effect of tide and cyclone translation speed, the surge–tide interaction model was run for each tidal phase at 1 h interval for the three-cyclone translation speed of the tracks.
To investigate the impact of cyclone path or cyclone landfall location Cyclone Sidr is taken as a base case, which hit the Khulna coast during November 2007. Landfall location of this cyclone is varied by creating six more parallel cyclone tracks that would hit at different locations along the Bangladesh coast. All of these cyclones have the same cyclonic characteristics (track speed, central pressure drop, wind speed, radius of maximum wind, etc.) as Cyclone Sidr. In total, seven cyclone tracks have been employed including the base case, with four tracks to the right side of Cyclone Sidr covering the southeast coast including Chittagong and the two at the left side covering the southwest coast including Khulna. All the tracks are shown in the upper panel of Figure 3.
To investigate the impact of coastline crossing angle, two distinct cyclones (Cyclone 1991 and Cyclone Sidr) are chosen as base cases whose landfall were in the Chittagong coast and the Khulna coast, respectively. For the Chittagong coast in addition to the 1991 cyclone (termed as “Track C2”), two more cyclone tracks: Cyclone Roanu of 2016 (termed as “Track C1”) and Cyclone 1975 (termed as “Track C3”) are employed. For the Khulna coast along with Cyclone Sidr (termed as “Track K2”), tracks of Cyclone 1988 (termed as “Track K3”) and Cyclone 1998 (termed as “Track K1”) are used to investigate the impact of coastline crossing angle. The additional cyclone tracks are chosen in a manner to ensure that the tracks created larger and smaller coastline crossing angles at the Chittagong and Khulna coasts as compared to the base cyclone tracks. Thus, three total tracks for the Khulna coast and three tracks at the Chittagong coast have been tested. To keep the results comparable, the cyclone characteristics were kept identical for each coast. All the six tracks, three each at the Khulna and Chittagong coasts, are shown in the lower panel of Figure 3.

4. Results and Discussion

4.1. Impact of Cyclone Translation Speed upon Surge Characteristics

For a cyclone of given intensity, there is a minimum translation speed above which it can sustain or rise in intensity and below which it will begin to wane. An increase in cyclone forward speed may have two effects. First, the resultant wind speed at the right half of the cyclone becomes higher, so the wind forcing is larger to create higher surge height; second, as the cyclone moves faster, it has less time to force the water resulting in lower surge height. These two effects are opposite to each other, which is demonstrated by Rego and Li [22]. According to the authors, cyclone forward movement speed is an important parameter, which was previously overlooked. The authors showed that in case of Hurricane Rita in 2005 at the Gulf of Mexico, increase of cyclone forward speed increases peak surge height and decreases surge volume. In addition, resonance may occur for certain forward movement speed at certain locations. Zhang [47] numerically investigated the combined effect of cyclone forward speed and approach angle for an idealized basin and showed that generation of Kelvin waves may become an important phenomena for surge height at the coast.
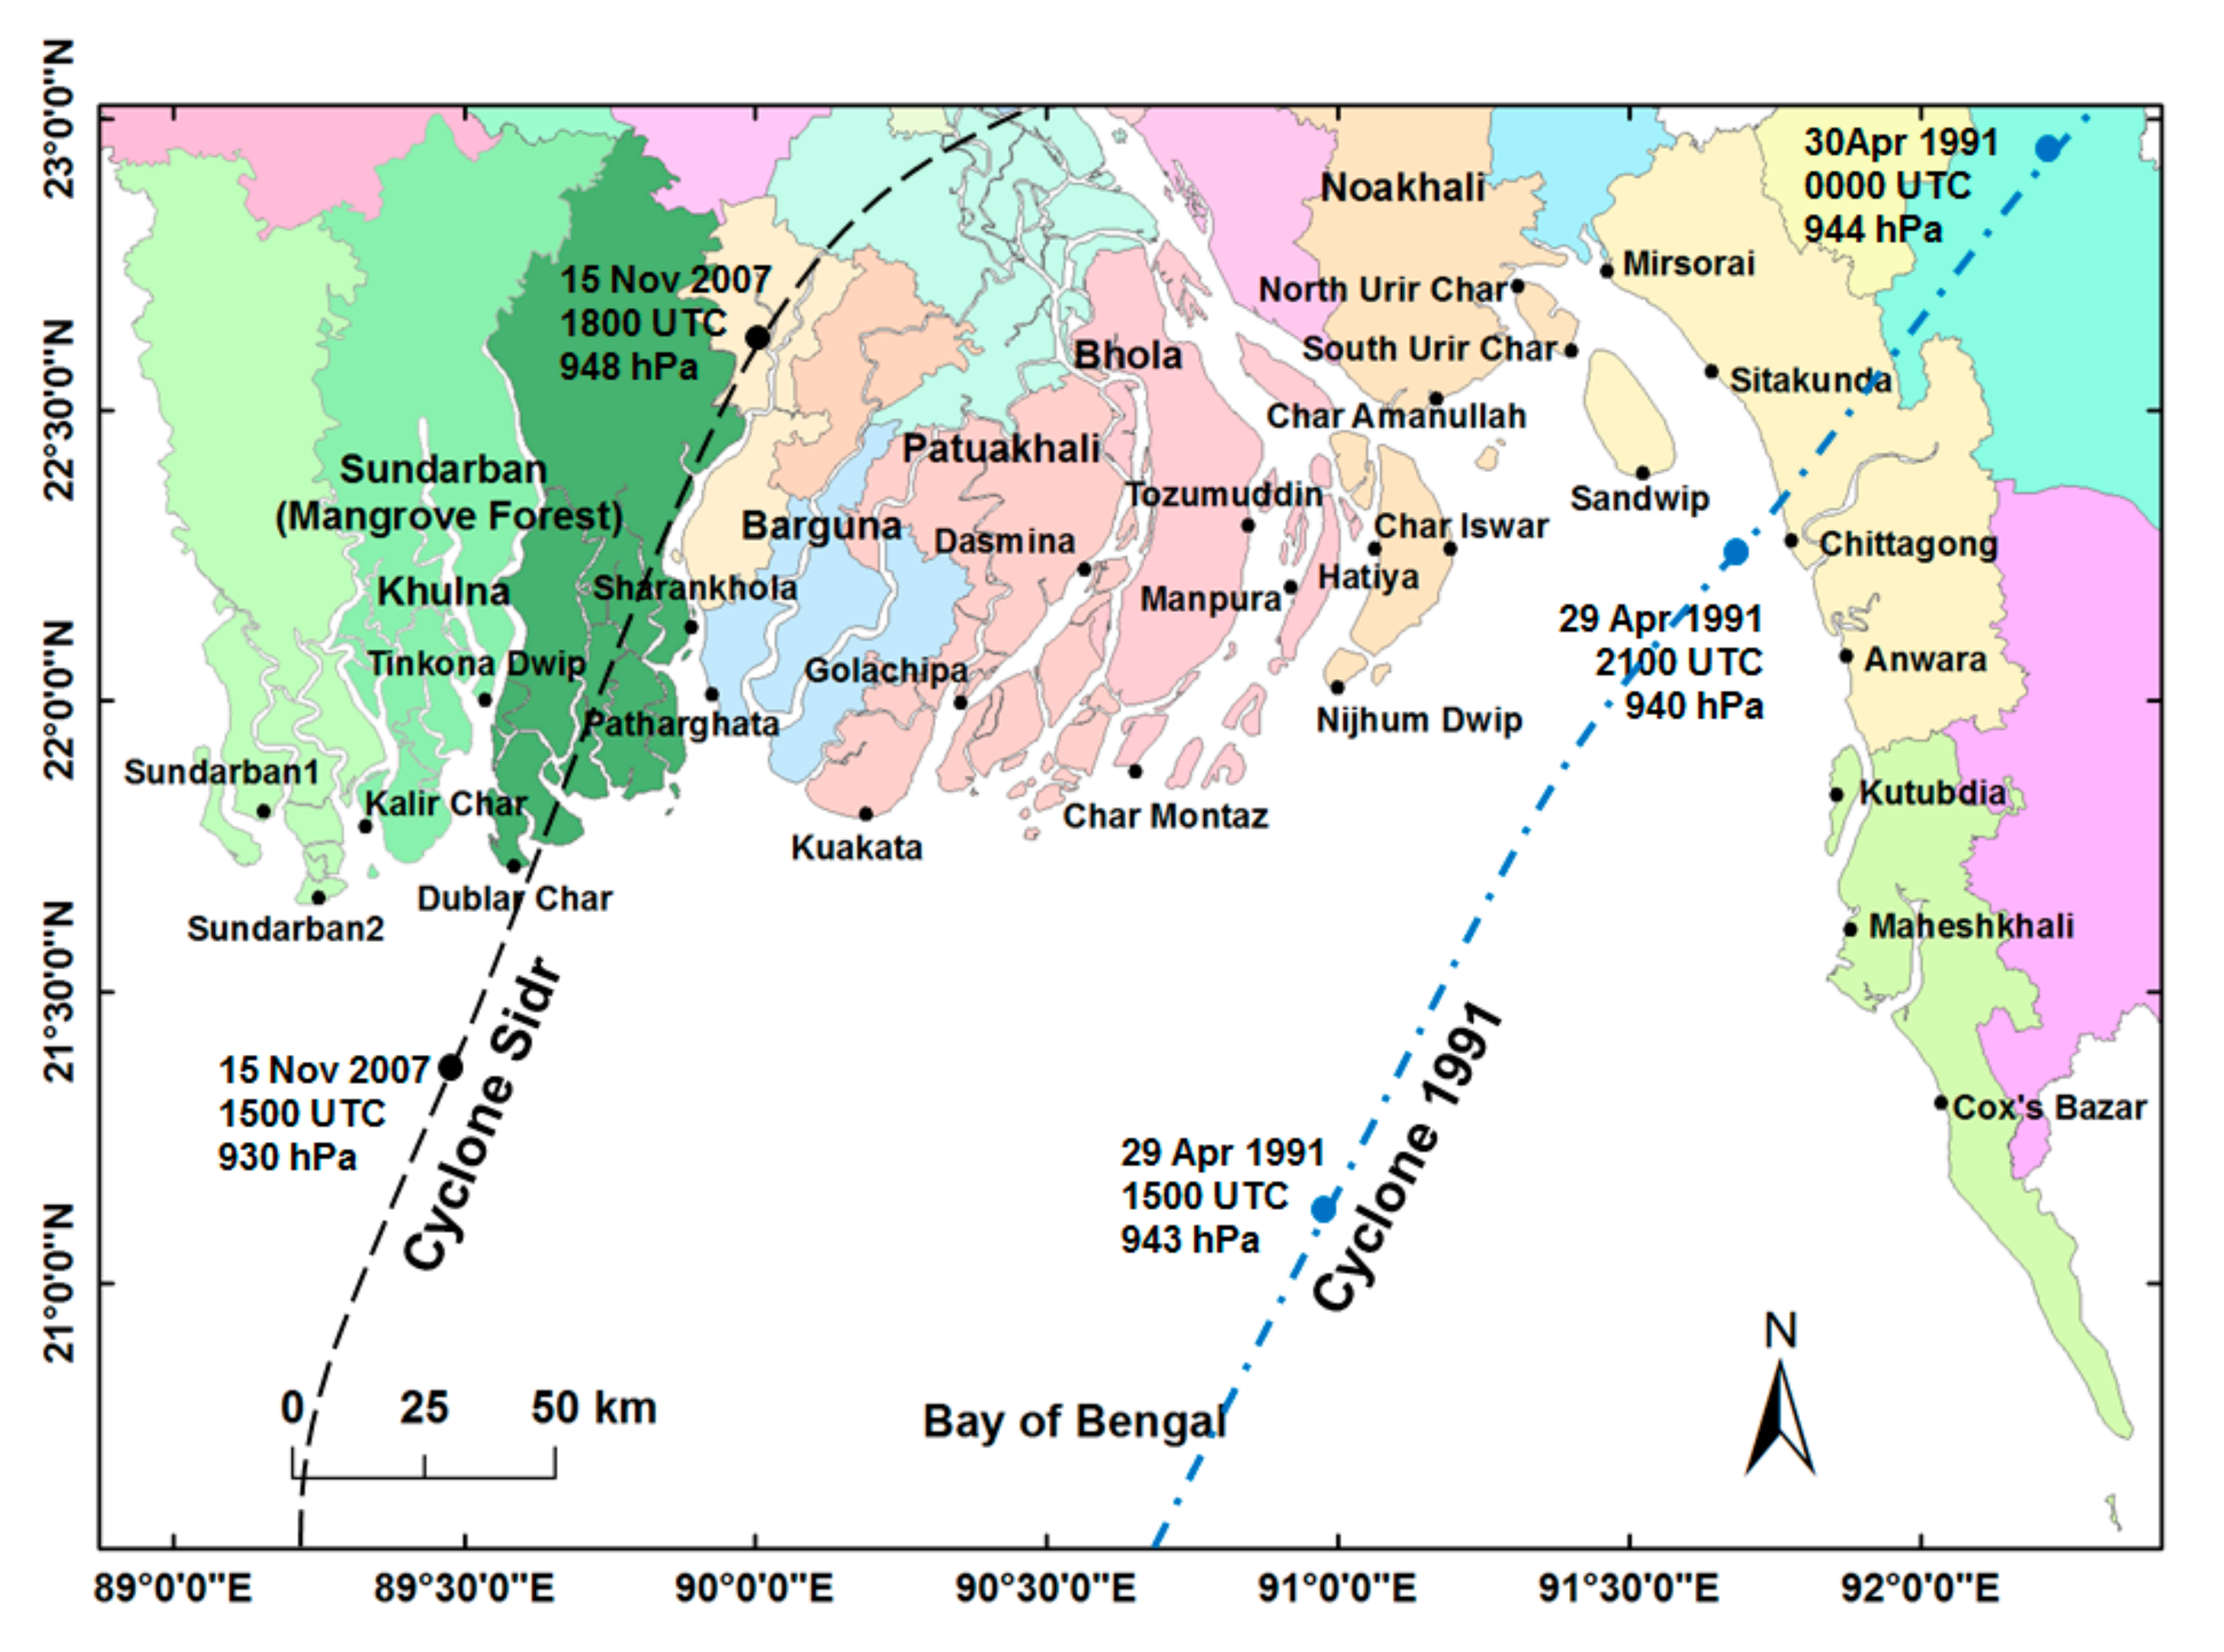
In the present study, the track of Cyclone Sidr has been considered as a base case with original forward movement speed, which was 26.3 km/h. (16.4 miles/h.). Two other hypothetical cyclone tracks were generated, which followed exactly the same path as Cyclone Sidr but only changed the forward movement speed: one slower than Cyclone Sidr and the other faster than the same. The forward movement speed of the three cyclones being analyzed are summarized in Table 2.
It can be noted that average forward movement speed of tropical cyclones are 12 miles/h, and very high values may be uncommon (or even unrealistic) in tropical areas. However, cyclones in north and mid-latitudes may reach a very high forward speed of 67 miles/h, in the case of cyclones during the falls of 1999 and 2000 [48].

4.1.1. Comparison of Computed Wind Speed and Surge Heights

All of the numerical experiment cases discussed in this sub-section are “surge-only” cases. Figure 4 shows the computed surge profiles and magnitude of wind speeds for “base”, “faster” and “slower” cyclone translation speeds at Patharghata and Char Montaz, which were the landfall location and a location about 70 km away from the landfall at the right side of the cyclone track, respectively. Separate sets of model runs are performed neglecting the translation speed of cyclone in wind speed computation in the model to extract the impact of cyclone translation speed upon computed wind speeds and surge heights. Computations including translation speed are represented by firm lines and those excluding translation speed are represented by dotted lines (marked by “cc0” in Figure 4).
It is to be noted that, according to Hussain and Tajima [10], estimated radius of maximum wind (RMW) for Cyclone Sidr was 73–125 km. Thus, Char Montaz is located within the estimated RMW of Cyclone Sidr. At first, the impact of cyclone translation speed upon computed wind speed is discussed.
From the upper panel of the figure, it is evident that as the “eye” of the cyclone passes very close to Patharghata. The model is able to capture two peaks of wind speed, presumably one before and one after the cyclone center passes over that location. In addition, it may be noticed that the time difference between the two peaks is shorter for faster cyclone translation speed. The magnitudes of first peaks for “faster”, “base” and “slower” cases are almost equal and first peaks are also nearly the same when the computations included and excluded cyclone translation speed. However, the magnitude of the second peak show a drastic reduction for the “slower” case when cyclone translation speed is included and also for all three cases the magnitude of the second peaks are much smaller when cyclone translation speed is neglected (in wind speed computation). It can be further noticed that, for the “faster” case, the second peak of wind speed is slightly larger than the first peak, while, for the “base” case, it is slightly smaller and, for the “slower” case, it is much smaller in magnitude. This is because, for the “faster” case, the first peak value (10.69 m/s) is enhanced by the high value of cyclone translation speed (53.8 km/h, i.e., 14.9 m/s) to a larger value in the second wind speed peak (10.93 m/s). On the other hand, for the “base” case, the computed first peak value (10.92 m/s) is lessened by the moderate value of cyclone translation speed (26.3 km/h i.e., 7.3 m/s) to a smaller value in the second wind speed peak (10.0 m/s) and for the “slower” case first peak (10.75 m/s) is further reduced by the very small cyclone translation speed (17.5 km/h i.e., 4.9 m/s) to much smaller value in the second peak (2.24 m/s). The impact of excluding the cyclone translation speed in wind speed calculation can be clearly observed from drastic reduction of second peak for all the three cases. It can also be noticed that, when cyclone forward movement is reduced, the influence zone of cyclone induced wind is enlarged.
From the lower panel of Figure 4, the computed wind speed at Char Montaz shows only one peak for each case as the location is away from the cyclone center. Here, the magnitude of wind speed gradually decreases with the reduction of cyclone translation speed for the cases when translation wind speed is included in computation. This is due to the decrease of resultant wind speed by the slowness of cyclone translation speed. On the other hand, when translation wind speed is neglected, the maximum wind speed is almost the same (3.02 m/s for “faster”, 3.04 m/s for “base” and 3.03 m/s for “slower” case) for all cyclone translation speeds. It is evident that, also at Char Montaz, the reduction in cyclone translation speed increases the duration of cyclone induced wind.
Next, the resulting surge profiles from the “faster”, “base” and “slower” cases at Patharghata and Char Montaz are discussed. From the upper panel of the same figure (Figure 4), it is evident that, at the landfall location, Patharghata, with the inclusion of translation wind, slightly smaller surge height (10.12 m) is generated by the “faster” case while the “base” case and the “slower” case generate almost the same surge height (10.86 m and 10.76 m, respectively). On the other hand, when translation wind is neglected in the computation, surge height is much smaller (6.1 m) for the “faster” case, which increases for the “base” case (9.1 m) and for the “slower” case (9.3 m). Thus, at Patharghata, the landfall location, for both inclusion and exclusion of cyclone translation speeds, lowest surge heights are generated by the “faster” cases, which is due to the less time attained by the wind force to generate surge heights. However, for the “base” and “slower” cases, wind forces have sufficient time to create larger surge heights when they hit the coast. In addition, it is evident that surge duration (or surge volume) considerably increases with the reduction of translation speed, where the “faster” case shows a sharp rise in water level, which becomes gradual for the “base” case and “slower” case.
From the lower panel of the same figure (Figure 4) at Char Montaz, it is found that, when cyclone translation speed is included in computation, the reduction of cyclone forward movement speed gradually brings down the magnitude of wind speed, but maximum surge heights do not follow the same trend. In fact, maximum surge height is attained for the “base” case (4.4 m), closely followed by the “slower” case (4.1 m), and it is comparatively smaller for the “faster” case (3.8 m). The computed wind speeds at Char Montaz without the translation wind are almost the same for the three cases (3.02–3.03 m/s), but the maximum surge height gradually increases from “faster” case (2.7 m) to “base” case (3.4 m) and from “base” case to “slower” case (3.5 m). Thus, at Char Montaz, the location away from landfall but within the RMW, lowest surge heights are attained by the “faster” cases for both inclusion and exclusion of cyclone translation speed due to the lesser time attained by the wind force to generate surge heights. The total surge volume or surge duration also gradually increases from “faster” case to “base” case and from “base” case to “slower” case.

4.1.2. Comparison of Surge Arrival Times

In this sub-section, all of the cases considered are “surge–tide interaction” cases. Near the landfall locations, surge waves are directly forced by the strong cyclonic wind and, as a result, surge arrival times are insignificantly influenced by tidal phase [10]. On the other hand, at locations away from landfall, especially outside the RMW, surge waves tend to propagate as a long wave and maximum surge tends to accumulate towards the high water areas, which is referred to as “surge clustering”. Such phenomena was also observed by Horsburgh and Wilson [19] and Wolf [49] in the case of North Sea and later by Hussain and Tajima [10] at Moheshkhali for Cyclone 1991 at Sitakunda and Chittagong for Cyclone Sidr of 2007. In the present paper, the combined effect of cyclone translation speed and tidal phase upon surge arrival time at Sitakunda, which is away from the landfall location and also outside the RMW, has been investigated in case of Cyclone Sidr. As Cyclone Sidr made landfall on the western part of the Bangladesh coast, a large part of the coastline remained on the right side of the track, so this cyclone is selected to analyze the surge propagation time at different parts of the Bangladesh coast after landfall. 
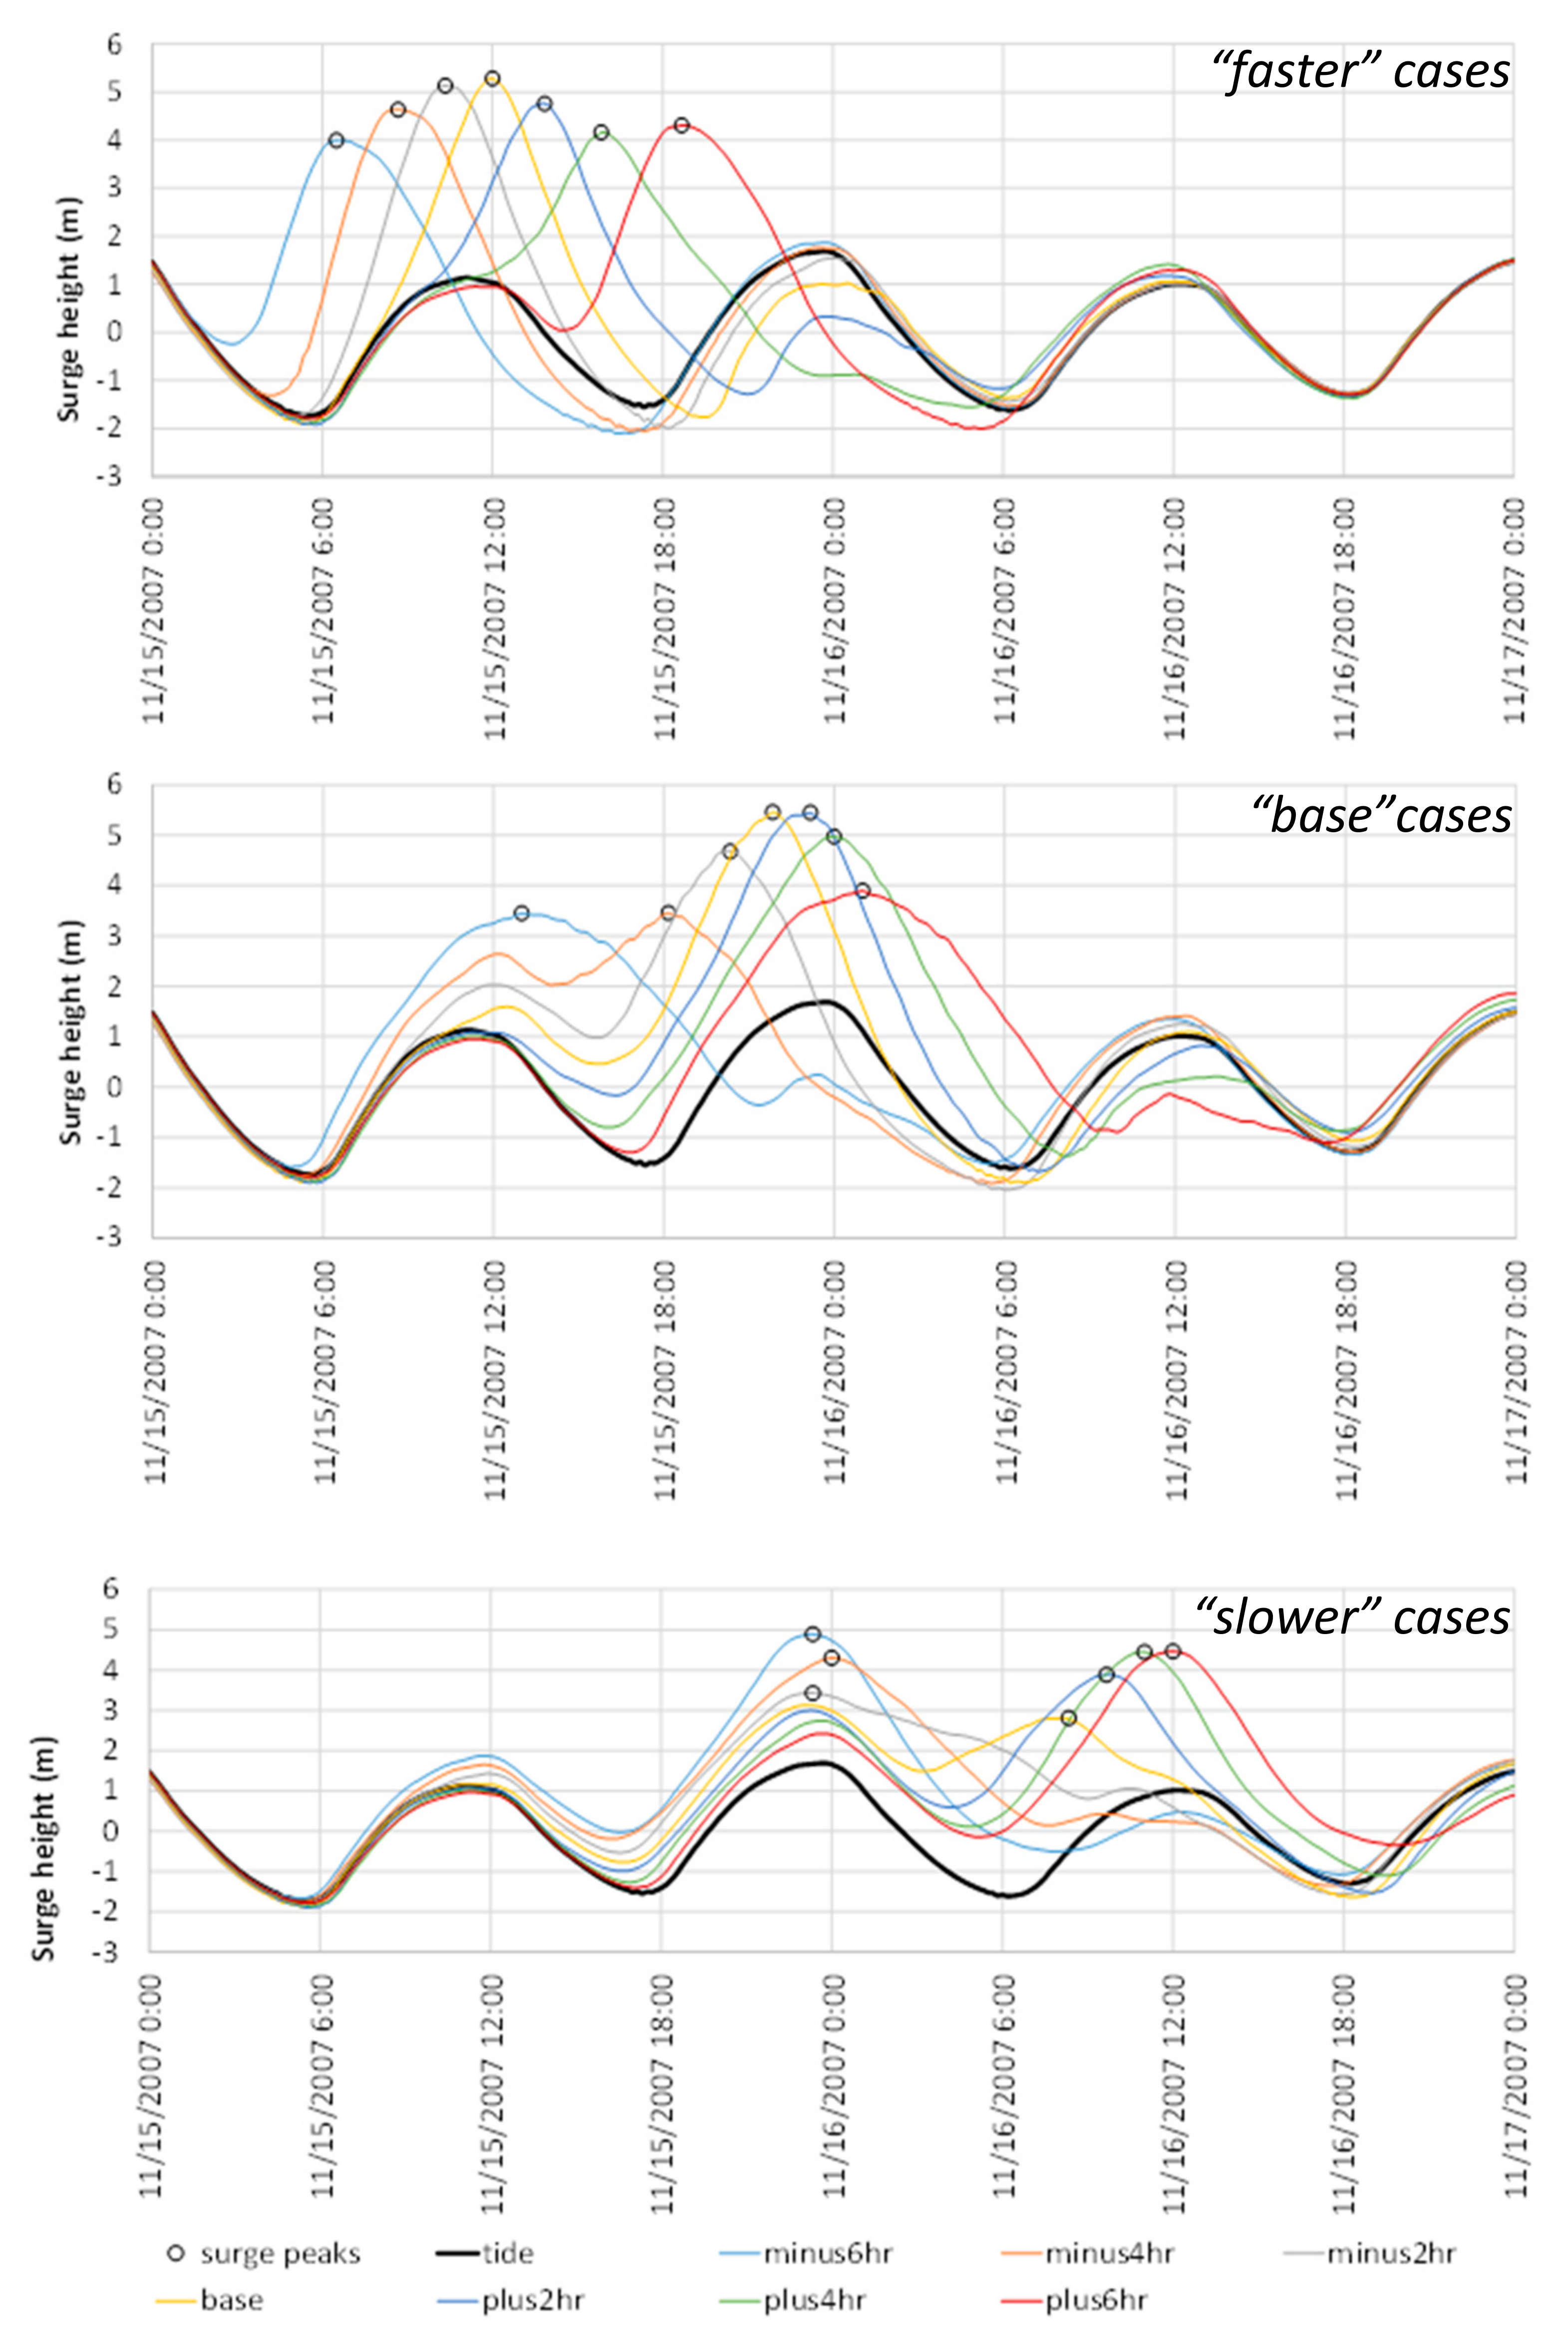
Figure 5 shows computed tidal water levels, surge profiles and surge peaks at different tidal phases at Sitakunda for “faster” case (top panel), “base” case (middle panel) and “slower” case (bottom panel). Storm surges that are generated in every 2 h interval are plotted in Figure 5. It is clearly evident from the figure that, for the faster translation speed of the cyclone, peak surges occur almost equally spaced at 2 h intervals, the same as the shift of storm surge generation. In other words, when cyclone translation speed is high, surge arrival times are not affected by tidal phase shift. For the “base” case (Figure 5 (middle panel)), clearly surge peaks do not occur equally spaced and surge clustering is evident during the rising and high water periods. Again, for the “slower” case (Figure 5 (bottom panel)), surge peaks apparently occur only around the high water periods and surge clustering phenomena tend to be stronger in this case. Thus, from these three figures, it is clearly evident that surge arrival times are more and more affected by tidal phase when cyclone translation speed is reduced. In addition, for reduced cyclone translation speeds, the maximum surges tend to occur around rising and high water periods at locations that are situated away from the landfall location.
Next, for the three cyclone translation speed cases, the surge clustering phenomena is compared between two locations inside and outside the RMW. Two locations along the Bangladesh coast are selected: one inside the RMW but away from landfall location—Char Montaz—and the other outside the RMW—Sitakunda—to analyze the total surge height and delay in surge arrival at different tidal phases during Cyclone Sidr. The term delay refers to the time required by the maximum surge to reach other parts of the Bangladesh coast after the landfall time; so it is the surge propagation time from the landfall location after the landfall time. The tidal phases from a 6 h lead to a 6 h lag for the base case of the Cyclone Sidr have been included in the analysis. Two locations along the Bangladesh coast are selected: one inside the RMW but away from landfall location—Char Montaz—and the other outside the RMW—Sitakunda—to analyze the total surge height and delay in surge arrival at different tidal phases during Cyclone Sidr. The tidal phases from a 6 h lead to a 6 h lag for the base case of the Cyclone Sidr have been included in the analysis.
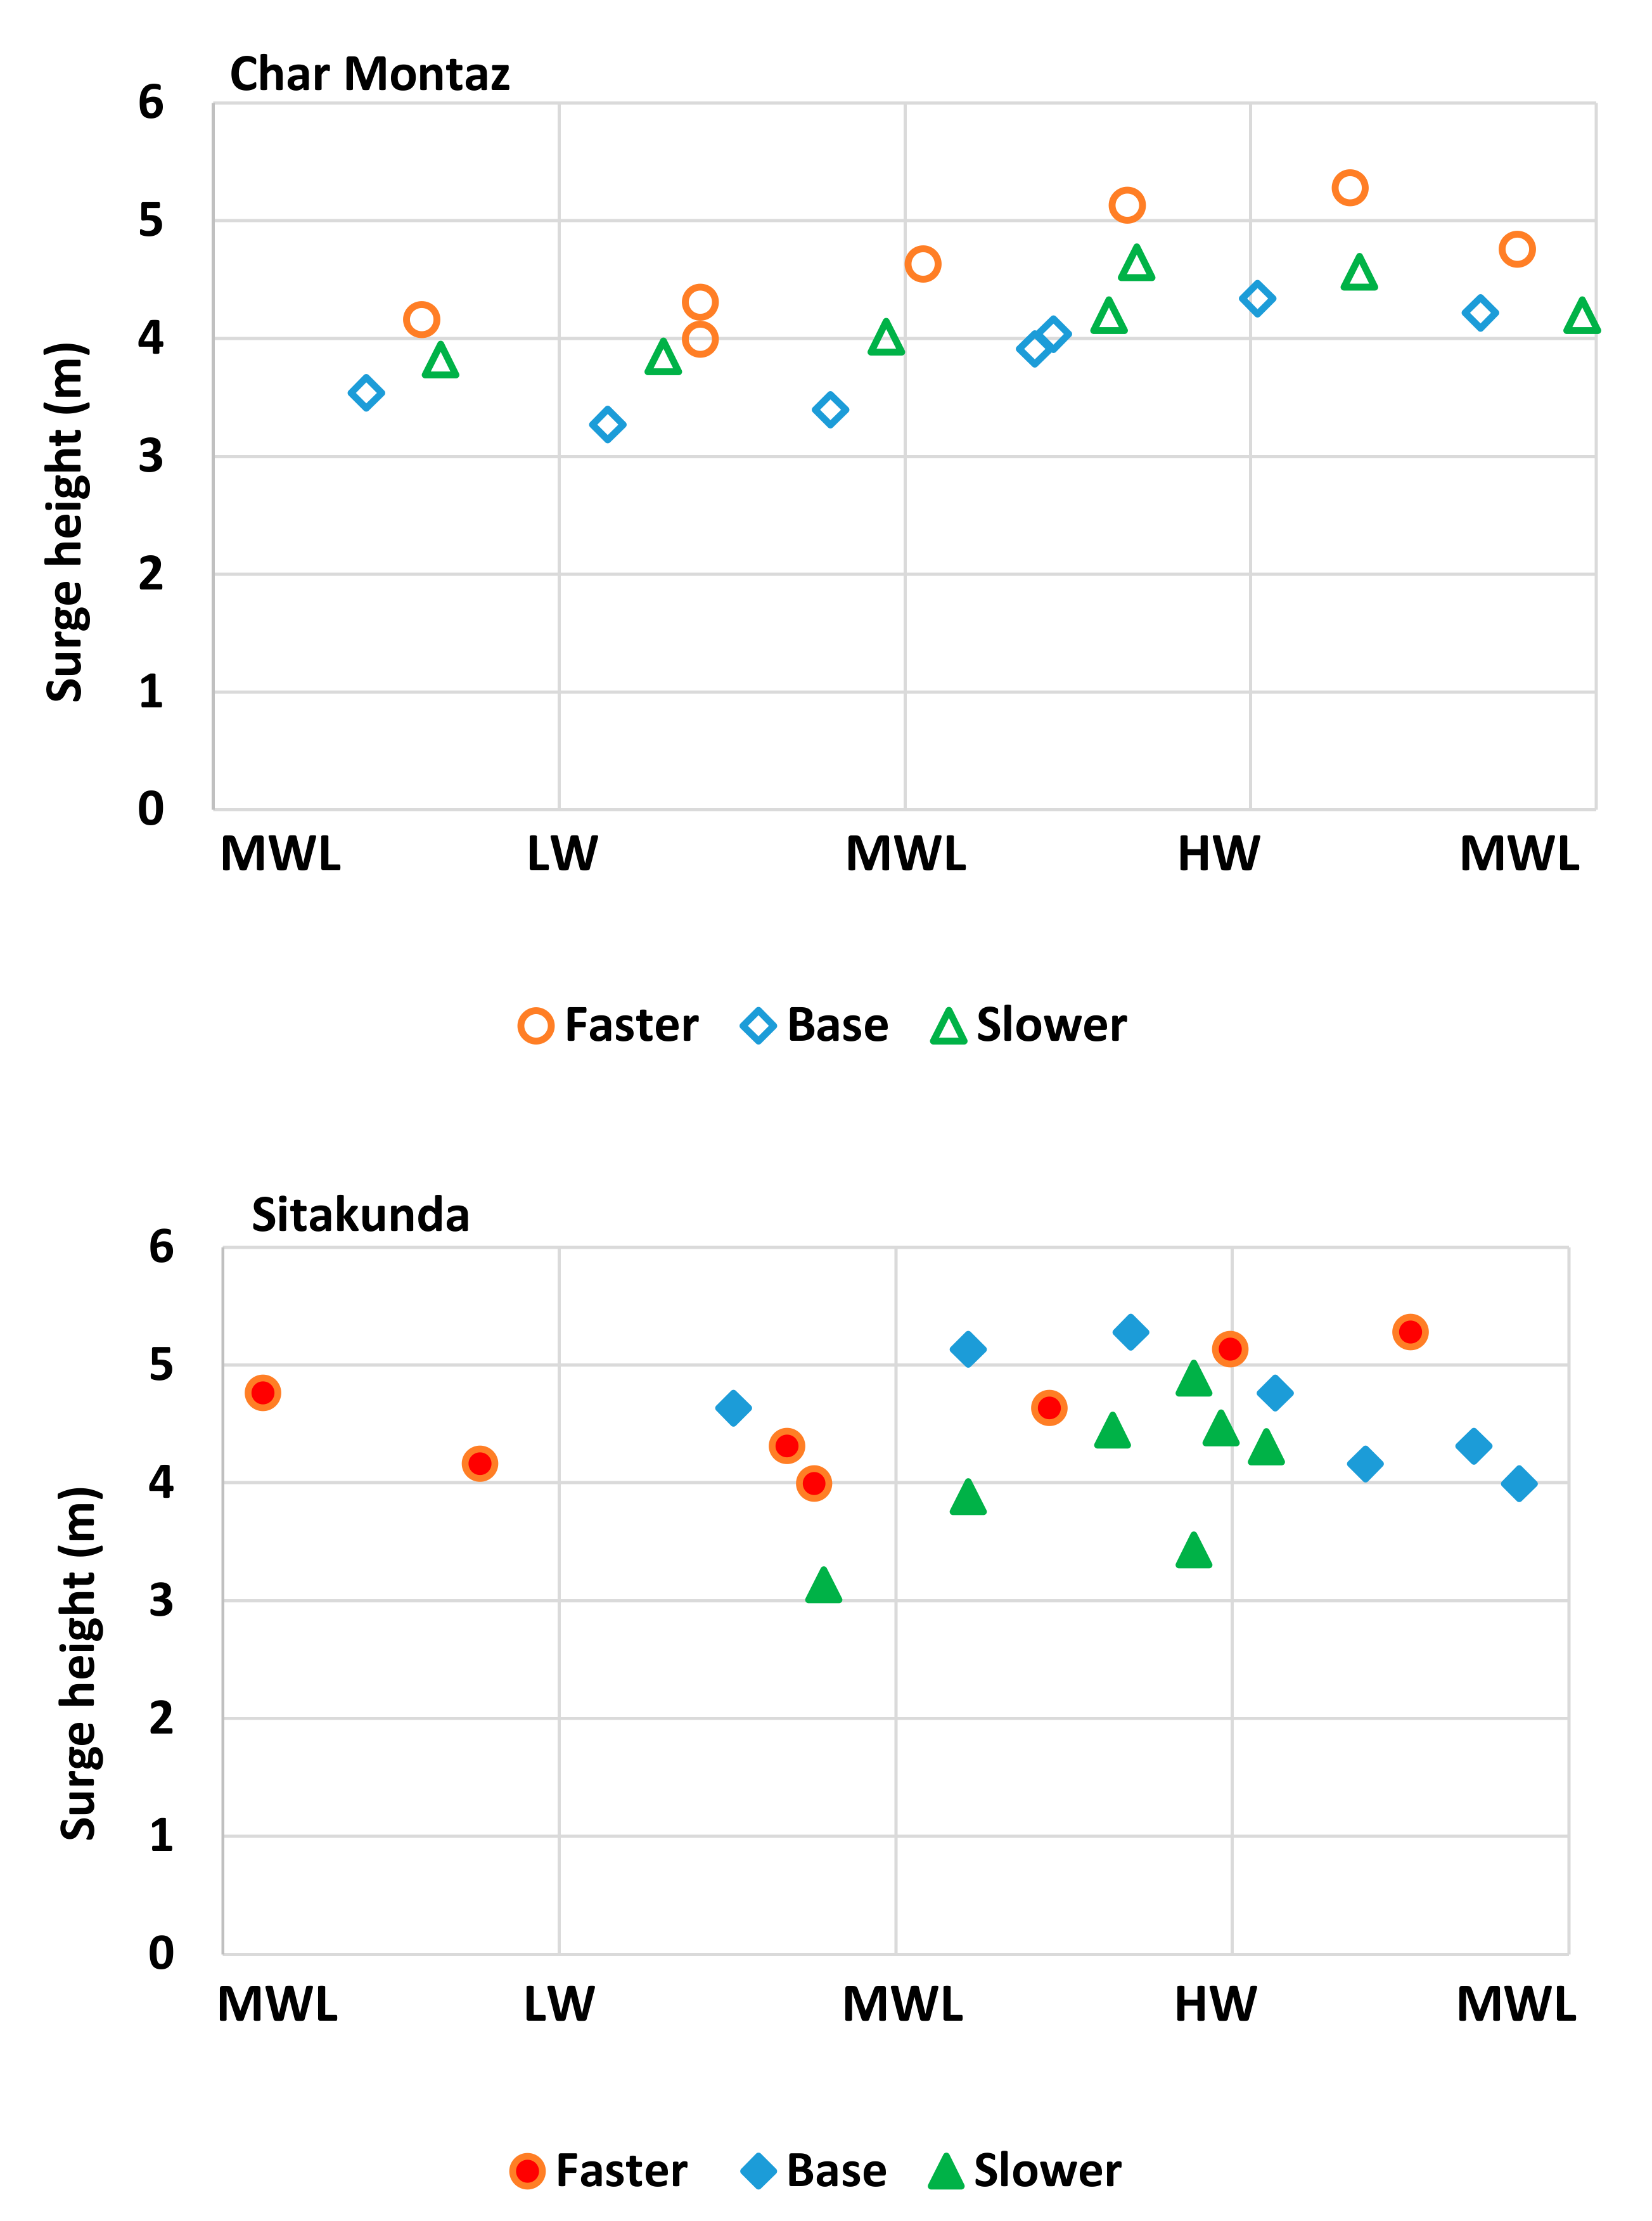
Figure 6 shows the total surge height and the tidal phases when maximum surges arrive at Char Montaz (upper panel) and Sitakunda (lower panel) along the Bangladesh coast. For clarity, storm surges that are generated in every 2 h interval are plotted in Figure 6. Tidal asymmetry has been considered in calculating the tidal phase when the maximum surges arrive at the coast. From the upper panel of the figure, it is clearly apparent that, at Char Montaz, for all three of the cyclone translation speed cases, maximum surge heights are well-distributed over the entire tidal cycle and maximum surge heights occur at high water periods for all three track speed cases. On the other hand, from the lower panel of the figure, at Sitakunda, maximum surges appear over the entire tidal cyclone only for the “faster” case. For the “base” and “slower” cases, maximum surges tend to accumulate towards the rising and high-water periods; in other words, surge-clustering occurs. It can be noticed that maximum surge heights for three different cyclone translation speeds at Char Montaz and at Sitakunda are quite close to each other, despite the fact that Char Montaz is located closer to the landfall location than Sitakunda. This is primarily attributed to the funneling effect at the northeastern part of the Meghna Estuary, which amplifies the surge heights at Sitakunda.
In the next figure, Figure 7, the delay in total surge arrival and the tidal phases when maximum surges arrive at Char Montaz (upper panel) and Sitakunda (lower panel) along the Bangladesh coast are shown. For obvious reasons, the timing of delay in surge arrival in the tidal cycle matches with the previous figure (Figure 6) for the corresponding upper and lower panels. Clearly, the maximum surges are much delayed for Sitakunda (Figure 7 (lower panel)) compared to Char Montaz (Figure 7 (upper panel)), as Char Montaz is located closer to the landfall location. It can be noted that, at Char Montaz, delay in surge arrival after landfall is higher for the “base” case compared to “slower” case. This may be due to the slightly larger surge wave height obtained by the “base” case compared to the “slower” case at Char Montaz as shown in the lower panel of Figure 4. As a result, the higher surge wave of “base” case is more delayed compared to the lower surge wave of “slower” case by bottom friction effects at Char Montaz. Next, at Sitakunda, from the lower panel of Figure 7, cyclones with faster translation speed arrive at the coast earlier and vice versa. Surge clustering phenomena does not appear for the “faster” case but becomes dominant as the translation speed reduces. For the “slower” case, maximum delay in surge arrival occurs and the surge peaks only tend to appear during rising and high water periods. In addition, at Sitakunda, all the maximum delay occurs near the mean water level of rising tide, whereas the delay in arrival time quickly decreases near the high water phase of the tidal cycle due to larger water depths, which enable a faster phase velocity of the surge wave. Zero delay in surge arrival for “slower” case, especially around the high water tidal phase, represents the rise in local tidal water level, which is higher than the actual surge wave when it arrives at the Sitakunda coast.

4.1.3. Comparison of External Surge for Surge Only Cases

According to Horsburgh and Wilson [19], the surge wave may travel as a long wave to other parts of the coast, and this long wave is termed as “external surge”. As shown by Hussain and Tajima [10] for the Bangladesh coast, the height of external surge is significantly dependent on two factors: tidal phase and local wind field of the cyclone at the particular location. In this section, the impact of cyclone translation speed upon the height of external surge has been examined. To extract the pure impact of translation speed and local wind upon the travelling external surge the following cases are “surge only” runs, which obviously include the cyclone translation speeds during wind speed calculations.
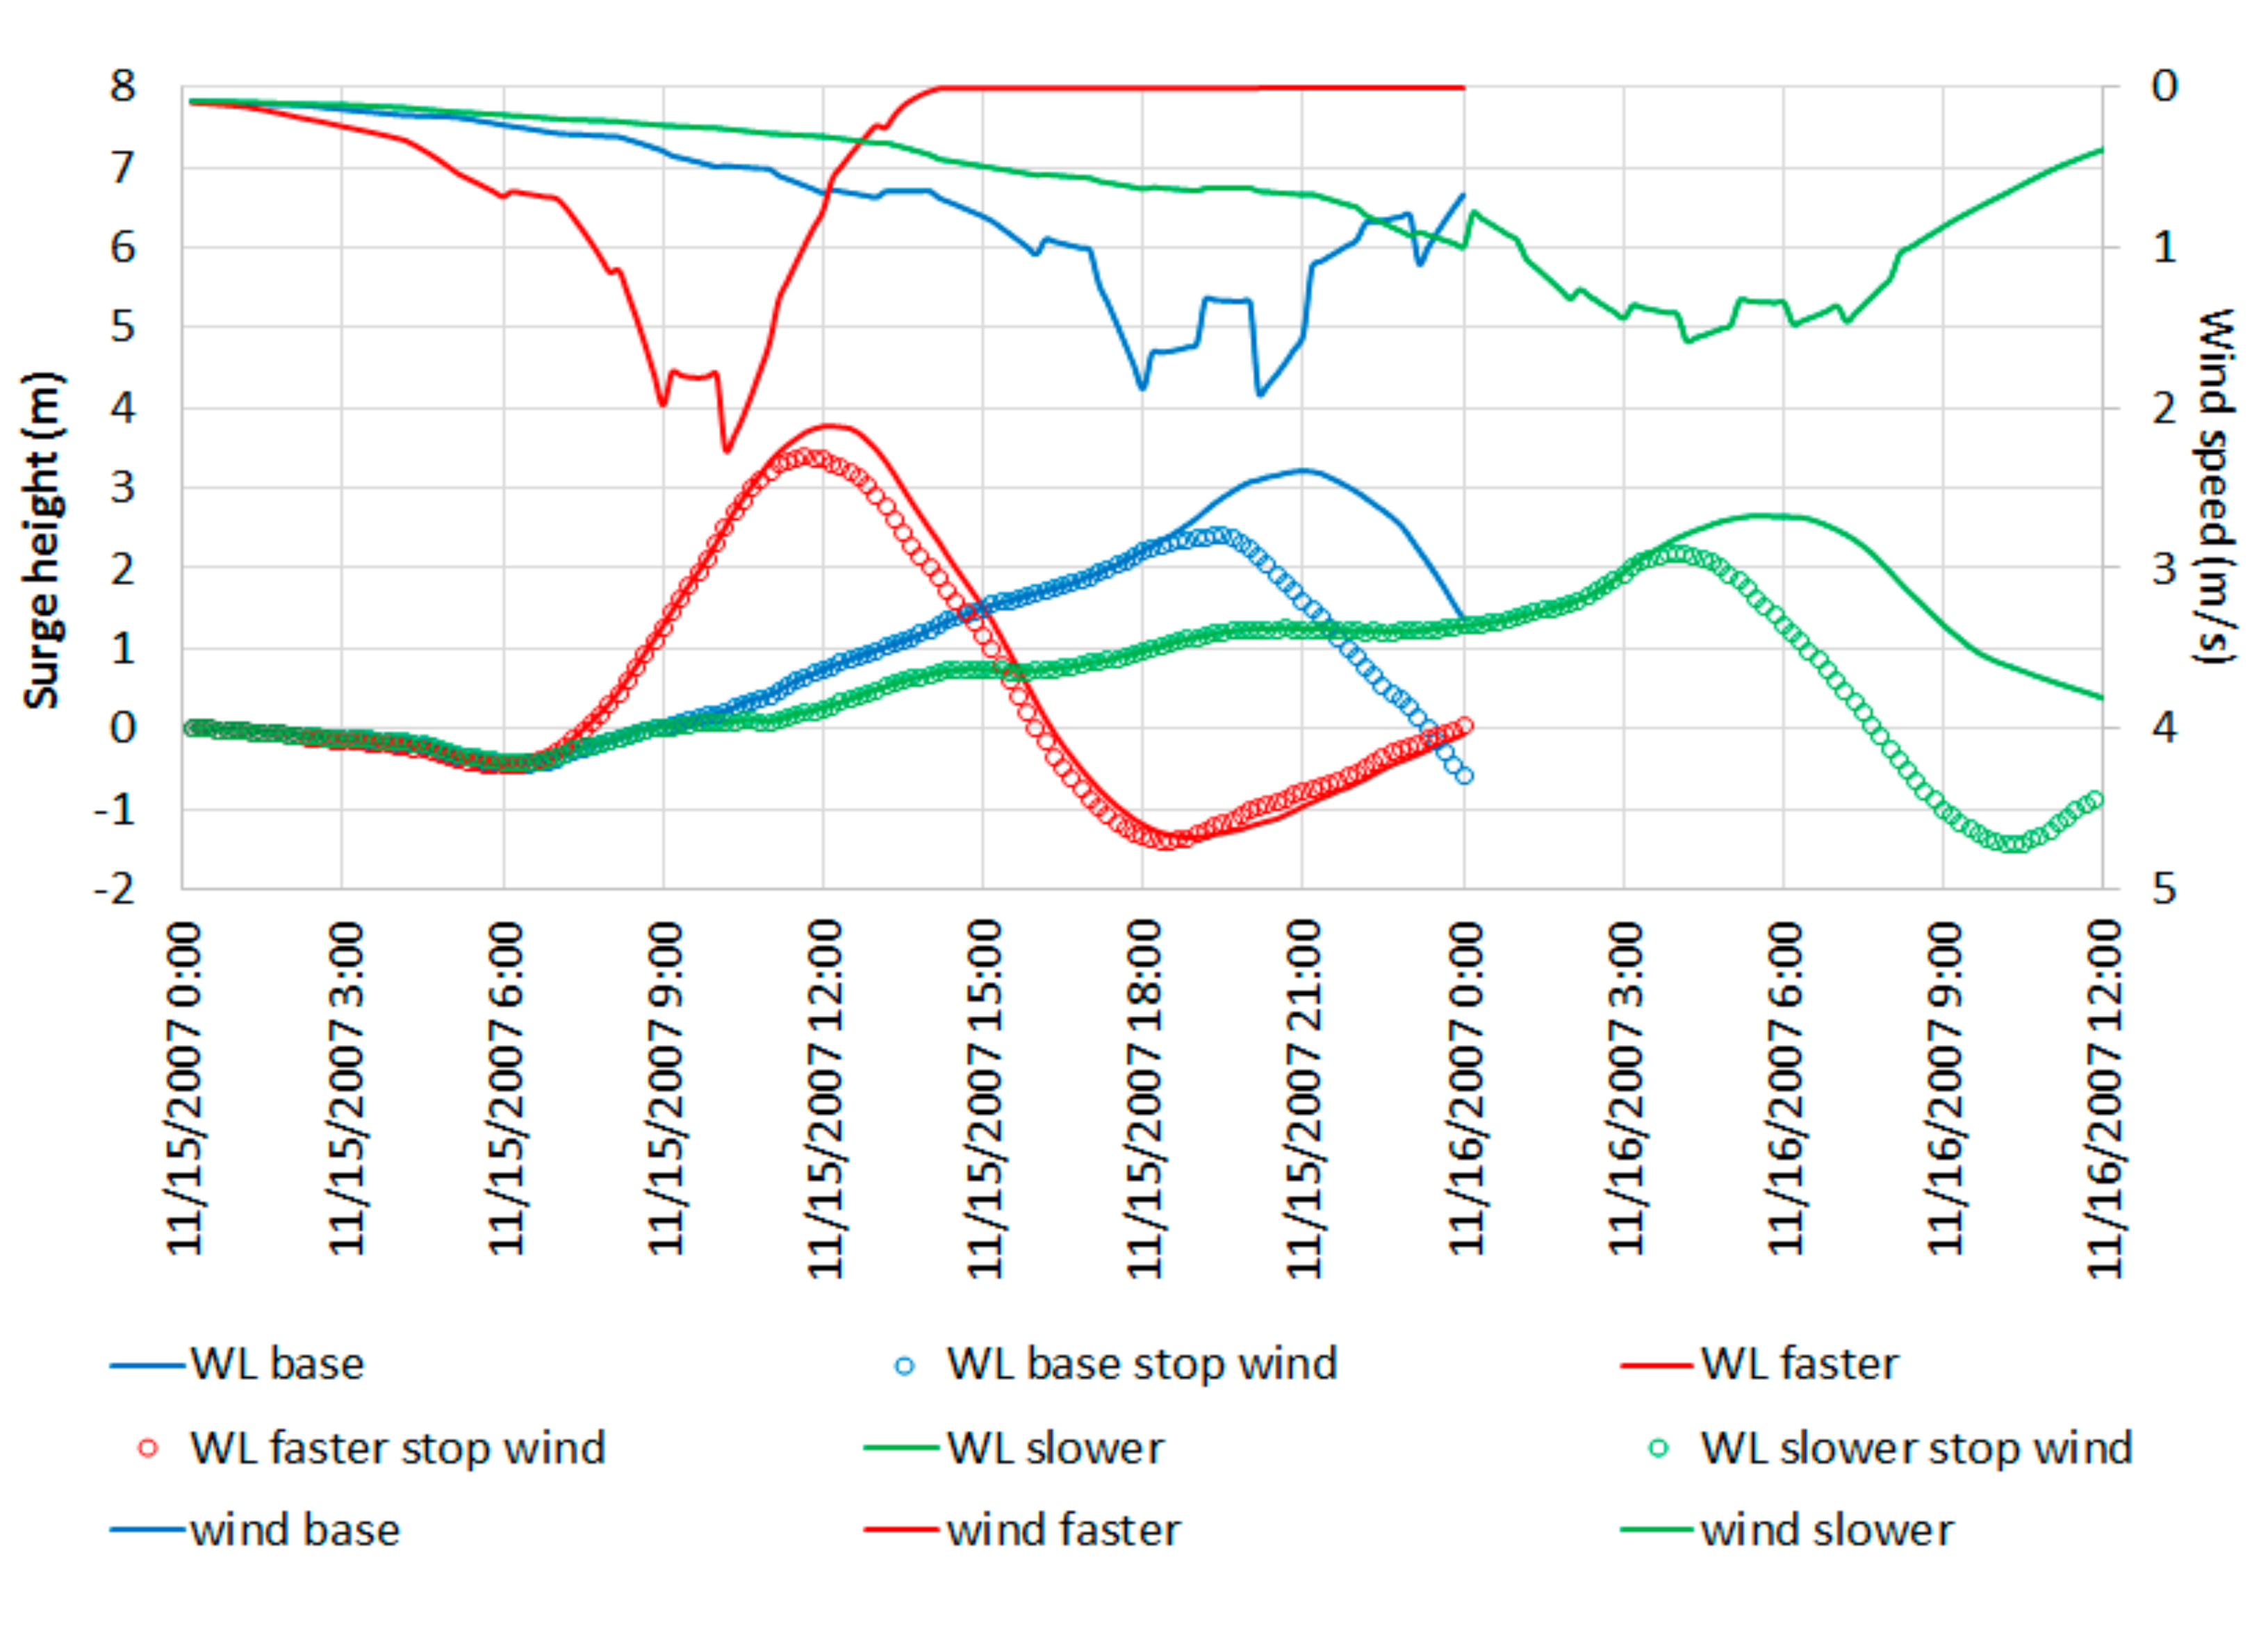
Figure 8 shows the wind speed and surge water levels for “faster”, “base” and “slower” cases at Chittagong. Firm lines represent surge heights (primary axis) and wind speeds (secondary axis, with values in reverse order) and circles represent surge height when wind is artificially removed after landfall. The method to artificially remove the wind force to identify the impact of local wind field on the surge water profile explained by Horsburgh and Wilson [19], and later by Hussain and Tajima [10], is followed in the present study. Here, the model run experiments are designed to evaluate the significance of local reinforcement of the surge compared with the surge that propagates as a wave. During these model runs, the wind field is smoothly reduced from the calculated values of wind speed to zero values through a duration of three hours starting from the landfall time. In Figure 8, red lines and circles correspond to “faster” cases, blue lines and circles correspond to “base” cases and green lines and circles correspond to “slower” cases. From the figure, it is clearly evident that magnitude of wind speed is highest for the “faster” case, and it gradually reduces for “base” case and “slower” case. The height of external surge follows the same trend. Now, it can be noted that, for both Char Montaz (Figure 4, bottom panel) and Chittagong (Figure 8), local cyclone induced wind speed reduced with the reduction of cyclone translation speed. However, the trend for surge height is opposite for the two locations. As previously mentioned, the resultant wind speed at the right half of the cyclone becomes higher due to the increase in cyclone forward movement speed and, as a result, higher wind forcing creates higher surge height. This is evident in the case of the calculated surge heights at Chittagong (Figure 8) located about 250 km away from the landfall location. In contrast, when the cyclone moves faster, it has less time to force the water, resulting in lower surge height, which becomes evident in the case of Char Montaz, which is located about 70 km from the landfall location. Thus, when the surge height is directly forced by the cyclonic wind speed especially within the RWM, faster translation speed produces reduced surge height as the cyclone gets less time to force the water. On the other hand, at locations further away from the landfall outside the RMW, surge waves travel as a propagating long wave where higher surges are produced by larger wind speeds.
Now, the impact of local wind upon the external surge can be analyzed from the difference between “surge only” profiles and surge profiles where wind is artificially removed after landfall. It is clearly evident from the figure that the impact of local wind upon the external surge is the maximum for the “base” case, the impact is slightly smaller for the “slower” case and it is much smaller for the “faster” case. Thus, it is apparent that, although the magnitude of local wind speed is the maximum for the “faster” case, the timing of maximum local wind speed actually dictates how much the external surge will be amplified by the local wind generated by the cyclone. In other words, for the “faster” case when the maximum surge height is attained (at 12:00 noon) at Chittagong, the local wind speed is 0.76 m/s and, as a result, the artificial removal of wind has an impact of 0.36 m surge height reduction. In contrary, for the “base” and “slower” cases when the maximum surge heights are attained, the local wind speeds are 1.65 m/s and 1.4 m/s, respectively, and, as a result, the removal of winds reduce surge height by 1.7 m and 1.3 m, respectively. Thus, in addition to the local tidal influence, the amplification of the external surges are primarily dictated by the condition of local winds, which, in turn, depends on the cyclone translation speed.

4.1.4. Comparison of External Surge at Different Tidal Phases

In this sub-section, the combined impact of local wind and tidal phase upon the external surges generated by cyclones of three different translation speeds have been analyzed. All these cases being considered are surge–tide interaction runs. 
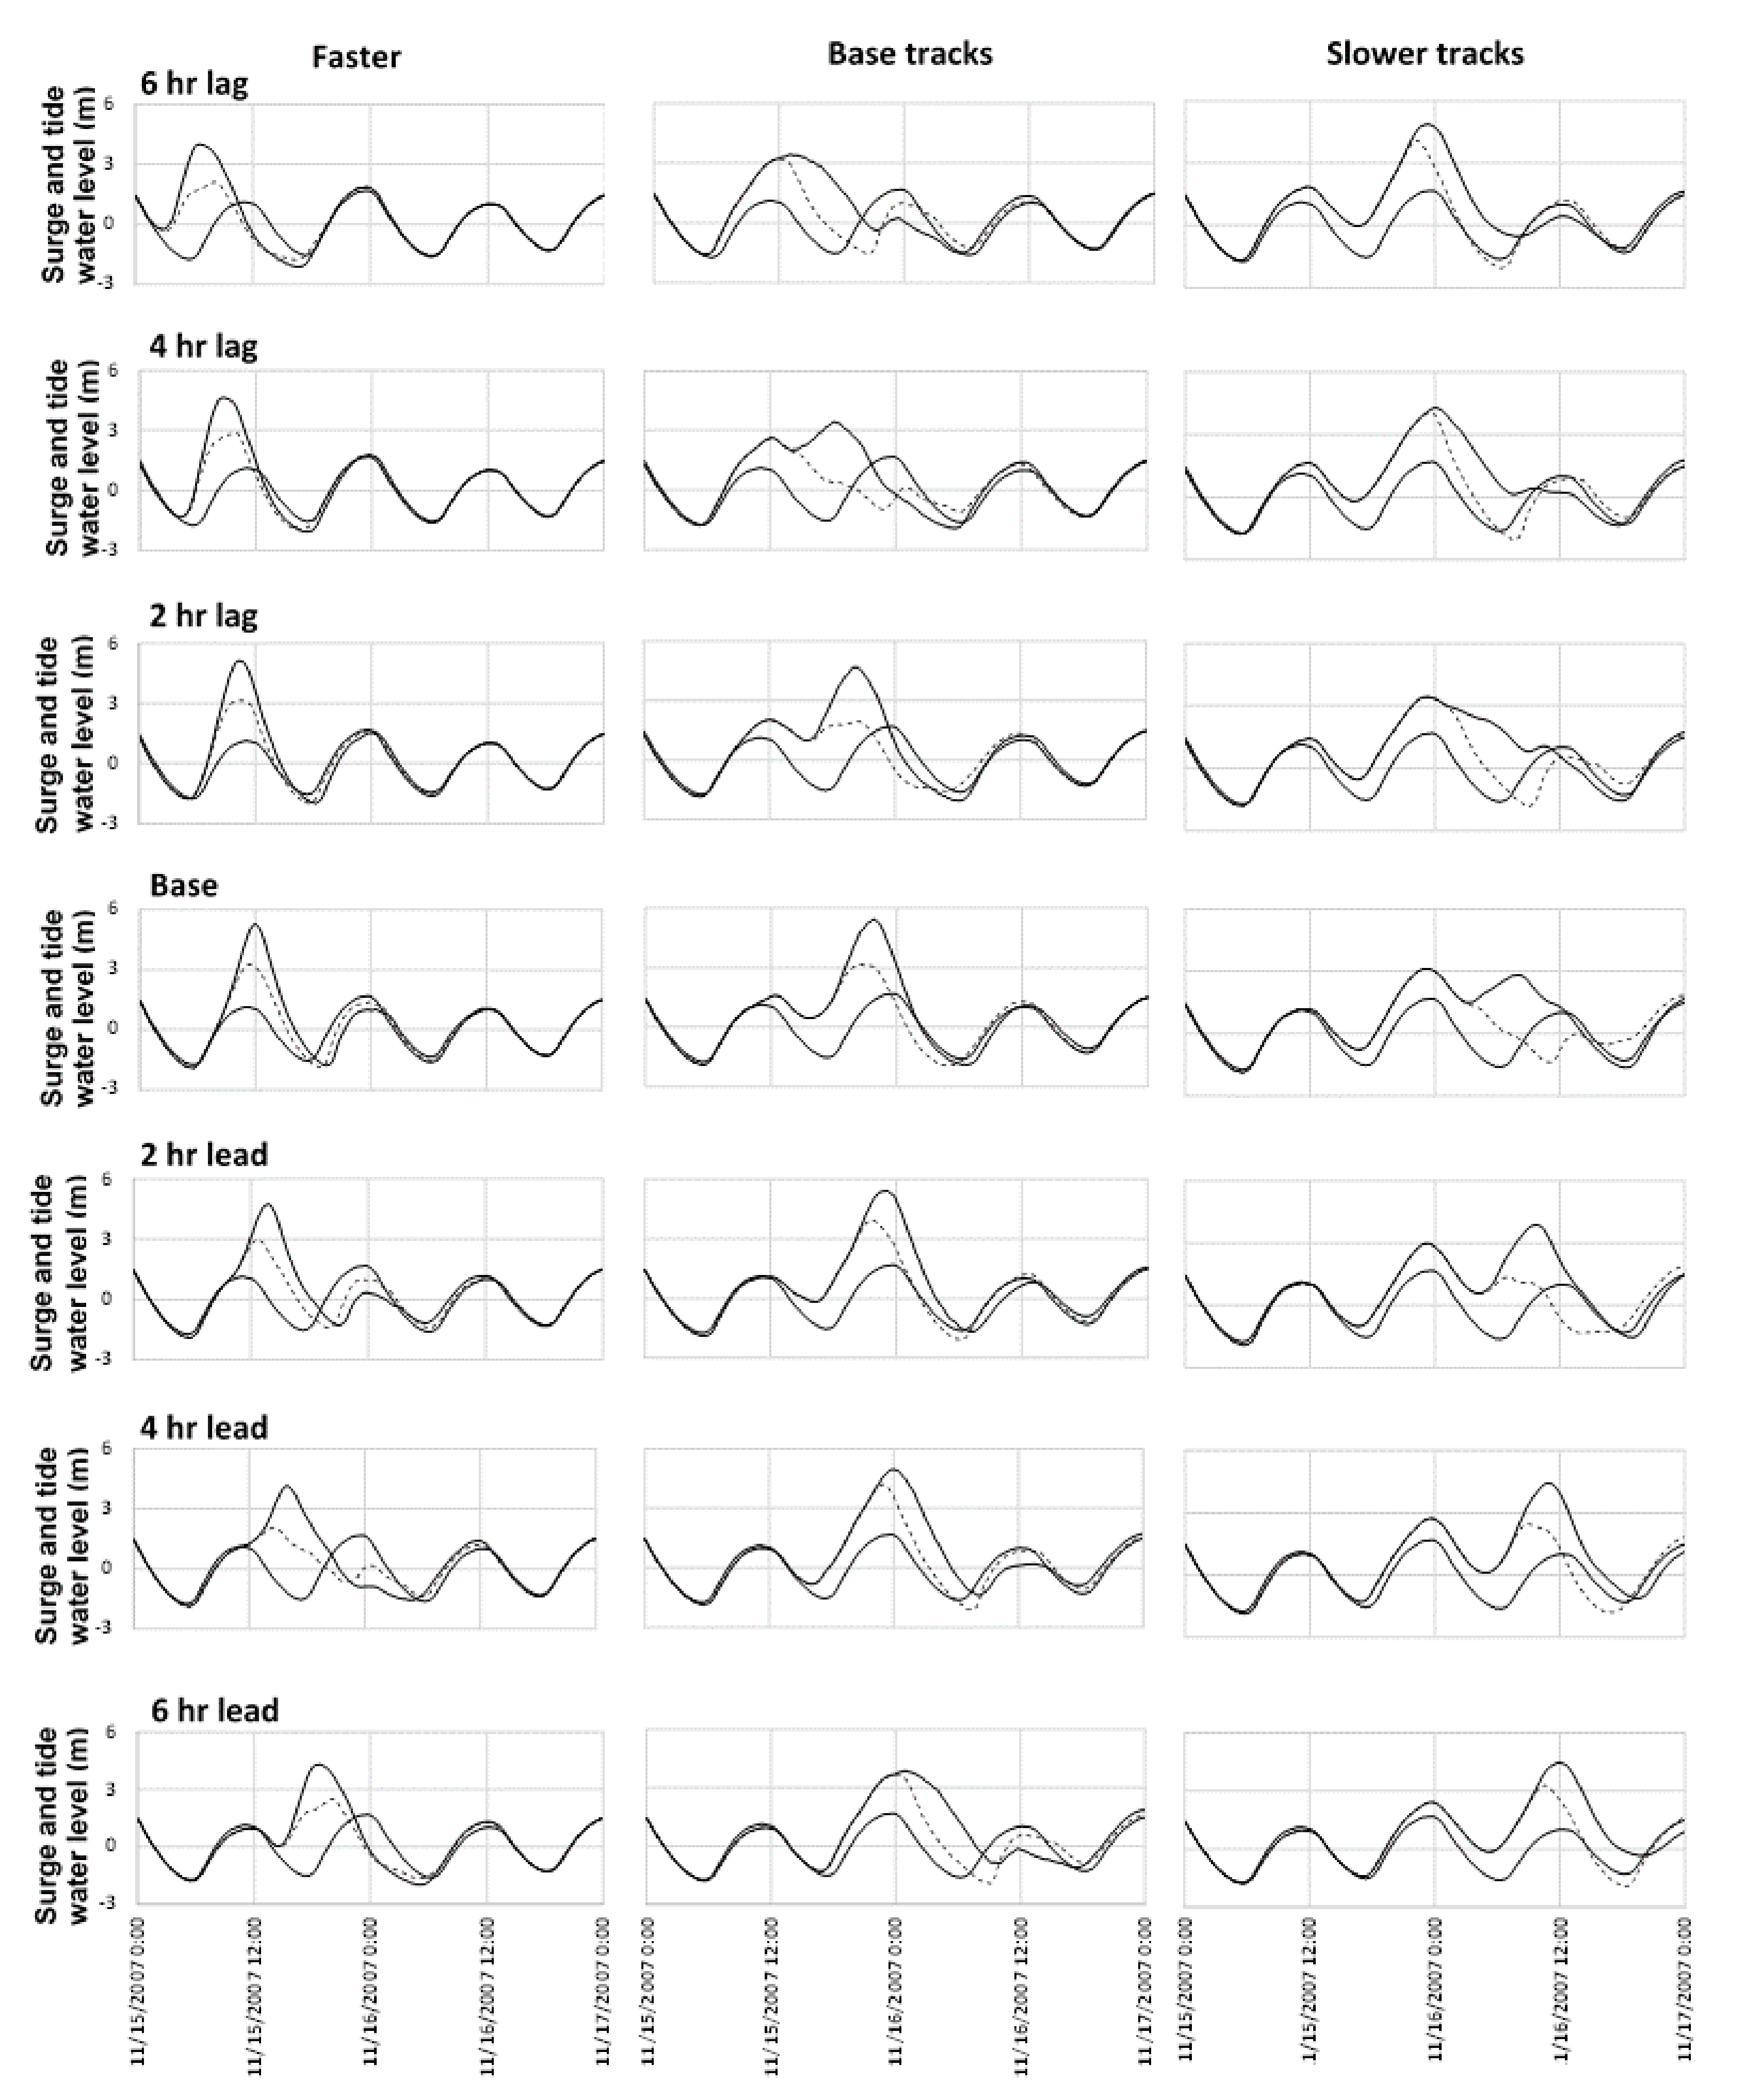
Figure 9 shows the comparison among surge profiles for “faster” (left), “base” (center) and “slower” (right) cases at Sitakunda for base case and other tidal phases at 2 h interval. In the figure, the thick black lines represent the calculated tidal water level at Sitakunda; the thin lines represent the calculated total surge water level profiles generated by the cyclone tracks where central pressure values are shifted by 2 h, and the dashed lines show the water surface profiles where the wind field is artificially removed after the cyclone makes landfall.
From the figure, it is evident that, even though stronger wind forces are created by the faster translation speed of cyclones, highest surge water levels are created by the “faster” case only for “4 h lag” and “2 h lag” cases compared to the other peak surges of the same tidal phase. For the “base”, “2 h lead” and “4 h lead” cases, maximum surge height is obtained by the “base” cyclone translation speed. Finally, “slower” tracks, even with the smallest wind speed, produce the highest surge peaks at “6 h lag” and “6 h lead” (which are approximately the same tidal phase) cases. This signifies the importance of both tidal phase and local wind upon the generation of peak surge heights of external surges.
From the figure at the top and bottom panel, i.e., for both the 6 h lag case and 6 h lead case (which are at approximately the same tidal phase), it is clearly evident that the removal of the local wind field in these tidal phases significantly reduce the peak surge levels for the “faster” tracks, keeping the surge durations same. On the other hand, in the case of “base” cases, peak surges remain almost the same, but surge durations are shortened with surge profiles receding quickly. For “slower” tracks, peak surges are reduced as well as surge durations becoming shorter when local wind is removed. From a comparison of all the surge profiles for three cyclone translation speed cases at different tidal phases, it is apparent that, for “faster” cases, local wind tends to enhance the peak surge height, keeping the surge duration approximately the same. However, for “base” and “slower” cases, local wind tends to both increase the peak surge height as well as increase the surge duration.
Two peaks in surge profiles are observed for the “4 h lag” and “2 h lag” cases of “base” track speed; and for the “base” and “2 h lead” cases of “slower” track speed. All of these four profiles are significantly influenced by the local wind, as can be realized from the comparison of thin lines and dashed lines. In addition, it may be noticed that the tidal phases of the above-mentioned four cases coincides with the low water periods of Sitakunda. This result implies that the local wind stress is more effective for a rise in sea surface in shallow water, which is consistent with the findings of Hussain and Tajima [10] and also in line with Pugh’s [50] idealized expression for sea surface slope. From the above discussion, it may be concluded that the second peaks in the surge profiles, which are higher than the first peak, are generated by the local wind and is significantly influenced by the tidal phase and cyclone translation speed.

4.2. Impact of Cyclone Path upon Surge Characteristics

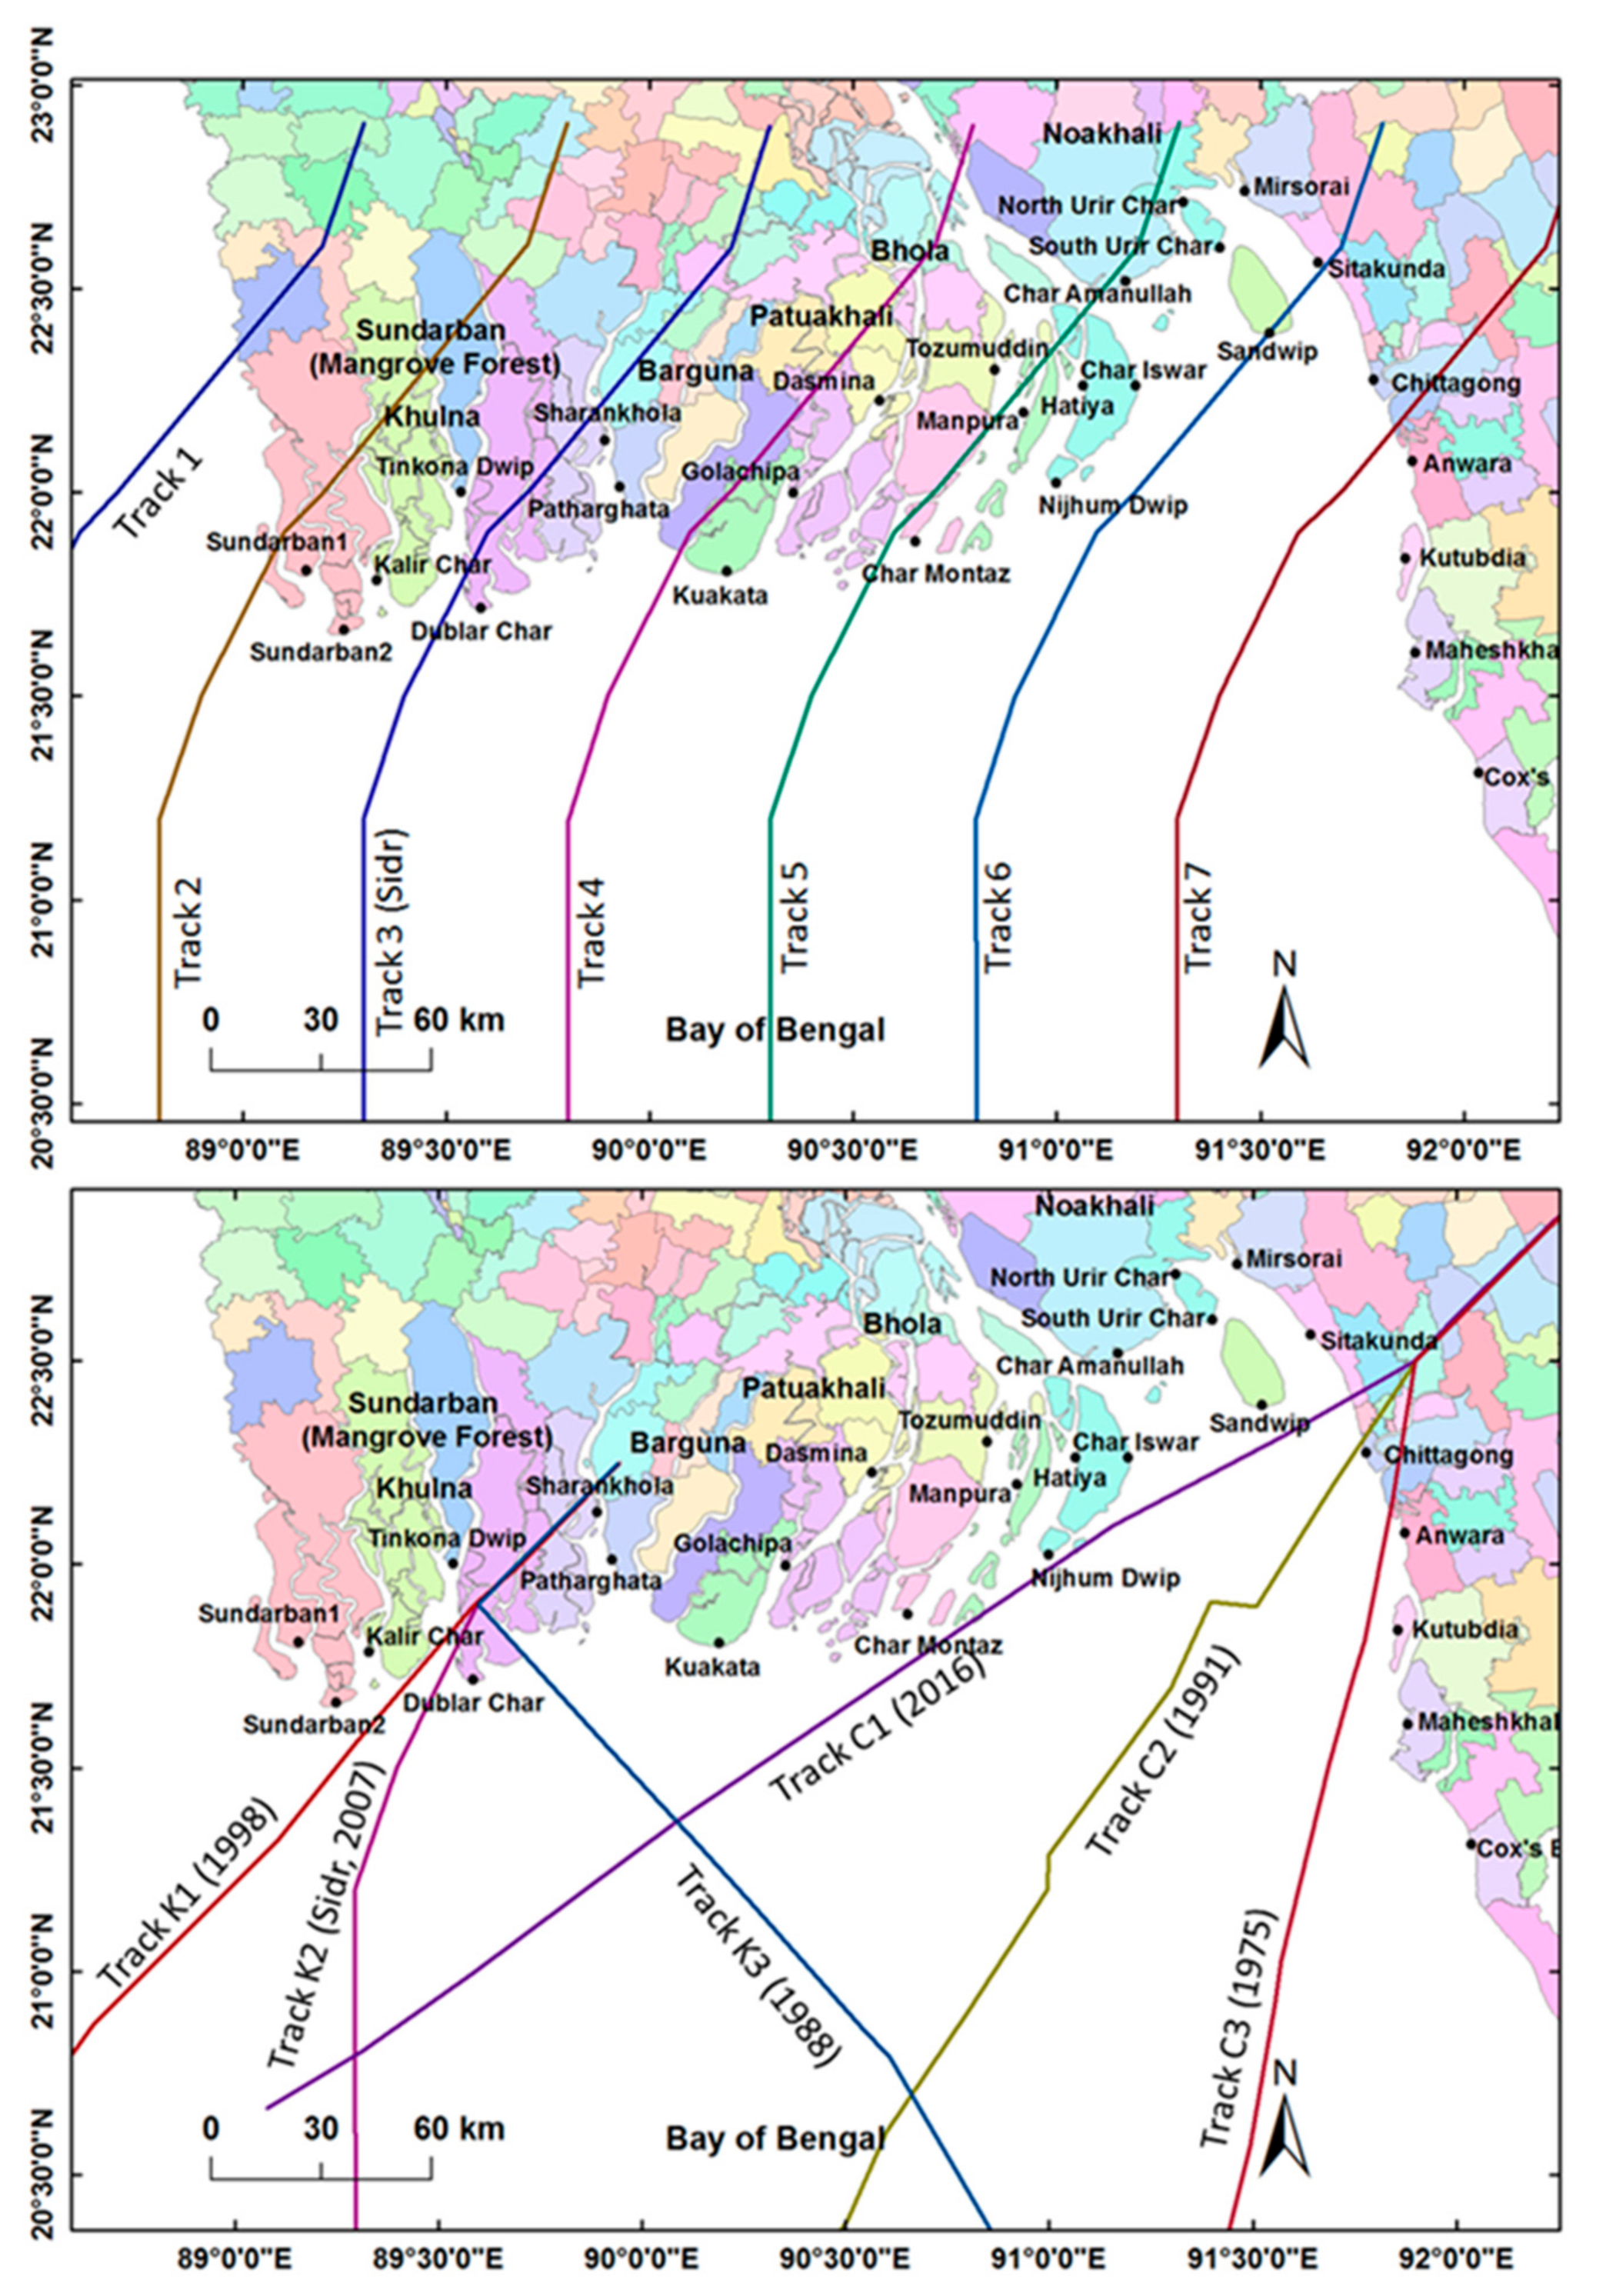
To investigate the impact of cyclone path upon surge characteristics, a total of seven parallel hypothetical cyclone tracks are generated based on the track of Cyclone Sidr. As all the tracks have the same cyclonic characteristics (track speed, central pressure drop, wind speed, radius of maximum wind, etc.), it is expected that only the local coastline configurations, bathymetry and tidal range would influence the surge characteristics at the particular landfall locations and other parts as well. Such impact on storm surge by the cyclone path was investigated by Tajima et al. [8] for the Meghna Estuary region and by Feng et al. [51] for the Tianjin coast, China. At first, to ignore the influence of tide, surge wave profiles from “surge only” runs that form seven parallel tracks are shown in the upper panel of 
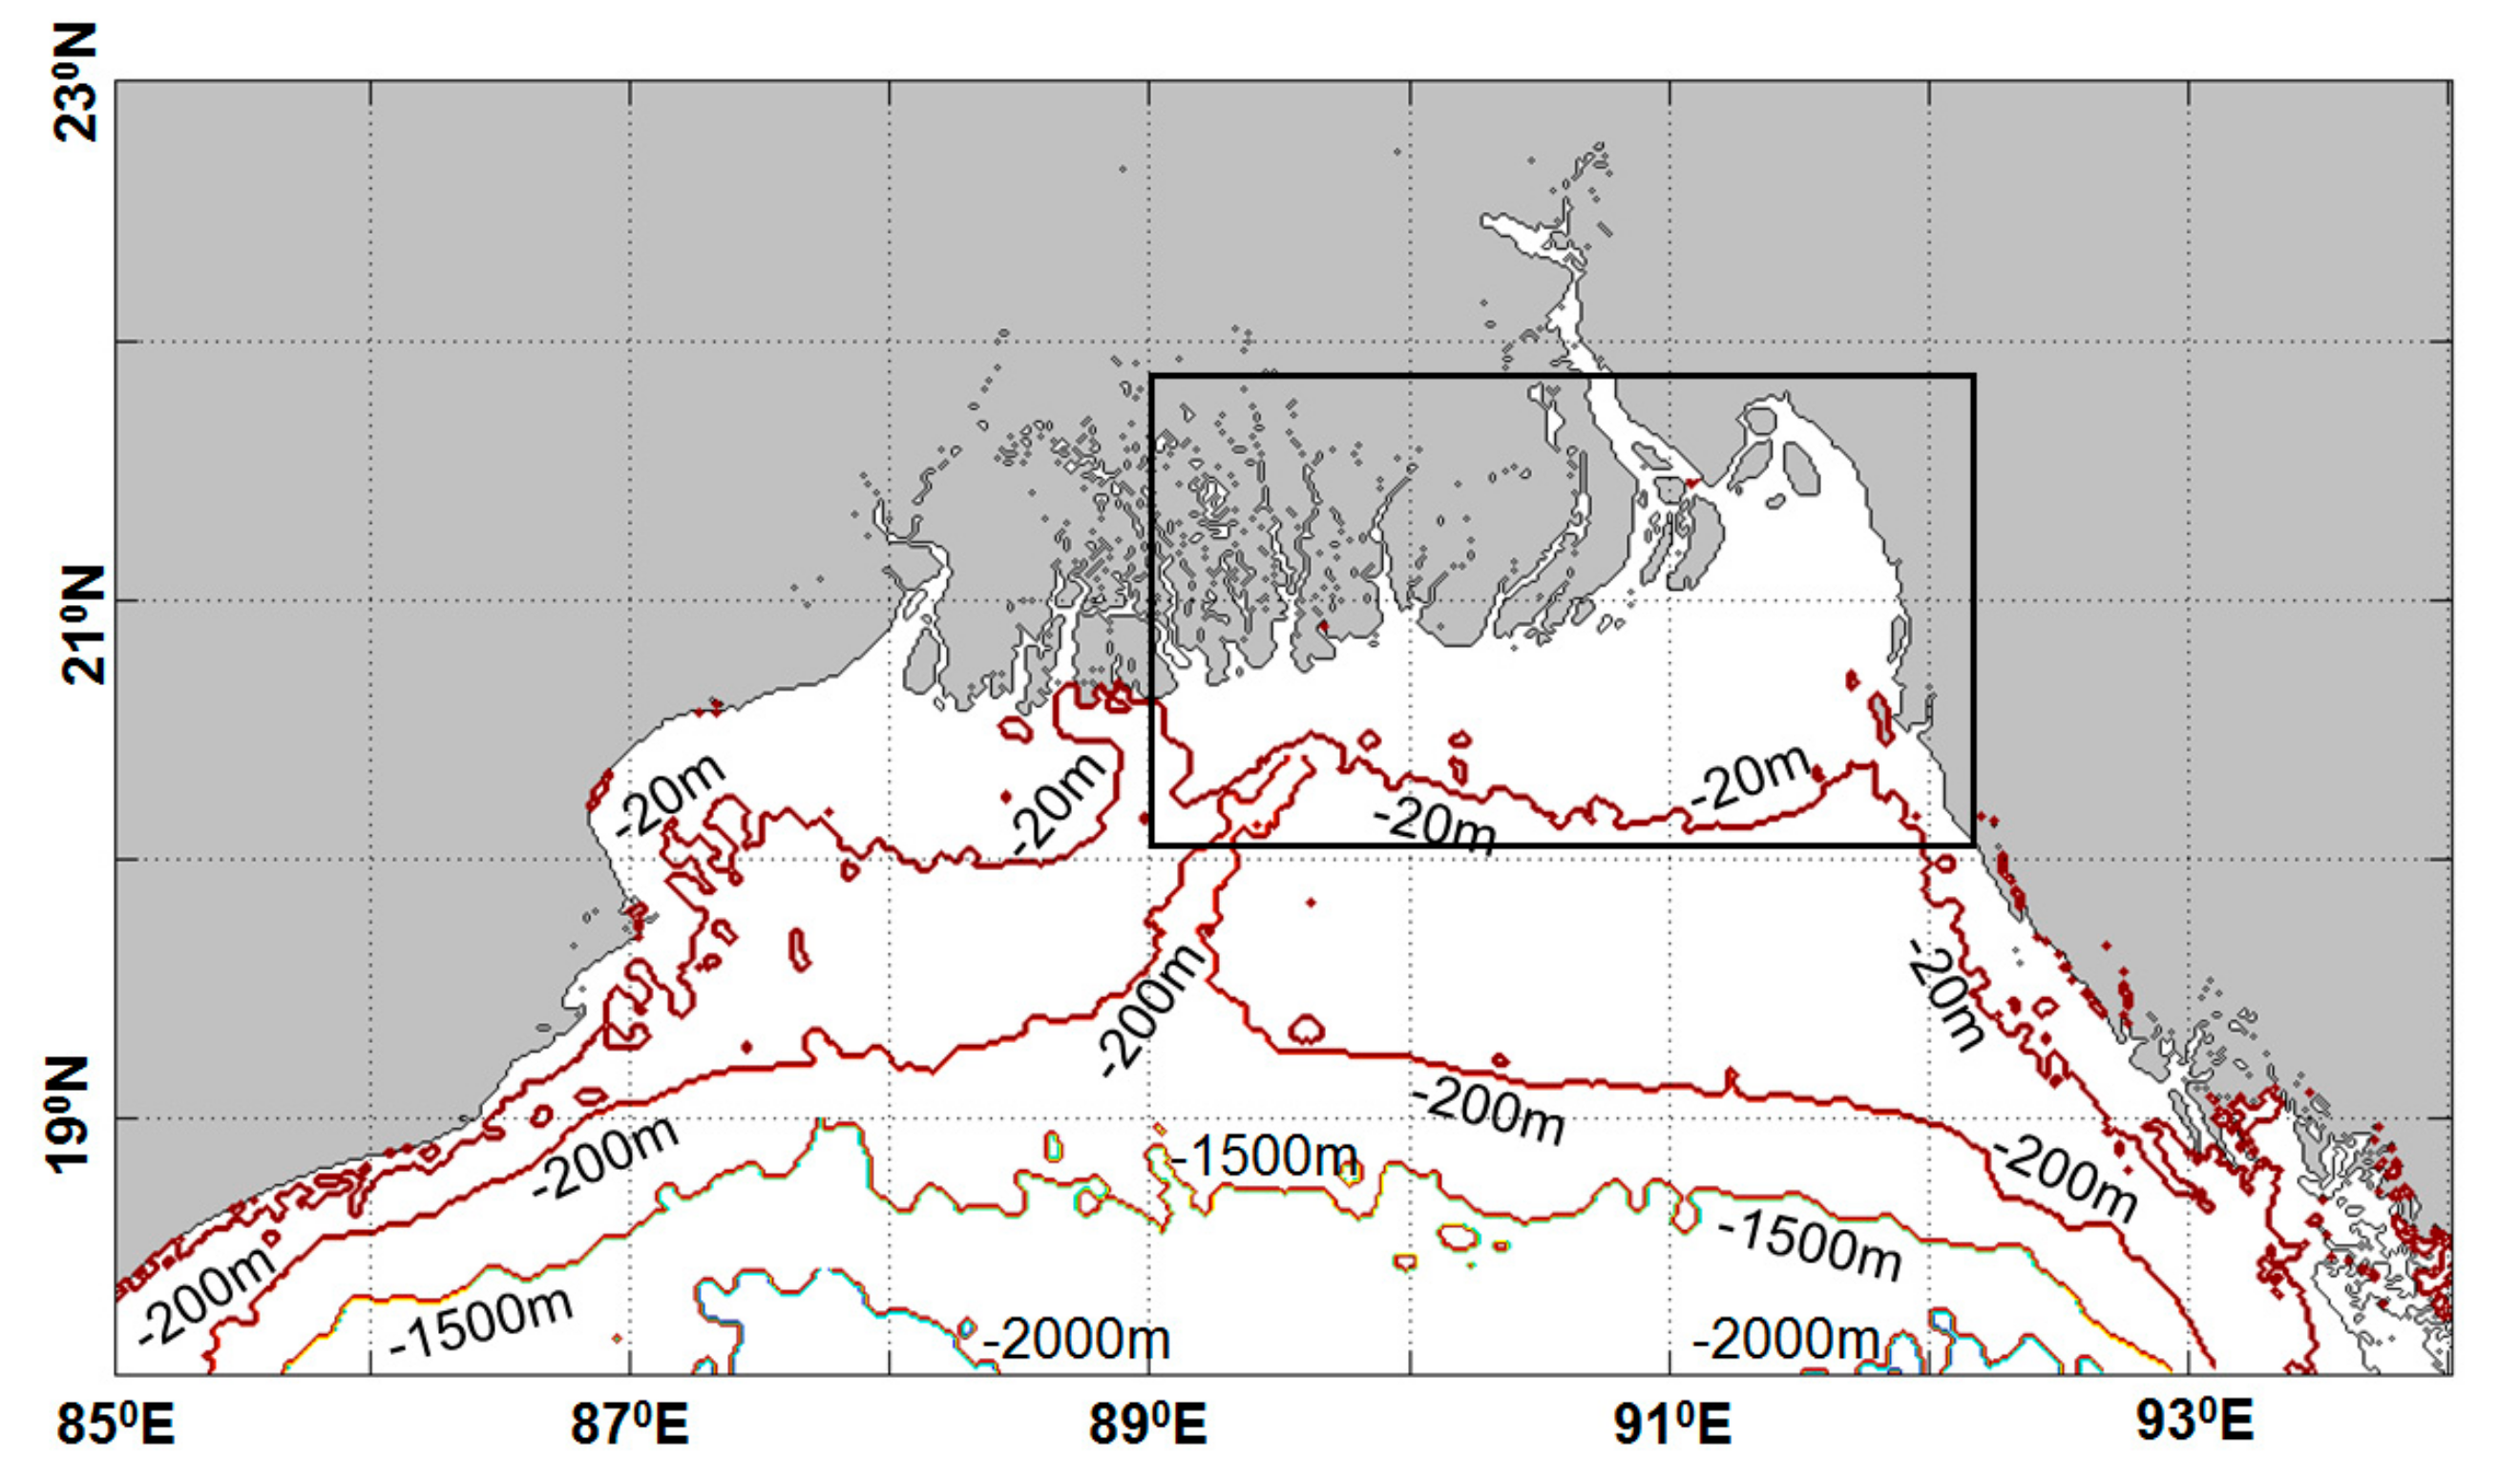
Figure 10. The surge profiles are at the nearest locations to the right side of the tracks. For Track 1 and Track 2, Sundarban1 is selected. This is because Track 1 actually makes landfall outside the coastline of Bangladesh, but major impact is expected in the Sundarban1 region, being at the right side of the track. For Track 3: Dublar Char, Track 4: Kuakata, Track 5: Char Montaz, Track 6: Sandwip and Track 7: Anwara are selected as the nearest landfall locations. In the lower panel of Figure 10, a closer view of the local bathymetry and seven hypothetical tracks at the northern Bay of Bengal are shown.
From the figure of surge profiles, it is evident that Track 3 makes landfall at Dublar Char at the earliest with relatively small surge height compared to other locations. On the other hand, surge height at Sandwip is highest and, at Anwara, it is relatively high compared to other parts. Maximum surge arrival is delayed at Sandwip and Anwara by about 1.5 h and 3 h, respectively. Now, from the lower panel of the figure, it can be noticed that most of Track 3 passes over the deep trench “Swatch of No Ground”, which will cause the surge wave to propagate faster (as a deep water wave) before landfall. This track passes over shallow regions only for a short distance. This is why the surge wave arrives at Dublar Char quickly with low surge height. From the lower panel of Figure 10, it can also be observed that Track 6 and Track 7 travel along the shallow region of the bay longer than the other tracks. As a result, surge heights are more amplified along these two tracks. The delay in surge arrival at Sandwip and Anwara can be attributed to the fact that coastlines at these locations are located about 60 km and 30 km further north compared to other locations along the coast. Thus, it simply takes a longer time for the surge wave to arrive at these locations.
Next, the results of tidal influence upon surge characteristics generated by these seven hypothetical tracks are discussed. 
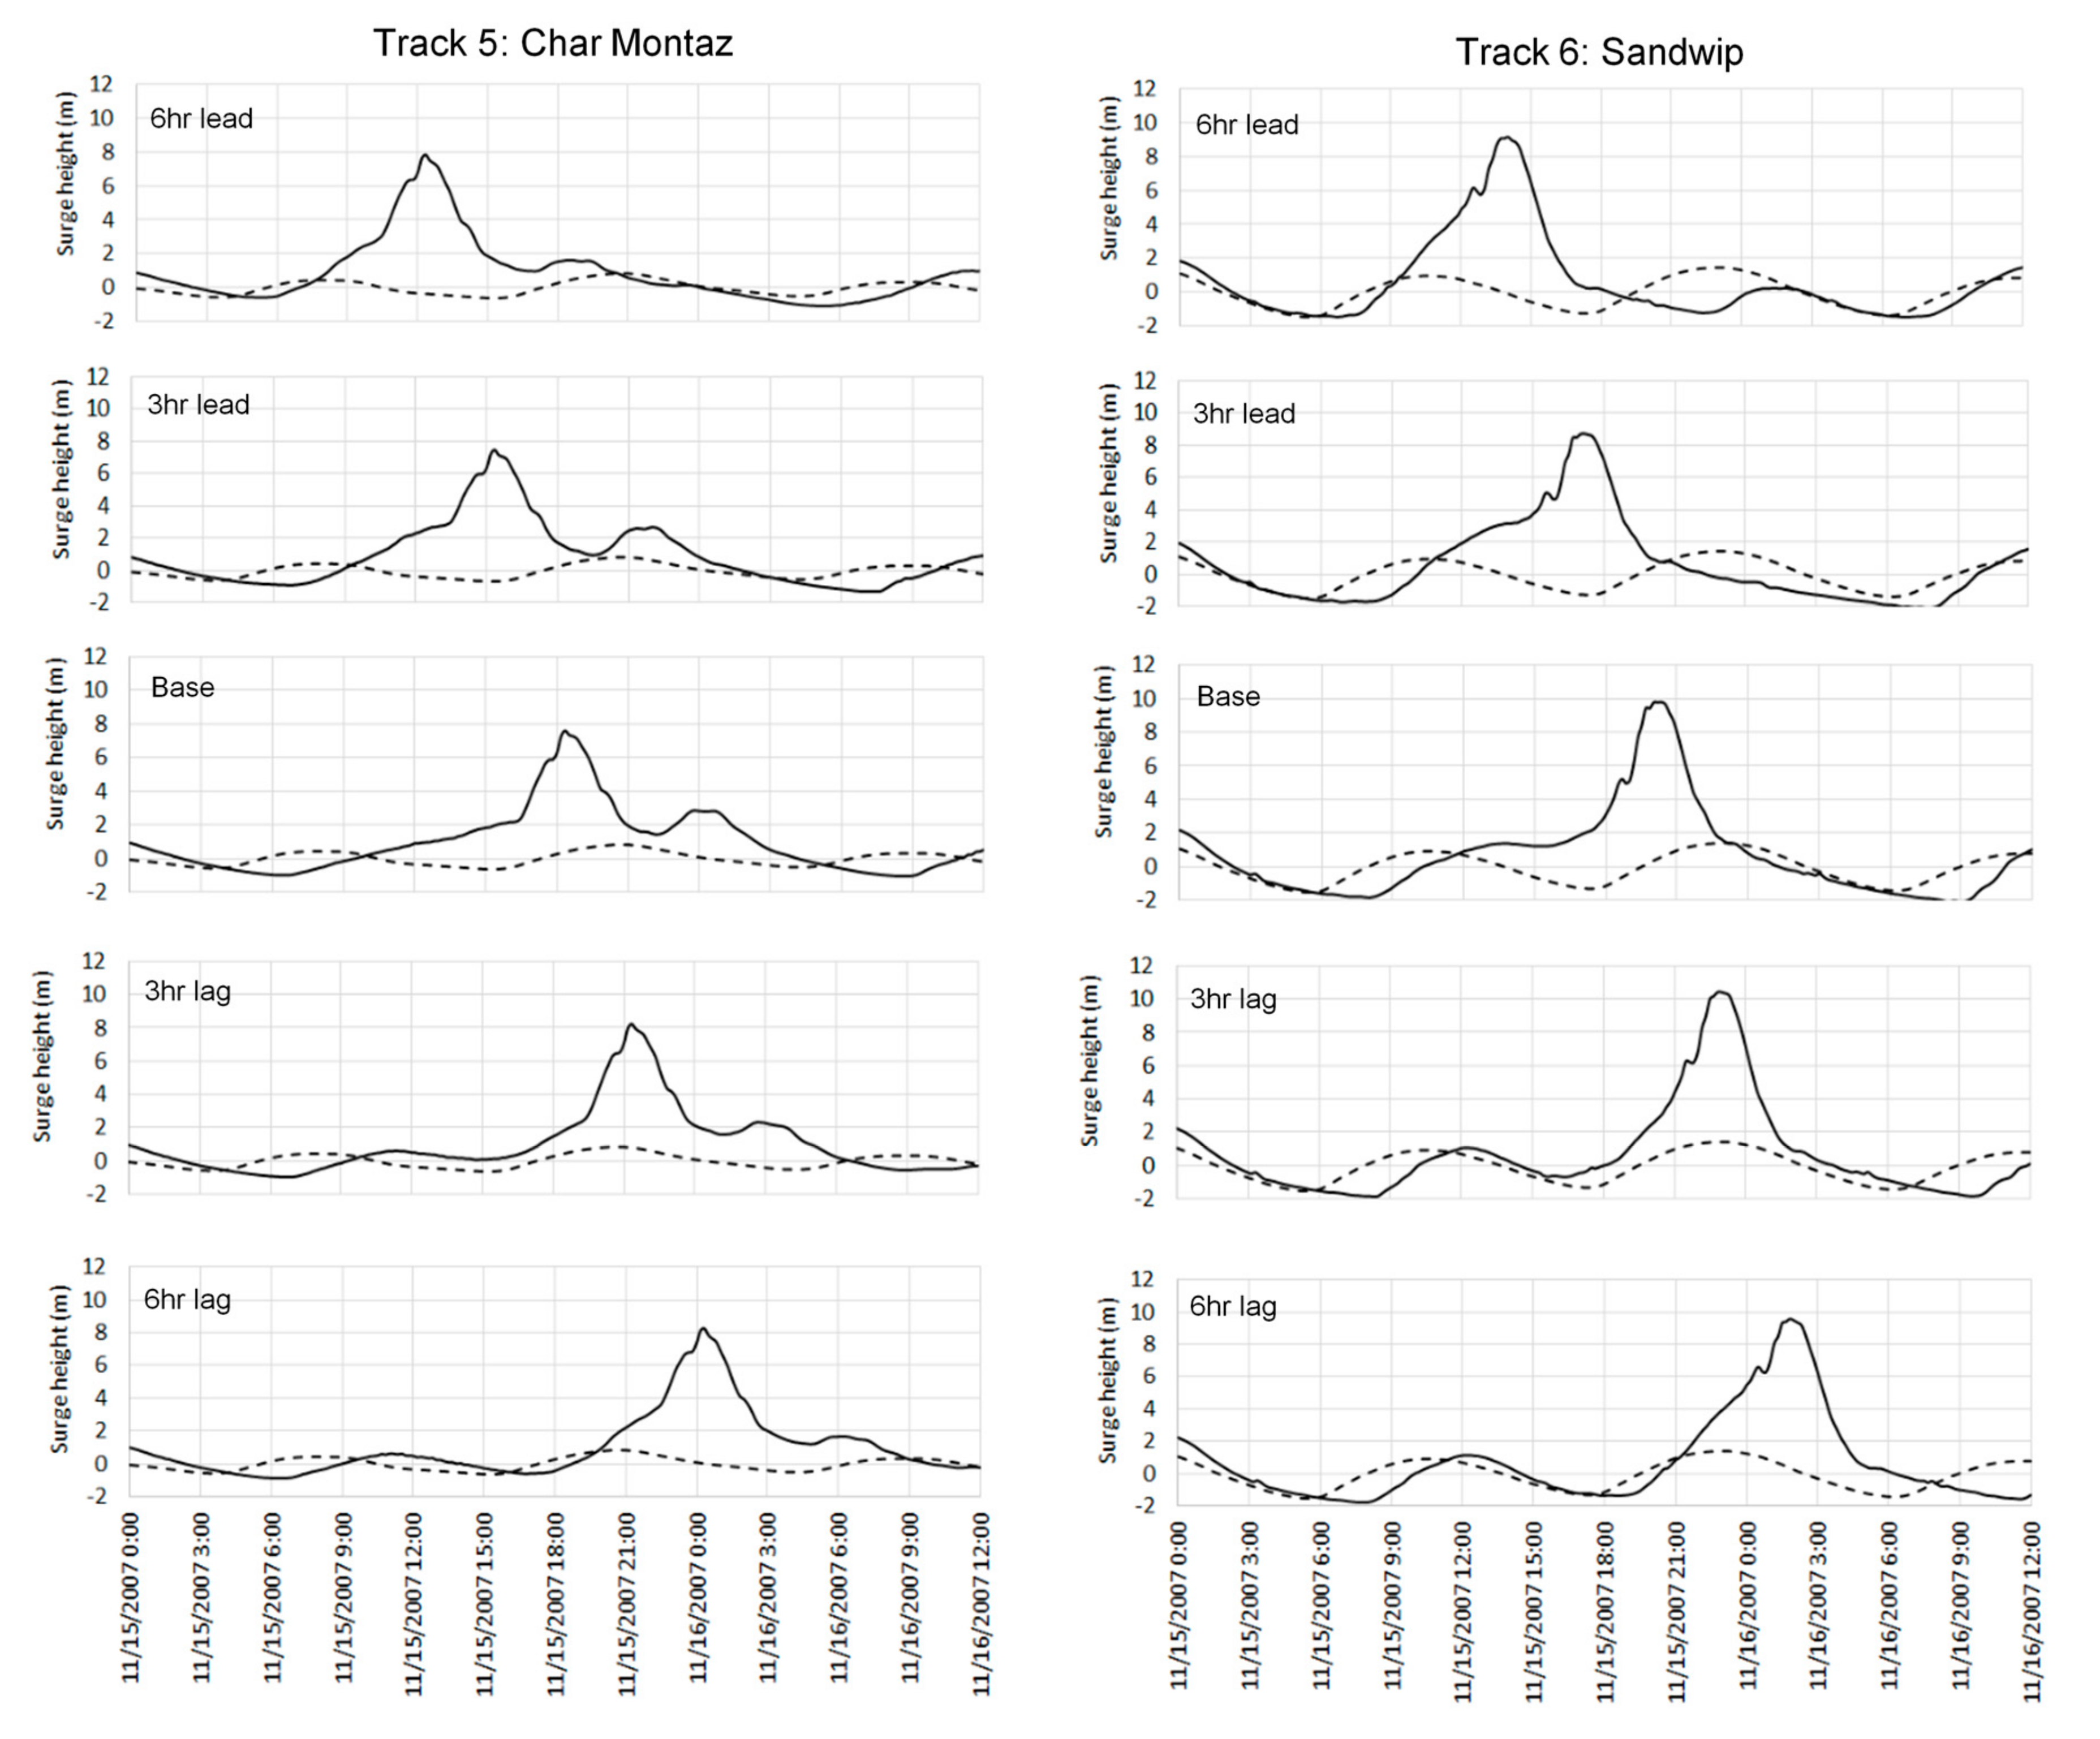
Figure 11 shows the surge profiles and local tidal water levels at different tidal phases at landfall location for Track 5: Char Montaz (left panel) and at landfall location for Track 6: Sandwip (right panel). Practically, “minus 6 h” and “plus 6 h” should represent the same tidal phase, but they have been included in the analyses to account for the tidal asymmetry, which is observed at many areas of the Meghna Estuary [52]. As already discussed, very close to the landfall locations, surge waves are directly forced by the cyclone wind and surge arrival times are least influenced by the tidal phase shift. This is clearly evident from the figure, where the surge peaks appear with a 3 h shift from every case both at Char Montaz and Sandwip. Maximum surge heights are achieved during high water duration at both the locations, but surge heights do not increase linearly with tidal water level due to the nonlinear interaction between surge and tide [10,15,18,19]. In addition, it may be noticed from Figure 11 that even though the surge arrival times are not affected by the tidal phase, surge durations (time duration from the surge profile that remains above the high water level during a cyclonic event) are strongly dependent on tidal phases. From the figure, it is evident that, in the case of “6 h lead”, “3 h lag” and “6 h lag” for Track 5 at Char Montaz and for “3 h lag” for Track 6 at Sandwip, water level rise exhibits a substantially sharper rise compared to the “base” case of Track 5 at Char Montaz and “3 h lead” case of Track 6 at Sandwip. Thus, from the tidal phase comparison, it clearly appears that surges that start to peak during the rising phase of the tide produce sharper peaks with shorter surge durations. It may be noticed that two local features influence the surge profiles at Char Montaz and at Sandwip: local bathymetry at the southern part and local tidal current. Firstly, due to the shallow water bathymetry at the south of Char Montaz, bottom friction slows down the surge water progression, and rate of water level rise is slower compared to Sandwip, where the bathymetry is relatively deeper at the southern part. As a result, time required to attain the maximum surge height from the time the water level starts peaking is much longer at Char Montaz compared to Sandwip. Secondly, the northward tidal currents at Char Montaz force the receding surge profile and produce a second peak in the profile expanding the surge duration, which is not the case for Sandwip. At Sandwip, strong tidal currents are diverted towards the Sandwip Channel and tidal velocity is small at the south of Sandwip Island (as shown in the upper panel of Figure 10 in Hussain and Tajima [10]).
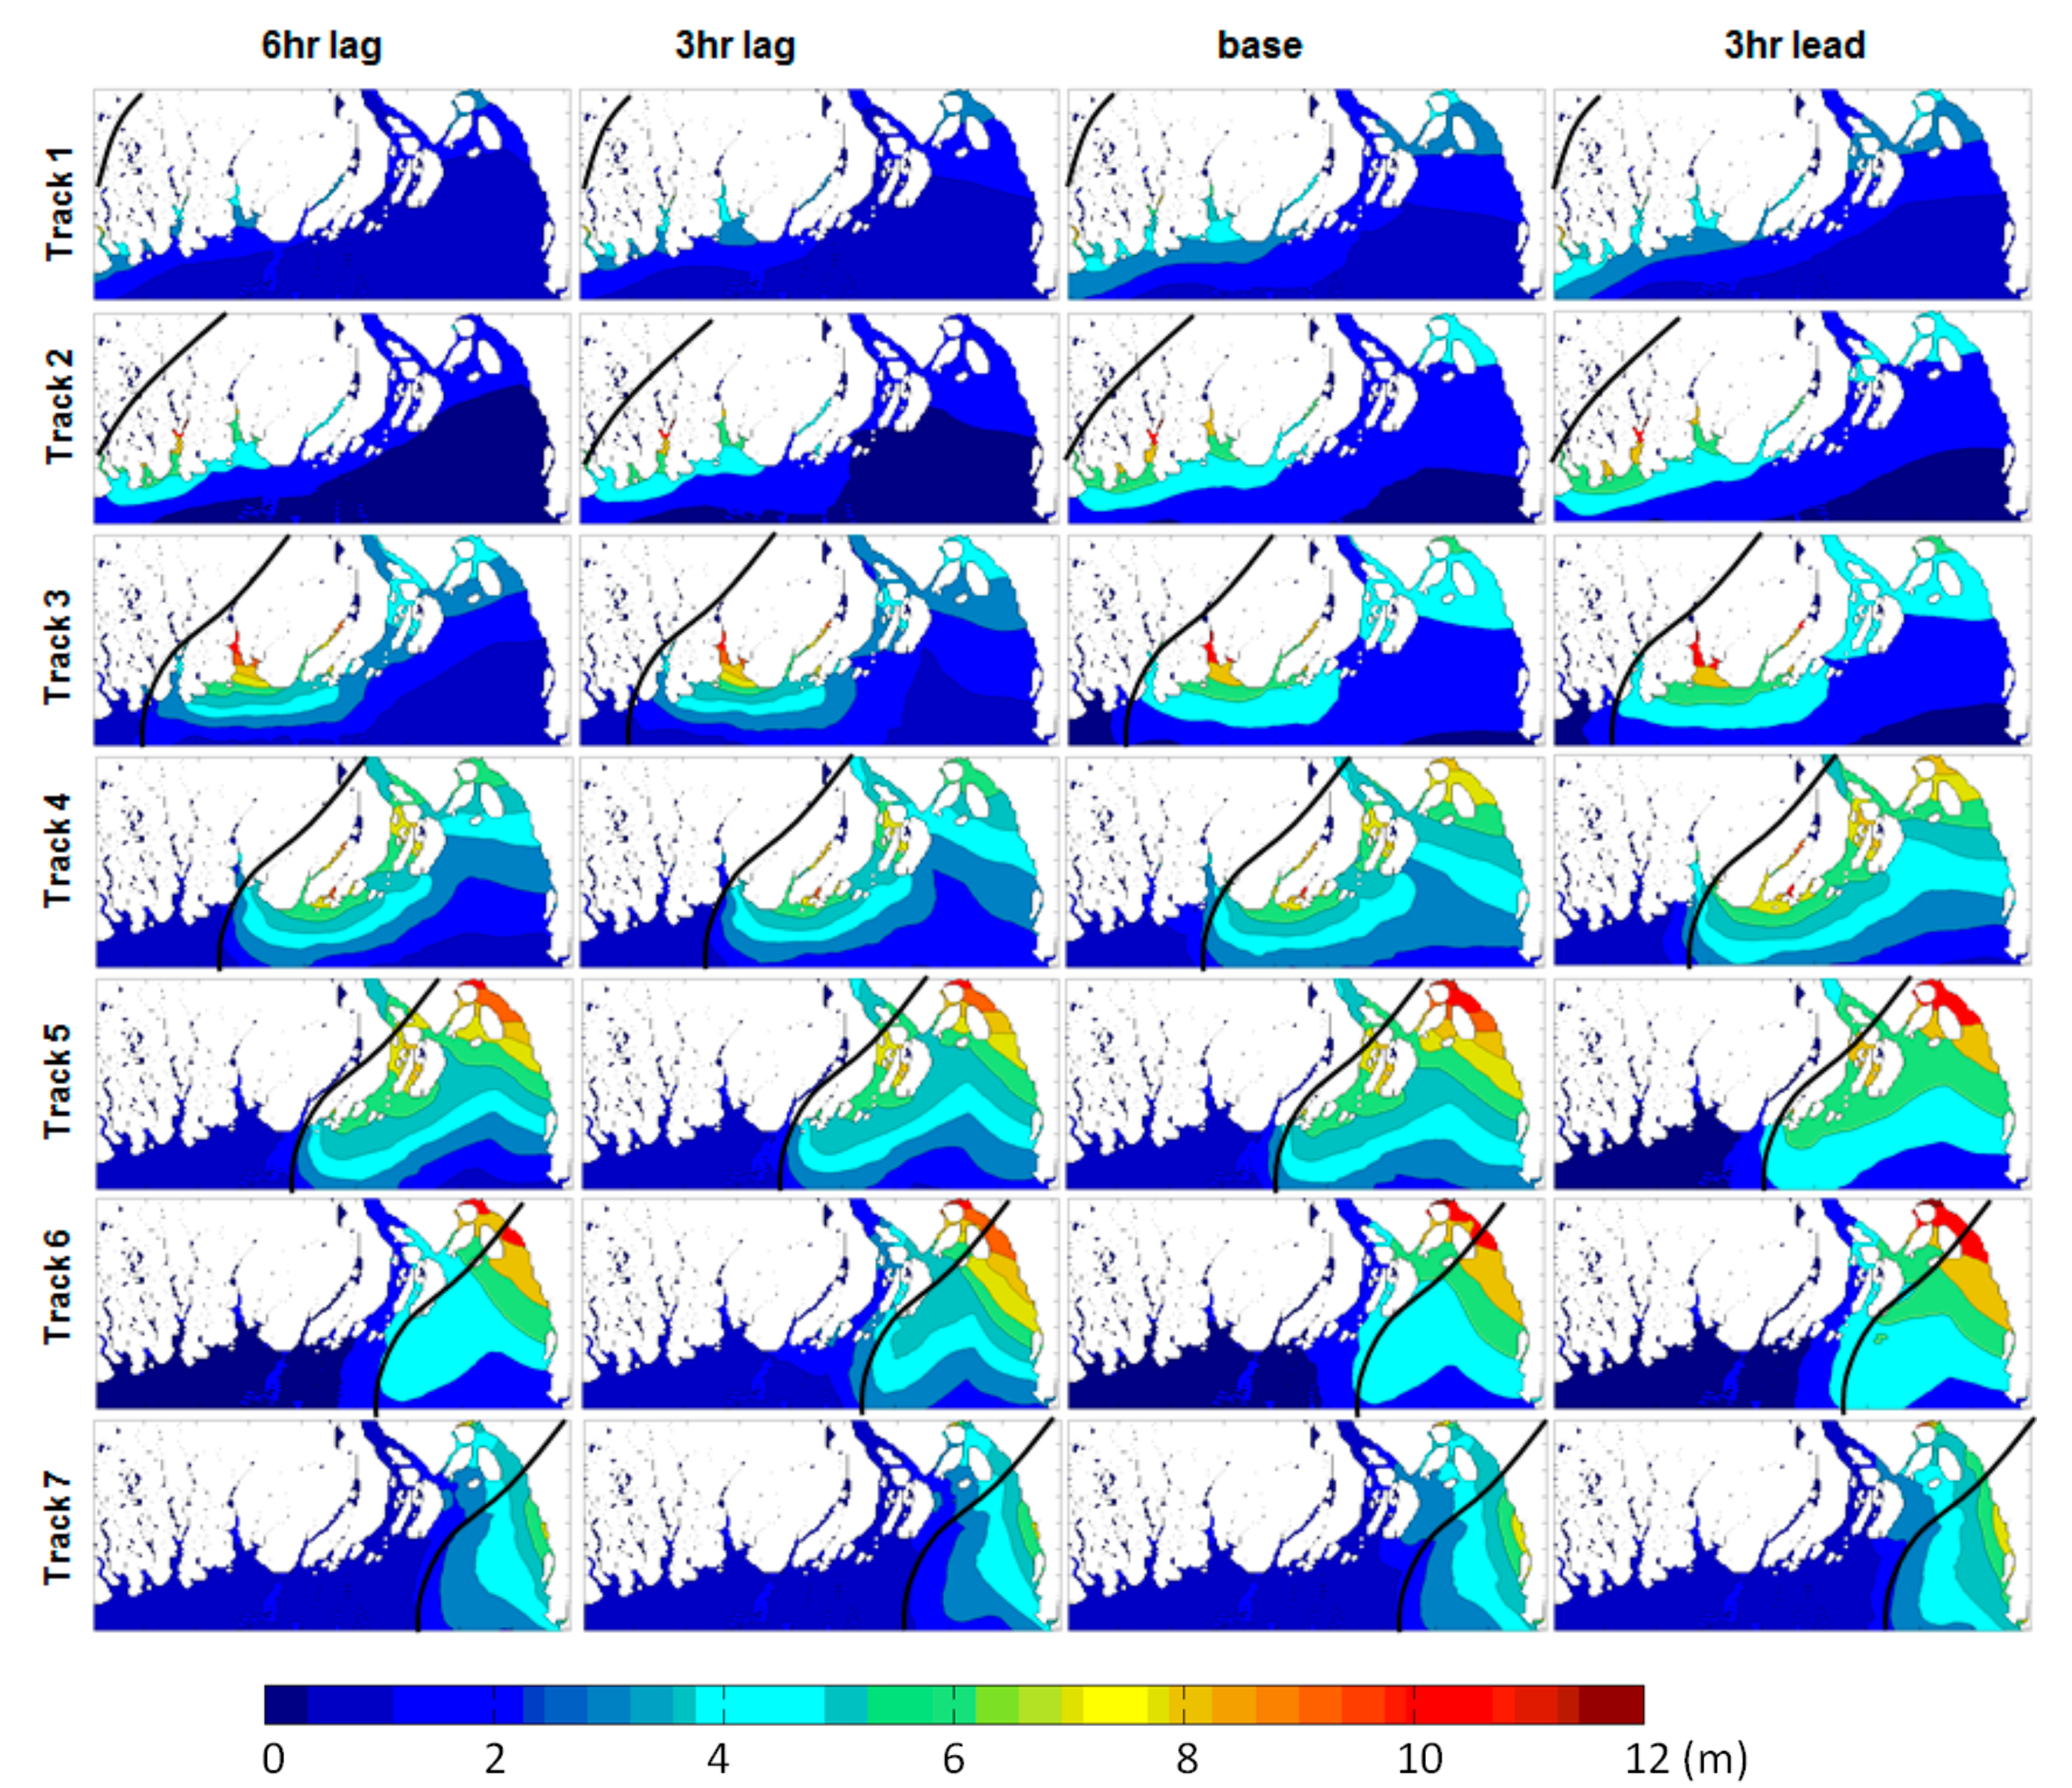
Figure 12 shows the spatial distribution of maximum surge heights for seven parallel hypothetical tracks at the four different tidal phases at 3 h intervals. The same color-bar is provided for all the figures to make an overall comparison. From a quick look, out of the seven hypothetical tracks, Track 3 (Sidr) that makes landfall at Patharghata, Track 5 making landfall at Char Montaz and Track 6 making landfall at Sandwip generate the highest surge waves of about 12 m or more. For Track 3, highest surge height is produced during the “base” case, while, for Track 5 and Track 6, height surge heights are developed during the “3 h lead” cases. It may be noticed that, even though Tracks 1 and 2 are very close to the western border of Bangladesh, surge waves do reach almost the entire coastline. Highest surge heights for Track 1 are obtained at Hiron Point (6.34 m) and at Sarankhola (6.53 m) across all tidal phases of the model run. Track 1 produced a surge wave as high as 4.26 m at North Urir Char, even though the track is quite far away from Urir Char Island. Highest surge heights for Track 2 are obtained at Kalir Char (9.11 m), Hiron Point (11.2 m) and Sarankhola (10.1 m). For Track 2, the surge wave also propagates towards North Urir Char and makes a surge height of 5.19 m. Next, Track 3, which is the track of Cyclone Sidr, produces the highest surge height at Patharghata (11.5 m) and Sarankhola (12.7 m). This track produces a surge height of 6.57 m at North Urir Char. Track 4, which makes landfall at Kuakata, develops the highest surge heights at Dasmina (9.67 m), Nijhum Dwip (8.81 m) and North Urir Char (8.66 m). Track 5, making landfall at Char Montaz, develops the highest surge heights at North Urir Char (11.9 m), Mirsorai (11.4 m) and Sitakunda (10.4 m). Track 6, making landfall at Sandwip, also produces the highest surge heights at the same locations as the previous track. The surge heights are North Urir Char: 13.0 m, Mirsorai 11.6 m and Sitakunda 11.3 m. Finally, Track 7 makes landfall at Anwara and produces the highest surge heights at Anwara (7.75 m), Chittagong (6.94 m) and Kutubdia (6.74 m). The values of the highest surge heights mentioned are the maximum across all tidal phases.
The spatial distribution of maximum surge heights for different tracks suggests that, as the track moves towards the east, the extent of coastline under the threat of surge wave reduces. This is primarily due to the stronger impact of surge waves on the right side of the cyclone tracks. Even though Tracks 5 and 6 produce large surge waves at the northern part of the Meghna Estuary, the spatial extent of high surge wave for these cases are smaller than Tracks 1–3, which cover almost the entire coast of Bangladesh. From the surge height of all the tracks, it may also be concluded that wherever the landfall takes place along the coast of Bangladesh, the northeastern part of the Meghna Estuary, starting from Urir Char, Sandwip, Mirsorai, Sitakunda towards Chittagong remains under the risk of storm surge disaster.

4.3. Impact of Cyclone Landfall Crossing Angle upon Surge Characteristics

Zhang [47] made a detailed investigation on the impact of landfall crossing angles on surge height, but the study focused on ideal computation domain with straight coastlines. The present investigation aims to account for the complex coastlines and bathymetry of the Bay of Bengal and find out the impact at two coasts: the Chittagong and Khulna coasts. The base cases are the tracks of Cyclone 1991 and Cyclone Sidr, at the Chittagong and Khulna coasts, respectively. The other tracks are selected historical tracks that made landfall at the same coasts with larger and smaller coastline crossing angles.
It can be mentioned that the cyclone properties (tracks speed, central pressure, wind speed, radius of maximum wind, etc.) of these selected tracks were kept the same as the base tracks (Cyclone 1991 and Cyclone Sidr) to draw out the impact of cyclone landfall crossing angle only. 
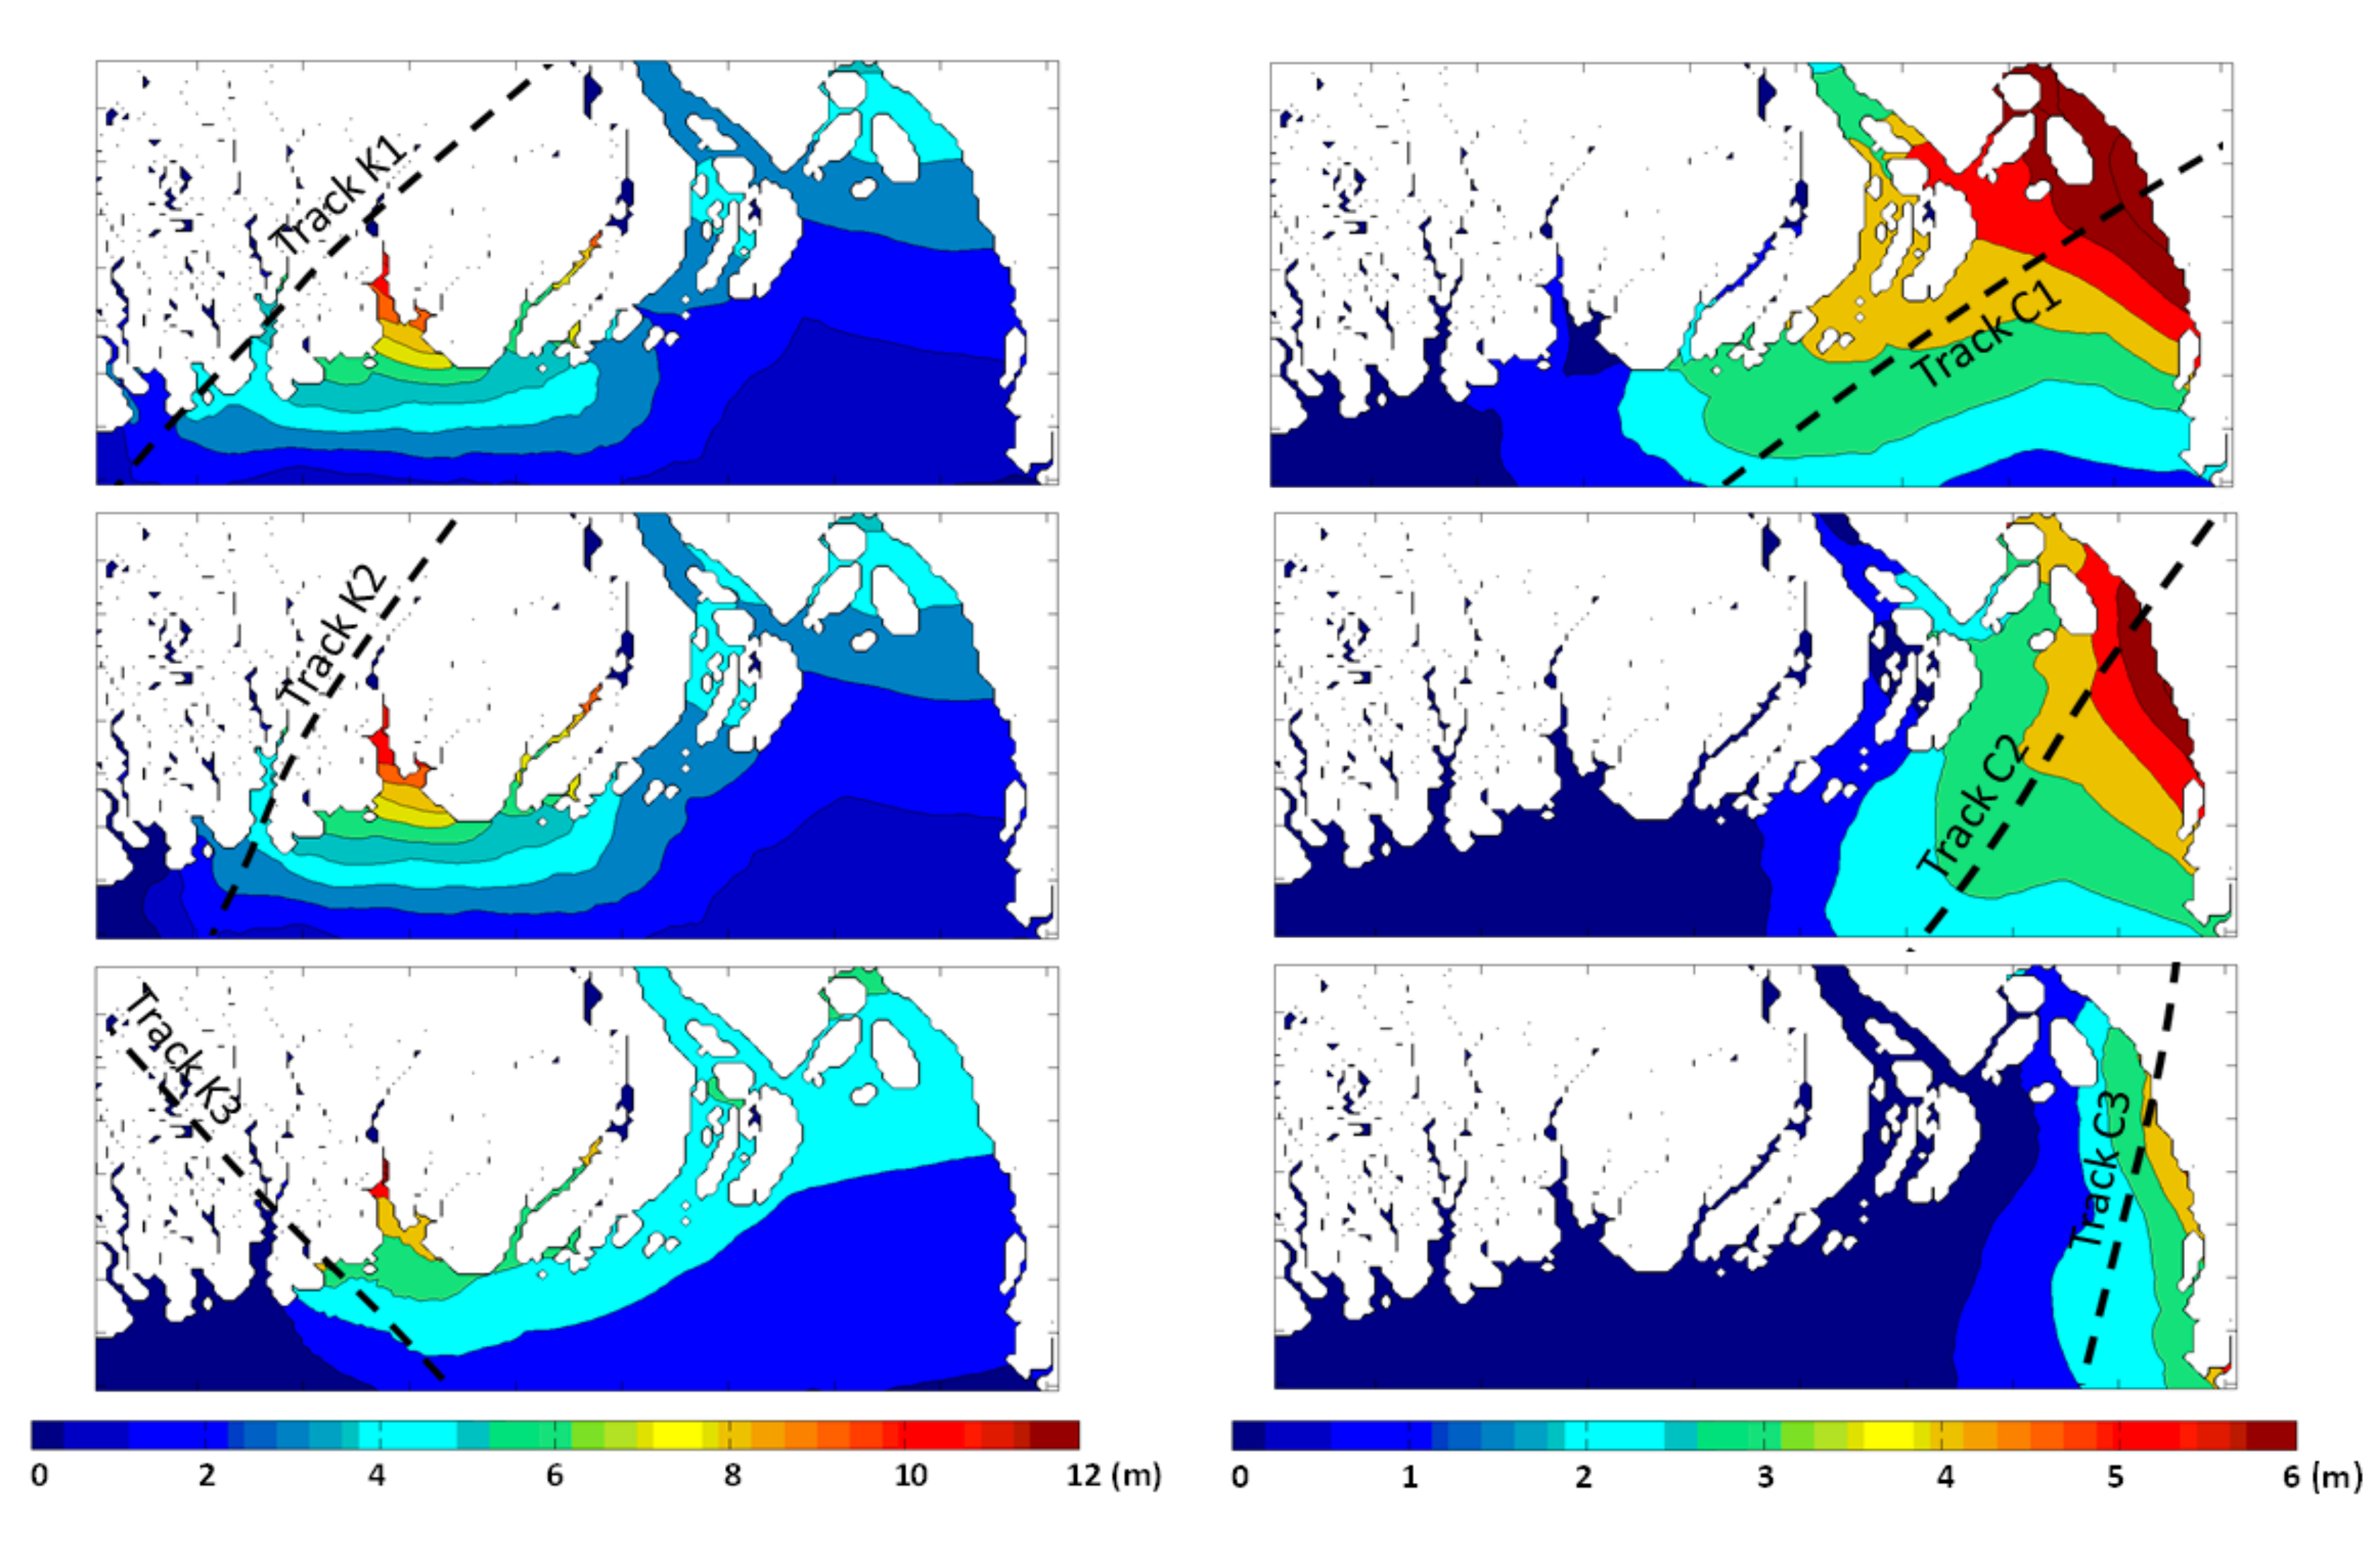
Figure 13 shows the spatial distribution of maximum surge height (m) for three different tracks at the Khulna (left panel) and Chittagong (right panel) coasts, respectively. All three tracks at the Khulna coast produce the highest surge height at Patharghata and Sarankhola. The maximum surge height is the highest for Track K3, and the influence zone also is the highest for this track. For Tracks K1 and K2, areas near the landfall location (Patharghata and Kuakata) and the northeastern part of Meghna Estuary (around Sandwip and Urir Char) are affected, but, for Track K3, almost the entire coastline until Kutubdia and Cox’s Bazar experiences high surge waves. For the Chittagong coast, the maximum surge height is about 5–6 m for the three tracks, but the influence zone of high surge waves widely vary. For Track C1, surge waves as high as 6 m are obtained from the north of Kutubdia Island, Anwara, Chittagong, Sitakunda, Mirsorai, Sandwip and Urir Char Island. Apart from this, the surge waves extend from Cox’s Bazar in the east to Patharghata in the west. For Track C2, the influence zone is reduced, and it varies from Cox’s Bazar in the east to Char Montaz in the west. A maximum surge height of 6 m is reached at Anwara, Chittagong and Sitakunda. For Track C3, the influence zone is further reduced to about half of the Meghna Estuary starting from Cox’s Bazar in the east to Sandwip Island in the west. A maximum surge height of 5 m is reached only at Anwara.
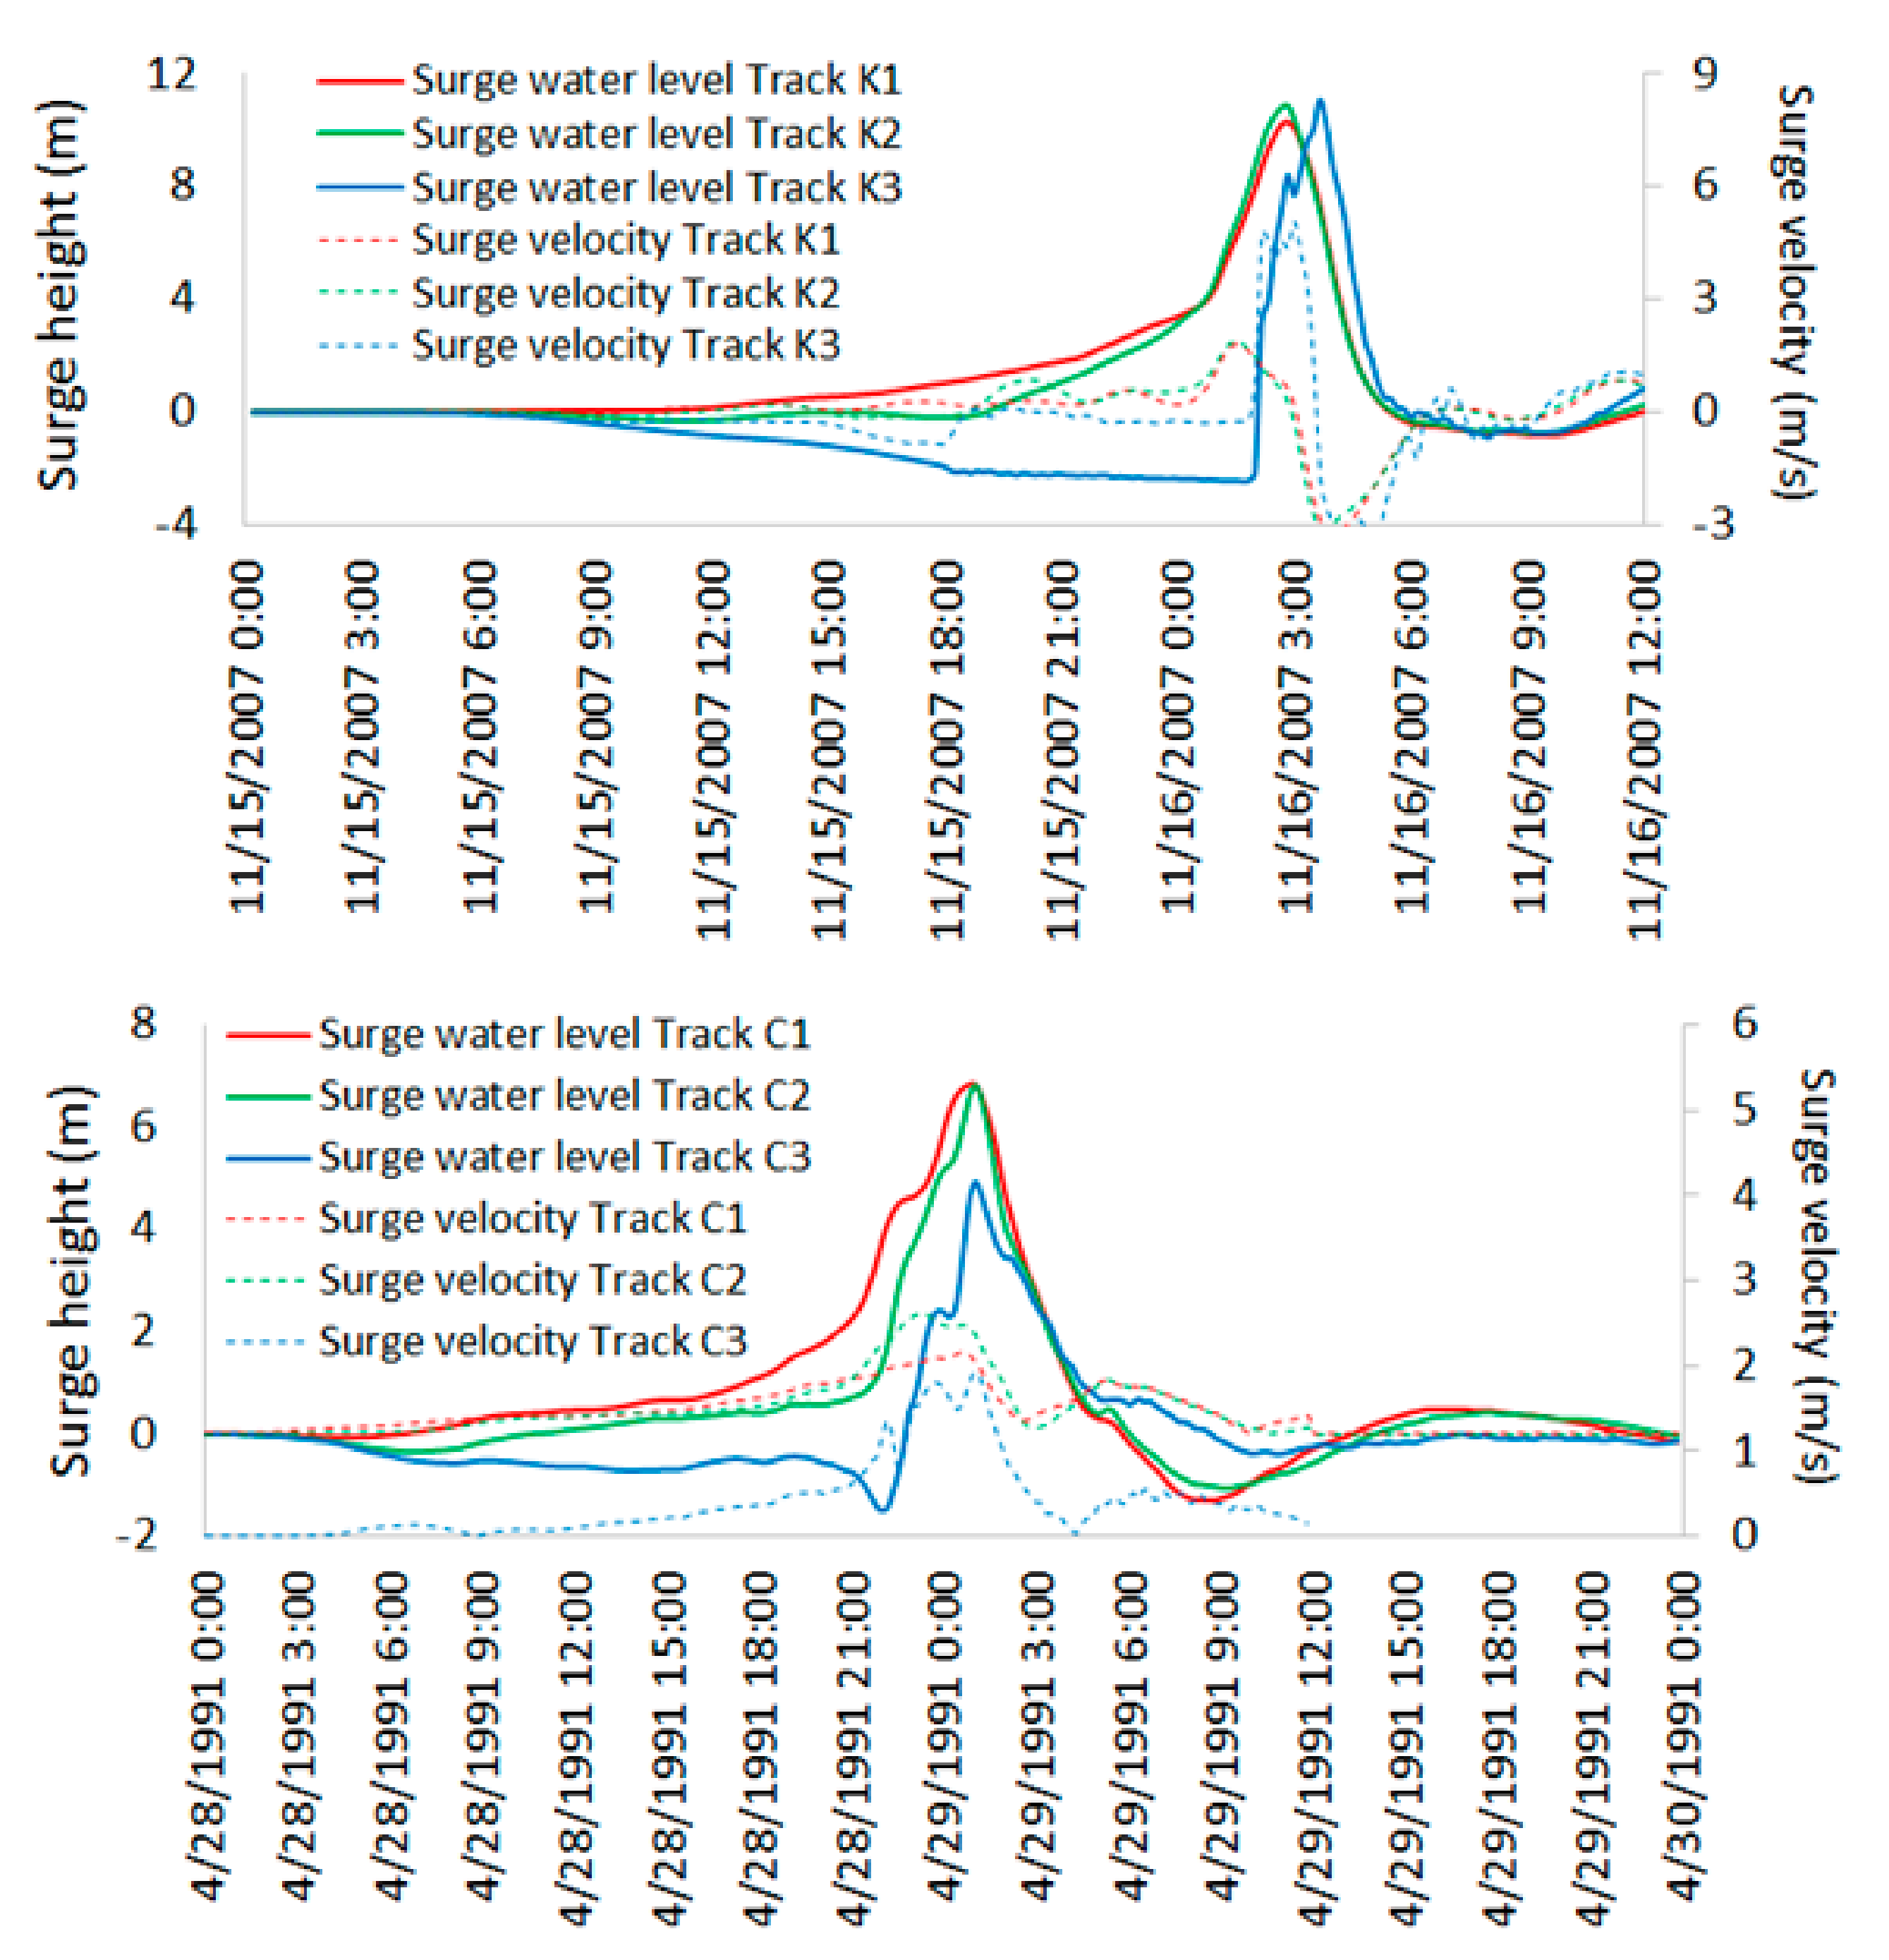
Figure 14 shows the surge water level profiles and surge velocity towards the coast from “surge only” runs at the Khulna and Chittagong coasts at three different cyclone landfall crossing angles. From the figure, it is clearly evident that surge duration is at a minimum for Track K3 in the case of the Khulna coast and Track C3 in the case of the Chittagong coast, i.e., when the cyclone landfall crossing angles are the smallest. This is can be primarily attributed to the smallest spatial extent of the water body on the right side of tracks K3 and C3. As a result, these tracks are able to generate the lowest amount of surge volumes compared to the other tracks. For the Khulna coast, the surge profile for Track C3 has a very sharp rise in water level compared to the other two tracks of this coast. This is due to the very strong surge velocity towards the coast generated by this track as compared to the other two tracks. On the other hand, at the Chittagong coast, the highest surge velocity towards the coast is generated by Track C2, and the sharpest rise in surge water level is observed for this track compared to the other two tracks. As strong surge velocity is expected to generate high momentum as well as substantial force on coastal levees and other protective structures, these results are useful to the implementing agencies for the design of coastal structures along the coast of Bangladesh.

5. Discussion

Bangladesh will rank third (after China and India) among the top 15 countries in terms of population exposure to extreme water level by the 2070s from the combined impact of current exposure, climate change and subsidence and socio-economic change [3]. Nicholls et al. [2] reported that, during the past two centuries, 42% of tropical cyclone-associated deaths have occurred in Bangladesh. Thus, storm surge flood is a major disaster in Bangladesh that needs proper planning and management measures to ensure sustainable development of the country. The results of the present paper suggest that cyclone translation speed has a significant impact on surge volume and slower moving storms tend to produce larger surge volume towards the coast. At the same time, the impact of cyclone translation speed inside and outside the RMW are quite different. From the existing satellite based warning system, the cyclone translation speed can be estimated and the respective affected areas may be provided more accurate warning about the possible embankment overtopping and subsequent inundation that may be caused by the cyclone. In addition, the arrival times of surge waves at different parts of the Bangladesh coast may be predicted more accurately based on the present study to provide essential warning lead time to the coastal inhabitants. The cyclone path analysis results provide useful information regarding the influence zone under different cyclone tracks. The surge heights as well as surge arrival times at different parts of the Bangladesh coast can be predicted and forecasted. The information regarding cyclone landfall crossing angle can also be used effectively to determine the surge duration as well as surge volume or possible inundation. The potential force upon coastal embankments during a sharply rising surge wave may also be calculated beforehand to investigate possible damage and other consequences. Thus, the results of the present study are expected to contribute to reducing the storm surge flood disaster risks along the coastal areas of Bangladesh from the above-mentioned aspects.
Regarding the limitations of the present model study, there are two issues. Firstly, a rectangular grid system with horizontal resolution of 30 arc-second has been employed in this study. Considering the complex coastline along the Bangladesh coast using curvilinear grids with finer resolution may have been more desirable. However, in the context of the objectives of the present study, which primarily focuses on the nonlinear surge–tide interaction in the study area, the resolution and grid system of the model is adequate. Secondly, to simulate the inundation from the surge waves, high-resolution topography data is necessary, which is presently not available to the authors. Thus, even though the present model employs a wetting-and-drying boundary condition, inundation simulation is not accurate, which may cause overestimation of surge height at the coast.

6. Conclusions

Three cyclone track properties: cyclone translation speed, cyclone path and cyclone landfall crossing angle, in combination with tidal phase shift, have been investigated to find out the impact upon surge characteristics. A two-dimensional hydrodynamic model in horizontal direction (2DH) coupled with a storm-surge model has been employed for surge height computation. The model for tidal propagation is based on nonlinear shallow water equations. The coupled model was validated with the data of Cyclone Sidr of 2007 by Hussain and Tajima [10].
At first, the impact of cyclone translation speed upon the calculated wind speed is analyzed close to the landfall location and away from the landfall location. Near the landfall location, reducing the translation speed reduces only the second peak in wind field and thereby reduces the overall magnitude of wind speed. However, away from landfall location, reducing the translation speed reduces maximum wind speed. For computed surge profiles, when the surge height is directly forced by the cyclonic wind speed, especially within the RWM, faster translation speed produces reduced surge height as the cyclone gets less time to force the water. On the other hand, at locations further away from the landfall outside the RMW, surge waves travel as a propagating long wave where higher surges are produced by larger wind speeds. It is found that surge arrival times are more and more affected by tidal phase when cyclone translation speed is reduced. In addition, for reduced cyclone translation speeds, the maximum surges tend to occur around rising and high water periods at locations that are situated away from the landfall location. As a result, surge clustering phenomena does not appear for the “faster” tracks but becomes dominant as the translation speed reduces. It is also observed that the local enhancement of external surges are significantly influenced by the tidal phase and cyclone translation speed.
From the analysis of seven hypothetical parallel cyclone paths, it is found that local bathymetry and coastline configurations strongly influence the surge height and surge arrival time along the Bangladesh coast. Incorporation of tidal interaction in model runs affect the surge durations significantly. The spatial distribution of maximum surge heights for different tracks suggests that, as the track moves towards the east, the extent of coastline under the threat of surge wave reduces. Cyclone tracks making landfall at the Char Montaz or Sandwip produce large surge waves at the northern part of the Meghna Estuary. However, the spatial extent of high surge wave for these cases are smaller compared to the tracks that make landfall on the western part of Bangladesh coast covering almost the entire coastline of Bangladesh. From the surge height of all the tracks, it may also be concluded that, wherever the landfall takes place along the coast of Bangladesh, the northeastern part of the Meghna Estuary, starting from Urir Char, Sandwip, Mirsorai, and Sitakunda towards Chittagong, remains under the risk of storm surge disaster.
From the analyses of cyclone landfall crossing angles at the Khulna and Chittagong coasts, it is observed that surge durations are the smallest at both the coasts when the coastline crossing angles are the smallest. In addition, it was found that for the Khulna coast, storm surge influence zone is the largest for the smallest coastline crossing angle, whereas, for the Chittagong coast, the influence zone is very narrow for smallest coastline crossing angles.

Acknowledgments

Financial support of the study is provided by the Board of Governors of Institute of Water and Flood Management (IWFM) of Bangladesh University of Engineering and Technology (BUET).

Author Contributions

All of the authors contributed substantially to the present research. Y.T. developed the numerical model for tidal propagation and storm surge simulation. M.A. Hussain. and Y.T. conceptualized and designed the numerical experiments and analyzed the results presented in Section 4.1. M.A. Hussain ran all the numerical experiments for this section. Later, M.A. Hussain, M.A. Hossain and P.D. designed the numerical experiments and analyzed the results presented in Section 4.2 and Section 4.3. P.D. ran all the numerical experiments of Section 4.2 and Section 4.3. M.A. Hussain wrote the paper.

Conflicts of Interest

The authors declare no conflict of interest. The founding sponsors had no role in the design of the study; in the collection, analyses, or interpretation of data; in the writing of the manuscript, and in the decision to publish the results.

References

  1. Parker, B. The Power of the Sea: Tsunamis, Storm Surges, Rogue Waves, and Our Quest to Predict Disasters, 1st ed.; Palgrave Macmillan: Basingstoke, UK, 2010; ISBN 978-0-230-61637-0. [Google Scholar]
  2. Nicholls, R.J. Coastal megacities and climate change. GeoJournal 1995, 37, 369–379. [Google Scholar] [CrossRef]
  3. Susan, H.; Nicholls, R.J.; Ranger, N.; Hallegatte, S.; Corfee-Morlot, J.; Herweijer, C.; Chateau, J. A global ranking of port cities with high exposure to climate extremes. Clim. Chang. 2011, 104, 89–111. [Google Scholar] [CrossRef] [Green Version]
  4. Paul, B.K. Why relatively fewer people died? The case of Bangladesh’s Cyclone Sidr. Nat. Hazard 2009, 50, 289–304. [Google Scholar] [CrossRef]
  5. Debsarma, S.K. Simulations of storm surges in the Bay of Bengal. Mar. Geod. 2009, 32, 178–198. [Google Scholar] [CrossRef]
  6. Akhand, M.H. Disaster management and cyclone warning system in Bangladesh. In Early Warning Systems for Natural Disaster Reduction; Zschau, J., Kuppers, K.N., Eds.; Springer: Berlin, Germany, 2003. [Google Scholar] [CrossRef]
  7. Chowdhury, A.M.R.; Bhuyia, A.U.; Choudhury, A.Y.; Sen, R. The Bangladesh cyclone of 1991: Why so many people died. Disasters 1993, 17, 291–303. [Google Scholar] [CrossRef] [PubMed]
  8. Tajima, Y.; Hamada, Y.; Hussain, M.A. Impact of dynamic morphology change on storm surge disaster risks along the Meghna Estuary. In Proceedings of the 8th international conference on Asian and Pacific Coasts (APAC), Chennai, India, 7–10 September 2015; pp. 947–954. [Google Scholar]
  9. Karim, M.F.; Mimura, N. Impacts of climate change and sea-level rise on cyclonic storm surge floods in Bangladesh. Glob. Environ. Chang. 2008, 18, 490–500. [Google Scholar] [CrossRef]
  10. Hussain, M.A.; Tajima, Y. Numerical investigation of surge–tide interactions in the Bay of Bengal along the Bangladesh coast. Nat. Hazards 2017, 86, 669–694. [Google Scholar] [CrossRef]
  11. Flather, R.A. A storm surge prediction model for the northern Bay of Bengal with application to the cyclone disaster in April 1991. J. Phys. Oceanogr. 1994, 24, 172–190. [Google Scholar] [CrossRef]
  12. As-Salek, J.A.; Yasuda, T. Effects of the characteristics of cyclones hitting Noakhali–Cox’s Bazar coast on the storm-surges in the Meghna estuary. Coast. Eng. Jpn. 1996, 39, 79–110. [Google Scholar]
  13. As-Salek, J.A.; Yasuda, T. Interaction between wind- and pressure-response of storm surges in the Meghna estuary and the effect of astronomical tide on them. In Proceedings of the Oceanology International’98, London, UK, 10–13 March 1998; pp. 151–160. [Google Scholar]
  14. As-Salek, J.A. Coastal trapping and funneling effect on storm surges in the Meghna estuary in relation with the cyclones hitting Noakhali–Cox’s Bazar coast of Bangladesh. J. Phys. Oceanogr. 1998, 28, 227–249. [Google Scholar] [CrossRef]
  15. As-Salek, J.A.; Yasuda, T. Tide–surge interaction in the Meghna Estuary: Most severe conditions. J. Phys. Oceanogr. 2001, 31, 3059–3072. [Google Scholar] [CrossRef]
  16. Kim, S.Y.; Yasuda, T.; Mase, H. Numerical analysis of effects of tidal variations on storm surges and waves. Appl. Ocean Res. 2008, 30, 311–322. [Google Scholar] [CrossRef]
  17. Prandle, D.; Wolf, J. Interaction of surge and tide in the North Sea and River Thames. Geophys. J. R. Astron. Soc. 1978, 55, 203–216. [Google Scholar] [CrossRef]
  18. Wolf, J. Surge-tide interaction in the North Sea and River Thames. In Floods Due to High Winds and Tides; Peregrine, D.H., Ed.; Elsevier: Amsterdam, The Netherlands, 1981; pp. 75–94. [Google Scholar]
  19. Horsburgh, K.J.; Wilson, C. Tide surge interaction and its role in distribution of surge residuals in the North Sea. J. Geophys. Res. 2007, 112. [Google Scholar] [CrossRef]
  20. Murty, T.S.; Flather, R.A.; Henry, R.F. The storm surge problem in the Bay of Bengal. Prog. Oceanogr. 1986, 216, 195–233. [Google Scholar] [CrossRef]
  21. Katsura, J.; Hayashi, T.; Nishimura, H.; Isobe, M.; Yamashita, T.; Kawata, Y.; Yasuda, T.; Nakagawa, H. Storm Surge and Severe Wind Disasters Caused by the 1991 Cyclone in Bangladesh; Japan Ministry of Education, Science and Culture: Tokyo, Japan, 1992.
  22. Rego, J.L.; Li, C. On the importance of the forward speed of hurricanes in storm surge forecasting: A numerical study. Geophys. Res. Lett. 2009, 36. [Google Scholar] [CrossRef]
  23. Emanuel, K.A. The Storm Surge. Divine Wind: The History and Science of Hurricanes; Oxford University Press: Oxford, UK, 2005; pp. 147–152. [Google Scholar]
  24. Fritz, H.M.; Blount, C.; Sokoloski, R.; Singleton, J.; Fuggle, A.; McAdoo, B.G.; Moore, A.; Grass, C.; Tate, B. Hurricane Katrina storm surge distribution and field observations on the Mississippi Barrier Islands. Estuar. Coast. Shelf Sci. 2007, 74, 12–20. [Google Scholar] [CrossRef]
  25. Irish, J.L.; Resio, D.T.; Ratcliff, J.J. The influence of storm size on hurricane surge. J. Phys. Oceanogr. 2008, 38, 2003–2013. [Google Scholar] [CrossRef]
  26. Needham, H.F.; Keim, B.D. Correlating storm surge heights with tropical cyclone winds at and before landfall. Earth Interact. 2014, 18. [Google Scholar] [CrossRef]
  27. Soria, J.L.A.; Switzer, A.D.; Villanoy, C.L.; Fritz, H.M.; Bilgera, P.H.T.; Cabrera, O.C.; Siringan, F.P.; Maria, Y.Y.-S.; Ramos, R.D.; Fernandez, I.Q. Repeat storm surge disasters of Typhoon Haiyan and its 1897 predecessor in the Philippines. Bull. Am. Meteorol. Soc. 2016, 97, 31–48. [Google Scholar] [CrossRef]
  28. Shibayama, T.; Tajima, Y.; Kakinuma, T.; Nobuoka, H.; Yasuda, T.; Ahsan, R.; Rahman, M.; Islam, M.S. Field survey of storm surge disaster due to cyclone SIDR in Bangladesh. Proc. Coast. Eng. JSCE 2010, 55, 1396–1400. [Google Scholar] [CrossRef]
  29. Tajima, Y.; Gunasekara, K.H.; Shimozono, T.; Cruz, E.C. Study on locally varying inundation characteristics induced by Super Typhoon Haiyan. Part 1: Dynamic behavior of storm surge and waves around San Pedro Bay. Coast. Eng. J 2016, 58. [Google Scholar] [CrossRef]
  30. Tajima, Y.; Yasuda, T.; Pacheco, B.M.; Cruz, E.C.; Kawasaki, K.; Nobuoka, H.; Miyamoto, M.; Asano, Y.; Arikawa, T.; Ortigas, N.M.; et al. Initial report of JSCE-PICE joint survey on the storm surge disaster caused by Typhoon Haiyan. Coast. Eng. J. 2014, 56. [Google Scholar] [CrossRef]
  31. Matsumoto, K.; Takanezawa, T.; Ooe, M. Ocean tide models developed by assimilating TOPEX/POSEIDON altimeter data into hydrodynamical model: A global model and a regional model around Japan. J. Oceanogr. 2000, 56, 567–581. [Google Scholar] [CrossRef]
  32. Takanezawa, T.; Matsumoto, K.; Ooe, M.; Naito, I. Effects of the period ocean tides on Earth rotation, gravity and crustal deformation predicted by global barotropic model—Period from Mtm to Sa. J. Geod. Soc. Jpn. 2001, 47, 545–550. [Google Scholar]
  33. Bricker, J.D.; Takagi, H.; Mas, E.; Kure, S.; Adriano, B.; Yi, C.; Roeber, V. Spatial variation of damage due to storm surge and waves during typhoon Haiyan in the Philippines. J. Hydraul. Coast. Environ. Eng. 2014, 70, 231–235. [Google Scholar] [CrossRef]
  34. Kim, S.Y.; Mori, N.; Shibutani, Y.; Yasuda, T.; Mase, H. Hindcast of storm surges and waves caused by Typhoon Haiyan using a coupling model of surge and wave. J. Hydraul. Coast. Environ. Eng. 2014, 70, 226–230. [Google Scholar] [CrossRef]
  35. Skamarock, W.C.; Klemp, J.B.; Dudhia, J.; Gill, D.O.; Baker, O.M.; Duba, M.G.; Huang, X.Y.; Wang, W.; Powers, J.G. A Description of the Advanced Research WRF Version 3; National Center for Atmospheric Research: Boulder, CO, USA, 2008. [Google Scholar]
  36. Tsuboki, K.; Sakakibara, A. Large-Scale Parallel Computing of Cloud Resolving Storm Simulator in High Performance Computing; Zima, H.P., Ed.; Springer: New York, NY, USA, 2002; pp. 243–259. [Google Scholar]
  37. Mori, N.; Kato, M.; Kim, S.; Mase, H.; Shibutani, Y.; Takemi, T.; Tsuboki, K.; Yasuda, T. Local amplification of storm surge by Super Typhoon Haiyan in Leyte Gulf. Geophys. Res. Lett. 2014, 41, 5106–5113. [Google Scholar] [CrossRef] [PubMed]
  38. Myers, V.A. Characteristics of United States Hurricanes Pertinent to Levee Design for Lake Okeechobee, Florida; 32; U.S. Department of Commerce, Weather Bureau: Washington, DC, USA, 1954.
  39. Kato, H. Study on risk assessment of storm surge flood. Tech. Natl. Inst. Land Infrastruct. Manag. 2005, 112, 1346–7328. [Google Scholar]
  40. Mitsuya, Y.; Fujii, T. Analysis and synthesis of typhoon wind pattern over Japan. Bull. Disaster Prev. Res. Inst. 1987, 37, 169–185. [Google Scholar]
  41. Oey, L.Y.; Ezer, T.; Wang, D.P.; Fan, S.J.; Yin, X.Q. Loop current warming by Hurricane Wilma. Geophys. Res. Lett. 2006, 33. [Google Scholar] [CrossRef]
  42. Huang, Y.; Weisberg, R.H.; Zheng, L.; Zijlema, M. Gulf of Mexico hurricane wave simulations using SWAN: Bulk formula-based drag coefficient sensitivity for Hurricane Ike. J. Geophys. Res. 2013, 118, 3916–3938. [Google Scholar] [CrossRef]
  43. Powell, M.D.; Vickery, P.J.; Reinhold, T. Reduced drag coefficient for high wind speeds in tropical cyclones. Nature 2003, 422, 279–283. [Google Scholar] [CrossRef] [PubMed]
  44. Ward, R. General Bathymetric Chart of the Oceans; International Hydrographic Organization: Liverpool, UK, 2010; Volume 14. [Google Scholar]
  45. Taguchi, Y.; Tajima, Y.; Hussain, M.A. Monitoring and investigation of dynamic morphological change in Meghna Estuary. J. JSCE Hydraul. Coast. Environ. Eng. 2013, 69, 636–640. [Google Scholar] [CrossRef]
  46. Johns, B.; Rao, A.D.; Dube, S.K.; Sinha, P.C. Numerical modeling of tide–surge interaction in the Bay of Bengal. Philos. Trans. R. Soc. 1985, A313, 507–535. [Google Scholar] [CrossRef]
  47. Zhang, C. Effect of Hurricane Forward Speed and Approach Angle on Coastal Storm Surge. Master’s Thesis, Department of Oceanography and Coastal Sciences, Louisiana State University, Baton Rouge, LA, USA, May 2012. [Google Scholar]
  48. Mercer, D.; Sheng, J.; Greatbatch, R.J.; Bobanović, J. Barotropic waves generated by storms moving rapidly over shallow water. J. Geophys. Res. 2002, 107, 17. [Google Scholar] [CrossRef]
  49. Wolf, J. Coastal flooding: Impacts of coupled wave–surge–tide models. Nat. Hazards 2009, 49, 241–260. [Google Scholar] [CrossRef] [Green Version]
  50. Pugh, D.T. Tides Surges and Mean Sea-Level; Wiley: Chichester, UK, 1987; p. 472. [Google Scholar]
  51. Feng, X.; Yin, B.; Yang, D. Effect of hurricane path on storm surge response at Tianjin, China. Estuar. Coast. Shelf Sci. 2012, 106, 58–68. [Google Scholar] [CrossRef]
  52. Hussain, M.A.; Tajima, Y. Tidal propagation characteristics at the eastern part of Meghna Estuary. J. Coast. Zone Manag. Unpublished work. 2017. [Google Scholar]
Figure 1. Tracks of Cyclone Sidr of 2007 and Cyclone 1991 along with the locations of interest in the Bangladesh coast.
Jmse 05 00052 g001
Figure 2. Computation domain along with Bathymetry of northern Bay of Bengal. The inner rectangle shows the coastlines along the Bangladesh coast.
Jmse 05 00052 g002
Figure 3. (Upper panel) seven hypothetical parallel cyclone tracks including the base case (Track 3: Cyclone Sidr); (Lower panel) three tracks each at the Khulna and Chittagong coasts for the investigation of coastline crossing angle.
Jmse 05 00052 g003
Figure 4. Computed wind speed and surge profiles during Cyclone Sidr; at Patharghata (upper panel) and at Char Montaz (lower panel). Surge profiles are plotted in primary axis and wind speed in secondary axis. Computations including translation speed are represented by firm lines and those excluding translation speed are represented by dotted lines.
Jmse 05 00052 g004
Figure 5. Computed tidal water levels, surge profiles and surge peaks at different tidal phases at Sitakunda for “faster” cases (top panel), “base” cases (middle panel) and “slower” cases (bottom panel).
Jmse 05 00052 g005
Figure 6. Maximum surge height (m) at different tidal phases for three track speed cases during Cyclone Sidr at Char Montaz (upper panel) and at Sitakunda (lower panel).
Jmse 05 00052 g006
Figure 7. Delay in maximum surge arrival (in minutes) at different tidal phases for three track speed cases during Cyclone Sidr at Char Montaz (upper panel) and at Sitakunda (lower panel).
Jmse 05 00052 g007
Figure 8. Computed wind speed and surge water levels for “faster”, “base” and “slower” cases at Chittagong. Firm lines represent wind speeds and surge heights and open circles represent surge height when wind is artificially removed after landfall. Red lines and circles correspond to “faster” cases, blue lines and circles correspond to “base” cases and green lines and circles correspond to “slower” cases.
Jmse 05 00052 g008
Figure 9. Comparison among surge profiles for “faster” (left), “base” (center) and “slower” (right) cases at Sitakunda at different tidal phases at 2 h intervals when wind is artificially removed after landfall; thick continuous lines: tide only runs, thin continuous lines: surge–tide interaction runs and dotted lines: surge–tide interaction runs when wind is removed.
Jmse 05 00052 g009
Figure 10. (Upper panel) surge profiles from seven parallel tracks at the nearest landfall locations at the right side of the tracks along the Bangladesh coast; (Lower panel) a closer view of bathymetry along the seven parallel tracks.
Jmse 05 00052 g010
Figure 11. Surge profile (firm lines) along with local tidal water level (dotted line) at different tidal phases at landfall location for Track 5—Char Montaz (left panel), and at the landfall location for Track 6—Sandwip (right panel).
Jmse 05 00052 g011
Figure 12. Spatial distribution of maximum surge height (m) at different tidal phases for Tracks 1–7.
Jmse 05 00052 g012
Figure 13. Spatial distribution of maximum surge height (m) for “surge-only” cases for Tracks K1–3 at the Khulna coast (left panel) and for Tracks C1–3 at the Chittagong coast (right panel).
Jmse 05 00052 g013
Figure 14. Surge water level profiles and surge velocity from “surge only” runs at the Khulna coast (upper panel) and the Chittagong coast (lower panel) for three different cyclone landfall crossing angles.
Jmse 05 00052 g014
Table 1. Cyclone parameters of the two previous cyclone events considered as base cases.
Cyclone ParametersCyclone 1991Cyclone Sidr
Minimum central pressure (observed)918 hPa944 hPa
Maximum 1 min sustained wind speed (observed)250 km/h260 km/h
Radius of Maximum Wind, RMW (calculated)55–88 km73–125 km
Table 2. Forward movement speed of three cyclone tracks being analyzed.
TrackForward Speed (km/h)Forward Speed (miles/h)
Slower17.5 (4.9 m/s)11.0
Base (Sidr)26.3 (7.3 m/s)16.4
Faster53.8 (14.9 m/s)33.6

