Article

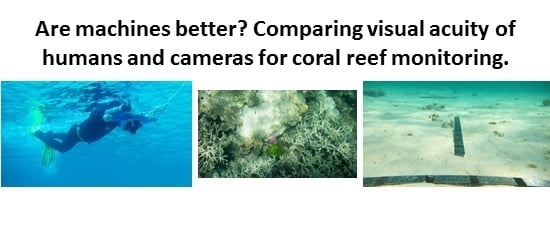
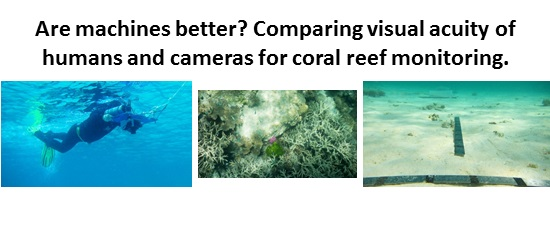
Comparison of Human and Camera Visual Acuity—Setting the Benchmark for Shallow Water Autonomous Imaging Platforms

Australian Institute of Marine Science, PMB 3 MC, Townsville Qld. 4810, Australia
*
Author to whom correspondence should be addressed.
J. Mar. Sci. Eng. 2016, 4(1), 17; https://doi.org/10.3390/jmse4010017
Submission received: 30 November 2015 / Revised: 9 February 2016 / Accepted: 14 February 2016 / Published: 24 February 2016
(This article belongs to the Section Ocean Engineering)

Abstract

:
A comparison was made between the underwater visual acuity of human observers and a high-end stills camera as applied to visual surveys of shallow water coral reefs. The human observers had almost double the visual acuity of the camera, recording a Snellen eye test score of 20/8 at 4.3 m depth against 20/15 for the camera. The human observers had a field of view of 7.8 m (horizontal) by 5.8 m at 4.3 m depth while the camera had a field of view of 4.46 m by 2.98 m, or only one-third of the area observed by the snorkelers. The human observers were therefore able to see a three-times-larger field of view at twice the resolution of the camera. This result comes from the observers actively scanning the scene to put the area of interest in the part of the retina with the greatest resolving power (the fovea), increasing the apparent resolving power of their eyes, against the camera which resolved equally across the image. As a result, in actively identifying targets, humans exceeded the camera, but for more passive observation work they may be closer to the performance of the camera. The implications for autonomous platforms are that to match the human observers for target recognition, platforms will need to operate lower (to increase resolution) and longer (to sample the same area) and so issues such as collision avoidance and navigation will be critical to operationalizing autonomous systems.

Graphical Abstract

1. Introduction

There is an increasing need to replace or supplement diver and snorkeler based marine field sampling with sampling based on autonomous platforms, such as Autonomous Surface Vessels (ASVs) or Autonomous Underwater Vehicles (AUVs). This is being driven by the need to sample in deep areas (below dive-able depth or around 30 m [1,2]), to sample at night or in murky conditions, or to work in areas inhabited by potentially hazardous animals such as sharks or crocodiles [3,4].
For many autonomous platforms visual imaging systems are the main form of information collection [5]. These include standard digital cameras, hyper-spectral cameras, three-dimensional (3D) and 360 degree rigs using a range of lighting from ambient to wavelength-specific light sources (such as UV light) [6]. In designing cameras for new platforms there is an implied assumption that these cameras can capture the same level of information as a diver or snorkeler can using their eyes, with the benefit that the camera produces a permanent record that can be analyzed by human or machine vision systems. This assumption needs to be tested by defining what a human observer can perceive and then comparing or benchmarking this against what a camera system can achieve. The camera system can be benchmarked on what a human can interpret from the captured images (machine capture + human interpretation) or against an automated image analysis system (machine capture + machine interpretation).
This study looks to provide an initial comparison of the visual acuity of two snorkelers and a modern camera system as applied to the manta-tow sampling method, a common method for observing shallow water coral reefs [7]. The manta-tow method involves an observer on snorkel being towed on the surface behind a small vessel and assessing the condition of the benthos or reef over a series of two-minute tows. At the end of the two minutes a summary of the reef just seen is recorded on an underwater slate before the next two-minute tow is started. This method is quick and simple but requires at least three people (snorkeler, boat driver and safety observer) and does not create a permanent record of what is seen, apart from the summary record. There are other coral reef and shallow water visual assessment methods, such as line intercept transects [8] and fish visual surveys [9,10,11], that are also amenable to being replaced by autonomous platforms using still or video imaging systems [2,6,7]. Note that this was just an initial study using one site, at one time, with two observers; it is hoped to extend this work to other sites and water types as field opportunities allow.

2. Experimental Section

The manta-tow method uses a small floating wooden board, approximately 70 cm × 50 cm, which a snorkeler holds onto as they get towed along the surface around the reef. The board holds a sheet of underwater paper for recording what they observe. For this study an existing manta tow board was re-purposed by attaching a Sony® A7r 36 mega-pixel full frame camera (Tokyo, Japan) in a Nauticam® NA-A7 underwater housing (Hong Kong, China) with a Nikon UW-Nikkor® 20 mm f2.8 lens (Tokyo, Japan) to the lower side of the board to give a view of the bottom equivalent to what a snorkeler would see. The underwater camera housing was adapted to allow for external power and camera control. On the upper side of the board a series of sensors were mounted including a sonar altimeter (Tritech® PA500, Aberdeen, Scotland), a roll/tilt sensor (LORD MicroStrain® 3DM-GX4-25, Williston, VT, USA) and a GPS unit, all controlled by a Raspberry Pi® microcomputer (Caldecote, UK) located in a waterproof instrument pod. Figure 1 shows the set up and the location of the main components.
The manta board rig allowed the collection of position data via GPS (using a small aerial that remained above the water during tows), distance to the bottom via a sonar altimeter and roll/tilt/acceleration data, all synchronized by the GPS time signal. The camera was synced to the other data by photographing another GPS unit and then correcting the internal clock of the camera to the common GPS time. This allowed the precise location, altitude (equivalent to bottom depth), speed, direction, and orientation of the camera to be recorded for each image taken. The manta board rig was controlled by the snorkeler to be just under the surface with the camera facing directly down.
A number of visual targets were printed on A3 paper (279 × 420 mm), laminated and weighted down to stay on the bottom. Two 1 m steel rulers were used to give distance measures. A small depth sensor (Schlumberger® CTD Diver, Houston, TX, USA) was attached to one of the targets to give a separate measure of depth. The visual targets included A3-sized print-outs of the standard Snellen eye chart [12], a color chart for white balance adjustments, and print outs with varying-sized lines to check what level of detail could be seen by the snorkelers and the camera. The visual targets are shown in Figure 2.
The visual targets were positioned in approximately four-meter deep water in a sandy area off Wistari Reef in the southern part of the Great Barrier Reef, Australia. The two metal rulers were arranged in a “T” shape at the start of a flat sandy area with the other visual targets arranged along a line over which the snorkelers were towed (see Figure 3). Conditions for the sampling were excellent with clear skies, calm seas and very clear water. The area chosen consisted of flat sandy region with a depth of around 4–5 m in a sheltered back reef area. All runs were done over a period of about 30 min, mid-morning, at the same location with effectively the same conditions.
The snorkelers were towed at 2 knots over the targets (which they had not previously seen) three times; once to determine the visual acuity using the Snellen chart, the second to read off the metal ruler markings and the third to look at resolving power using the left-most chart in Figure 2. Each observer was only given one pass per target to determine what they could observe to ensure that they did not have prior knowledge of what they were seeing. For each observer run the camera was fired once a second along the tow to capture the same information. The best images were then used for the comparison; in particular images with the targets at the center where lenses typically perform best [13] were selected although the uniformity of the sampling conditions meant that the images were all of similar quality (sharpness, detail and lighting).
The camera images were recorded as raw files (as Sony® AWR files, Tokyo, Japan) and converted to Adobe® Digital Negative (DNG) files using the Adobe® DNG Converter (version 9.2, San Jose, CA, USA); from there they were imported into Adobe Lightroom® (version 4.4, San Jose, CA, USA) and processed in Adobe Photoshop® (version CS5.1, San Jose, CA, USA). For all of the field images presented here the details are: Sony A7r camera, Nikon 20 mm f2.8 UW-Nikkor Lens, depth 4.3 m, exposure f8.0, ISO 100, shutter 1/320 s, white balance 7900 K, camera speed 2 knots moving right to left.

3. Results

3.1. Visual Field of View

The measured field of view from the camera system with a 20 mm lens on a full-frame sensor in 4.3 m of water, from Figure 3, was 16.5 pixels/cm to give a field of view of 4.46 m horizontally and 2.98 m vertically. This equates to an angular field of view of 54 degrees and contrasts to a theoretical in-air measurement for the same equipment of 7.74 m × 5.16 m [14]. This represents a 66% reduction in field of view or, conversely, a multiplier of three times.
The field of view for the snorkelers was measured by getting them, while in the water with their eyes below surface level, to extend their arms until they could just see their hands and to measure this angle using a camera from above. Note the snorkelers wore their standard masks while doing the tests as the mask limits peripheral vision.
For the two snorkelers tested, the horizontal angular field of view was 80° for the first observer and 86° for the second (Figure 4), indicating that the mask severely limited peripheral vision (“normal” peripheral vision is over 130° [15]); the differences between the two mask values were most likely due to differing mask design. Using an angular field of view of 85 degrees, for a depth of 4.3 m, gives a snorkeler field of view of around 7.8 m horizontally by 5.8 m vertically against the camera value of 4.46 m × 2.98 m. This means the snorkelers were seeing an area of 45 m2 versus 13 m2 for the camera, or over three times the area.

3.2. Visual Acuity

A standard Snellen eye chart [12] (right-most part of Figure 2) was used to record visual acuity. The Snellen chart measures visual acuity by comparing what a particular person can discern at a set distance from the eye chart compared to what a person with normal vision can discern: 20/20 vision is where a normal person would be able to discern the letters/shapes at a distance of 20 ft (6 m) from the eye chart, and a score of 20/15 means that a person is able to discern at 20 ft what a person with normal eye sight would be able to see at 15 ft. Lower values for the second number indicate increased visual acuity (a score of 20/15 indicates a visual acuity 25% better than normal).
For the two snorkelers tested (neither of which wears glasses or other visual aids for long distance vision) both observers had better than 20/20 vision in air and could comfortably read down to 20/15 at a distance of 20 ft or 6 m from the chart. Using a distance to the chart of 4.3 m (the same as the water depth of the field data), both could see down to 20/13 in air with one person being able to read down to 20/10, which is better than “average”; at this distance normal vision would be 20/15 (15 ft is approximately 4.5 m or close to the field sampling depth of 4.3 m).
In water, both snorkelers were able to see down to 20/8 in 4.3 m of water, which is better than their in-air vision with an improvement of around 53%. At the same distance/depth, the best image of the same chart from the camera is shown in Figure 5. With the image enlarged to 100% the acuity of the camera is around 20/15 (top line of the right-hand side of the left image in Figure 6) and with mild sharpening, color balancing and contrast enhancement applied (right image in Figure 6), some parts of the 20/13 line are readable. As a result, the acuity of the camera is at best 20/13 and more likely around 20/15; this is significantly worse than that of the snorkelers (who both scored 20/8 in water).
For a distance of 4.3 m, normal vision in air would be approximately 20/15. Given the magnifying properties of water (around 130% [16]) this should increase for the snorkelers to around 20/11 underwater. As both snorkelers had better than normal in-air vision, at 20/13 for a 4.3 m distance, then, using a 1.33 magnification, this would put their in-water vision at around 20/9. Their actual in-water acuity was 20/8 or close to their theoretical score. The camera would therefore need to score 20/13 or better in water to match a human observer with normal vision and 20/8 or better to match the observers used in this study; at 20/15 it is well below what the humans achieved.
Note that the score of 20/15 for the camera is for a human interpreting the camera image, if the image was to be analyzed by image recognition software then realistically the 20/20 line (bottom of the left side of the left image in Figure 6) would be the smallest text that would be discernible.

3.3. Resolution

Using an image with a range of lines, spaces, text and crosses (see left image in Figure 2), the snorkelers were asked to record what they could see. The results from both snorkelers were the same; text was readable down to a 16 point size (5.6 mm high) and lines down to 2 mm in thickness and 2 mm of separation. From the camera, the same chart is shown in Figure 7 (at 100% resolution). The text is readable down to 24 points, the text at 16 points is less so, and the actual text resolving power for the camera value is probably around 20–22 point font versus 16 for the snorkelers. For black lines on a white background, the camera did as well as the snorkelers, seeing lines 2 mm wide spaced 2 mm apart.
The image of the rulers was also analyzed. With black markings on a grey steel background, the camera performance was less than that of the human observers. The human observers were able to identify the inch scale markings (text approximately 5 mm high) on the ruler from a depth of 4.3 m while the camera had trouble, requiring contrast enhancement and sharpening (using Adobe Photoshop®: contrast slider set to 15, “un-sharp mask” filter set to 100% with a radius of 3.1 pixels), to make the lower scale somewhat readable (Figure 8).

3.4. Color Balance

Using image manipulation software (Adobe Lightroom®), the image in Figure 9 was color-adjusted to reflect the same image target on land. The camera recorded images with a white balance of 7900 K; to give a balance that better reflected the actual image target, a white balance of 15,250 K was required.

4. Discussion

4.1. Visual Acuity

The results show that snorkelers, for the same depth, visual target and equivalent field of view, have significantly better visual performance than the current range of digital cameras. The camera set-up used is considered to be one of the best currently available [17,18] with the Nikkor lenses being one of the few lenses that are designed to work “wet”, meaning without a dome and associated additional air/water interface [17,18,19,20]. In general, the snorkelers were able to perceive detail at twice the resolution of the camera and, for the same water depth, had a field of view three times that of the camera. This was particularly so for text, where the human observers were able to recognize letter shapes even if they were only partially defined. In comparisons based just on shapes and lines, the human observers were still more effective than the camera but the difference was less pronounced. Under ideal conditions, such as black lines on a white background, the camera and human results were similar; under non-ideal conditions, such as the black markings on a grey steel ruler, the humans exceeded the camera.
The results need to be interpreted, however, with an understanding of how the human eye works. Unlike a camera, the resolving power of the eye is not uniform spatially, but rather the central part of the retina (the fovea) has a higher resolving power than the edge of the retina [15]. For the experiments conducted in this study, the snorkel observers would have automatically moved their eyes to place the target (the underwater charts) in the center of their vision (even if they kept their head still) and thus at the point of highest resolving power, while the camera will resolve all parts of the image equally. What this means is that the human eye may be very good at identifying known or anticipated targets, as the study showed that it outperformed the camera, but may be less good at scanning an entire scene or identifying items at the periphery. Unfortunately it was not possible to stop the observers from automatically looking at the targets so it was difficult to quantify the resolving power of an “off-target” area.
The study was limited to one time, one area, a small number of observers and, in particular, to one water and bottom type. Changing the optical properties of the water column (such as increased turbidity), lighting (such as overcast or dawn/dusk) and bottom type (bottom topography and complexity) may change the performance of both the camera and human observers. The study was conducted under ideal conditions (high light, clear water, uniform substrate, low waves); it would be interesting to look at how light and turbidity change visual acuity given the ability for the human eye to function in low light (which may favor the human observers) contrasted with the ability to post-process images to extract detail (which may favor the camera) [15].

4.2. Real World Use

Images taken over a nearby reef area (20 m from the test site, taken at the same time, see Figure 10) were visually analyzed by the authors for what information they could provide. Visually, the main benthic types could easily be discerned, as could the growth forms of the corals. From this and similar images it would be possible to identify the main benthic form (e.g., sand, coral, rubble, etc.), the growth form of any coral (branching, encrusting, digitate, etc.) and, for some easily identified taxa, some level of taxonomic information (such as the genus Acropora evident in the lower right and left of Figure 10).

4.3. Implications for Autonomous Monitoring

Humans are particularly good at target recognition, partially due to the way the eye scans to automatically position the area of highest resolving power over the target and partially because human brains are powerful image recognition engines [21]. So, for applications that involve the identification of targets, a human observer will potentially outperform a machine vision system. For passive observing, where the observer is analyzing an entire scene, camera systems can provide enough information for an equivalent analysis to be done, such as determining the main benthic forms from Figure 10. This means that the imaging system must be designed around the specific goal of the observing task rather than as a general purpose imaging platform.
The work showed that, for the study conditions, the camera needs to be closer to the subject to record the same level of detail as our eyes can perceive. This can be done optically, but given turbidity and light issues, this will normally mean having the camera physically closer. For the conditions encountered in this study (shallow clear water), the camera needed to be 50% closer to record the same level of detail; that is, the acuity of a person in a 5 m depth of water was matched by a camera 2–3 m from the same target. The need to be closer to the objects being observed means that camera systems will have a much smaller field of view and so the autonomous platform will need to do more samples/runs in order to cover the same area as a human observer; this will take more time and negate some of the potential efficiencies that autonomous platforms bring.
The other implication of needing to be closer to the bottom is that issues of collision avoidance, underwater navigation and positioning become critical. Running a platform at 2 m above a bottom with complex topology is a far easier task than doing the same at 1 m or less. This means that advances in underwater navigation are a critical component of operationalizing underwater autonomous platforms.
The final implication is the need to move away from general purpose imaging systems based on consumer-grade equipment to purpose-built systems based on machine vision systems. This includes high resolution sensors, quality optics, use of raw or non-compressed image and video formats, use of stills over video where possible, and the need to implement lighting solutions that maximize the quality of the images and video collected. The goal is to produce images of archival quality that are amenable to future automated image analysis systems. There are cameras that meet these needs but these are typically used in industrial applications (such as quality control in manufacturing) and so adapting these types of technologies to environmental monitoring is an important next step in developing autonomous underwater imaging platforms.

5. Conclusions

This short study showed that the currently available cameras and lenses cannot match a human observer for shallow water coral reef observations where the goal of the program is to identify particular targets (for example a particular type of coral or organism such as a crown-of-thorns starfish). In this scenario, trained observers tend to automatically use the highest resolving part of their eyes (by actively looking through moving their head and eyes to scan a scene), allowing them to not only have a greater optical acuity but, by scanning, to also have a greater field of view. This increased field of view and visual acuity coupled with the ability of the human mind to recognize shapes and objects [21] puts the human observer ahead for this type of observing. Where the observing goal involves more passive observation, such as estimating the cover of benthic forms where the entire scene needs to be scanned and analyzed, cameras should be able to match what humans can do. The ability of a camera to create a permanent record is an important advantage allowing change detection by comparing images taken at different times along with allowing future analysis of particular targets or benthic types.
The implication for autonomous platforms is that, to match human capability, the imaging systems need to be optimized in terms of the sensors, lenses, lighting, image formats and processing and deployment. There is a need to utilize advances in machine vision systems over consumer-grade equipment with the explicit goal of producing images suitable for automated image analysis to accommodate future advances in this area. For studies looking to identify particular targets (such as pest species), cameras will need to be located closer to the subject, about half what a person would need, with a corresponding reduction in field of view. The camera needs to record images in raw format to allow for color correction and sharpening to be done in post-processing and to ensure that compression artifacts, found in JPEG and other compressed formats, do not interfere with automated image analysis routines.
Positioning cameras closer to complex terrain, such as that found on a coral reef, requires more complex navigation and collision avoidance capabilities than what is needed if the system is able to operate further away from the target. Reducing the height also reduces the field of view, requiring more passes over an area to capture the entire scene. Autonomous platforms will therefore need to operate lower and longer, and so these requirements need to be part of the design specifications for platforms under development.
The limited nature of this study (one site and only two observers) highlights the need to better understand human and imaging system performances under a range of other conditions, especially in turbid water and low light. It also highlights that the type of observing (active target recognition or passive scene analysis) will change the relative strength of human and camera-based observing. A full understanding of the environment and goals of the observing needs to be obtained first to inform the specifications of the imaging system deployed. There is a need to move away from generic consumer-based solutions to targeted systems using industrial vision equipment tailored to deliver against the project outcomes.
A full understanding of the imaging requirements and corresponding limitations is needed in order to develop platform mission profiles that will deliver the required set of outcomes. This in turn will need to link into the fundamental platform design to ensure the platform can support the operational imaging requirements. These linkages, between platform design, mission planning and image outcomes, need to be fully understood so that new platforms are able to support the operational capabilities of the current imaging systems while delivering the required science outcomes.

Supplementary Materials

Supplementary File 1

Acknowledgments

The authors would like to thank Shaun Hahn and Ray Boyes of AIMS for help in conducting the field work as well as the staff of the Heron Island Research Station, run by the University of Queensland, for their help. All trademarks mentioned are the property of their respective owners. The authors also acknowledge the valuable input of the two reviewers and thank them for their help.

Author Contributions

Scott Bainbridge designed the study, oversaw the field work and analyzed the results. Scott Gardner designed and built the equipment rig, selected the test site and designed and conducted the field sampling. The other snorkelers who did the field work have been identified in the Acknowledgements. The manuscript was written by Scott Bainbridge with editorial input from Scott Gardner.

Conflicts of Interest

The authors declare no conflict of interest.

References

  1. Boavida, J.; Assis, J.; Reed, J.; Serrão, E.A.; Gonçalves, J.M. Comparison of small remotely operated vehicles and diver-operated video of circalittoral benthos. Hydrobiologia 2016, 766, 247–260. [Google Scholar] [CrossRef]
  2. Singh, W.; Örnólfsdóttir, E.B.; Stefansson, G. A camera-based autonomous underwater vehicle sampling approach to quantify scallop abundance. J. Shellfish Res. 2013, 32, 725–732. [Google Scholar] [CrossRef]
  3. Desa, E.; Madhan, R.; Maurya, P. Potential of autonomous underwater vehicles as new generation ocean data platforms. Curr. Sci. 2006, 90, 1202–1209. [Google Scholar]
  4. Patterson, M.; Relles, N. Autonomous underwater vehicles resurvey bonaire: A new tool for coral reef management. In Proceedings of the 11th International Coral Reef Symposium, Ft. Lauderdale, FL, USA, 7–11 July 2008; pp. 539–543.
  5. Armstrong, R.A.; Singh, H.; Torres, J.; Nemeth, R.S.; Can, A.; Roman, C.; Eustice, R.; Riggs, L.; Garcia-Moliner, G. Characterizing the deep insular shelf coral reef habitat of the hind bank marine conservation district (US virgin islands) using the seabed autonomous underwater vehicle. Cont. Shelf Res. 2006, 26, 194–205. [Google Scholar] [CrossRef]
  6. Kocak, D.M.; Dalgleish, F.R.; Caimi, F.M.; Schechner, Y.Y. A focus on recent developments and trends in underwater imaging. Mar. Technol. Soc. J. 2008, 42, 52–67. [Google Scholar] [CrossRef]
  7. Moran, P.J.; Johnson, D.; Miller-Smith, B.; Mundy, C.; Bass, D.; Davidson, J.; Miller, I.; Thompson, A. A Guide to the Aims Manta Tow Technique; Australian Institute of Marine Science (AIMS): Townsville, Australia, 1989. [Google Scholar]
  8. Long, B.; Andrews, G.; Wang, Y.-G.; Suharsono. Sampling accuracy of reef resource inventory technique. Coral Reefs 2004, 23, 378–385. [Google Scholar] [CrossRef]
  9. Mallet, D.; Wantiez, L.; Lemouellic, S.; Vigliola, L.; Pelletier, D. Complementarity of rotating video and underwater visual census for assessing species richness, frequency and density of reef fish on coral reef slopes. PLoS ONE 2014, 9, e84344. [Google Scholar]
  10. Pelletier, D.; Leleu, K.; Mou-Tham, G.; Guillemot, N.; Chabanet, P. Comparison of visual census and high definition video transects for monitoring coral reef fish assemblages. Fish. Res. 2011, 107, 84–93. [Google Scholar] [CrossRef]
  11. Harvey, E.; Fletcher, D.; Shortis, M.R.; Kendrick, G.A. A comparison of underwater visual distance estimates made by scuba divers and a stereo-video system: Implications for underwater visual census of reef fish abundance. Mar. Freshw. Res. 2004, 55, 573–580. [Google Scholar] [CrossRef]
  12. Sloan, L.L. Measurement of visual acuity: A critical review. AMA Arch. Ophthalmol. 1951, 45, 704–725. [Google Scholar] [CrossRef] [PubMed]
  13. Schulz, J. Geometric optics and strategies for subsea imaging. Subsea Optics Imaging 2013. [Google Scholar] [CrossRef]
  14. Lyons, M. Photography Calculators. Available online: http://www.tawbaware.com/maxlyons/calc.htm (accessed on 5 November 2015).
  15. Cambridge in Colour. Cameras versus the Human Eye. Available online: http://www.cambridgeincolour.com/tutorials/cameras-vs-human-eye.htm (accessed on 5 November 2015).
  16. Ross, H.E.; Nawaz, S. Why do objects appear enlarged under water? Arquivos Brasileiros de Oftalmologia 2003, 66, 69–76. [Google Scholar] [CrossRef]
  17. Connick, J. Nauticam na-a7/ Sony Review: Mirrorless in Mexico. Available online: http://diveadvisor.com/sub2o/nauticam-na-a7-sony-review-mirrorless-in-mexico# (accessed on 6 January 2016).
  18. White, B. Nikonos Lenses on a Digital Camera? Available online: http://www.backscatter.com/learn/article/article.php?ID=94 (accessed on 6 January 2016).
  19. Rorslett, B. Lenses for Nikonos (i-v) Mount. Available online: http://www.naturfotograf.com/lens_nikonos.html (accessed on 6 January 2016).
  20. Church, J. Jim Church's Essential Guide to Nikonos Systems; Aqua Quest Publications, Inc.: Locust Valley, NY, USA, 1994. [Google Scholar]
  21. Oliva, A.; Torralba, A. The role of context in object recognition. Trends Cogn. Sci. 2007, 11, 520–527. [Google Scholar] [CrossRef] [PubMed]
Figure 1. Modified manta board showing camera, sensors and instrumentation pod.
Jmse 04 00017 g001
Figure 2. Visual targets used for calculating (left to right) resolving power, color balance and visual acuity (Snellen chart) (not to scale, originals were printed at A3 (279 mm × 420 mm)).
Jmse 04 00017 g002
Figure 3. Image showing the two 1 m steel rulers (right) and the color chart (left).
Jmse 04 00017 g003
Figure 4. Images showing head shots of snorkelers with their arms extended, indicating the side limits of their field of view. From this the angle of vision can be measured, as indicated by the lines overlaid on the images, and hence the field of view for a set depth.
Jmse 04 00017 g004
Figure 5. Image from the camera showing the two Snellen eye charts in 4.3 m of water.
Jmse 04 00017 g005
Figure 6. A 100% enlargement showing (left) that the top line of the right page is just readable which represents a visual acuity of 20/15 and (right) the same image with contrast enhancement and mild sharpening which shows some legibility at the 20/13 line (second from top, right hand side).
Jmse 04 00017 g006
Figure 7. Image target showing an array of lines, text and shapes, at 100% enlargement.
Jmse 04 00017 g007
Figure 8. A 200% enlargement of the rulers showing ruler markings; the enlargement was taken from the center of the image where lens performance should be maximized.
Jmse 04 00017 g008
Figure 9. Close-up of the color chart in 4.3 m of water: left image is out of the camera with a white balance of 7900 K; the right image is corrected to the in-air chart colors with a white balance of 15,250 K. The original color chart is shown in Figure 2.
Jmse 04 00017 g009
Figure 10. Image showing details of coral growth at depth of 2.7 m.
Jmse 04 00017 g010

