Article

On the Intersite Variability in Inter-Annual Nearshore Sandbar Cycles

by
Dirk-Jan R. Walstra
1,2,*,
Daan A. Wesselman
3,†,
Eveline C. Van der Deijl
3,† and
Gerben Ruessink
3,†
1
Marine and Coastal Systems, Deltares, PO Box 177, 2600 MH, Delft, The Netherlands
2
Hydraulic Engineering Section, Faculty of Civil Engineering and Geosciences, Delft University of Technology, PO Box 5048, 2600 GA, Delft, The Netherlands
3
Department of Physical Geography, Faculty of Geosciences, Institute for Marine and Atmospheric Research, Utrecht University, PO Box 80115, 3508 TC, Utrecht, The Netherlands
*
Author to whom correspondence should be addressed.
These authors contributed equally to this work.
J. Mar. Sci. Eng. 2016, 4(1), 15; https://doi.org/10.3390/jmse4010015
Submission received: 4 December 2015 / Revised: 31 January 2016 / Accepted: 3 February 2016 / Published: 25 February 2016
(This article belongs to the Special Issue Coastal Morphodynamics)

Abstract

:
Inter-annual bar dynamics may vary considerably across sites with very similar environmental settings. In particular, the variability of the bar cycle return period (Tr) may differ by a factor of 3 to 4. To date, data studies are only partially successful in explaining differences in Tr, establishing at best weak correlations to local environmental characteristics. Here, we use a process-based forward model to investigate the non-linear interactions between the hydrodynamic forcing and the morphodynamic profile response for two sites along the Dutch coast (Noordwijk and Egmond) that despite strong similarity in environmental conditions exhibit distinctly different Tr values. Our exploratory modeling enables a consistent investigation of the role of specific parameters at a level of detail that cannot be achieved from observations alone, and provides insights into the mechanisms that govern Tr. The results reveal that the bed slope in the barred zone is the most important parameter governing Tr. As a bar migrates further offshore, a steeper slope results in a stronger relative increase in the water depth above the bar crest which reduces wave breaking and in turn reduces the offshore migration rate. The deceleration of the offshore migration rate as the bar moves to deeper water—the morphodynamic feedback loop—contrasts with the initial enhanced offshore migration behavior of the bar. The initial behavior is determined by the intense wave breaking associated with the steeper profile slope. This explains the counter-intuitive observations at Egmond where Tr is significantly longer than at Noordwijk despite Egmond having the more energetic wave climate which typically reduces Tr.

1. Introduction

Alongshore sand bars are common features in shallow nearshore coastal environments (water depth typically less than 10 m) with a striking variability in the cross-shore and longshore geometry (e.g., [1,2,3,4]). Bars are the net result of cross-shore sediment accumulation resulting from the highly non-linear morphological feedback between the bed profile and nearshore hydrodynamics (e.g., [2,5]). As bars may also influence upper beach morphology [6,7,8] and are often altered by shoreface nourishments (e.g., [9,10,11]), their relevance for coastal managers is evident.
The behavior of (multiple) bar systems has been studied extensively over the past decades. These studies focused on bar behavior at time scales ranging from hours, days and weeks (e.g., [7,12,13]), via months and seasons (e.g., [14,15,16]) to years and decades (e.g., [5,8,17,18,19,20,21]). Common findings are that bars mostly have a multi-annual lifetime and that up to five bars can occur simultaneously in the cross-shore. As the most seaward (outer) bar limits the amount of wave energy by enforcing waves to break, it controls the evolution of the shoreward located (inner) bars [13,21,22]. Decay of the outer bar typically initiates a cascaded response in which the next (shoreward) bar experiences amplitude growth and net seaward migration. This in turn creates accommodation space for its shoreward neighbor and so on, eventually resulting in the generation of a new bar near the shoreline. This offshore directed cyclic character is typically measured by the period between two bar decay events, referred to as the bar cycle return period (Tr).
This Tr can vary markedly at a site and between sites, but the underlying reasons and environmental controls are not well understood [3,20,23,24,25]. Intra-site differences in Tr are typically related to (quasi) persistent three-dimensional bar behavior referred to as bar switching (e.g., [5,18,26]). It is defined as bars being alongshore discontinuous, either in a different phase of the bar cycle [5] or with a completely different Tr [18,23]. For the latter case, intra-site differences in Tr can be substantial (exceeding a factor 4) and appears to be continuously present in time [18], here referred to as a persistent bar switch. Bar switches that separate sections with similar Tr are usually less persistent as alongshore interactions cause bar switches to disappear when the adjacent bars temporarily are in a similar phase [5], here referred to as a non-persistent bar switch.
Wijnberg and Terwindt [18] were among the first to study the inter-site differences in Tr. To that end they introduced the concept of a large-scale coastal behavior (LSCB) region. It is defined as an area in which the sandbars show similar cross-shore migration (i.e., approximately constant Tr) and exhibit comparable changes in bar morphology over several decades. For the Holland coast (Figure 1) the annual surveys of the coastal profiles (Jarkus database) revealed that the transitions between LSCB regions were primarily persistent bar switches. In general, the transitions between LSCB regions were relatively distinct and of limited alongshore length (about 2 km). One of the most prominent differences in Tr was found between the area northward of the IJmuiden harbor moles to the Petten Seawall and the area southward of IJmuiden to the harbor moles of Scheveningen (see Figure 1). The overall inter-annual bar cycle characteristics are similar for both areas. However, the Tr differ significantly: in the southern area the return period is much smaller (about 4 versus 15 years for the area northwards of IJmuiden). In addition, the alongshore coherence in offshore bar movement seems to be larger in the southern region [18], that is, there are less non-persistent bar switches.
For the Holland coast, Wijnberg [24] found that changes in decadal coastal behavior were primarily coupled to large man-made structures and alongshore changes in the offshore bathymetry (ebb delta and shoreface terrace). No link could be established with any other investigated environmental variables, such as the sediment composition and wave forcing. A similar change across a manmade structure was also observed at Duck, NC (USA), where a factor 2 difference in Tr in the areas just north and south of a pier was observed [23]. Wijnberg [24] hypothesized that structures inhibit the alongshore interaction between the intersected coastal sections causing an independent evolution that ultimately results in different equilibrium states originating from, for example, small differences in the local wave climate or bed slopes.
The nearshore bar response is sensitive to initial perturbations in the bed profile and is dominated by the morphologic feedback to the wave and current fields (e.g., [5,15,23,27]). The inter-annual bar amplitude response is primarily governed by the water depth above the bar crest, hXb, and the incident wave angle, θ [16,21]. As a consequence, the morphological developments do not only depend on the instantaneous small-scale processes; they also incorporate some degree of time history in profile configuration. Using a process-based profile model (i.e., assuming alongshore uniformity), Walstra et al. [5] showed that specific initial profile and wave forcing combinations could affect the bar characteristics over the entire inter-annual cycle period. This is qualitatively in line with [18,24] who hypothesized that regions with different large-scale coastal behavior are controlled by the combined effects of different hydrodynamic forcing, sedimentological constraints (viz. grain size, stratigraphy) and/or morphological constraints (viz. shoreline orientation, shoreface morphology, surf zone morphology). To the best of our knowledge, all comprehensive data analysis studies were unable to further detail the (relative) contribution of these parameters and to identify the dominant physical processes that govern the bar cycle return period in different LSCB regions or sites.
Therefore, the present study utilizes a process-based forward model to identify the dominant environmental variables and the associated mechanisms that govern Tr. To that end, the profile model developed in [5,21] is applied at two locations 42 km apart (Noordwijk and Egmond, located at RSP 38 km and 80 km, respectively; RSP (RijksStrandPalen) is the Dutch alongshore beach pole numbering system). The sites are located in the LSCB regions just South and North of the IJmuiden harbor moles (Figure 1) with distinctly different bar cycle return periods. The model is utilized to investigate the influence of various environmental parameters on Tr. To that end, a range of model simulations are evaluated by comparing the predicted bar cycle return periods for various combinations of environmental variables from the Noordwijk and Egmond sites. The considered variables comprise the wave forcing (viz. wave height and incident wave angle), sediment size, and various geometric profile properties (viz. bar size, bar location and profile steepness). Subsequently, the underlying processes that predominantly govern Tr are identified. We finalize the paper with a discussion on the main findings and with the conclusions.

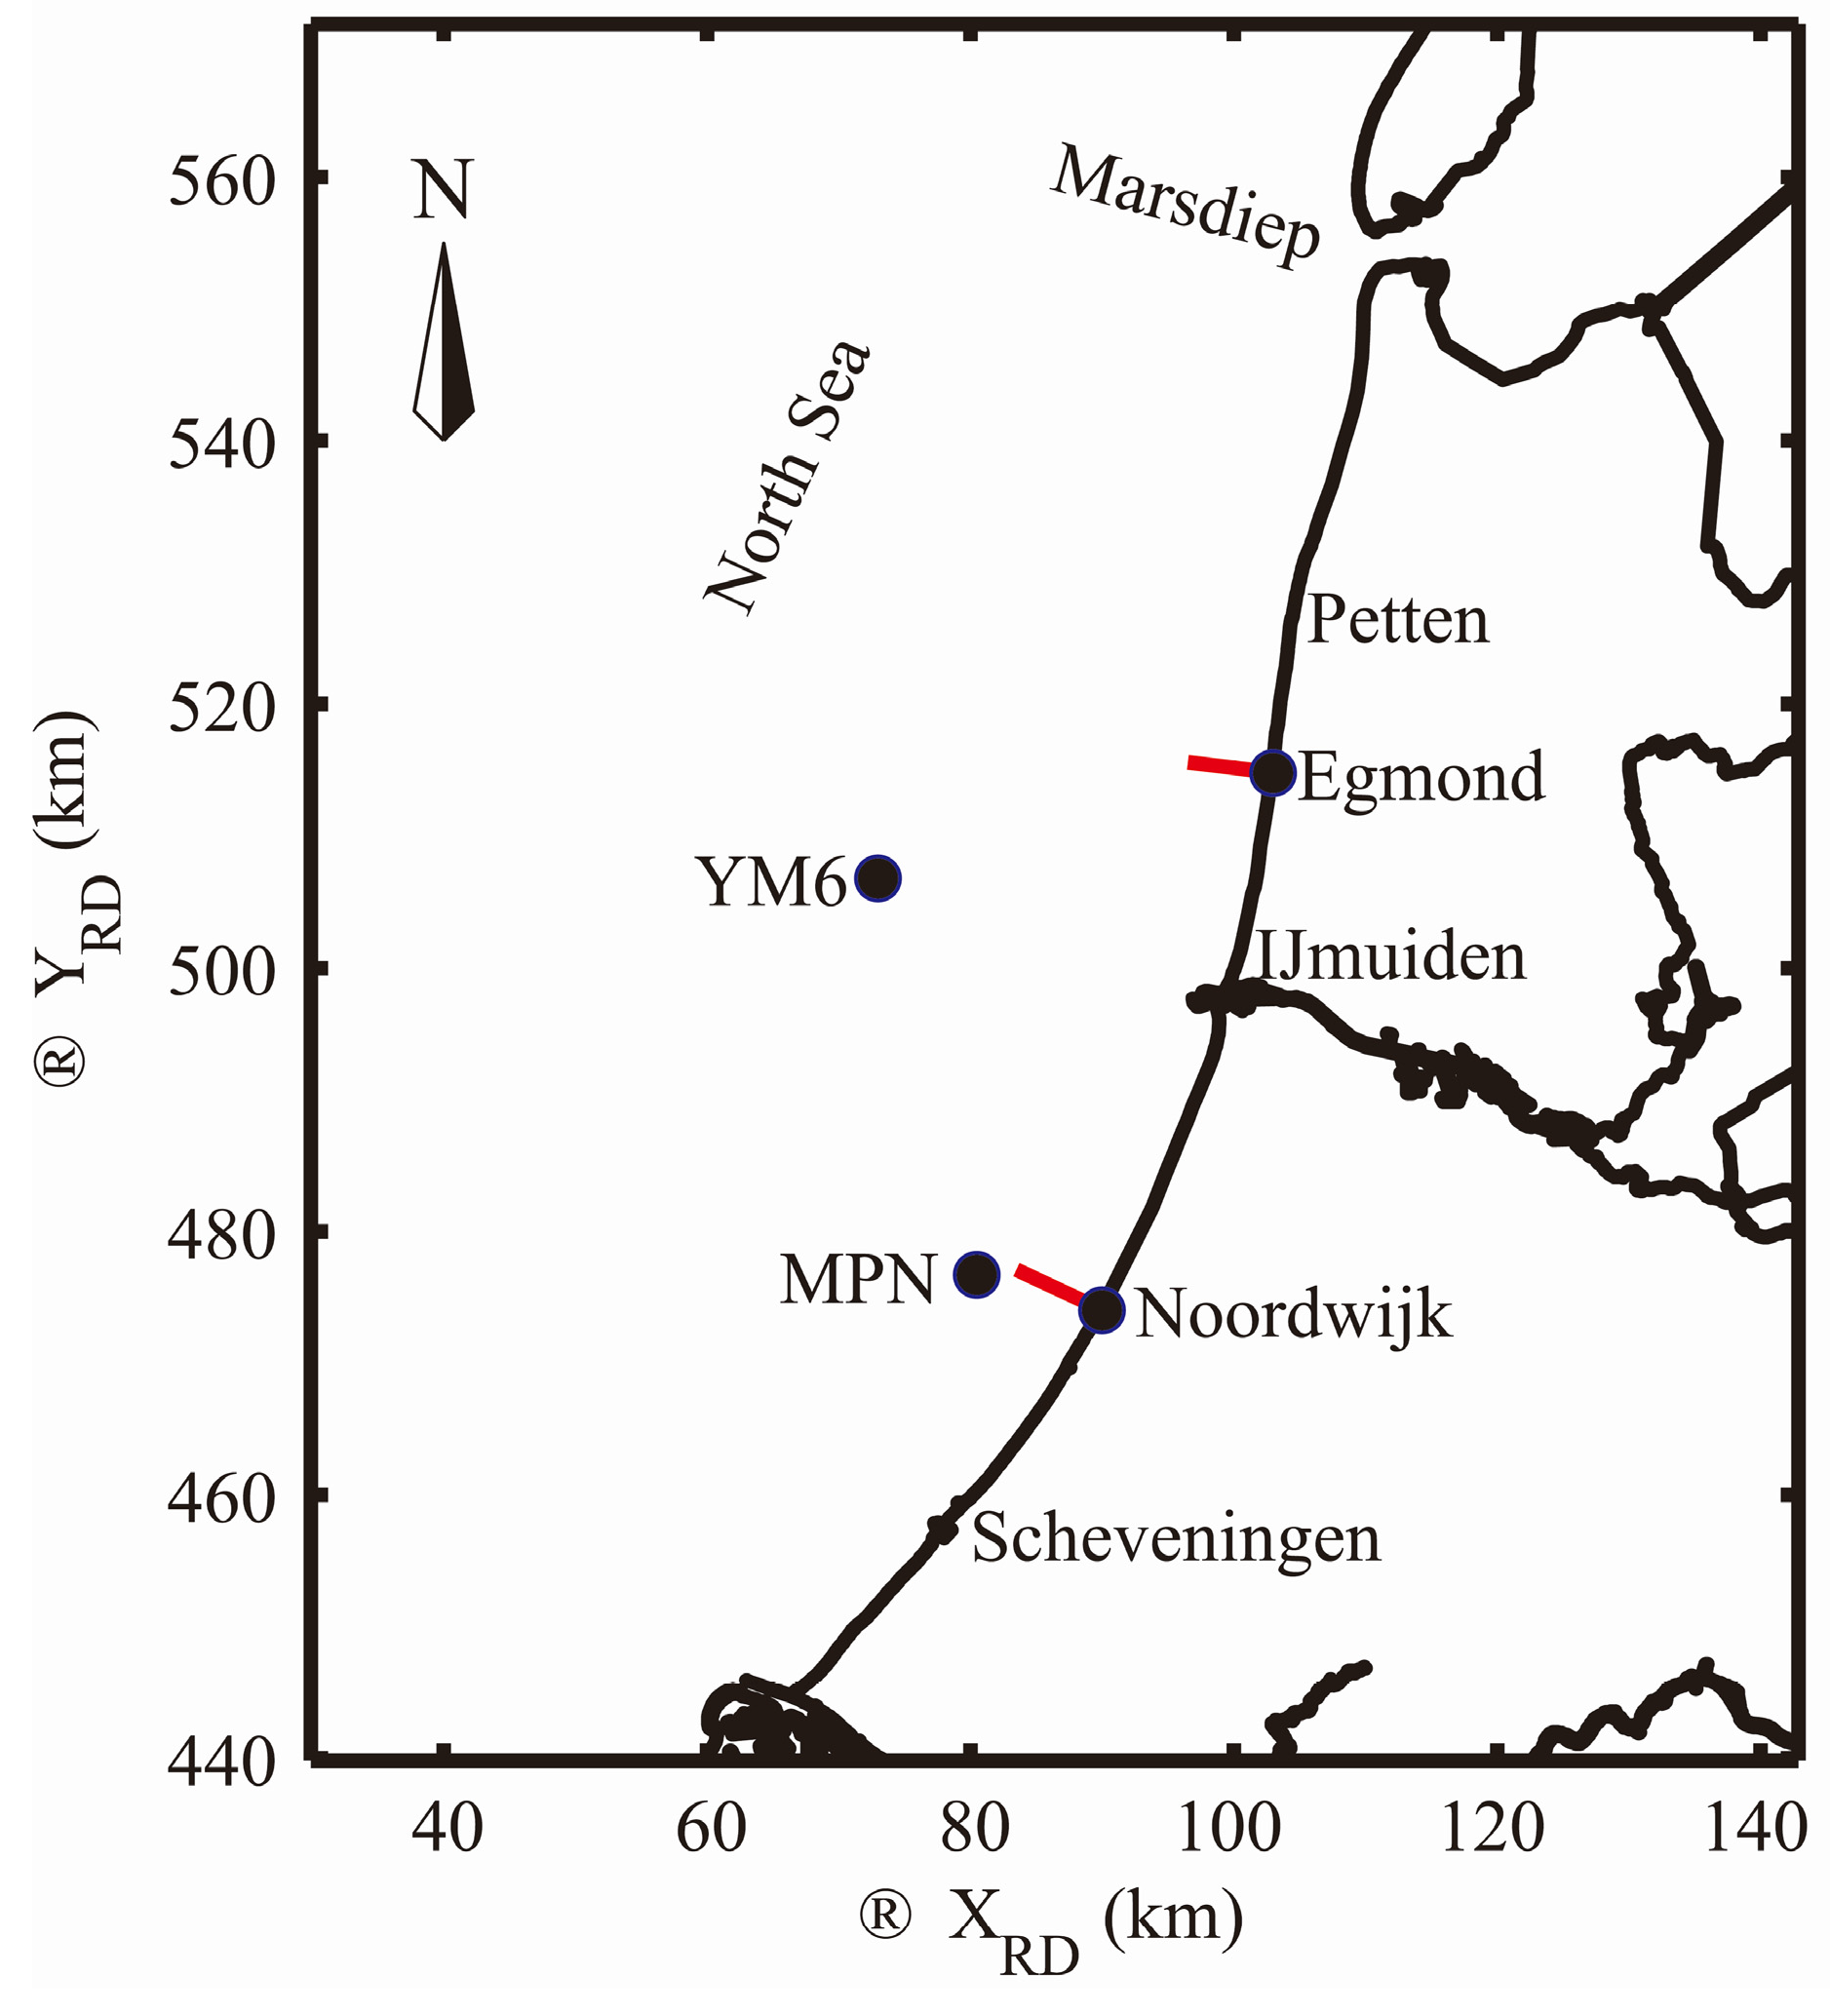
2. Environmental Settings

Both Noordwijk and Egmond are located along the Holland coast which is enclosed by the Marsdiep inlet in the north and the Rotterdam harbor moles in the south (Figure 1). The Holland coast is characterized by sandy beaches and multiple barred near-shore zones [28]. The entire Holland coast is an inlet free, sandy and wave dominated coast, with relatively small alongshore variations in offshore wave height and tide [24]. Due to the concave shape of the Holland Coast, the coastline orientation at Egmond (277 °N) and Noordwijk (298 °N) differs by about 21°. Furthermore, the sediment at Egmond is markedly coarser than at Noordwijk (see Table 1).

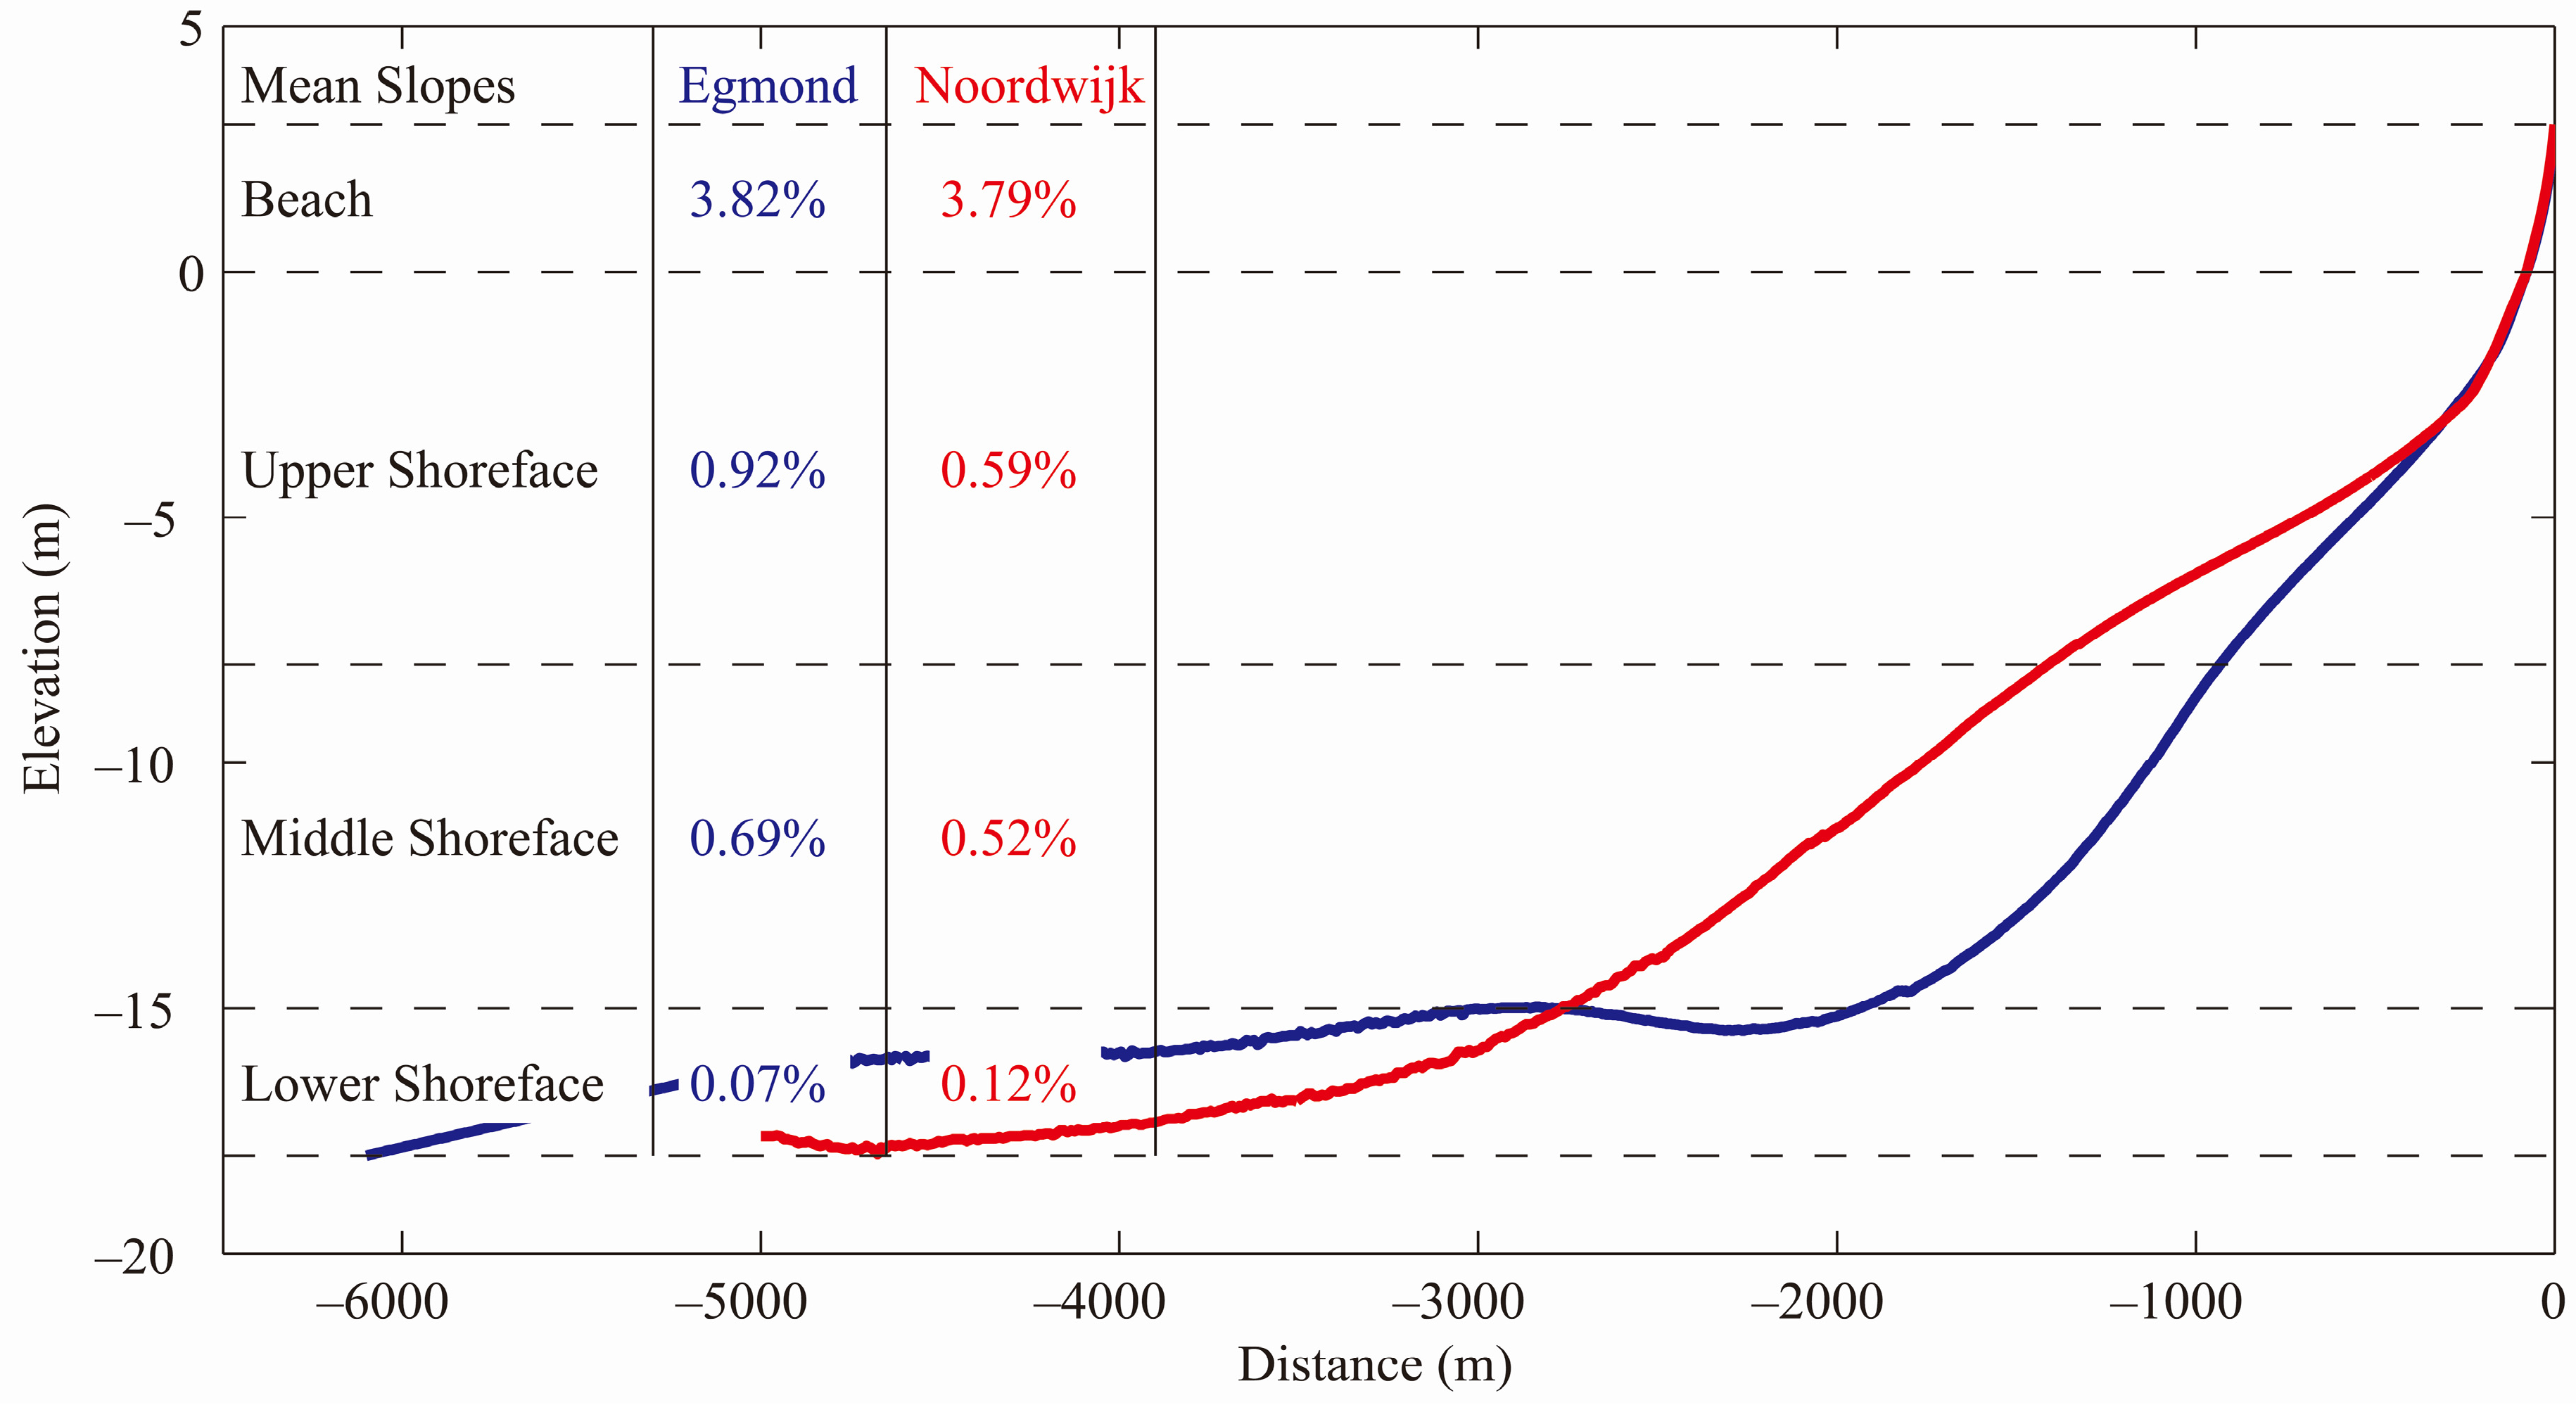
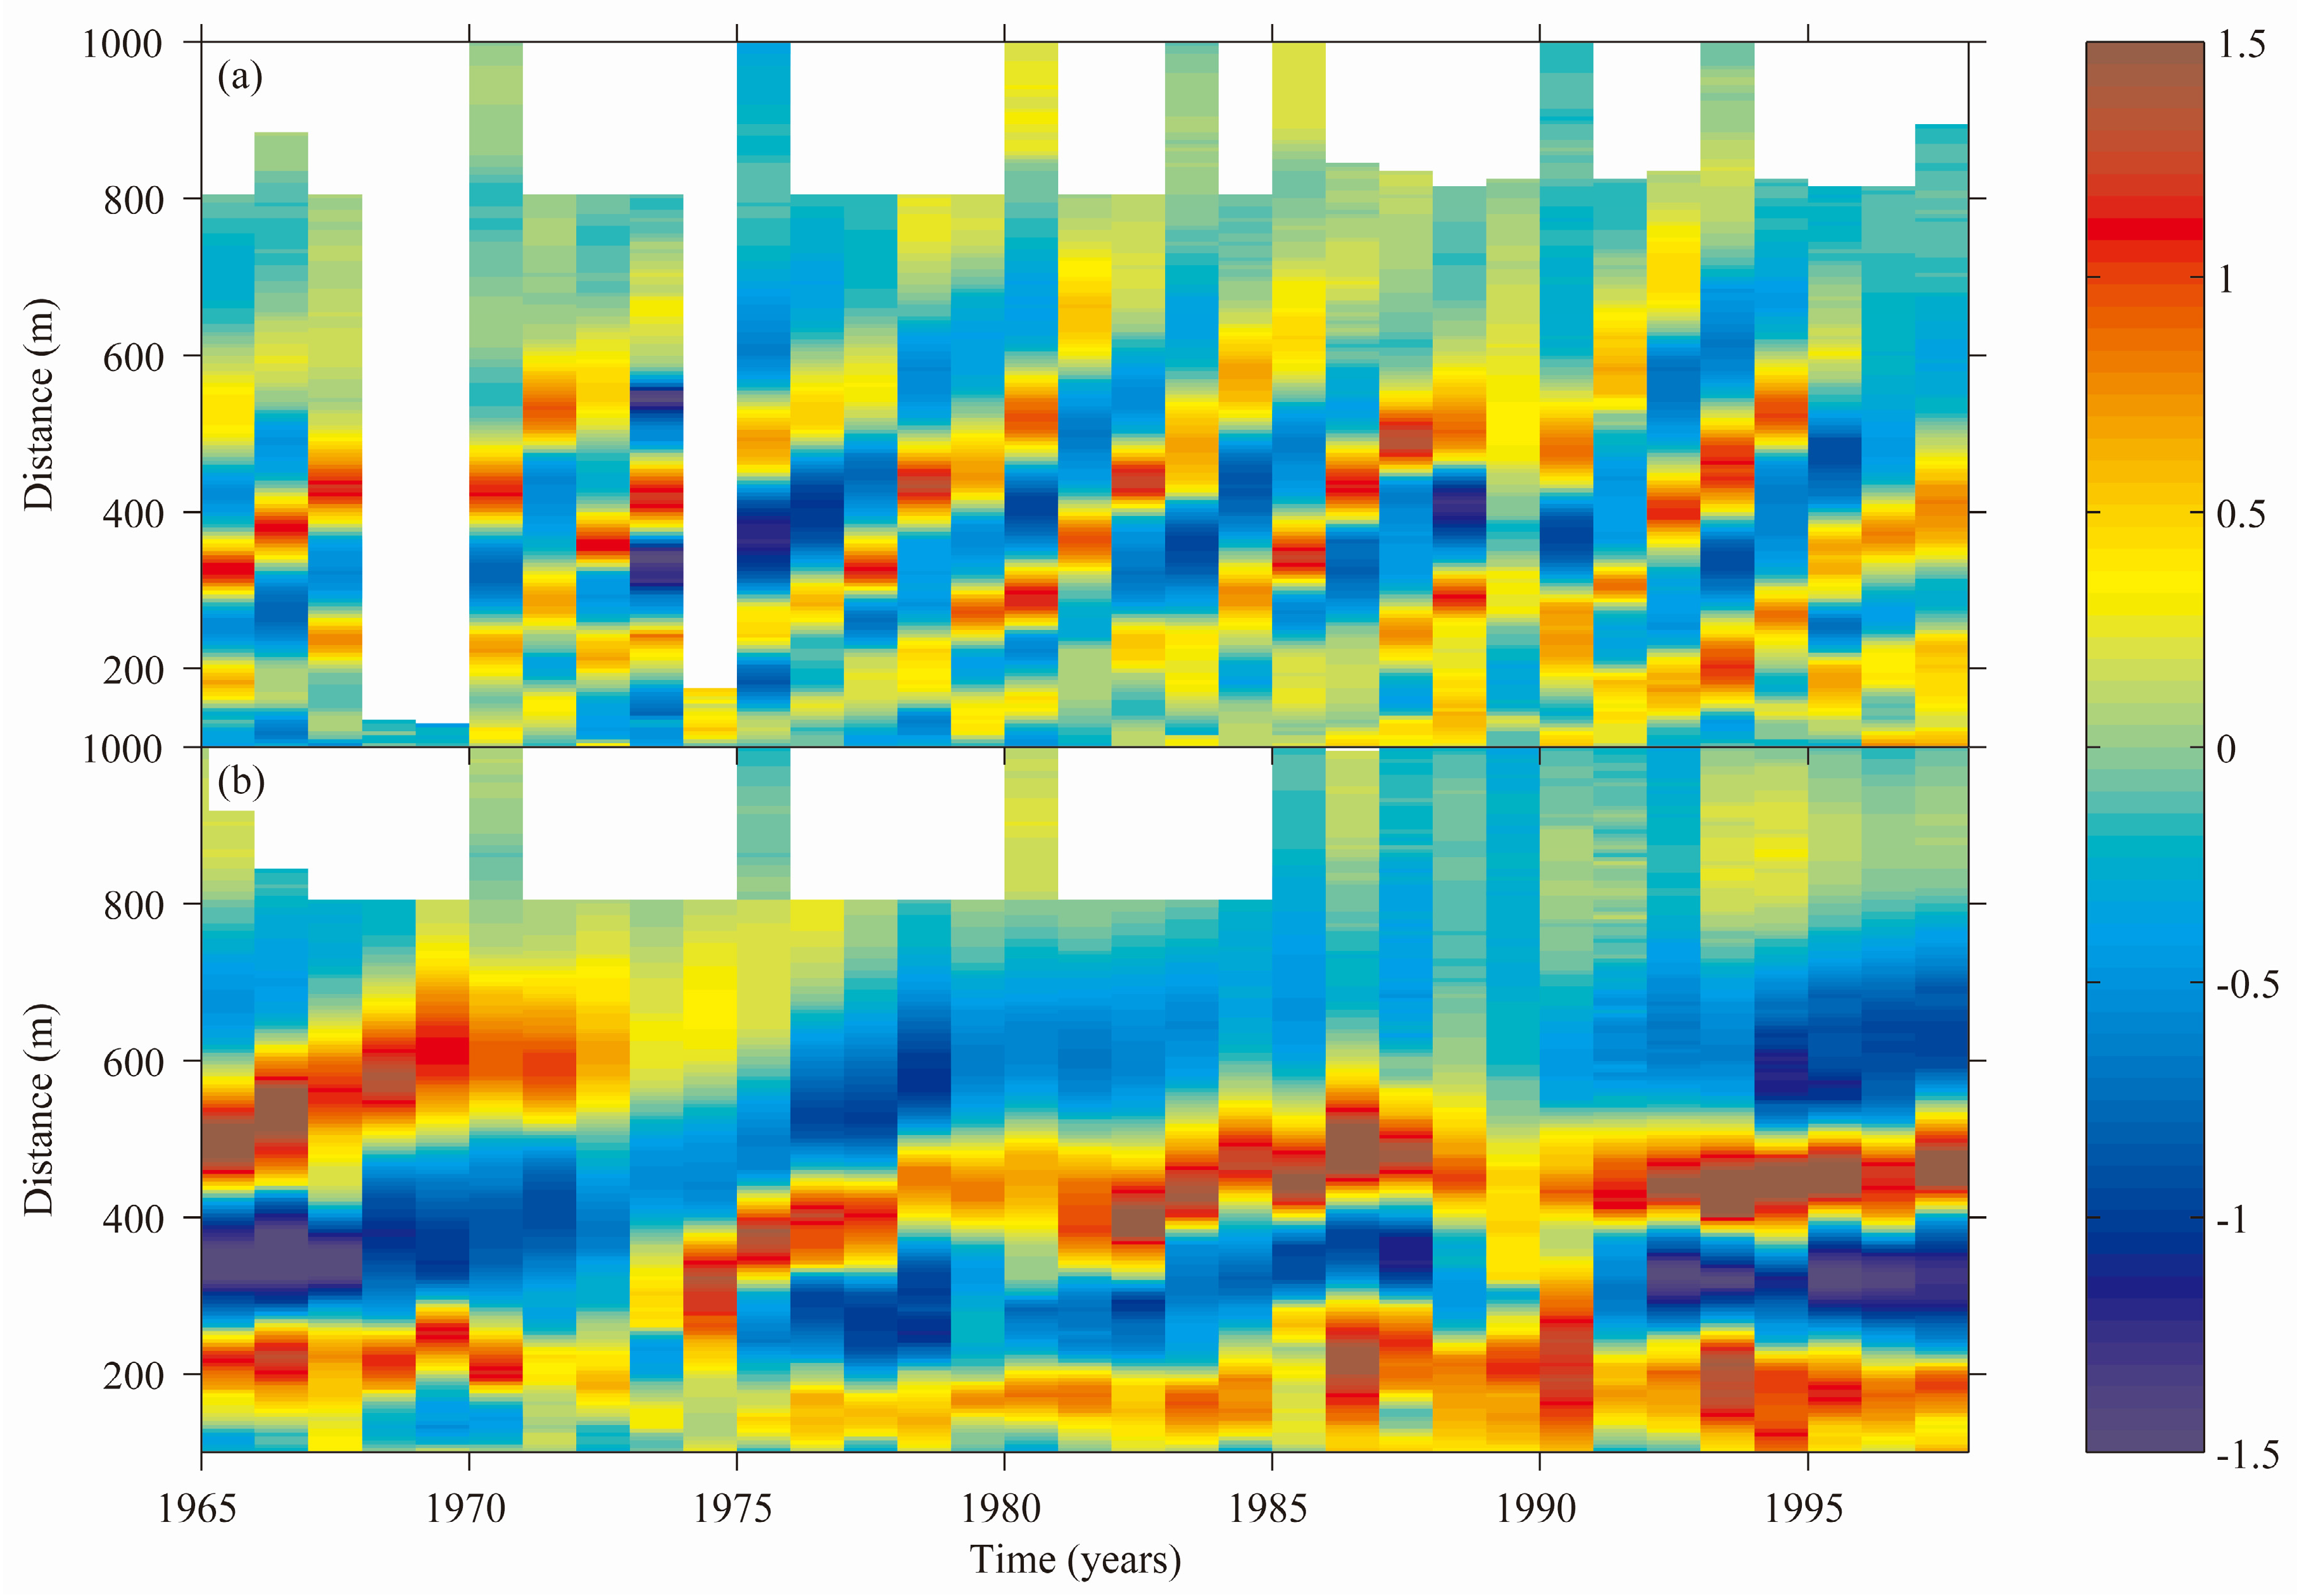
2.1. Cross-Shore Bed Profile Characteristics

First, in order to exclude the bar morphology, the time-averaged cross-shore bed profile characteristics are analyzed for both sites. The time-averaged profiles were derived for Noordwijk and Egmond based on the annual profile surveys of the Jarkus database [18] for the period 1965 to 1998. Data from 1999 onwards were excluded because both sites were regularly nourished since that time, e.g., [9,10]. The shoreface (between −18 m and 0 m NAP (Normaal Amsterdams Peil); NAP is the Dutch datum at approximately mean sea level) is sub-divided into four sections, for each of which we compare the mean slopes in Figure 2: the beach section (Section 1) comprises the beachface between the dune foot (3 m NAP) and the mean water level (0 m); the upper shoreface (Section 2) the profile between 0 and –8 m; the middle shoreface (Section 3) is enclosed by the –8 m and –15 m depth contour and the lower shoreface (Section 4) is the part of the profile between –15 m and –18 m. The boundary between the upper and middle shoreface is defined at –8 m, because it is the edge of the near-shore zone [28]. Sandbars, and accordingly the temporal variability in sea bed elevation, are significantly reduced [29] and bars do not occur beyond this depth. The seaward limit of the analyzed profiles is set to −18 m, which corresponds to the water depth at the location of the wave observations at Noordwijk (MPN). As indicated in Figure 2, the beach and lower shoreface have similar slopes, whereas the upper and middle shoreface are notably steeper at Egmond.

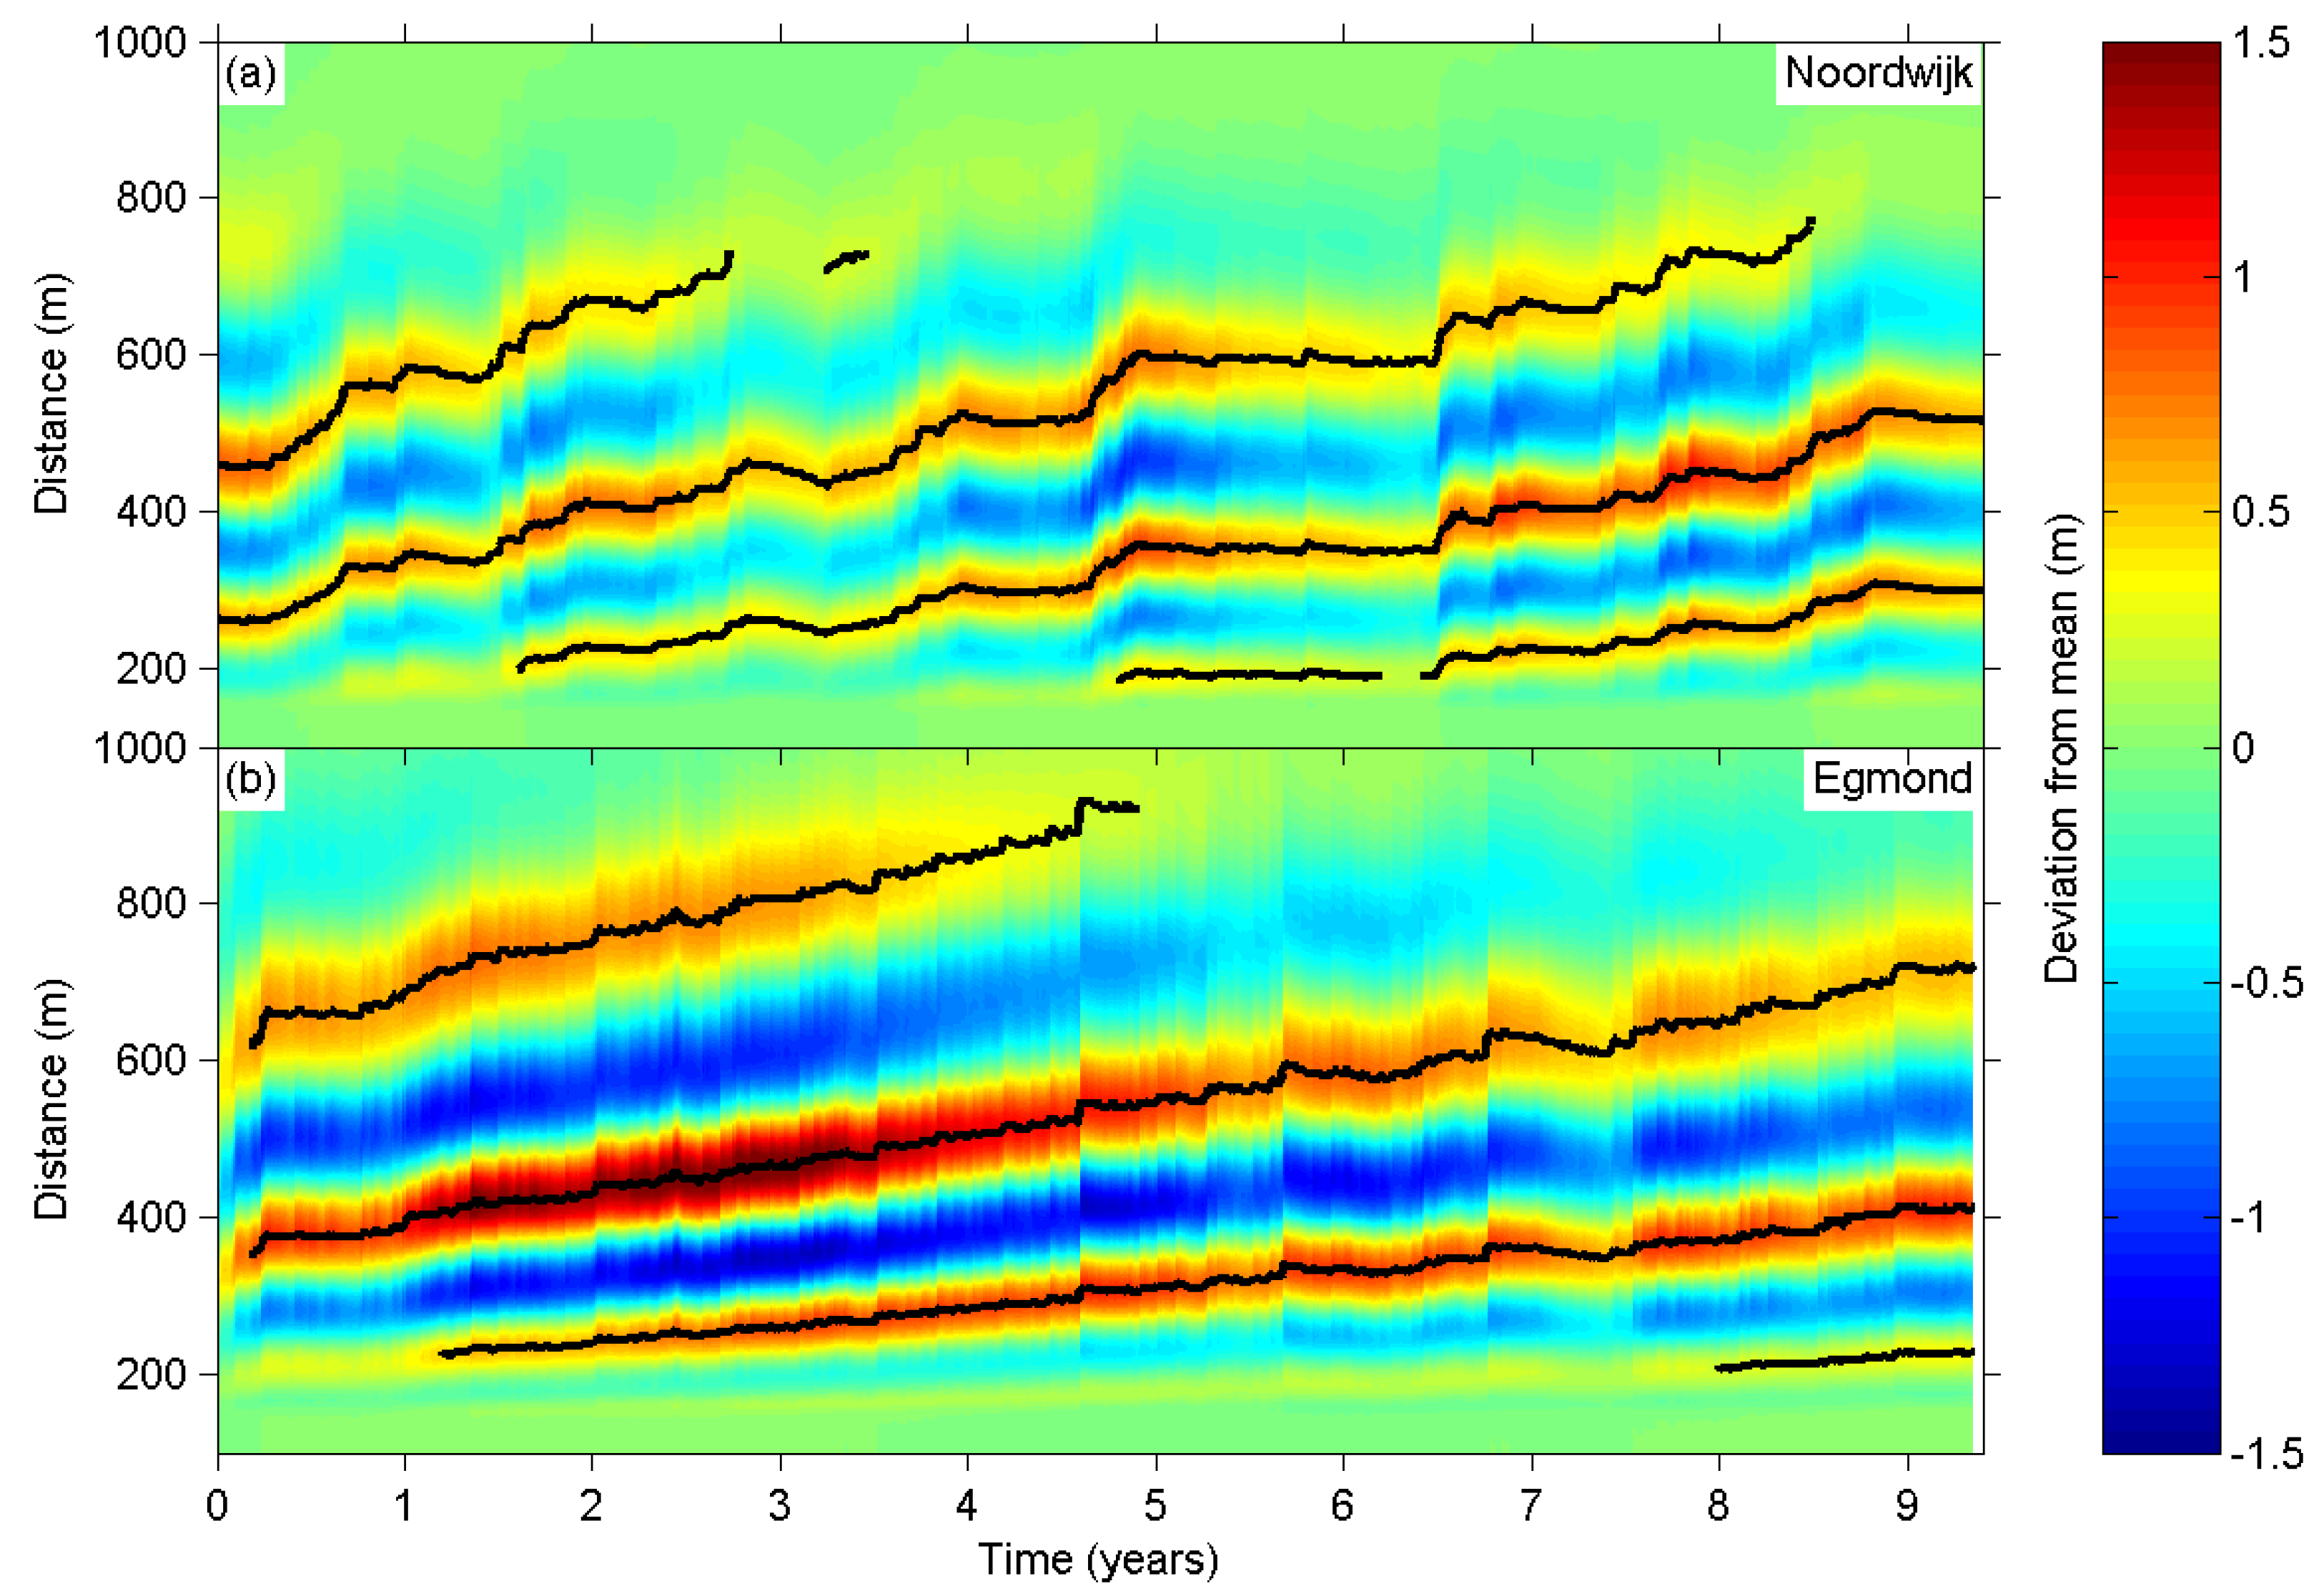
2.2. Sandbar Characteristics

The sandbars are studied by subtracting the time averaged profile (Figure 2) from the actual bed profiles; especially at the upper and middle shoreface the resulting profile perturbations result primarily from the bar morphology. Figure 3 shows the profile perturbations for Egmond and Noordwijk for the part of the cross-shore profile at which the bars are prevalent.
Both at Egmond and Noordwijk mostly three bars are present [18,30]. The positive and negative perturbations indicate the bar and trough regions, respectively. The time stack plots (Figure 3a,b) clearly reveal the inter-annual cyclic bar characteristics. That is, bar initiation in the inter-tidal region, gradual offshore migration and amplitude growth and finally gradual decay at the seaward limits of the surf zone. However, the difference in bar cycle return period between both sites is striking. Estimates of Tr, derived earlier with a complex EOF method are 3.9 and 15.1 years for Noordwijk and Egmond, respectively [3]. Furthermore, the bars at Egmond are noticeably wider and higher.

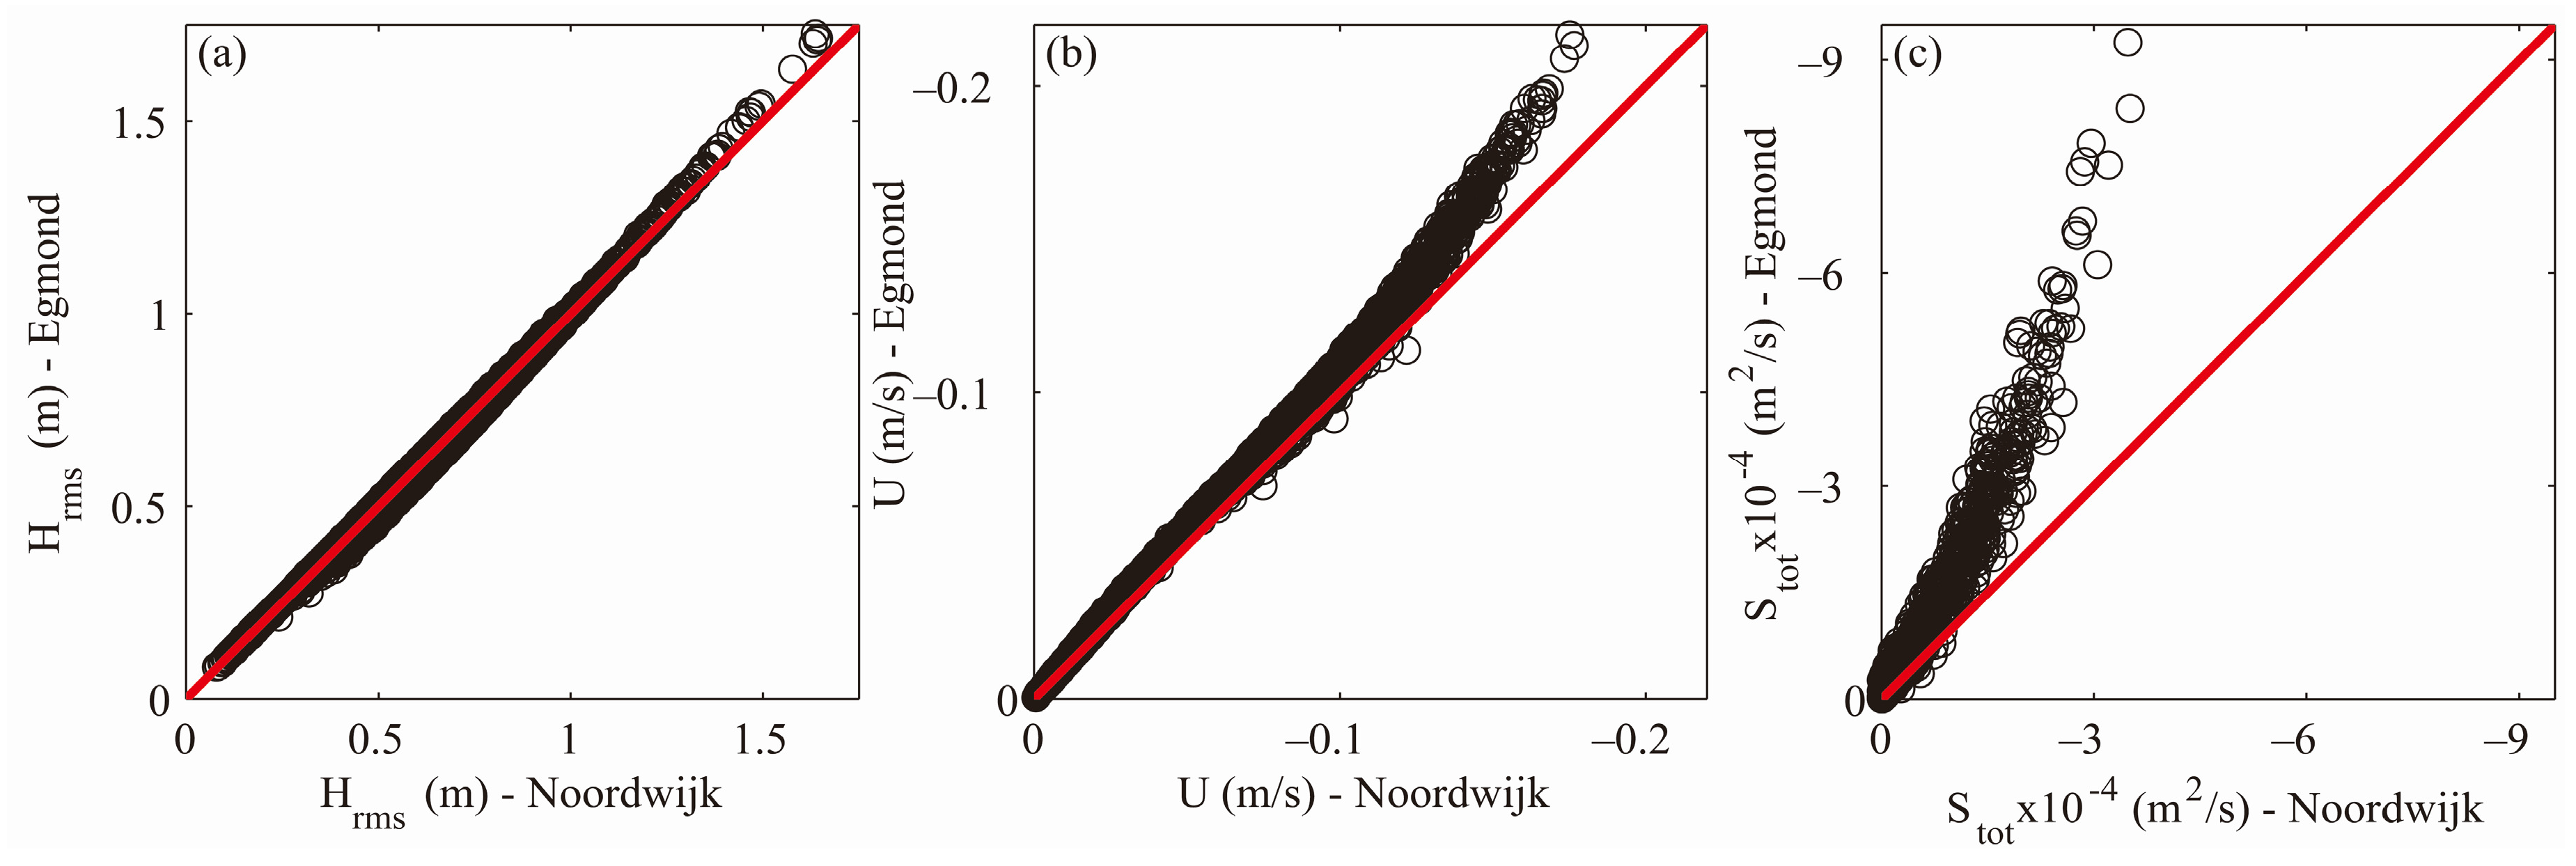
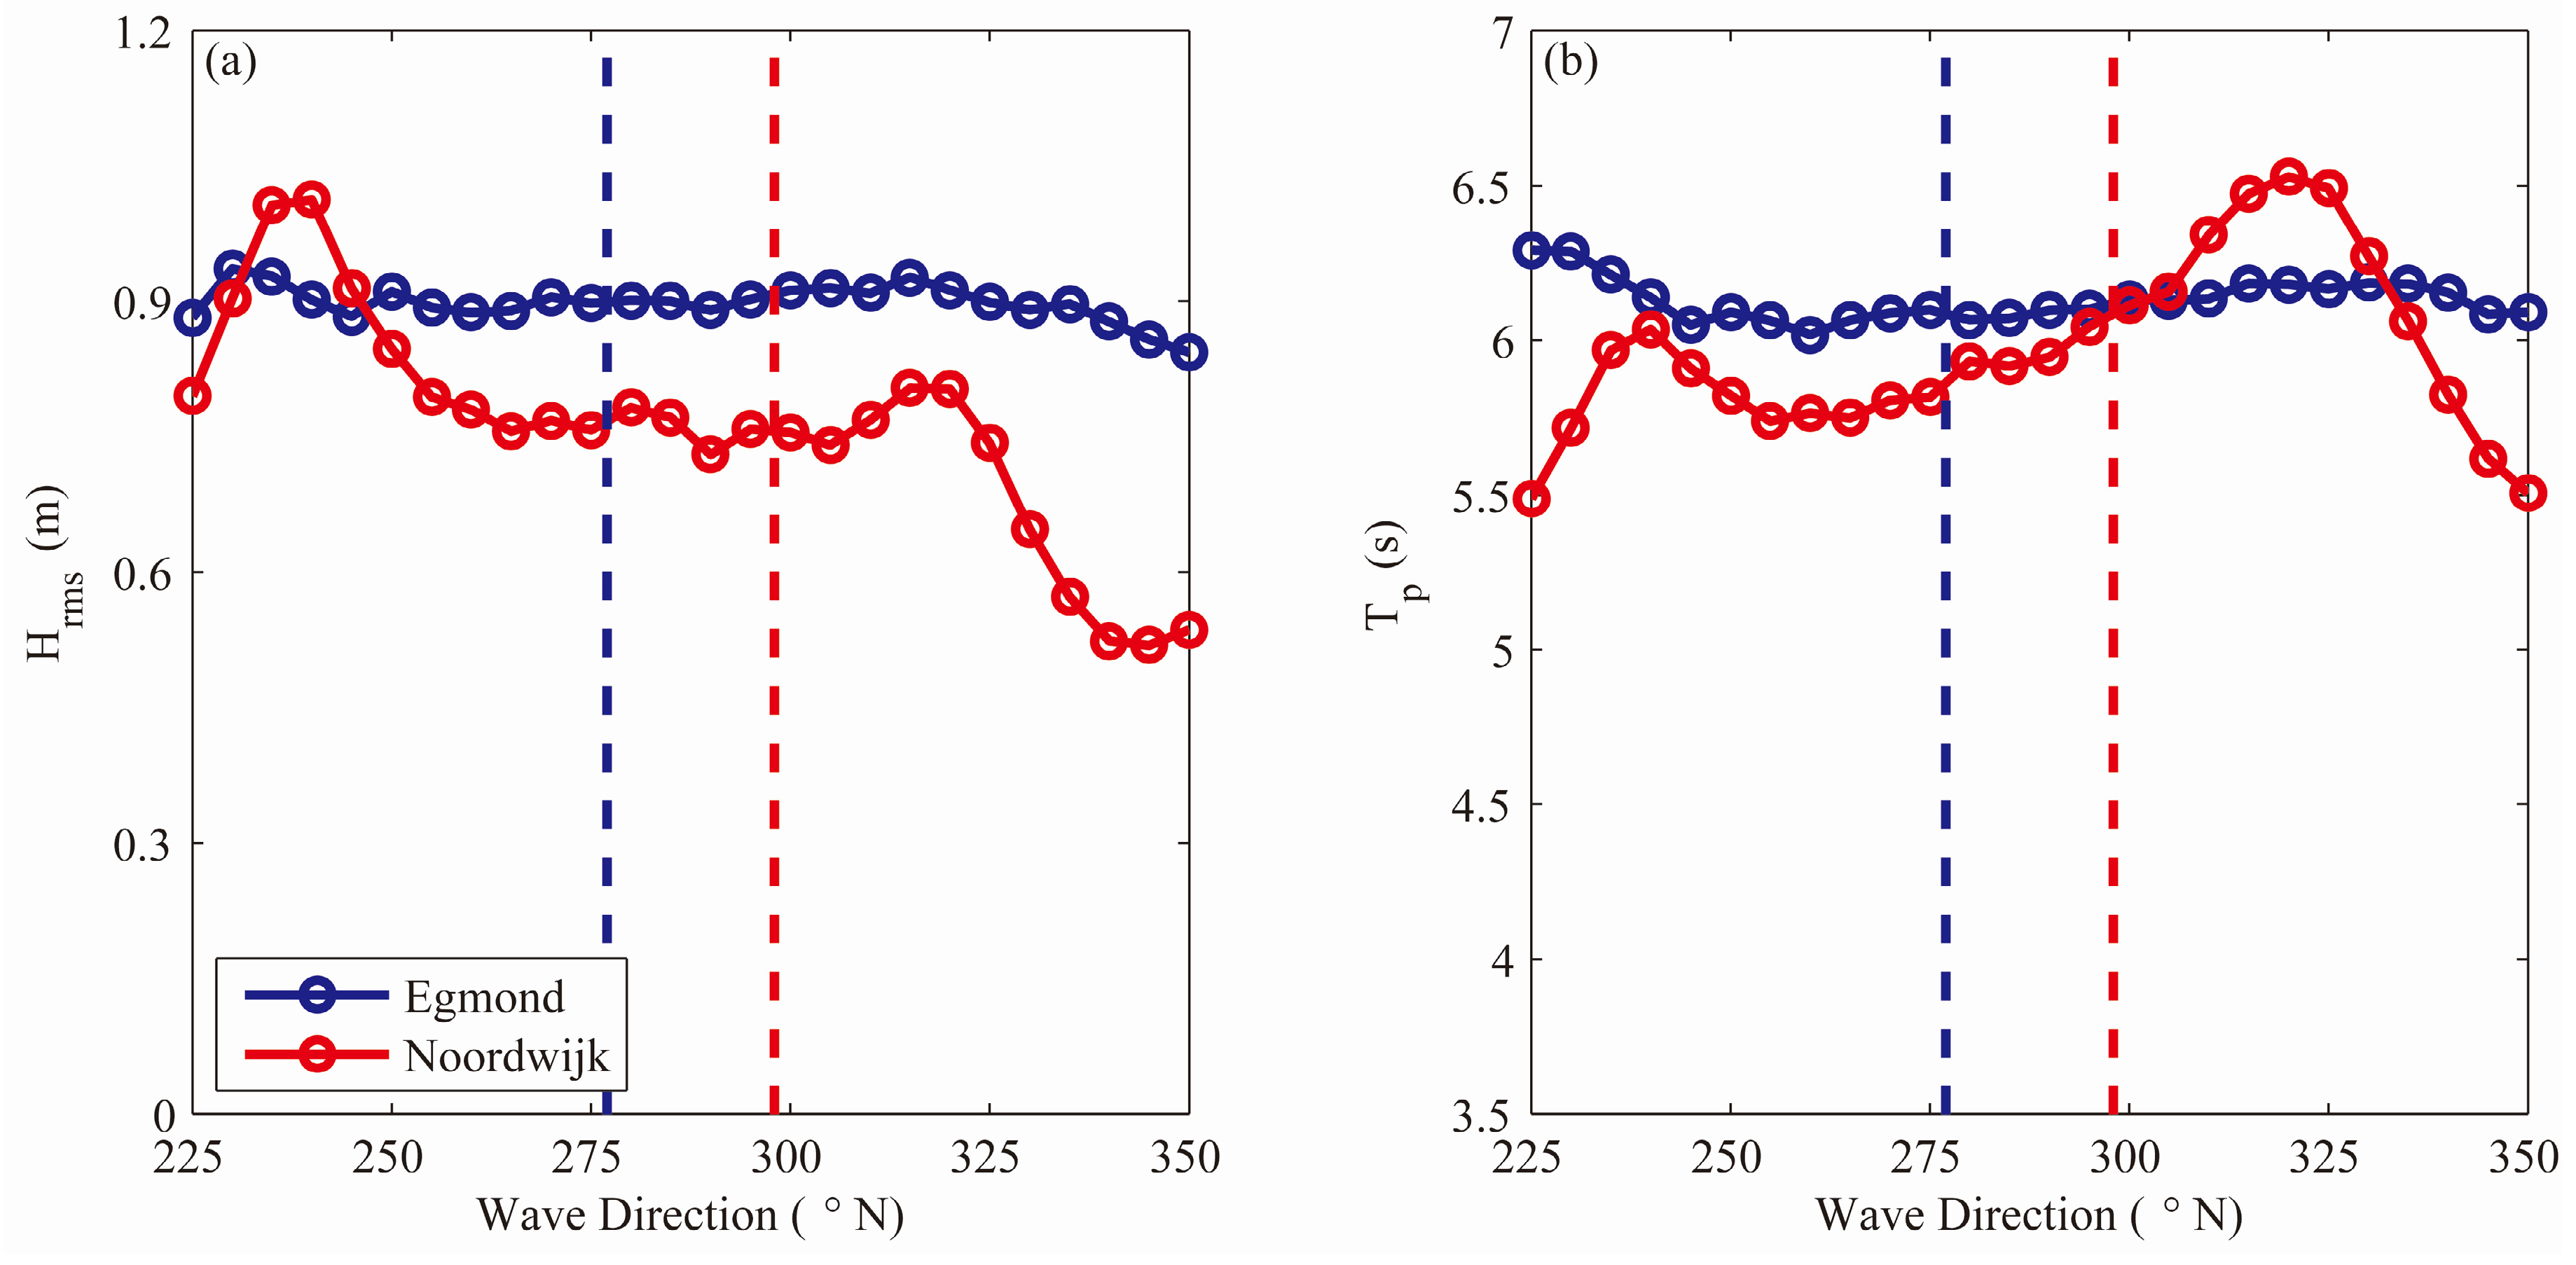
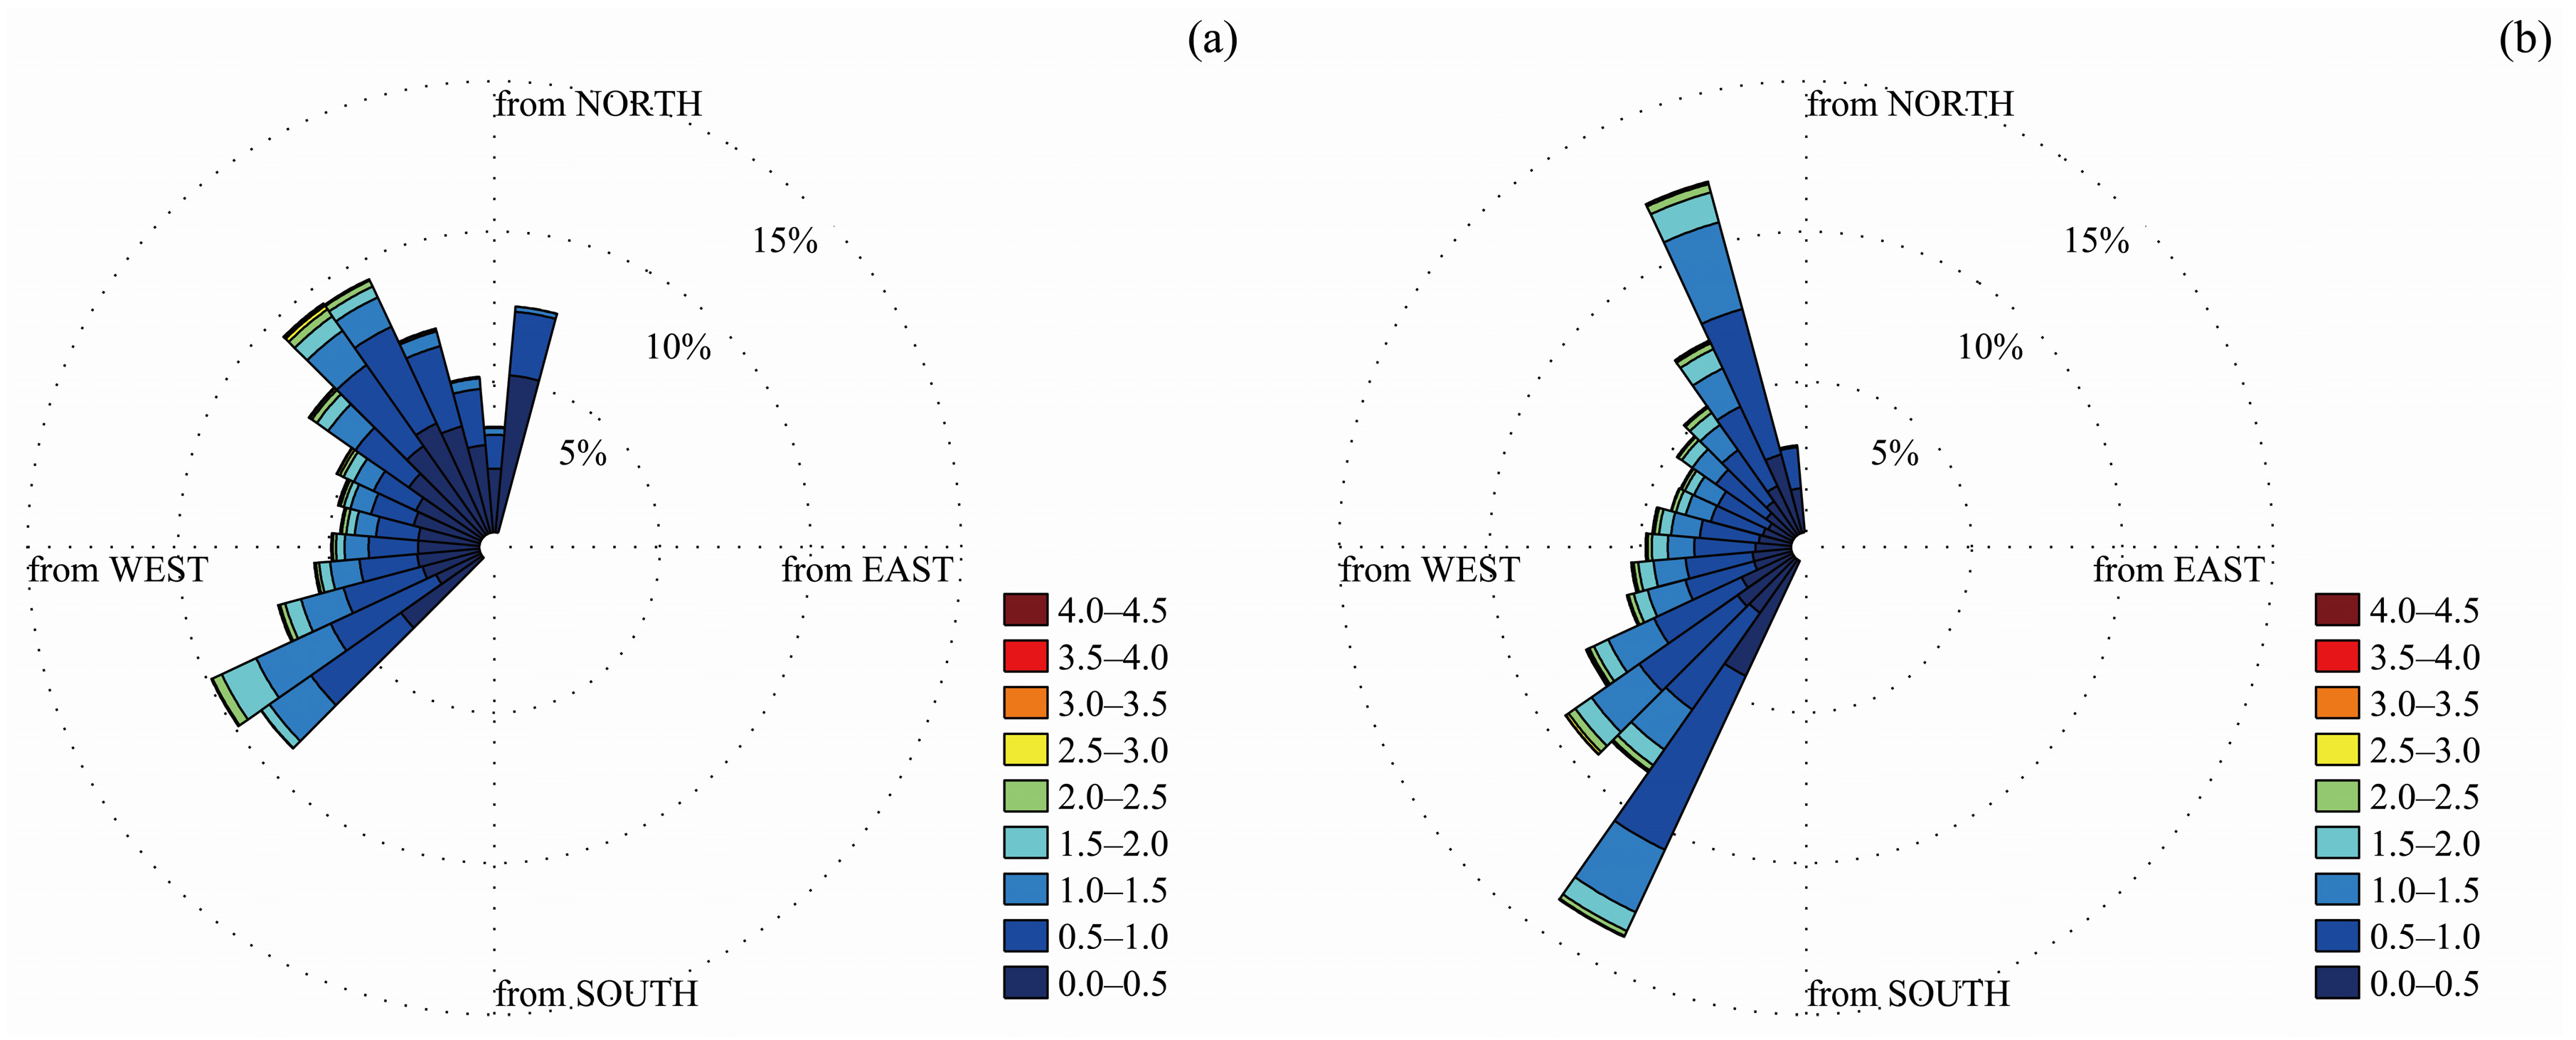
2.3. Wave and Tidal Characteristics

We considered the period from 1 January 1990 to 31 December 1999 for which detailed hourly and three-hourly wave observations (root-mean-square wave height Hrms, peak wave period Tp and wave direction θ) were available for Noordwijk (Meetpost Noordwijk, MPN; see Figure 1) and IJmuiden (about 17 km south of Egmond, Munitie stortplaats, YM6; see Figure 1), respectively. To ensure a consistent comparison at the same water depth, the wave conditions at YM6 were converted to the water depth at MPN (from –21 m to –18 m) using Snell’s law.
Figure 4a compares the time-mean Hrms of Noordwijk and Egmond as a function of θ. Apart from the waves from the southwestern direction, the wave height at Egmond is larger. Especially for the northwestern direction this difference increases as Egmond is more exposed to the North Sea. Differences in the time-mean wave period are relatively small (Figure 4b). Storms (Hrms > 1.5 m) are predominantly obliquely incident (Figure 5) and occur throughout the year, although the fall and winter are usually more energetic than spring and summer [14]. This gives rise to a weak seasonality in Hrms [24]. In addition, there is some year-to-year variability in the wave climate [5]. At Noordwijk, for example, the annual cumulative wave energy can be up to 30% higher or lower than the multi-annual mean, although the differences are usually substantially smaller [5]. In addition, there is no periodicity in the year-to-year variability.
The tide along the Holland coast is micro-tidal, with a mean tidal range of about 1.6 m. The tidal range decreases slightly in northward direction, which results in a tidal range that is on average about 0.1 m smaller at Egmond than at Noordwijk [24]. Tidal currents are generally lower than 1 m/s with little alongshore variations.

3. Approach

The main objective is to identify which environmental parameters and processes primarily govern the bar cycle duration. To that end, we apply the calibrated Noordwijk model [21] to a profile at Egmond as well. Although profile models typically require a site-specific calibration [13], we maintain the Noordwijk model settings in the application at the Egmond site. Only the site specific environmental variables from Egmond are used (i.e., profile, d50 and time series of the waves and water levels). It is not our aim to achieve an optimal performance at Egmond (i.e., best agreement with the observed inter-annual profile evolution) as long as the model is able to predict a significant difference in Tr between both sites. That will allow us to generate consistent predictions for both sites in which, for example, one specific (known) variable is modified. This approach allows us to identify the influence of the main environmental parameters such as wave height, near shore profile shape and sediment size on Tr. A comparison of two separately calibrated models would hamper such a comparison. Although different model settings will not influence the overall characteristics of the simulated bar morphology (i.e., the net offshore directed cycle), it will affect the magnitude of the morphodynamic response. This will influence the subtle interdependencies between the hydrodynamic forcing and the morphodynamic response, which, in turn, will convolute the analysis of the predictions at both sites. However, as stated earlier, the primary concern is to verify that the predicted Tr at Egmond differs sufficiently (i.e., larger) than at Noordwijk in the reference simulations. Therefore, as a first step, the predictions for both sites are evaluated. Next, the main environmental variables will be interchanged to identify the relative contribution of the wave climates, profiles and sediment size to changes in the bar cycle return period (e.g., the Egmond wave climate is combined with the Noordwijk profile and vice versa). The results of these hindcast simulations and the overall effects of the Egmond and Noordwijk wave climates, profiles and sediment sizes on Tr are discussed in detail in Section 4. In Section 5, these overall effects are further examined in order to identify the mechanisms and processes that govern Tr. For this, detailed schematic simulations are conducted and analyzed in which, for example, the influence of the profile slope on Tr is quantified.
This section continues with a brief description of the model in Section 3.1, followed by a description of the hindcast simulations in Section 3.2. Finally, the adopted analysis method is briefly discussed in Section 3.3.

3.1. Model Description

Unibest-TC is a cross-shore profile model and comprises coupled, wave-averaged equations of hydrodynamics (waves and mean currents), sediment transport, and bed level evolution. Straight, parallel depth contours are assumed. Starting with an initial, measured cross-shore depth profile and boundary conditions offshore, the cross-shore distribution of the hydrodynamics and sediment transport are computed. Transport divergence yields bathymetric changes, which feedback to the hydrodynamic model at the subsequent time step, forming a coupled model for bed level evolution. The phase-averaged wave model is based on [31] extended with the roller model according to [32] and the breaker delay concept [33] to have an accurate cross-shore distribution of the wave forcing. The cross-shore varying wave height to depth ratio, γ, of [34] was used in the breaking wave dissipation formulation as it results in more accurate estimates of the wave height across bar-trough systems than a cross-shore constant γ. The vertical distribution of the flow velocities is determined with the 1DV current-model of [35]. Based on the local wave forcing, mass flux, tide and wind forcing a vertical distribution of the longshore and cross-shore wave-averaged horizontal velocities are calculated. These advective currents are combined with the instantaneous oscillatory wave motion in such a way that the resulting velocity signal has the same characteristics of short-wave velocity skewness, amplitude modulation, bound infragravity waves, and mean flow as a natural random wave field [36]. The transport formulations distinguish between bed load and suspended load transport. The bed load formulations [37] are driven by the instantaneous velocity signal. The suspended transports are based on the integration over the water column of the sediment flux. The wave-averaged near-bed sediment concentration is prescribed according to [38], which among other factors, is driven by a time-averaged bed shear stress based on the instantaneous velocity signal. A detailed description of the Unibest-TC model can be found in [13,21].

3.2. Hindcast Model Simulations

The simulations are based on the settings according to the Noordwijk model calibrated for 1980 to 1984 period (i.e., one bar cycle period, see [21]). As the calibrated model was shown to be valid for other periods at Noordwijk as well [5] and the primary focus of the present study is to investigate the difference between the two sites, we did not perform additional calibration or validation simulations for the Noordwijk and the Egmond model application.
The hindcast simulations have a net duration of about 9.5 years (1990–1999) and were forced with the locally observed (MPN and YM6 stations, see Figure 1) hydrodynamic forcing time series for this period for both sites (water levels and wave characteristics). The initial bed profiles were derived from the measured 1990 Jarkus transects (see Figure 6) and the sediment characteristics are according to Table 1.
Next, model simulations were performed in which the profile (and sediment diameter), wave climate (wave height, period and angle) for Noordwijk and Egmond were interchanged. Since the sediment size and the profile slope are correlated (e.g., [39]), we did not consider these separately. This implies that four combinations of wave time series and profile/d50 could be evaluated (Table 2).
To investigate whether specific profile characteristics influenced the bar cycle period, we constructed synthetic profiles in which parts of the Noordwijk and Egmond (time-averaged) profiles and bars were combined. These profiles were subsequently used to perform hindcast simulations forced with the wave climates of both sites. We considered combinations of the upper shoreface (upper profile up to 8 m water depth), the middle shoreface (profile between 8 and 15 m water depth) and the lower shoreface (profile deeper than 15 m water depth) from both sites (see Table 3 and Figure 7). As the sediment size is assumed to be cross-shore constant in the model, it cannot be varied together with the profile sections. The choice of sediment size was therefore associated with the upper shoreface profile as in test simulations it was found that especially these required to be correlated to avoid an unstable or unrealistic profile evolution.

3.3. Analysis Method

The bar cycle return period Tr was determined by the time it takes a bar to be at the same cross-shore position as its predecessor. Ruessink et al. [3] showed that the complex EOF analysis is a robust method to derive Tr and it is therefore also used in this study. Complex EOF was preferred over classic EOF because it can capture the migrating sandbar pattern in a single (complex) mode and, as such, allows for a straightforward quantification of spatial and temporal sandbar characteristics (see [3]). Classic EOF is restricted to the description of standing patterns and thus requires two modes that contain approximately equal variance to describe migrating sandbars (see [18]). While these two modes can be combined into a complex pair, the technique that produces the complex mode inherently was preferred. An extensive description of complex EOF can be found in [3,40].

4. Model Results

First the reference cases for Noordwijk and Egmond are presented. Subsequently, the results of the modified model set ups described in Section 3 are discussed by comparing these to the reference case predictions.

4.1. The Reference Cases (Scenarios NN and EE)

From the comparison of the predicted profile development (Figure 8), the difference in bar cycle duration stands out immediately. The bar cycle period for Noordwijk (Scenario NN) is 4.8 years, which compares well to that derived from the observations for the same period (Tr = 3.9 years). For Egmond (Scenario EE), the predicted Tr of 8.7 years is significantly larger. However, it is still a significant under-estimation of the value derived from the profile surveys (Tr = 15.1 years). Ruessink et al. [13] showed that the model required a site specific calibration effort on weekly time scales. Given the multi-annual time scales considered in the present study, relatively larger model errors are to be expected as the model was not calibrated to the Egmond site. Since we are primarily interested in identifying the causes for the difference in the bar cycle period, we consider the model performance at Egmond to be adequate since the model predicts a significant difference in Tr between both sites. Furthermore, the short-term response to periods of increased or reduced wave energy is relatively stronger for Noordwijk (i.e., short-term variations around the annual trend are larger at Noordwijk). The difference in Tr primarily originates from the combined effects of a larger annual offshore migration at Noordwijk (averaged offshore migration rate is approximately 55 m/year compared to 40 m/year for Egmond) and an approximately 200 m narrower cross-shore bar zone because the bars decay at a relatively shallow water depth.

4.2. Effects of Wave Climate vs. Sediment Size and Profile (Scenarios EN and NE)

The initial profile and wave climate have a profound impact on the resulting profile evolution (Figure 9a,b). Imposing the slightly more energetic Egmond wave climate on the Noordwijk profile (Scenario NE, see Figure 9a) results in a 50% reduction of the bar cycle period compared to the Noordwijk reference (Scenario NN, see Figure 8a). The opposite occurs when subjecting the Egmond profile to the Noordwijk wave climate (Scenario EN, see Figure 9b): the bar cycle period is almost doubled to 14.6 years. Although the Egmond wave climate reduced Tr, the wave climate increases the bar zone width by about 200 m and also results in slightly increased maximum bar amplitude. Due to the increased Tr, the bar zone width is difficult to determine for Scenario EN, but the results seem to suggest that it decreases by at least 100 m. Furthermore, the maximum bar amplitude in this scenario is about 0.5 m less compared to the Egmond reference case (Scenario EE, see Figure 8b).
Consistent with [3], the energy level of the wave climate appears to influence Tr significantly. However, the effect of the initial profile and bar morphology has an even larger influence. Comparing Tr for the four scenarios (summarized in Table 4), an indication of the relative importance of the initial profiles and wave climates can be obtained. The interchange of wave climates results in a change of Tr of about 200% (compare scenarios NN, NE, EE, and EN). The influence of the initial profile, bar morphology and sediment size results in a variation Tr of about 300%. For example, the Egmond climate on the Noordwijk profile results in a Tr of 2.4 years compared to Tr = 8.7 years for the Egmond profile.

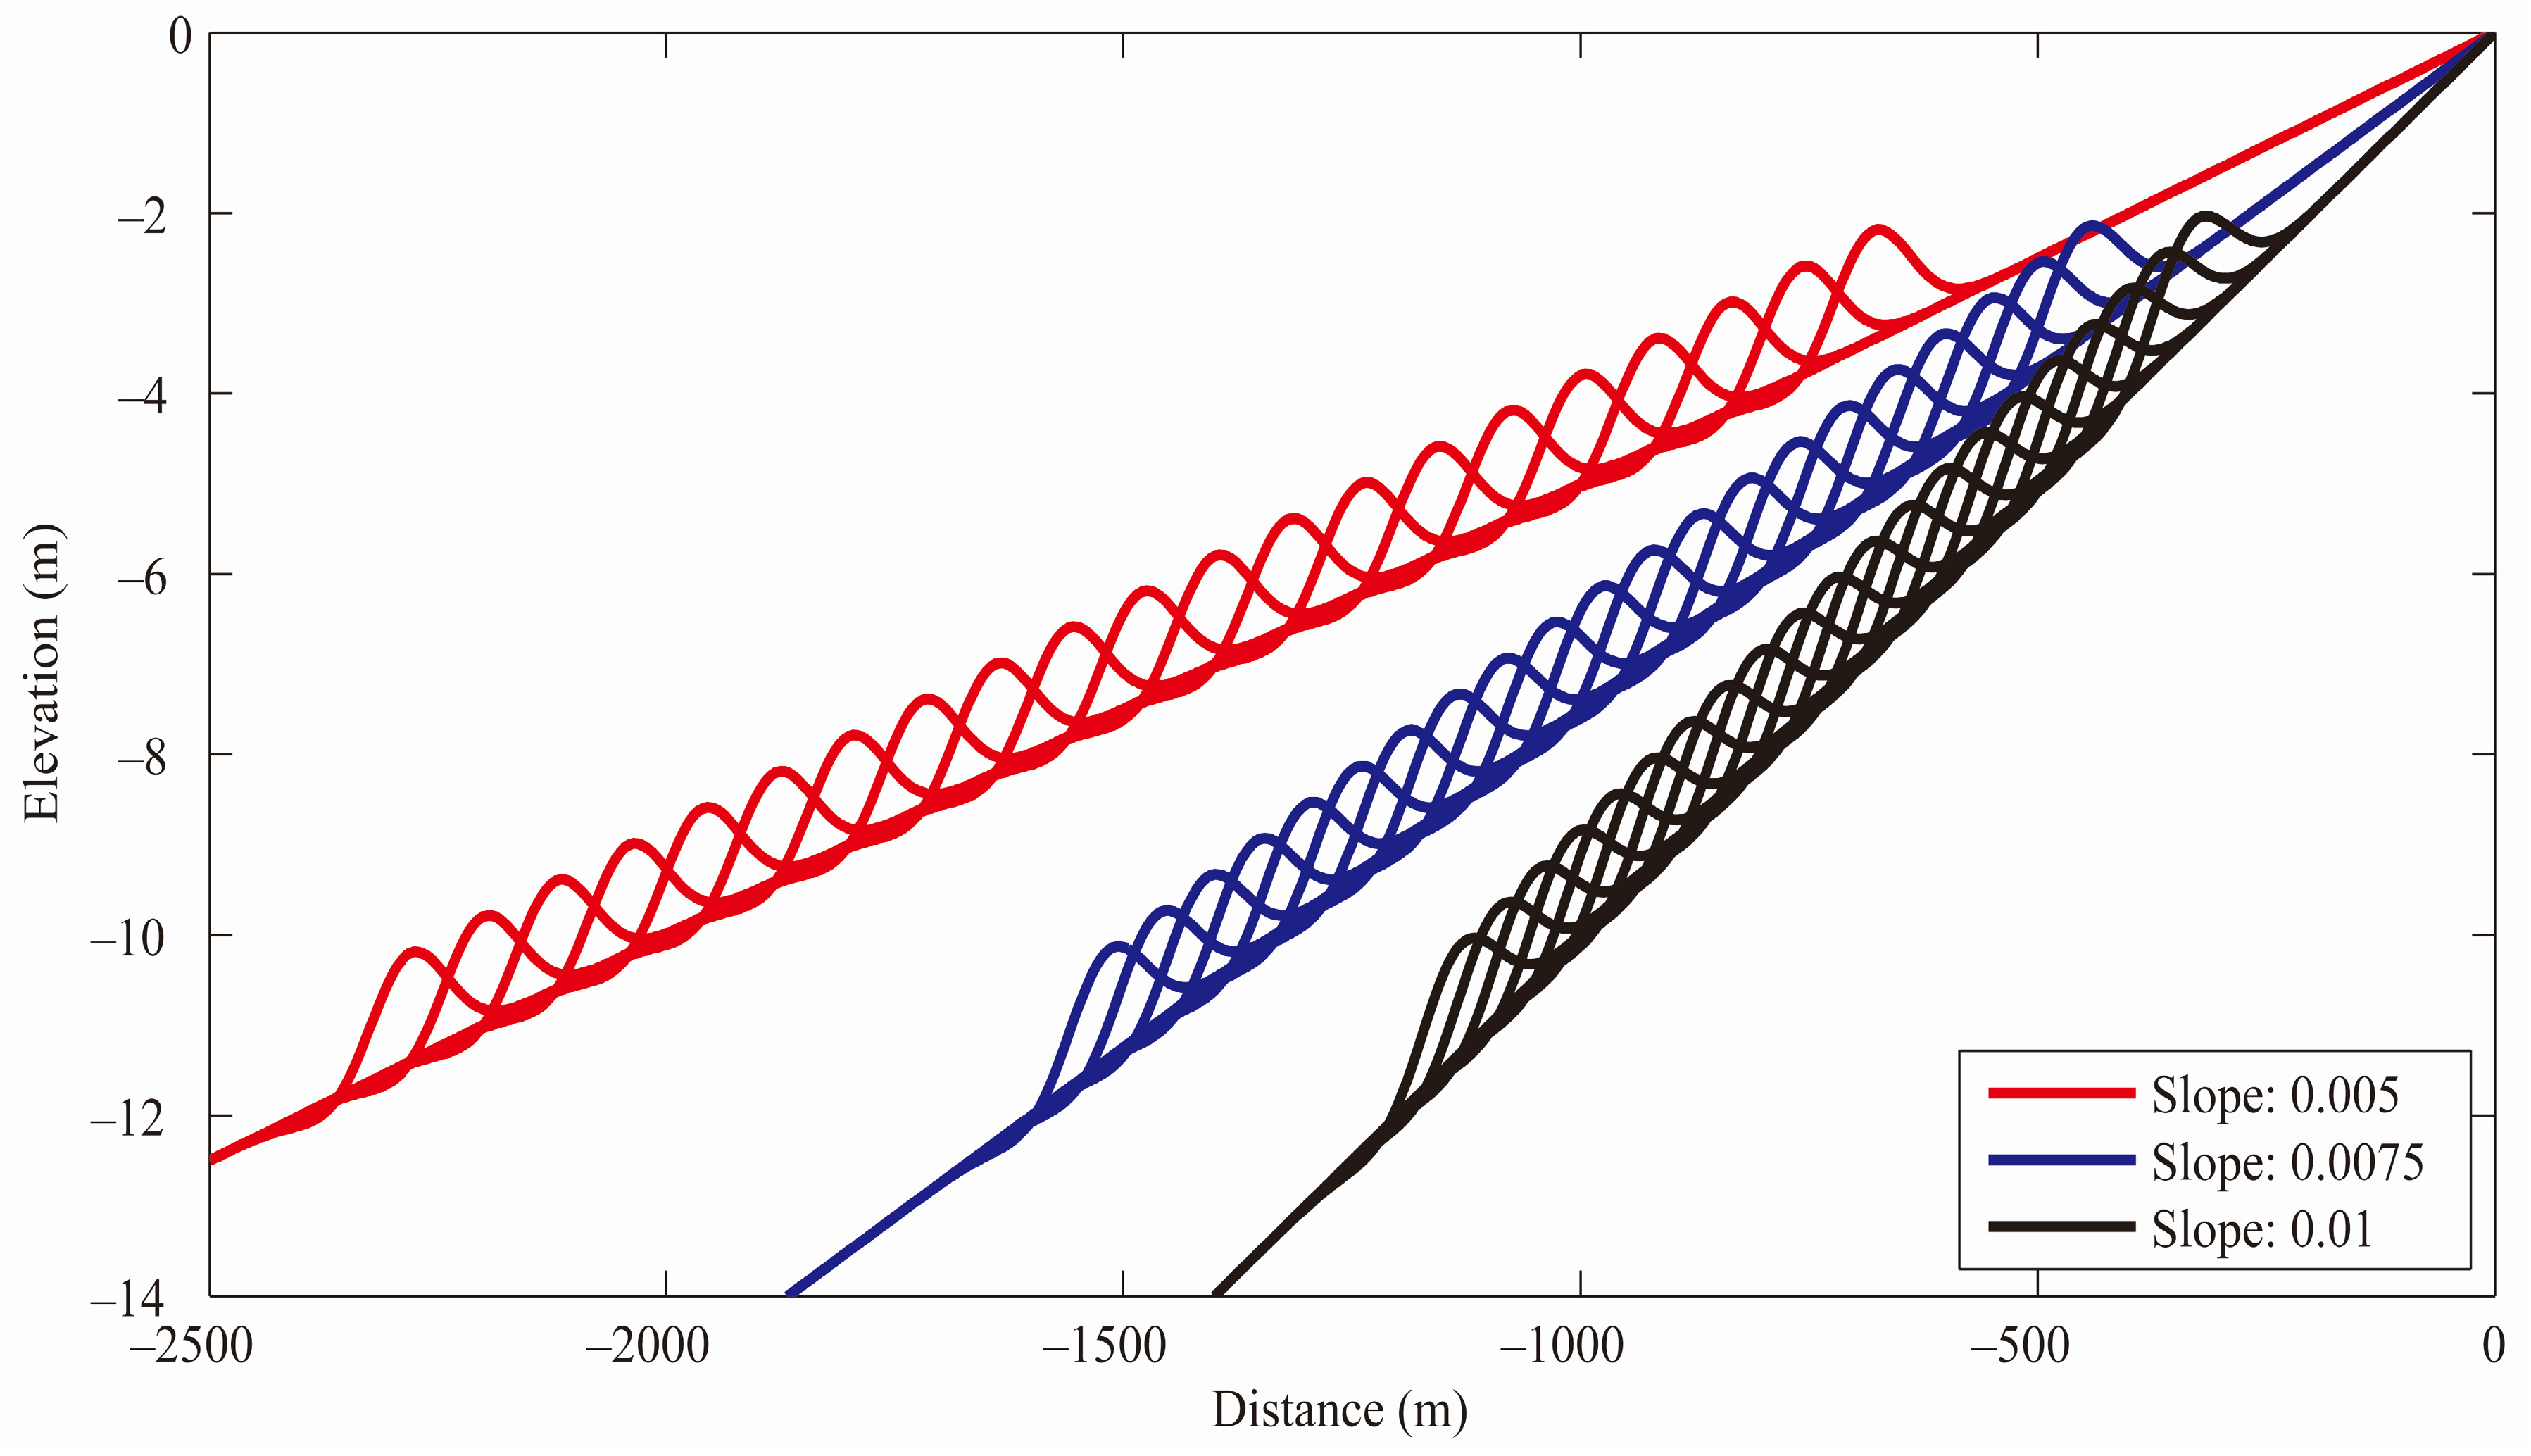
4.3. Effects of Profile Slope and Bar Characteristics

The various profile compositions as summarized in Section 3.2 are used as the starting point for 10 year morphodynamic simulations using the wave and water level time series of both Noordwijk and Egmond as boundary conditions. The predicted return periods are collected in Table 5. The table shows the return periods for the composite profiles forced with the Noordwijk and Egmond wave climates as well as the relative change compared to the appropriate hindcast simulations.
Combining the Egmond bars with the Noordwijk profile (profile 1—ENNN) clearly causes an increased Tr for both wave climates (i.e., compare Tr values for profile 1 in Table 5). Compared to the original Noordwijk profile the increase is about twice as large for the Noordwijk wave climate compared to the Egmond wave climate (1.36 vs. 1.17). However, incorporating the Egmond upper shoreface in the Noordwijk profile (i.e., bar zone; profile 2—NENN) has a larger impact. Profile 2 combined with the Noordwijk climate results in a somewhat unrealistic profile evolution for which only a visual estimate of the bar cycle period could be made; however, a clear substantial increase in Tr was present (7 years). For the Egmond wave climate, the relatively steep slope of the Egmond upper shoreface results in a major (2.55) relative increase in Tr.
The comparison of profile 3 (i.e., Egmond bar and upper shoreface combined with the middle and lower shoreface of Noordwijk; EENN) with the original Noordwijk profile simulations shows significantly increased Tr for both wave forcing time series (changes in Tr for profile 3 are 2.69 and 2.91 compared original Noordwijk profile, see Table 5). This implies that the combined effect of the upper shoreface slope and bar volume (and sediment size) has the largest effect on Tr of all the considered scenarios by far. The influence of the bed slope of the upper shoreface is especially clear for the Egmond wave forcing (i.e., for NENN—only upper shoreface is taken from Egmond—Tr is 2.55 larger than for the complete Noordwijk profile, using the Egmond bar results in an Tr of 2.91). For the Noordwijk wave forcing this is less obvious (Tr respectively 1.46 and 2.69 larger). This is probably due to the unrealistic predictions starting from profile 2 subjected to the Noordwijk wave forcing.
The return periods for profile 3 were reduced by only 10% to 20% relative to original Egmond profile simulations. This implies the effect of the middle and lower shoreface are relatively limited. This is also reflected by Profiles 4 and 5. Interestingly, comparison of the perturbation time stacks revealed that the slope of the upper shoreface also influenced the bar amplitude. This was especially clear for the simulations with Profile 2 in which the bar amplitude rapidly increased to similar values as observed at Egmond (not shown).
In the simulations with the composite profiles the upper shoreface and bar volume appear to contribute about 80% to 90% of the profile induced changes on Tr. The Egmond wave climate reduces Tr by about a factor 2–2.5 and is approximately similar for most composite profiles (except for profile 2). The relative influence of the profile and wave climate on Tr are therefore similar as found for the reference simulations (Section 4.1 and Section 4.2).

5. The Relative Influence of Environmental Parameters on Tr

5.1. Introduction

From the evaluation in the previous section it is apparent that the wave climate, profile geometry and sediment size all have a significant effect on Tr. Increased sediment size causes a decrease in sediment transport and Tr (and vice versa). A relatively energetic wave climate results in an enhanced net bar offshore migration and consequently reduces Tr, whereas relatively large bars and steeper upper shoreface bed slopes have the opposite effect. Of the latter two, it was found in the previous section that especially the upper shoreface bed slope has a major influence on Tr. At first sight this is somewhat counter-intuitive as a steeper slope typically results in more intense wave breaking and consequently enhanced undertow and offshore sediment transport at the bar crest. This is addressed in Section 5.2 by comparing outcomes from morphostatic simulations (i.e., no bed updating) for profiles with identical bars in the inner surf zone, but different profile slopes. This approach is extended in Section 5.3 to investigate the influence of the water depth at the bar crest (hXb) on Tr by considering sets of simulations in which a bar with constant shape is placed at 21 equidistant locations across the barred zone.

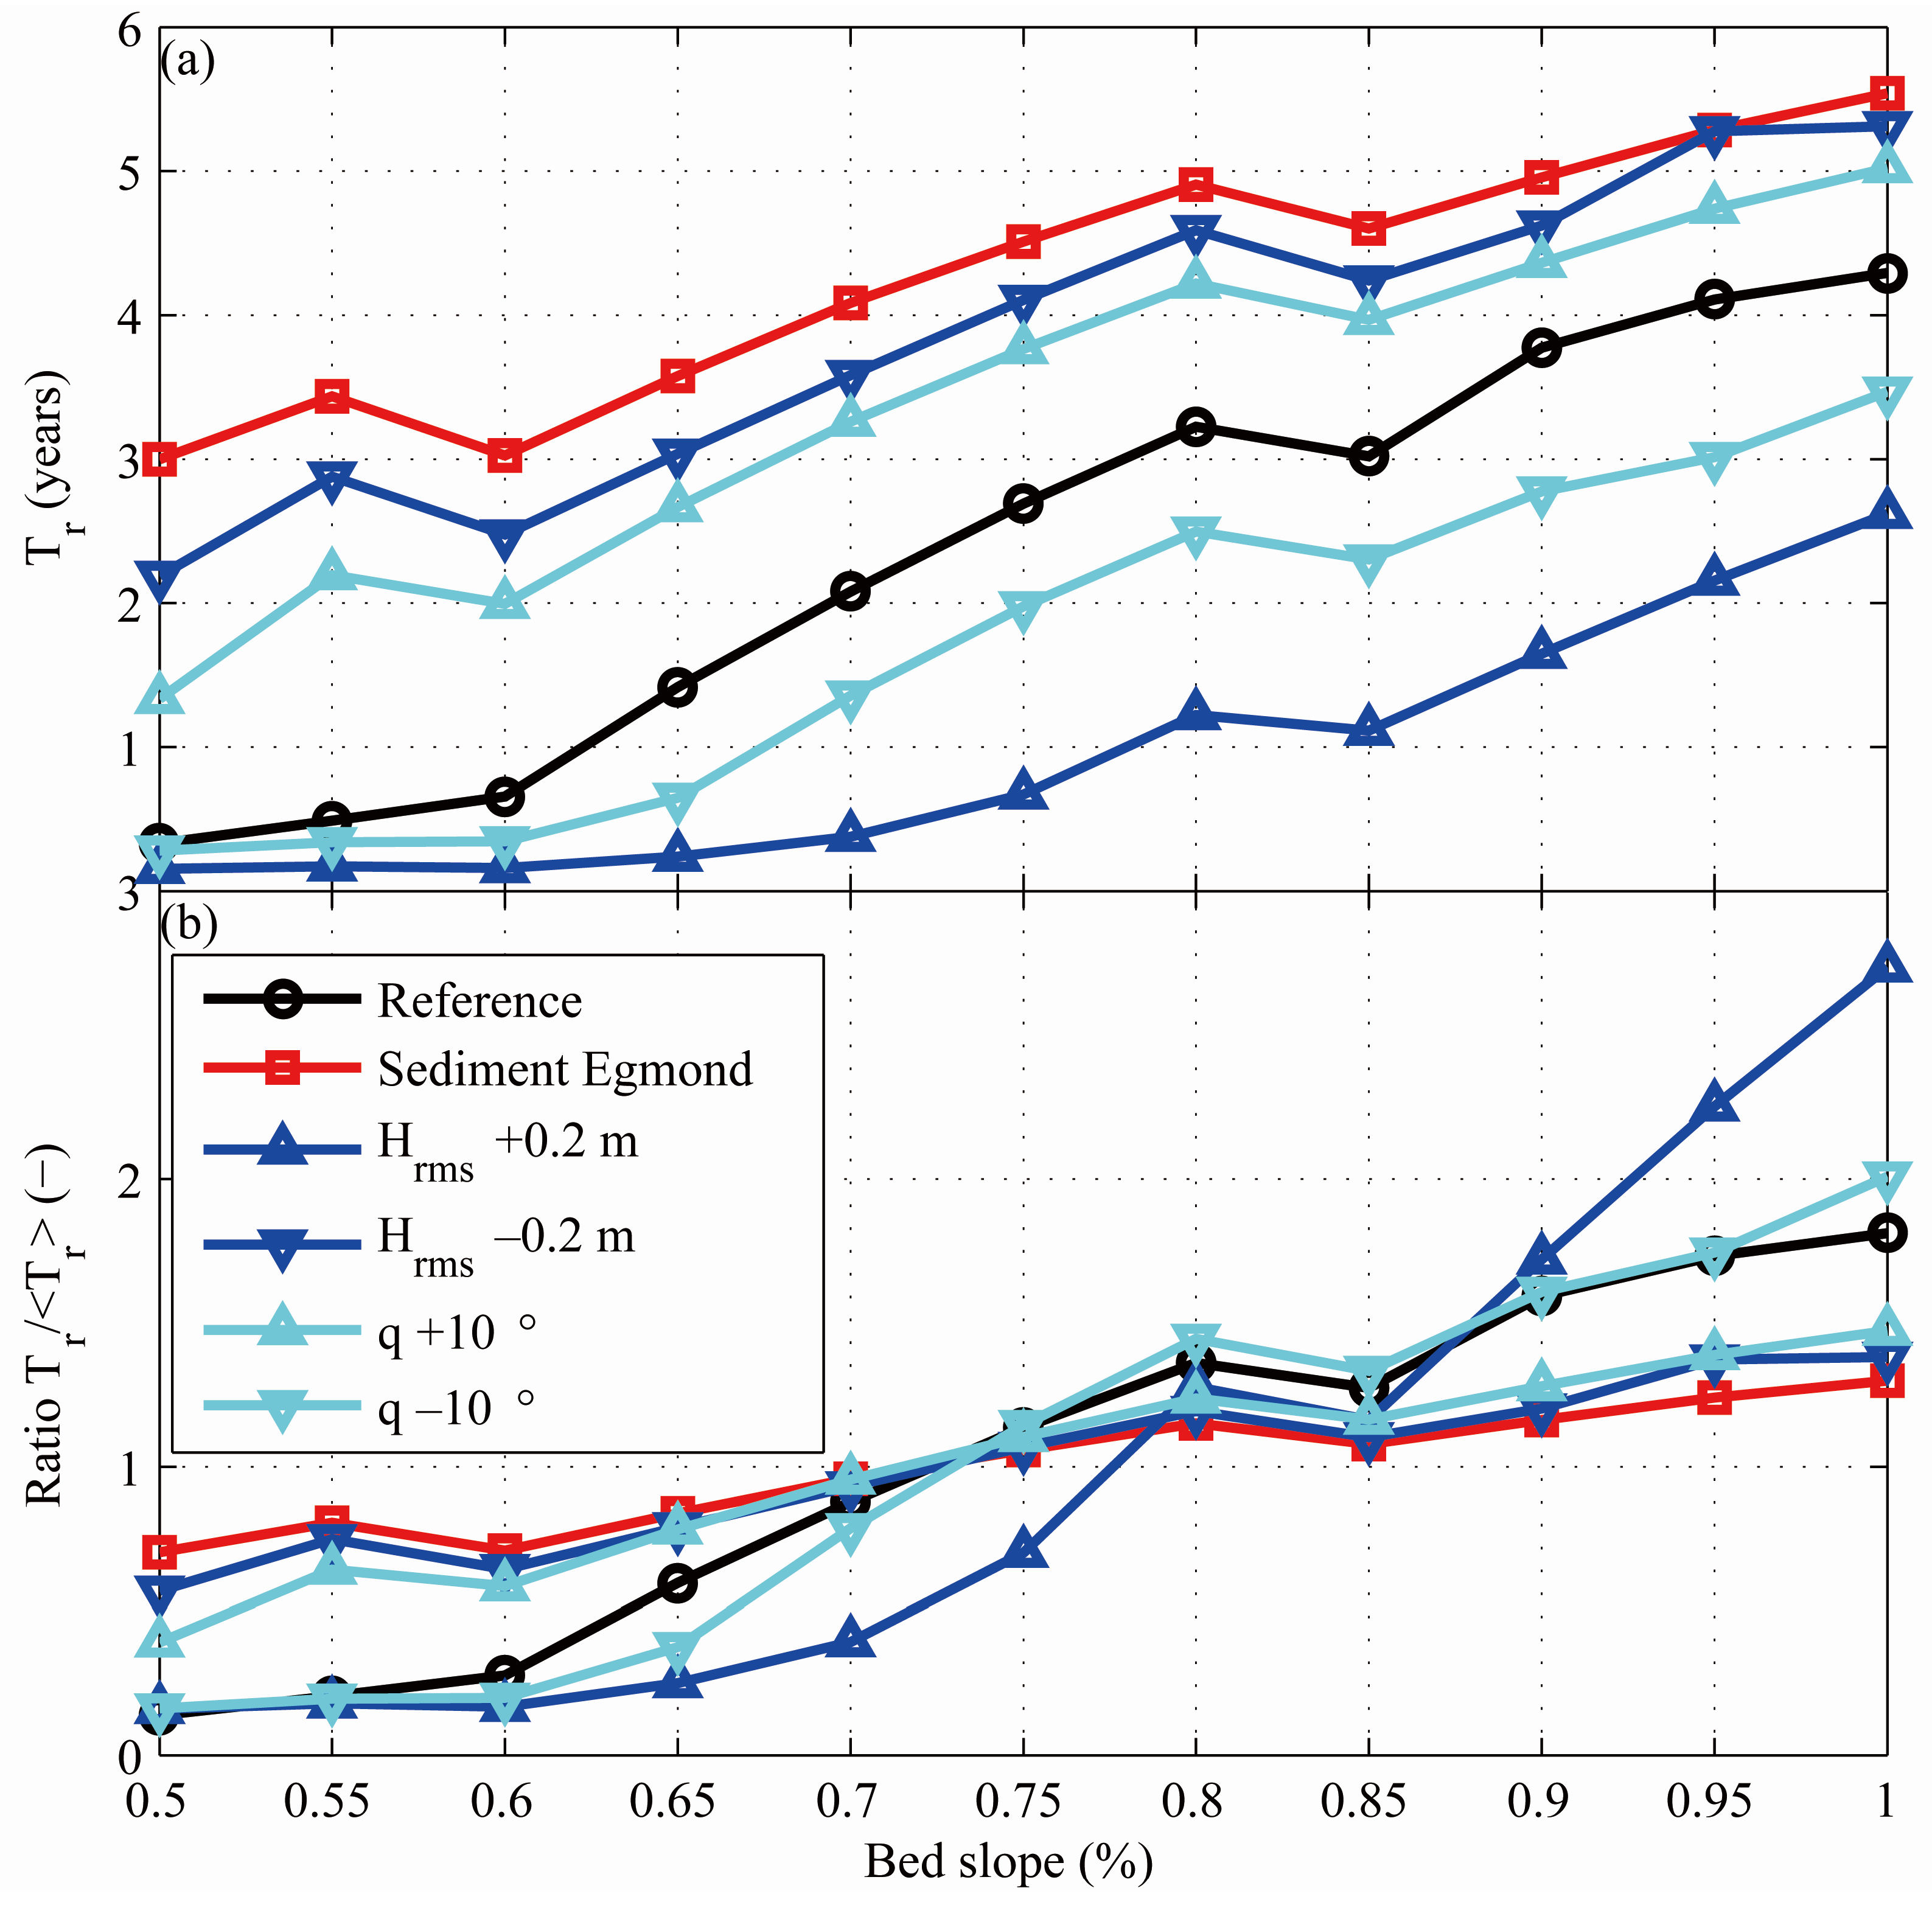
5.2. Effect of the Profile Slope on the Bar Migration Rate in the Inner Surf Zone

The effect of the profile slope was further investigated by considering morphostatic simulations starting from schematic profiles in which identical bars (with the crest at identical water depth) are combined with bed slopes representative for Egmond and Noordwijk (Figure 10) which were subjected to the full 9.5 year Noordwijk wave and water level time series. Detailed comparisons of wave height, undertow and sediment transport at the crest of the bars (location indicated in Figure 10) clearly confirmed that, despite the identical wave height at the top of the bar (Figure 11a), the undertow (depth-averaged return flow) is indeed larger due to more intense wave breaking at the bar crest for the steeper Egmond profile (Figure 11b). The enhanced turbulence levels due to the wave breaking and the increased return flow velocities consequently enhance the offshore sediment transports (Figure 11c). Potentially, this would induce an enhanced offshore bar migration.

5.3. Identification of the Effects of Hrms, θ and d50 on Tr

In the hindcast simulations the initial response described above apparently does not result in an increased Tr. Therefore, it is assumed that the cumulative effect of the morphodynamic feedback between the barred profile and the wave forcing primarily governs Tr. In [21], the water depth above the bar crest (hXb) was identified to be a crucial parameter. Therefore, we need to investigate how hXb and the morphodynamic feedback loop affects Tr. In other words, how is the offshore migration rate affected as the bar migrates offshore and can we quantify the impact on Tr? To estimate Tr we conduct a set of one-day simulations starting from plane profiles in which a bar is placed at 21 equidistant locations across the bar zone. In order to exclude the effect of the transient bar amplitude response (i.e., the change from growth to decay as the bar migrates across the surf zone) we considered a bar with a constant shape. For each simulation the daily migration rate and bar amplitude response are determined by considering the change in the horizontal and vertical bar crest position. Subsequently, the daily migration rates are integrated over the set of 21 simulations to estimate the time it takes for a bar to migrate across the bar zone as a proxy for Tr.
By modifying a single environmental variable in each considered set we are able to isolate its influence on Tr. We considered 10 profile slopes ranging from 0.5% to 1% (see Figure 12). The same single wave condition as also used in [21] (Hrms = 1.7 m, Tp = 8 s, θ = 20°) was applied. Normally a single wave condition is not sufficient to represent the full wave climate [41]. However, since we are primarily interested in the relative changes in Tr, the full wave climate is not required. In addition to the profile slope, the wave height and wave direction were also varied with ranges that are representative of the difference in these parameters between Egmond and Noordwijk. The relevant Noordwijk environmental variables were used as a reference. Since in this approach Tr is derived from the initial profile response, it will also allow us to isolate the effect of the sediment size (this was not possible in the morphodynamic simulations as unrealistic profiles or instabilities resulted if the upper profile and bar zone were inconsistent with the sediment size).
The migration rate (dXb/dt) and bar amplitude response (dAb/dt) as derived for the set of reference simulations as a function of the bed slope are shown in Figure 13 for both hXb and x. The influence of the bed slope on both dXb/dt and dAb/dt is striking. A steeper profile clearly results in an offshore migration of the bar into larger water depths, but in a narrower cross-shore region (compare Figure 13a,b). It clearly illustrates the importance of hXb: steeper slopes initially induce an increased offshore migration but it quickly reduces as the bar migrates to deeper water. As a result, the cross-shore region at which this offshore migration occurs is also narrower. The bar amplitude growth is significantly larger for steeper profile slopes, extends into larger water depths, and also occurs in a relatively narrow region (Figure 13c,d). The integrated positive (i.e., offshore) migration rates across the surf zone are used as a proxy for Tr. In this way the varying width of the barred zone (see Figure 13b) is included in the analysis.
The predicted Tr are clearly influenced by the bed slope for all the considered scenarios (Figure 14a) with a larger Tr for a steeper slope. Despite the larger maximum offshore migration rates (as shown Figure 13), the cumulative result is an increased Tr for steeper bed slopes as these high rates only occur in a relatively narrow cross-shore region. This confirms our idea that the morphodynamic feedback loop primarily governs Tr. Comparing the relative change in Tr compared to the averaged value for each series (Tr/<Tr>, Figure 14b), it can be seen that the sensitivity to the bed slope varies. The simulations with increased sediment size, wave angle and a reduced wave height result in a relatively reduced sensitivity to the bed slope, whereas an increased wave height shows an increased sensitivity.
The importance of the bed slope implies that hXb and the morphodynamic feedback loop primarily govern Tr. Despite more intense wave breaking and an initial enhanced offshore migration rate, the overall effect of a steeper profile is an increased Tr as it causes:
1)
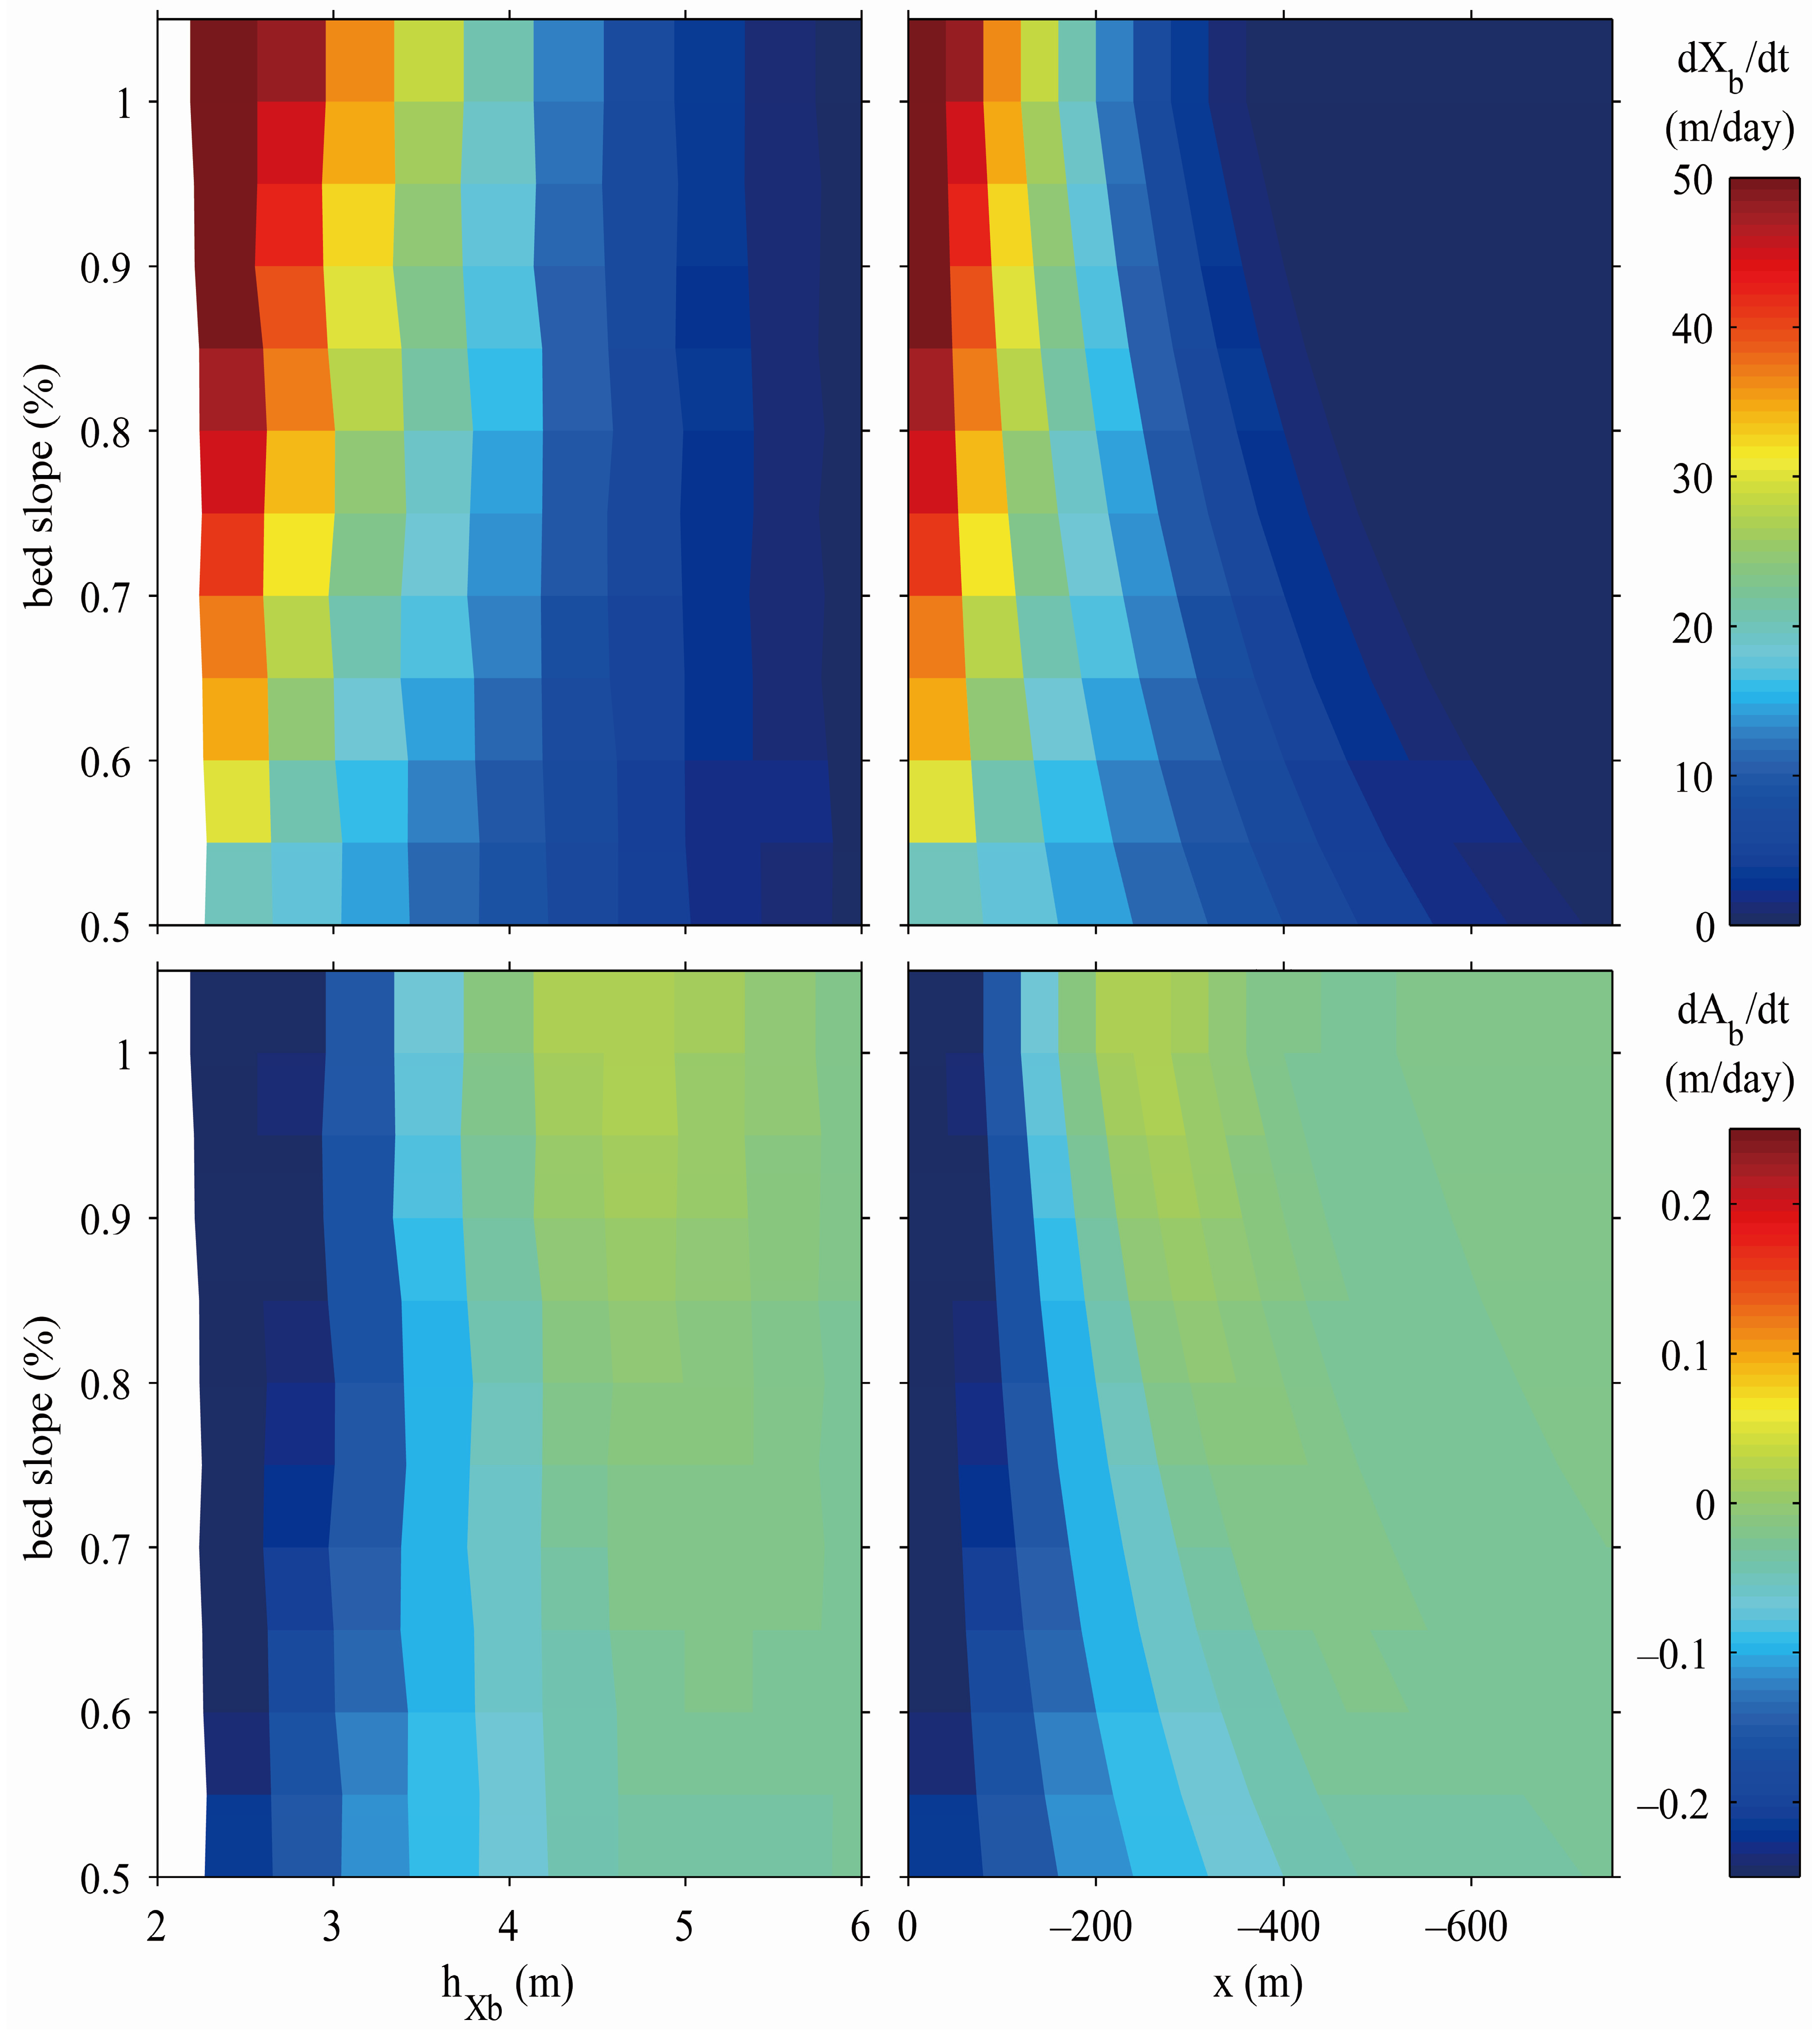
A relatively larger increase in hXb as a bar gradually migrates offshore which in turn causes fewer waves to break on the bar and consequently reduces the offshore bar migration.
2)
Enhanced wave breaking results in relatively larger bars (e.g., see Figure 13b) that will also reduce the offshore migration (e.g. compare scenarios ENNN and NN in Table 5; see also [19]). Although a larger bar amplitude implies a somewhat smaller hXb at the same cross-shore location (and Tr), the increase in hXb as a bar migrates offshore dominates the Tr response.
3)
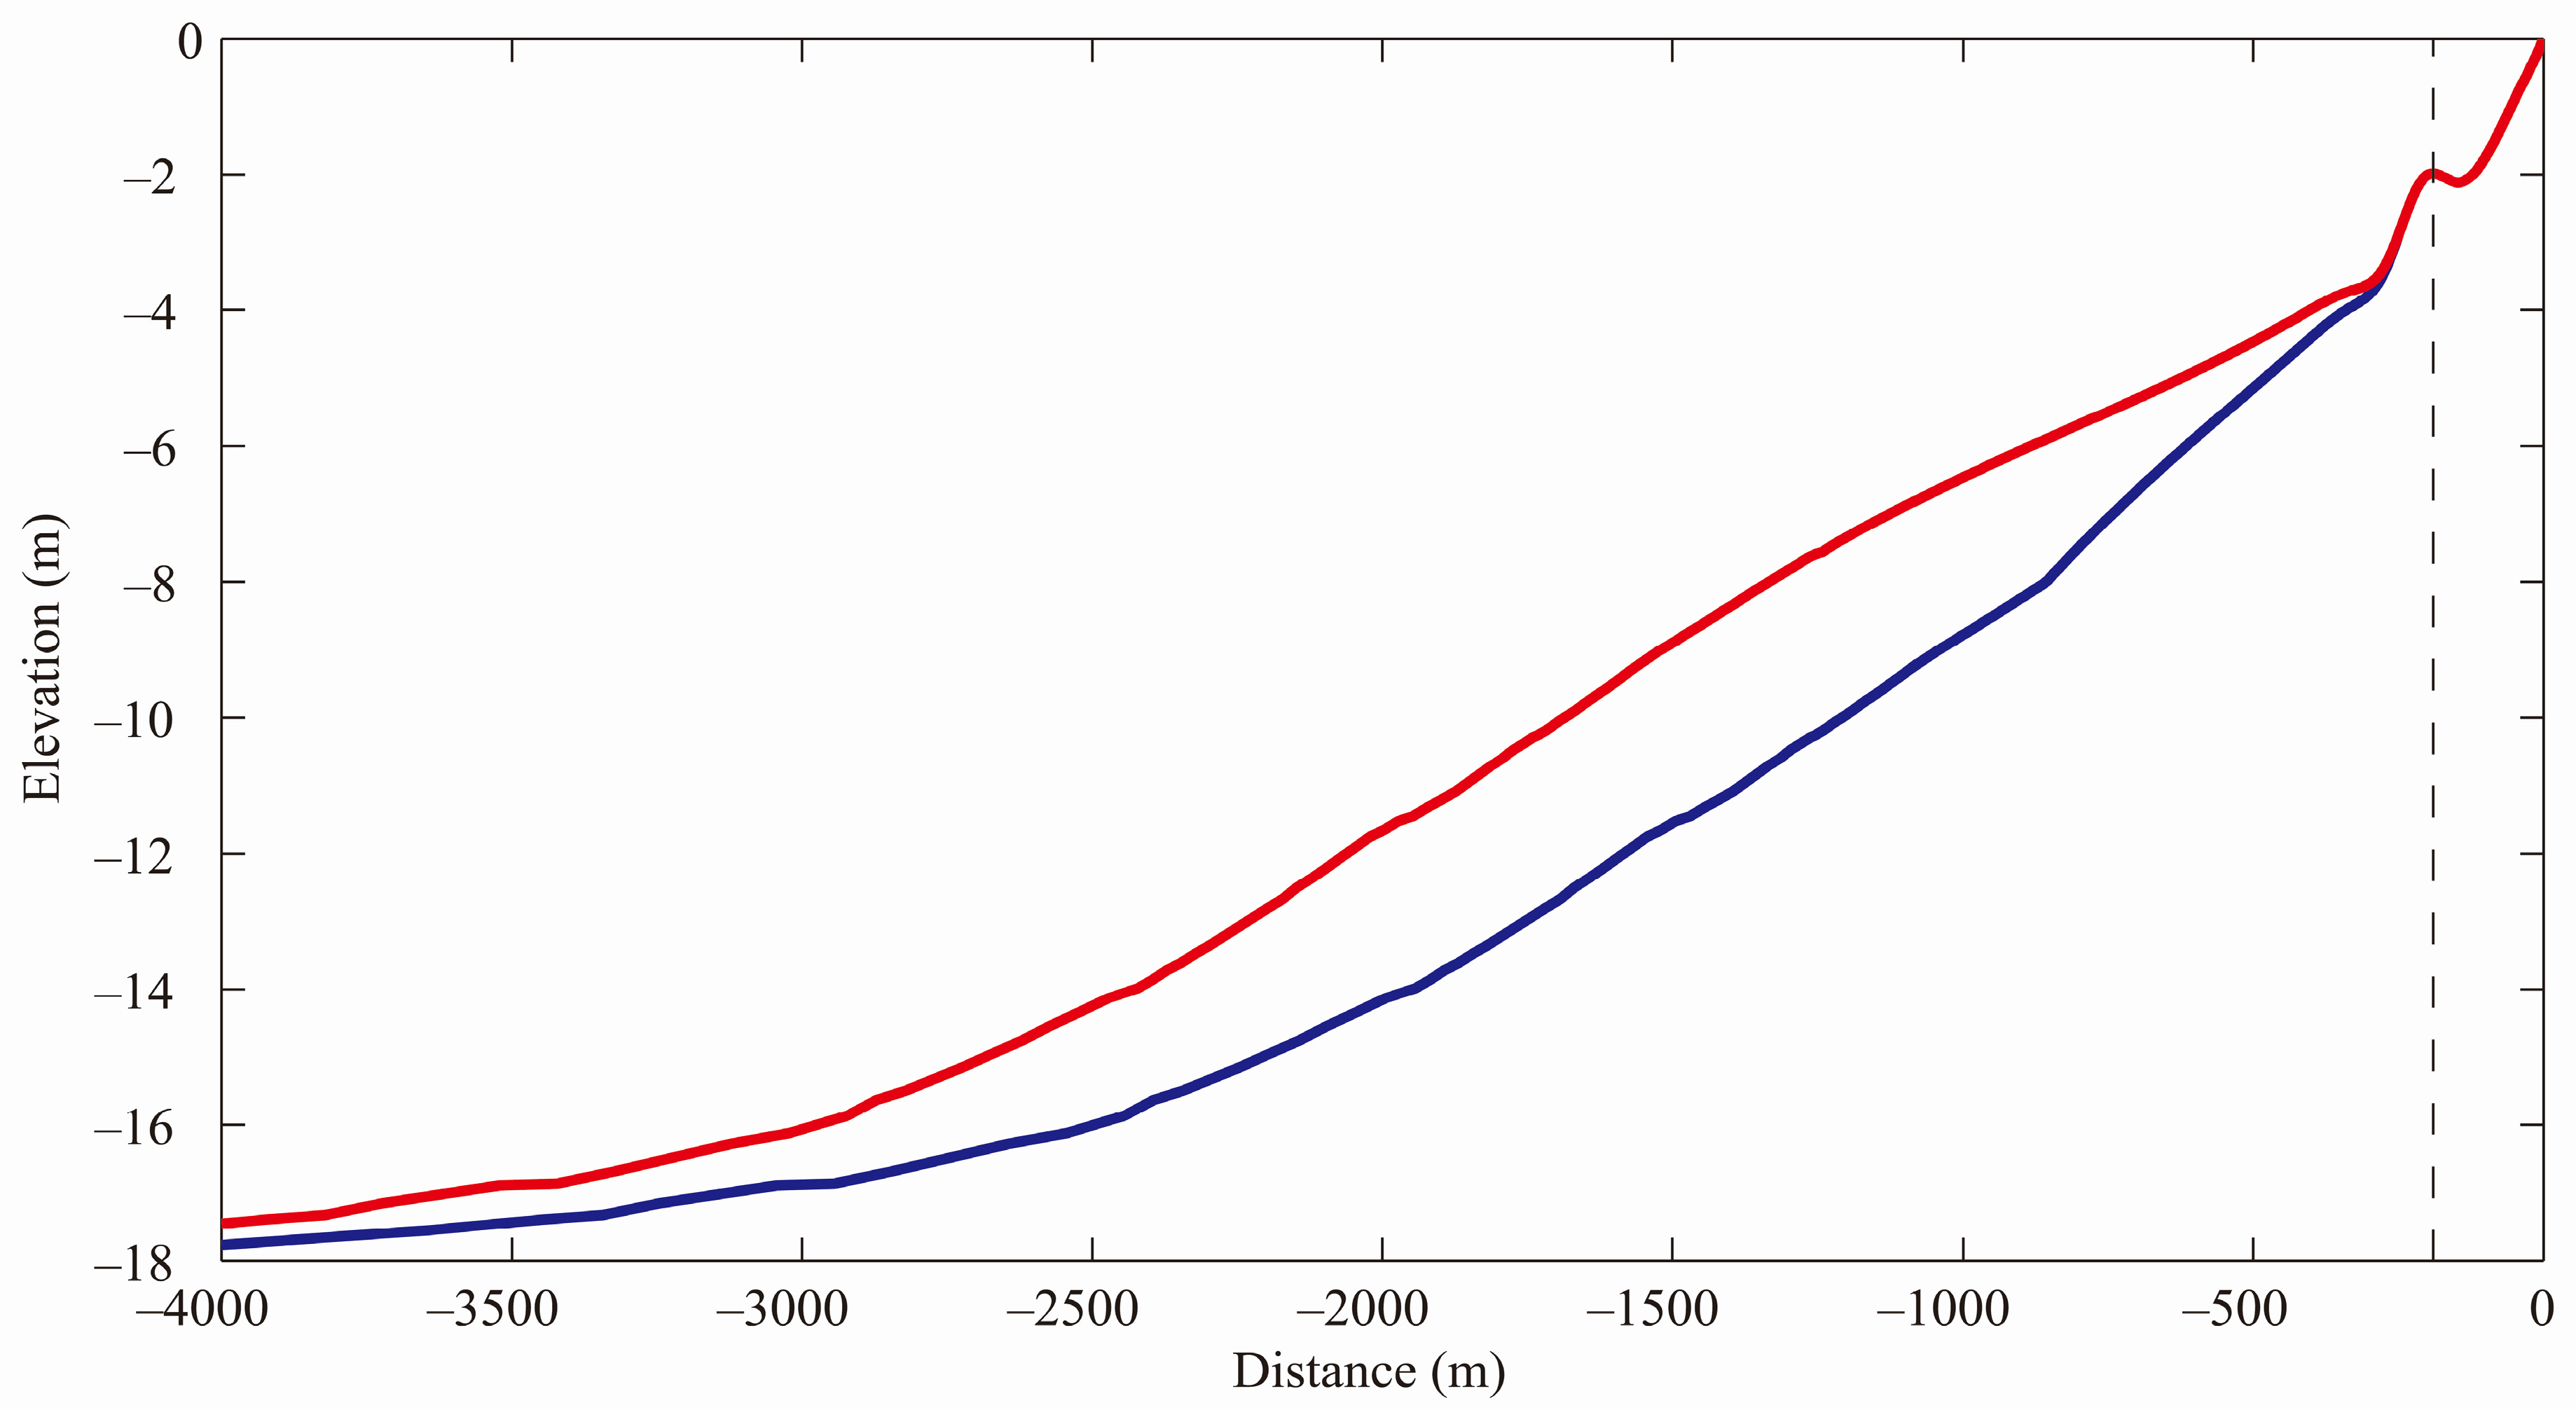
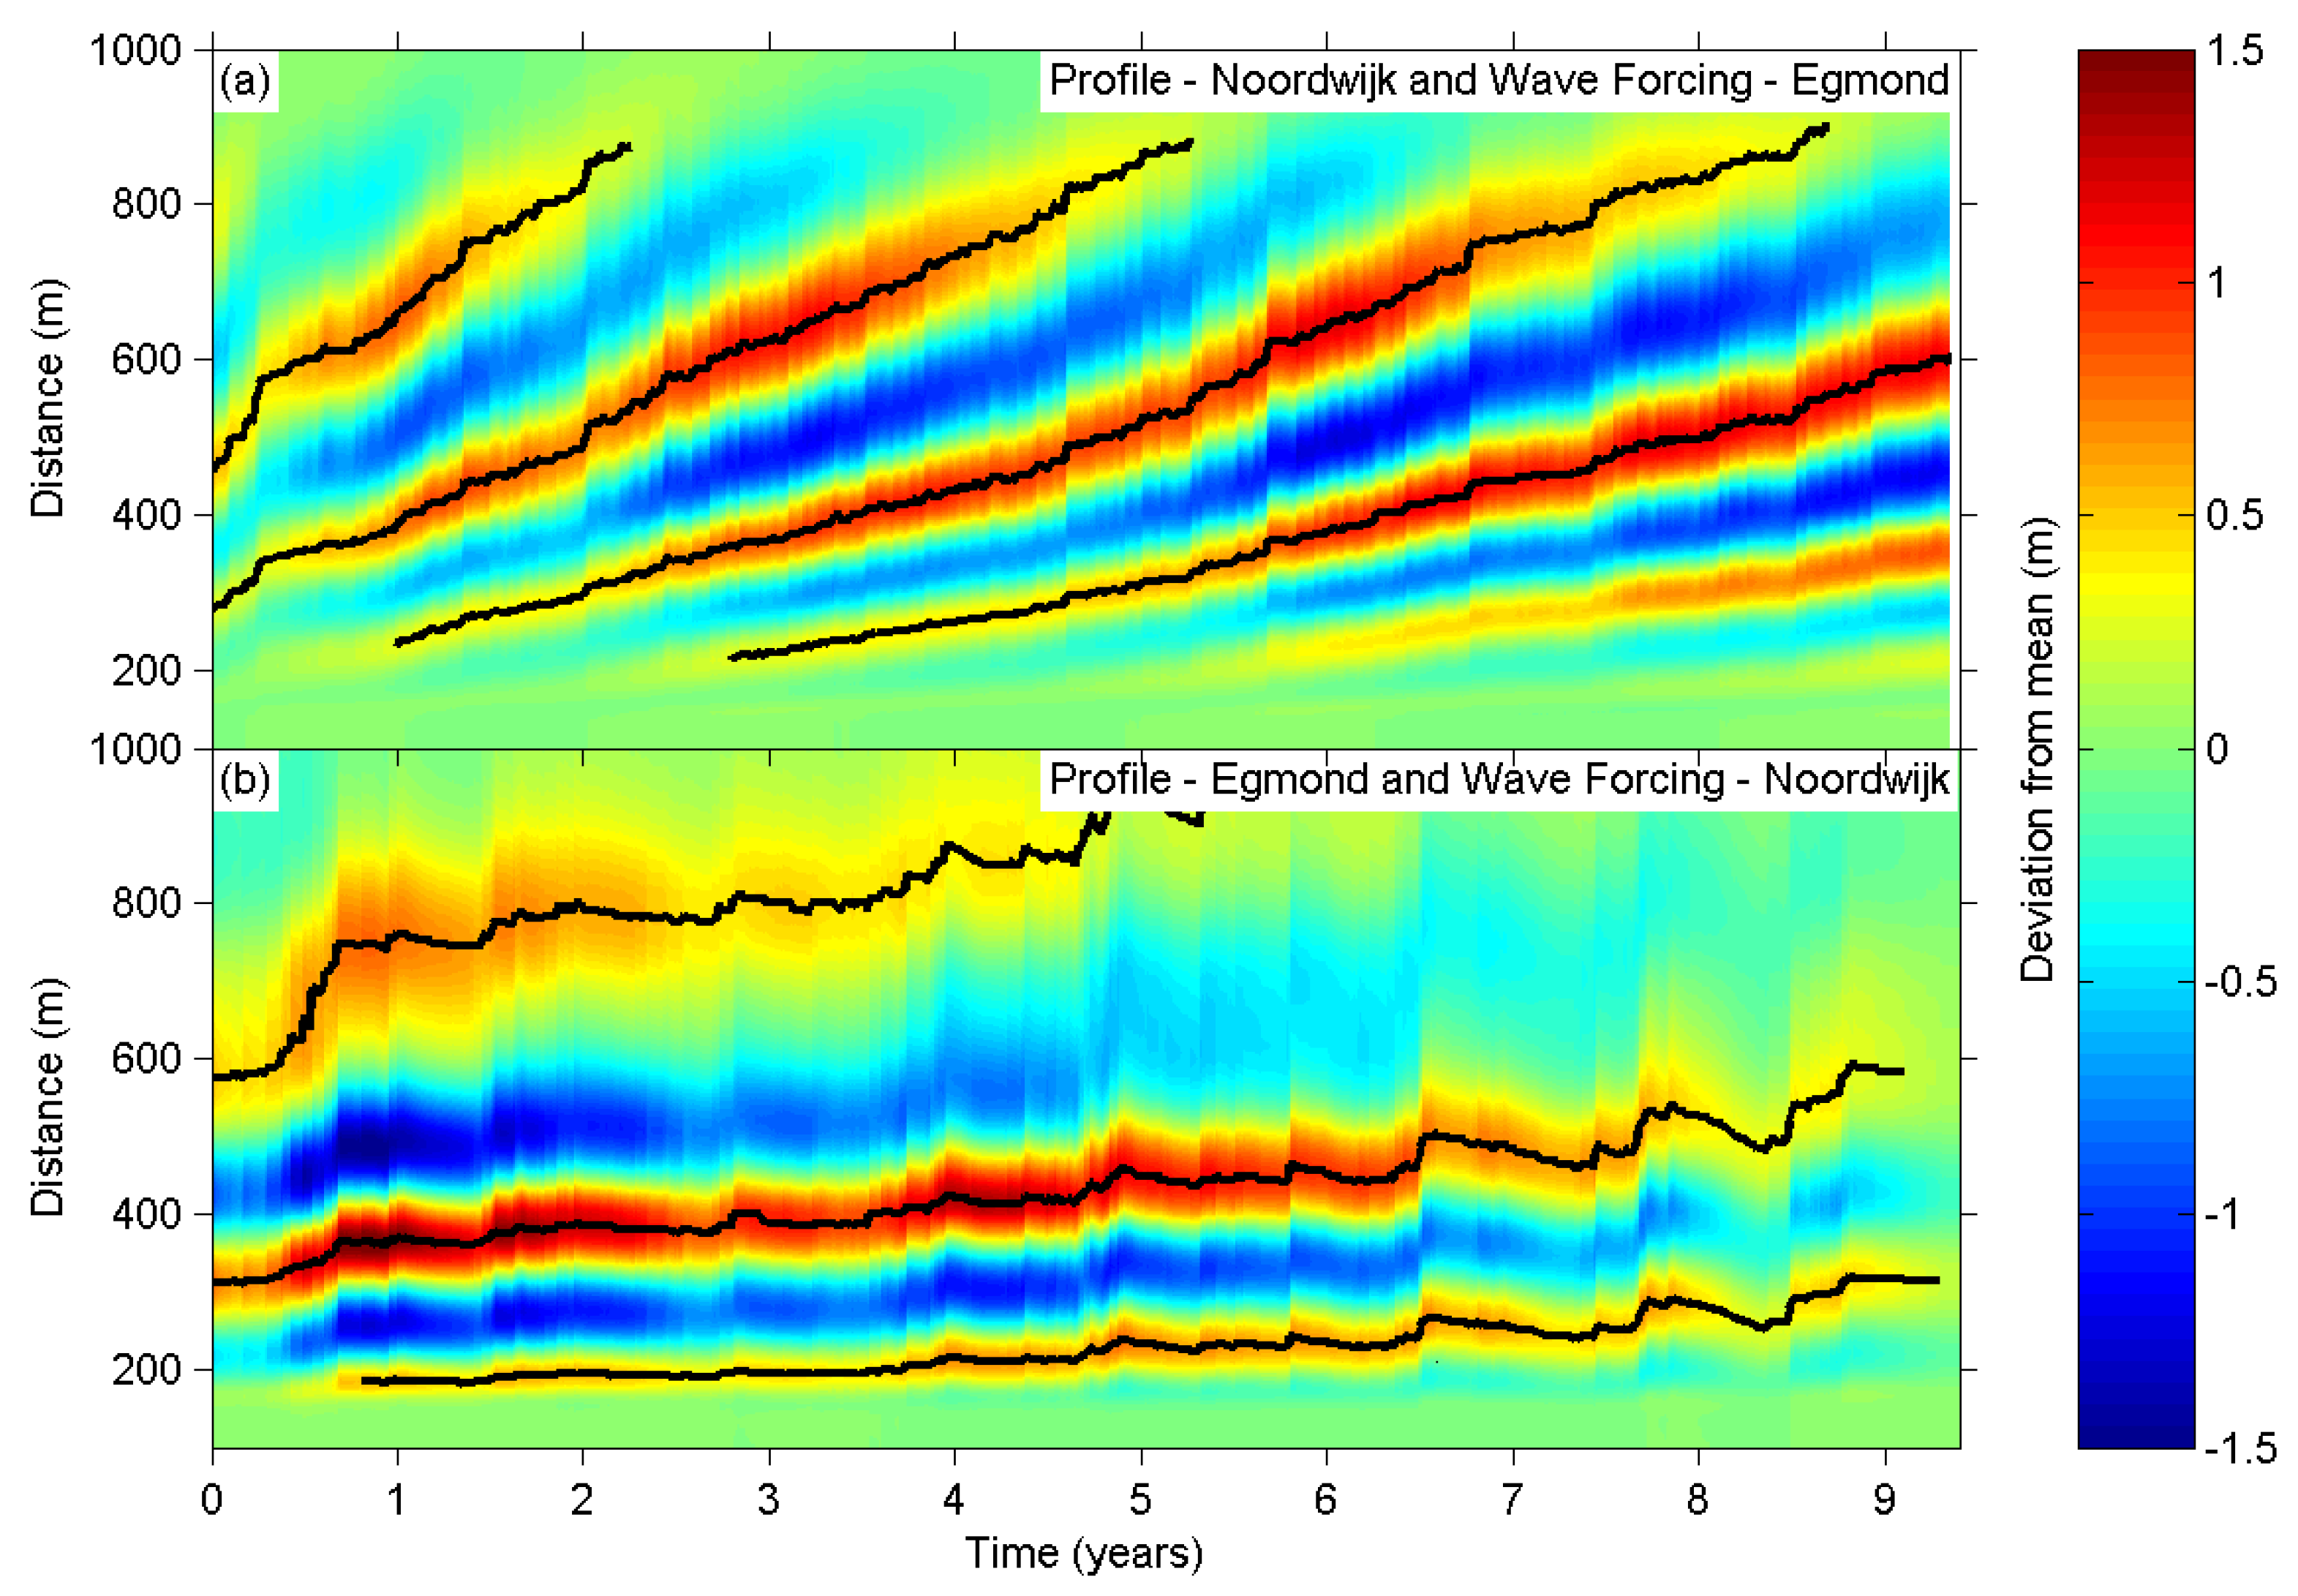
An increased water depth where bar decay sets in due to more intense wave breaking. Combined with the more energetic wave climate this increases the bar zone width at Egmond by about 200 m compared to Noordwijk (as was both observed (Figure 2) and predicted (Figure 8)). Therefore, it takes longer for the bars to migrate across this region (e.g., a mean offshore migration rate of 40 m/year would lead to a five year increase in Tr).

6. Discussion

The present study has provided a physics-based exploration of the known worldwide differences in bar cycle duration, with a focus on the Dutch sites Noordwijk and Egmond. Although the model underestimated Tr by about 30% for Egmond, the factor 2 difference in Tr relative to Noordwijk is remarkable and provided us with significant confidence to use the model as an exploratory tool. By using identical model settings, the detailed and consistent model predictions allowed us to study the contributions of individual environmental parameters in great detail. Especially the role of the morphological feedback loop in which changes in depth also affect the waves, currents and sediment transport, which in turn influence the profile evolution, could be identified clearly. Due to the importance of the water depth at the bar crest (hXb), this feedback loop proved to be of major importance to explain the effect of the bed slope on Tr. The complex and highly non-linear interaction between the forcing and the inter-annual bar behavior can thus result in gradually diverging profile evolution at sites with seemingly very similar characteristics (e.g., profile evolution at either side of the pier at Duck or bar switch, see [5,23]. Our model results indicate that the inter-annual bar evolution should be regarded as forced behavior. Despite the non-linearities, the dissipation of wave energy within the nearshore system and the subsequent morphological response can be attributed to the forcing. In our opinion the indications of free (i.e., non-forced) behaviur as identified in some studies (e.g., [42]) are due to the inability in data analysis studies to couple the observed non-linear response behavior to the (combined) state of a range of environmental parameters.
The identified dependences of Tr on wave climate, bar size/volume, bar zone width (and depth range) and sediment size are consistent with previous data-based studies of inter-site bar behavior (e.g., [3] and references therein). The importance of the bed slope on Tr has been suggested in earlier studies (e.g., [19,24] and our work unraveled the underlying physical processes. In contrast, Ruessink et al. [3] found that the bed slope did not appear to control inter-site differences in geometric and long-term temporal bar variability. We suspect that the varying influence of the environmental parameters on Tr for different bed slopes (Figure 14) and the limited amount of datasets/sites that could be considered in [3] are the primary reasons for this discrepancy.

7. Conclusions

Consistent with some earlier findings from field observations, our numerical model simulations illustrate that the bar cycle duration (Tr) is found to be positively correlated with sediment diameter and bar size, while Tr is negatively correlated with the wave forcing and profile slope. The simulations starting from composite profiles in which bar size, profile slope and sediment size were varied, clearly identified that the bed slope in the barred zone is the most important parameter that governs Tr. The sensitivity of Tr to this upper profile slope arises from the importance of the water depth above the bar crest (hXb) for sandbar response. As a bar migrates seaward, a steeper slope results in a relatively larger increase in hXb, which reduces wave breaking and subsequently causes a reduced offshore migration rate. Therefore, we conclude that the morphodynamic feedback loop is significantly more important than the initially larger offshore bar migration due to the more intense wave breaking in case of a steeper profile slope.
The application of the Egmond instead of the Noordwijk wave climate reduces Tr by a factor 3 to 4. However, the predicted Tr at Egmond is about two times larger, which is primarily originating from the difference in the upper profile slope and the larger sediment diameter at Egmond. These opposing effects further emphasize the importance of the upper bed slope and sediment diameter on Tr and illustrate that the net offshore bar migration is due to the highly non-linear two-way interaction between the wave forcing and the evolving profile morphology.

Acknowledgments

D.J.W. was supported by Deltares’ Coastal Systems (CERM) strategic research program. G.R. was funded by the Dutch Technology Foundation STW, which is part of the Netherlands Organisation for Scientific Research (NOW), and which is partly funded by the Ministry of Economic Affairs (project number 12397).

Author Contributions

D.J.W. and G.R. developed the model and the modeling approach, while D.A.W. and E.C.D. performed most of the model simulations. D.J.W. wrote the paper. D.A.W., E.C.D. and G.R. all provided feedback during the writing.

Conflicts of Interest

The authors declare no conflict of interest.

References

  1. Greenwood, B.; Davidson-Arnott, R.G.D. Sedimentation and equilibrium in wave-formed bars: A review and case study. Can. J. Earth Sci. 1979, 16, 312–332. [Google Scholar] [CrossRef]
  2. Wijnberg, K.M.; Kroon, A. Barred beaches. Geomorphology 2002, 40, 103–120. [Google Scholar] [CrossRef]
  3. Ruessink, B.G.; Wijnberg, K.M.; Holman, R.A.; Kuriyama, Y.; van Enckevort, I.M.J. Intersite comparison of interannual nearshore bar behavior. J. Geophys. Res. Oceans 2003, 108, 3249. [Google Scholar] [CrossRef]
  4. Zenkovich, V.P. Processes of Coastal Development; Oliver and Boyd: White Plains, NY, USA, 1967. [Google Scholar]
  5. Walstra, D.J.R.; Ruessink, B.G.; Reniers, A.J.H.M.; Ranasinghe, R. Process-based modeling of kilometer-scale alongshore sandbar variability. Earth Surf. Process. Landf. 2015, 40, 995–1005. [Google Scholar] [CrossRef]
  6. Kroon, A. Three-dimensional morphological changes of nearshore bar system along the coast near Egmond aan Zee. J. Coast. Res. 1990, 9, 430–451. [Google Scholar]
  7. Quartel, S.; Ruessink, B.G.; Kroon, A. Daily to seasonal cross-shore behaviour of quasi-persistent intertidal beach morphology. Earth Surf. Process. Landf. 2007, 32, 1293–1307. [Google Scholar] [CrossRef]
  8. Walstra, D.J.R.; Brière, C.D.E.; Vonhögen-Peeters, L.M. Evaluating the PEM passive beach drainage system in a 4-year field experiment at Egmond (The Netherlands). Coast. Eng. 2014, 93, 1–14. [Google Scholar] [CrossRef]
  9. Van Duin, M.J.P.; Wiersma, N.R.; Walstra, D.J.R.; van Rijn, L.C.; Stive, M.J.F. Nourishing the shoreface: Observations and hindcasting of the Egmond case, The Netherlands. Coast. Eng. 2004, 51, 813–837. [Google Scholar] [CrossRef]
  10. Ojeda, E.; Ruessink, B.G.; Guillen, J. Morphodynamic response of a two-barred beach to a shoreface nourishment. Coast. Eng. 2008, 55, 1185–1196. [Google Scholar] [CrossRef]
  11. Van der Spek, A.; Elias, E. The effects of nourishments on autonomous coastal behaviour. In Coastal Dynamics, Proceedings of the 7th International Conference on Coastal Dynamics; pp. 1753–1763.
  12. Kroon, A. Sediment Transport and Morphodynamics of the Beach And Nearshore Zone Near Egmond, the Netherlands. Ph.D. Thesis, Utrecht University, Utrecht, The Netherlands, 1994. [Google Scholar]
  13. Ruessink, B.G.; Kuriyama, Y.; Reniers, A.J.H.M.; Roelvink, J.A.; Walstra, D.J.R. Modeling cross-shore sandbar behavior on the timescale of weeks. J. Geophys. Res. Earth Surf. 2007, 112, 1–15. [Google Scholar]
  14. Van Enckevort, I.M.J.; Ruessink, B.G. Video observations of nearshore bar behavior. Part 1: Alongshore uniform variability. Cont. Shelf Res. 2003, 23, 501–512. [Google Scholar] [CrossRef]
  15. Ruggiero, P.; Walstra, D.J.R.; Gelfenbaum, G.; van Ormondt, M. Seasonal-scale nearshore morphological evolution: Field observations and numerical modeling. Coast. Eng. 2009, 56, 1153–1172. [Google Scholar] [CrossRef]
  16. Dubarbier, B.; Castelle, B.; Marieu, V.; Ruessink, B.G. Process-based modeling of cross-shore sandbar behavior. Coast. Eng. 2015, 95, 35–50. [Google Scholar] [CrossRef]
  17. Ruessink, B.G.; Kroon, A. The behaviour of a multiple bar system in the nearshore zone of Terschelling: 1965–1993. Mar. Geol. 1994, 121, 187–197. [Google Scholar] [CrossRef]
  18. Wijnberg, K.M.; Terwindt, J.H.J. Extracting decadal morphological behavior from high-resolution, long-term bathymetric surveys along the Holland coast using eigen function analysis. Mar. Geol. 1995, 126, 301–330. [Google Scholar] [CrossRef]
  19. Shand, R.D.; Bailey, D.G.; Shephard, M.J. An inter-site comparison of net offshore bar migration characteristics and environmental conditions. J. Coast. Res. 1999, 15, 750–765. [Google Scholar]
  20. Kuriyama, Y. Medium-term bar behavior and associated sediment transport at Hasaki, Japan. J. Geophys. Res. Oceans 2002, 107, 3132. [Google Scholar] [CrossRef]
  21. Walstra, D.J.R.; Reniers, A.J.H.M.; Ranasinghe, R.; Roelvink, J.A.; Ruessink, B.G. On bar growth and decay during interannual net offshore migration. Coast. Eng. 2012, 60, 190–200. [Google Scholar] [CrossRef]
  22. Ruessink, B.G.; Terwindt, J.H.J. The behaviour of nearshore bars on the time scale of years: A conceptual model. Mar. Geol. 2000, 163, 289–302. [Google Scholar] [CrossRef]
  23. Plant, N.G.; Holman, R.A.; Freilich, M.H.; Birkemeier, W.A. A simple model for inter-annual sandbar behavior. J. Geophys. Res. Oceans 1999, 104, 15755–15776. [Google Scholar] [CrossRef]
  24. Wijnberg, K.M. Environmental controls on decadal morphologic behaviour of the Holland coast. Mar. Geol. 2002, 189, 227–247. [Google Scholar] [CrossRef]
  25. Lippmann, T.C.; Holman, R.A.; Hathaway, K.K. Episodic, non-stationary behaviour of a double bar system at Duck, North Carolina, USA. J. Coast. Res. 1993, 15, 49–75. [Google Scholar]
  26. Shand, R.D.; Bailey, D.G.; Shephard, M.J. Longshore realignment of shore-parallel sand-bars at Wanganui, New Zealand. Mar. Geol. 2001, 179, 147–161. [Google Scholar] [CrossRef]
  27. Van Rijn, L.C.; Ribberink, J.S.; van der Werf, J.; Walstra, D.J.R. Coastal sediment dynamics: Recent advances and future research needs. J. Hydraul. Res. 2013, 51, 475–493. [Google Scholar] [CrossRef]
  28. Van Rijn, L.C.; Ruessink, B.G.; Mulder, J.P.M. Coast3D Egmond: The Behaviour of a Straight Sandy Coast on the Time Scale of Storms and Seasons; Aqua Publications: Amsterdam, The Netherlands, 2002. [Google Scholar]
  29. Hinton, C.; Nicholls, R.J. Spatial and temporal behaviour of depth of closure along the Holland coast. In Proceedings of the 26th International Coastal Engineering Conference, Copenhagen, Denmark, 22–26 June 1998; pp. 2913–2925.
  30. Pape, L.; Plant, N.G.; Ruessink, B.G. On cross-shore sandbar behavior and equilibrium states. J. Geophys. Res. Earth Surf. 2010, 115. [Google Scholar] [CrossRef]
  31. Battjes, J.A.; Janssen, J.P.F.M. Energy loss and set-up due to breaking of random waves. In Proceedings of the 16th International Conference on Coastal Engineering, New York, NY, USA, 27 August–3 September 1978; pp. 570–587.
  32. Nairn, R.B.; Roelvink, J.A.; Southgate, H.N. Transition zone width and implications for modelling surfzone hydrodynamics. In Proceedings of the 22nd International Conference on Coastal Engineering, Delft, The Netherlands, 2–6 July 1990; pp. 68–91.
  33. Roelvink, J.A.; Meijer, T.J.G.P.; Houwman, K.; Bakker, R.; Spanhoff, R. Field validation and application of a coastal profile model. In Proceedings of the Coastal Dynamics Conference, Gdansk, Poland, 4–8 September 1995.
  34. Ruessink, B.G.; Walstra, D.J.R.; Southgate, H.N. Calibration and verification of a parametric wave model on barred beaches. Coast. Eng. 2003, 48, 139–149. [Google Scholar] [CrossRef]
  35. Reniers, A.J.H.M.; Thornton, E.B.; Stanton, T.P.; Roelvink, J.A. Vertical flow structure during sandy duck: Observations and modeling. Coast. Eng. 2004, 51, 237–260. [Google Scholar] [CrossRef]
  36. Roelvink, J.A.; Stive, M.J.F. Bar-generating cross-shore flow mechanisms on a beach. J. Geophys. Res. 1989, 94, 4785–4800. [Google Scholar] [CrossRef]
  37. Ribberink, J. Bed-load transport for steady flows and unsteady oscillatory flows. Coast. Eng. 1998, 34, 52–82. [Google Scholar] [CrossRef]
  38. Van Rijn, L.C. Principles of Sediment Transport in Rivers, Estuaries and Coastal Seas; Aqua Publications: Amsterdam, The Netherlands, 1993. [Google Scholar]
  39. Dean, R.G. Equilibrium Beach Profiles: U.S. Atlantic and Gulf Coasts; Technical Report No. 12; Department of Civil Engineering, University of Delaware: Newark, DE, USA, 1977. [Google Scholar]
  40. Horel, J.D. Complex principal component analysis: Theory and examples. J. Clim. Appl. Meteorol. 1984, 23, 1660–1673. [Google Scholar] [CrossRef]
  41. Walstra, D.J.R.; Hoekstra, R.; Tonnon, P.K.; Ruessink, B.G. Input reduction for long-term morphodynamic simulations in wave-dominated coastal settings. Coast. Eng. 2013, 77, 57–70. [Google Scholar] [CrossRef]
  42. De Vriend, H.J. On the predictability of coastal morphology. In Proceedings of the 3rd European Marine Science and Technology Conference, Lisbon, Portugal, 23–27 May 1998.
Figure 1. The Holland Coast with the sites at Egmond and Noordwijk indicated, as well as the location of the wave buoys YM6 (IJmuiden Munitie Stortplaats) and MPN (MeetPost Noordwijk). Red lines indicate the considered profiles at Noordwijk and Egmond, XRD and YRD are the “Rijksdriehoek” coordinates.
Jmse 04 00015 g001
Figure 2. Time-averaged profiles for Noordwijk and Egmond on the same cross-shore axis with the origin for both at NAP 0 m.
Jmse 04 00015 g002
Figure 3. Profile perturbations of the time averaged near-shore profile are shown for (a) Noordwijk (RSP 80 km) and (b) Egmond (RSP 38 km).
Jmse 04 00015 g003
Figure 4. Comparison of the time-mean Hrms wave height (a) and the time-mean peak wave period (b) at Noordwijk and Egmond as a function of the incident wave direction. The vertical lines indicate the shore normal orientation for both sites.
Jmse 04 00015 g004
Figure 5. Wave roses of the imposed wave time series at Noordwijk (a) and Egmond (b).
Jmse 04 00015 g005
Figure 6. The nearshore part of the initial profiles for Noordwijk (red) and Egmond (blue), the offshore boundary of the model is at x = –6500 m.
Jmse 04 00015 g006
Figure 7. Constructed profiles from part of the Egmond and Noordwijk profiles. See Table 3 for profile composition details shown in plots ae.
Jmse 04 00015 g007
Figure 8. Predicted profile perturbations for (a) Noordwijk (Scenario NN) and (b) Egmond (Scenario EE).
Jmse 04 00015 g008
Figure 9. Predicted profile perturbations for scenarios with swapped wave forcing: (a) Noordwijk profile with wave forcing from Egmond (Scenario NE) and (b) vice versa (Scenario EN).
Jmse 04 00015 g009
Figure 10. Schematic upper shoreface profiles combined with the middle and lower shoreface profiles for Noordwijk (red) and Egmond (blue) with the same water depth at the bar crest. Vertical dashed line indicates bar crest location at which model predictions are compared in Figure 9.
Jmse 04 00015 g010
Figure 11. Comparison of the root-mean-square wave height Hrms (a), depth-averaged return flow U (b) and total sediment transport Stot (c) at the top of the bar crest Noordwijk vs. Egmond (location shown in Figure 8). Red line indicates equality between Egmond and Noordwijk.
Jmse 04 00015 g011
Figure 12. Plane profiles with the 21 schematic bars for 3 of the 10 considered profile slopes. Each bar was subjected to a one-day simulation with Hrms = 1.7 m, Tp = 8 s and θ = 20°, and various additional scenarios.
Jmse 04 00015 g012
Figure 13. The migration rates, dXb/dt (a,b) and bar amplitude response, dAb/dt (c,d) for the reference case as a function of the bed slope plotted with hXb (a,c) and x (b,d).
Jmse 04 00015 g013
Figure 14. Absolute Tr (a) and the change in Tr relative to the Tr averaged over all considered bed slopes Tr/<Tr> (b) as a function of the bed slope. The reference case is based on the Noordwijk environmental parameters.
Jmse 04 00015 g014
Table 1. Sediment diameters for Egmond and Noordwijk expressed as the 50 and 90 percentile, dss is the estimated d50 of the sediment in suspension, as applied in the model, small cross-shore variations in grain size are ignored.
Grain sizeNoordwijk (µm) [14]Egmond (µm) [28]
d50180265
d90280380
dss170240
Table 2. Hindcast simulations for Noordwijk and Egmond with interchanged wave forcing and profiles sediment diameter.
ScenarioProfile and SedimentWave Time Series
NNNoordwijkNoordwijk
ENEgmondNoordwijk
NENoordwijkEgmond
EEEgmondEgmond
Table 3. Definition of the profiles constructed from parts of the Egmond and Noordwijk profiles.
Profile CodeBarShoreface
Upper/ d50MiddleLower
1 (ENNN)EgmondNoordwijkNoordwijkNoordwijk
2 (NENN)NoordwijkEgmondNoordwijkNoordwijk
3 (EENN)EgmondEgmondNoordwijkNoordwijk
4 (NNEN)NoordwijkNoordwijkEgmondNoordwijk
5 (NNNE)NoordwijkNoordwijkNoordwijkEgmond
Table 4. Hindcast simulations for Noordwijk and Egmond with interchanged wave forcing and profiles (and d50).
ScenarioProfile/SedimentWave ConditionsCycle Period (years)
NNNoordwijkNoordwijk4.8
ENEgmondNoordwijk14.6
NENoordwijkEgmond2.4
EEEgmondEgmond8.7
Table 5. Bar cycle periods and relative change to reference simulations for the different profile compositions subjected resulting from 10 year simulations for both the Noordwijk and Egmond wave time series. Scenarios between the brackets in columns 4 and 5 are according to Table 4. Profile codes in first column according to Table 3, indicating the origin of (from left to right): the bar, the upper shoreface (and sediment), middle shoreface and lower shoreface.
Profile CodeBar return period, Tr (years) Wave Time SeriesRelative change in Tr (−) Wave Time Series
NoordwijkEgmondNoordwijkEgmond
1 (ENNN)6.52.81.36 (NN)1.17 (NE)
2 (NENN)*7.06.1*1.46 (NN)2.55 (NE)
3 (EENN)12.97.00.89/2.69 (EN/NN)0.80/2.91 (EE/NE)
4 (NNEN)4.62.20.95 (NN)0.90 (NE)
5 (NNNE)5.12.61.05 (NN)1.10 (NE)
* indicates simulation for which bar cycle period could not be determined reliably).

