Article

Reducing Reliability Uncertainties for Marine Renewable Energy

University of Exeter, Penryn Campus, Cornwall, TR10 9FE, UK
*
Author to whom correspondence should be addressed.
J. Mar. Sci. Eng. 2015, 3(4), 1349-1361; https://doi.org/10.3390/jmse3041349
Submission received: 28 August 2015 / Accepted: 26 October 2015 / Published: 5 November 2015

Abstract

:
Technology Readiness Levels (TRLs) are a widely used metric of technology maturity and risk for marine renewable energy (MRE) devices. To-date, a large number of device concepts have been proposed which have reached the early validation stages of development (TRLs 1–3). Only a handful of mature designs have attained pre-commercial development status following prototype sea trials (TRLs 7–8). In order to navigate through the aptly named “valley of death” (TRLs 4–6) towards commercial realisation, it is necessary for new technologies to be de-risked in terms of component durability and reliability. In this paper the scope of the reliability assessment module of the DTOcean Design Tool is outlined including aspects of Tool integration, data provision and how prediction uncertainties are accounted for. In addition, two case studies are reported of mooring component fatigue testing providing insight into long-term component use and system design for MRE devices. The case studies are used to highlight how test data could be utilised to improve the prediction capabilities of statistical reliability assessment approaches, such as the bottom–up statistical method.

Graphical Abstract

1. Introduction

It is widely acknowledged that marine renewable energy (MRE) has a significant role to play in the transition towards a global green economy. The 20% target for electricity generation set within the European Commission’s Europe 2020 strategy [1] includes 200–300 MW of installed MRE capacity in the United Kingdom [2] which could equate to the creation of 10,000 jobs by 2020 and be worth £6.1 billion by 2035 [3]. With the present level of installed capacity around 9 MW, such projections are ambitious considering the current nascent state of the industry in which only a few notable projects have reached the field demonstration stage (TRLs 7–8) prior to economic validation (TRL 9, as defined by [4]). As yet no device operators have deployed large scale array projects, although the current installed capacity will be bolstered by two tidal array projects that have recently been approved (MeyGen’s 10 MW Phase 1 and Scottish Power Renewables 10 MW Sound of Islay Tidal Array) [5].
Despite the forecasted growth of the industry over the next two decades and support of funding incentives in the UK (e.g., the Marine Energy Array Demonstrator scheme, Marine Renewables Commercialisation Fund, Saltire Prize and various Technology Strategy Board and EU initiatives) a number of barriers have been identified which must be overcome before large scale deployments are realised. The Wave and Tidal Energy in the UK. Conquering Challenges, Generating Growth report produced by RenewableUK [3] identified four key risk areas which could hamper progress: finance, technology development, grid and consenting. Confidence in the ability of the MRE industry to deliver a localised cost of energy (LCOE) which is competitive with other forms of power generation in an acceptable time-frame is essential for continued investment in the sector. An operational availability threshold of 75% has been identified [5] to achieve this. In order for the sector to progress towards higher TRLs the reliability of components and sub-systems must be demonstrated as this plays a key role in the overall availability of the device [6] as well as shaping efficient maintenance intervals [7].
The DTOcean (Optimal Design Tools for Ocean Energy Arrays: www.dtocean.eu) project aims to accelerate the deployment of the first generation of wave and tidal energy arrays through the development of a “Design Tool” which will be able to assess the: (i) economics; (ii) reliability; and (iii) environmental impact of wave or tidal energy arrays. This paper will therefore focus on reliability assessment methods currently employed within the sector and the approach selected for the DTOcean Tool. In addition, several case studies are provided to highlight the role of component reliability testing in understanding component performance and reducing reliability uncertainties.

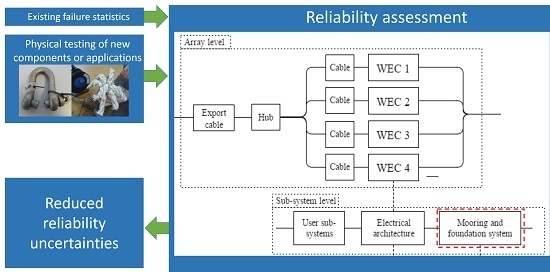
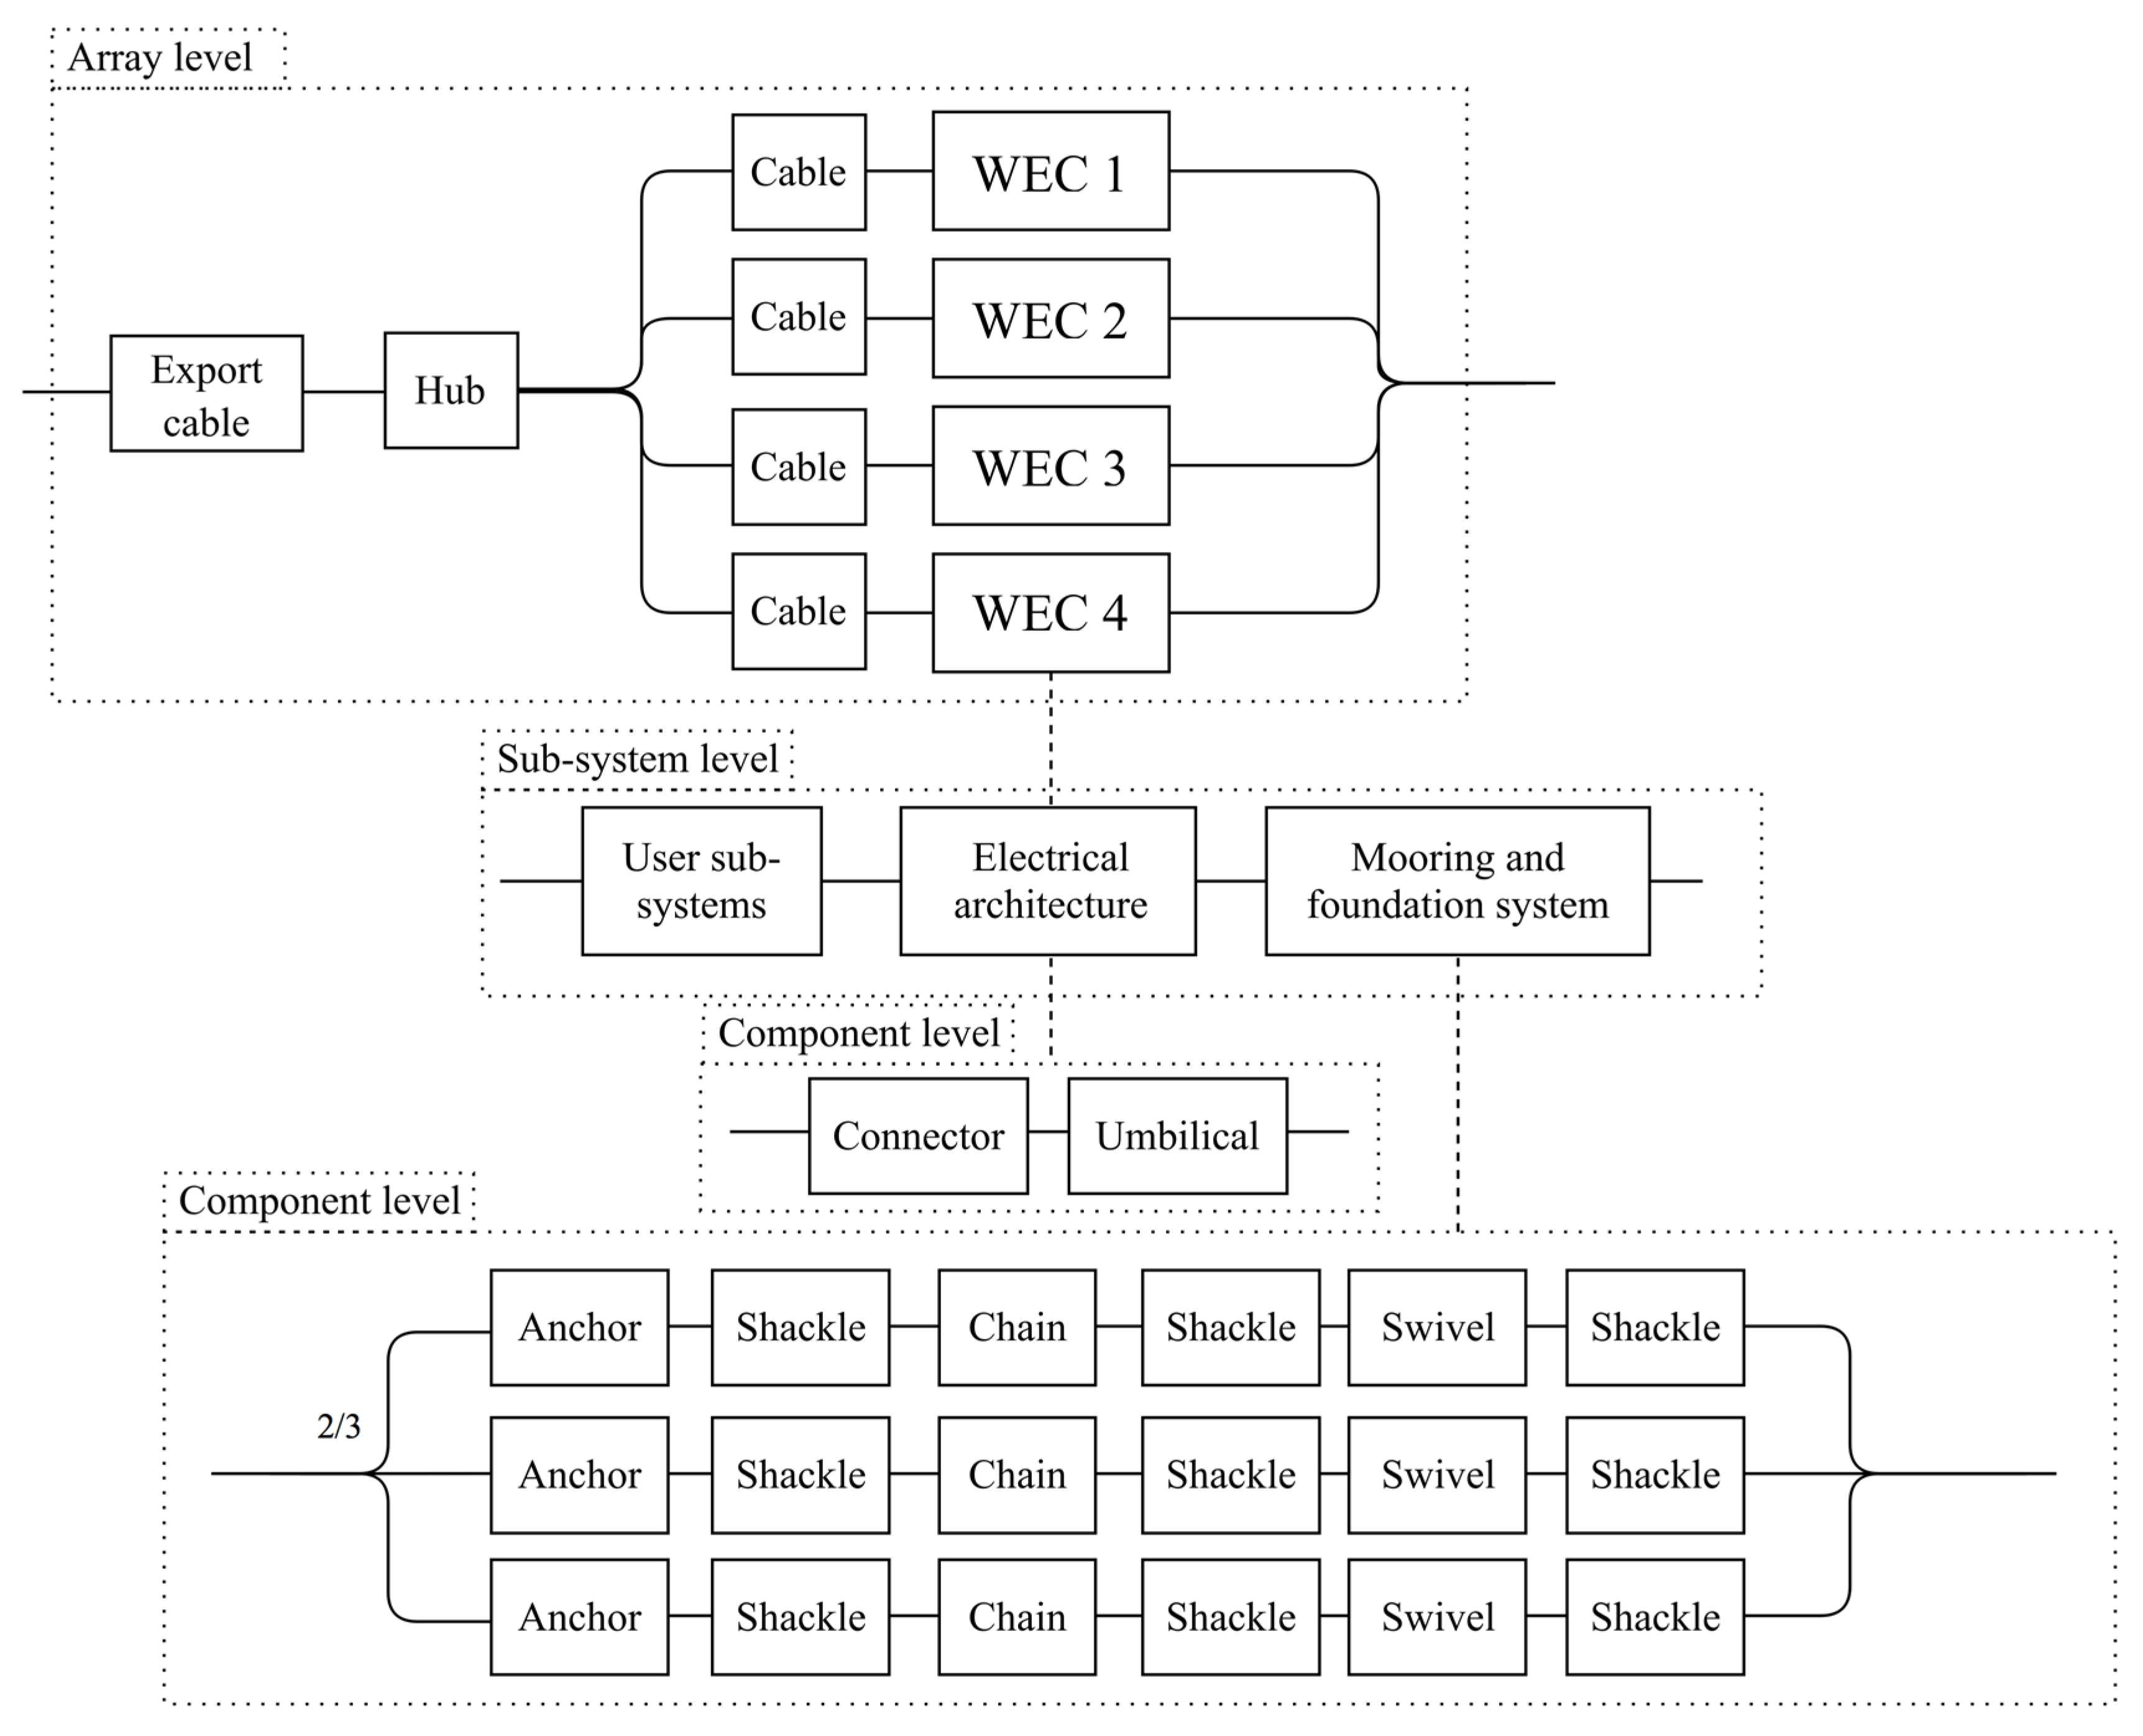
2. Reliability Assessment within the DTOcean Tool

2.1. DTOcean Design Tool Overview

The aim of the FP-7 funded DTOcean project is to develop an open-source Design Tool which will provide a number of solutions for MRE array design. The Tool will comprise a suite of design modules which will be used to analyse and optimise several key aspects; array layout, electrical system architecture, mooring and foundation systems in addition to lifecycle logistics. The role of the electrical architecture and mooring and foundation modules will be to identify optimum electrical layouts (including radial, single- and double-sided strings) as well as suitable mooring and foundation systems based on user-provided device and site parameters. For the purpose of reliability assessment the components which make up each designed sub-system will be displayed to the user via a Reliability Block Diagram contained within the Tool’s graphical user interface (GUI). These diagrams are a powerful method to calculate system reliability when sub-systems exist which have inter-dependencies or where provision has been made for redundancy. In order to provide a full assessment of system reliability, the other parts of the system (i.e., power take-off, structure and condition-monitoring) will be represented by a generic block named “device” in the Reliability Block Diagram and assigned a failure rate by the user, perhaps based on sea-trials of a single device or component testing. The user will be able to provide more detailed information about these sub-systems if available.

2.2. Assessment Method

A widely used metric for assessing the expected operating life of a component, sub-system or global system is mean time to failure (MTTF). The basis of MTTF calculations are reliability functions R(t) which are based on statistical probability density functions (PDFs) generated from numerical modelling or physical test/field data:
M T T F ( T ) = 0 R ( t ) d t
An exponential PDF is typically used to represent the constant rate of random failures which tend to occur during the “useful” or operational life of the component or sub-system. This interval is the focus of reliability assessment within the first release version of the DTOcean Tool. However, the option to include more sophisticated failure distributions and adjustment mechanisms representative of the “burn-in” and “wear-out” periods of component operation may be included in a later release. Within the Tool system reliability is calculated based on the hierarchical links between each component and sub-system that make up devices within the array, including any unique relationships such as the m of n mooring system shown in Figure 1. The time to failure (TTF) of each component or assembly is also calculated and used by the System Control and Operation module in order to plan maintenance actions based on time-domain stochastic (Poisson process) simulations. If the calculated MTTF is lower than the limit set by the user, the design modules will be re-invoked to identify a different solution with a higher reliability level. The design modules will also be re-run if the associated LCOE or environmental impact of a solution is deemed to be unacceptable when compared to user-defined criteria.

2.3. Data Provision

As yet a common failure database has not been established within the MRE industry, despite the development of initial reliability models [8]. A similar endeavour to the offshore wind SPARTA (System performance, Availability and Reliability Trend Analysis [9]) project has been recently initiated for tidal turbine drivetrains (TiPTORS; Tidal Turbine Power Take-Off Reliability Simulation programme [10]). The current absence of a common database is due to a lack of design convergence within the sector (particularly for wave energy devices), the use of custom-made components and also the commercial confidentiality of designs. At present, developers must therefore rely on the adaptation of existing reliability assessment methods, as well as knowledge gained during earlier TRL stages to predict the operational performance of devices.
Figure 1. Reliability Block Diagram for an array of four generic wave energy converters, each possessing three mooring lines.
Jmse 03 01349 g001
The challenge for any reliability assessment is to accurately quantify or estimate the underlying failure rates. There are two distinct scenarios. First, established industries with large-scale production tend to have considerable operational experience (e.g., the offshore wind industry can now rely on as much as 4000 years of cumulative turbine operation [11]). Although no reliability information is publicly available for offshore wind operations, turbine manufacturers and asset operators can rely on this experience for their statistical analysis to determine failure rates and governing failure modes.
The second situation exists where sufficient operating experience does not exist and reliability assessments rely on existing statistical information which is then adjusted to account for the sensitivity of component failure rates in different applications. These bottom–up statistical methods apply influence factors to existing base failure rates to account for variations in quality, environment and stress (i.e., temperature, use rate or applied load to name but a few). Using this approach, reliability calculations can be carried out with a relatively low amount of information such as the type and number of components and operating and environmental conditions. Whilst this method is straightforward to implement it is highly reliant on the underlying data and although influence factors are available in databases such as Mil-Hdbk-217F [12] for electronic components or OREDA® database [13] produced by the oil and gas industry, the use of factors designed for other applications introduces uncertainty to the predicted failure rate. To illustrate this point Table 1 lists environmental influence factors for a commercial-off-the-shelf (COTS) piece of equipment; a power transformer. Clearly the use of the naval, sheltered factor will result in a conservative failure rate which is representative of equipment exposed to a non-benign environment and indeed it would be prudent to use field data even if it is from a different industry (i.e., offshore wind [14]). In the absence of actual performance data a failure estimation based on this approach is highly simplified and resulting predictions are heavily influenced [15] by the following assumptions: (i) it focuses only on the central portion of the “bathtub” curve; (ii) it does not take into account developments in manufacturing or design to improve reliability; and (iii) it treats failures as independent events in a system (i.e., it ignores cascade failures).
Table 1. Environmental influence factors for power transformers adapted from Mil-Hdbk-217F [12].
EnvironmentFactorDescription
Ground, benign1.0Non-mobile, temperature and humidity controlled environment, readily maintainable
Naval, sheltered5.0Sheltered or below deck conditions
Naval, unsheltered16.0Unprotected, surface equipment exposed to weather conditions and salt water immersion
Although it is acknowledged that the widely used bottom–up statistical method [16] does have some shortcomings, given the current lack of detailed operational data in the MRE sector (particularly shared data) this method is suited to the present state of the sector. Its inclusion within the Tool will take the form of reliability assessment algorithms which will draw upon failure rates for each component in addition to relevant influence factors from a centralised database. These values will be sourced from appropriate failure rate databases, including those identified in this paper. If the user has conducted their own analysis (such as from field trials), the Tool will have the functionality to accept other failure rates, overwriting the default values held in the database.

2.4. Uncertainty

Reliability calculation uncertainties will be addressed by the application of uncertainty ranges which will be dependent on the status of the technology and application area (e.g., Table 2). This approach will be based on technology classification assessment procedures outlined in [17]. For example a proven technology in a known application will be assigned a much smaller uncertainty range than a new or unproven technology used in a new application.
Table 2. Technology assessment classifications according to DNV-OSS-213 [17].
Application AreaTechnology Status
1 (Proven)2 (Limited Field History)3 (New or Unproven)
1 (known)123
2 (new)234
To assist the user in identifying components which have a high consequence of failure and/or failure frequency it has been proposed that colour-coded risk priority number [18] charts will also be included in the GUI. Whilst the focus of this paper has been on mooring components, the generic approach used in the DTOcean Tool is applicable to other MRE sub-systems.

3. Improving Reliability Predictions through Component Reliability Testing

Technology developers at TRLs 4–6 are subject to competing demands; the need to prove that their technology is reliable to strengthen investor confidence whilst at the same time reducing costs to make their technology commercially viable. Necessary savings of 50%–75% by 2025 have been proposed by the Low Carbon Innovation Coordination Group to ensure that the sector is commercially competitive with other forms of generation by 2025 [19]. Striking the difficult balance between robust yet affordable designs is a key engineering challenge for developers at this stage. Component reliability testing either in the field or laboratory is a cost effective means of establishing component or sub-system performance in a controlled, low-risk environment before heading offshore [20].

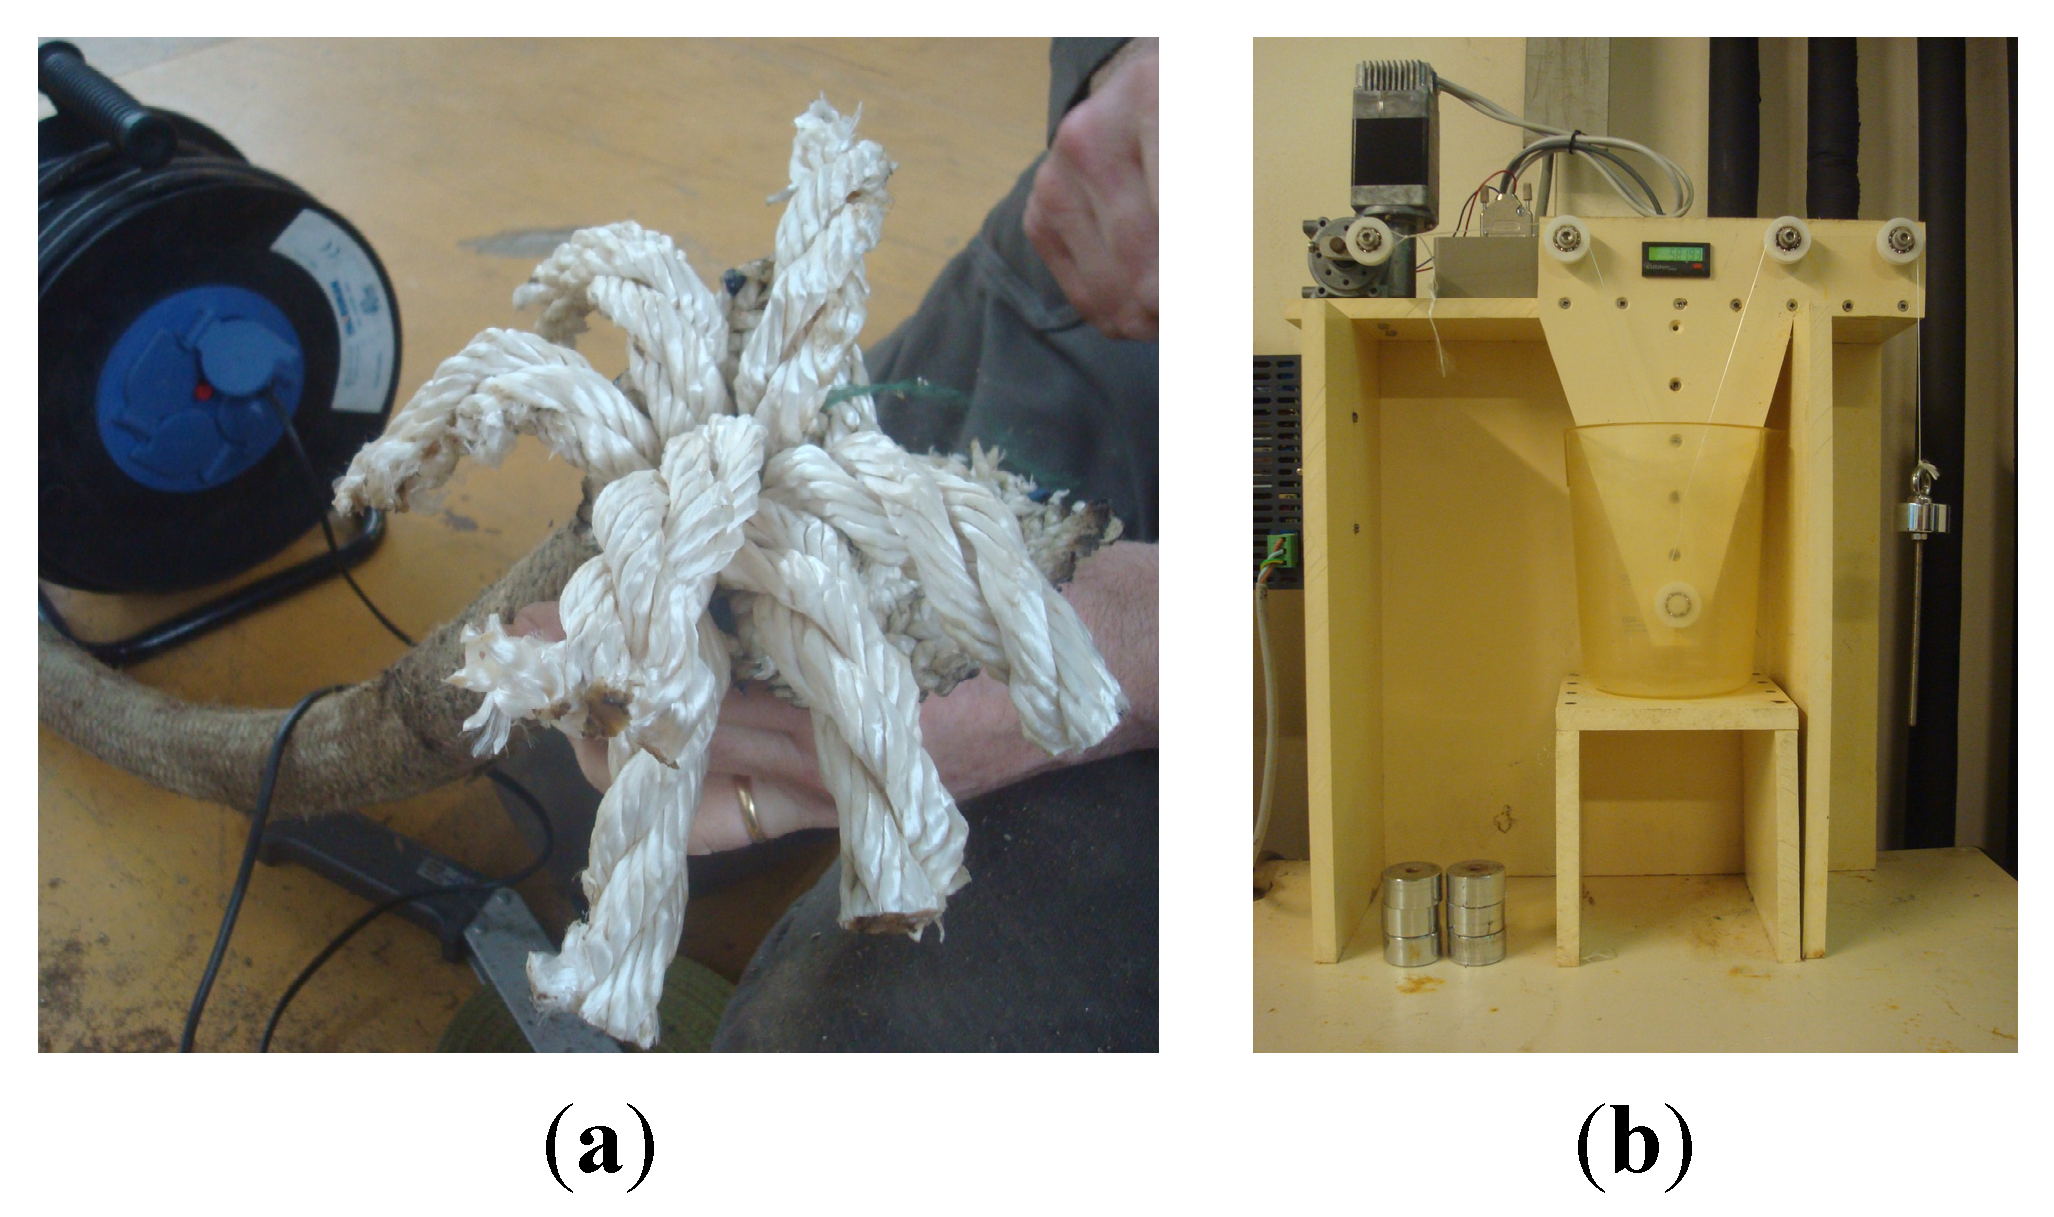
3.1. Testing Facilities: The South West Mooring Test Facility (SWMTF) and Dynamic Marine Component Test Facility (DMAC)

Whilst there are costs associated with running laboratory equipment and employing trained personnel, funding programmes such as MaRINET (Marine Renewables Infrastructure Network: http://www.fp7-marinet.eu/) have provided technology developers with transnational access to a wide range of facilities. Two such MaRINET facilities owned and operated by the University of Exeter are the South West Mooring Test Facility (SWMTF) [21] and the Dynamic Marine Component test rig (DMaC) [21].
Subsea components such as those used in mooring systems (e.g., [22]), risers and cables (e.g., [23]) are prime examples of components which require testing prior to use. These components have to be highly reliable to be fit for purpose (i.e., to ensure that the device is kept on station in the case of mooring components), whilst being cost-effective. Novel solutions may offer lower lifecycle costs or functionality which is not present in conventional components but these require thorough testing to ensure that target performance and reliability levels are adequately met. The following sub-sections will summarise two examples of component testing carried out by the University of Exeter with collaborating partners, both focused on TRLs 4; technology validation in laboratory conditions.

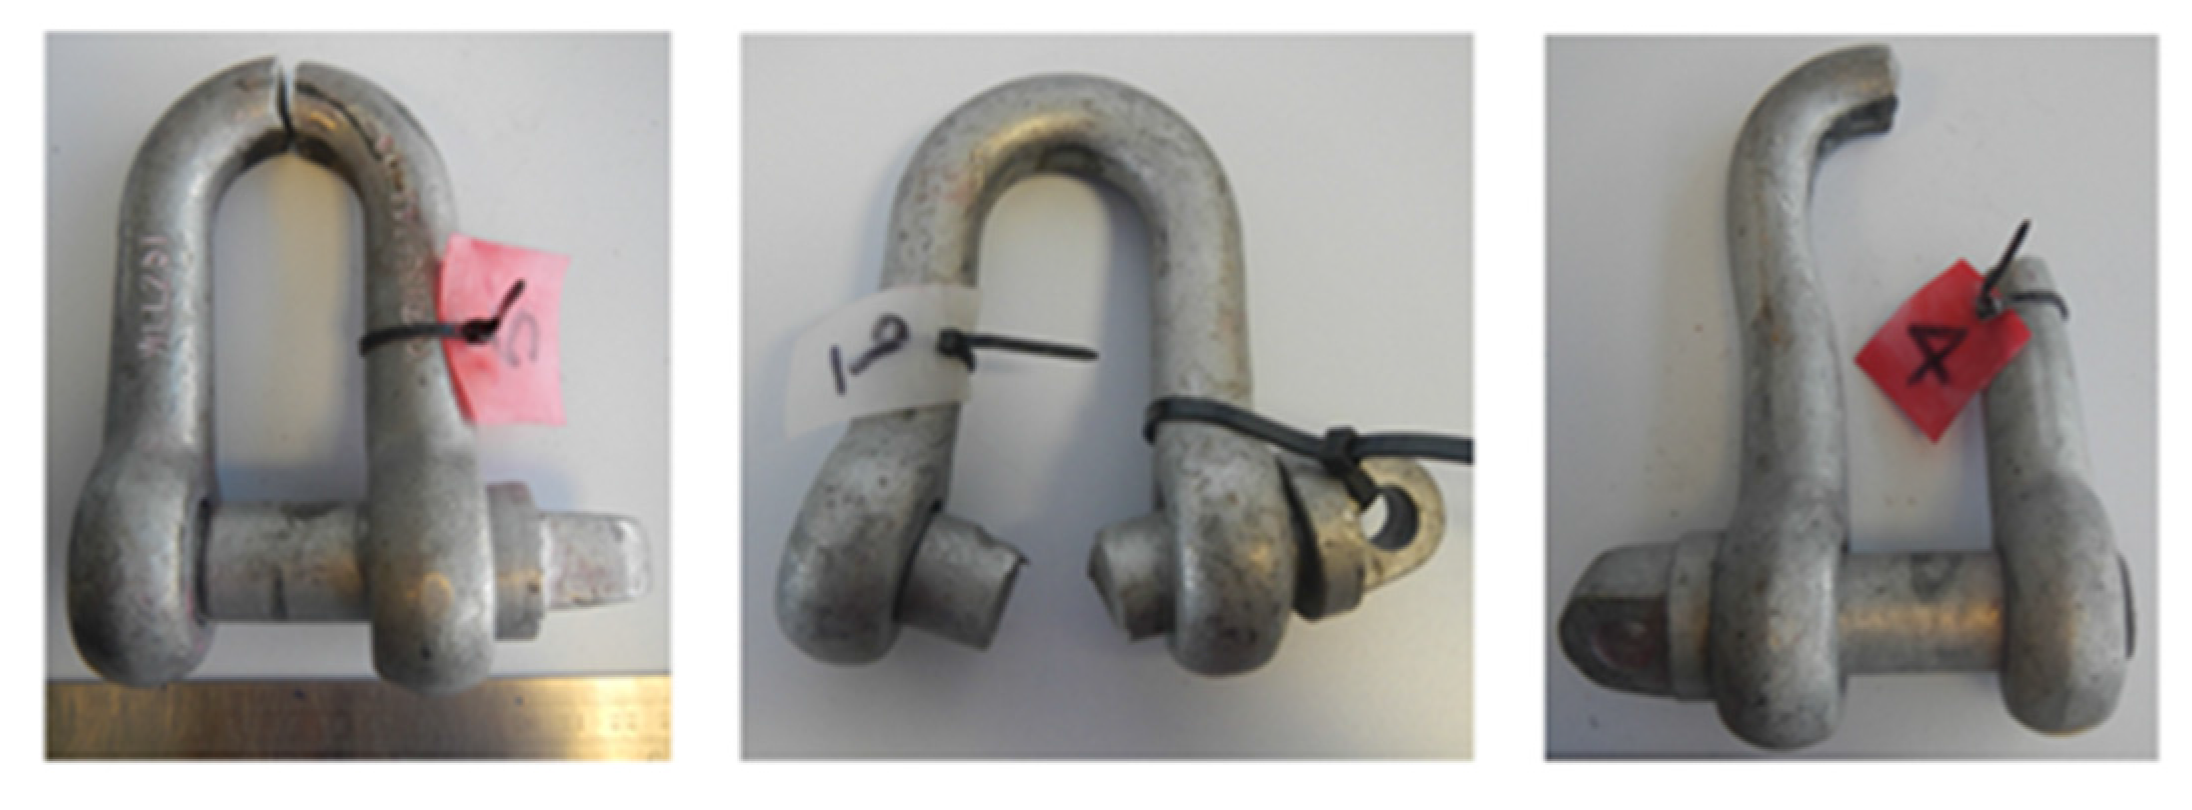
3.2. Reliability Assessment: A Case Study to Review Safety Factors in Mooring Design

In this case study a combined approach for reviewing safety factors and reliability was developed using three key techniques:
  • Numerical modelling using finite element software
  • Accelerated testing using DMaC
  • Field trials at the SWMTF.
Data collected from previous field trials at the SWMTF provided realistic load data to inform the case study. A review of how these techniques can be used to speed up the reliability verification process was conducted.
Component and assembly numerical models of the shackle bow and pin were developed and a range of load cases were reviewed, including the maximum load measured at the SWMTF (53 kN) and the supplier specified minimum breaking load of the shackle (MBL = 122.6 kN).
Controlled break load and accelerated fatigue performance of the shackles was investigated using DMaC. The break tests established an average break load of 210 kN; a safety factor of 8.6 on the shackle working load limit (WLL) and a safety factor of 1.7 on the MBL. Both failures occurred on the thread of the pin. The break tests also allowed identification of the yield point of the shackles; just over 100 kN. This was used to specify the fatigue trials, ensuring they were conducted within the elastic range of the shackles. Force driven cyclical loading of 10–90 kN was specified for the fatigue trials at a frequency of 2 Hz. A total of 11 shackles were fatigue tested resulting in failures ranging from 19,380 cycles to 109,470 cycles and a variety of failure locations including on both the pin and bow (Figure 2 and Table 3). The measured number of cycles to failure is approximately equal to 11% expected by the S-N curve for shackles in air specified in DNV-RP-C203 [24]. This large difference may be due to manufacturing defects in addition to the fact that the shackles were tested with an applied pre-tension, as opposed to the fully reversed load cycles used to construct the S-N curves.
Table 3. Tabulated values of the number of cycles to failure for each shackle.
ShackleExposure LevelFailure Location and TypeLog10 Load Cycles
10LowNone3.70
11LowNone3.70
4MediumNone4.29
5MediumNone4.29
6MediumBreak (bow)4.29
7HighFatigue crack (pin)4.39
8HighFatigue crack (pin)4.39
9HighBreak (centre of pin)4.39
Figure 2. Examples of failed shackles.
Jmse 03 01349 g002
Several new and pre-aged shackles were deployed at the SWMTF for a period approaching 6 months, with maximum loads reaching just over 10 kN. Failures were not anticipated at this load range and none were observed. Dye penetrant testing was used to investigate damage; no damage was observed. Following the sea trials, the shackles were subject to further fatigue testing at DMaC.
The numerical modelling correctly identified areas of weakness in the shackle, but significantly underestimated the strength of both the pin and the bow. The physical testing showed that large safety factors are present in static loading situations with the shackle being substantially stronger than the supplier specification or that predicted by the numerical models. Safety factors were significantly reduced in fatigue loading with failures occurring from 20,000 cycles when the 90 kN load was applied cyclically; this loading level is below the MBL specified by the supplier. Further analysis is required regarding the sea trial data.
In this case study the physical testing allowed accurate figures to be established for the failure modes predicted by the numerical modelling. The ability to perform accelerated testing at 2 Hz allowed a large number of cycles to be applied to the shackles for a detailed assessment of fatigue performance. The mean stress applied during these trials was found to have a significant effect on the rate of failure when comparing data to DNV recommended guidance [25]. Further details of the study can be found in [26].

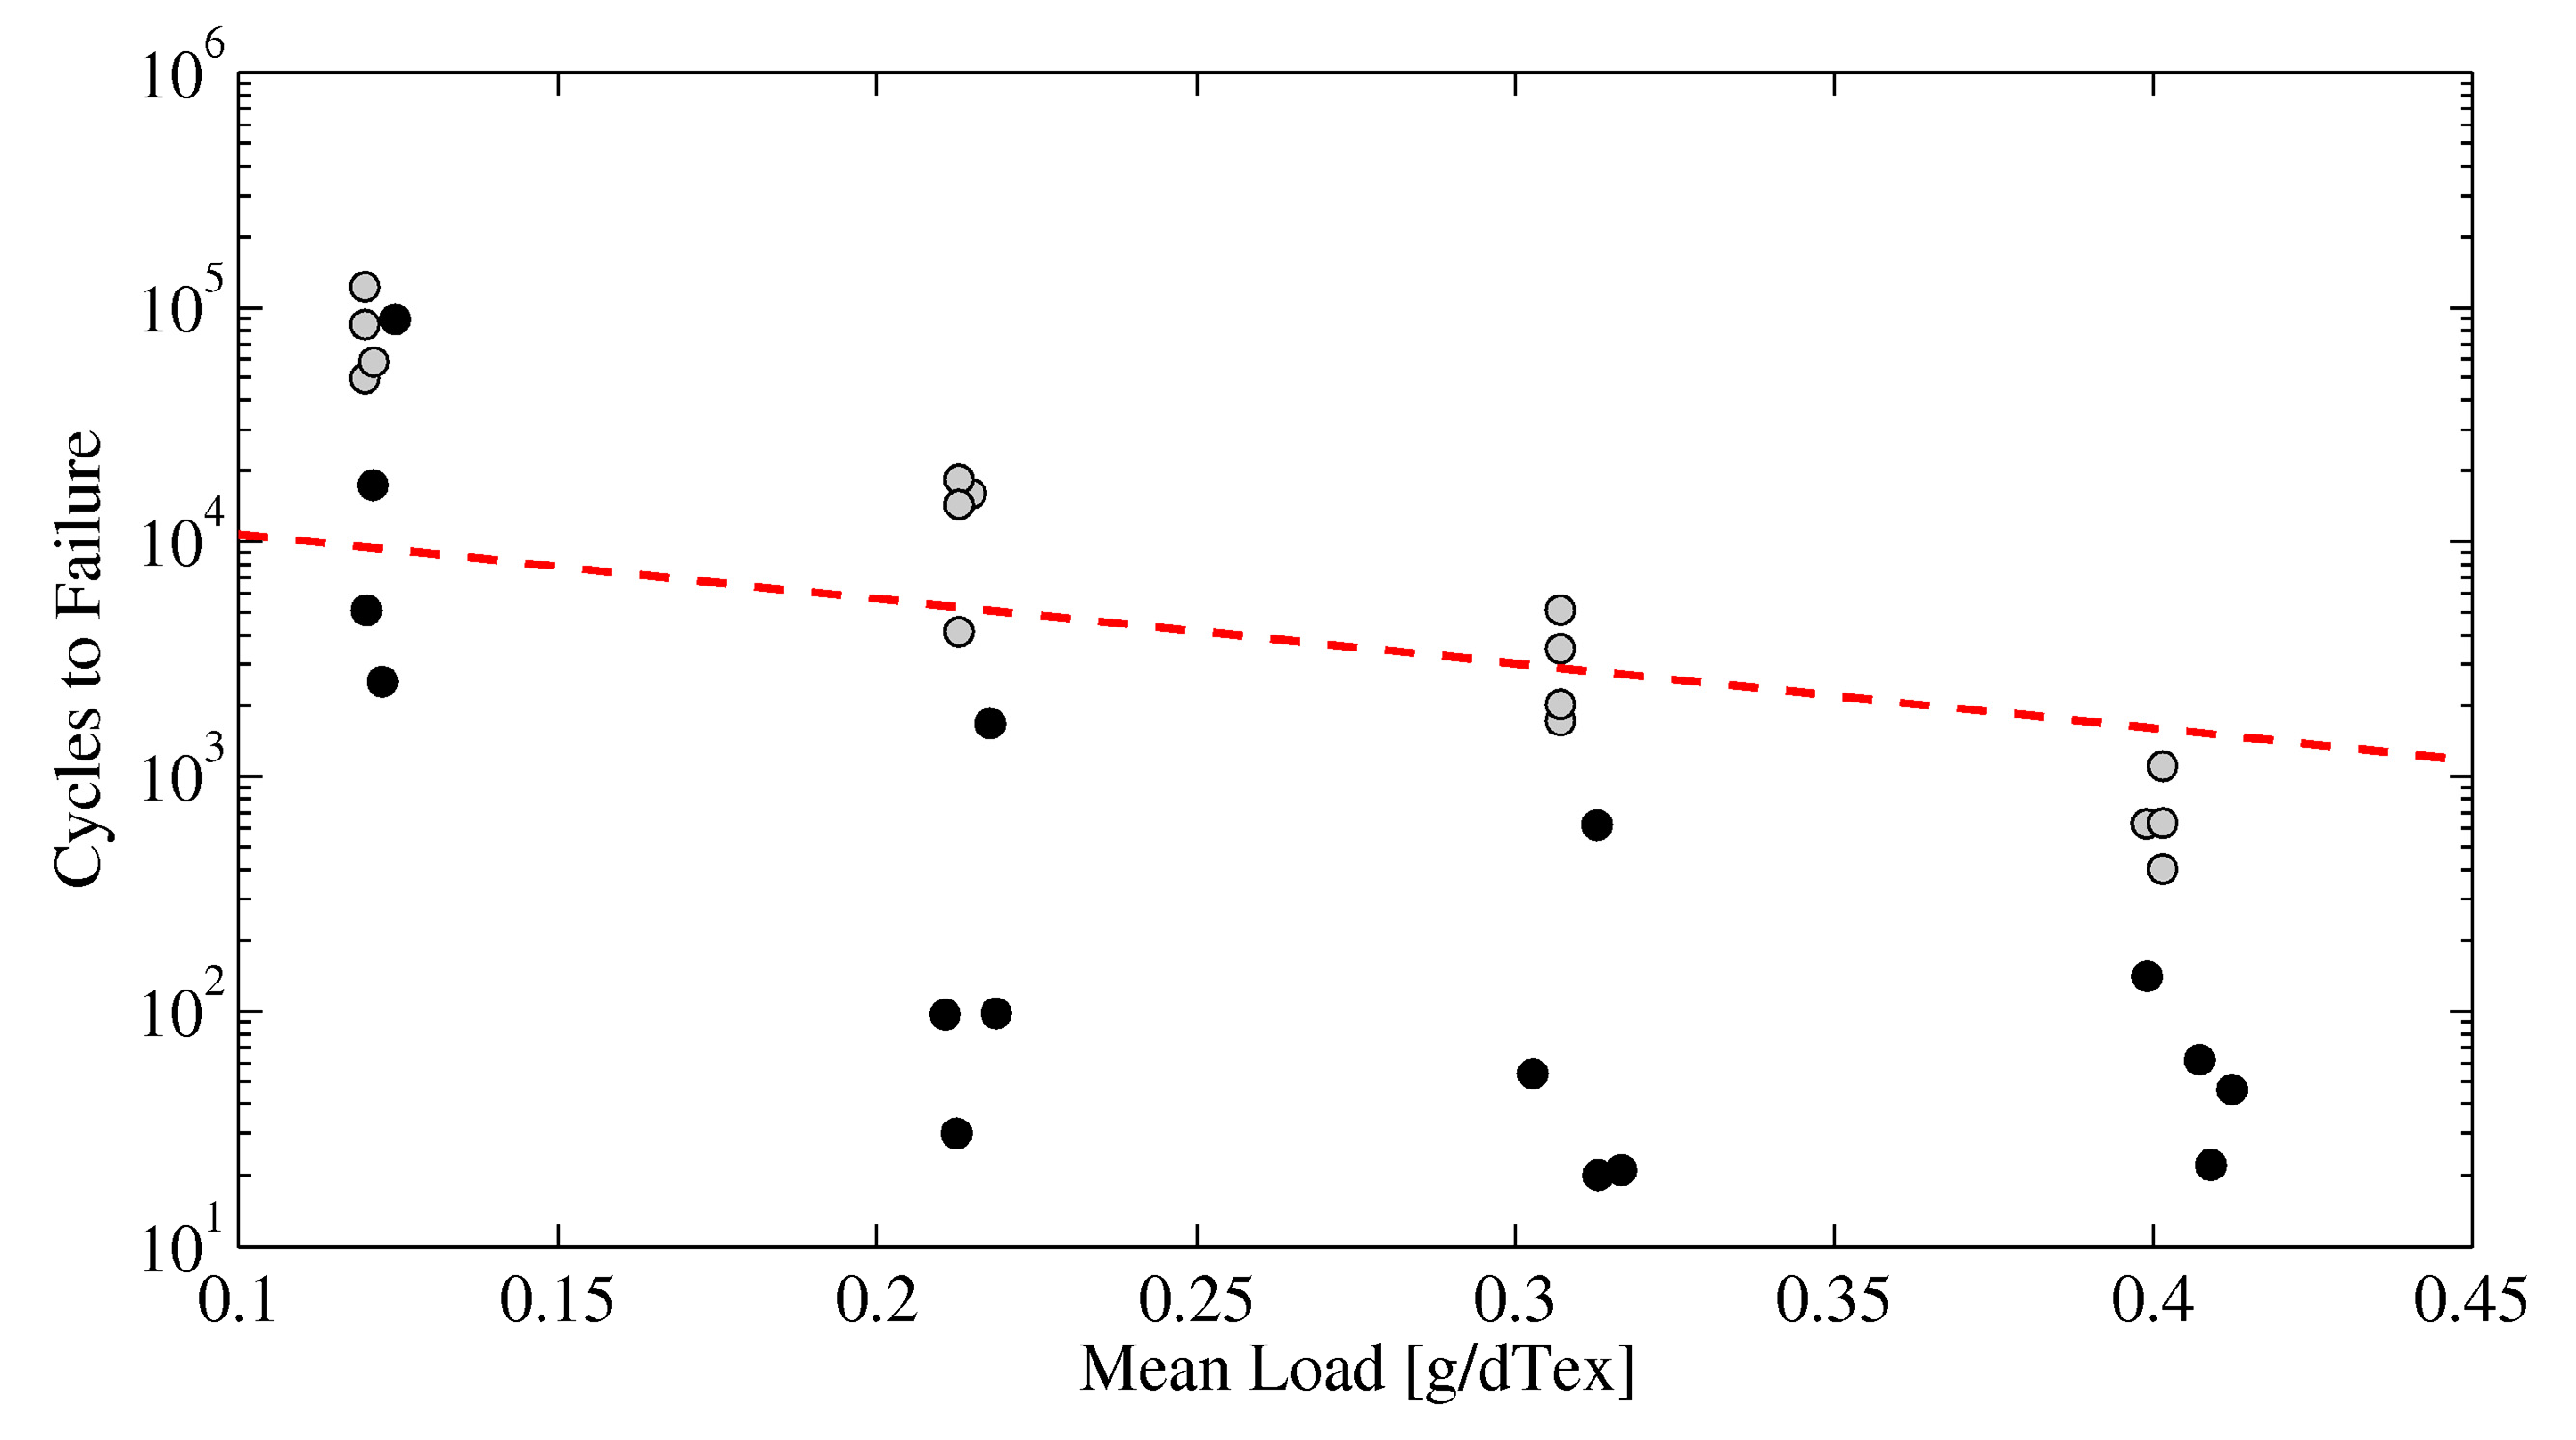
3.3. Synthetic Rope Yarn Durability Assessment

With a proven track record in the offshore industry, synthetic ropes have the potential to be an enabling technology for the MRE sector in terms of the specification of economic and durable mooring components [27]. The response of synthetic ropes is complex, because they display viscoelastic and viscoplastic behaviour which is dependent on time and prior load history [28]. Significant effort over the past two decades has been made into characterising this behaviour through testing and the development of numerical models (e.g., [29]). However, the loading regimes used during testing have reflected the main application of synthetic ropes to-date (large equipment, such as oil and gas exploration drilling platforms or support vessels), for example tests involving low frequency sinusoidal loading. The loading regimes experienced by dynamically responsive MRE devices such as WECs are clearly different and may indeed be sensitive to mooring characteristics such as damping [30]. Therefore a new approach to performance testing and analysis is required for MRE applications.
As part of the MERiFIC (Marine Energy in Far Peripheral and Island Communities: http://www.merific.eu/) project, tests were conducted at the University of Exeter and L’Institut français de recherche pour l’exploitation de la mer (IFREMER) to ascertain the performance of nylon ropes subjected to loading conditions relevant to MRE devices. This built upon earlier characterization work by Ridge et al. in [31]. In the first part of the study [28] several new rope samples (of the same construction to that shown in Figure 3a) were subjected to harmonic and irregular loading regimes using the DMaC test rig based on tension measurements recorded by the SWMTF. The focus of the study was to determine the influence of load history on response, characterised through three performance metrics which are important to MRE mooring system design: rope strain, axial stiffness and axial damping.
Figure 3. (a) Rope sample with outer jacket removed showing construction (parallel-stranded); (b) Yarn-on-yarn abrasion test machine at IFREMER [32].
Jmse 03 01349 g003
The second part of the study looked into the performance of aged samples [32] after 18 months use as part of the SWMTF mooring system. Whilst it is important for a device developer to know the short-term performance of mooring components, it is also crucial that the long-term durability is well understood. After subjecting the aged sample to the same loading conditions as the new samples in the first part of the study, the investigation revealed small changes to the properties of the rope. The analysis was extended to include yarn-on-yarn fatigue testing at IFREMER (Figure 3b) in addition to tension testing of yarns and scanning electron micron imaging of fibres [32]. From the dataset of yarn results presented in Figure 4 and Table 4 it is possible to define a linear trend between the number of cycles to failure and mean load (T). Calculated trend line parameters are listed in Table 5 including Cordage Institute recommended number of cycles to failure (based on [33]).
Table 4. Tabulated values of the number of cycles to failure for aged and new yarns.
Yarn ConditionMean Load (g/dTex)Log10 Cycles to Failure
MinimumMaximumAverage
New0.124.695.094.87
0.213.624.264.06
0.313.243.713.45
0.402.613.042.81
Aged0.123.44.954.07
0.211.483.222.17
0.311.302.791.79
0.411.342.151.74
Table 5. Calculated linear trend parameters for number of cycles to failure.
Yarn ConditionLog10 Cycles to FailureR2
New−7.2396T + 5.68240.9345
Aged−7.7221T + 4.4790.5542
Cordage Institute [33] log 10 ( 20220 e 6.332 T ) -
Figure 4. Yarn-on-yarn abrasion tests of aged and new yarns (black and grey markers respectively, from [32]). Mean loads have been normalised by dTex, a measure of mass per unit length (units: g/10 km). Minimum cycles to failure as defined in Cordage Institute guidelines [33] are shown as a dashed red line.
Jmse 03 01349 g004
The scatter in the aged yarn results is considerably greater than for the new yarns as demonstrated through the calculated coefficients of variation (R2) listed in Table 5. Such variability was also observed in break and cyclic tension tests and this is likely to be symptomatic of mild fatigue wear and structural rearrangement sustained during deployment.

3.4. The Value of Physical Component Test Data to Reliability Prediction

Physical component test data provides a means of reducing the lifetime estimate uncertainties associated with using generic failure rates (which may be unverified and potentially unsuitable for the application) prior to gaining operational experience gained in the field. In particular testing allows failure modes to be established prior to installation, providing insight into component wear and reliability and thus allowing confidence levels of long-term installation durability to increase [15]. In the early design stages (TRLs <5) the expected operating conditions may not be fully defined and component performance may be unknown. In this case full fatigue limit state analysis using damage accumulation methods (e.g., the Pålmgren-Miner rule) is typically not possible and instead a statistical approach to reliability assessment combined with experimental fatigue data could be used to estimate the MTTF of the component. The case studies reported in the previous two sections present characteristic failure modes of shackles and synthetic rope yarns. In order to fully define a usable set of fatigue curves more data points are required; a minimum number of 15 samples using at least three stress ranges are required for steel components according to DNV-RP-C203 [24]. Having achieved this, the number of cycles to failure can be estimated if a dominant stress or tension range (or mean load) can be identified from numerical analysis. For example from the yarn-on-yarn test data, the independent variable; mean load is analogous with the influence factor described in Section 2.3., enabling predictions to be made on synthetic rope yarn abrasion. Loading cycles are inherently stochastic in nature, varying in mean load, load amplitude and load rate. It is therefore acknowledged that the estimate of component life provided by this approach would be conservative compared to full damage accumulation analysis.

4. Conclusions

Marine Renewable Energy has the potential to make a significant contribution to the supply of electricity for countries with sufficient wave resource. In order for it to be financially competitive with other forms of electricity generation, significant, but not insurmountable barriers must be overcome before large scale array deployments are realised. Whilst the MRE sector is currently seen as high-risk investment option, the rewards are potentially large. In order to encourage continued investment in the sector confidence in the long-term operating availability and durability of designs is required for a range of stakeholders including certification agencies, insurers and investors. Indeed given the choice of investing in one of several technologies, the ability to operate almost continuously, i.e., having very high reliability target levels to achieve high availability, may be more important in the early stages of development than device performance rating.
For devices which have reached TRL 4, efforts within the sector are currently focused on de-risking technologies through incremental development work with the aim of achieving designs which are both cost effective and reliable. This involves laboratory testing, numerical modelling and prototype testing at benign sites in order to “iron-out” issues before full-scale prototypes are deployed. Once installed, the consequence of failure could range from inconvenient and costly to catastrophic. De-risking not only includes scrutinising novel component designs but also COTS equipment used in different applications in order to determine suitability. Component testing has a key role to play in this process. By subjecting components to representative operating conditions that are likely to be seen in service (i.e., loading regimes, usage rates, electrical loads etc.), greater confidence can be gained about failure rates, marking a departure from using generic (and perhaps unsuitable) database values. Testing also enables the causes and effects of failure to be investigated in greater detail further contributing to risk mitigation.
Given the nascent state of the MRE sector and shortage of available operational data it is unsurprising that reliability assessments are currently being conducted using simple statistical methods. The bottom-up statistical method has been adopted by the DTOcean project for inclusion in a Tool for MRE array design. The Tool will be packaged with a database of failure rates which can be overridden by the user should more appropriate data be available. Although simple, this approach will provide a fast estimate of array reliability, allowing weaknesses in the system to be identified through several graphical interfaces. At present device deployment intervals are usually short with the main aim to gain proof of concept. As more operating hours are accumulated, higher accuracy reliability estimates will be possible. In the meantime, a method to improve statistical reliability predictions using physical component test data has been suggested in this paper.

Acknowledgments

The research leading to the results presented in this paper has received funding from the European Community’s Seventh Framework Programme. Several projects have been funded by this programme including DTOcean, MERiFIC and MaRINET. In addition, the research mentioned in Section 3.2 received funding from SuperGEN UKCMER through the EPSRC (EP/I027912/1, EP/M014738/1).

Author Contributions

S.D.W. compiled the paper, conducted the synthetic rope study (Section 3.3) and is leading the development of the reliability assessment tool used in the DTOcean project. T.G. carried out the shackle study reported in Section 3.2. P.R.T. and L.J. provided scientific advice and content for the manuscript, in particular the sections on reliability theory.

Conflicts of Interest

The authors declare no conflict of interest.

References

  1. European Commission. Smarter, Greener, More Inclusive? Indicators to Support the Europe 2020 Strategy; Publications Office of the European Union: Luxembourg, Luxembourg, 2015. [Google Scholar]
  2. European Ocean Energy. Industry Vision Paper; European Ocean Energy: Brussels, Belgium, 2013. [Google Scholar]
  3. RenewableUK. In Wave and Tidal Energy in the UK. Conquering Challenges, Generating Growth; RenewableUK: London, UK, 2013.
  4. European Commission. In HORIZON 2020—Work Programme 2014–2015. Annex G. Technology Readiness Levels (TRL); Extract from Part 19-Commission Decision C (2014)4995; European Commission: Brussels, Belgium, 2014.
  5. Magagna, D.; MacGillivray, A.; Jeffrey, H.; Hanmer, C.; Raventos, A.; Badcock-Broe, A.; Tzimas, E. Wave and Tidal Energy Strategic Technology Agenda, 2nd ed.; SIOcean, Joint Research Centre: Brussels, Belgium, 2014. [Google Scholar]
  6. Wolfram, J. On assessing the reliability and availability of marine energy converters: The problems of a new technology. Proc. Inst. Mech. Eng. O J. Risk Reliabil. 2006, 220, 55–68. [Google Scholar]
  7. Abdulla, K.; Skelton, J.; Doherty, K.; O’Kane, P.; Doherty, R.; Bryans, G. Statistical Availability Analysis of Wave Energy Converters. In Proceedings of the 21st International Offshore and Polar Engineering Conference, Maui, HI, USA, 19–24 June 2011.
  8. University of Edinburgh. SuperGEN Marine Energy Research. Final Report; University of Edinburgh: Edinburgh, UK, 2011. [Google Scholar]
  9. Catapult Offshore Renewable Energy and the Crown Estate. SPARTA: The Performance Data Exchange Platform for Offshore Wind. Available online: https://ore.catapult.org.uk/sparta (accessed on 5 August 2014).
  10. Offshore Renewable Energy (ORE) Catapult. Tidal turbine powertrain reliability project. Available online: https://ore.catapult.org.uk/our-projects/-/asset_publisher/fXyYgbhgACxk/content/tidal-turbine-powertrain-reliability-project (accessed on 5 August 2015).
  11. Crabtree, C.J.; Zappalá, D.; Hogg, S.I. Wind energy: UK experiences and offshore operational challenges. Proc. Inst. Mech. Eng. A J. Power Energy 2015. [Google Scholar] [CrossRef] [Green Version]
  12. U.S. Department of Defense. Military Handbook: Reliability Prediction of Electronic Equipment; MIL-HDBK-217F; U.S. Department of Defense: Washington, DC, USA, 1991. [Google Scholar]
  13. OREDA. Offshore REliability Data Home Page. Available online: http://www.oreda.com (accessed on 10 July 2015).
  14. Bala, S.; Pan, S.; Das, D.; Apeldoorn, O.; Ebner, S. Lowering Failure Rates and Improving Serviceability in Offshore Wind Conversion-Collection Systems. In Proceedings of the 2012 IEEE Power Electronics and Machines in Wind Applications, Denver, CO, USA, 16–18 July 2012.
  15. Thies, P.R.; Smith, G.H.; Johanning, L. Addressing failure rate uncertainties of marine energy converters. Renew. Energy 2012, 44, 359–367. [Google Scholar] [CrossRef]
  16. McAuliffe, F.D.; Macadré, L.; Donovan, M.H.; Murphy, J.; Lynch, K. Economic and Reliability Assessment of a Combined Marine Renewable Energy Platform. In Proceedings of the 11th European Wave and Tidal Energy Conference, Nantes, France, 6–11 September 2015.
  17. Det Norske Veritas. Offshore Service Specification DNV-OSS-312 Certification of Tidal and Wave Energy Converters; Det Norske Veritas: Oslo, Norway, 2008. [Google Scholar]
  18. Snowberg, D.; Weber, J. MHK Technology Development Risk Management Framework; NREL/TP-5000-63258; National Renewable Energy Laboratory: Denver, USA, 2015. [Google Scholar]
  19. Low Carbon Innovation Coordination Group. Technology Innovation Needs Assessment (TINA) Marine Energy Summary Report. Available online: http://www.carbontrust.com/media/168547/tina-marine-energy-summary-report.pdf (accessed on 12 September 2014).
  20. Thies, P.R.; Johanning, L.; Smith, G.H. Towards component reliability testing for marine energy converters. Ocean Eng. 2011, 34, 1918–1934. [Google Scholar] [CrossRef]
  21. Johanning, L.; Thies, P.R.; Smith, G.H. Component test facilities for marine renewable energy converters. In Proceedings of the Marine Renewable and Offshore Wind Energy Conference, London, UK, 21 April 2010.
  22. Gordelier, T.; Parish, D.; Johanning, L. A novel mooring tether for highly dynamic offshore applications; mitigating peak and fatigue loads via reduced and selectable axial stiffness. J. Mar. Sci. Eng. 2015, 3, 1287–1310. [Google Scholar] [CrossRef]
  23. Thies, P.R.; Johanning, L.; Karikari-Boateng, K.A.; Ng, C.; McKeever, P. Component reliability test approaches for marine renewable energy. Proc. Inst. Mech. Eng. O J. Risk Reliabil. 2015, 229, 403–416. [Google Scholar] [CrossRef] [Green Version]
  24. Det Norske Veritas. Fatigue Design of Offshore Steel Structures; Det Norske Veritas: Oslo, Norway, 2011. [Google Scholar]
  25. Det Norske Veritas. Offshore Standard DNV-OS-E301 Position Mooring; Det Norske Veritas: Oslo, Norway, 2013. [Google Scholar]
  26. Gordelier, T.; Johanning, L.; Thies, P.R. Reliability verification of mooring components for floating marine energy converters. In Proceedings of the SHF Marine Renwable Energy—MRE 2013, Brest, France, 9–10 October 2013.
  27. Weller, S.D.; Johanning, L.; Davies, P.; Banfield, S.J. Synthetic mooring ropes for marine renewable energy applications. Renew. Energy 2015, 83, 1268–1278. [Google Scholar] [CrossRef] [Green Version]
  28. Weller, S.D.; Davies, P.; Vickers, A.W.; Johanning, L. Synthetic rope responses in the context of load history: Operational performance. Ocean Eng. 2014, 83, 111–124. [Google Scholar] [CrossRef] [Green Version]
  29. Chailleux, E.; Davies, P. Modelling the Non-Linear Viscoelastic and Viscoplastic Behaviour of Aramid Fibre Yarns. Mech. Time Depend. Mater. 2003, 7, 291–303. [Google Scholar] [CrossRef]
  30. Johanning, L.; Smith, G.H.; Wolfram, J. Measurements of static and dynamic mooring line damping and their importance for floating WEC devices. Ocean Eng. 2007, 34, 1918–1934. [Google Scholar] [CrossRef]
  31. Ridge, I.M.L.; Banfield, S.J.; Mackay, J. Nylon fibre rope moorings for wave energy converters. In Proceedings of the OCEANS 2010 Conference, Seattle, WA, USA, 20–23 September 2010.
  32. Weller, S.D.; Davies, P.; Vickers, A.W.; Johanning, L. Synthetic rope responses in the context of load history: The Influence of Aging. Ocean Eng. 2015, 96, 192–204. [Google Scholar] [CrossRef] [Green Version]
  33. Flory, J.F. Cordage Institute guidelines for marine grade nylon and polyester rope-making yarns. In Proceedings of the OCEANS 2013 Conference, Bergen, Norway, 6–8 May 2013.

