Review

A Universal Parameter to Predict Subaerial Landslide Tsunamis?

1
Department of Civil and Environmental Engineering, Imperial College London, London SW7 2AZ, UK
2
Laboratory of Hydraulics, Hydrology and Glaciology (VAW), Swiss Federal Institute of Technology (ETH) Zurich, CH-8093 Zürich, Switzerland
*
Author to whom correspondence should be addressed.
J. Mar. Sci. Eng. 2014, 2(2), 400-412; https://doi.org/10.3390/jmse2020400
Submission received: 18 February 2014 / Revised: 11 March 2014 / Accepted: 31 March 2014 / Published: 29 April 2014
(This article belongs to the Special Issue Tsunami Science and Engineering)

Abstract

:
The significance of the impulse product parameter P is reviewed, which is believed to be the most universal parameter for subaerial landslide tsunami (impulse wave) prediction. This semi-empirical parameter is based on the streamwise slide momentum flux component and it was refined with a multiple regression laboratory data analysis. Empirical equations based on P allow for a simple prediction of wave features under diverse conditions (landslides and ice masses, granular and block slides, etc.). Analytical evidence reveals that a mass sliding down a hill slope of angle 51.6° results in the highest waves. The wave height “observed” in the 1958 Lituya Bay case was well predicted using P. Other real-world case studies illustrate how efficient empirical equations based on P deliver wave estimates which support hazard assessment. Future applications are hoped to further confirm the applicability of P to cases with more complex water body geometries and bathymetries.

1. Introduction

An important class of tsunamis is caused by mass movements including landslides, rock falls, underwater slumps, glacier calving, debris avalanches or snow avalanches [1,2,3,4,5]; these are commonly referred to as landslide tsunamis or landslide generated impulse waves. Landslide tsunamis (impulse waves) typically occur in reservoirs and lakes, fjords or in the sea at volcanic islands or continental shelves [2,6,7,8,9]. The term landslide tsunami is sometimes also applied to waves generated in reservoirs and lakes [10] even though the term impulse waves would then be more correct.
Irrespective of where these waves are caused, they are a considerable hazard and the total cumulative death toll of Unzen (1792), Ritter Island (1888), Vajont (1963) and Papua New Guinea (1998) alone is likely to exceed 22,100 [2,4,11]. Fortunately, landslide tsunamis (impulse waves) may nowadays be predicted with relatively high confidence (much better than an order of magnitude) by given slide parameters using both numerical [3,7,12,13,14,15,16,17,18,19] or physical [14,20,21,22,23,24,25,26,27,28,29] model studies.
Subaerial landslide tsunamis are particularly challenging to predict because the mass, initially located above the water surface, impacts the water body and may entrain a large amount of air. Slide velocities of up to 128 m/s were estimated based on slide deposits [30], generating highly turbulent landslide tsunamis (impulse waves) if they interact with a water body. Fortunately, susceptible areas are often monitored, giving prior warning of a potential subaerial landslide tsunami (impulse wave). An active prevention of the wave generation is difficult to achieve so that passive methods, including early warning, evacuation, reservoir drawdown, or provision of adequate freeboards of dam reservoirs, are applied. A prediction of wave features is essential for the success of these methods, which must be conducted frequently, particularly in lakes [8,31] and during the planning and operational phases of reservoirs [6,31,32].
A common method for the assessment of this hazard is to conduct a physical model study in the laboratory environment. Generic physical model studies [20,21,22,23,24,26,27,28,29] systematically vary parameters (slide properties, hill slope angle, water depth) and express the unknown wave parameters (amplitude, height, period) as a function of these “known” parameters. The most relevant parameters for subaerial landslide tsunamis (impulse waves) are shown in Figure 1. The developed empirical equations allow for first estimates of future events [8,31,33], and their application is often the most straightforward method if time is limited. The results also determine whether a more accurate prototype specific numerical [7,11,19] or physical [6,32] model study is required; these latter methods are costly and require considerable more time and resources.
Herein, the significance of the impulse product parameter P is reviewed, which is believed to be the most universal parameter for generic landslide tsunami (impulse wave) predictions. Useful analytical derivations based on P are deduced and it is illustrated how P greatly simplifies hazard assessment through real-world predictions.
Figure 1. Definition sketch of subaerial landslide tsunami (impulse wave) generation (adapted from Heller and Hager [26], with permission from © 2010 American Society of Civil Engineers).
Jmse 02 00400 g001

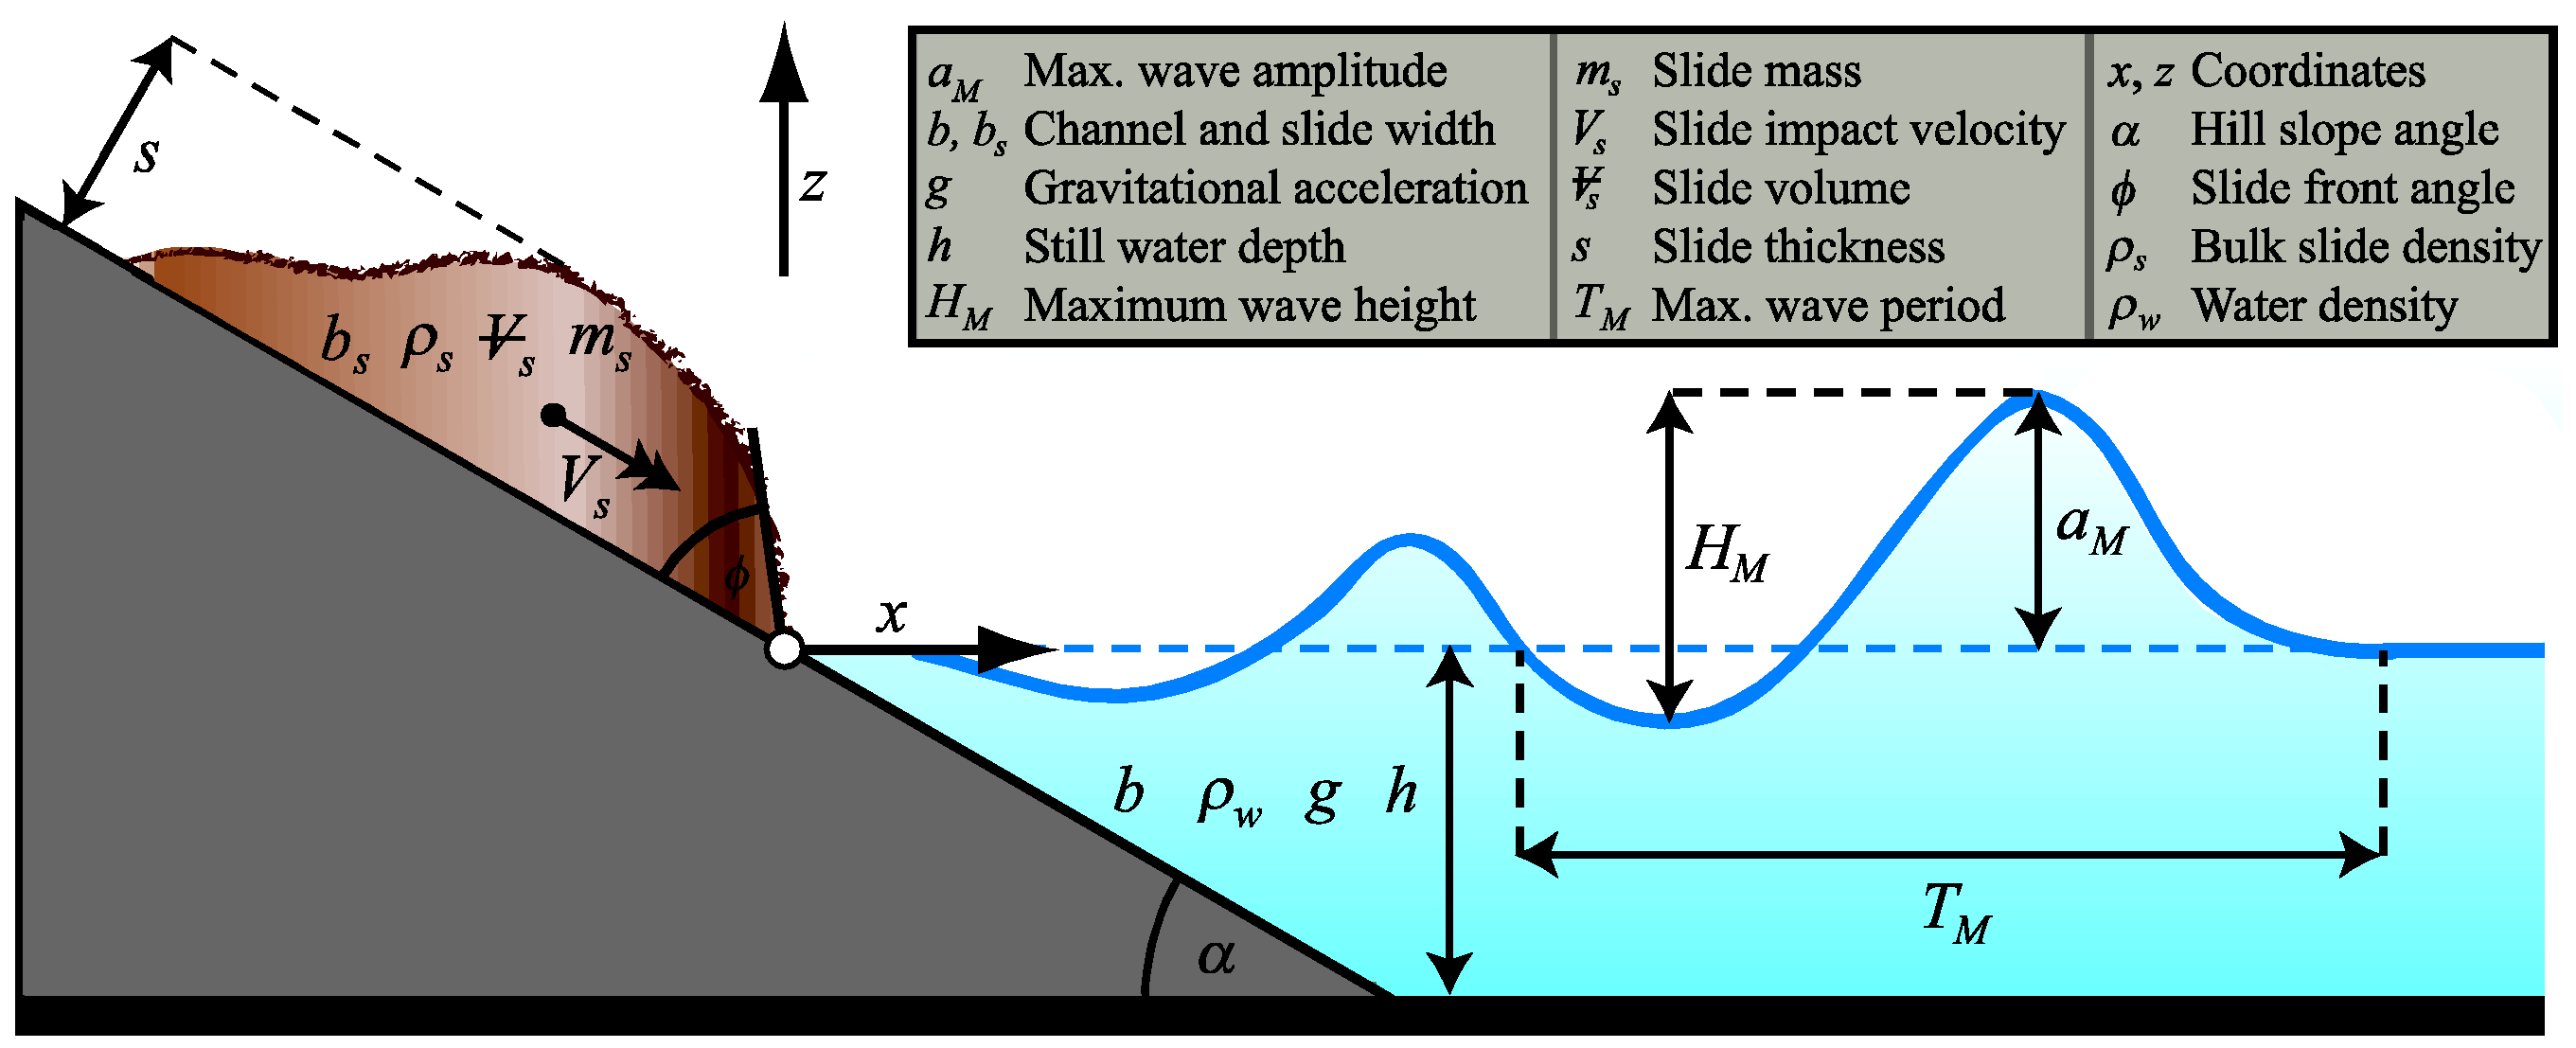
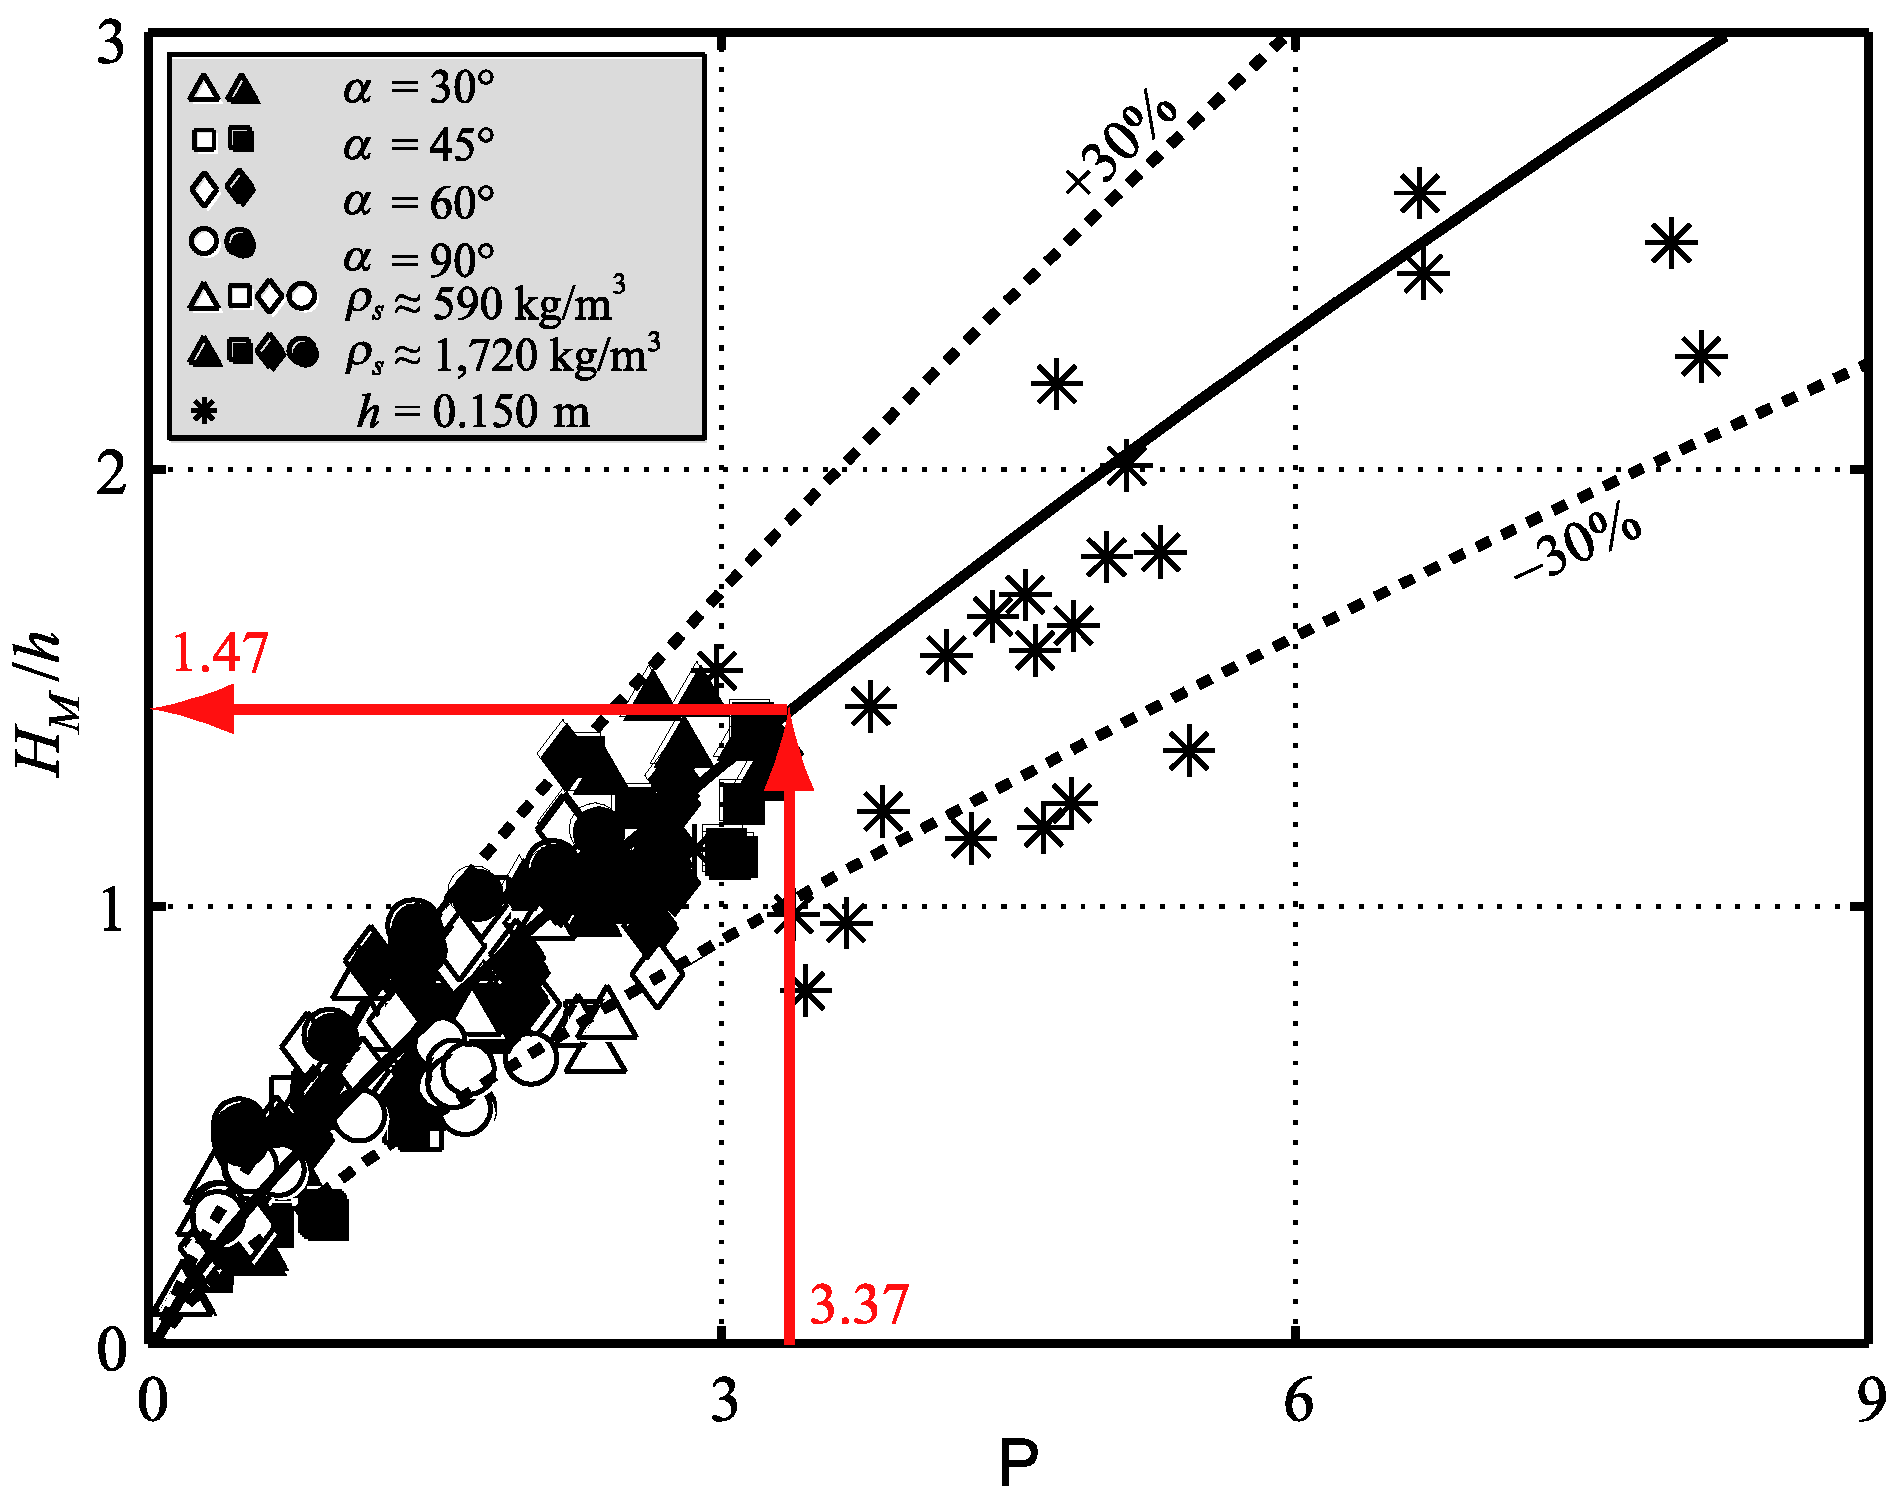
2. The Impulse Product Parameter

2.1. Derivation

The semi-empirical impulse product parameter P was developed by Heller and Hager [26] from subaerial landslide generated impulse wave model tests in a laboratory wave channel (2D) (see description of method in Appendix A). It is defined as
P = FS1/2 M1/4{cos[(6/7)α]}1/2
Equation (1) includes the slide Froude number F = Vs/(gh)1/2, the relative slide thickness S = s/h, the relative slide mass M = ms/(ρwbsh2) and the hill slope angle α. Figure 1 shows all parameters required for these dimensionless numbers, namely the slide impact velocity Vs, gravitational acceleration g, still water depth h, slide thickness s, slide mass ms, water density ρw and slide width bs. The parameter P is based on the square root of the streamwise slide momentum flux component, involving the bulk slide density ρs and slide discharge Qs, as [24]
(ρsQsVscosα)1/2 ≈ (ρssbsVs2cosα)1/2 = ρs1/2s1/2bs1/2Vscos1/2α
The expression on the right hand side in Equation (2) was further refined with a multiple regression data analysis based on hundreds of 2D experiments, resulting in the establishment of P [26]. This refinement was conducted to minimize the data scatter in the prediction of the wave parameters. The analysis revealed that the relative effects of Vs and s are correctly retained in P, as predicted in Equation (2). Since a vertically impacting slide with cos(90°) = 0 would result in no impulse wave action, the term cos1/2α in Equation (2) was replaced by the empirical parameter {cos[(6/7)α]}1/2 resulting in the smallest data scatter. The relative effect of ρs1/2 in the slide mass ms = ρs Jmse 02 00400 i001, with bulk slide volume Jmse 02 00400 i001, was with ρs1/4 found to be less pronounced in the data analysis than predicted in Equation (2).
Figure 2 shows P versus the relative maximum wave height HM/h resulting from the multiple regression data analysis. The average data scatter is ±30%, and the maximum scatter in the order of ±40% is considerable smaller than in previous studies [21,23], involving +100/−50% maximum scatter relative to the relative wave amplitude a/h or height H/h. In addition, the parameter P considers wider parameter ranges thereby applying to landslides and ice masses, to hill slope angles 30° ≤ α ≤ 90°, and to further conditions (Table A1). Heller and Spinneken [29] (see description of method in Appendix A) demonstrated that P, originally developed for granular slides, applies also to waves generated by block slides. Further, the study of Fuchs et al. [34] used P to describe underwater landslide characteristics. These diverse conditions under which P applies may establish P as the most universal parameter for landslide tsunami (impulse wave) hazard assessment.
Figure 2. Example of prediction diagram based on P: Relative maximum wave height HM/h versus P for granular slides and best fit HM/h = (5/9)P4/5 (R2 = 0.82, Table 1) with ±30% lines including most data points; the red arrows show the prediction for the 1958 Lituya Bay case resulting in HM = 1.47h = 179 m; data indicated with * are too low due to non-negligible scale effects (adapted from Heller and Hager [26], with permission from © 2010 American Society of Civil Engineers).
Jmse 02 00400 g002
Table 1. Empirical equations based on P derived in 2D physical model studies by Heller and Hager [26] and Heller and Spinneken [29]; maximum wave height HM and period TM correspond to the identical wave and location xM where the maximum wave amplitude aM was measured; for block model slides the blockage ratio B = bs/b (0.88 − 0.98), the expression Φ = sin1/2φ (0.71 − 1.00) considering the slide front angle φ and the expression Ts = ts/{[h + Jmse 02 00400 i001
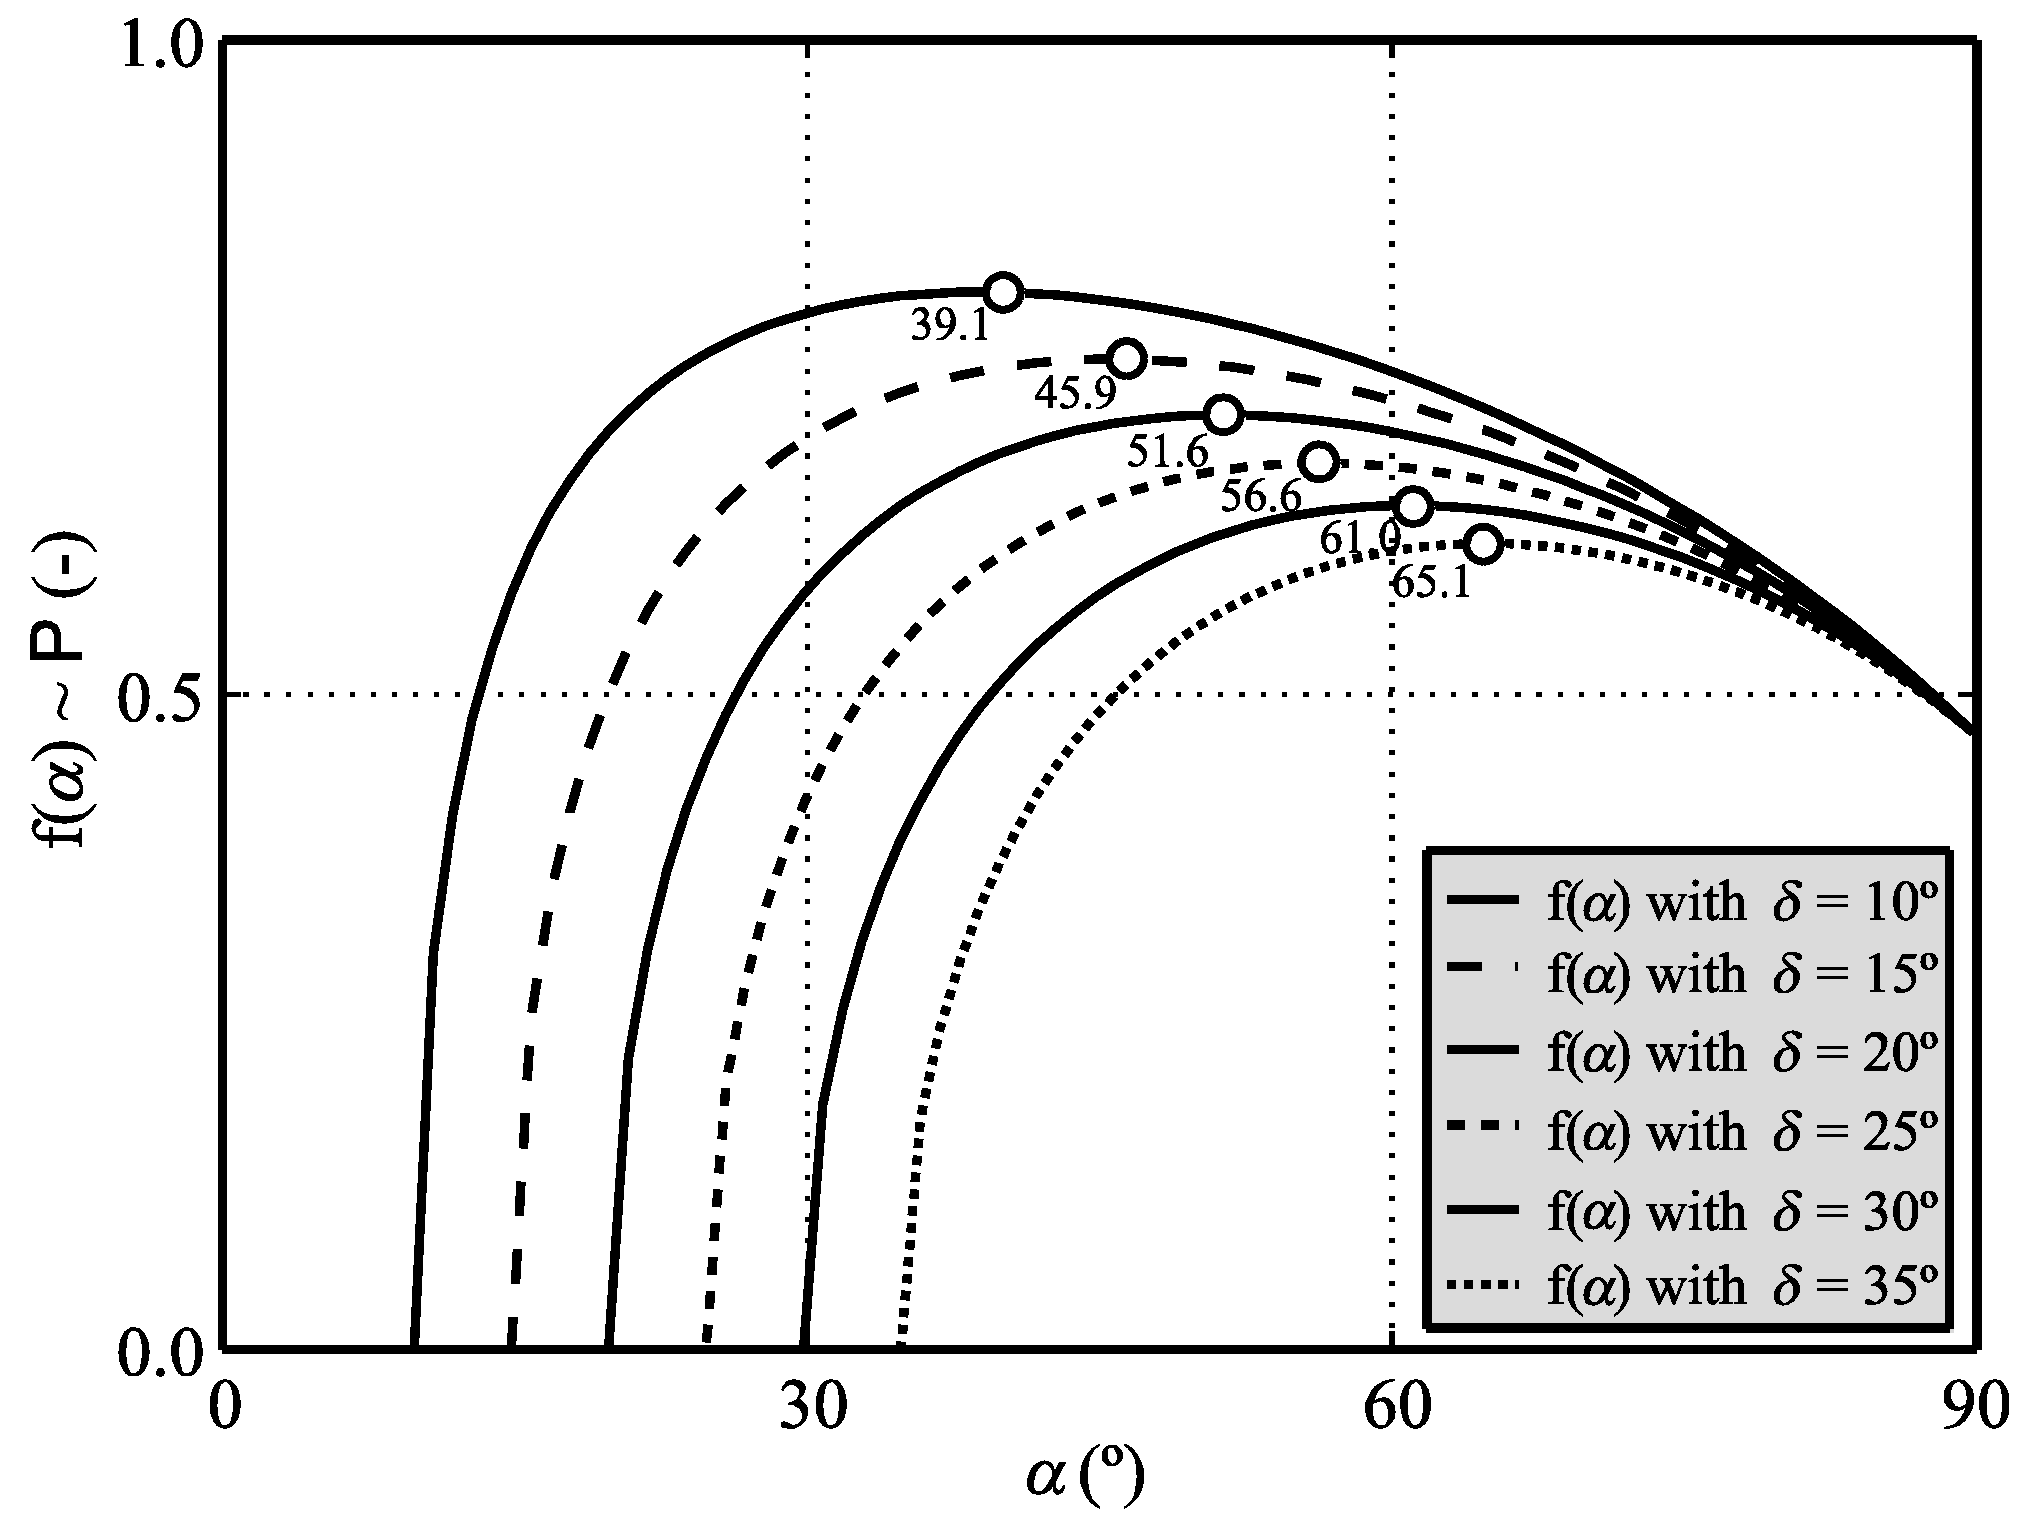
/(sbs)]/Vs} (0.34 − 1.00) considering the transition type are relevant, with ts = characteristic time of submerged landslide motion.
Wave parameterHeller and Hager [26]Heller and Spinneken [29]
Slide typegranularblock
Maximum amplitudeaM = (4/9)P4/5h(R2 = 0.88)aM = (3/4)[PBΦTs1/2]9/1°h(R2 = 0.88)
Streamwise distance at aMxM = (11/2)P1/2h(R2 = 0.23)
Maximum height (Figure 2)HM = (5/9)P4/5h(R2 = 0.82)HM = [PBΦTs1/4]9/1°h(R2 = 0.93)
Maximum periodTM = 9P1/2(h/g)1/2(R2 = 0.33)TM = (19/2)[PTs1/2]1/4(h/g)1/2(R2 = 0.24)
Amplitude evolutiona(x) = (3/5)[P(x/h)−1/3]4/5h(R2 = 0.81)a(x) = (11/10)[P(x/h)−1/3BΦTs3/4]9/1°h(R2 = 0.85)
Height evolutionH(x) = (3/4)[P(x/h)−1/3]4/5h(R2 = 0.80)H(x) = (3/2)[P(x/h)−1/3BΦTs1/2]9/1°h(R2 = 0.89)
Period evolutionT(x) = 9[P(x/h)5/4]1/4(h/g)1/2(R2 = 0.66)T(x) = (13/2)[P(x/h)5/4Ts1/3]1/4(h/g)1/2(R2 = 0.53)
Table 1 summarizes the most relevant empirical equations based on P, all derived from wave channel (2D) tests. This includes the maximum wave amplitude aM (with its location xM), height HM and period TM (Figure 1) and their evolutions a(x), H(x), T(x), with distance x from the slide impact point for both granular [26] and block slides [29]. All these wave parameters simply contain P and the majority of these empirical equations result in large coefficients of determination R2 > 0.80.

2.2. Analytical Aspects

The parameter P allows for the derivation of theoretical aspects which are as universally applicable as P itself. The slide centroid impact velocity Vs on a constant slope defined by α and the dynamic bed friction angle δ may be approximated with an energy balance between the slide release and impact location [30] as
Vs = [2gΔzsc(1 − tanδcotα)]1/2
The parameter Δzsc is the slide centroid drop height distance between slide release and the impact location. Equations (1) and (3) result with A = (2Δzsc)1/2s1/2[ms/(ρwbs)]1/4/h3/2 and f(α) = (1 − tanδcotα)1/2{cos[(6/7)α]}1/2 in
P = A(1 − tanδcotα)1/2{cos[(6/7)α]}1/2 = Af(α)
Figure 3 shows f(α), for a typical dynamic bed friction angle range of 10° ≤ δ ≤ 35°, versus the hill slope angle α. The function f(α) is proportional to P and as such directly proportional to the maximum wave amplitude aM, height HM and period TM and their evolutions a(x), H(x), T(x) with distance x (Table 1). Figure 3 reveals that the hill slope angles resulting in maximum P are in the range 39.1° ≤ αmax ≤ 65.1°. As expected, no impulse wave is generated for α < δ where the slide remains at rest. Further, αmax corresponding to the maximum P value increases with increasing δ. For a hill slope angle α → 90° (glacier calving, rock fall), the effect of the friction angle δ is negligible so that f(α) = 0.47, irrespective of the value of δ.
Figure 3. f(α) ~ P according to Equation (4) for different dynamic bed friction angles δ (°); the typical value δ = 20° results in a slope angle αmax = 51.6°.
Jmse 02 00400 g003
The values for αmax are analytically derived by differentiating Equation (4) with respect to α and set to zero, resulting in
(tanδ/sin2α) = (1 − tanδcotα)tan[(6/7)α]6/7
For the typical value δ = 20°, Equation (5) results in αmax = 51.6° under otherwise constant conditions, which is in agreement with Figure 3. Impulse waves at α ≈ 50° were indeed witnessed, namely in the Alps [8]. Mass movements on such steep mountain flanks, with α close to αmax, in combination with the confined water body geometries of lakes and reservoirs, contribute to the high relevance of landslide generated impulse waves in mountainous regions. The probability for landslides is typically highest at α = 36° to 39° [35]. Even then, only about 10% smaller waves may be expected (for δ = 20°) as compared with the maximum due to the moderate change of f(α) with α between 35° and 75° (Figure 3).

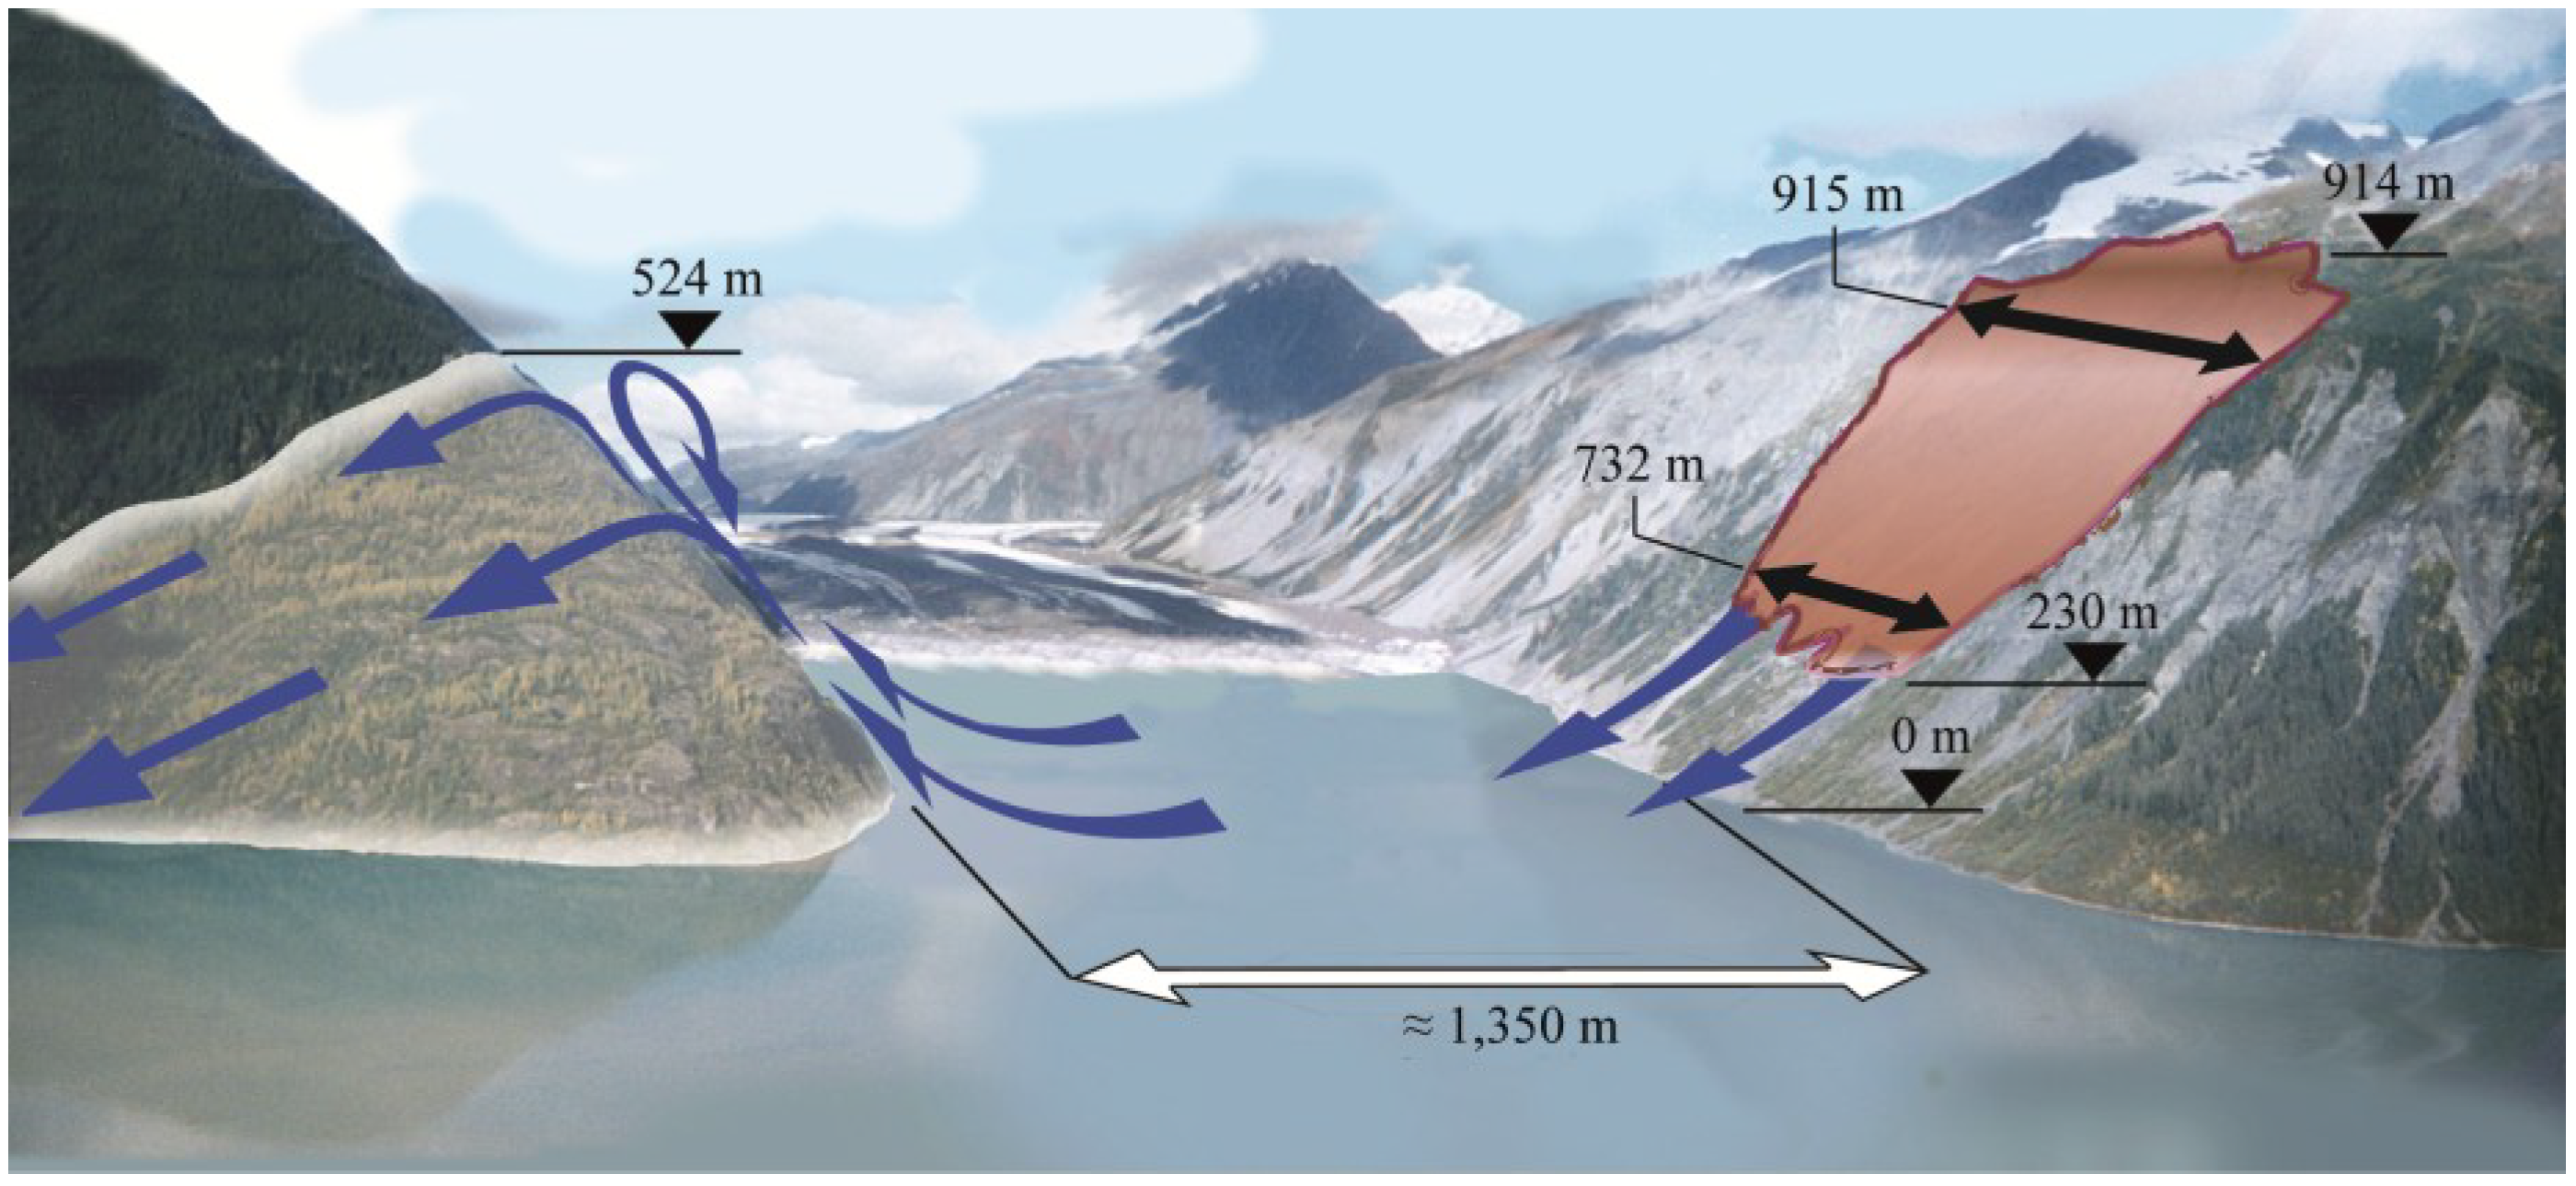
3. Real-World Applications

The well documented 1958 Lituya Bay case [1,16,36] shown in Figure 4 is used to provide an example of a real-world prediction based on P. The T-shaped Lituya Bay is located near the St. Elias Mountains in Alaska, where the main bay is about 12 km long and 1.2 km to 3.3 km wide, except for the 300 m wide exit to the Pacific Ocean. On 9 July 1958, an 8.3 moment magnitude earthquake initiated a rock slide with a grain density of ρg = 2700 kg/m3 sliding from a maximum altitude of 914 m above sea level on a slope of α = 40° (Figure 4). The parameters in P are taken from Heller and Hager [26], namely the slide impact velocity Vs = 92 m/s, still water depth h = 122 m, maximum slide thickness s = 92 m, mean slide width bs = 823 m and slide mass ms = 82.62 × 10⁹ kg. These result in a slide Froude number F = 2.66, a relative slide thickness S = 0.75, a relative slide mass M = 6.74, a hill slope angle α = 40°, so that P = 3.37. The rock slide at Lituya Bay generated an impulse wave with a maximum run-up height of R = 524 m on the opposite shore at a distance x ≈ 1350 m and a run-up angle β = 45°.
Figure 4. Artist’s impression of 1958 Lituya Bay rockslide generating a tsunami of ~162 m in height destroying forest up to maximum run-up height of 524 m (adapted from Heller and Hager [26], with permission from © 2010 American Society of Civil Engineers).
Jmse 02 00400 g004
Fritz et al. [36] investigated the Lituya Bay case in a physical model study and measured an up-scaled wave height of H = 162 m and a wave amplitude of a = 152 m close to the opposite shore at x = 885 m. This wave height is in excellent agreement with the inversely computed value H = 162 m in front of the opposite shore computed with the solitary wave run-up equation of Hall and Watts [37] and R = 524 m.
The prediction of HM shown in Figure 2 results in a maximum wave height of HM = 179 m just in front of the opposite shore (xM = 1232 m based on empirical equation in Table 1) compared to the “observed” wave height of H = 162 m. The small difference is explained with the lateral spread of wave energy (Figure 4), in contrast to the laboratory tests, where any spread was prevented by the side boundaries of the 2D setup. Further, the empirical equation in Table 1 for aM results in aM = 143 m, which is in good agreement with a = 152 m measured at x = 885 m in the physical model [36].
The following examples show that empirical predictions based on P are often conclusive enough to replace expensive prototype specific physical or numerical model studies, or at least to provide well founded recommendations on whether a more expensive investigation is required. Heller et al. [31] provided a generic hazard assessment methodology based on P applicable in both 2D (Table 1) and 3D, including wave generation, propagation and run-up on shores or dams. Fuchs and Boes [8] calibrated and validated this method [31] with a rock fall generated impulse wave observed in 2007 at Lake Lucerne, Switzerland, and predicted then potential future waves at the same location. Preliminary estimates based on P for the planned Kühtai reservoir and hydropower dam in Austria suggested that an impulse wave due to a snow avalanche may overtop the dam so that a detailed prototype specific study was recommended. This was realized by Fuchs et al. [32] at scale 1:130, indicating that the wave only moistens the dam crest without overtopping. Cannata et al. [33] implemented the method of Heller et al. [31] in the open source GIS software GRASS, along with a considerable more time consuming shallow-water equation approach. A comparison of the run-up based on the two approaches for a case study at Lake Como, Italy, resulted in a general agreement of the wave height magnitude. BGC [38] predicted the wave parameters in the slide impact zone based on P for slope failure scenarios in the Mitchell Pit Lake, Canada. The wave propagation and potential dam overtopping were then numerically modelled with TELEMAC-2D with these initial predictions as input values. These examples provide evidence that the parameter P is an efficient tool for first estimates in real-world predictions and for hazard assessment in general.

4. Limitations

Whereas P was developed for subaerial landslide tsunamis (impulse waves), it does not apply to submarine landslide tsunamis [5,9,25,39,40,41]. Although some slide parameters are significant for both phenomena, other parameters not considered in P, including the initial slide submergence, are only relevant for underwater landslide tsunamis. Further, parameters applicable for both cases may not necessarily be relevant in the same ranges and their relative importance for submarine slides may also not be reflected by Equation (1). Finally, subaerial slides often result in considerable air entrainment, in contrast to underwater slides. The application of P to partially submerged slides is currently not investigated.
The parameter P was thus far mainly tested for wave channel (2D) rather than for wave basin (3D) geometries. Even though 2D geometries can reflect real-world cases (e.g. narrow reservoirs, lakes or fjords), the wave propagation is commonly of 3D nature. Transformation methodologies of results from 2D to 3D were presented by Huber and Hager [20], Heller et al. [31] and Heller et al. [42] in which the two latter studies already included P. Several 3D real-world predictions were based on this transformed form of P [8,32,33]. An ongoing project aims to further investigate the transformation of 2D results based on P to other idealized geometries, and future real-world applications are hoped to further confirm the applicability of P to cases with more complex water body geometries and bathymetries.

5. Conclusions

The relevance of the semi-empirical impulse product parameter P was reviewed, which is believed to be the most universal parameter to predict subaerial landslide tsunamis (impulse waves). The parameter P includes all relevant slide parameters affecting the wave generation process in wide test ranges such as densities heavier and lighter than water or slide impact angles between 30° and 90° (Table A1). The parameter P is based on the streamwise slide momentum flux component and it was refined with a multiple regression data analysis of granular slide tests conducted in a laboratory channel (2D) and further confirmed with 2D block model slide tests. Empirical equations based on P allow for a simple prediction of the maximum wave amplitude aM, height HM and period TM and their evolutions a(x), H(x) and T(x) with propagation distance (Table 1). Analytical evidence based on P revealed that the highest waves occur for a slide impact angle of α = 51.6°. The landslide probability is highest for hill slope angles of α = 36 to 39° where only about 10% smaller waves may be expected.
Despite the fact that P was derived under idealized conditions, it is considered a useful and effective parameter for estimates in real-world cases. This was demonstrated for the 1958 Lituya Bay case, where a good agreement between the “observed” and predicted wave heights resulted. Four further real-world studies conducted by other authors involving rock falls at Lake Lucerne, Switzerland; snow avalanches in the planned Kühtai reservoir in Austria; rock falls at Lake Como, Italy; and potential slope failures in Mitchell Pit Lake in Canada, provided evidence that first estimates based on P are often conclusive enough to replace expensive prototype specific physical or numerical model studies, or at least provide well founded recommendations on whether a more expensive investigation is required.
The parameter P applies to subaerial and potentially to partially submerged landslide tsunamis (impulse waves); however, it does not apply to submarine slides. A further limitation of P is its derivation for wave channel (2D) tests. Equations for waves propagating in 3D were proposed based on 2D to 3D transformation methods including P, and real-world applications showed that these equations result in realistic values. In the light of this success, the application of P to more complex water body geometries is the subject of an ongoing research effort.

Acknowledgments

The authors thank H.M. Fritz and A. Zweifel for having provided their experimental data. J. Spinneken is acknowledged for comments on an earlier version of this review. The work was supported by the Swiss National Science Foundation (Grant No. 200020-103480/1) and an Imperial College London Junior Research Fellowship.

Author Contributions

Conceived and designed the experiments: VH of experiments at Imperial College London, WHH of experiments at ETH Zurich. Performed the experiments: VH. Analyzed the data: VH of data obtained at Imperial College London, VH WHH of data obtained at ETH Zurich. Wrote the review: VH. Commented on and improved the review: WHH.

Conflicts of Interest

The authors declare no conflict of interest.

Appendix A: Experimental Methodology

The 2D experiments were conducted in two prismatic wave channels, namely the granular slide tests in an 11 m (L) × 0.500 m (W) × 1 m (H) wave channel at ETH Zurich [26] and the block model slide tests in a 24.5 m (L) × 0.600 m (W) × 1.0 m (H) wave channel at Imperial College London [29]. The channel bottoms consisted of glass sheets and the walls of glass and steel sheets (ETH Zurich, Zurich, Switzerland) or only glass sheets (Imperial College London, London, UK). The parameter ranges of both studies are reported in Table A1 and the coordinate origin (x; z) is defined at the intersection of the still water surface with the hill slope ramp (Figure 1).
Table A1. Limitations of P: Parameter ranges of physical model studies of Heller and Hager [26] and Heller and Spinneken [29].
NameSymbolDimensionHeller and Hager [26]Heller and Spinneken [29]
Slide model typegranularblock
Channel widthb(m)0.5000.600
Still water depthh(m)0.150–0.6750.300, 0.600
Slide thicknesss(m)0.050–0.2490.120
Grain diameterdg(mm)2.0–8.0
Streamwise distancex(m)0–8.900–17.7
Slide impact velocityVs(m/s)2.06–8.770.59–3.56
Bulk slide volume Jmse 02 00400 i001(m3)0.0167–0.06680.0373
Bulk slide densityρs(kg/m3)590–1,7201,534
Slide massms(kg)10.09–113.3057.23
Slide widthbs(m)0.500~0.588, ~0.578, 0.526
Slide front angleφ(°)not systematic investigated30, 45, 60, 90
Transition type(−)nonenone and circular shaped
Hill slope angleα(°)30–9045
Slide Froude numberF(−)0.86–6.830.34–2.07
Relative slide thicknessS(−)0.09–1.640.20–0.40
Relative slide massM(−)0.11–10.020.27–1.21
Relative streamwise distancex/h(−)0–590–40
Impulse product parameterP(−)0.17–8.130.16–1.19
Number of testsi(−)434144
The granular slide material in the 434 tests at ETH Zurich (Zurich, Switzerland) was accelerated in a box with up to 8 bar air pressure with a pneumatic landslide generator [22]. Once the box reached its maximum velocity, its front flap opened, the slide left the box, slid down on a 3 m long hill slope ramp and generated the impulse waves. The whole pneumatic landslide generator was adjustable to various still water depths h and slide impact angles α and the box height and length was also adjustable such that various bulk slide volumes Vs and slide heights s could be investigated (Table A1). The pneumatic landslide generator allowed for a systematic and independent variation of all governing parameters included in P. The granular slide materials, made of barium-sulphate (BaSO4) and polypropylene (PP), consisted of four cylindrically shaped grains of diameter of dg = 2 to 8 mm of densities heavier (ρs ≈ 1720 kg/m3) and lighter (ρs ≈ 590 kg/m3) than water. Mixtures of different grain diameters and densities were also included in the test program. However, the grain diameter and grain size distribution were found to have a negligible effect on the wave features and are not included in P. A small fraction of the tests was conducted at a small water depth h = 0.150 m where scale effects relative to the wave amplitude and height, in comparison with the remaining model tests, may be up to about 15% [43]. Figure 2 supports this statement showing that these tests resulted in a slightly smaller maximum wave height than predicted by the corresponding empirical equation in Table 1. The main measurement techniques included two Laser Distance Sensors (LDS) [44] to scan the slide profiles (estimated accuracy ± 0.5 mm) at 100 Hz, seven capacitance wave gauges to record the wave profiles (±1.5 mm) at 500 Hz at relative distances of up to x/h = 59.0 and Particle Image Velocimetry (PIV) [45] for determining the velocity vector fields in the slide impact zone. All three measurement systems were triggered simultaneously with the start bottom of the pneumatic landslide generator [26].
The 144 block model slide experiments at Imperial College London (London, UK) involved a hill slope ramp of constant front angle α = 45° (Table A1). The ramp’s front surface consisted of PVC sheets and a stainless steel guide in the center matching a groove in the slide bottom to assure that the slide stayed in the channel center during impact. The four slides, one for each slide front angle φ, were also made of PVC. They were moved in the raised position with a pulley system and released with a mechanism fitted to the slide surface. The glass bottom in the immediate slide impact was protected with a 1 m long rubber sheet covered with a thin stainless steel plate. The slide was either brought to an immediate rest at the slope bottom with mastic sealant or it run out further over a circular-shaped transition made of an aluminum sheet bent to an eighth of a circle of radius 0.400 m. The test program included three specific block model parameters, namely three blockage ratios B = bs/b = 0.88, 0.96 and 0.98 (varied with PVC additions mounted at the sides of the slides), four slide front angles φ = 30, 45, 60 and 90° and two transition types, in addition to different slide parameters (Table A1). The slide impact velocity Vs was measured with a LDS [44]. A PVC strip with holes at constant intervals was bounded on the surface of each slide and this strip was scanned at 128 Hz with the LDS. The slide velocity was then calculated with the information about the spatial and temporal intervals between neighboring holes. The wave features (±1.5 mm) were measured with seven resistance type wave gauges at 128 Hz at a relative distances of up to x/h = 40.0 (Table A1) [29].

References

  1. Miller, D.J. Giant Waves in Lituya Bay, Alaska; Geological Survey Professional Paper No. 354-C; U.S. Government Printing Office: Washington, DC, USA, 1960.
  2. Slingerland, R.L.; Voight, B. Occurrences, properties and predictive models of landslide-generated impulse waves. In Rockslides and Avalanches; Voight, B., Ed.; Elsevier: Amsterdam, The Netherlands, 1979; Volume 2, pp. 317–397. [Google Scholar]
  3. Ward, S.N. Landslide tsunami. J. Geophys. Res. 2001, 106, 11201–11215. [Google Scholar] [CrossRef]
  4. Synolakis, C.E.; Bardet, J.-P.; Borrero, J.C.; Davies, H.L.; Okal, E.A.; Silver, E.A.; Sweet, S.; Tappin, D.R. The slump origin of the 1998 Papua New Guinea Tsunami. Proc. R. Soc. Lond. A 2002, 458, 763–789. [Google Scholar] [CrossRef]
  5. Masson, D.G.; Harbitz, C.B.; Wynn, R.B.; Pedersen, G.; Løvholt, F. Submarine landslides: Processes, triggers and hazard prediction. Philos. Trans. R. Soc. A 2006, 364, 2009–2039. [Google Scholar]
  6. WCHL. Hydraulic Model Studies—Wave Action Generated by Slides into Mica Reservoir—British Columbia. Report; Western Canada Hydraulic Laboratories: Vancouver, Canada, 1970. [Google Scholar]
  7. Løvholt, F.; Pedersen, G.; Gisler, G. Oceanic propagation of a potential tsunami from the La Palma Island. J. Geophys. Res. 2008, 113, C09026. [Google Scholar] [CrossRef]
  8. Fuchs, H.; Boes, R. Berechnung felsrutschinduzierter Impulswellen im Vierwaldstättersee. Wasser Energ. Luft 2010, 102, 215–221. [Google Scholar]
  9. Watt, S.F.L.; Talling, P.J.; Vardy, M.E.; Heller, V.; Hühnerbach, V.; Urlaub, M.; Sarkar, S.; Masson, D.G.; Henstock, T.J.; Minshull, T.A.; et al. Combinations of volcanic-flank and seafloor-sediment failure offshore Montserrat, and their implications for tsunami generation. Earth Planet. Sci. Lett. 2012, 319–320, 228–240. [Google Scholar] [CrossRef]
  10. Kremer, K.; Simpson, G.; Girardclos, S. Giant Lake Geneva tsunami in AD 563. Nat. Geosci. 2012, 5, 756–757. [Google Scholar] [CrossRef]
  11. Ward, S.N.; Day, S. Ritter Island Volcano—Lateral collapse and the tsunami of 1888. Geophys. J. Int. 2003, 154, 891–902. [Google Scholar] [CrossRef]
  12. Monaghan, J.J.; Kos, A.; Issa, N. Fluid motion generated by impact. J. Waterw. Port C-ASCE 2003, 129, 250–259. [Google Scholar] [CrossRef]
  13. Quecedo, M.; Pastor, M.; Herreros, M.I. Numerical modeling of impulse wave generated by fast landslides. Int. J. Numer. Methods Eng. 2004, 59, 1633–1656. [Google Scholar] [CrossRef]
  14. Liu, P.L.-F.; Wu, T.-R.; Raichlen, F.; Synolakis, C.E.; Borrero, J.C. Runup and rundown generated by three-dimensional sliding masses. J. Fluid Mech. 2005, 536, 107–144. [Google Scholar] [CrossRef]
  15. Lynett, P.; Liu, P.L.-F. A numerical study of the run-up generated by three-dimensional landslides. J. Geophys. Res. 2005, 110, C03006. [Google Scholar] [CrossRef]
  16. Schwaiger, H.F.; Higman, B. Lagrangian hydrocode simulations of the 1958 Lituya Bay tsunamigenic rockslide. Geochem. Geophy. Geosyst. 2007, 8, 1–7. [Google Scholar]
  17. Bascarini, C. Computational fluid dynamics modelling of landslide generated water waves. Landslides 2010, 7, 117–124. [Google Scholar] [CrossRef]
  18. Abadie, S.M.; Morichon, D.; Grilli, S.; Glockner, S. Numerical simulation of waves generated by landslides using a multiple-fluid Navier-Stokes model. Coast. Eng. 2010, 57, 779–794. [Google Scholar] [CrossRef]
  19. Abadie, S.M.; Harris, J.C.; Grilli, S.T.; Fabre, R. Numerical modeling of tsunami waves generated by the flank collapse of the Cumbre Viejo Volcano (La Palma, Canary Islands): Tsunami source and near field effects. J. Geophys. Res. 2012, 117, C05030. [Google Scholar] [CrossRef]
  20. Huber, A.; Hager, W.H. Forecasting impulse waves in reservoirs. In Proceedings of 19th Congrès des Grands Barrages, Florence, Italy, 26–30 May 1997; pp. 993–1005.
  21. Walder, J.S.; Watts, P.; Sorensen, O.E.; Janssen, K. Tsunamis generated by subaerial mass flows. J. Geophys. Res. 2003, 108. [Google Scholar] [CrossRef]
  22. Fritz, H.M.; Hager, W.H.; Minor, H.-E. Near field characteristics of landslide generated impulse waves. J. Waterw. Port C-ASCE 2004, 130, 287–302. [Google Scholar] [CrossRef]
  23. Panizzo, A.; De Girolamo, P.; Petaccia, A. Forecasting impulse waves generated by subaerial landslides. J. Geophys. Res. 2005, 110, C12025. [Google Scholar] [CrossRef]
  24. Zweifel, A.; Hager, W.H.; Minor, H.-E. Plane impulse waves in reservoirs. J. Waterw. Port C-ASCE 2006, 132, 358–368. [Google Scholar] [CrossRef]
  25. Enet, F.; Grilli, S.T. Experimental study of tsunami generation by three-dimensional rigid underwater landslides. J. Waterw. Port C-ASCE 2007, 133, 442–454. [Google Scholar] [CrossRef]
  26. Heller, V.; Hager, W.H. Impulse product parameter in landslide generated impulse waves. J. Waterw. Port C-ASCE 2010, 136, 145–155. [Google Scholar] [CrossRef]
  27. Heller, V.; Hager, W.H. Wave types of landslide generated impulse waves. Ocean Eng. 2011, 38, 630–640. [Google Scholar] [CrossRef]
  28. Mohammed, F.; Fritz, H.M. Physical modeling of tsunamis generated by three-dimensional deformable granular landslides. J. Geophys. Res. 2012, 117, C11015. [Google Scholar] [CrossRef]
  29. Heller, V.; Spinneken, J. Improved landslide-tsunami predictions: Effects of block model parameters and slide model. J. Geophys. Res. 2013, 118, 1489–1507. [Google Scholar] [CrossRef]
  30. Körner, H.J. Reichweite und Geschwindigkeit von Bergstürzen und Fliessschneelawinen. Rock Mech. 1976, 8, 225–256. [Google Scholar] [CrossRef]
  31. Heller, V.; Hager, W.H.; Minor, H.-E. Landslide generated impulse waves in reservoirs—Basics and computation. In VAW-Mitteilung 211; Boes, R., Ed.; Swiss Federal Institute of Technology (ETH) Zurich: Zurich, Switzerland, 2009. [Google Scholar]
  32. Fuchs, H.; Pfister, M.; Boes, R.; Perzlmaier, S.; Reindl, R. Impulswellen infolge Lawineneinstoss in den Speicher Kühtai. Wasserwirtschaft 2011, 101, 54–60. [Google Scholar]
  33. Cannata, M.; Marzocchi, R.; Molinari, M.E. Modeling of landslide-generated tsunamis with GRASS. Trans. GIS 2012, 16, 191–214. [Google Scholar]
  34. Fuchs, H.; Winz, E.; Hager, W.H. Underwater landslide characteristics from 2D laboratory modeling. J. Waterw. Port C-ASCE 2013, 139, 480–488. [Google Scholar] [CrossRef]
  35. Larsen, I.J.; Montgomery, D.R. Landslide erosion coupled to tectonics and river incision. Nat. Geosci. 2012, 5, 468–473. [Google Scholar] [CrossRef]
  36. Fritz, H.M.; Hager, W.H.; Minor, H.-E. Lituya Bay case: Rockslide impact and wave run-up. Sci. Tsunami Hazards 2001, 19, 3–22. [Google Scholar]
  37. Hall, J.V.; Watts, G.M. Laboratory Investigation of the Vertical Rise of Solitary Wave on Impermeable Slopes; Technical Memo Report No. 33; U.S. Army Corps of Engineers, Beach Erosion Board: Washington, DC, USA, 1953.
  38. BGC. Mitchell Pit Landslide Generated Wave Modelling. Appendix 4-E; BGC Engineering Inc.: Vancouver, BC, Canada, 2012. [Google Scholar]
  39. Watts, P. Tsunami features of solid block underwater landslide. J. Waterw. Port C-ASCE 2000, 126, 144–152. [Google Scholar]
  40. Bardet, J.-P.; Synolakis, C.E.; Davies, H.L.; Imamura, F.; Okal, E.A. Landslide tsunamis: Recent findings and research directions. Pure Appl. Geophys. 2003, 160, 1793–1809. [Google Scholar] [CrossRef]
  41. Najafi-Jilani, A.; Ataie-Ashtiani, B. Estimation of near-field characteristics of tsunami generation by submarine landslide. Ocean Eng. 2008, 35, 545–557. [Google Scholar]
  42. Heller, V.; Moalemi, M.; Kinnear, R.D.; Adams, R.A. Geometrical effects on landslide-generated tsunamis. J. Waterw. Port C-ASCE 2012, 138, 286–298. [Google Scholar]
  43. Heller, V.; Hager, W.H.; Minor, H.-E. Scale effects in subaerial landslide generated impulse waves. Exp. Fluids 2008, 44, 691–703. [Google Scholar] [CrossRef]
  44. Dorsch, R.G.; Häusler, G.; Herrmann, J.M. Laser triangulation: Fundamental uncertainty in distance measurement. Appl. Opt. 1994, 33, 1306–1314. [Google Scholar] [CrossRef]
  45. Raffel, M.; Willert, C.E.; Kompenhans, J. Particle Image Velocimetry—A Practical Guide; Springer: Berlin, Germany, 1998. [Google Scholar]

