Article

Study on Cavitation Flow Structure Evolution in the Hump Region of Water-Jet Pumps Under the Valley Condition

1
National Research Center of Pumps, Jiangsu University, Zhenjiang 212013, China
2
R&D Department, Wuhan Second Ship Design and Research Institute, Wuhan 430064, China
*
Authors to whom correspondence should be addressed.
J. Mar. Sci. Eng. 2025, 13(8), 1598; https://doi.org/10.3390/jmse13081598
Submission received: 26 June 2025 / Revised: 31 July 2025 / Accepted: 20 August 2025 / Published: 21 August 2025
(This article belongs to the Section Ocean Engineering)

Abstract

During the hydraulic performance experiment, significant vibration and noise were observed in the mixed-flow pump operating in the hump region. Cavitation occurrence in the impeller flow channels was confirmed through the transparent chamber. To analyze cavitation flow structure evolution in the mixed-flow pump, this paper integrates numerical and experimental approaches, capturing cavitation flow structures under the valley condition through high-speed photography technology. During the various stages of cavitation development, the cavitation forms are mostly vortex cavitation, cloud cavitation, and perpendicular vortex cavitation. Impeller rotation induces downstream transport of shedding cloud cavitation shedding structures. Flow blockage occurs when cavitation vortexes obstruct specific passages, accelerating cavitation growth that culminates in head reduction through energy dissipation mechanisms. Vortex evolution analysis revealed enhanced density of small-scale vortex structures with stronger localized core intensity in the impeller and diffuser. Despite larger individual vortex scales, reduced core intensity persists throughout the full flow domain. Concurrently, velocity profile characteristics across flow rates and blade sections (spanwise from tip to root) indicate heightened predisposition to flow separation, recirculation zones, and low-velocity regions during off-design operation. This study provides scientific guidance for enhancing anti-cavitation performance in the hump region.

1. Introduction

The water-jet pump is the core component of the water-jet propulsor, undertaking the important function of converting mechanical energy into fluid kinetic energy. Due to spatial constraints in carrier installation and layout, diffuser-equipped mixed-flow pumps are typically the preferred configuration for water-jet systems. However, mixed-flow pumps with high specific speeds are prone to developing the hump region at the head-flow curve, as shown in Figure 1. If in the hump region, both pumps and even the whole system may have problems such as increased vibration and abnormal noise [1,2,3,4].
Regarding the causes of the hump phenomenon in the pump head curve, scholars have conducted extensive research on various types of pumps. For centrifugal pumps, Liu [5] found that the stress on the final drainage pipe is significant in SSE earthquake responses, which is a key consideration in the design and development of molten salt pumps. For axial flow pumps, the hump phenomenon is generally considered to be associated with backflow [6,7,8,9]. The axial slotting method is commonly used to prevent flow separation, which can reduce backflow vortex, secondary flow losses, and channel blockages, thereby improving the hump phenomenon [10,11]. For mixed-flow pumps, Cheng [12] suggests that humps near the optimal operating condition are mainly caused by increased hydraulic loss.
The mixed-flow pump is a type of pump that integrates the characteristics of centrifugal pumps and axial flow pumps. It exhibits the high lift of centrifugal pumps and the large flow rate characteristics of axial flow pumps. The design of the mixed-flow pump allows it to efficiently handle liquid flows across a wide operating range. The main types include volute mixed-flow pumps, water-jet pumps, submersible mixed-flow pumps, pipeline booster pumps, and industrial mixed-flow pumps, among others. They play an important role in industrial production, agricultural irrigation, water conservation projects, urban water supply systems, sewage treatment, and water diversion projects. The water-jet pump is a specialized type of mixed-flow pump primarily used in propulsion systems, and it is also commonly utilized in high-speed and specialized ships.
Some scholars have conducted studies on cavitation. Long [13,14,15,16] captured the evolution of the cavitation flow structure and analyzed its impact on pump performance. Kumar [17] employed LDV measurements to quantify cavitation flow characteristics, validating numerical cavitation models through velocity field comparisons. Akira [18] measured the liquid flow rate inside the nozzle, utilized LDV to measure nozzle flow rates, and analyzed the effect of cavitation on the flow. Huang [19] applied PIV to capture the velocity information of an airfoil’s cavitation windings and established a correlation between the vorticity transport and the cyclic process of cavitation vacuoles, from incipient to collapse. Zhang [20] characterized initial cavitation on pump models via the test bench, calculating impeller airfoil pressure distributions. The results showed that initial cavitation in blade regions affected the impeller’s external characteristics. Westhuizne [21] identified complex interdependencies among cavitation erosion, impeller geometry, operating conditions, and material properties. Specifically, low-flow inlet backflow intensifies impeller cavitation erosion. Hua [22] identified leakage flow from the blade surface to trailing edges within tip clearance gaps, forming tip leakage vortex cavitation. This phenomenon is commonly observed in pumps, turbines, and ducted propellers. To reduce erosion of the pump casing by tip-wall vortex cavitation, the optimal cavitation tip gap should be minimized. Subar [23] concluded that the optimal gap-to-maximum leaf tip thickness ratio should be less than 0.15. Li [24,25] visualized cavitation bubble dynamics in centrifugal pumps via visual experimental devices. The results show that, as the flow rate increases, the cavitation bubble area in the centrifugal pump gradually moves towards the outlet under the action of centrifugal force. This makes it easy for the flow channel to become blocked, which greatly impacts the pump’s performance. Huang et al. [26] conducted numerical simulations of transient cavitating flow in a water-jet pump under non-uniform inflow conditions. Their research revealed the impact of cavitation on unsteady flow within the pump, demonstrated the characteristics of non-uniform inflow and cavitating flow in the pump, and explored the correlation mechanism between cavitation and vorticity diffusion. Kim et al. [27] revealed through numerical simulations that in a mixed-flow water-jet pump, the finite number of guide vane blades generates pressure and velocity differentials between the leading and trailing sides of the blades. This leads to extensive flow separation zones developing on the suction surfaces of the diffuser, extending toward the flow passage outlet and near the nozzle. The resulting breakaway vortices form obstruction lines that significantly degrade the hydraulic performance of the water-jet pump. Gong et al. [28] numerically investigated the dynamic mechanisms of tip leakage vortex cavitation in a water-jet pump under varying flow rates. Using the Q-criterion, they visualized cavitation vortex structures whose evolution aligned with experimental cavitation patterns. They found that with increasing flow rate, the locations of maximum and minimum pressure difference on the blade suction surface migrate toward the trailing edge. Zhao [29] investigated the dynamic characteristics of impeller cavitation structures through cavitation visualization experiments and numerical simulations. It was discovered that during cavitation development, adjacent blades exhibit divergent cavitation evolution trends due to phase effects. Phase effects significantly influence blade cavitation development, thereby affecting the stability of impeller excitation forces. Arakeri [30] observed in cavitation studies on axisymmetric bodies that the cavitation separation point occurs downstream of the laminar separation point and demonstrated that the distance between these separation points primarily depends on the Reynolds number. Ceccio [31] found that boundary instability in head cavitation of axisymmetric bodies, regardless of flow separation, causes local shedding of attached cavities. Xu [32] investigated cavitation-vortex interactions in the tip clearance region using high-speed imaging technology, coupled with numerical simulations employing the Scale-Adaptive Simulation (SAS) turbulence model and Zwart-Gerber-Belamari (ZGB) cavitation model. This approach validated the accuracy of the numerical methodology. Huang [33] employed the Reynolds-Averaged Navier-Stokes (RANS) method to numerically simulate transient cavitating flow within a water-jet pump under non-uniform inflow conditions. The study examined the impact of cavitation on unsteady internal flow, demonstrated the characteristics of non-uniform inflow and cavitating flow inside the pump, and analyzed the correlation mechanism between cavitation and vorticity diffusion. In summary, our teams have studied the hump phenomenon in the early stage [34,35,36]. Long [34] quantified cavitating flow structures in the water-jet pump hump region through synchronized high-speed imaging and closed-loop test rig measurements. Dimensionless analysis elucidated cavitation evolution mechanisms. Using orthogonal design, Long [35] optimized blade geometry (inlet/outlet angles) through numerical simulation. A custom MATLAB 2013 script computed the Hump Severity Index (HSI) to quantify hump intensity. Han [36] applied the SST k-ω turbulence model to map vorticity, turbulent kinetic energy, and entropy production distributions in hump regions under peak/trough conditions. Comparative analysis revealed significant flow disparities correlated with energy dissipation mechanisms. Concurrently, we also analyzed the related mechanism of energy dissipation in the hump region [36,37,38], including pressure pulsation, vortex structure in the pump, and turbulent kinetic energy in the pump leading to energy dissipation. To improve the performance of the hump region, we increased the radius and angle of the runner outlet to reduce the occurrence and development of the backflow [39,40]. However, cavitation dynamics in the hump region remain inadequately characterized. This study employs high-speed cavitation visualization to quantify flow structure in a mixed-flow pump. We will present from the numerical and experimental point of view, in addition to the two approaches and analyze the cavitation flow structure evolution at different cavitation development stages under the valley condition. The valley condition refers specifically to the operating condition where the head reaches the minimum value in the hump region. When the Q-H curve of the pump has a hump phenomenon, the curve will show the characteristics of first falling, then rising, and then falling. The point with the lowest head is the valley point, and the corresponding working condition is the valley condition.

2. Research on Numerical Simulation Method

2.1. Numerical Calculation Model

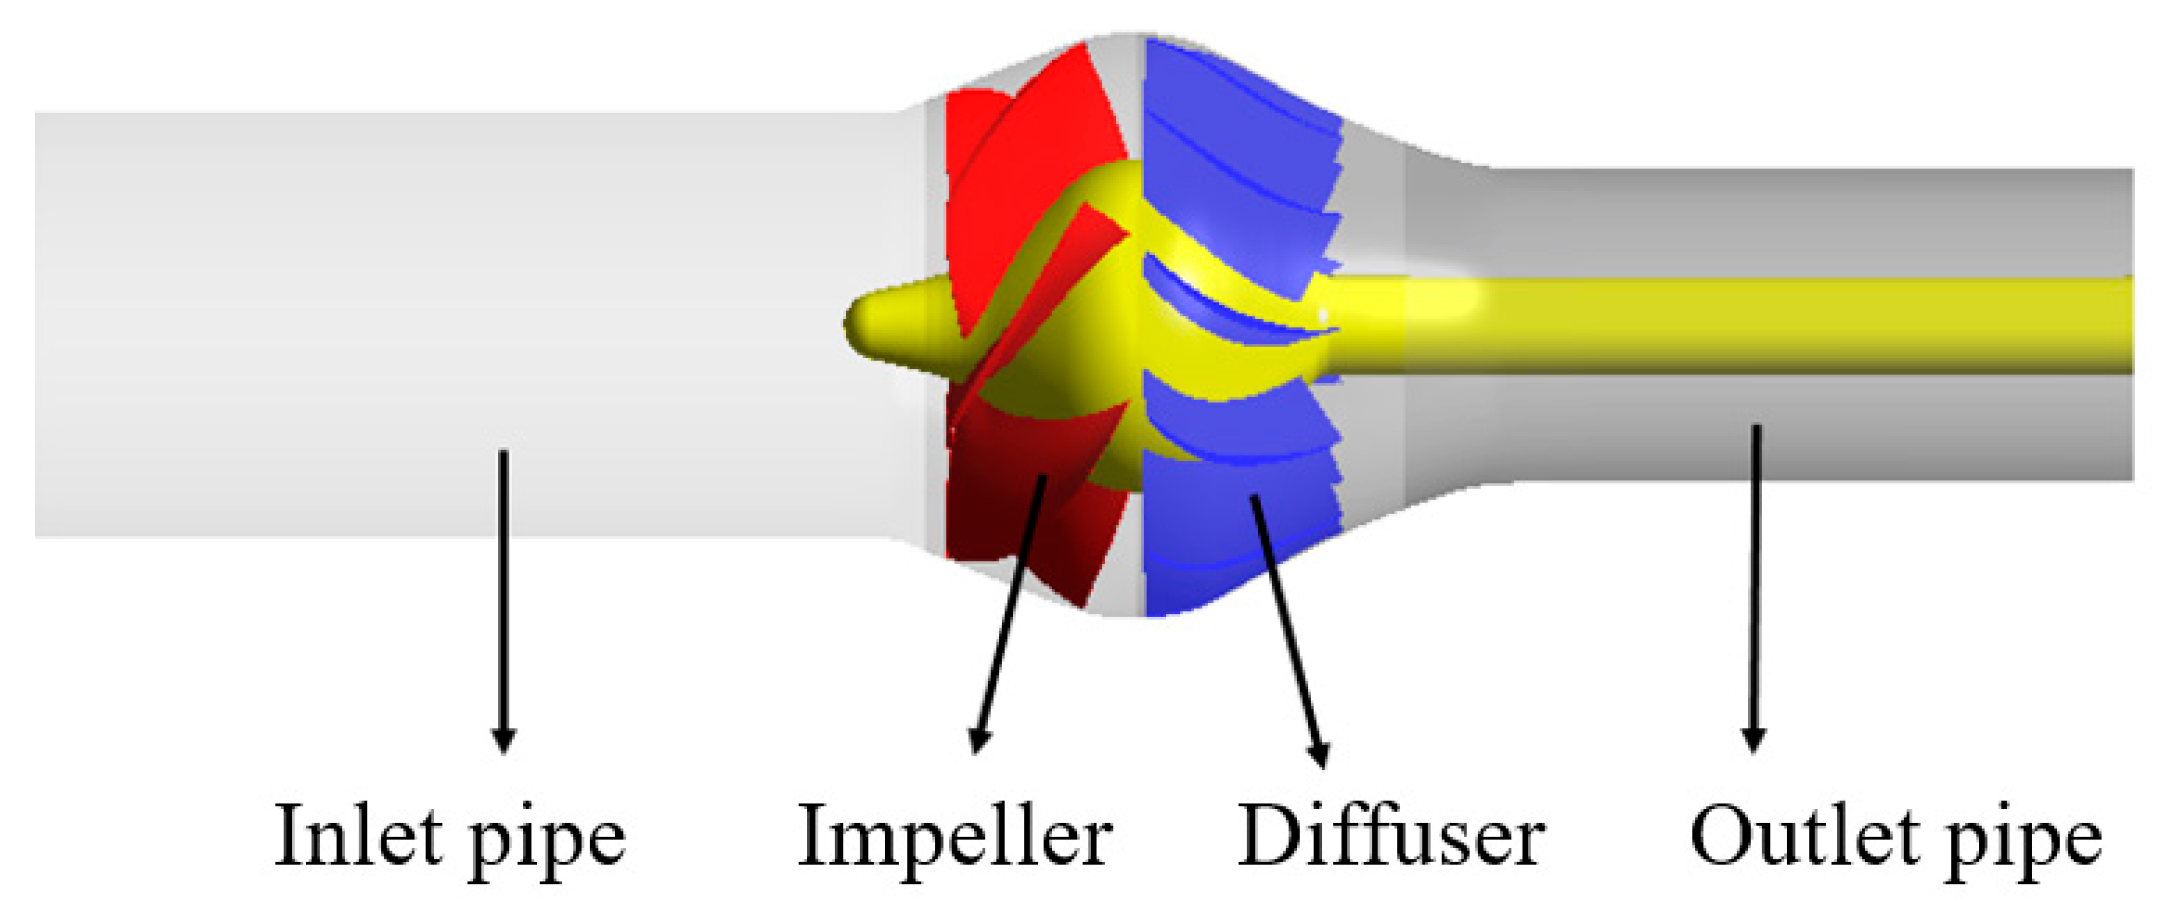
The calculation model of this paper is shown in Figure 2, comprising the inlet pipe, impeller, diffuser, and outlet pipe. In the numerical simulation, we used ANSYS 2021 to calculate the hydraulic performance of the model pump. The software exhibits high accuracy and reliability in addressing fluid flow problems, especially in simulating complex flow in rotating machinery. It can better capture phenomena such as dynamic-static interference, flow separation, and cavitation between the impeller and diffuser in the pump, thereby providing an effective numerical tool for analyzing the evolution of cavitation flow structures in the hump region.

2.2. Mesh Generation

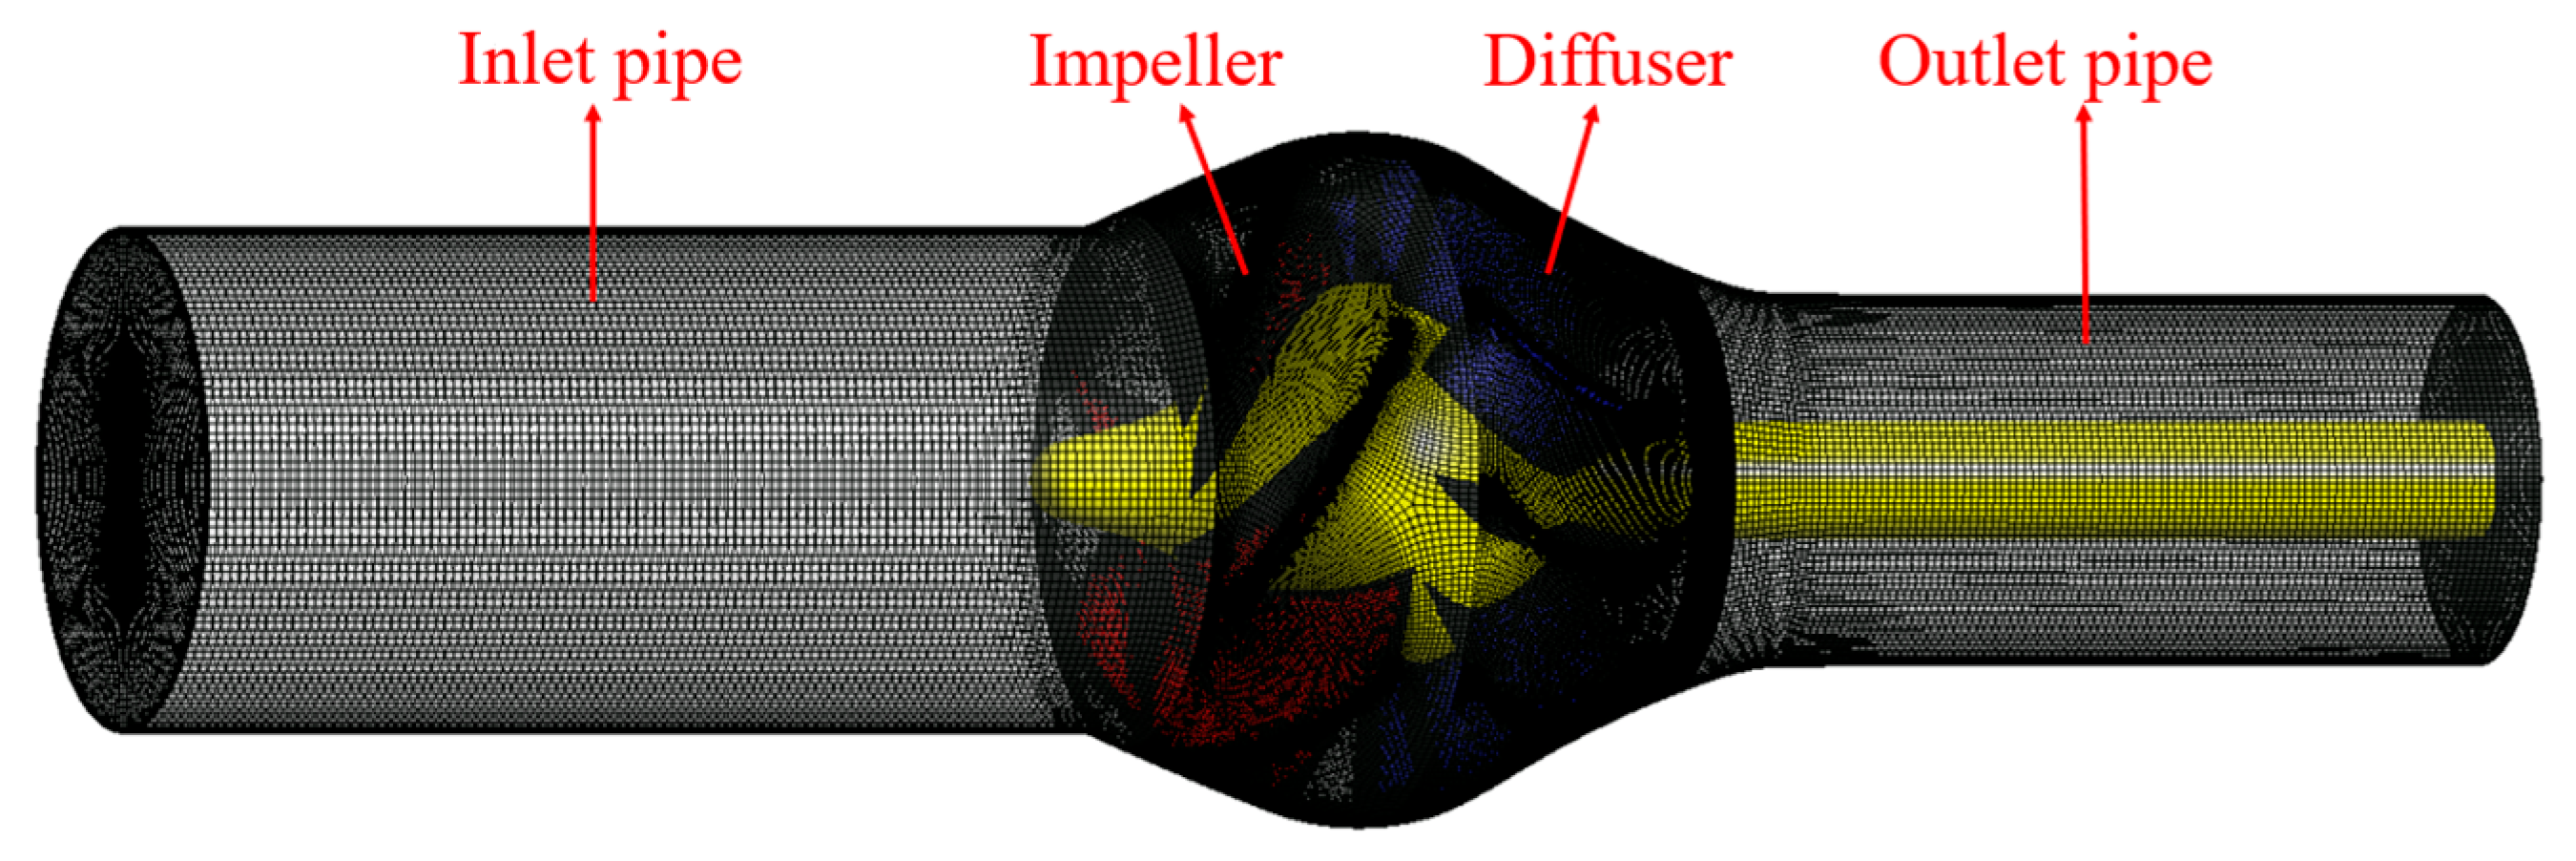
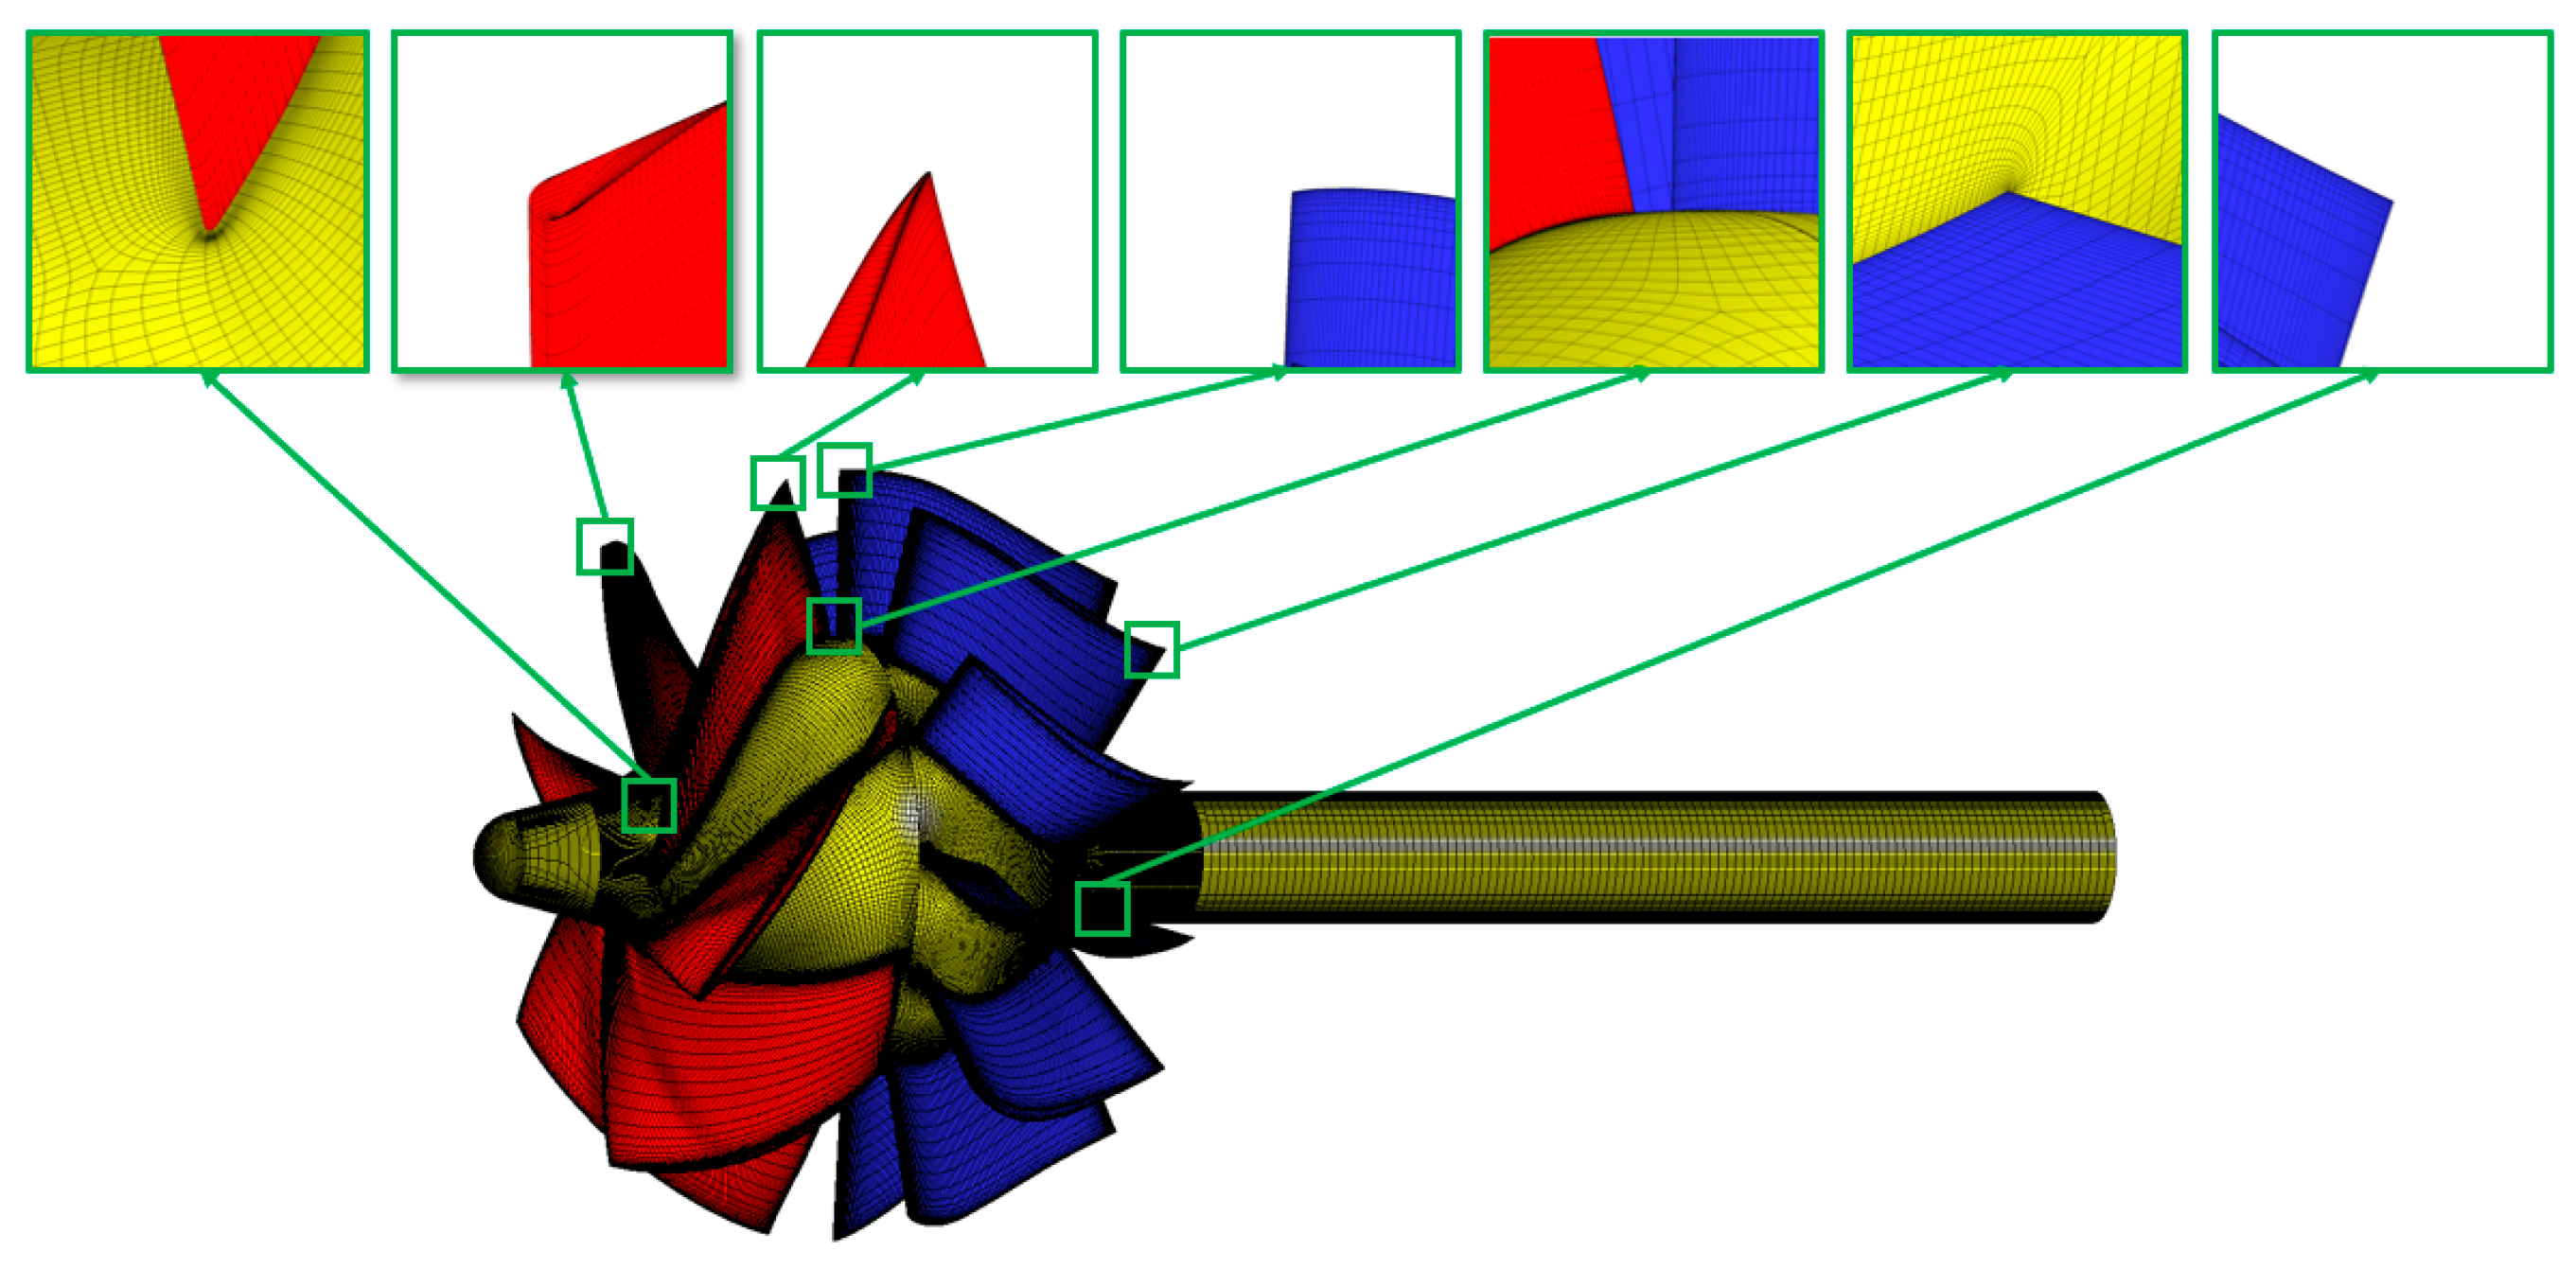
Mesh generation was performed for the fluid domains of the impeller, diffuser, inlet pipe, and outlet pipe. The computational grid is shown in Figure 3. The local grids of hydraulic components are illustrated in Figure 4. All meshes underwent boundary layer refinement. The y+ values for each component are shown in Table 1. Currently, the first layer grid is in the viscous bottom layer, which meets the calculation requirements of the SST k-ω turbulence model.

2.3. Control Equation

In the numerical simulation process of this paper, the fluid medium is incompressible viscous water. Since the temperature of a conventional pump remains nearly constant during operation, the effects of heat transfer and heat exchange are neglected in the calculations. The expressions of the control equations are as follows:
(1)
Continuity equation
ρ t + ρ u x + ρ v y + ρ w z = 0
In the formula, t is time; u is the velocity component of the fluid in the x direction; v is the velocity component of the fluid in the y direction; w is the velocity component of the fluid in the z direction.
(2)
Momentum conservation equation
The mathematical expression of the momentum conservation equation is as follows:
ρ u t + u u x + v u y + w u z = p x + μ τ x x x + τ y x y + τ z x z + ρ F x
ρ v t + u v x + v v y + w v z = p x + μ τ x y x + τ y y y + τ z y z + ρ F y
ρ w t + u w x + v w y + w w z = p z + μ τ x z x + τ y z y + τ z z z + ρ F z
In the formula, μ is the dynamic viscosity; τ is the viscous force component; and f is the volume force component.

2.4. Turbulence Model

The Navier-Stokes (N-S) equations can be used to directly solve for fluid flow under laminar conditions. However, fluid flow in practical engineering applications is mostly turbulent. Turbulence is a complex, large-scale flow process occurring in three-dimensional space and is ubiquitous in engineering applications. The N-S equations become less effective for directly solving turbulent fluid flow in complex flow domains. Therefore, it is necessary to apply appropriate averaging processing to the N-S equations to derive the Reynolds Averaged Navier-Stokes (RANS) equations. Different mathematical formulations are then introduced to encapsulate the turbulence effects, forming various turbulence models.
Selecting an appropriate turbulence model is crucial for numerical calculations. To obtain energy characteristic curves closer to experimental data, four commonly used turbulence models in practical engineering were selected for preliminary numerical simulation comparison: the Standard k-ε model, RNG k-ε model, Standard k-ω model, and SST k-ω model. The Standard k-ε model is widely applied, offers good convergence, and has low memory requirements. However, it performs poorly in simulating complex flows with high curvature, strong pressure gradients, or swirl. The RNG k-ε model can simulate complex flows such as separated flows, secondary flows, swirls, and jets, but it is often limited by the assumption of isotropic eddy viscosity. The Standard k-ω model is suitable for simulating boundary layer flows, separation, and transition under adverse pressure gradients, but suffers from poorer convergence. The SST k-ω model integrates the strengths of the Standard k-ε model in free-stream calculations and the Standard k-ω model in near-wall calculations. However, due to its strong dependence on wall distance, it is less suitable for free shear flows.
Pumps exhibit significant flow separation and backflow phenomena in the hump region and under low-flow operating conditions. The SST k-ω model is well-suited for simulating these conditions, and the calculated results closely match experimental data. Therefore, after comprehensive consideration, the SST k-ω model was adopted for numerical calculations in this study. This model was first proposed by Menter [41,42,43], and its mathematical expressions are shown below:
ρ k t + ρ k u i x i = x j μ + μ t σ k 3 k x j + P k β ρ k ω
( ρ ω ) t + ( ρ ω u i ) x i = x j μ + μ t σ ω 3 ( ω ) x j + α 3 ω k p k β 3 ρ ω 2 + 2 ( 1 F 1 ) ρ 1 ω σ ω 2 k x j ω x j
In the equations, β* = 0.09; and Pk represents the turbulence production term.

2.5. Cavitation Model

The cavitation flow in the water-jet pump is characterized by high shear and transient phase change. The mass exchange between gas and liquid phases needs to be described by mass transfer equations. The cavitation model is a model used to describe the mutual transformation between gas and liquid phases during flow. It simplifies the cavitation flow model and converts it into a non-slip mixed fluid model. There are various cavitation models based on the Rayleigh-Plesset equation, such as the ZGB cavitation model, Kunz cavitation model, and Schnerr-Sauer cavitation model [44]. Among them, the ZGB model is integrated in ANSYS CFX and is known for its high convergence and prediction accuracy. This paper selects the ZGB cavitation model to study the cavitation flow inside the waterjet pump. Its expression is as follows:
ρ ν α ν t + ρ ν α ν u   =   m ˙ + + m ˙
m ˙ + = F vap 3 α ruc 1 α ν ρ ν R B 2 3 p ν p ρ l , p     p ν
m ˙ = F cond 3 α ν ρ ν R B 2 p p ν 3 , p   >   p ν
In the formula, α is the volume fraction of gas phase; rnuc is the volume fraction of gas core; pv represents the saturated vapor pressure at room temperature; RB represents the bubble radius at the nucleation position; Fvap and Fcond represent the empirical parameters in the gasification and compression process, respectively. The parameters are set as follows: rnuc = 5 × 10⁻⁴, pv = 3574 Pa, RB = 1 × 10⁻⁶ m, Fvap = 50, and Fcond = 0.01.

2.6. Boundary Condition

The commercial software ANSYS 2021 was used for the hydraulic performance calculations of the model pump. The details of the boundary condition are shows in Table 2, as follows:

2.7. Mesh Independence Verification

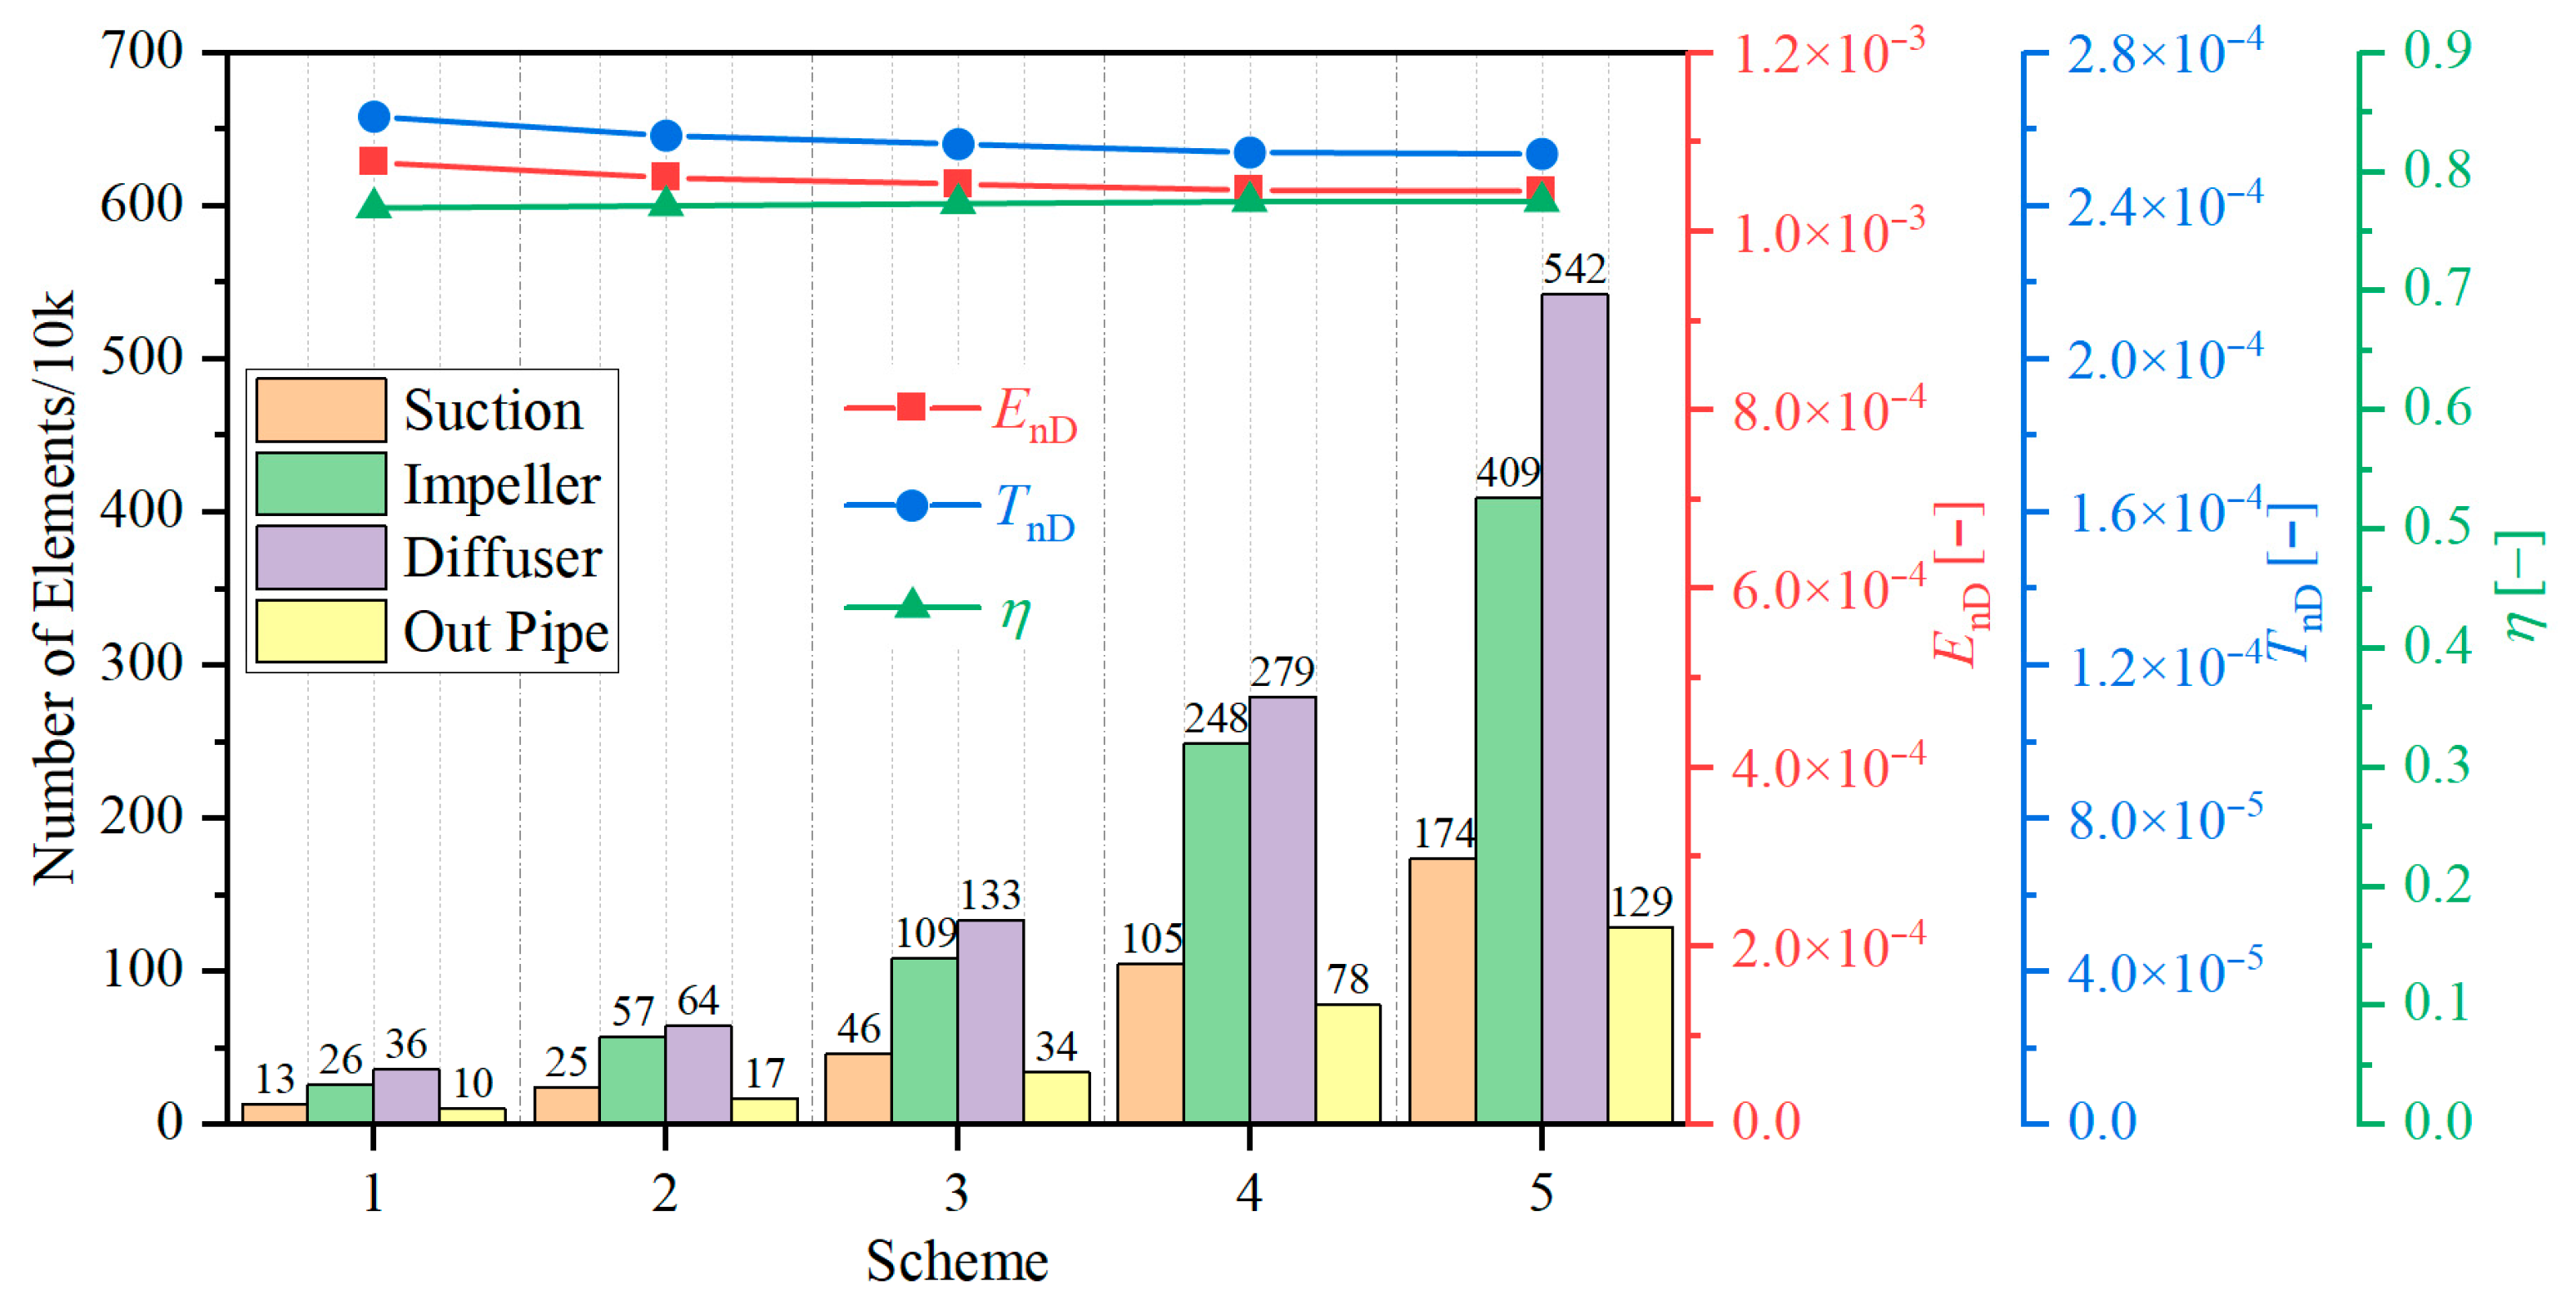
Figure 5 shows the composition of grid numbers for different schemes and its CFD results [36]. The total number of meshes is 12.54 million, and the mesh quantities of components such as the inlet pipe, impeller, diffuser, and outlet pipe are 1.74 million, 4.09 million, 5.42 million, and 1.29 million, respectively.

3. Cavitation Experiment

3.1. Cavitation Experiment Test

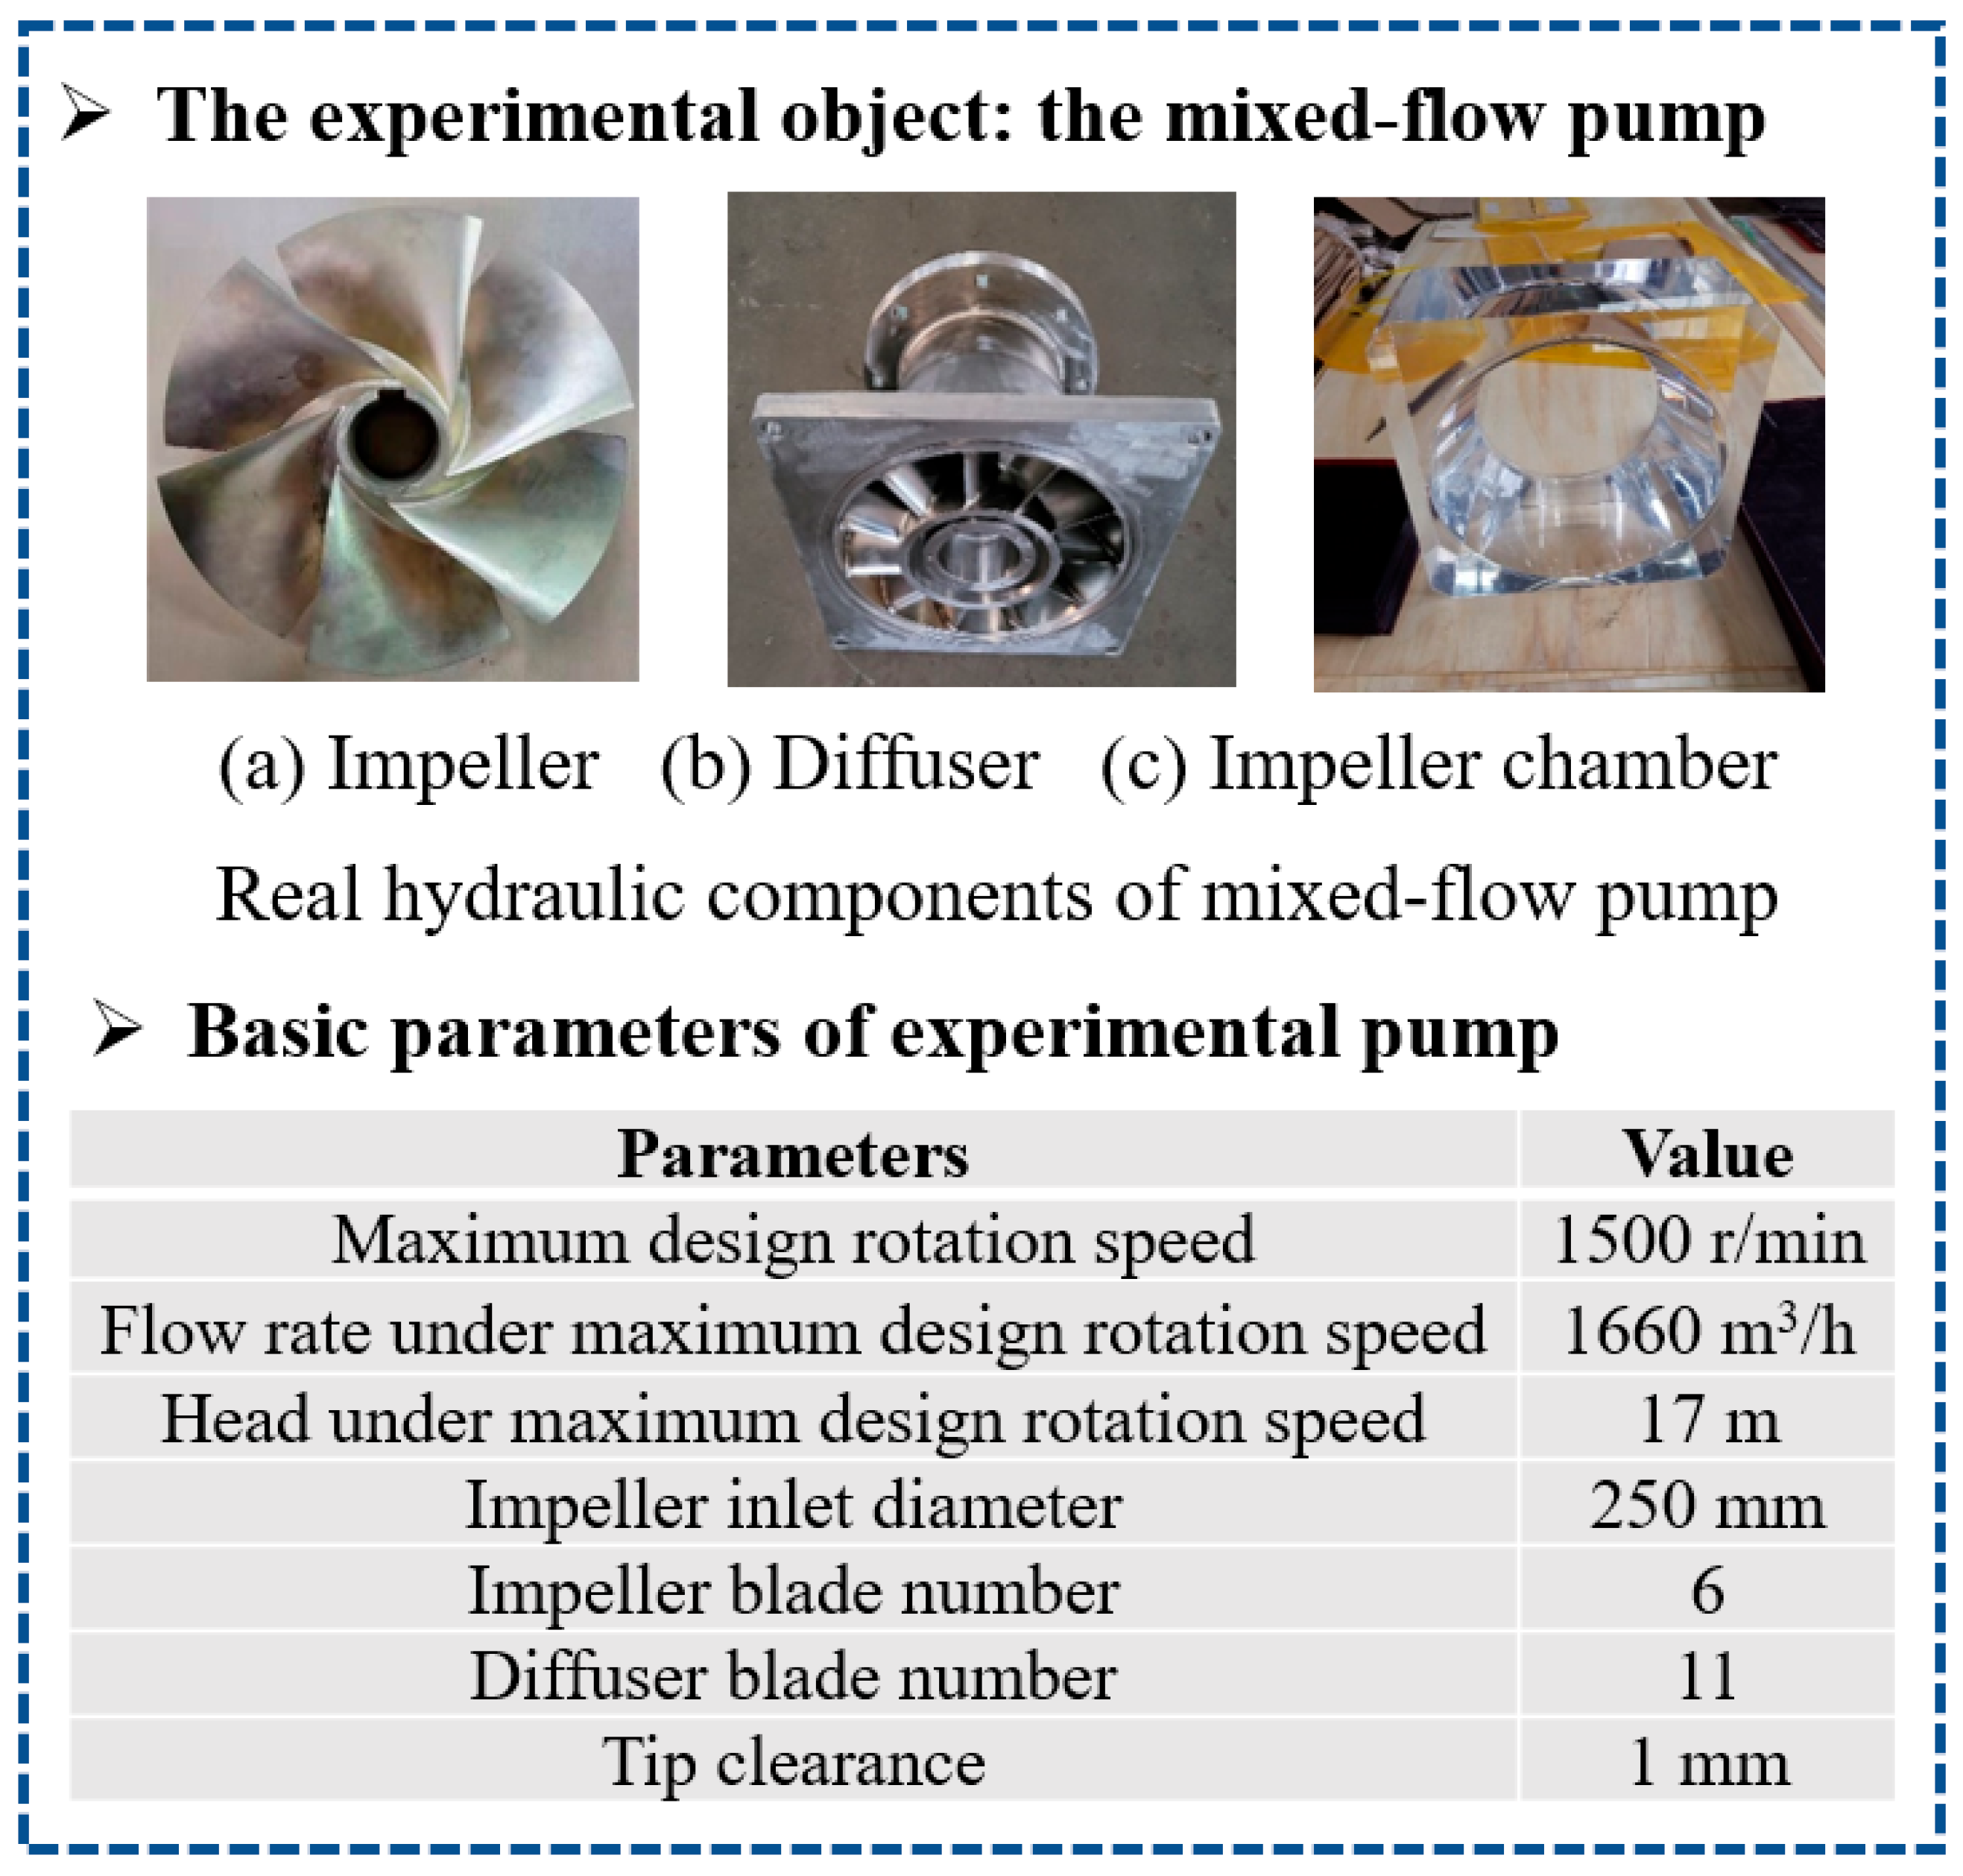
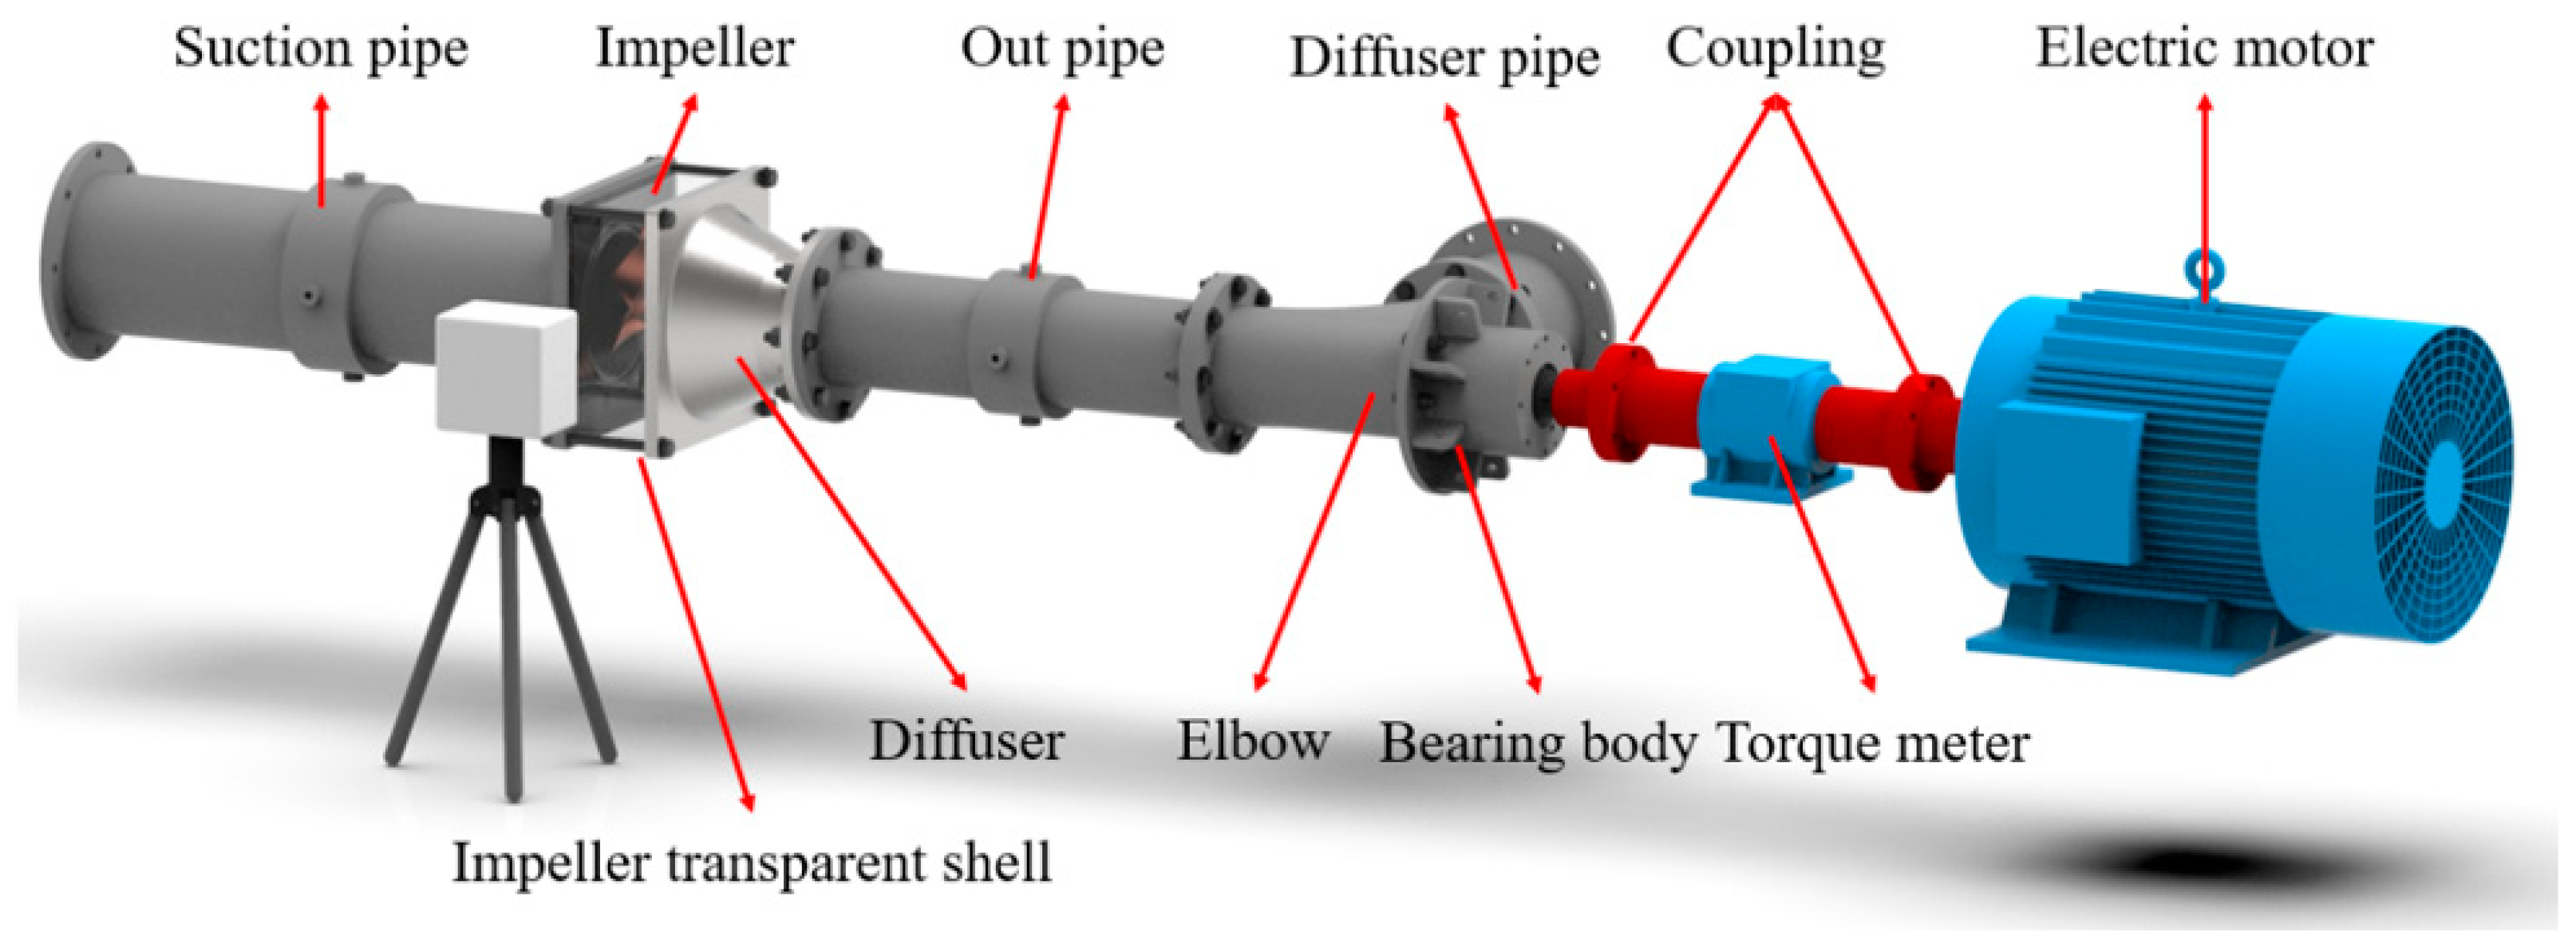
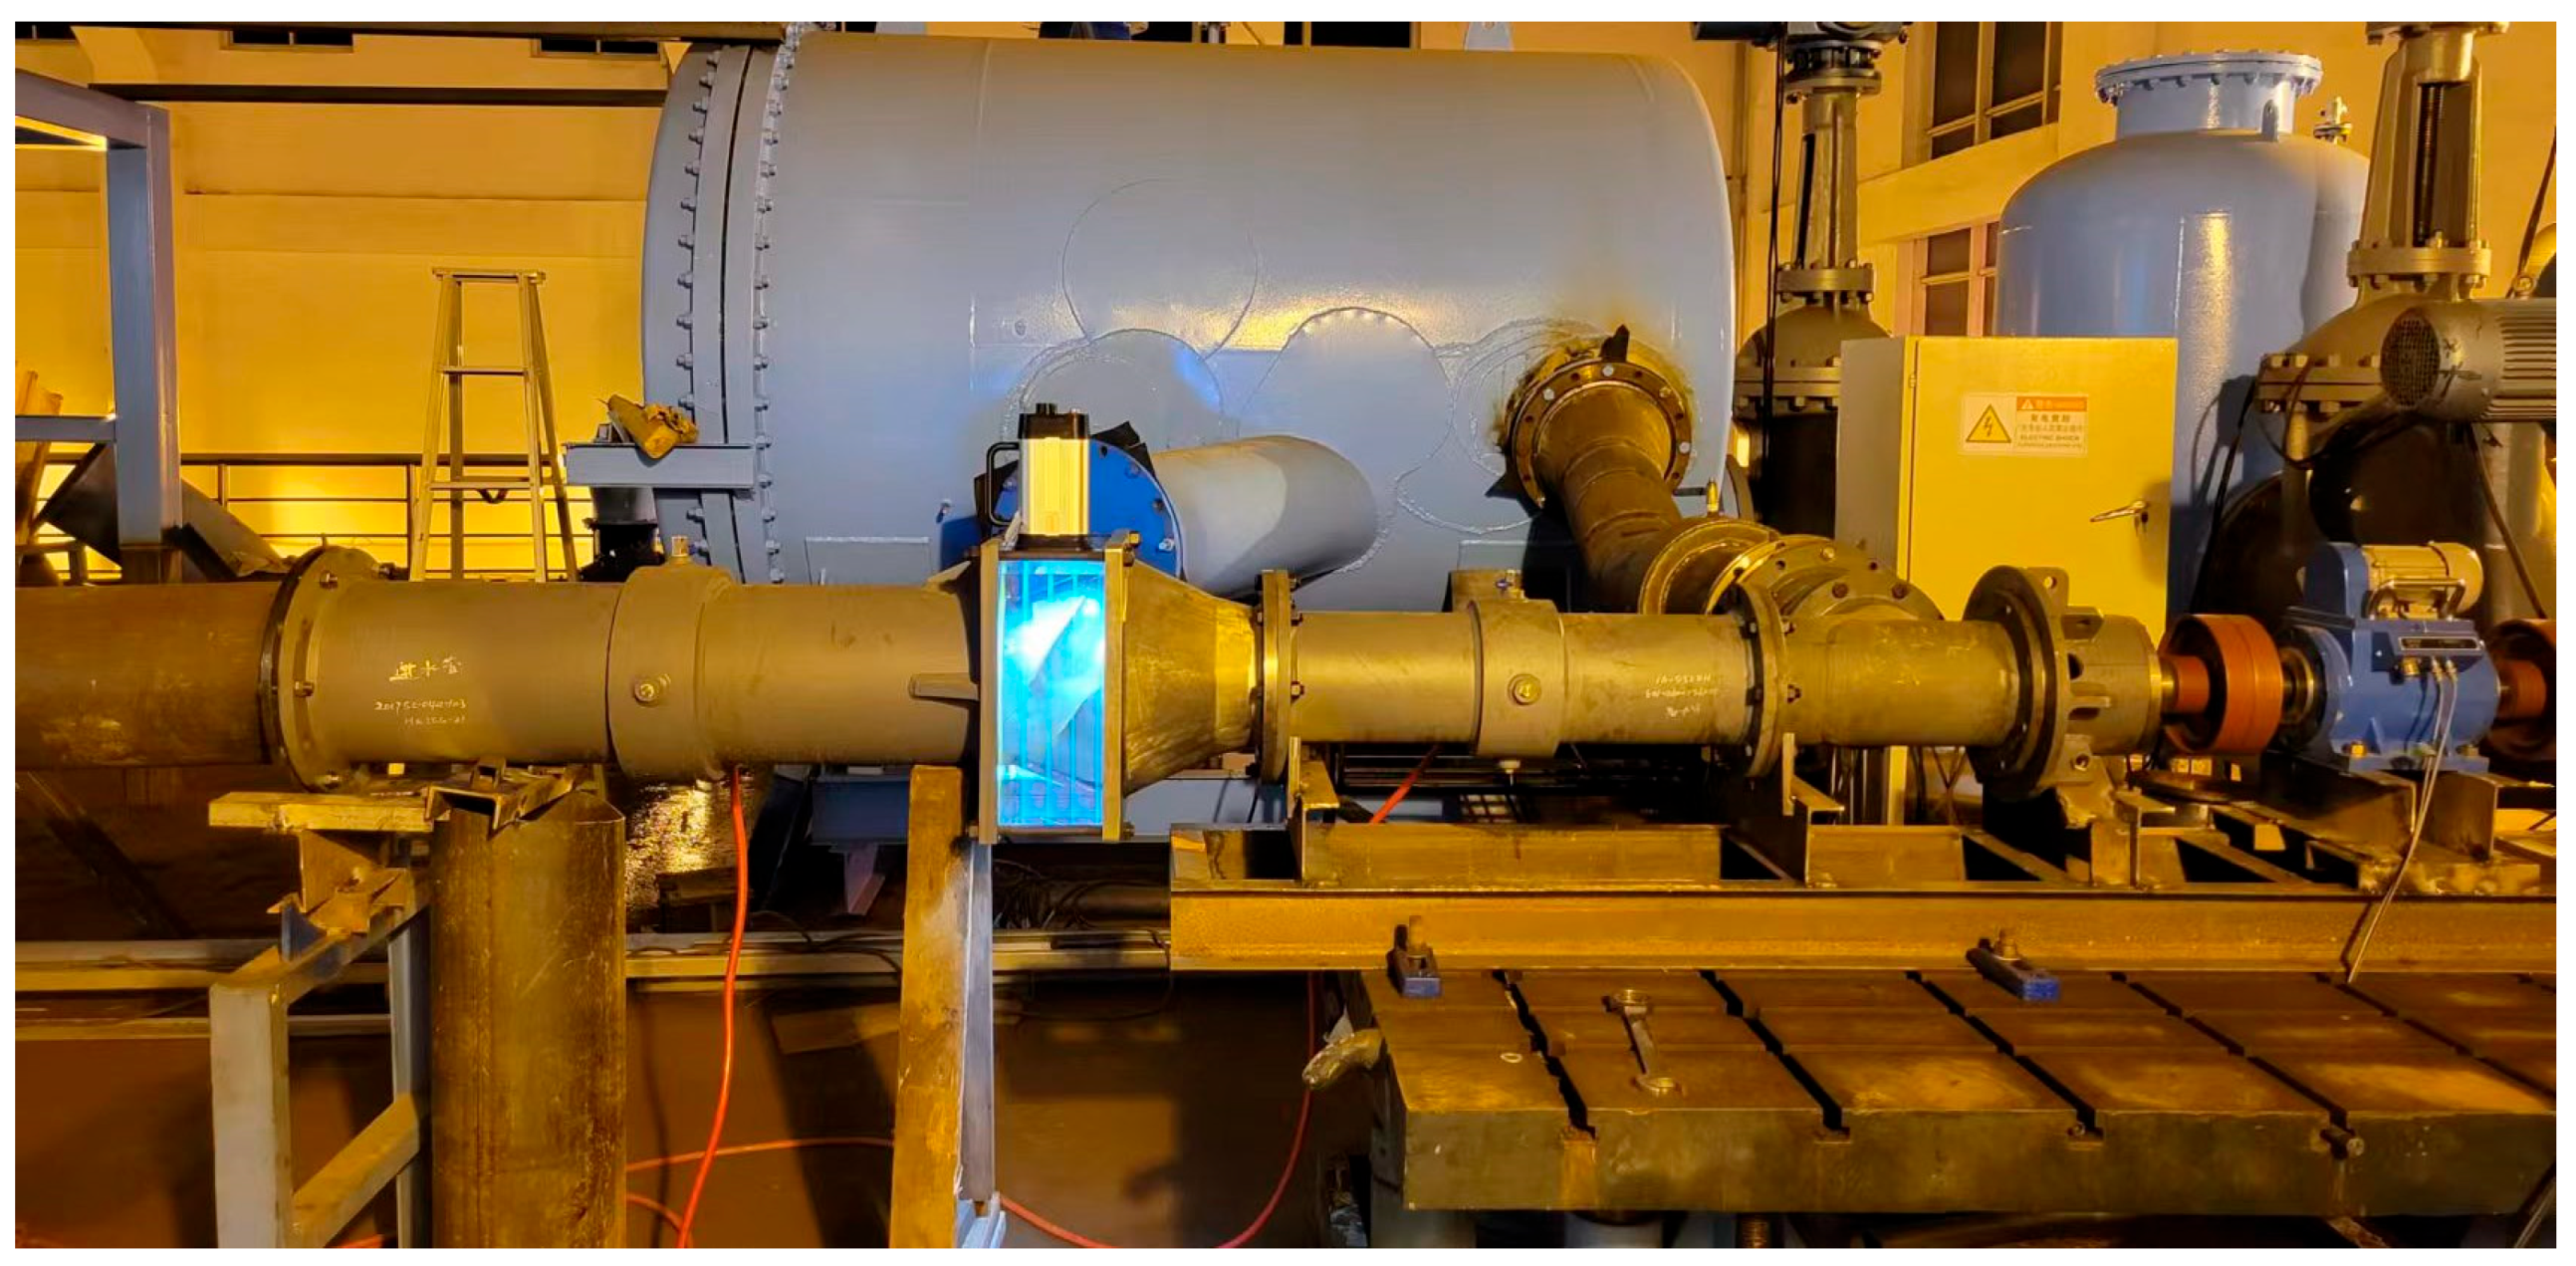
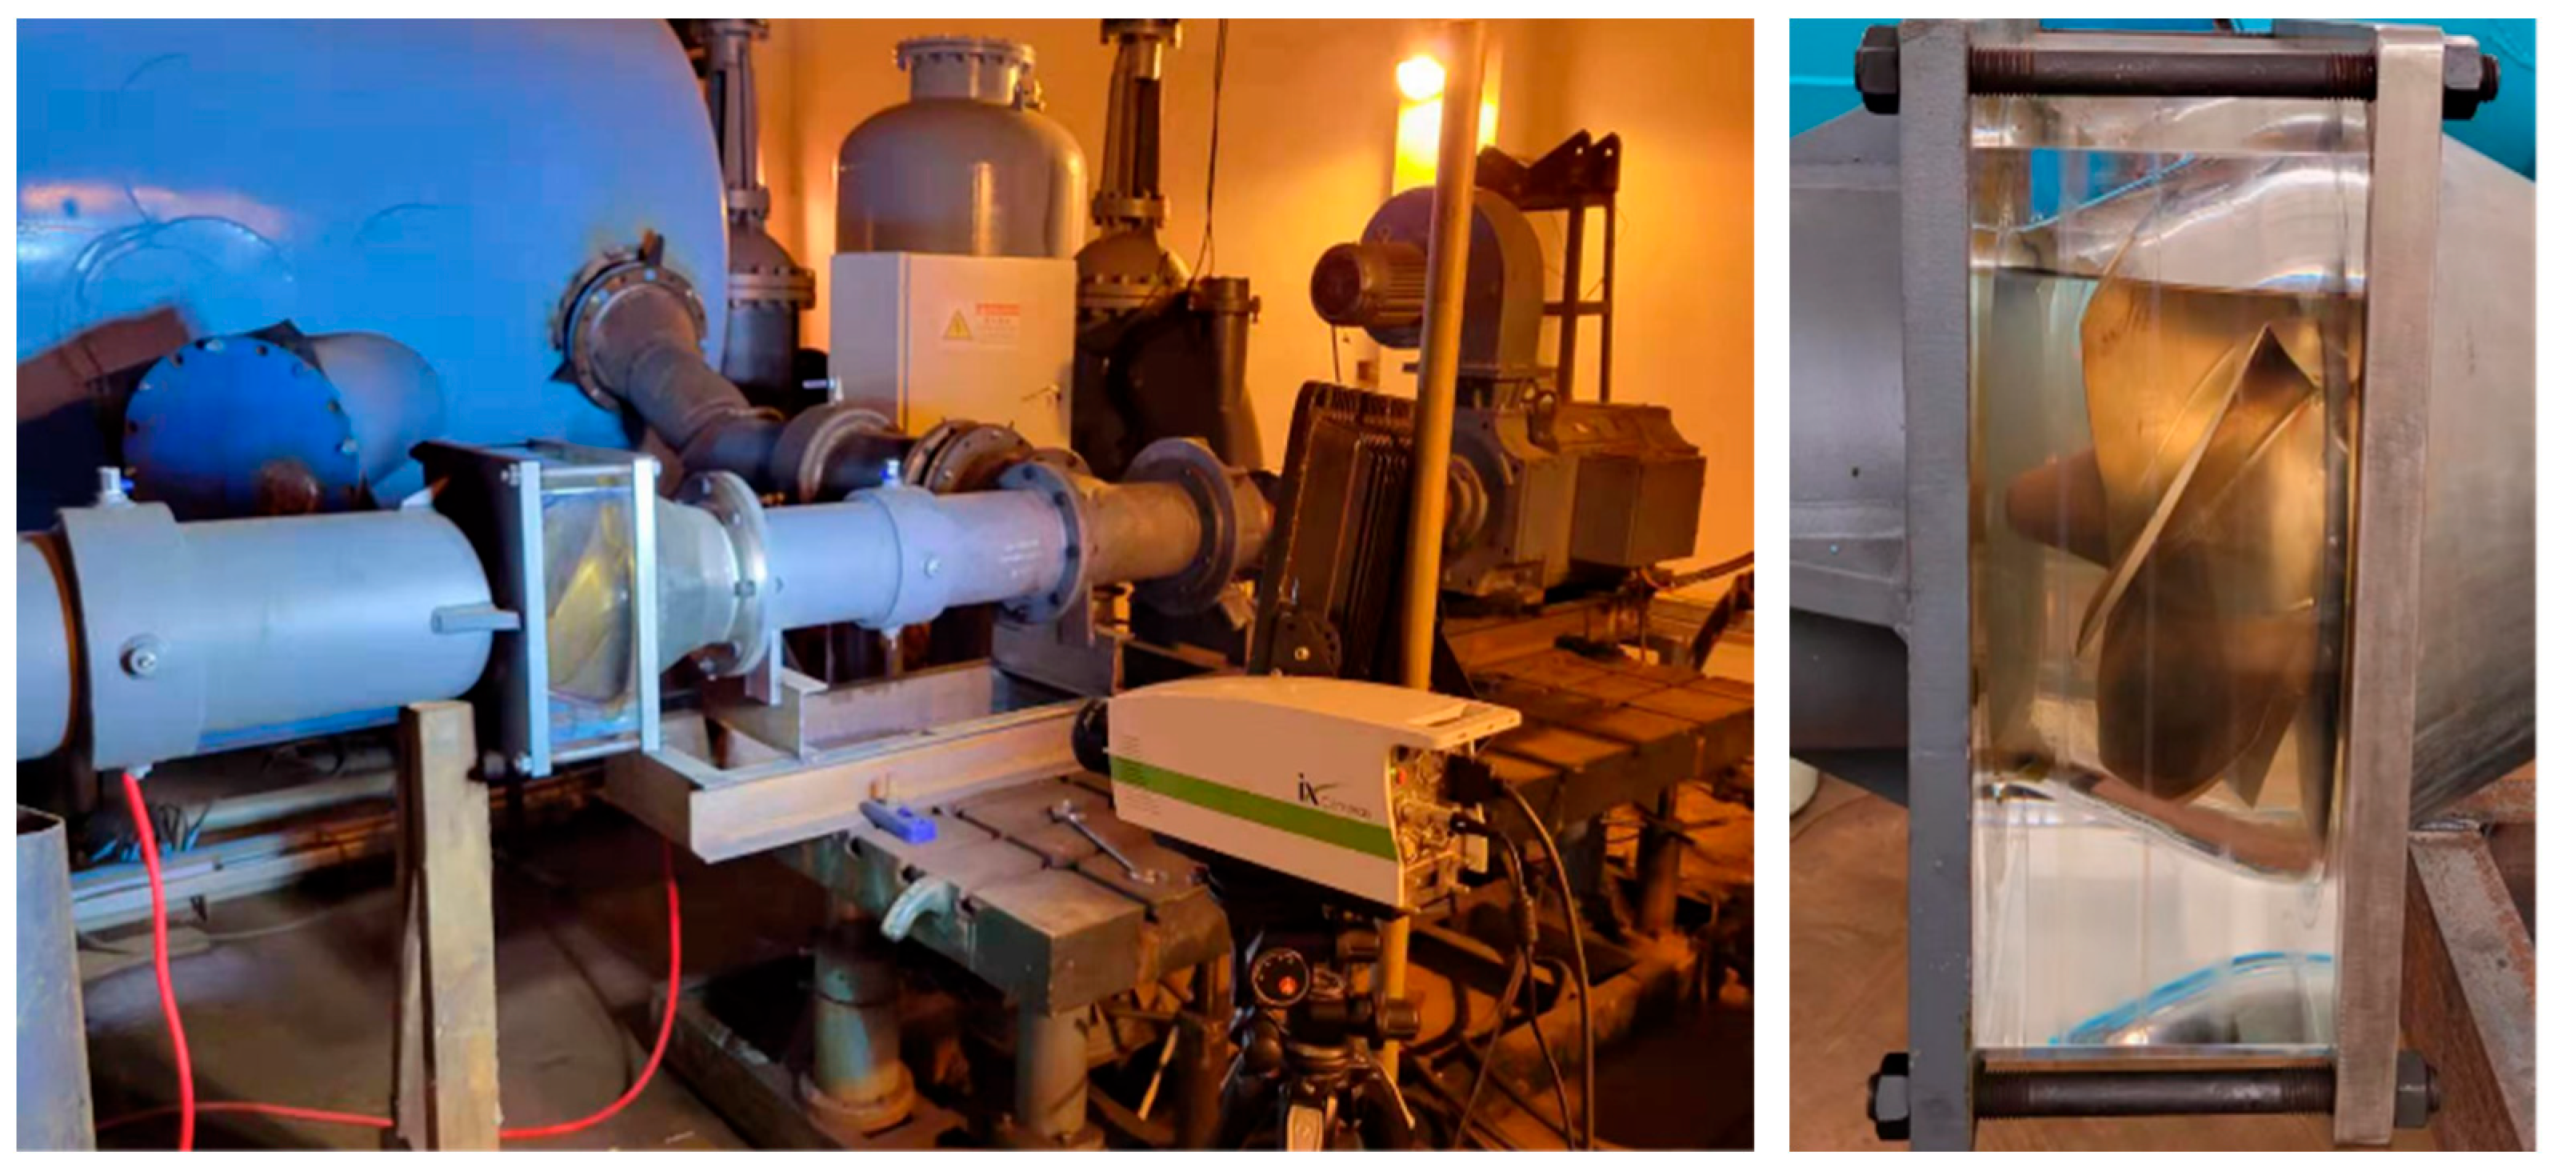
Figure 6, Figure 7, Figure 8 and Figure 9 show the cavitation experiment system schematic and component details. Pump comprehensive performance test bench and mainstream region grid high-speed photography collection system.
This experiment was conducted on the mixed-flow pump closed test bench at Jiangsu University. The cavitation performance test and high-speed camera shooting were carried out for the model pump.
The test pipeline was connected prior to the experiment. By controlling the vacuum pump and adjusting the valve, the inlet pressure was regulated to values corresponding to different cavitation stages at the current flow operating point, and the high-speed camera was activated to capture the cavitation flow states in the pump at different cavitation stages. The high-speed camera has a maximum resolution of 1280 × 1024, with a maximum frame rate of 2000 fps at this resolution.
To observe the cavitation flow patterns in the impeller of the water-jet pump, the impeller casing is fabricated from Plexiglas. To minimize the image distortion from light refraction, the casing adopts an inner circular and outer square design.
The 1 mm tip clearance adopted in this paper is determined based on the characteristics of the test model and research objectives. For the mixed-flow water-jet pump model with a diameter of 250 mm, the gap value, on the one hand, aligns with the practical feasibility of model processing technology. It can prevent friction risks between the impeller and casing due to excessively small clearance and simulate gap effects induced by wear and vibration during long-term operation of pump units in practical engineering via the similarity criterion. On the other hand, this gap size is more prone to inducing tip leakage vortex and associated cavitation phenomena, facilitating experimental observation and numerical simulation of the influence of gap flow on the flow field in the hump region. To better reveal the correlation mechanism between gap flow and cavitation and flow characteristics in the pump and provide reference for the design and operation optimization of the actual pump group.
The flow rate is adjusted, and the test data under the corresponding flow conditions are collected to complete the hydraulic performance test of the model pump at different speeds. To ensure scalability and geometric independence in accordance with IEC standards, the experimental flow Q, head H, and impeller torque T were converted to dimensionless parameters via the following formulas:
Q nD = Q n D 3
E nD = g H n 2 D 2
T nD = T ρ n 2 D 5
In the formula, the flow coefficient QnD, the energy coefficient EnD, and the torque coefficient TnD are all dimensionless numbers, and the unit of flow Q is m3/s. The rotation speed n unit is r/min; the nominal diameter D unit of the impeller is m; the head H unit is m; the unit of gravity acceleration g is m/s2; the unit of density ρ is kg/m3; the torque T unit is N·m.

3.2. Analysis of Hydraulic Performance Experiment Results

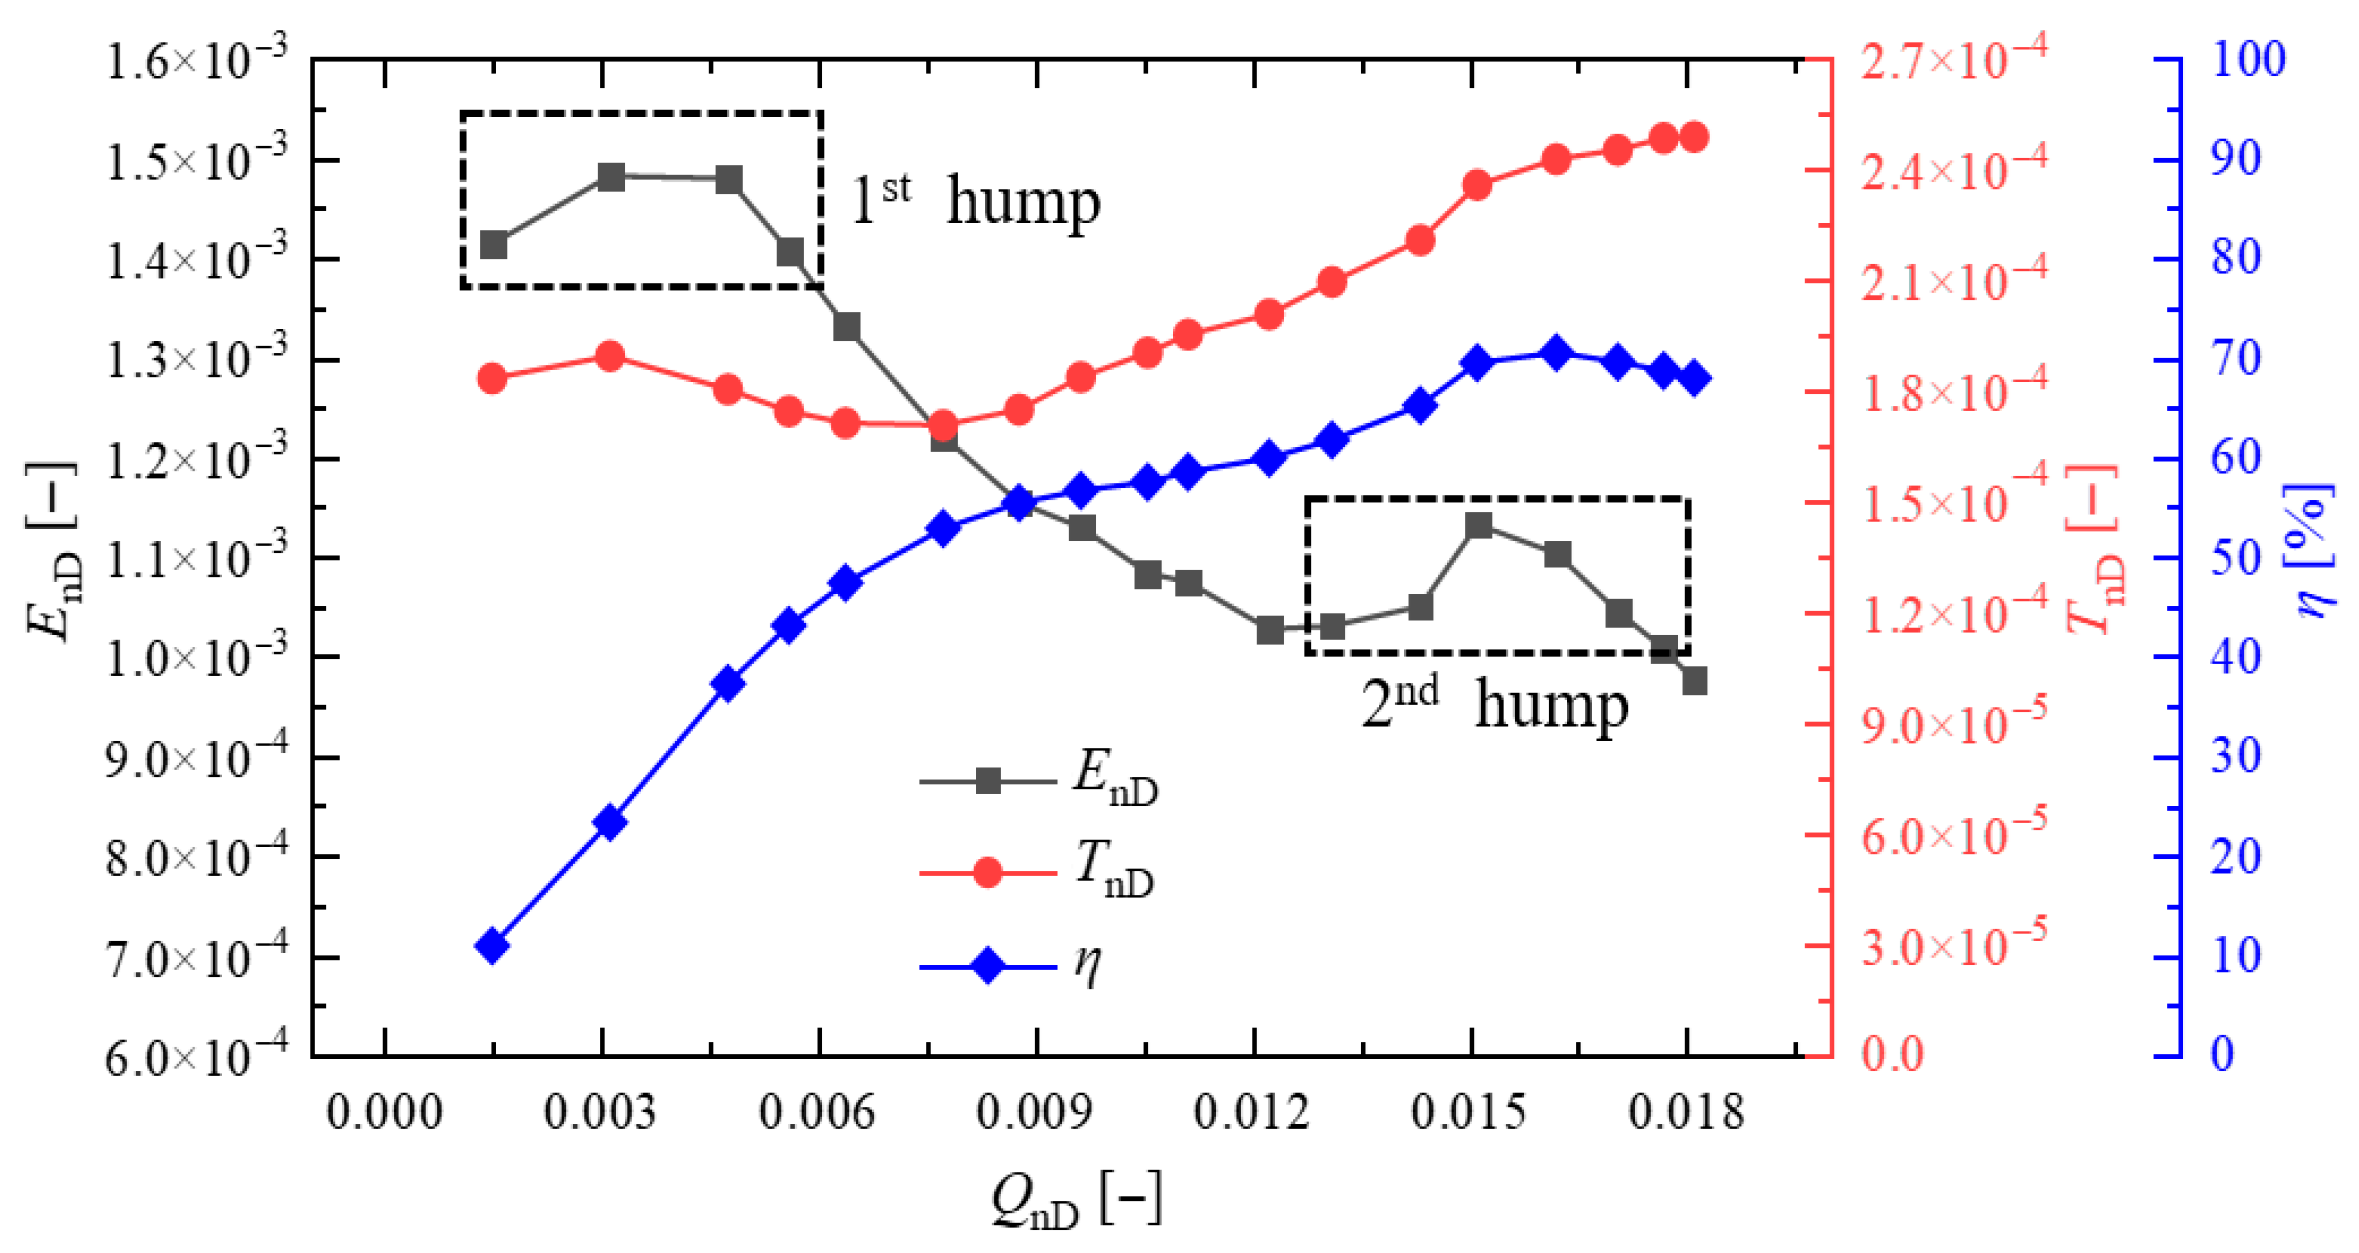
Figure 10 shows the hydraulic performance curves of the water-jet pump. Obviously, the energy characteristic curve exhibits the form of double humps. Given the proximity of the second hump region to the design condition, this paper specifically investigates cavitation phenomena within this secondary hump region. Due to the limited number of flow rate points selected for cavitation performance testing, the positions of the valley and peak can only be roughly determined. Based on the variation of the energy characteristic curve, the flow condition of QnD = 0.014 is selected as the near-valley condition, and the flow condition of QnD = 0.016 is selected as the near-peak condition. This paper only analyzes the cavitation flow structure and its evolution process under the near-valley condition.

3.3. Analysis of Cavitation Performance Experiment Results

In the cavitation performance experiment, Net Positive Suction Head (NPSH) is used as a crucial parameter to assess the likelihood of cavitation occurring in a pump. NPSH indicates the number of heads that exceeds the vapor pressure of the fluid at the inlet of a pump. The expression for NPSH is as follows:
N P S H = P s ρ g + v s 2 2 g + P v ρ g
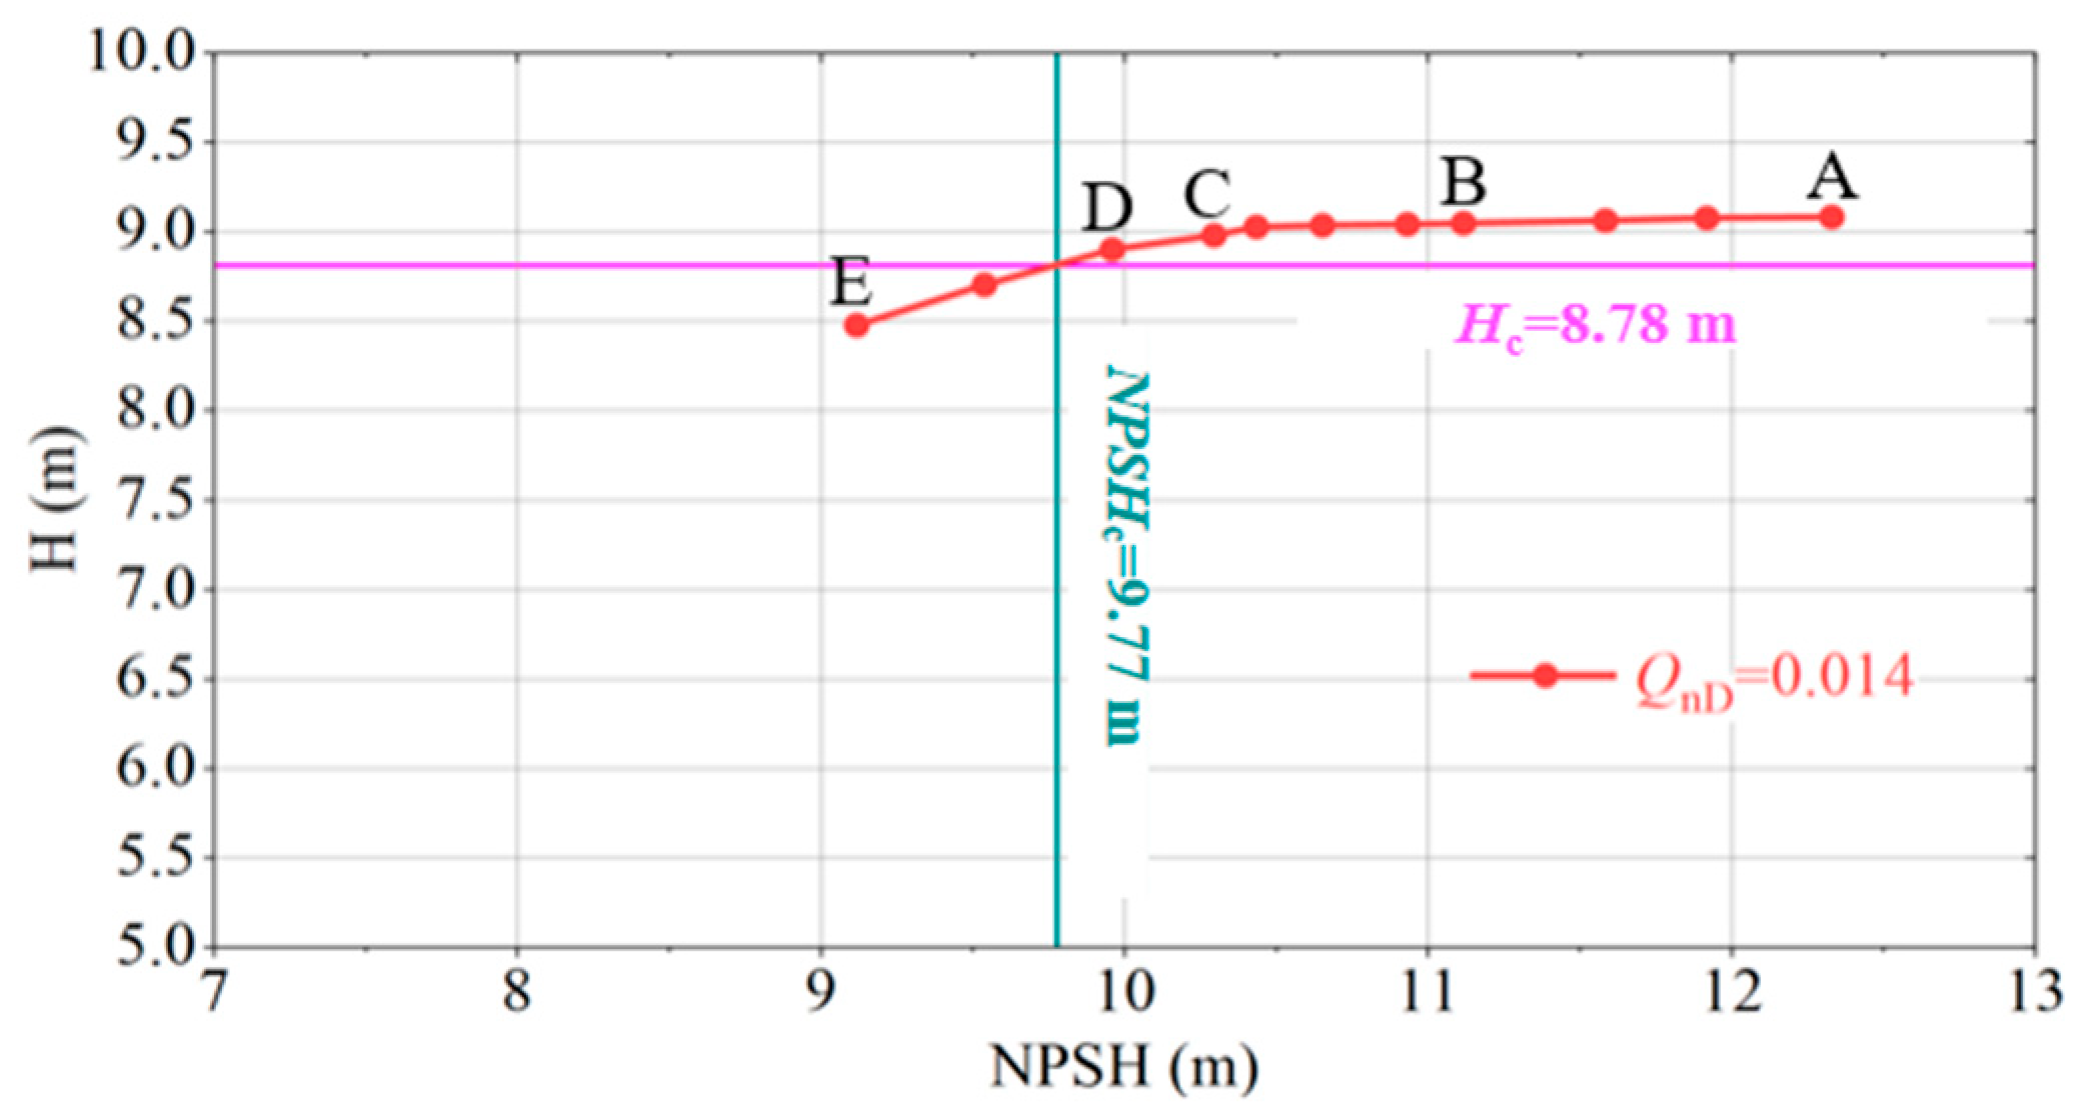
where Ps is the pressure at the pump inlet, vs is the velocity at the pump inlet, and Pv is the saturated vapor pressure of the liquid. During the experiment, the NPSH is gradually reduced until the ratio of the decrease in pump head to the pump head at a constant flow rate reaches 3%. The NPSH value at this point is defined as NPSHc.
Figure 11 shows the cavitation performance curve of the model pump under the near-valley condition. Points A–D in the figure represent the condition points corresponding to different cavitation development stages on the cavitation performance curve. Although the head of the test pump remains relatively constant at the initial stage of the cavitation experiment, significant cavitation has already occurred within the pump. Therefore, this condition is defined as the cavitation inception stage, with Point A selected as its representative. As the NPSH decreases, the head initially decreases slightly, followed by a more pronounced reduction. This condition corresponds to the point C on the cavitation performance curve, designated as the first critical cavitation stage. To more comprehensively demonstrate the evolution of cavitation flow structures, point B, located between point A and point C, is defined as the cavitation development transition stage. From point A to B, the head decreases by 0.03 m. From point B to C, it decreases by 0.02 m. When the head decreases by 3%, it approximately corresponds to the point D on the cavitation performance curve, defined as the critical cavitation stage. That is to say, from point C to D, the head decreases by 0.27 m. As the NPSH continues to decrease, the head reduction of the test pump becomes more significant. At this stage, point E is selected and defined as the breakdown cavitation stage. From point D to E, the head decreases by 0.26 m. As shown in Figure 12, Figure 13, Figure 14, Figure 15 and Figure 16, based on the various points selected from the cavitation performance curve, the evolution process of cavitation flow structure in the pump during different cavitation development stages is presented.

4. Evolution of Cavitation Flow Structure

The evolution of cavitation flow structures during the different stages is presented based on the condition points selected from the cavitation performance curve.
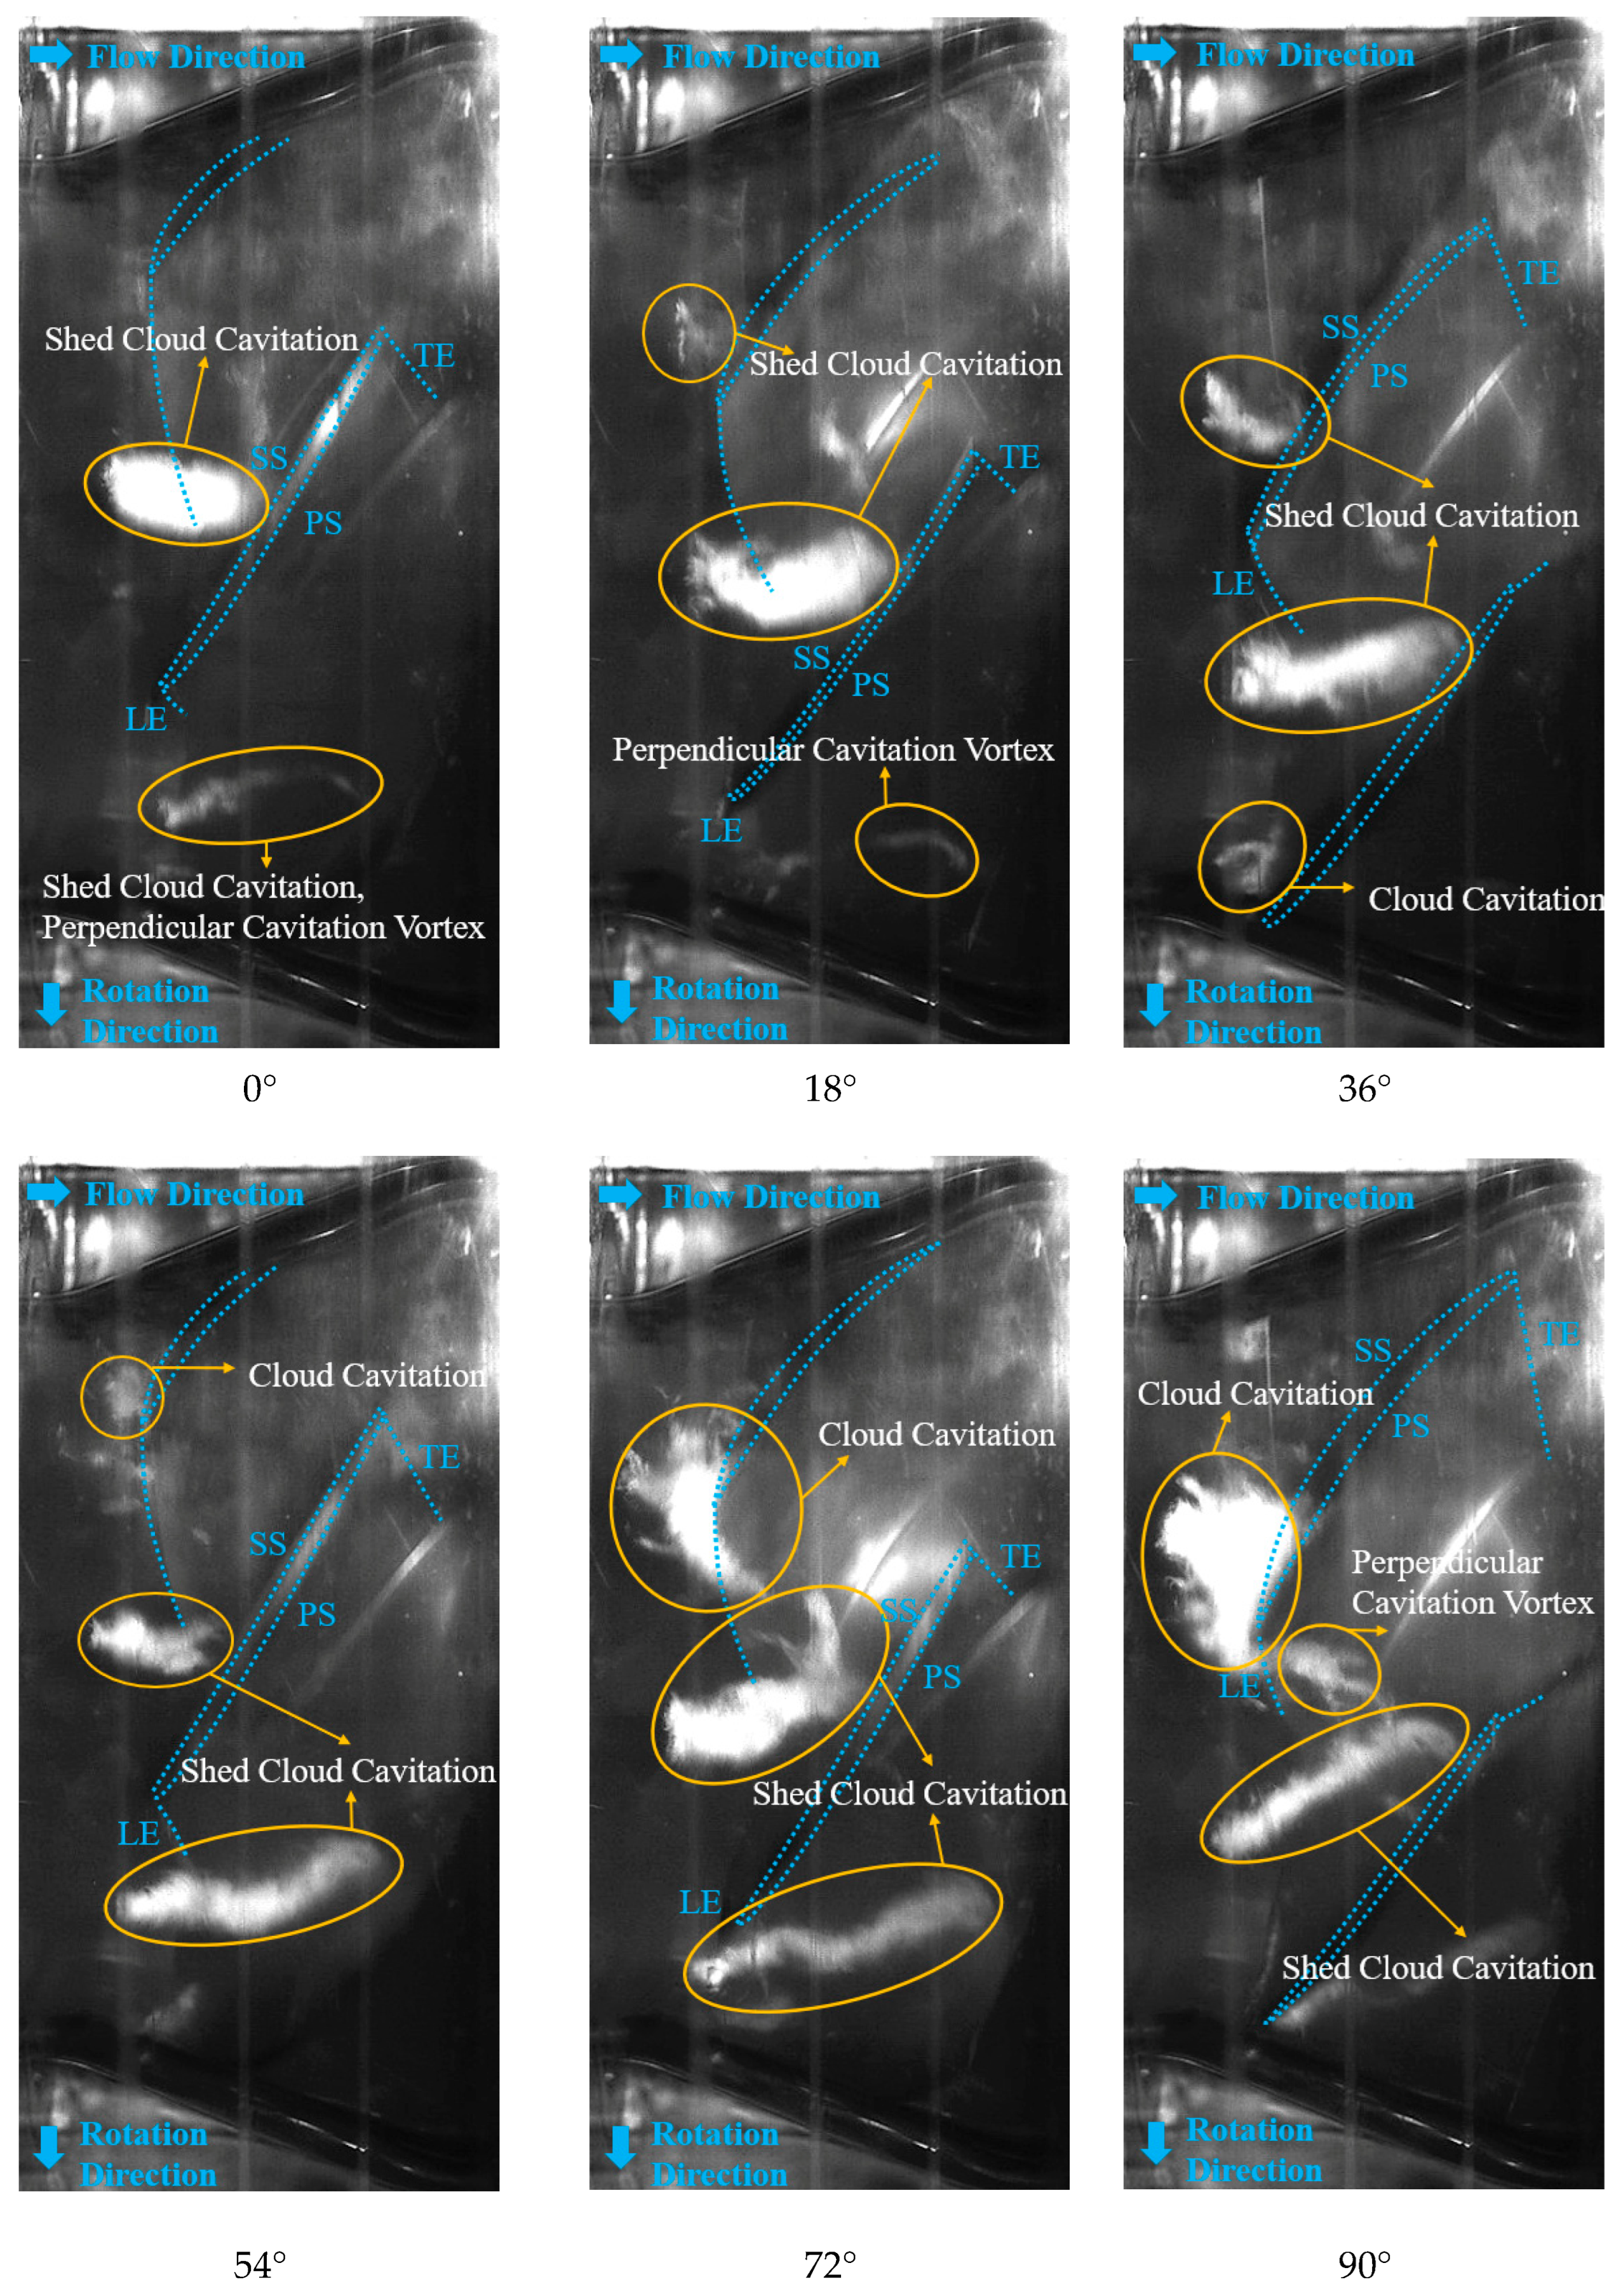
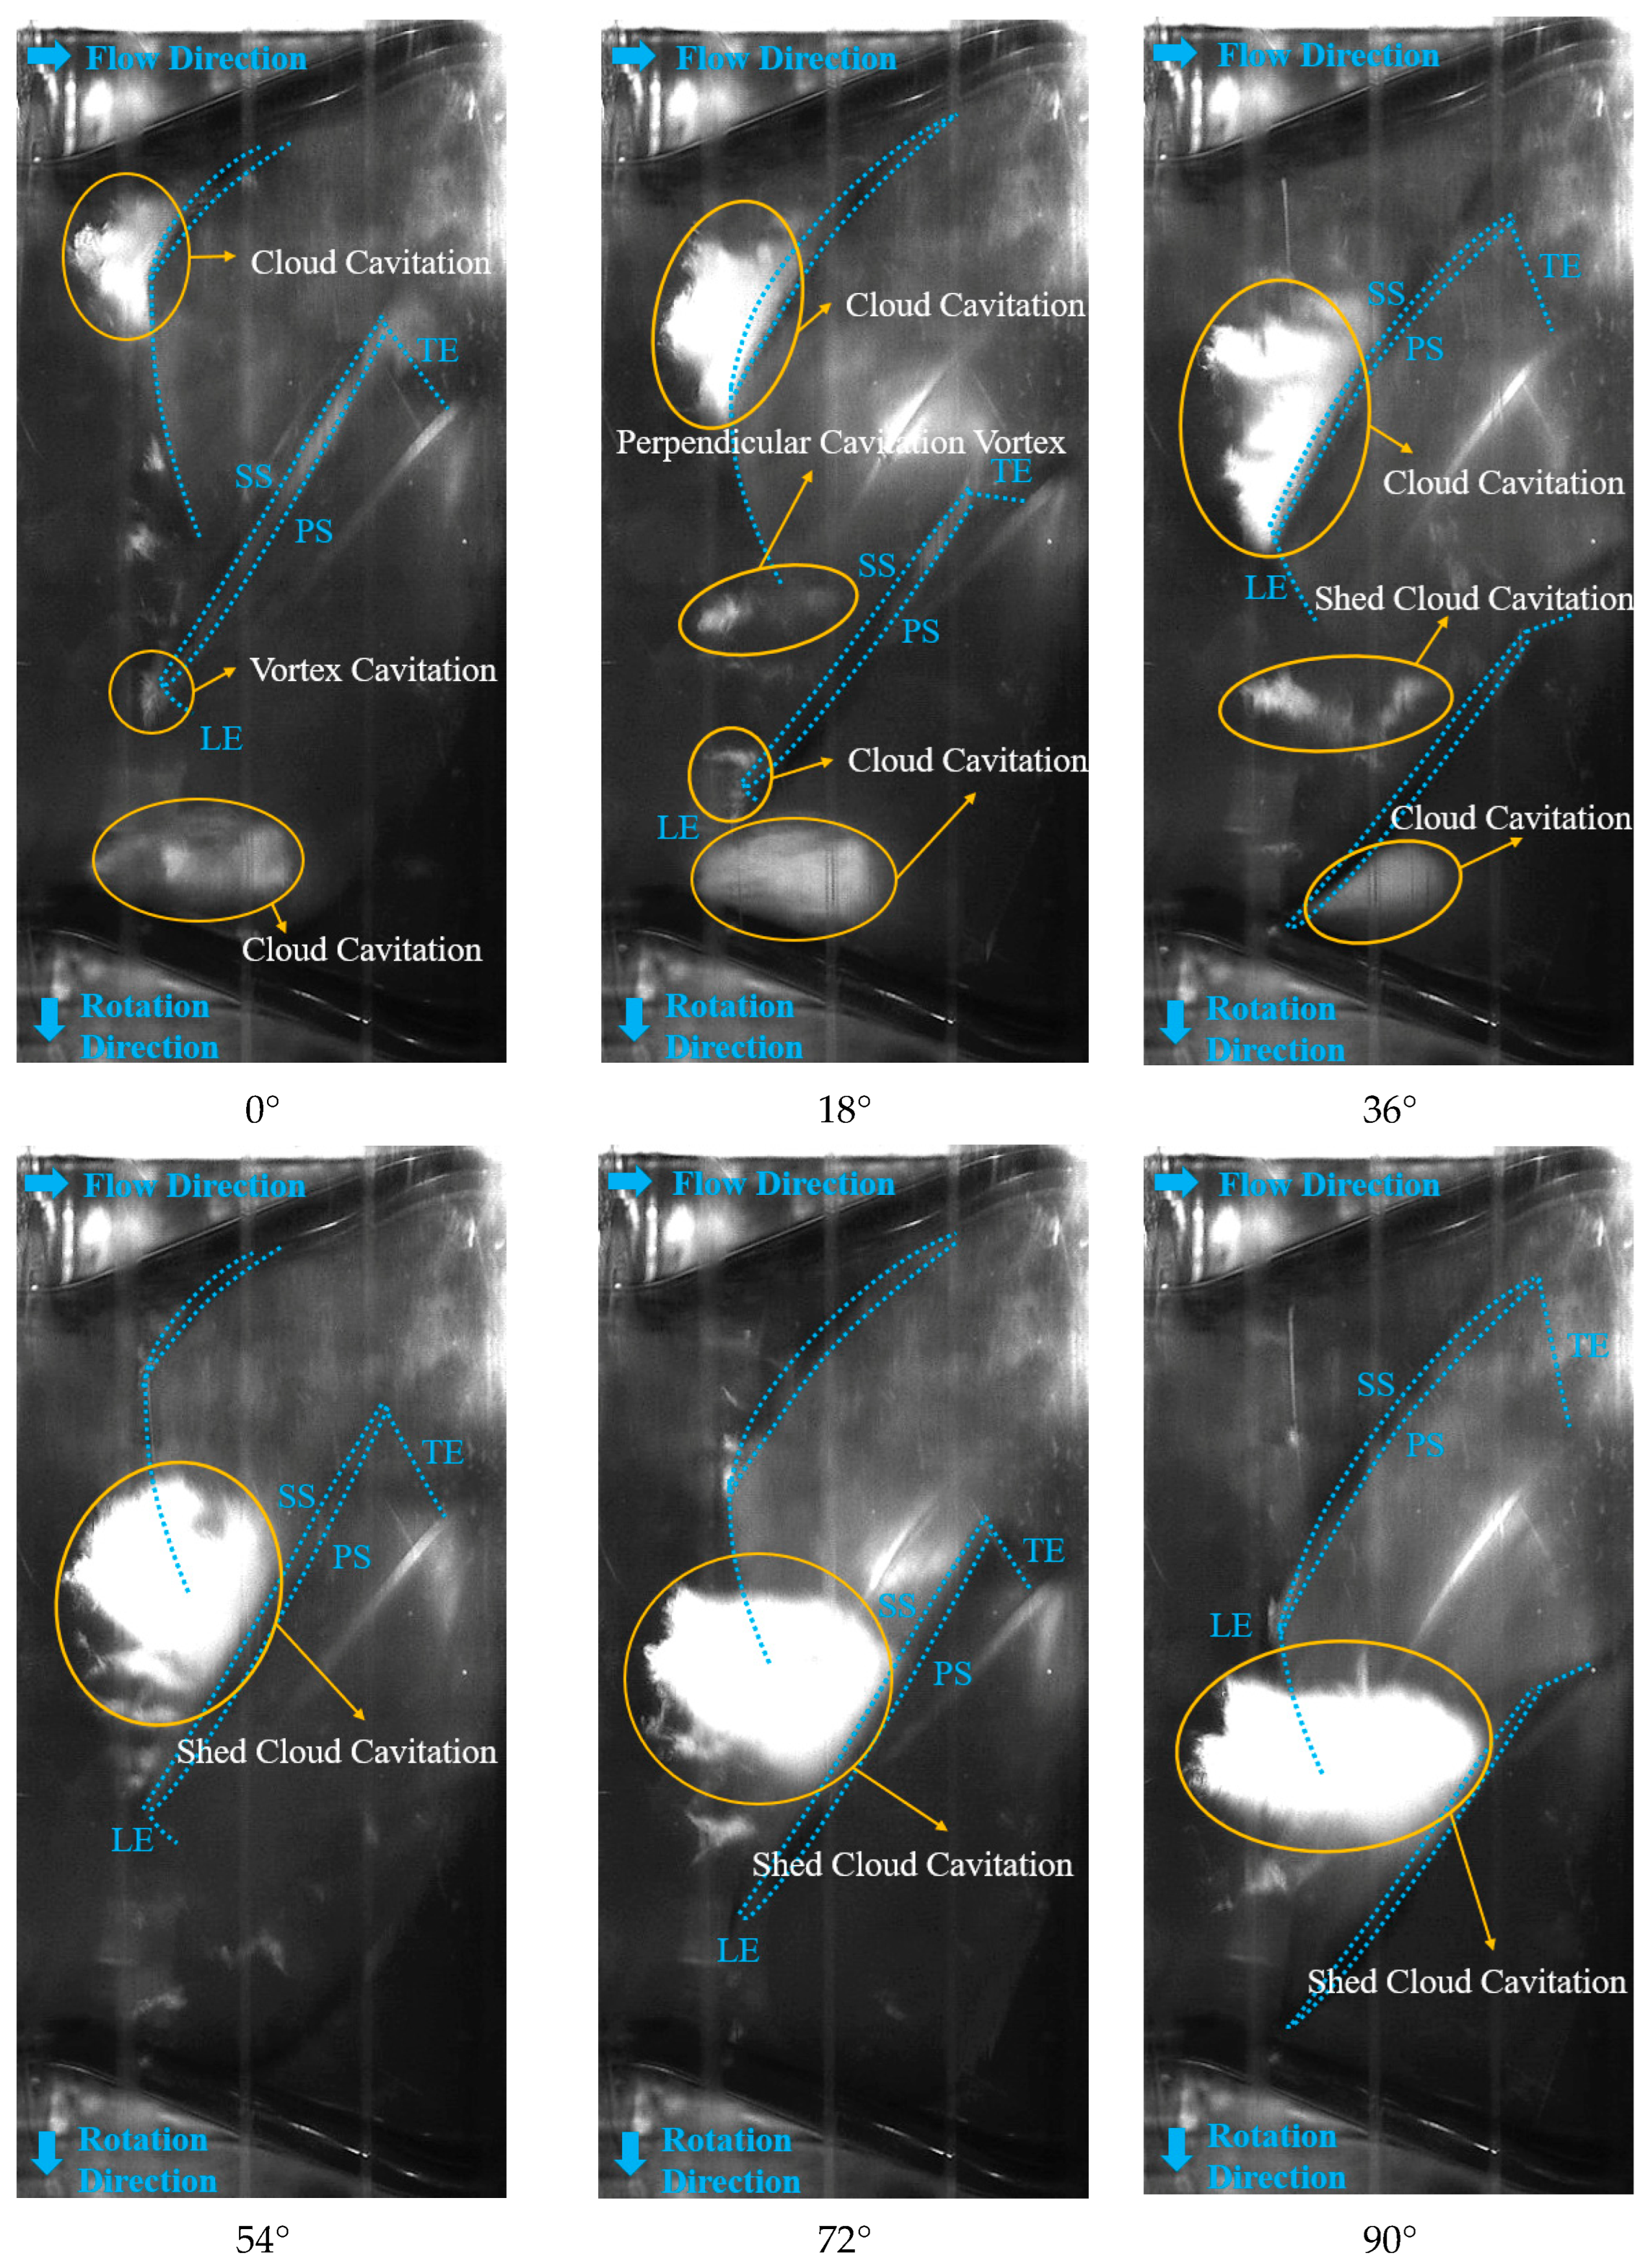
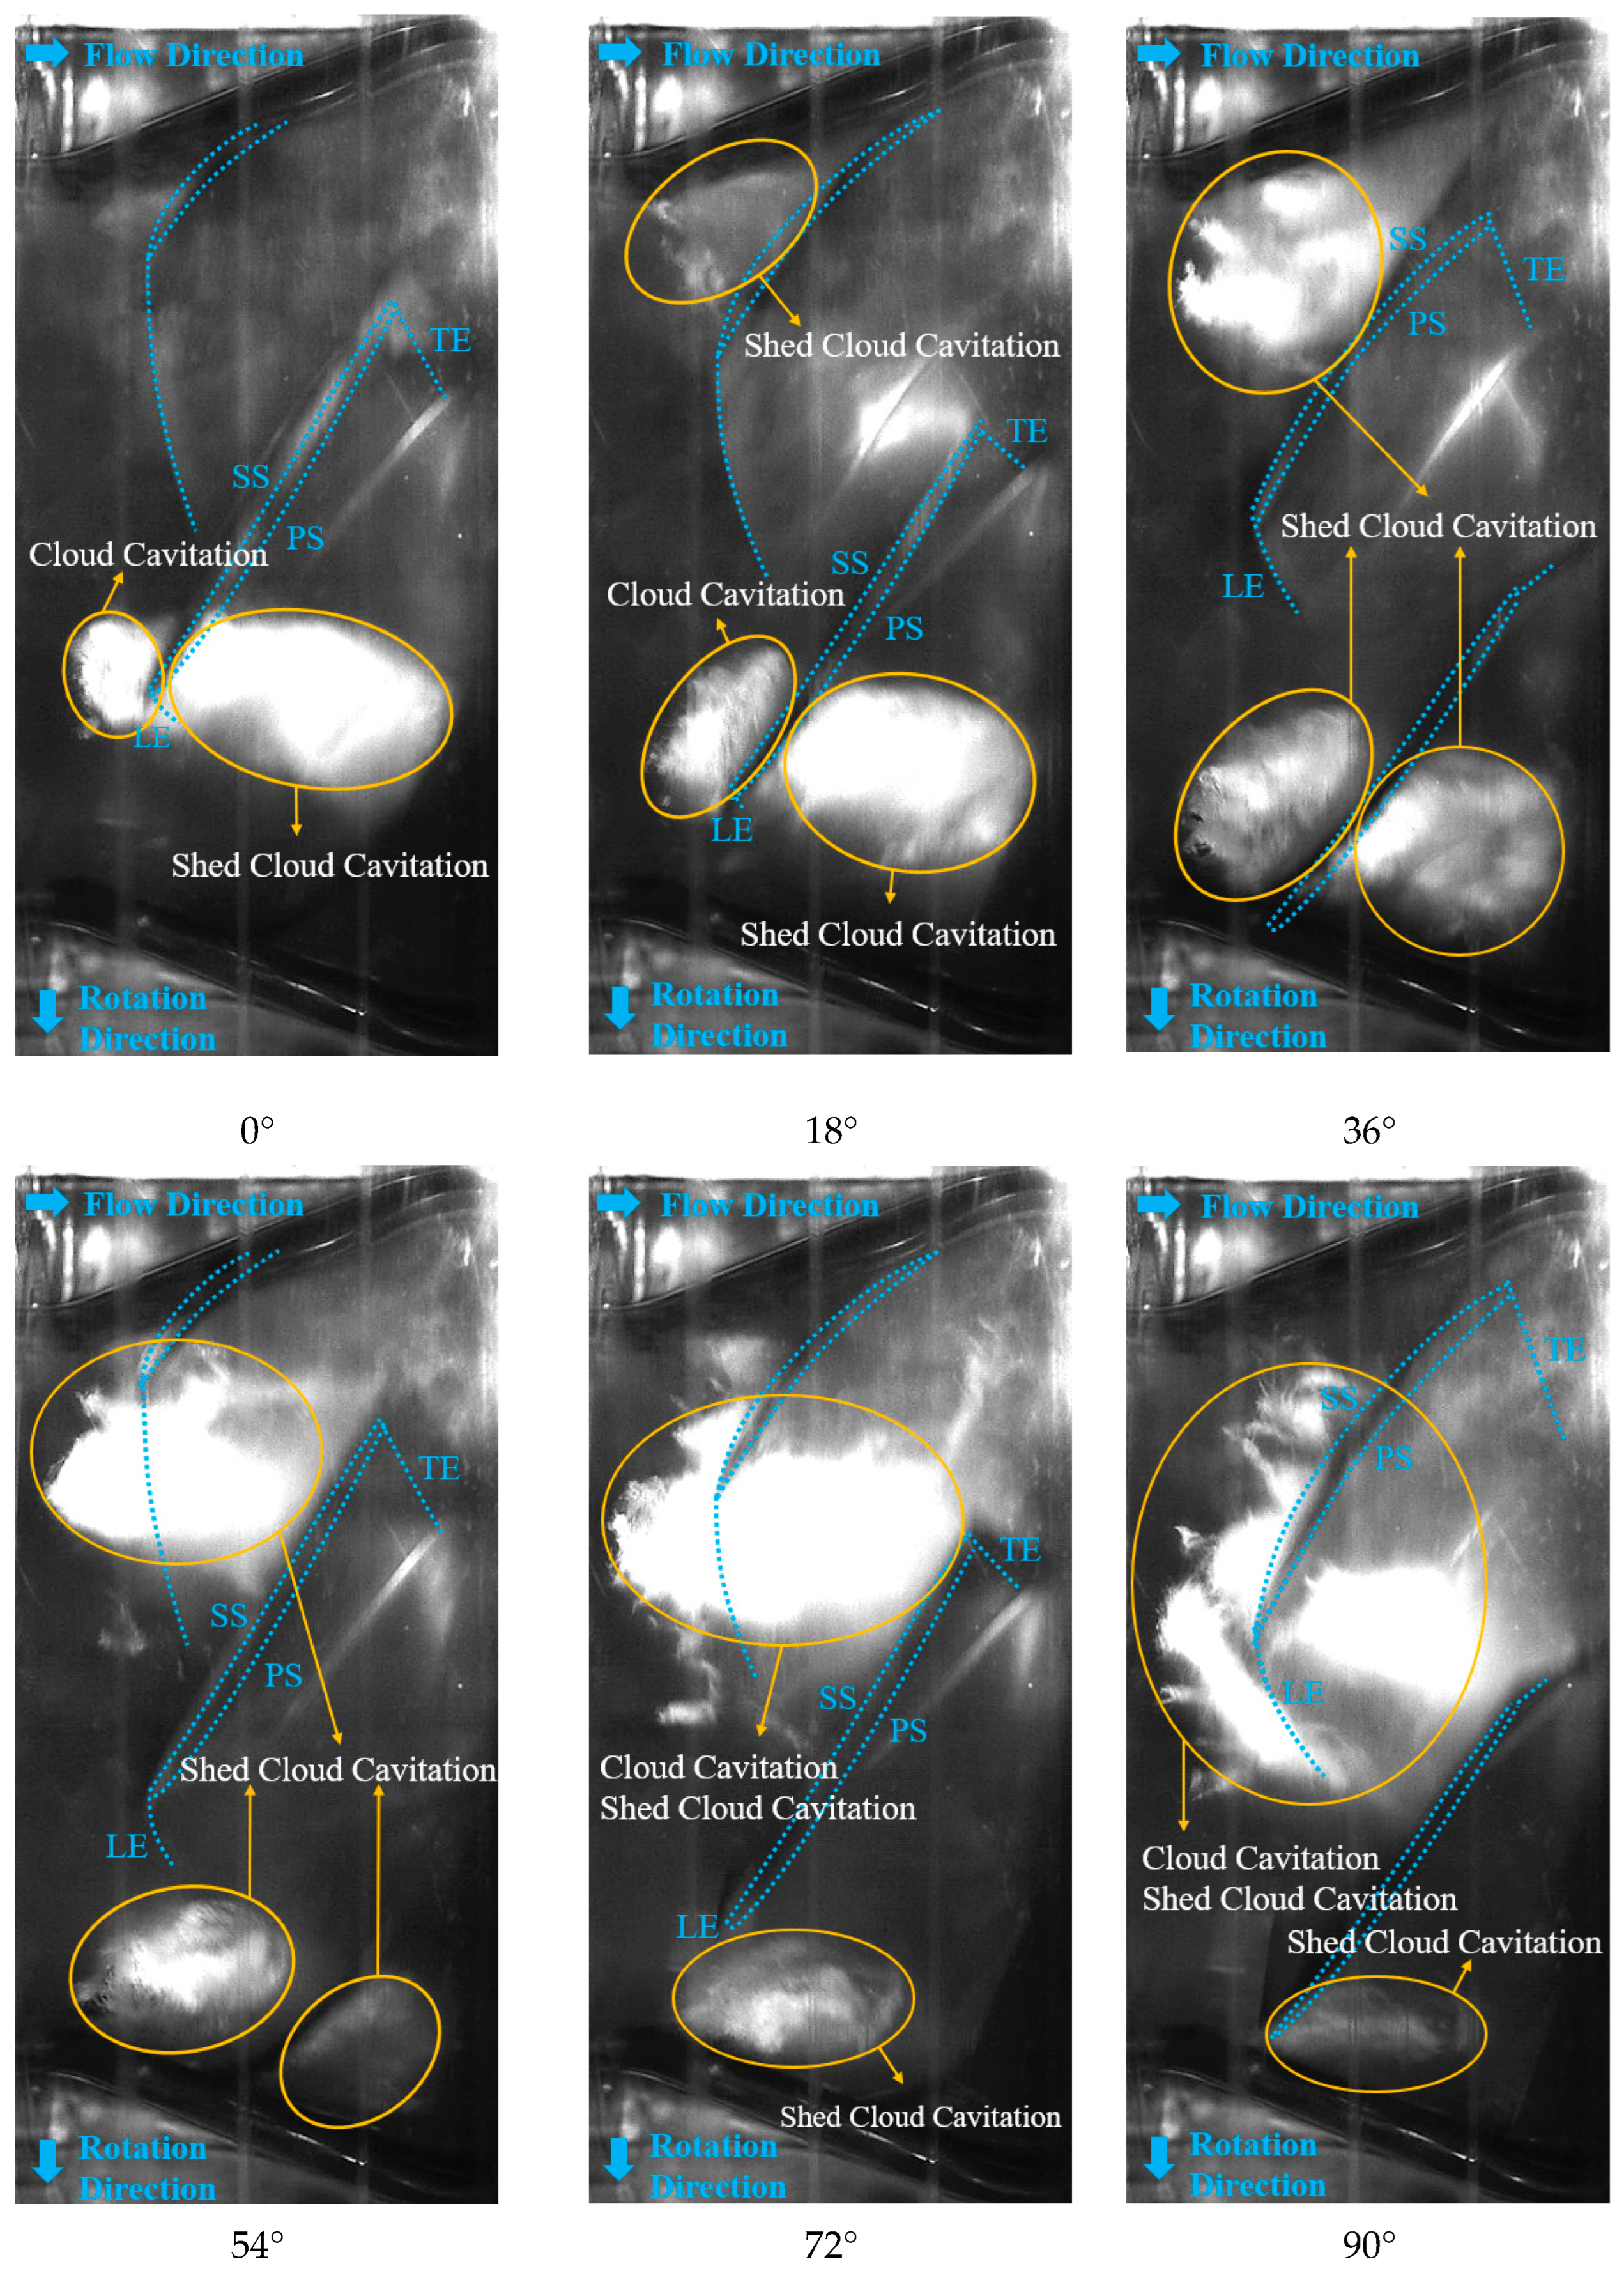
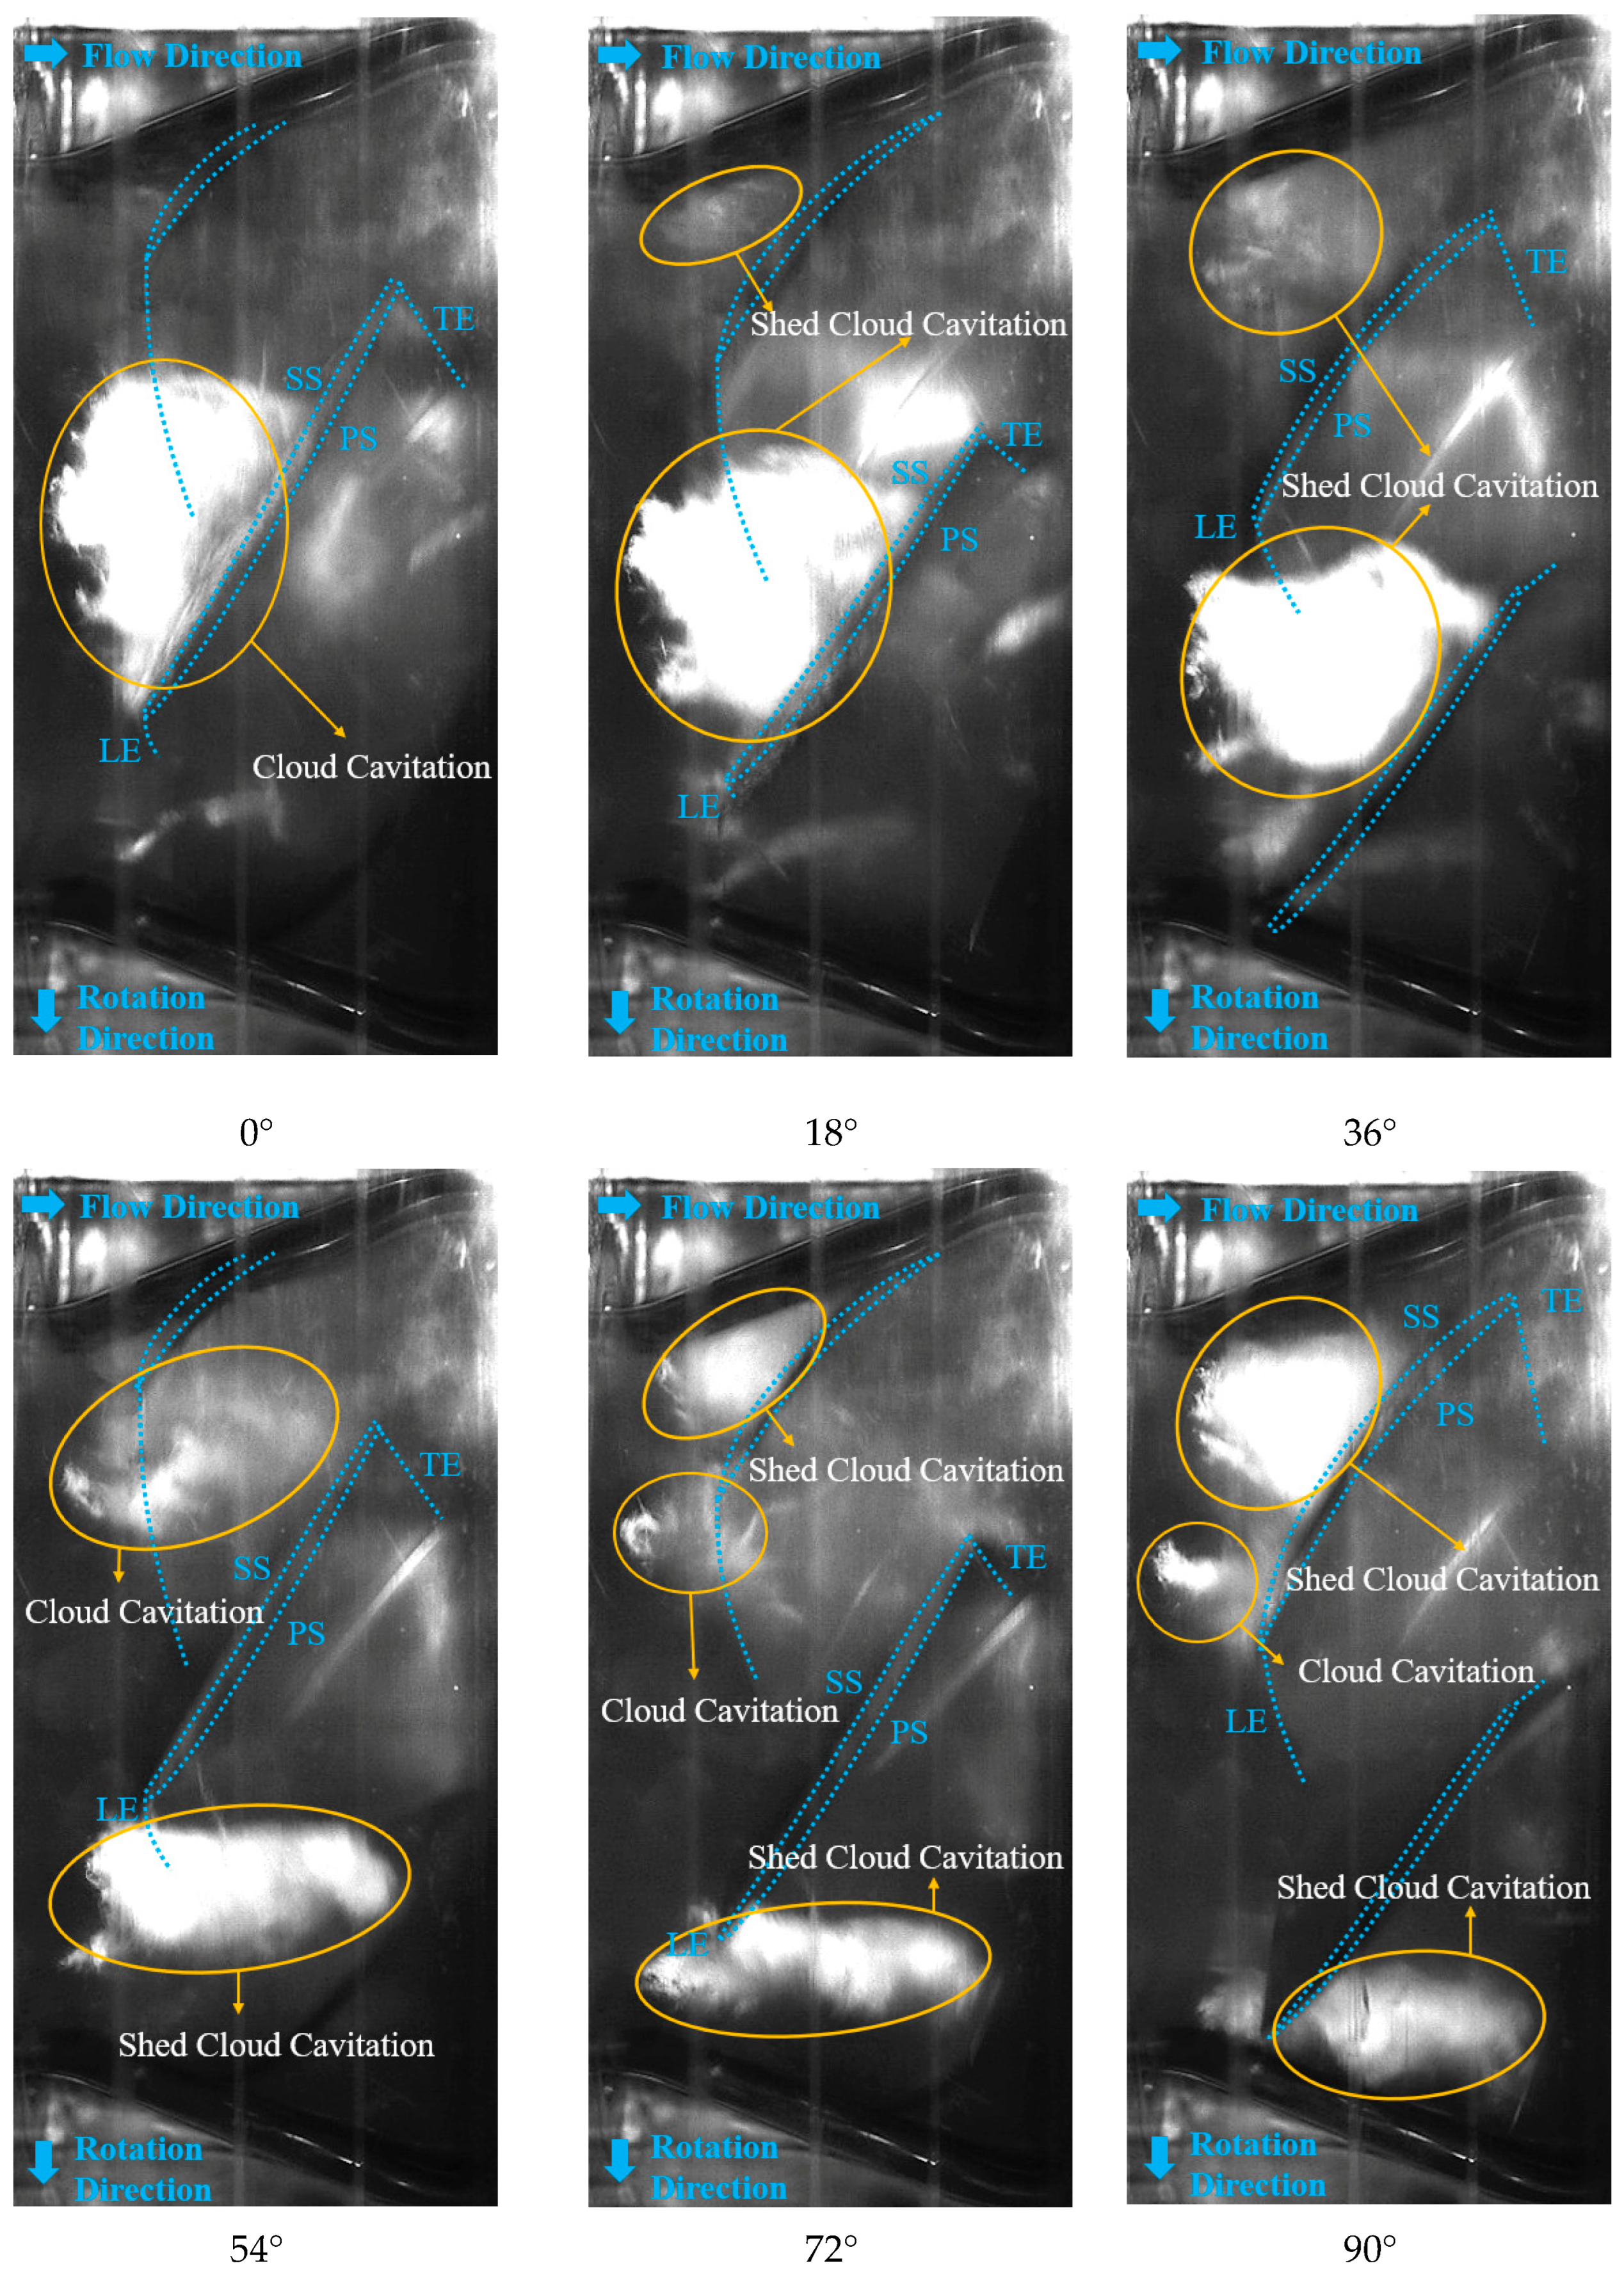
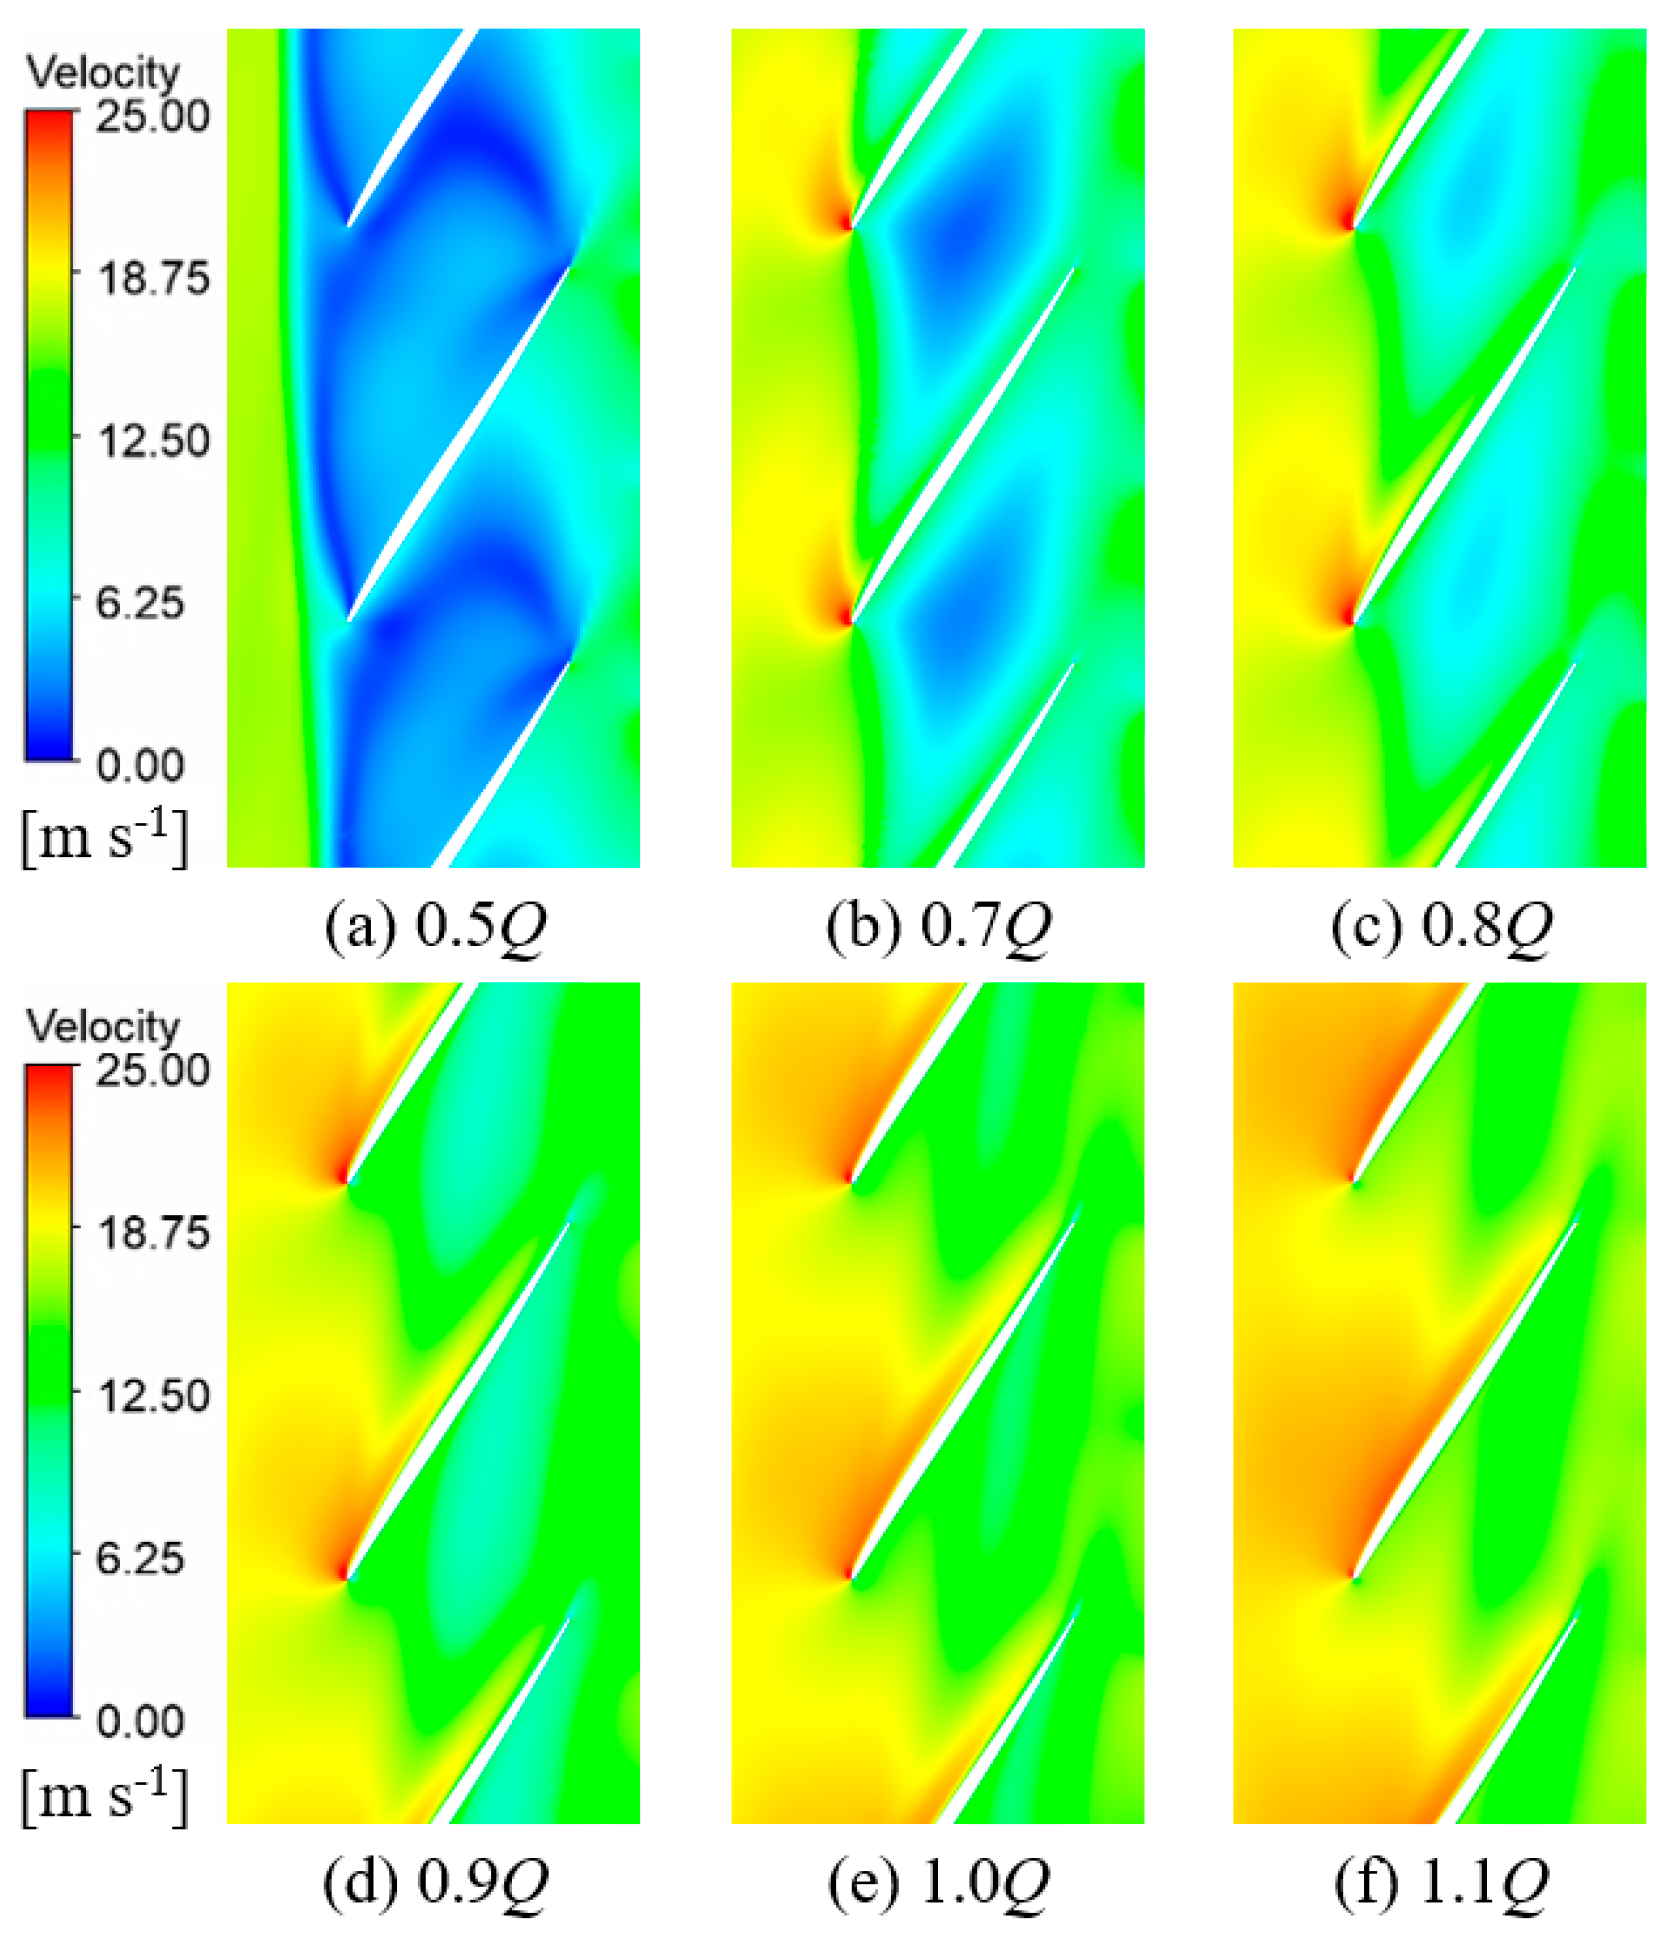
The cavitation stages in Figure 12, Figure 13, Figure 14, Figure 15 and Figure 16, including the cavitation inception stage, the cavitation development transition stage, the first critical cavitation stage, the critical cavitation stage, and the breakdown cavitation stage, strictly correspond to the characteristic points in Figure 11 cavitation performance curve. The cavitation inception stage in Figure 12 corresponds to point A in Figure 11. At this stage, the inlet pressure is high and the head is essentially stable, although weak cavitation, such as vortex cavitation, has appeared in the pump. The cavitation development transition stage in Figure 13 corresponds to point B in Figure 11. The NPSH is slightly reduced, the cavitation scale expands, and cloud cavitation begins to shed. The first critical cavitation stage in Figure 14 corresponds to point C in Figure 11. The NPSH is further reduced, with the cavitation vortex blocking about 2/3 of the flow channel, and the head begins to decrease significantly. The critical cavitation stage in Figure 15 corresponds to point D in Figure 11. The NPSH is reduced to the critical value corresponding to a 3% head drop, and the cavitation nearly fills the flow channel. The breakdown cavitation stage in Figure 16 corresponds to point E in Figure 11. The NPSH reaches its minimum value, cavitation completely blocks the flow channel, and the head is significantly reduced.

4.1. Cavitation Inception Stage

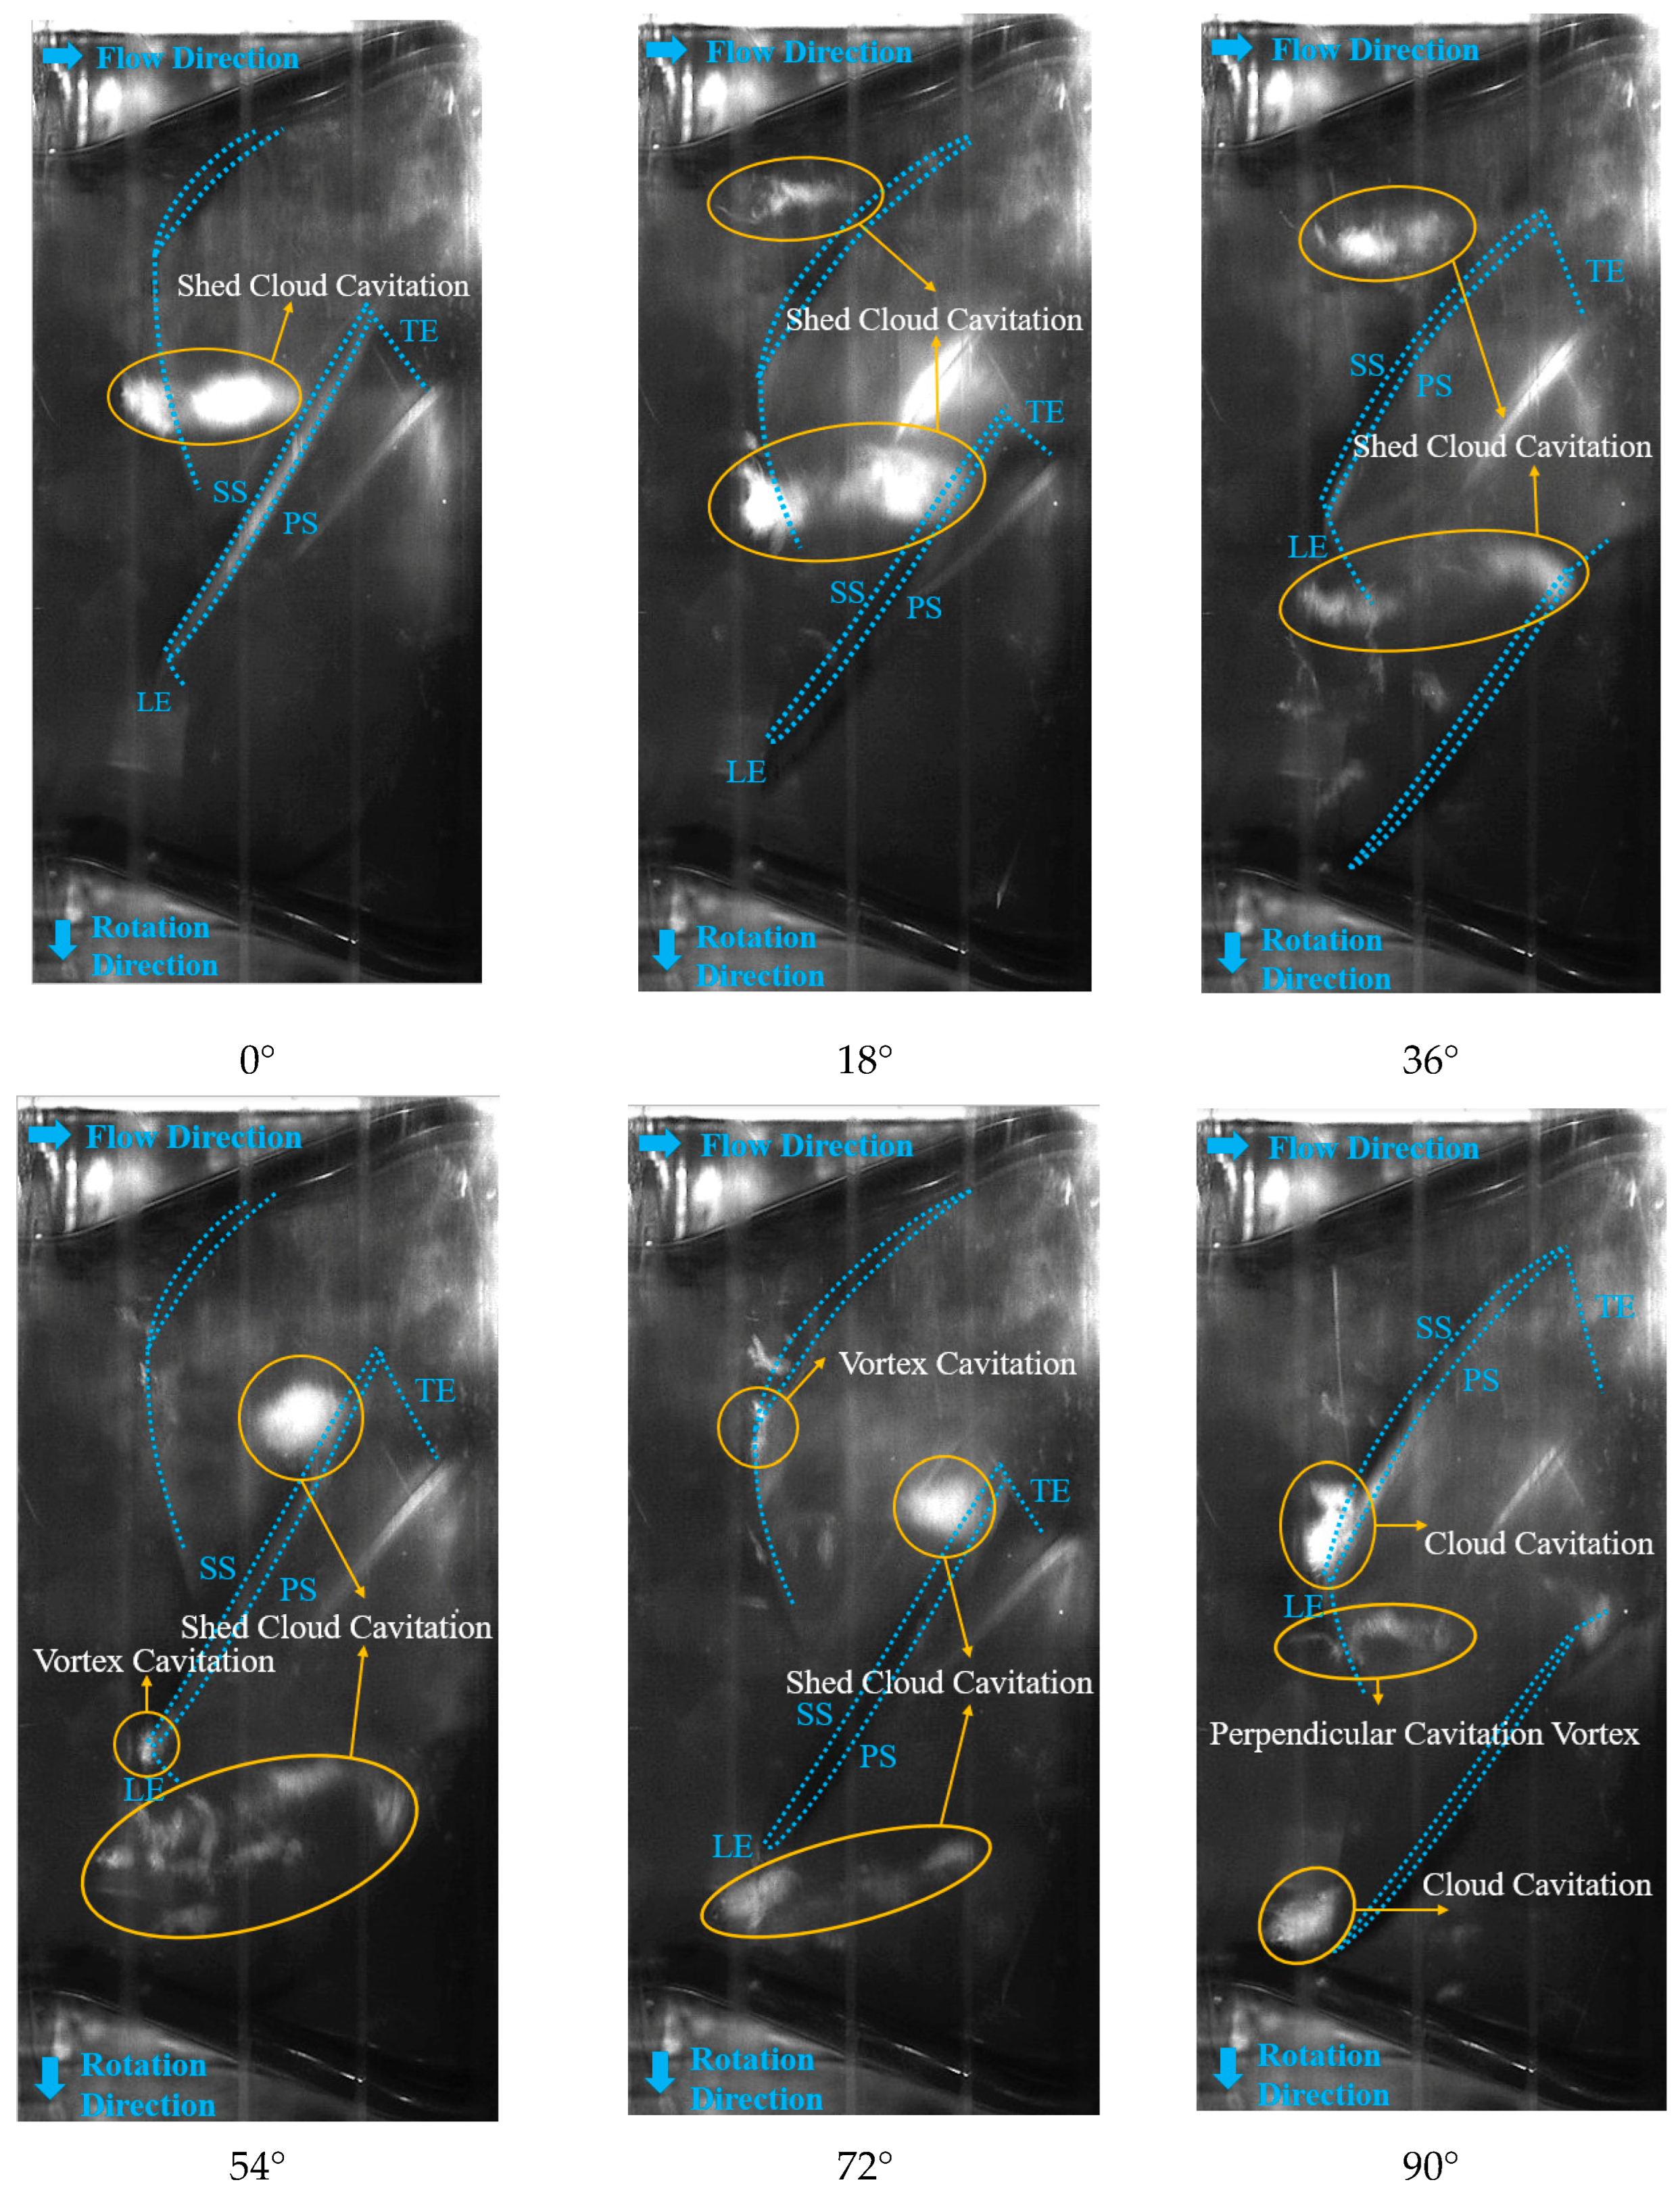
The angle values (0°, 18°, 36°, 54°, 72°, 90°) shown in Figure 12 represent the impeller rotation angles, set based on the matching relationship between the shooting parameters of the high-speed camera in the test and the impeller rotational speed.
For capturing the cavitation flow of the test pump, if the impeller rotational speed is n and the shooting frequency is f, the shooting angle α per frame is
α = n × 360 / 60 f
In the formula, α is the rotation angle of the impeller (°); n is the impeller speed (r/min).
In this experiment, only the cavitation flow structures at a test speed of 1200 r/min were captured. The high-speed camera was set to a frame rate of 2000 fps; that is, the impeller rotated 3.6° per frame captured. By selecting 18° as the interval (i.e., one image extracted every 5 frames), the dynamic evolution of cavitation structures with impeller rotation (such as the generation, shedding, migration, and collapse of cavitation) can be clearly captured, while avoiding information redundancy caused by excessively dense angle intervals.
These angles are directly related to the rotor position, with different angles corresponding to distinct circumferential positions of the impeller blades within the flow channel. For example, 0° corresponds to the initial position of a blade leading edge at the center of the observation field of view, and 18° and 36° represent the position after the impeller rotates by the corresponding angle. Through the continuous angle image sequence, the relative position changes of cavitation structures with respect to the blades and the flow channel during rotor rotation can be visually displayed, thereby revealing the dynamic coupling mechanism between cavitation and rotor motion.
During the cavitation inception stage in Figure 12, the main types of cavitation in the flow passage are vortex cavitation, cloud cavitation, and perpendicular vortex cavitation. The vortex cavitation occurs near the leading edge of the impeller blade. As the impeller rotates, the vortex cavitation develops into the cloud cavitation and eventually sheds. Subsequently, the vortex cavitation reoccurs near the impeller leading edge close to the shroud, while the shed cloud cavitation collapses and dissipates after forming the perpendicular cavitation vortex in the middle of the flow passage.

4.2. Cavitation Development Transition Stage

During the cavitation development transition stage in Figure 13, the main types of cavitation in the flow passage are cloud cavitation, shed cloud cavitation, and perpendicular cavitation vortex. The cloud cavitation occurs near the suction side of the impeller blade, close to the leading edge, and grows and gradually sheds as the impeller rotates. The shed cloud cavitation collapses and dissipates after forming perpendicular cavitation vortexes in the center of the flow channel. Compared to the cavitation inception stage, the cavity dimensions in the cavitation development transition stage increase.

4.3. First Critical Cavitation Stage

During the first critical cavitation stage in Figure 14, the main types of cavitation in the flow channel are the same as those in the cavitation inception stage. During the observation period, there is a significant variation in cavity size between adjacent flow passages. The cavitation vortex almost blocks 2/3 of the flow passage. However, the cavities in the other flow passage are much smaller in dimension. Small-scale cloud cavitation is present near the leading edge of the impeller blade, gradually shedding as the impeller rotates. The shed cloud cavitation collapses and dissipates after forming perpendicular cavitation vortexes in the flow passage.

4.4. Critical Cavitation Stage

During the critical cavitation stage in Figure 15, the main types of cavitation in the flow passage are the same as those in the cavitation inception stage. The cloud cavitation occurs near the suction side of the impeller blade close to the leading edge and grows and gradually sheds as the impeller rotates. In adjacent flow passages, one is almost completely blocked by cavities, while the other is blocked by approximately 1/3 in the circumferential direction.

4.5. Breakdown Cavitation Stage

During the breakdown cavitation stage in Figure 16, the main types of cavitation in the flow passage are the same as those in the cavitation inception stage. The cloud cavitation occurs near the suction side of the impeller blade, close to the leading edge, and grows and gradually sheds as the impeller rotates. Accompanied by the rotation of the cavitation vortex, the shed cloud cavitation gradually moves downstream. In adjacent flow passages, the middle of one is almost blocked by cavities, while the other is blocked by approximately 1/2 in the circumferential direction.

5. Evolution of Flow Structure in the Pump

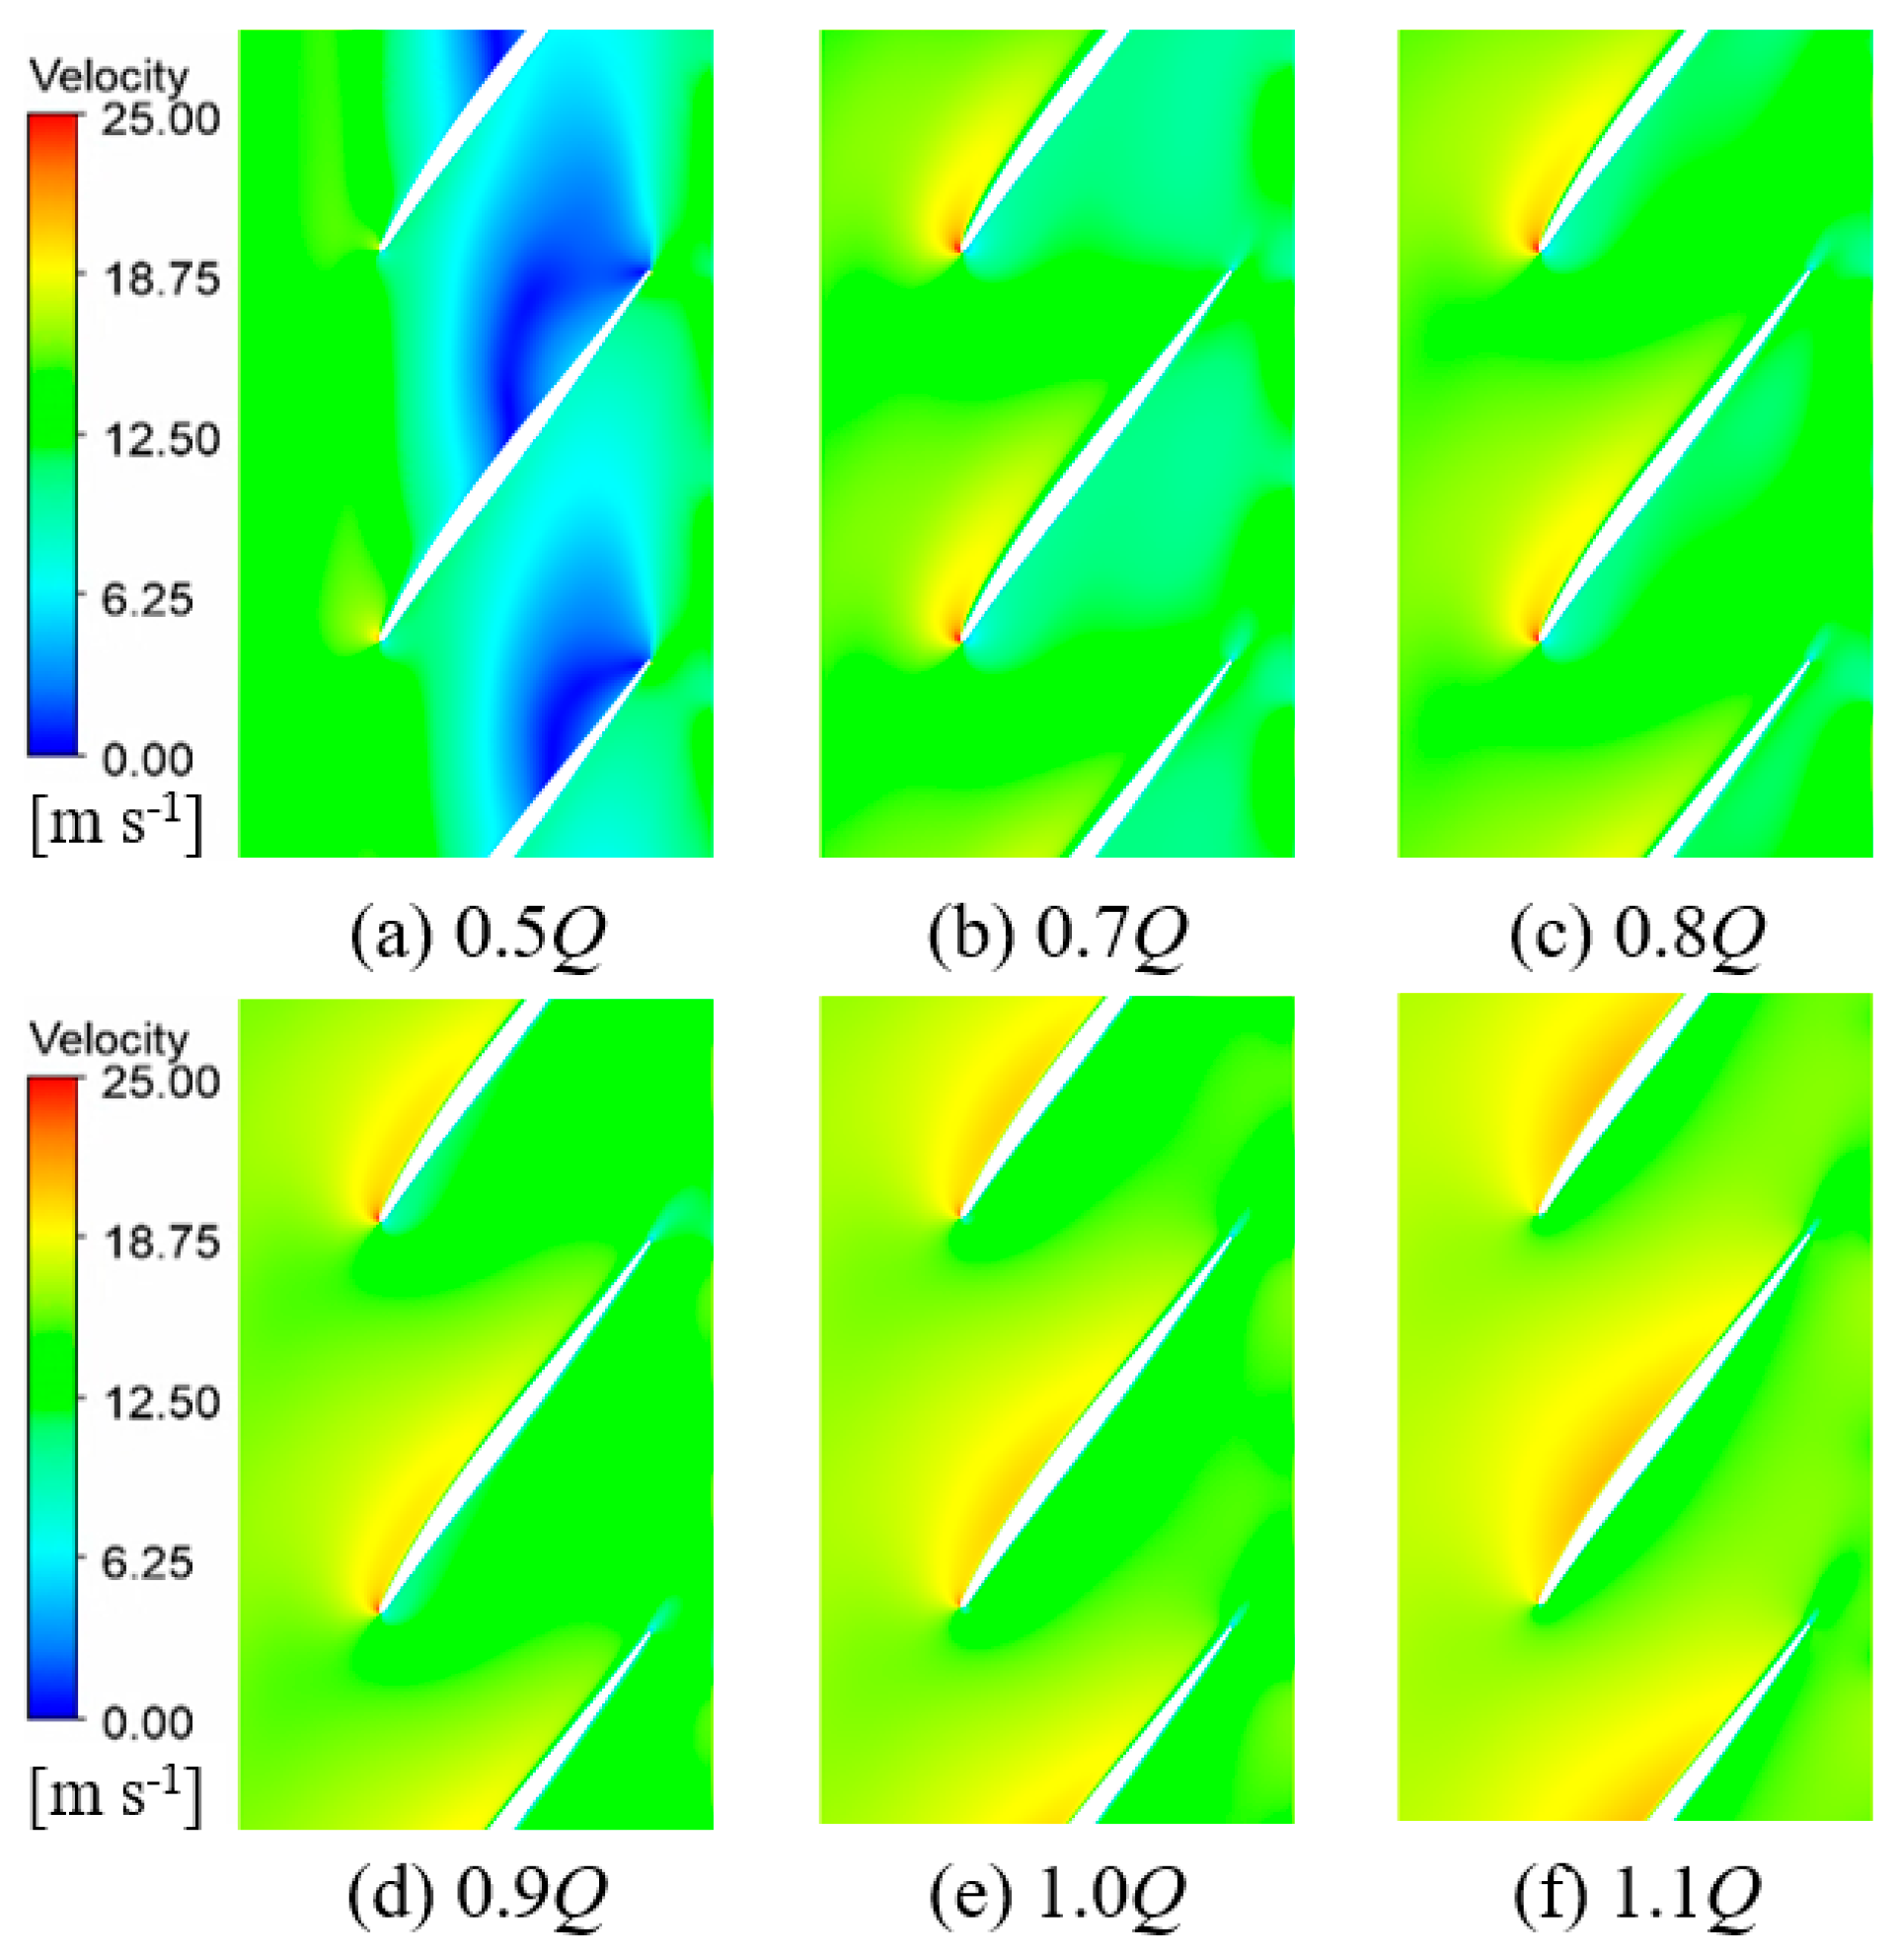
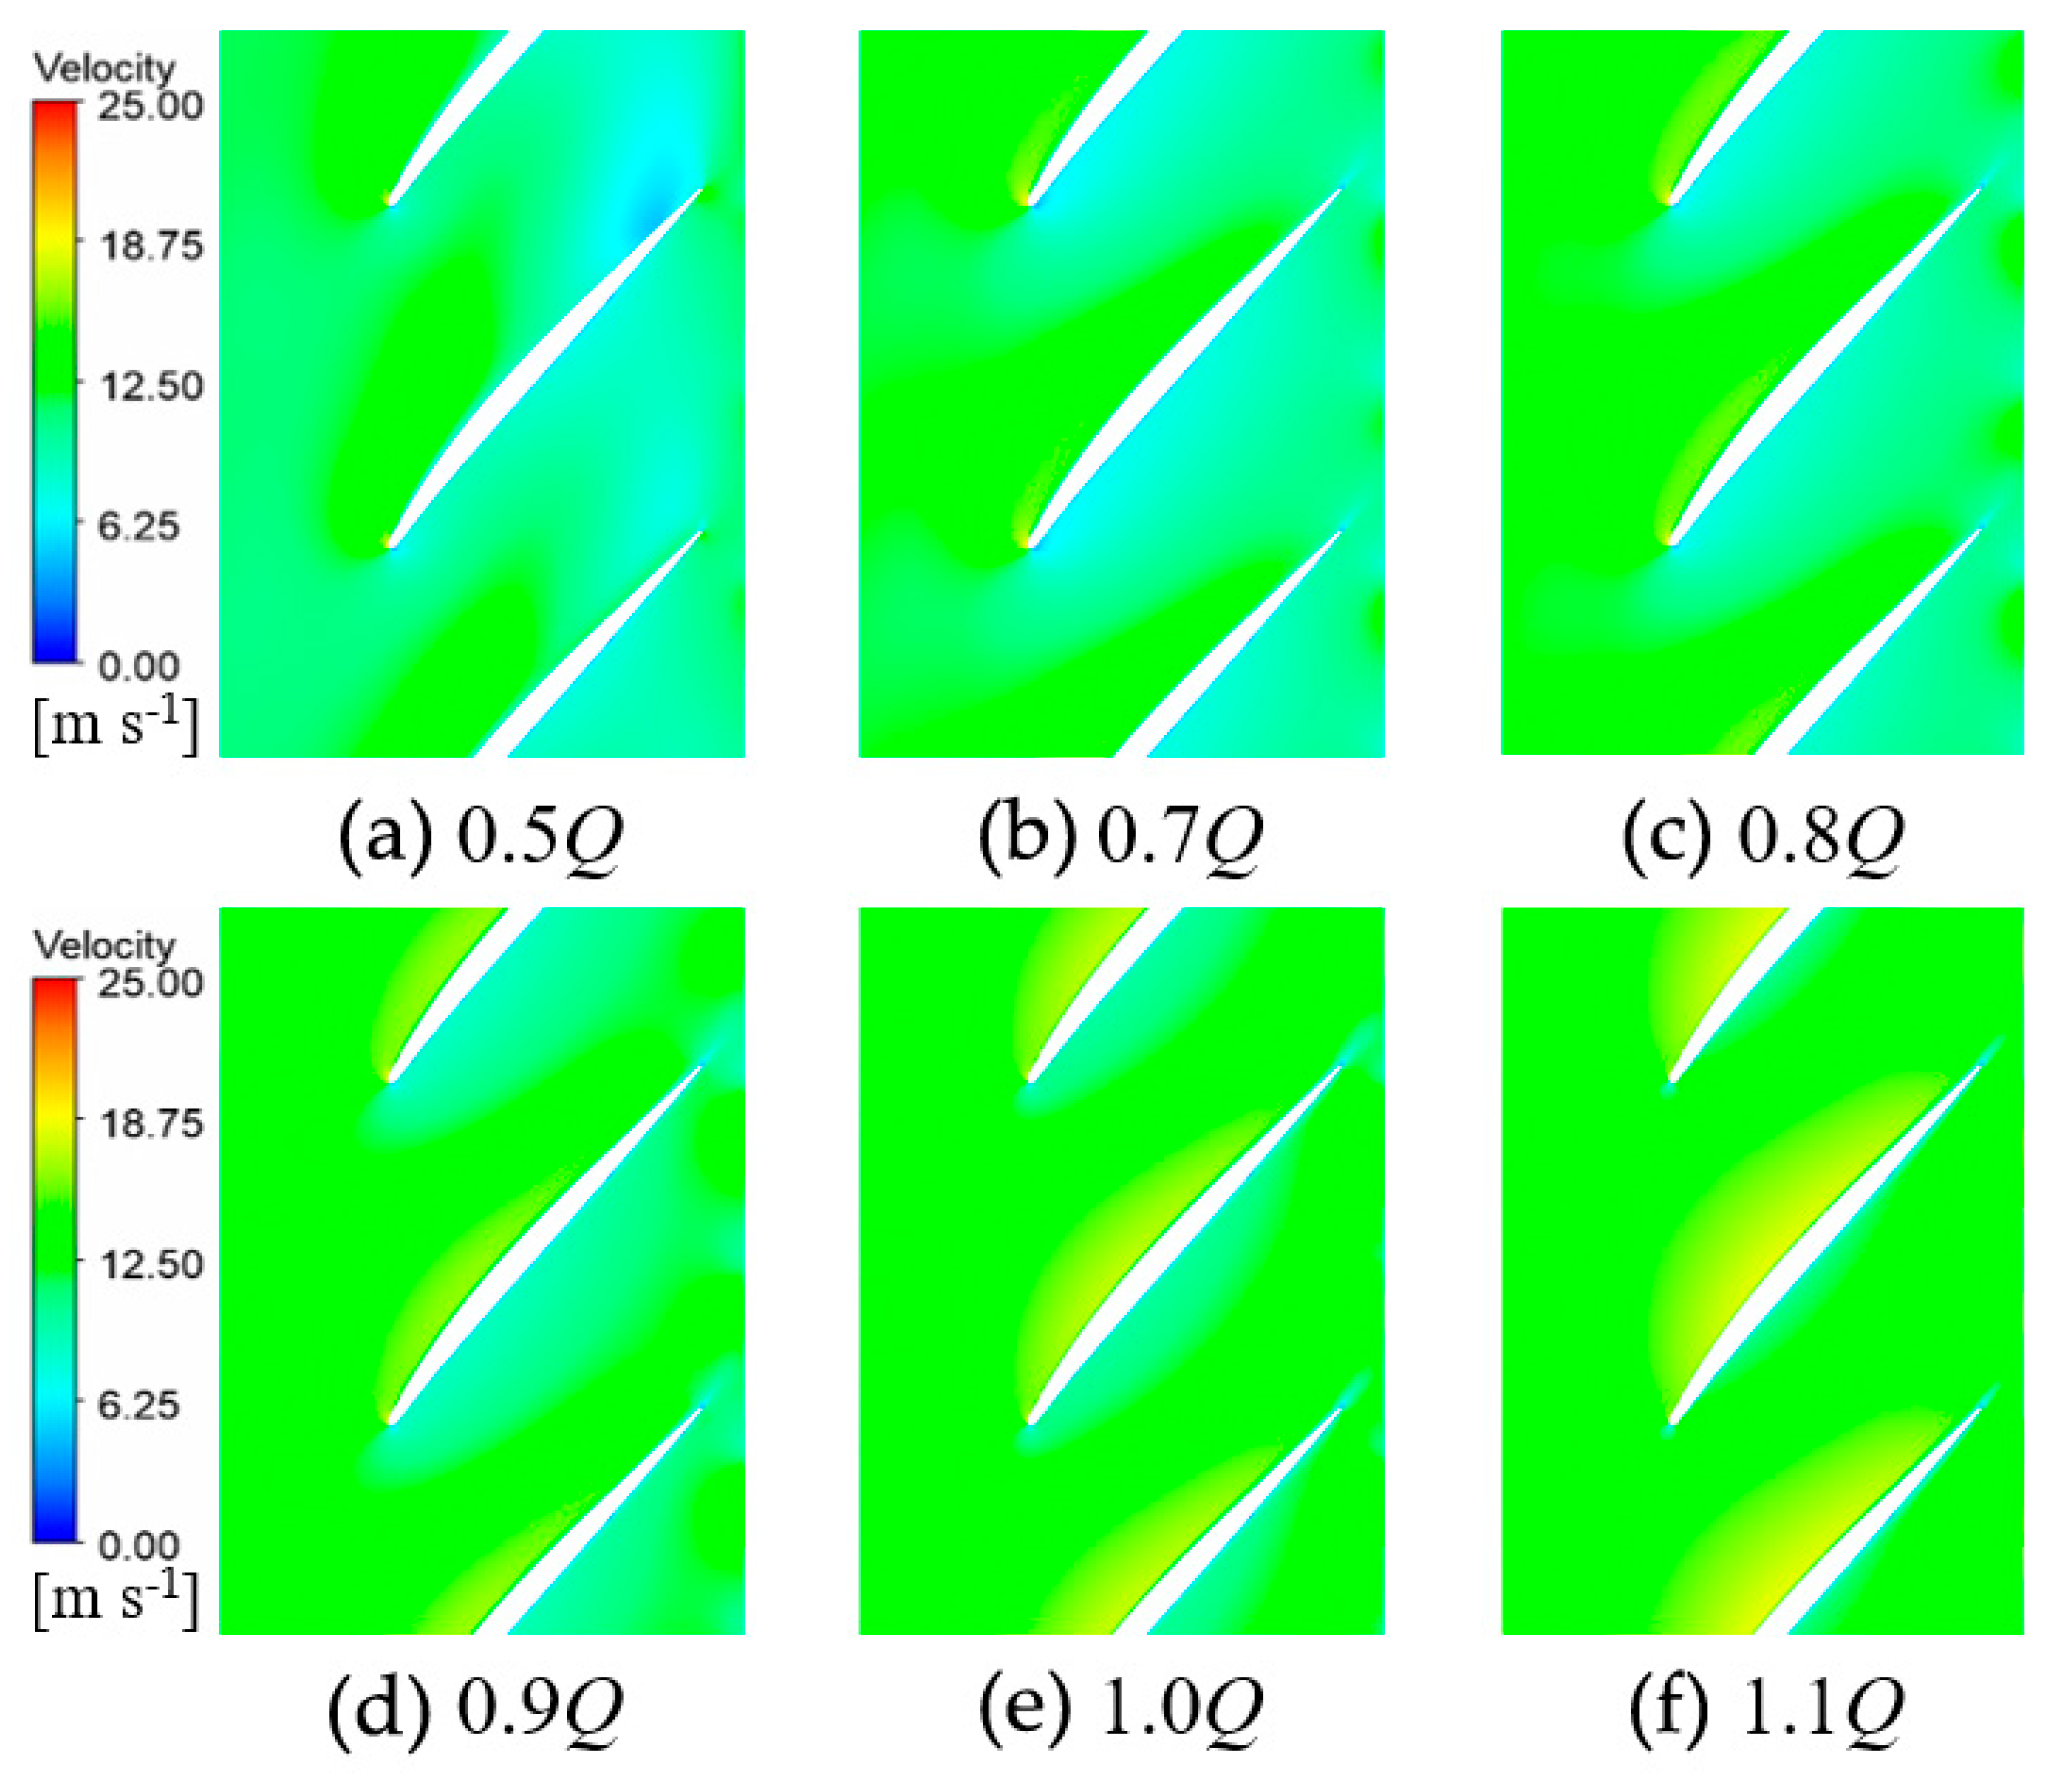
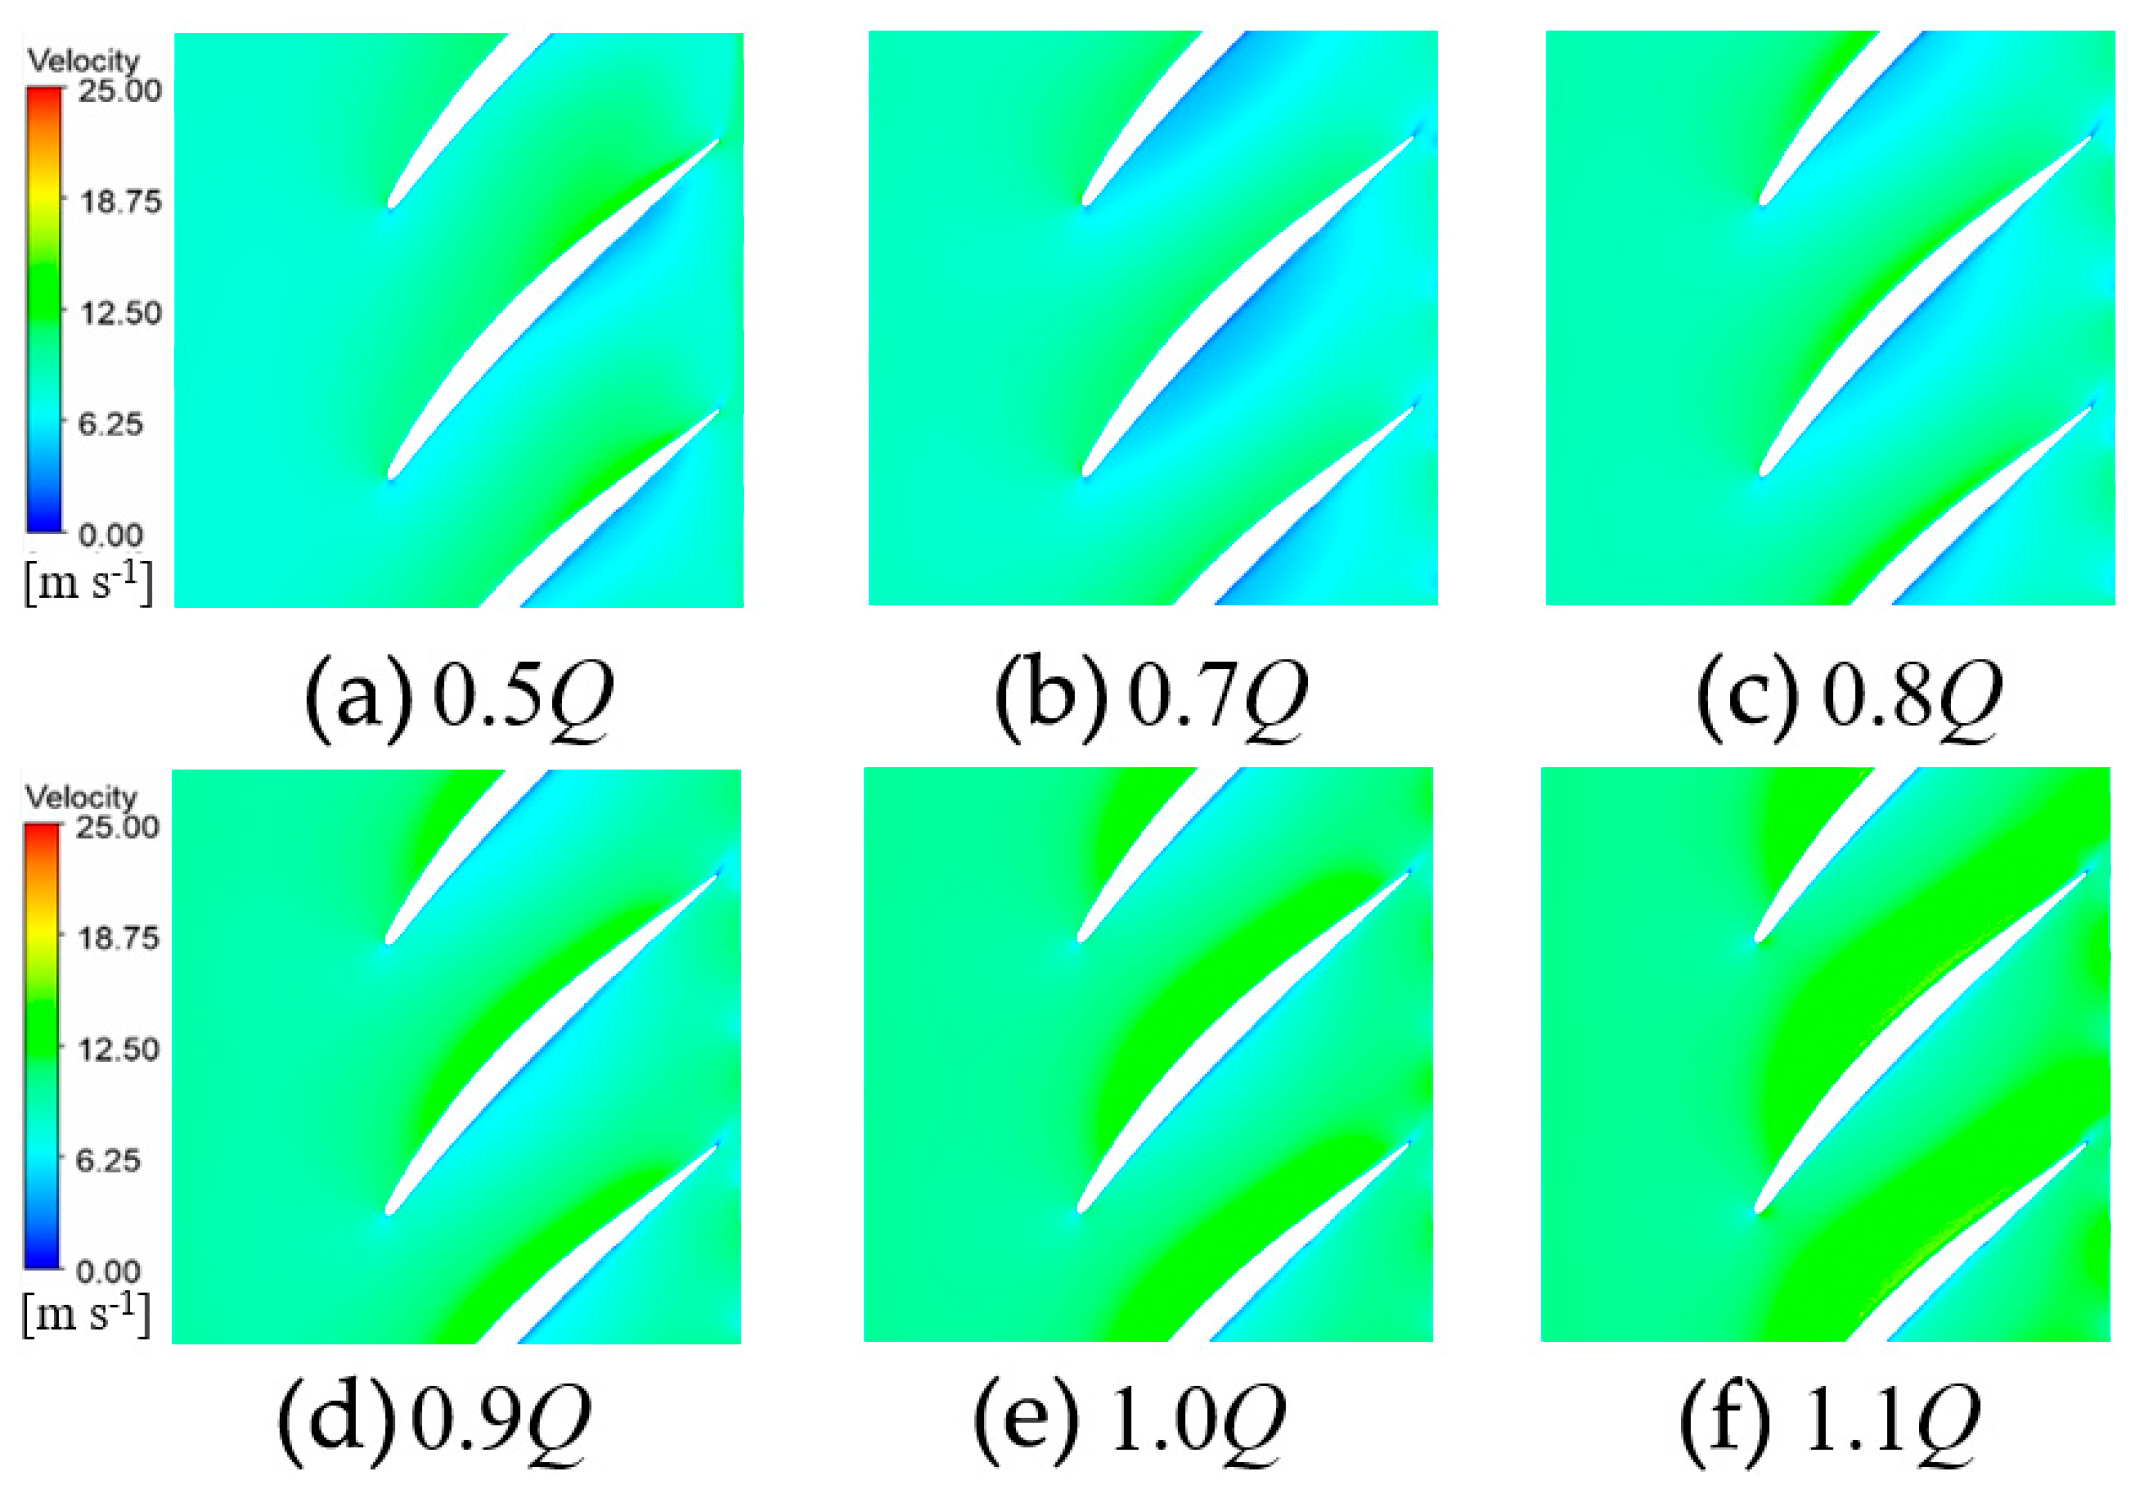
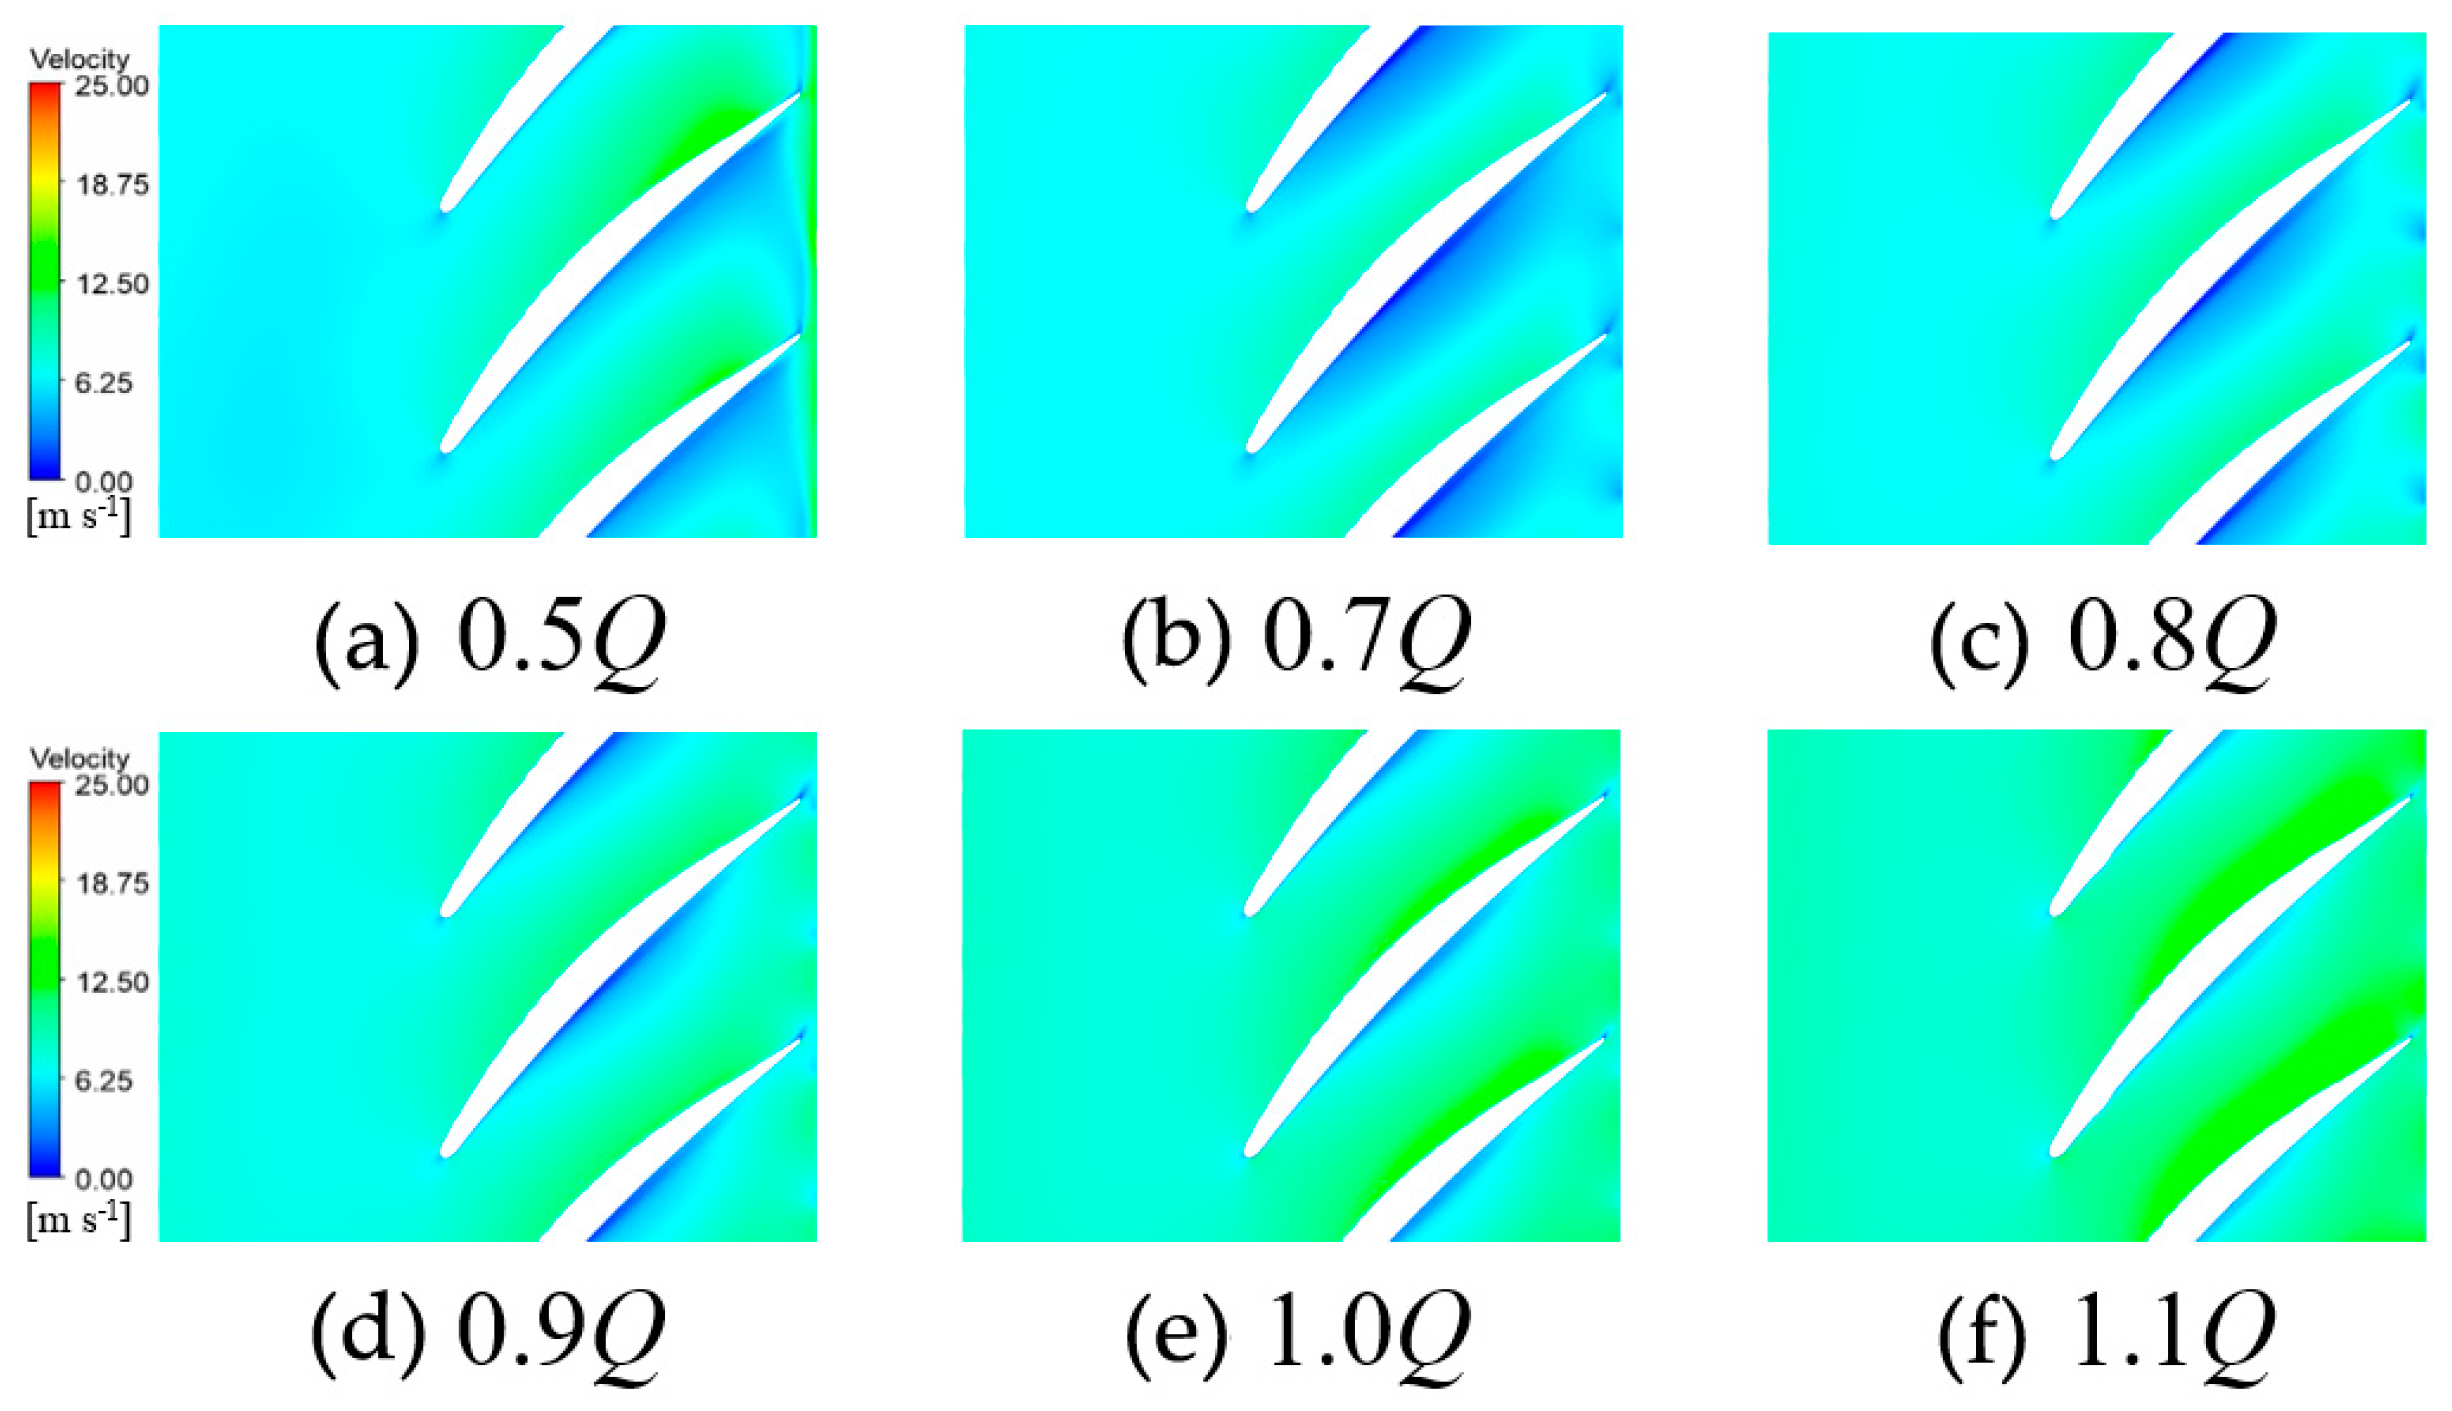
As fluid flows through the blades, non-uniform velocity distribution induces variations in the pressure field. If the local pressure falls below the critical value, the liquid vaporizes and forms bubbles. The impact generated when the bubbles collapse can cause material damage and performance degradation. This analysis focuses on velocity distribution diagrams at spans of 0.95, 0.75, 0.5, 0.25, and 0.1 from the blade tip to the pump root, at flow rates of 0.5Q, 0.7Q, 0.8Q, 0.9Q, 1.0Q, and 1.1Q, and at a speed of 1200 rpm. We explored the velocity distribution characteristics of different span sections, the influence of flow angle and secondary flows on the development of cavitation, and the steady-state flow field through analysis.

5.1. Analysis of Velocity Distribution Characteristics in Different Span Sections

Figure 17 shows the velocity distribution at 0.95 span of the pump under different flow rate conditions. At the small flow rate condition of 0.5Q, there is an obvious low-velocity zone at the tip edge. This may be due to the excessive inlet incidence angle of the blade, leading to backflow. As the flow rate increases to 1.0Q, the mainstream velocity rises to 19.4 m/s, and the high-velocity zone becomes concentrated on the pressure surface of the blade. At the high flow rate condition of 1.1Q, the leakage flow from the tip clearance overlaps with the mainstream, resulting in a local flow velocity of 22.2–25.0 m/s and the formation of a high-velocity zone. At high flow rates, the high-velocity zone at the blade tip induces a sudden pressure drop, easily triggering clearance cavitation, particularly near the blade’s outlet edge.
Figure 18 shows the velocity distribution at 0.75 span of the pump under different flow rates. At the flow rate condition of 0.7Q, the velocity distribution exhibits a gradient change. The midpoint of the suction surface has a velocity peak of 16.7 m/s, while the velocity on the pressure surface remains relatively uniform. At the design flow rate condition of 1.0Q, the velocity symmetry of the section is optimal, with an average flow velocity of approximately 19.4 m/s. However, under flow rate conditions of 0.5Q, 0.8Q, 0.9Q, and 1.1Q, the velocity distribution deviates from symmetry, and local eddy current zones emerge. The secondary flow intensity in this area is moderate. However, when the flow rate deviates from the design point, boundary layer separation is prone to occur due to an increased velocity gradient.
Figure 19 shows the velocity distribution at 0.50 span of the pump under different flow rate conditions. At the small flow rate condition of 0.5Q, the velocity distribution is asymmetric, and a low-velocity zone of 12.5–15.3 m/s emerges at the leading edge of the suction surface due to an excessive inlet incidence angle. At the flow rate condition of 0.8Q, a high-velocity mainstream of 19.1 m/s forms at the section center, and the velocity gradient near the blade suction surface is significant. At the design flow rate condition of 1.0Q, the symmetry is optimal, the velocity distribution is uniform, and the mainstream velocity stabilizes at 20.5 m/s.
Figure 20 shows the velocity distribution at 0.25 span of the pump under different flow rate conditions. At the flow rate condition of 0.5Q, the flow velocity at the blade root is only 11.1–13.9 m/s due to the hub boundary layer thickening, and there is obvious circumferential flow velocity non-uniformity. At the design flow rate condition of 1.0Q, the mainstream velocity increases to between 16.7 and 19.4 m/s. However, a low-velocity recirculation zone still exists near the hub. At the high flow rate condition of 1.1Q, the flow velocity distribution at the blade root tends to be uniform; however, a local acceleration phenomenon occurs at the hub-blade junction. Due to the coupling of centrifugal force and pressure gradient in the blade root region, radial secondary flow is prone to formation, which exacerbates boundary layer separation.
Figure 21 shows the velocity distribution at 0.10 span of the pump under different flow rate conditions. The flow velocity in this region is generally lower than 13.9 m/s. At flow rates between 0.5Q and 0.9Q, large-area low-velocity zones emerge, which may induce hub cavitation. At the design flow rate condition of 1.0Q, the flow velocity near the blade inlet edge increases slightly to 16.7 m/s. However, the overall flow is still dominated by the hub boundary layer. At the high flow rate condition of 1.1Q, the flow velocity distribution at the blade root end exhibits the characteristic of being high at the edges and low at the center. In the near-blade root region, the secondary flow intensity is the highest and prone to forming vortex clusters, which leads to intensified pressure fluctuations and exacerbates cavitation development.

5.2. Analysis of Pressure Distribution Characteristics

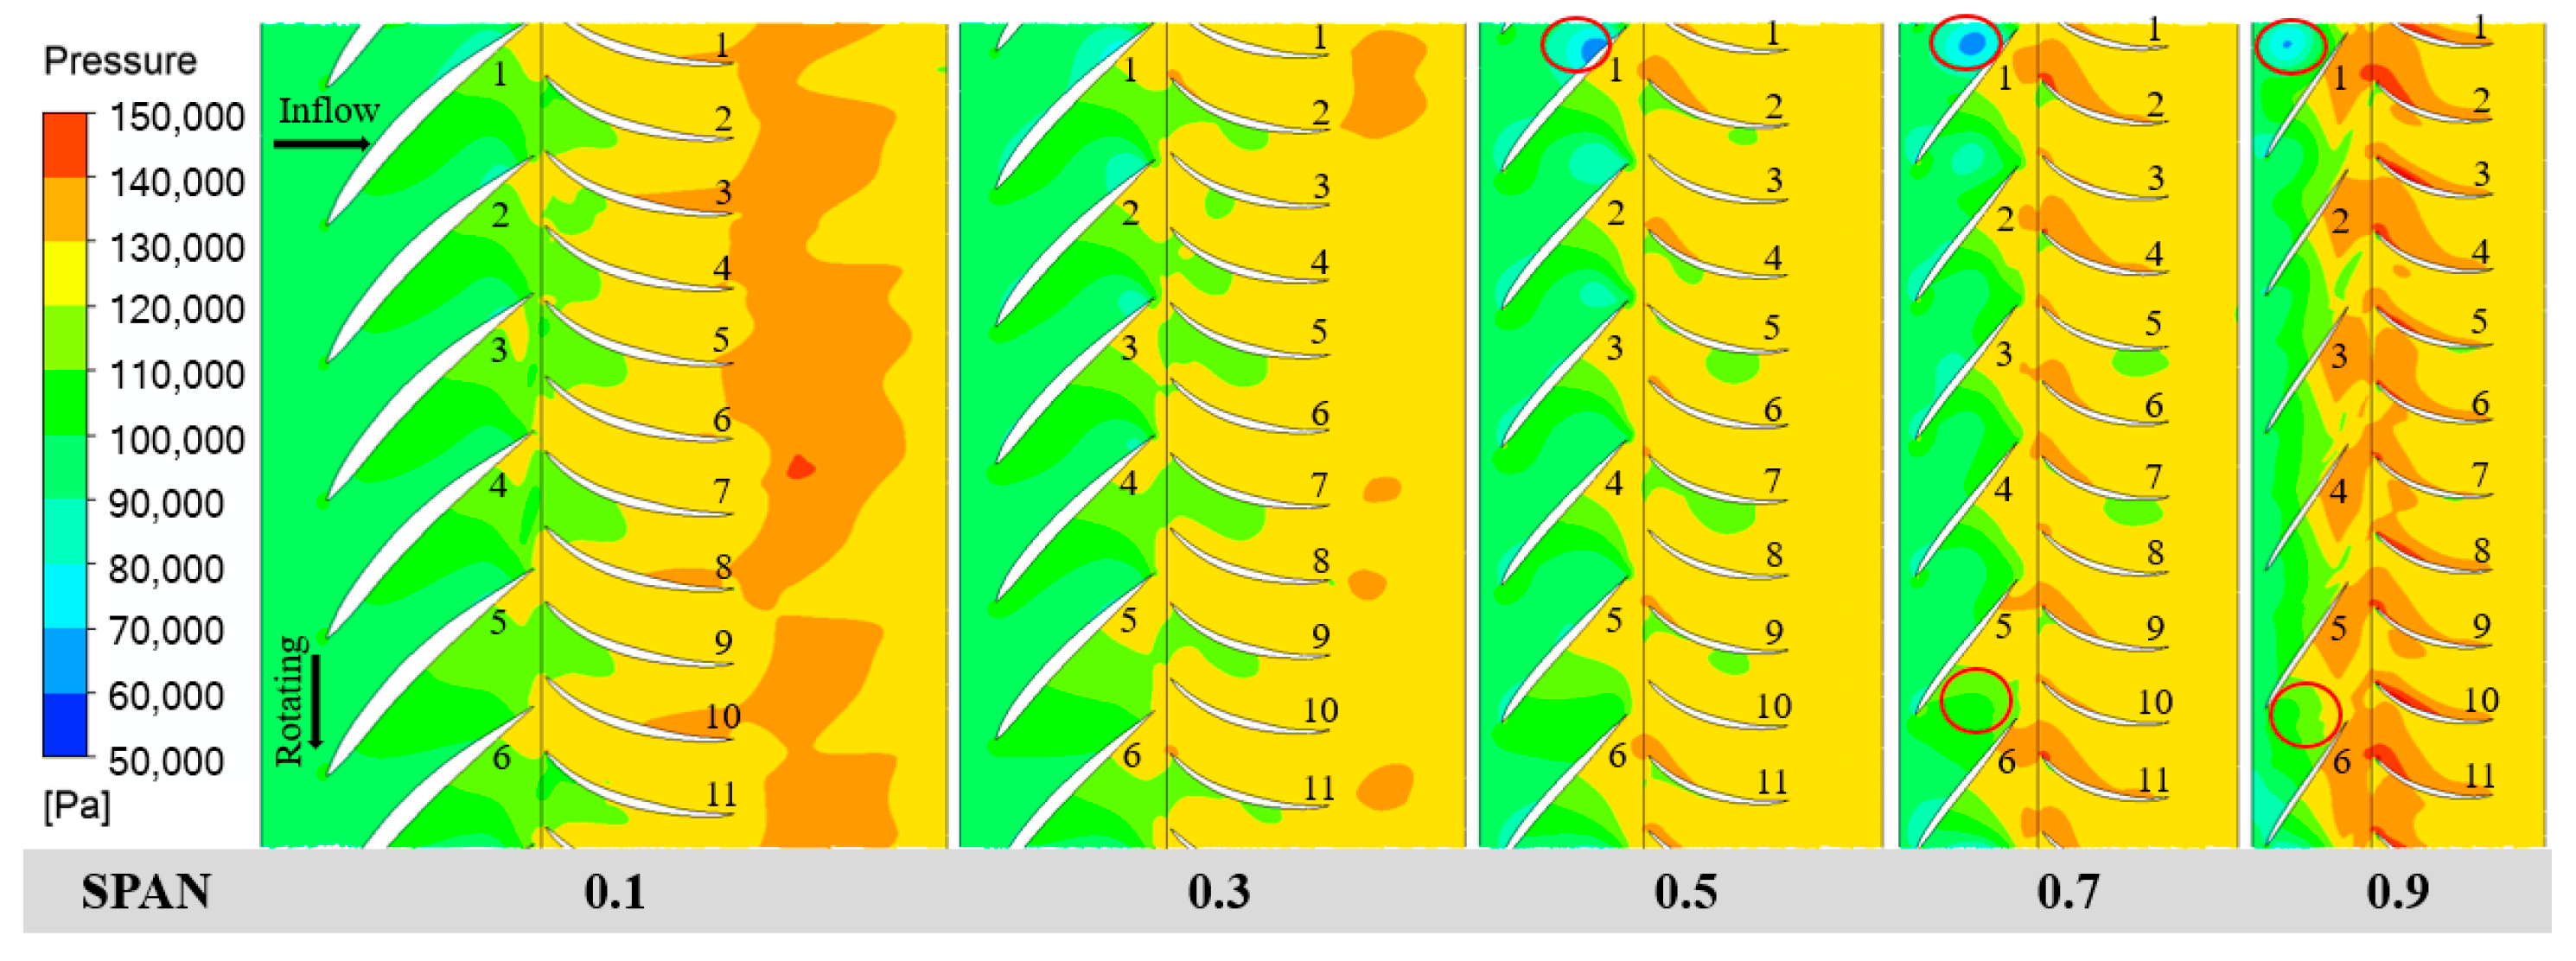
To further analyze the pressure distribution and flow characteristics on different blade surfaces and in flow passages under the valley condition, the pressure distribution contours at various spanwise heights in the impeller and diffuser flow domains are extracted, as shown in Figure 22. For ease of description, the flow passage formed by Blade 1 and Blade 2 is referred to as Passage 1, and the other passages are numbered similarly. It can be seen from Figure 22 that under the valley condition, there is a low-pressure region in Passage 6, which eventually results in lower pressure in some areas of the suction surface of Blade 1 and the pressure surface of Blade 6 compared to the average blade pressure; the pressure in Passage 5 is slightly higher than that in other passages, ultimately leading to lower pressure in some regions of the pressure surface of Blade 5 and the suction surface of Blade 6 relative to the average blade pressure. In addition, it is noted that there are scattered high- and low-pressure regions in some flow passages, indicating uneven pressure distribution with large variations in the flow passages, and complex flow structures such as backflow, secondary flow, and vortices may exist in these regions.
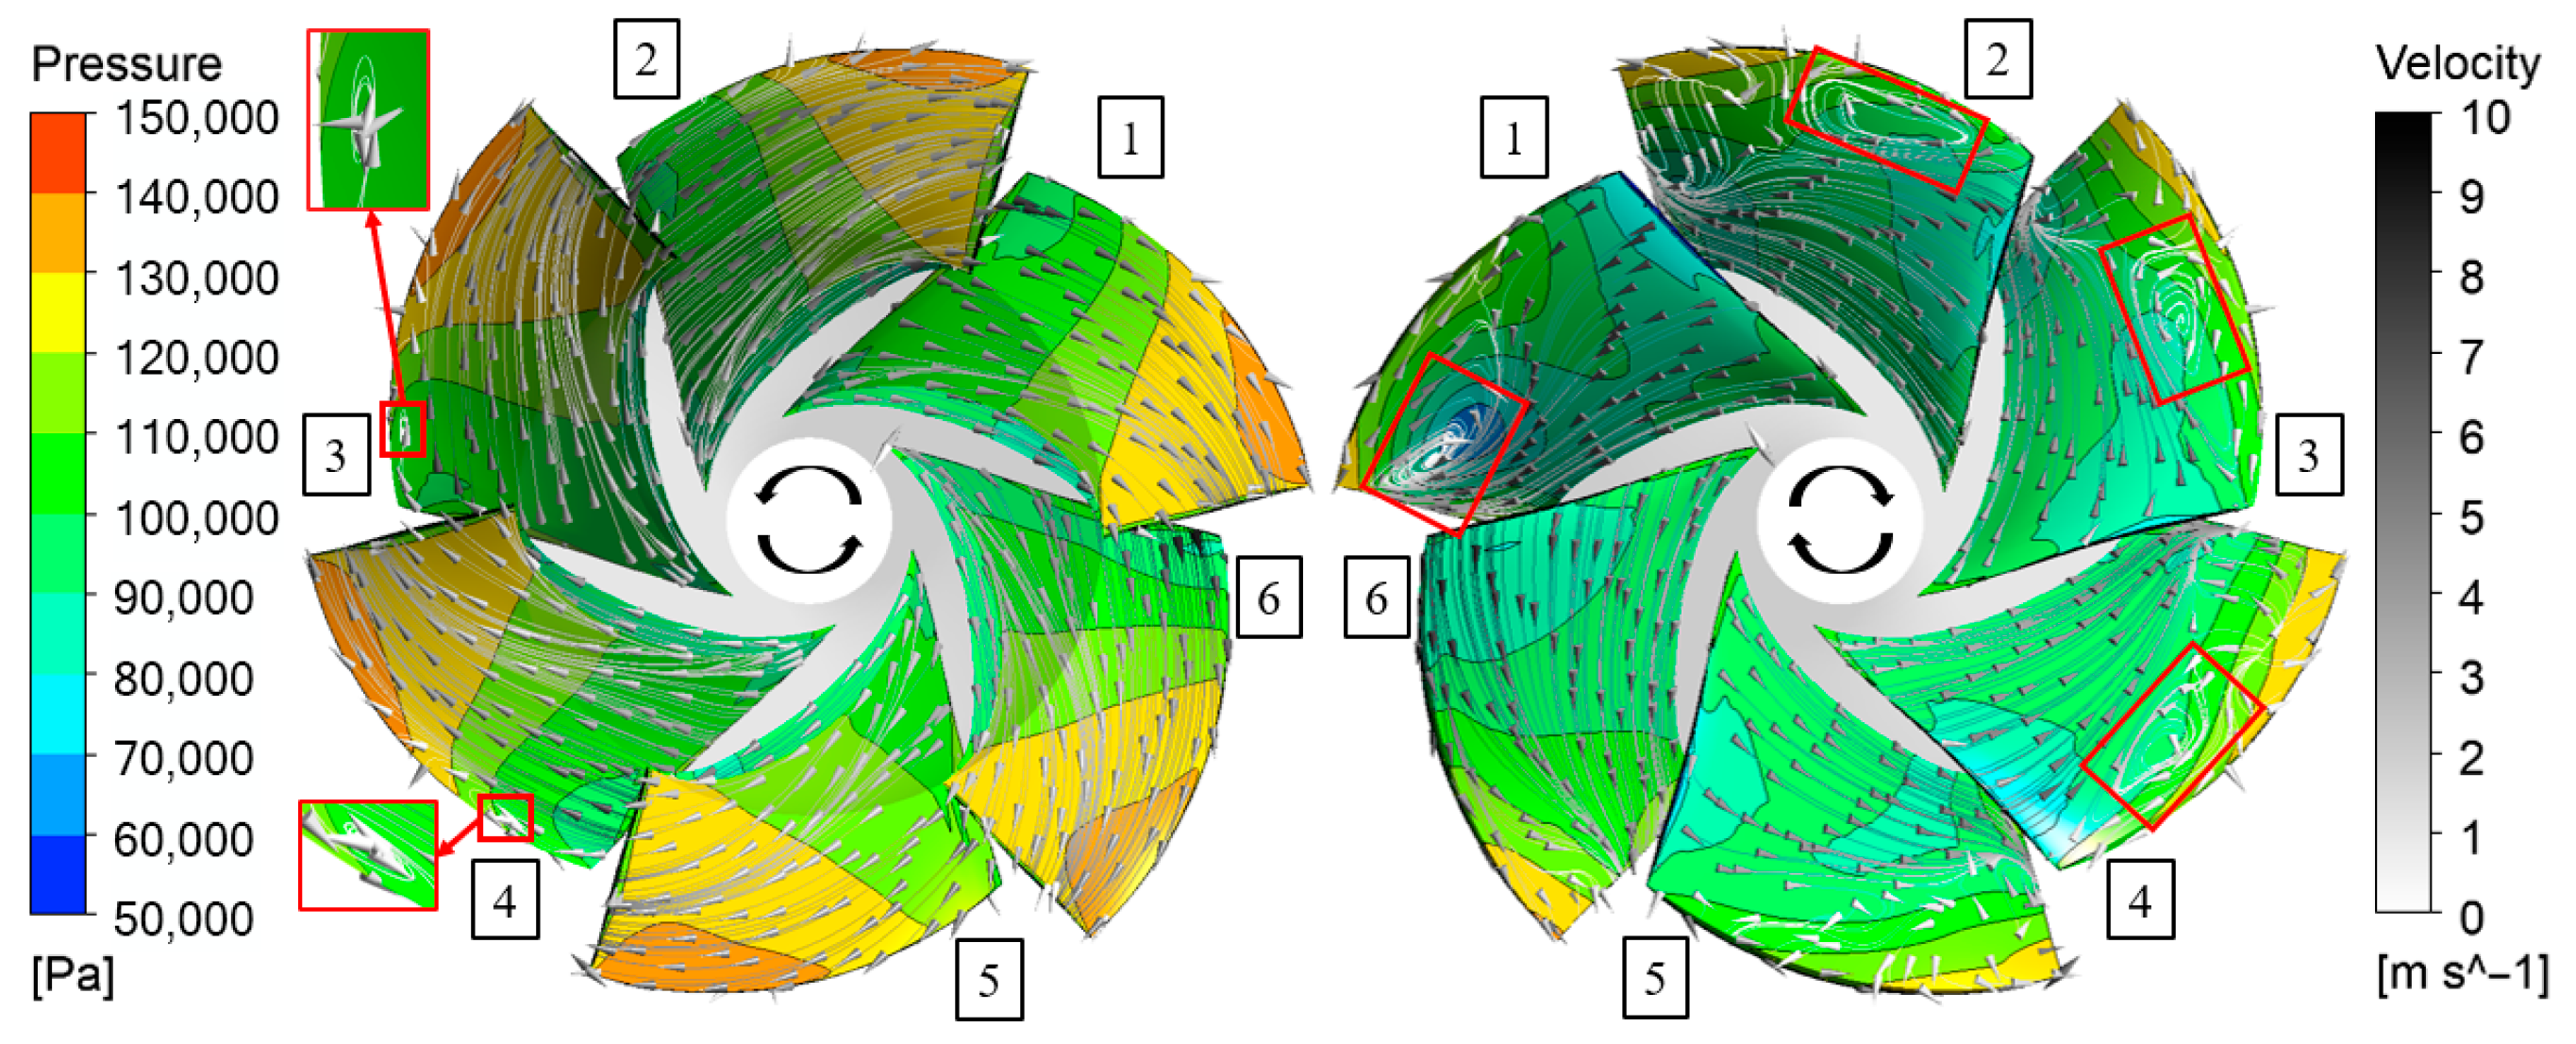
Figure 23 shows the pressure and streamline distributions of impeller blades under the valley condition. It can be observed that even under the valley condition, the streamlines on the pressure surfaces of impeller blades are relatively smooth and uniform. However, on suction surfaces with larger spanwise heights, flow structures such as flow separation and vortices exist, and significant differences in flow patterns are observed among different blades.

5.3. Coupling Mechanisms of Pressure Fluctuations and Cavitation

To fully reveal the transient flow characteristics and internal flow mechanisms in the hump region of a water-jet pump, unsteady numerical simulations were conducted at the trough and crest operating conditions. This enabled the study and analysis of pressure pulsation characteristics within the pump.
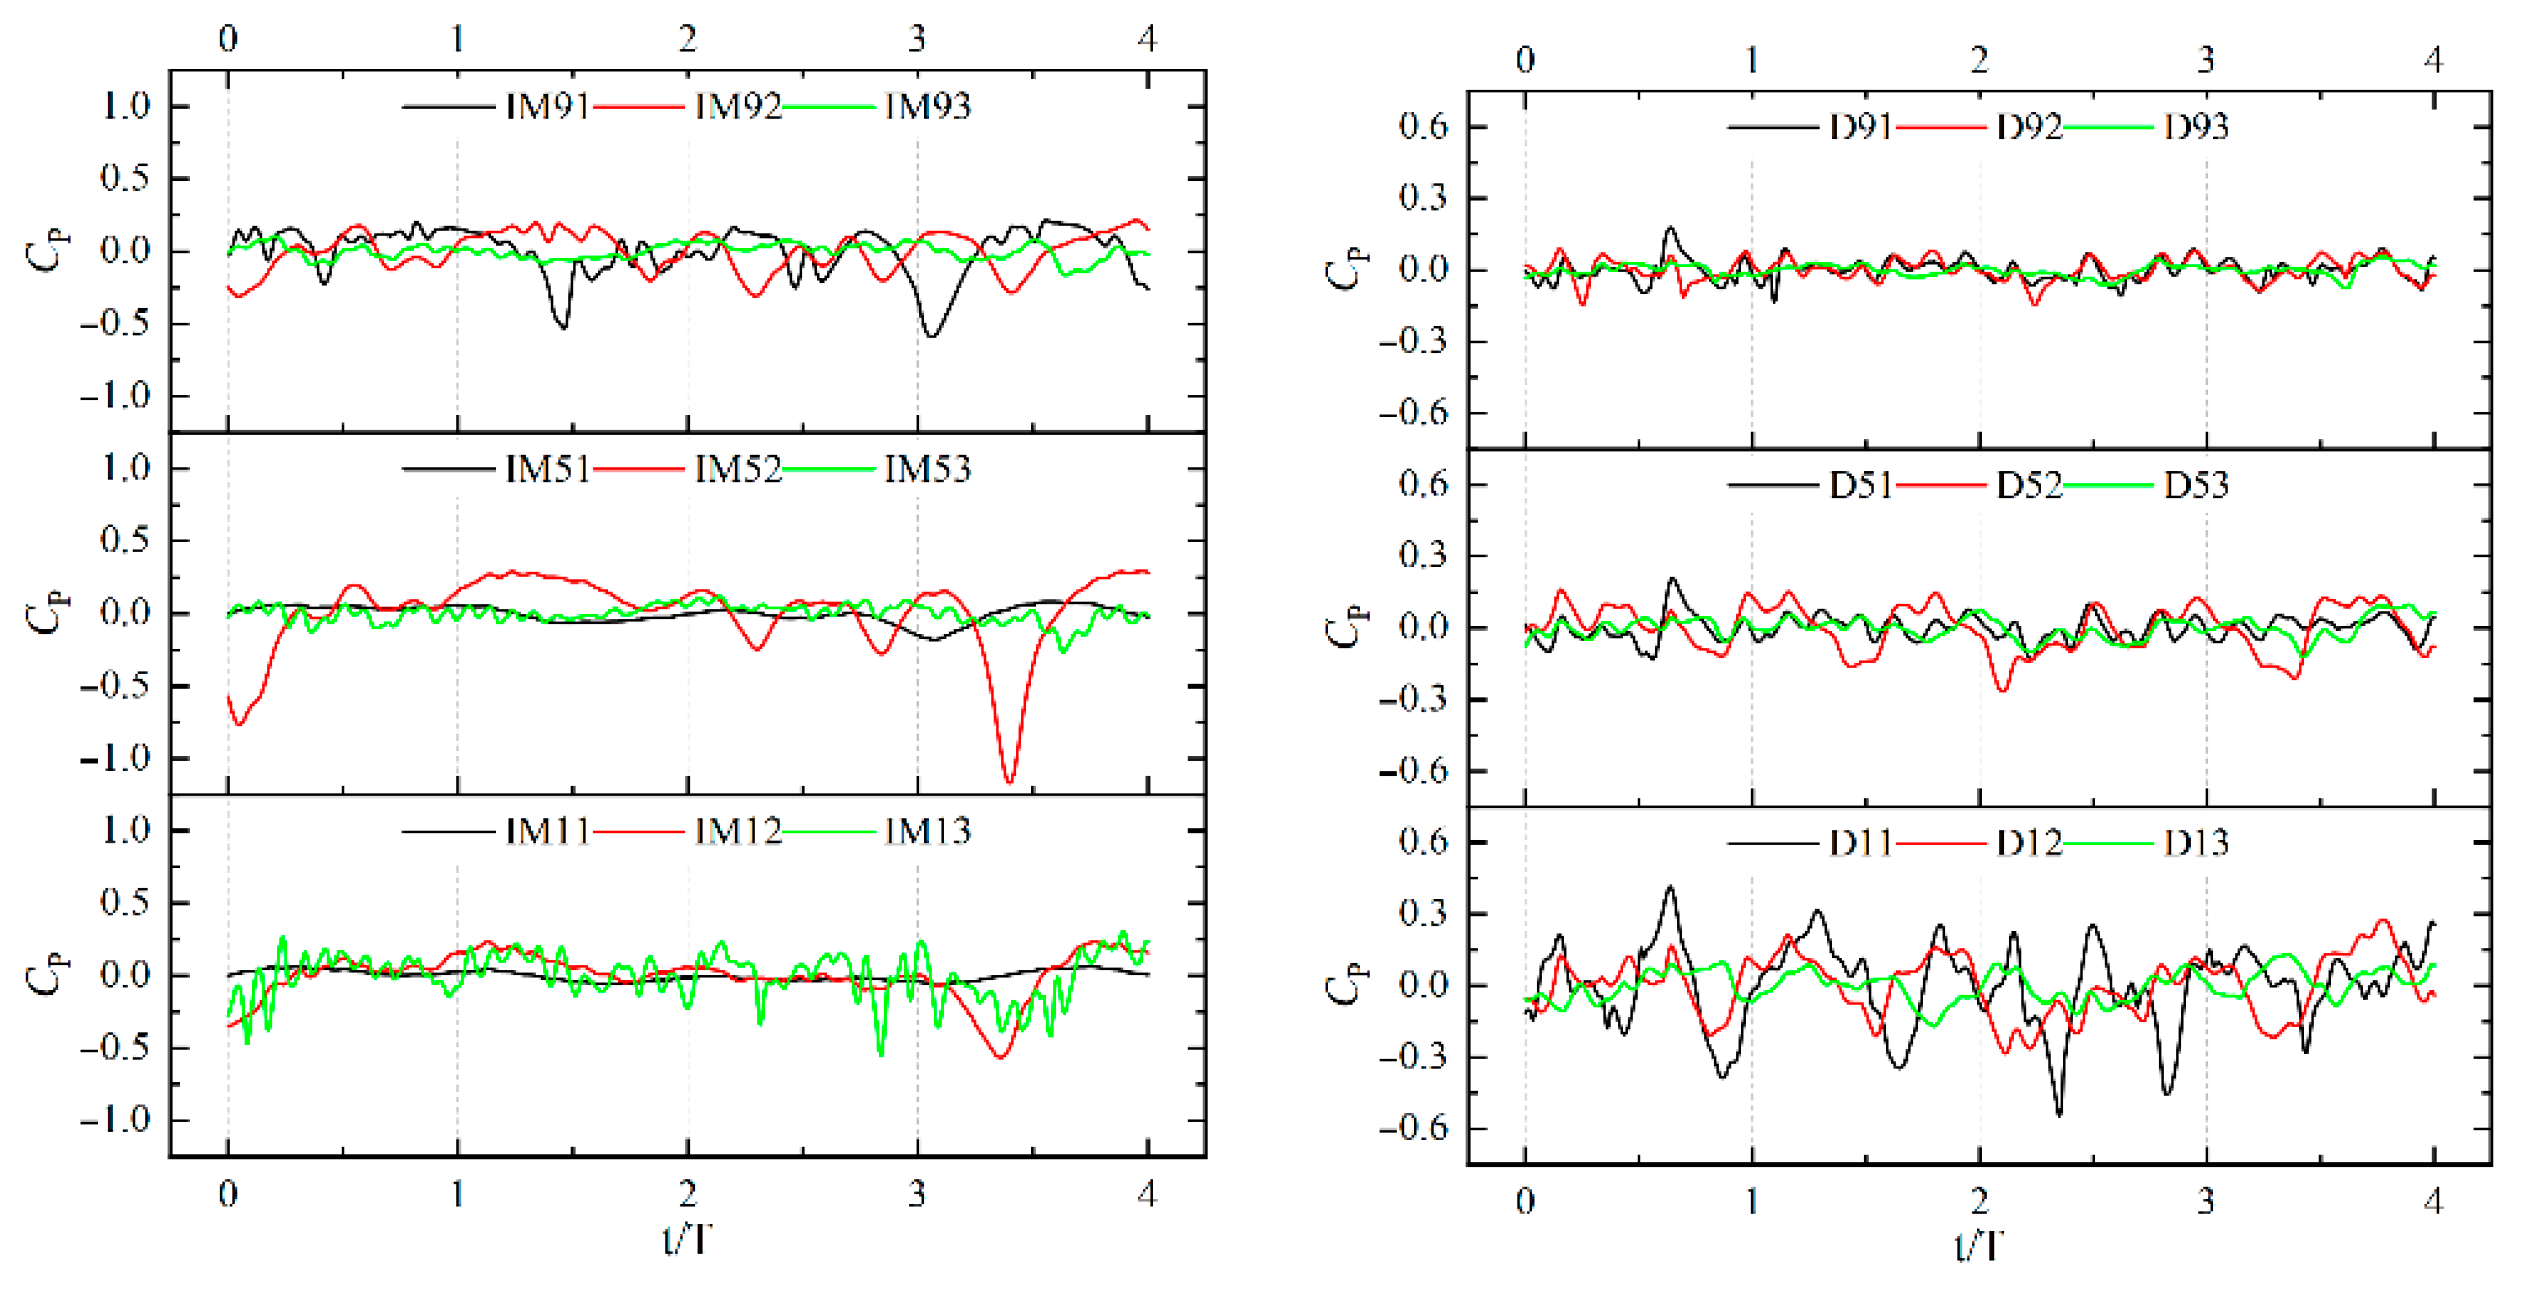
Figure 24 shows the time domain diagram of pressure pulsation in the pump under the valley condition. Under the valley condition, significant pressure pulsation is observed in the impeller inlet section at span = 0.9 and the diffuser middle section at span = 0.1. The pulsation in the inlet section of the former is significant, and that in the middle section of the latter is prominent. The number of peaks in each cycle is consistent with the number of diffuser blades and impeller blades, respectively. The frequency is concentrated at 0.25 and 1.5 times the shaft frequency, consistent with the vortex cavitation position in the cavitation inception stage. The positive feedback cycle of ‘pressure pulsation-cavitation’ is formed; that is, the pressure pulsation causes the local pressure to periodically drop below the saturated vapor pressure, inducing vortex core cavitation, while the collapse of cavitation bubbles exacerbates pressure fluctuation. The analysis of pressure pulsation corresponds to the cavitation inception stage shown in Figure 12.

5.4. Driving Mechanism of Re-Entrant Jets on Cavitation

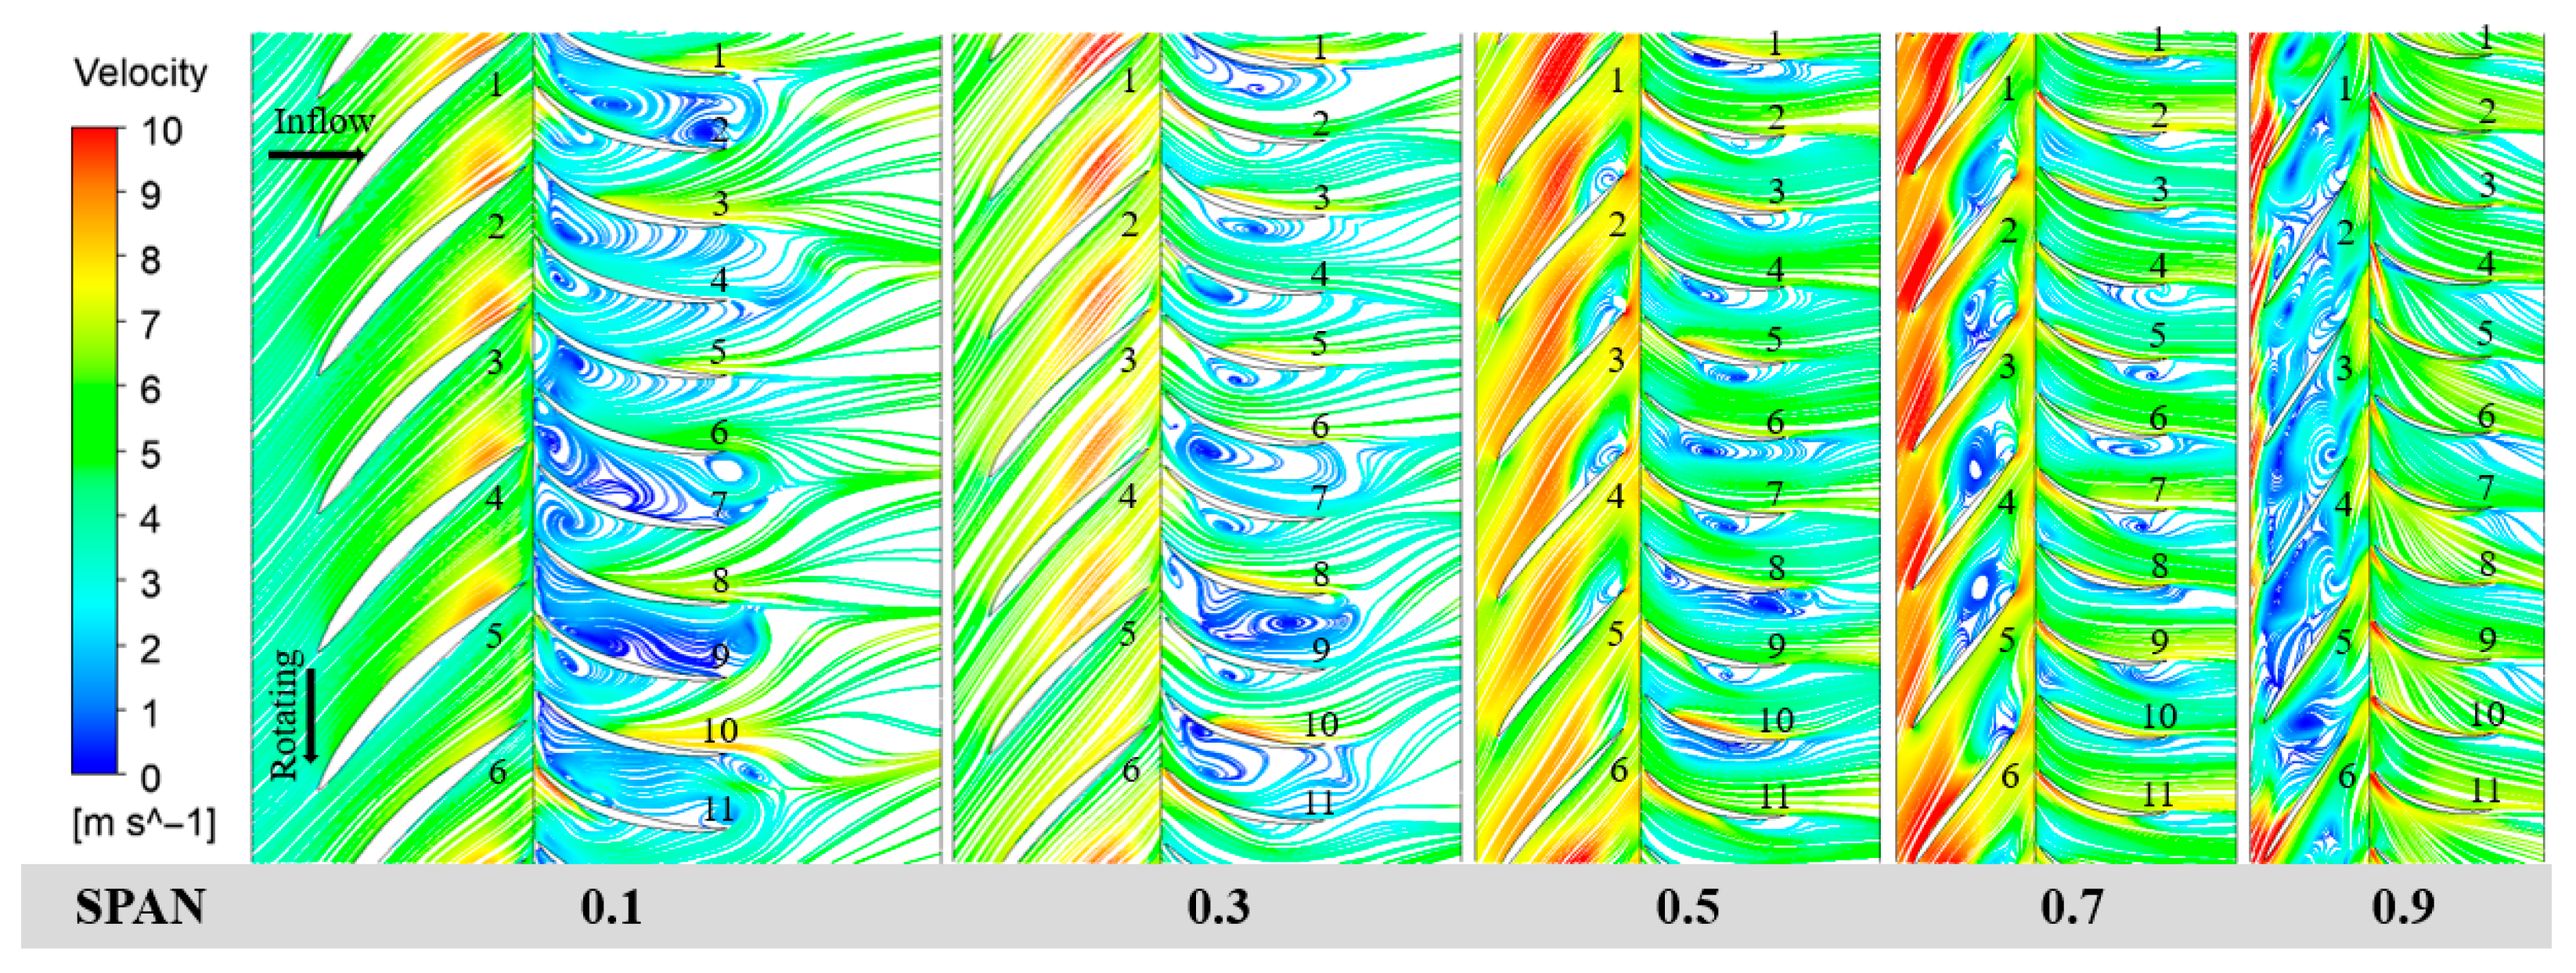
In order to further analyze the flow state in different flow channels under valley conditions, the streamline distribution at different spanwise heights in the impeller and diffuser flow domains are extracted, as shown in Figure 25. It can be seen from Figure 25 that under the valley condition, large-scale backflow vortices and flow separation exist inside the impeller and diffuser. As the spanwise height increases, the locations where backflow vortex and flow separation occur gradually shift from the diffuser to the impeller. The generation of a backflow vortex blocks the flow channel, ultimately leading to a decrease in the head of the water-jet pump. The shear action between the backflow vortex and the mainstream forms a strong vortex structure; the pressure at the vortex core is lower than the vapor pressure, inducing vortex cavitation.

5.5. Distribution of Vortex Cores in the Pump

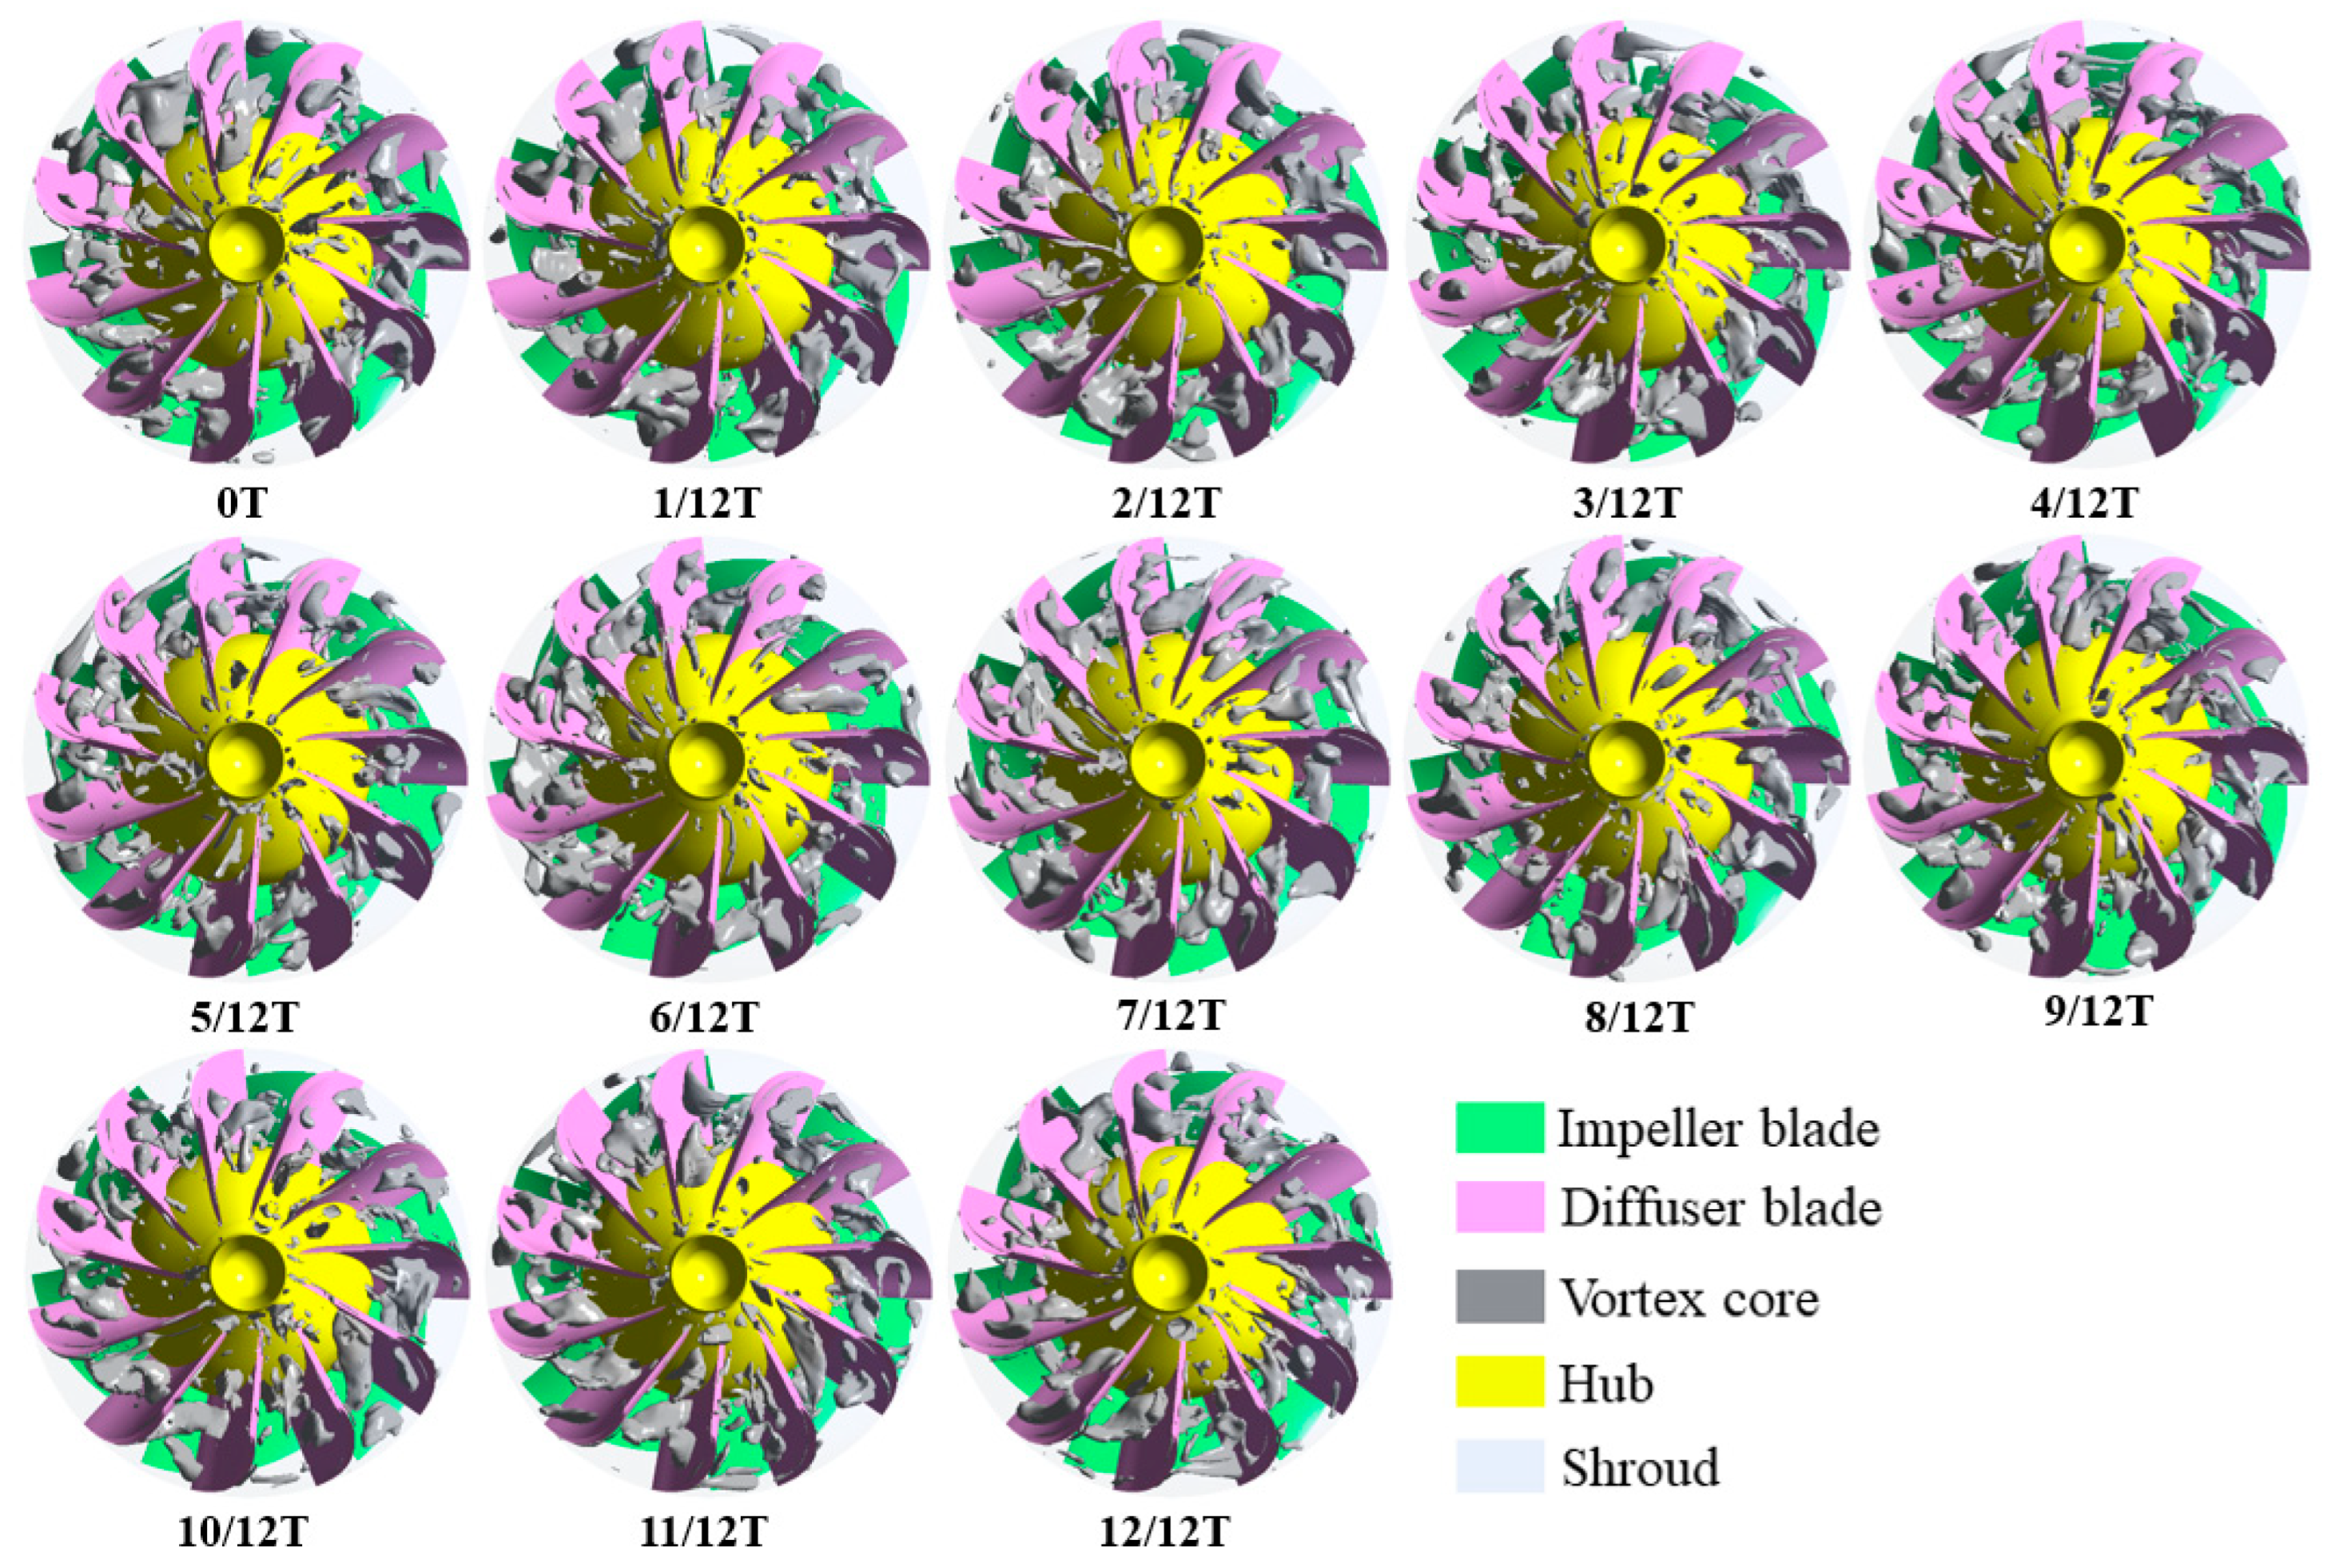
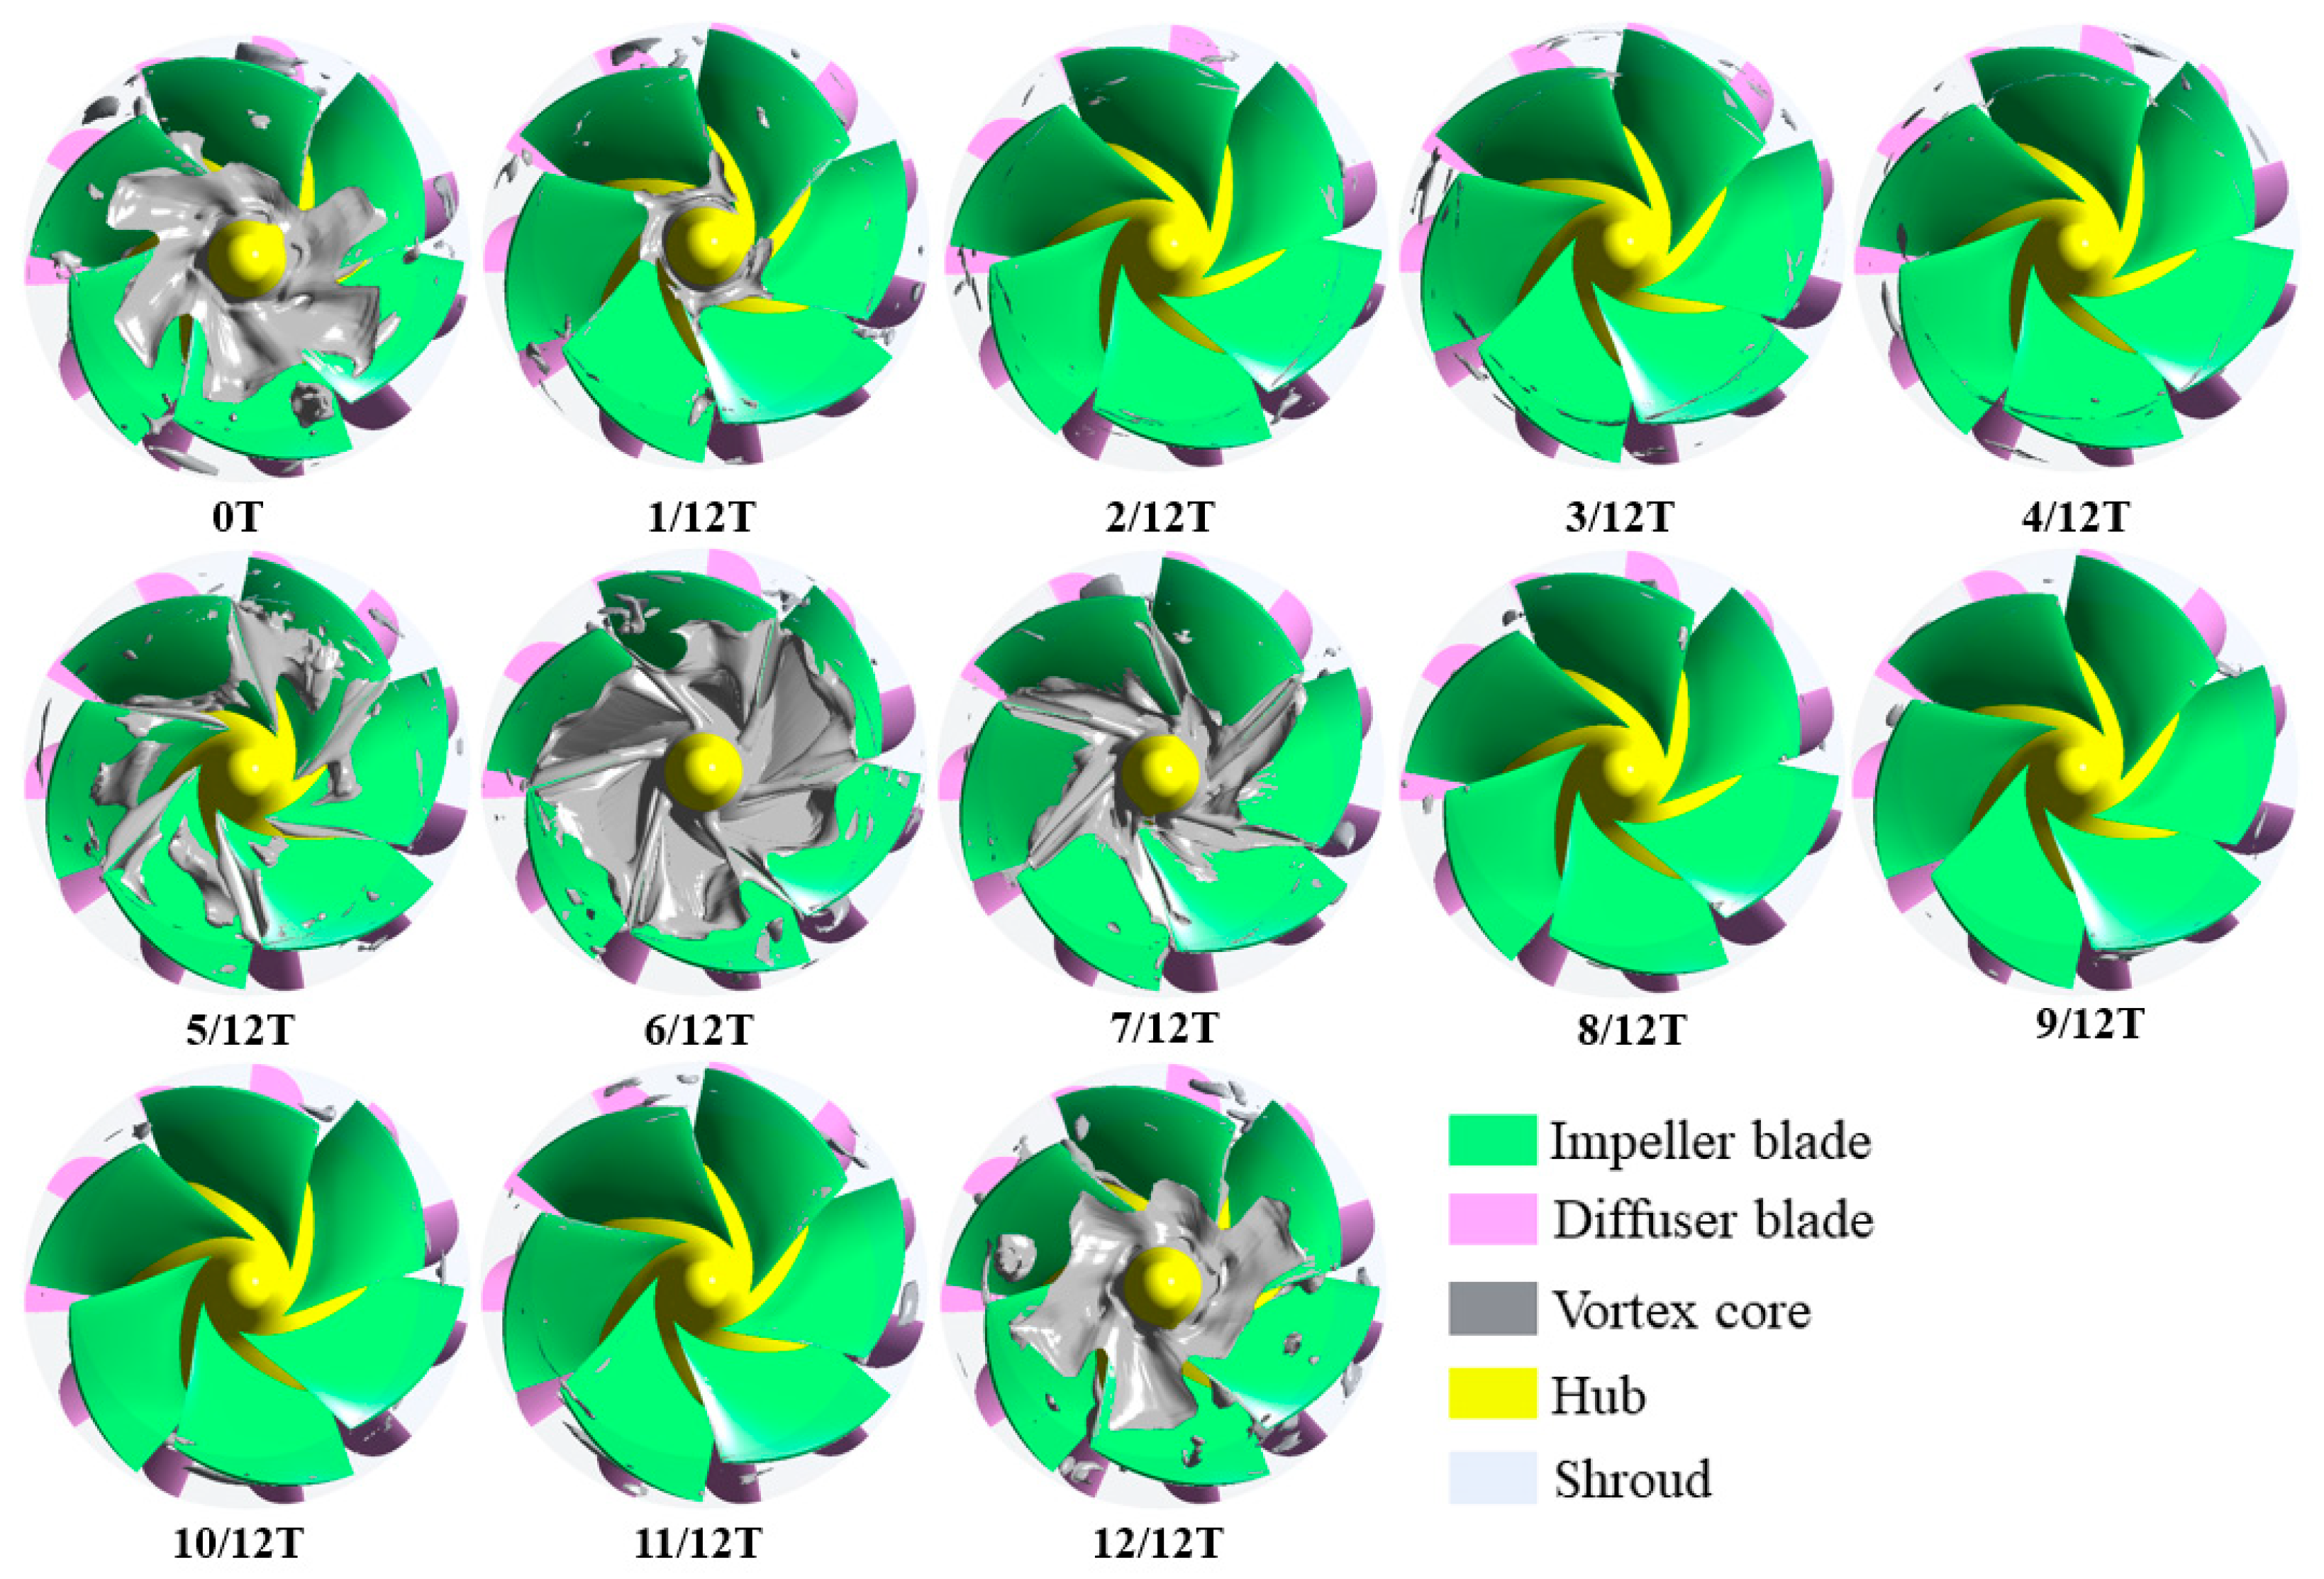
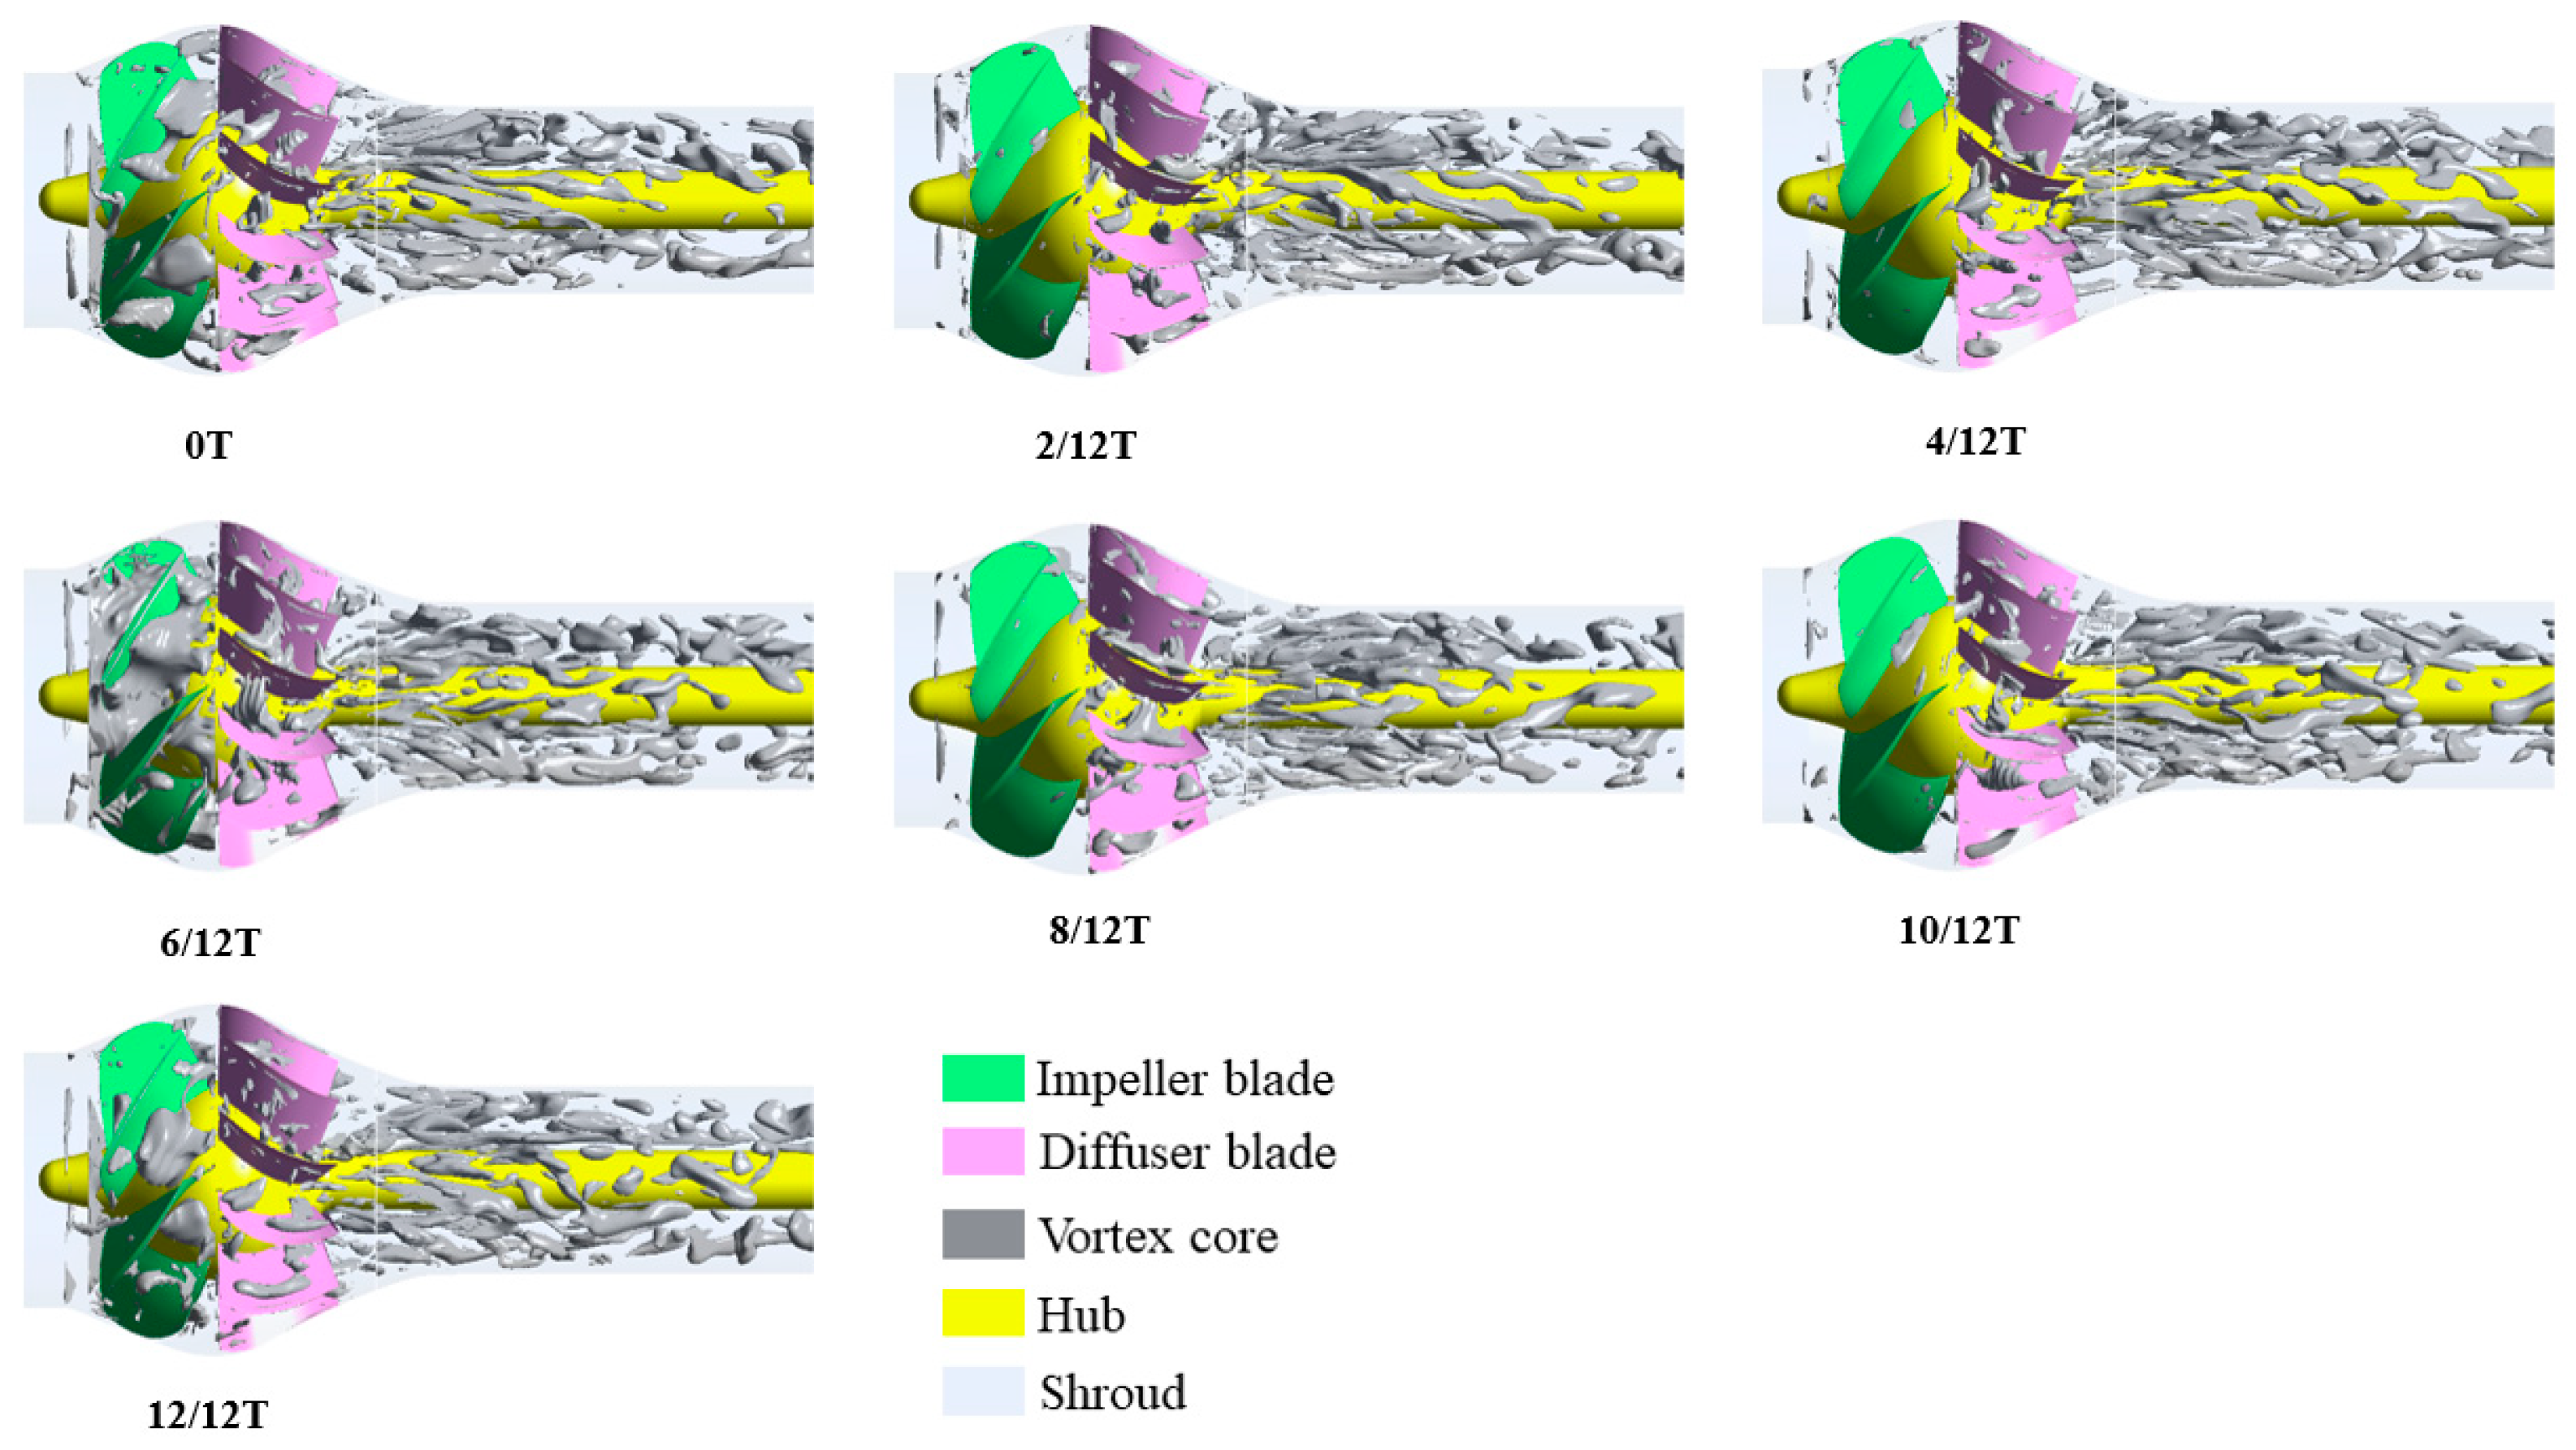
By extracting the vortex structures in the pump under the valley condition, Figure 26, Figure 27 and Figure 28 show the distribution of vortex cores in the diffuser, impeller, and full flow domain at different times, respectively. Figure 26 and Figure 27 show that under the valley condition, there are more small-scale vortex structures inside the impeller and diffuser and that the overall vortex core strength is higher. As can be seen from Figure 26, the vortex core in the diffuser flow domain is first generated at the inlet and then grows and moves downstream as the diffuser rotates. As the diffuser rotates further, the vortex core gradually dissipates, leaving only small-scale vortex structures in the flow passages for a certain period. Finally, the vortex core regenerates at the inlet. From Figure 27, it can be seen that the vortex structures in the impeller flow domain are persistent; however, under the valley condition, the scale and number of vortex cores are larger. From Figure 28, it can be observed that while the overall strength of vortex cores in the full flow domain is low, individual vortex cores exhibit a large scale.

6. Numerical Simulation Results and Experimental Comparison

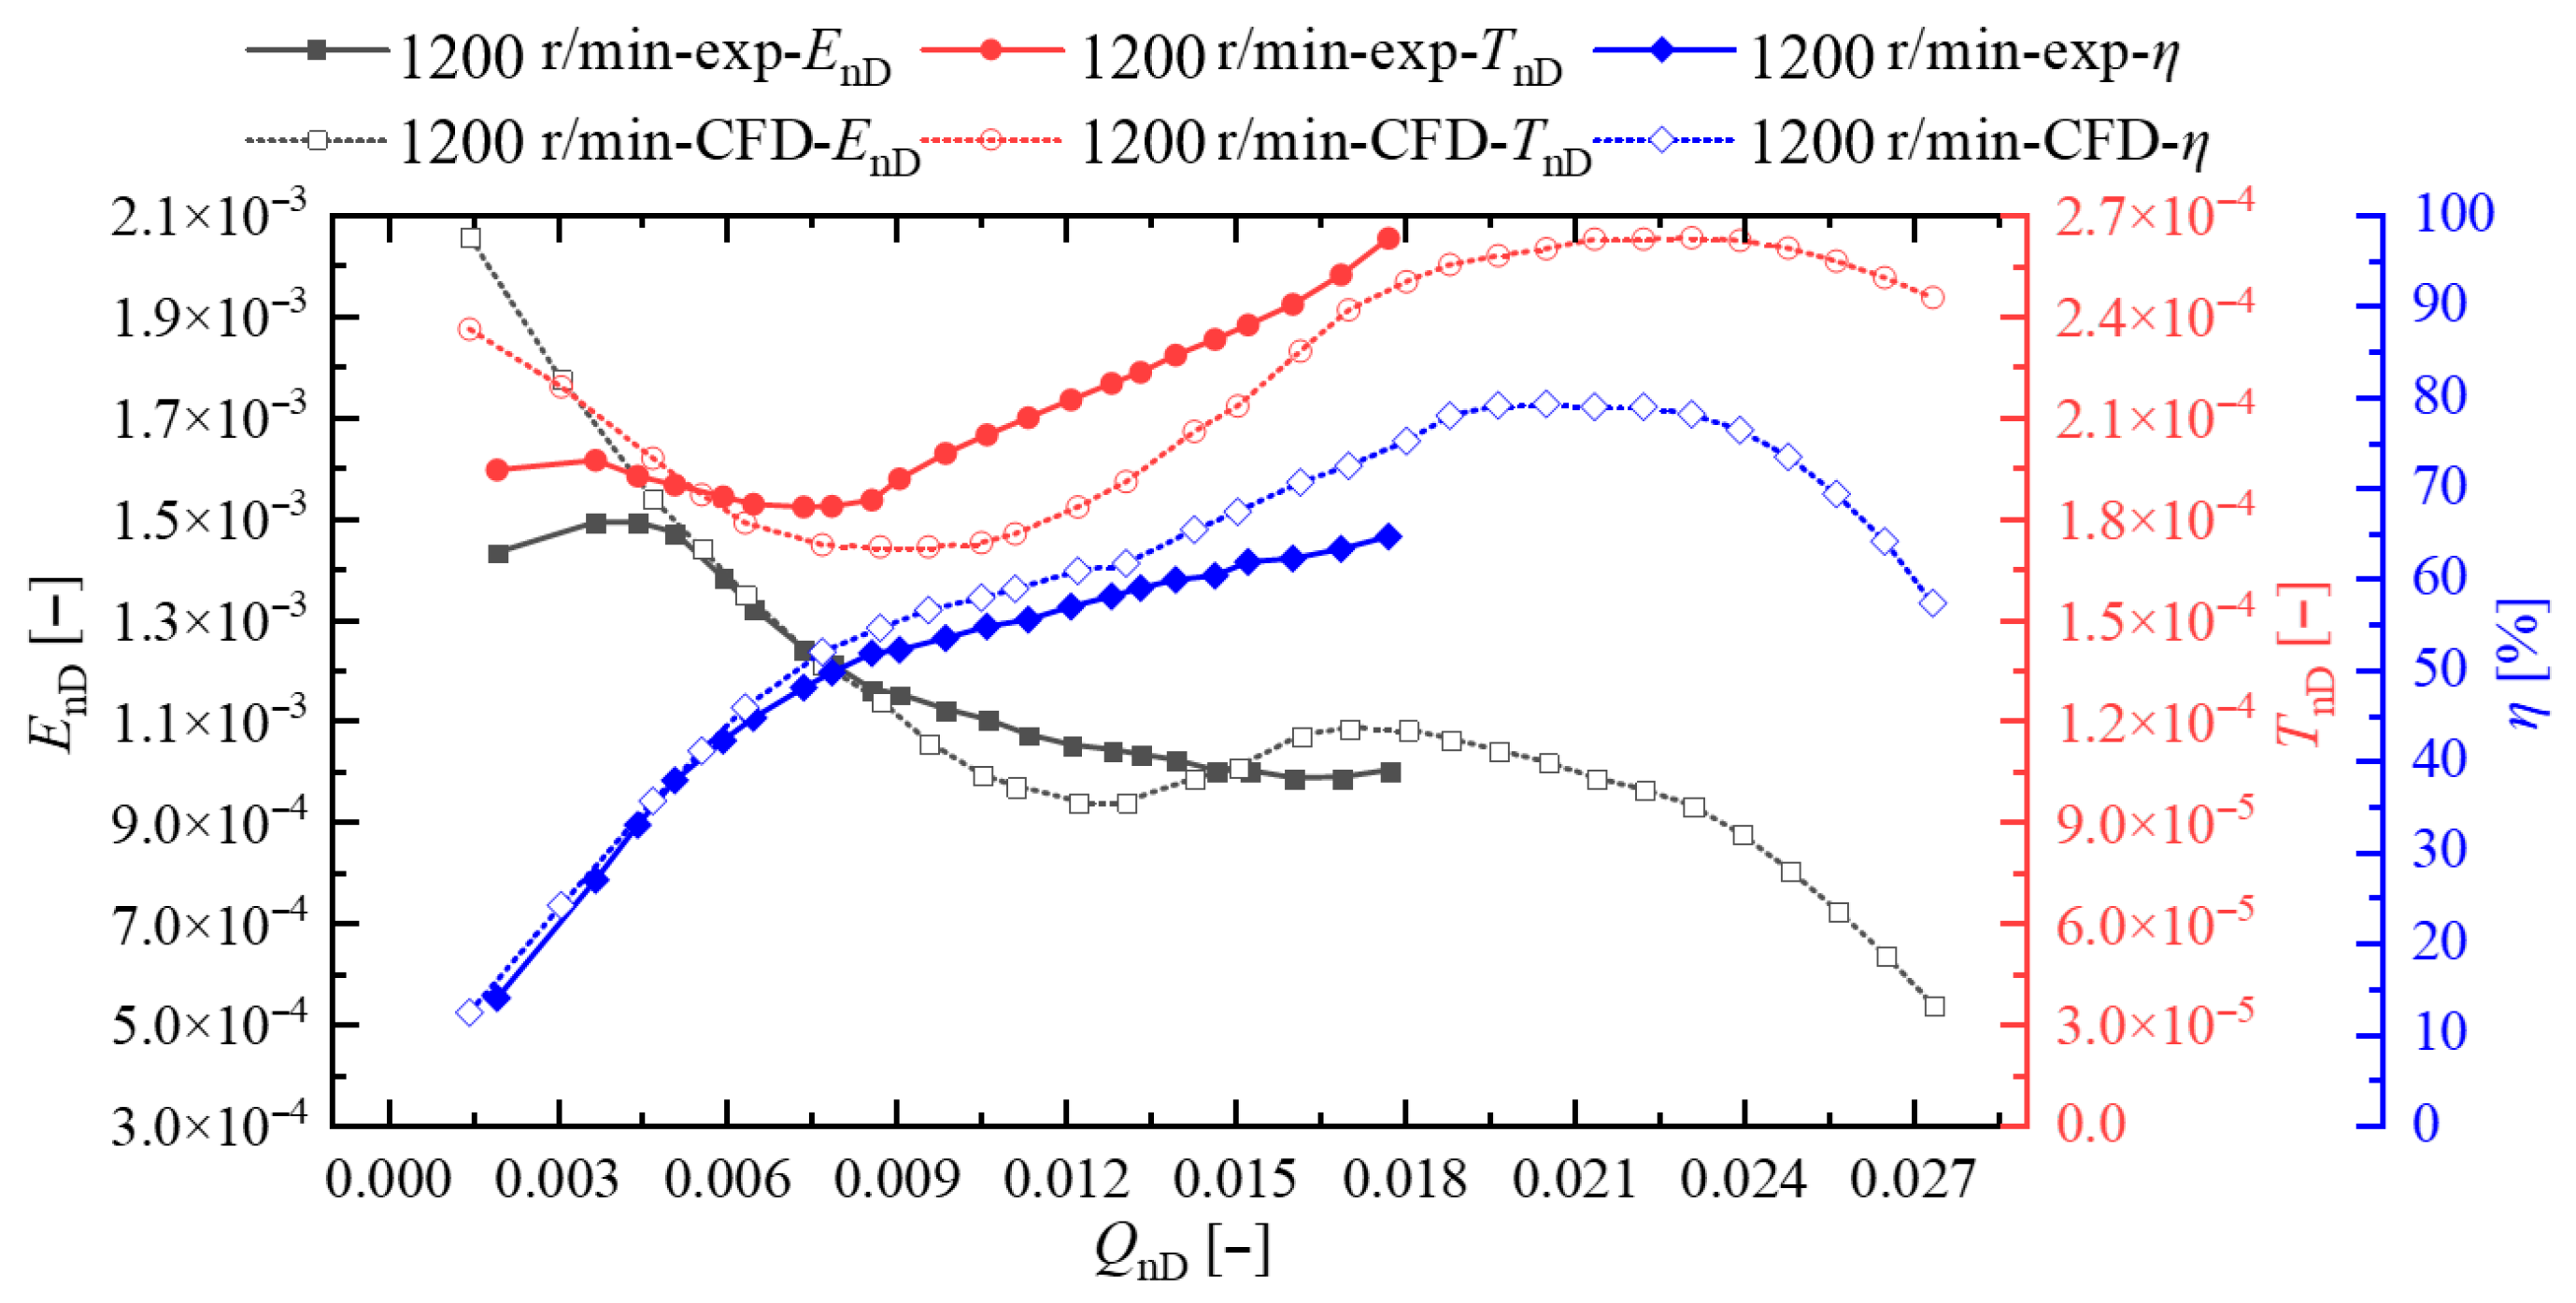
The numerical simulation of the scaled model pump is performed, and the results are nondimensionalized. The numerical simulation results are compared with the experimental data to verify the accuracy of the numerical simulation. The comparison results are shown in Figure 29. It can be observed from Figure 29 that when the flow coefficient QnD < 0.004, the deviation of the energy coefficient EnD is significant. The energy coefficient obtained from numerical simulation under the remaining flow conditions is consistent with that from the experiment. The torque coefficient and efficiency obtained from numerical simulation are consistent with the trends of those from the experiment.

7. Conclusions

Through the cavitation visualization experiment, the primary findings of this study are as follows:
(1)
Hydraulic and cavitation performance curves under the hump valley condition (QnD = 0.014) were obtained. Different cavitation development stages were defined based on variations in head and cavitation flow structure.
(2)
Under the valley condition, the cavitation patterns in different development stages mainly include vortex cavitation, cloud cavitation, and perpendicular cavitation vortex. In the inception stage, cavitation initiates as vortex cavitation at the inlet edge of the impeller rim, evolves into cloud cavitation, and then detaches to form a perpendicular cavitation vortex at the center of the flow channel. In the development transition stage, cloud cavitation and perpendicular cavitation vortex dominate, with the cavity size increasing. In the first critical stage, adjacent flow channels exhibit significant differences in cavitation extent; cloud cavitation detaches and moves downstream as the impeller rotates, with cavitation vortex blocking 2/3 of some channels. In the critical stage, one flow channel is nearly blocked by cavitation, while the other is circumferentially blocked by 1/3. In the breakdown stage, the cavitation patterns resemble those in the critical stage but with a larger cavity size and higher blockage, further reducing pump performance.
(3)
Under the valley condition, the impeller and diffuser contain more small-scale vortex structures with higher overall vortex core strength, whereas the full flow domain exhibits lower overall vortex core strength but larger individual vortex cores. Additionally, flow velocity distributions at various flow rates and spanwise sections (from blade tip to root) indicate that deviations in flow rate from the design point readily induce low-velocity regions, recirculation, and boundary layer separation.

Author Contributions

Y.Z.: Data curation, Formal analysis, Writing—review and editing; Y.L. (Yun Long 1): Data curation, Formal analysis, Writing—review and editing; M.L.: Data curation, Formal analysis, Writing—review and editing; H.H.: Data curation, Formal analysis, Writing—review and editing; K.W.: Data curation, Formal analysis, Writing—review and editing; J.Z.: Data Curation, Validation, Writing—Original draft; Y.L. (Yun Long 2): Conceptualization, Methodology, Supervision, Visualization, Writing—review and editing. All authors have read and agreed to the published version of the manuscript.

Funding

This work was funded by the China Postdoctoral Science Foundation Funded Project (Grant No. 2023M733355), the Jiangsu University Youth Talent Development Program (2020), the Chunhui Program Cooperative Scientific Research Project of the Ministry of Education, the Research Project of the State Key Laboratory of Mechanical System and Vibration (Grant No. MSV202203), and the Natural Science Foundation of China (Grant No. 51906085, Grant No. U20A20292).

Data Availability Statement

Data will be made available upon request.

Conflicts of Interest

The authors declare no conflicts of interest.

Nomenclature

NPSHNet positive suction head
QnDnon-dimensional flow coefficient
EnDnon-dimensional energy coefficient
TnDnon-dimensional torque coefficient
CFDComputational fluid dynamics
SSTShear stress transport

References

  1. Huang, S.; Song, Y.; Yin, J.; Xu, R.; Wang, D. Research on pressure pulsation characteristics of a reactor coolant pump in hump region. Ann. Nucl. Energy 2022, 178, 109325. [Google Scholar] [CrossRef]
  2. Wang, Y.; Ding, Z. Optimization design of hump phenomenon of low specific speed centrifugal pump based on CFD and orthogonal test. Sci. Rep. 2022, 12, 12121. [Google Scholar] [CrossRef] [PubMed]
  3. Yang, J.; Feng, X.; Liu, X.; Peng, T.; Chen, Z.; Wang, Z. The suppression of hump instability inside a pump turbine in pump mode using water injection control. Processes 2023, 11, 1647. [Google Scholar] [CrossRef]
  4. Liu, H.; Ma, Y.; Yan, W. Study and optimization of hump shaped performance characteristics of low specific speed centrifugal pump. Process Equip. Pip. 2018, 55, 58–61. (In Chinese) [Google Scholar]
  5. Liu, Y.; Chen, D.J.; Wang, D.Z.; Zhang, J.G.; Hu, Y.Y.; Ran, H.J. Seismic calculation and analysis of a long-axis multi-stage molten salt pump used in solar thermal power station. J. Vib. Shock 2021, 40, 148–155, 170. [Google Scholar]
  6. Li, W.; Ping, Y.; Shi, W.; Ji, L.; Li, E.; Ma, L. Research progress in rotating stall in mixed-flow pumps with guide vane. J. Drain. Irrig. Mach. Eng. 2019, 37, 737–745. (In Chinese) [Google Scholar]
  7. Li, E.; Li, W.; Shi, W.; Ma, L.; Yang, Z. Research on stall discrimination of a mixed-flow water jet pump in hump region. J. Cent. South Univ. Sci. Technol. 2020, 51, 2643–2652. (In Chinese) [Google Scholar]
  8. Li, E. Research on Flow Instability Mechanism of a Mixed-Flow Water Jet Pump. Master’s Thesis, Jiangsu University, Zhenjiang, China, 2020. (In Chinese). [Google Scholar]
  9. Ye, W.; Ikuta, A.; Chen, Y.; Miyagawa, K.; Luo, X. Numerical simulation on role of the rotating stall on the hump characteristic in a mixed flow pump using modified partially averaged Navier-Stokes model. Renew. Energy 2020, 166, 91–107. [Google Scholar] [CrossRef]
  10. Li, Q.; Wang, Y.; Liu, C.; Han, W. Study on unsteady internal flow characteristics in hump zone of mixed flow pump turbine. J. Gansu Sci. 2017, 29, 54–58. (In Chinese) [Google Scholar]
  11. Yang, J.; Yuan, S.; Pavesi, G.; Chun, L.; Zhou, Y. Study of hump instability phenomena in pump turbine at large partial flow conditions on pump mode. J. Mech. Eng. 2016, 52, 170–178. (In Chinese) [Google Scholar] [CrossRef]
  12. Qian, C.; Weimin, F.; Longcai, Z.; Na, L. Effects of inlet guide vane on characteristics of backflow vortex in hump region of axial flow pump. Trans. Chin. Soc. Agric. Mach. 2016, 47, 8–14. (In Chinese) [Google Scholar]
  13. Long, Y.; Zhu, R.; Wang, D. A cavitation performance prediction method for pumps PART1-Proposal and feasibility. Nucl. Eng. Technol. 2020, 52, 2471–2478. [Google Scholar] [CrossRef]
  14. Long, Y.; An, C.; Zhu, R.; Chen, J. Research on hydrodynamics of high velocity regions in a water-jet pump based on experimental and numerical calculations at different cavitation conditions. Phys. Fluids 2021, 33, 045124. [Google Scholar] [CrossRef]
  15. Yun, L.; Yan, Z.; Jianping, C.; Rongsheng, Z.; Dezhong, W. A cavitation performance prediction method for pumps: Part2-sensitivity and accuracy. Nucl. Eng. Technol. 2021, 53, 3612–3624. [Google Scholar] [CrossRef]
  16. Long, Y.; Zhang, M.; Zhou, Z.; Zhong, J.; An, C.; Chen, Y.; Wan, C.; Zhu, R. Research on cavitation wake vortex structures near the impeller tip of a water-jet pump. Energies 2023, 16, 1576. [Google Scholar] [CrossRef]
  17. Kumar, A.; Ghobadian, A.; Nouri, J. Numerical simulation and experimental validation of cavitating flow in a multi-hole diesel fuel injector. Int. J. Engine Res. 2022, 23, 958–973. [Google Scholar] [CrossRef]
  18. Akira, S.; Shigeo, H.; Akio, T. Effects of cavitation in a nozzle on liquid jet atomization. Int. J. Heat Mass Transf. 2008, 50, 3575–3582. [Google Scholar]
  19. Huang, B.; Wang, G.; Zhao, Y. Numerical simulation unsteady cloud cavitating flow with a filter-based density correction model. J. Hydrodyn. 2014, 26, 26–36. [Google Scholar] [CrossRef]
  20. Zhang, R. Research on incipient cavitation performance of axial flow pumps. Trans. Chin. Soc. Agric. Mach. 1994, 3, 38–44. [Google Scholar]
  21. Van der Westhuizen, W.B. Cavitation erosion effects, due to off design operation of boiler reed pumps in 600 MW power station. In Proceedings of the Institution of Mechanical Engineers: International Conference on Cavitation, Cambridge, UK, 9–11 December 1992; pp. 249–262. [Google Scholar]
  22. Hua, H.; He, Y. Experimental Study on Scale Effects of Developed Cavitation. In Proceedings of the 2nd Asian Conference on Fluid Mech, Beijing, China, 25–29 October 1983. [Google Scholar]
  23. Subar, B.H. Investigation of Tip-Wall Vortex Cavitation in An Axial-Flow Pump; AD-A134357; Naval Sea Systems Command: Washington, DC, USA, 1983. [Google Scholar]
  24. Li, S.; Gu, C.; Miao, Y. Visual experimental study on cavitation characteristics in centrifugal pump. Pump Technol. 1997, 5, 14–20. (In Chinese) [Google Scholar]
  25. Li, S.; Gu, C.; Miao, Y. Experimental study on cavitation visualization of centrifugal pump with front inducer. Fluid Mach. 1997, 10, 3–7. (In Chinese) [Google Scholar]
  26. Huang, R.; Zhang, R.; Wang, Y.; Luo, X.; Zhu, L. Experimental and numerical investigations into flow features in an intake duct for the waterjet propulsion under mooring conditions. Acta Mech. Sin. 2021, 37, 826–843. [Google Scholar] [CrossRef]
  27. Kim, J.H.; Kim, K.Y. Analysis and Optimization of a Vaned Diffuser in a Mixed Flow Pump to Improve Hydrodynamic Performance. J. Fluids Eng. 2012, 134, 071104. [Google Scholar] [CrossRef]
  28. Gong, B.; Zhu, H.L.; Chen, X.H.; Yin, J.L.; Li, N.; Wang, D.Z. Numerical and experimental study of tip leakage vortex structures and dynamics in a mixed-flow waterjet pump. J. Phys. Conf. Ser. 2024, 2752, 012103. [Google Scholar] [CrossRef]
  29. Zhao, G. Research on the Mechanisms of Cavitation-Excited Forces and It’s Stablities Control in a Waterjet Pump. Ph.D. Thesis, Zhenjiang University, Hangzhou, China, 2022. [Google Scholar]
  30. Arakeri, V.H. Viscous effects on the position of cavitation separation from smooth bodies. J. Fluid Mech. 1975, 68, 779–799. [Google Scholar] [CrossRef]
  31. Ceccio, S.L.; Brennen, C.E. Dynamics of attached cavities on bodies of revolution. ASME J. Fluids Eng. 1992, 114, 93–99. [Google Scholar] [CrossRef]
  32. Xu, S.; Long, X.-P.; Ji, B.; Li, G.-B.; Song, T. Vortex dynamic characteristics of unsteady tip clearance cavitation in a waterjet pump determined with different vortex identification methods. J. Mech. Sci. Technol. 2019, 33, 5901–5912. [Google Scholar] [CrossRef]
  33. Huang, R.; Wang, Y.; Du, T.; Luo, X.; Zhang, W.; Dai, Y. Mechanism analyses of the unsteady vortical cavitation behaviors for a waterjet pump in a non-uniform inflow. Ocean Eng. 2021, 233, 108798. [Google Scholar] [CrossRef]
  34. Long, Y.; Zhou, Z.; Zhong, J.; Han, H. Experimental study on evolution of cavitation flow structure in hump region of waterjet pump. J. Appl. Fluid Mech. 2024, 17, 2734–2744. [Google Scholar] [CrossRef]
  35. Long, Y.; Zheng, Y.; Han, H.; Zhong, J.; Zhu, R. Research on hydraulic optimization design method of water-jet propulsion pump considering hump index. J. Braz. Soc. Mech. Sci. Eng. 2024, 46, 377. [Google Scholar] [CrossRef]
  36. Han, H.; Long, Y.; Zhong, J. Research on the internal flow difference between peak and valley conditions of water jet propulsion pump during working at hump region. J. Mar. Sci. Eng. 2024, 12, 258. [Google Scholar] [CrossRef]
  37. Liu, M.; Long, Y.; Zheng, Y.; Zhong, J.; Yin, H. Research on the Comparison of the Flow Evolution Mechanisms of a Water-Jet Pump Between Valley and Peak Conditions. J. Mar. Sci. Eng. 2024, 12, 2352. [Google Scholar] [CrossRef]
  38. Liu, M.; Long, Y.; Yin, H.; Tian, C.; Zhong, J. Research on Energy Dissipation Mechanism of Hump Characteristics Based on Entropy Generation and Coupling Excitation Mechanism of Internal Vortex Structure of Waterjet Pump at Hump Region. J. Mar. Sci. Eng. 2025, 13, 442. [Google Scholar] [CrossRef]
  39. Li, D.; Qin, Y.; Wang, J.; Zhu, Y.; Wang, H.; Wei, X. Optimization of blade high-pressure edge to reduce pressure fluctuations in pump-turbine hump region. Renew. Energy 2022, 181, 24–38. [Google Scholar] [CrossRef]
  40. Wang, H.; Wu, G.; Wu, W.; Wei, X.; Chen, Y.; Li, H. Numerical simulation and analysis of the hump district of Francis pump-turbine. J. Hydroelectr. Eng. 2012, 31, 253–258. (In Chinese) [Google Scholar]
  41. Menter, F.R. Improved two-equation k-omega turbulence models for aerodynamic flows. NASA Tech. Memo. 1992, 93, 103975. [Google Scholar]
  42. Menter, F.R. Two-equation eddy-viscosity turbulence models for engineering applications. AIAA J. 1994, 32, 1598–1605. [Google Scholar] [CrossRef]
  43. Menter, F.R.; Kuntz, M.; Langtry, R. Ten years of industrial experience with the SST turbulence model. Heat Mass Transf. 2003, 4, 625–632. [Google Scholar]
  44. Zwart, P.J.; Gerber, A.G.; Belamri, T. A two-phase flow model for predicting cavitation dynamics. In Proceedings of the ICMF 2004 International Conference on Multiphase Flow, Yokohama, Japan, 30 May–3 June 2004. [Google Scholar]
Figure 1. Hump phenomenon.
Jmse 13 01598 g001
Figure 2. The water-jet pump model.
Jmse 13 01598 g002
Figure 3. Computational grid.
Jmse 13 01598 g003
Figure 4. Local grids of hydraulic components.
Jmse 13 01598 g004
Figure 5. Composition of grid numbers for different schemes and its CFD results [36].
Jmse 13 01598 g005
Figure 6. The experimental object and its basic parameters.
Jmse 13 01598 g006
Figure 7. Installation diagram of the test pump section [36].
Jmse 13 01598 g007
Figure 8. Test site for the model pump [36].
Jmse 13 01598 g008
Figure 9. Test site with different angles and the transparent section for shooting [34].
Jmse 13 01598 g009
Figure 10. Hydraulic performance curves of the water-jet pump.
Jmse 13 01598 g010
Figure 11. Cavitation performance curve under near-valley condition. (A: Cavitation Inception Stage; B: Cavitation Development Transition Stage; C: First Critical Cavitation Stage; D: Critical Cavitation Stage; E: Breakdown Cavitation Stage).
Jmse 13 01598 g011
Figure 12. Cavitation flow structure of cavitation inception stage.
Jmse 13 01598 g012
Figure 13. Cavitation flow structure of cavitation development transition stage.
Jmse 13 01598 g013
Figure 14. Cavitation flow structure of first critical cavitation stage.
Jmse 13 01598 g014
Figure 15. Cavitation flow structure of critical cavitation stage.
Jmse 13 01598 g015
Figure 16. Cavitation flow structure of breakdown cavitation stage.
Jmse 13 01598 g016
Figure 17. Velocity distribution at 0.95 span of the pump under different flow rate conditions.
Jmse 13 01598 g017
Figure 18. Velocity distribution at 0.75 span of the pump under different flow rate conditions.
Jmse 13 01598 g018
Figure 19. Velocity distribution at 0.50 span of the pump under different flow rate conditions.
Jmse 13 01598 g019
Figure 20. Velocity distribution at 0.25 span of the pump under different flow rate conditions.
Jmse 13 01598 g020
Figure 21. Velocity distribution at 0.10 span of the pump under different flow rate conditions.
Jmse 13 01598 g021
Figure 22. Pressure distribution inside the pump under the valley condition.
Jmse 13 01598 g022
Figure 23. Pressure and streamline distributions of impeller blades under the valley condition ((left) pressure surface; (right) suction surface) [36].
Jmse 13 01598 g023
Figure 24. Time-domain plot of pressure pulsation inside pump under the valley condition. ((left) impeller flow channel; (right) diffuser flow channel).
Jmse 13 01598 g024
Figure 25. Streamline distribution inside the pump under the valley condition.
Jmse 13 01598 g025
Figure 26. Distribution of vortex cores in the diffuser under the valley condition.
Jmse 13 01598 g026
Figure 27. Distribution of vortex cores in the impeller under the valley condition.
Jmse 13 01598 g027
Figure 28. Distribution of vortex cores in the full flow domain under the valley condition.
Jmse 13 01598 g028
Figure 29. Comparison between experimental and numerical simulation results.
Jmse 13 01598 g029
Table 1. Wall y+ values of each component.
ComponentWallMinimum Wall ValueMaximum Wall ValueAverage Wall ValueAverage Component Value
Inlet pipePipe wall1.08315.8824.1104.151
Deflector1.16817.7276.549
ImpellerHub0.0384.7392.0043.504
Blade0.05115.6734.212
Edge0.13110.2023.198
DiffuserHub0.0497.1502.0753.714
Blade0.04110.3304.035
Edge0.13110.2023.937
Outlet pipeShaft5.49512.7378.0007.518
Pipe wall5.3239.8577.368
Table 2. Boundary condition.
Liquid PhaseWater at 25 °C
turbulence calculationSST k-ω turbulence model
impeller fluid domainrotating domain
other fluid domainstationary domain
inlet boundary conditiontotal pressure inlet
outlet boundary conditionmass flow rate
wall boundary conditionno-slip wall condition
impeller shroudreverse rotating wall
remaining wallstationary wall
interface between rotating and stationaryfrozen rotor
differential schemehigh order
iterations1000
convergence criterion10−4
Disclaimer/Publisher’s Note: The statements, opinions and data contained in all publications are solely those of the individual author(s) and contributor(s) and not of MDPI and/or the editor(s). MDPI and/or the editor(s) disclaim responsibility for any injury to people or property resulting from any ideas, methods, instructions or products referred to in the content.