Article

Maritime Rescue Task Allocation and Sequencing Using MOEA/D with Adaptive Operators and Idle-Time-Aware Decoding Strategy

1
Department of Industrial Design, School of Mechanical Engineering, Northwestern Polytechnical University, Xi’an 710072, China
2
Key Laboratory of Ministry of Industrial Design and Ergonomics, Ministry of Industry and Information Technology, Northwestern Polytechnical University, Xi’an 710072, China
*
Authors to whom correspondence should be addressed.
J. Mar. Sci. Eng. 2025, 13(8), 1518; https://doi.org/10.3390/jmse13081518
Submission received: 30 June 2025 / Revised: 27 July 2025 / Accepted: 4 August 2025 / Published: 7 August 2025
(This article belongs to the Section Ocean Engineering)

Abstract

The timeliness of maritime rescue critically depends on the efficient generation of solutions and the execution of missions. Therefore, this study aims to implement maritime rescue task allocation and sequencing (MRTAS) while ensuring solution generation and mission execution efficiencies. First, a mathematical model minimizing mission completion time and resource consumption for MRTAS is established. Second, adaptive operators considering iteration progress and population objective distribution status and an idle-time-aware decoding strategy based on an in-degree embedded gap insertion are proposed. The adaptive operators and idle-time-aware decoding strategy are employed to enhance the multi-objective evolutionary algorithm based on decomposition (MOEA/D) for efficiency improvement in both solution generation and mission execution. The enhanced MOEA/D is then employed to identify Pareto-optimal MRTAS schemes. Validation using two case studies (Case 1–18 task, Case 2–100 task) confirms the practicality and feasibility of the enhanced MOEA/D. Furthermore, ablation studies, sensitivity analyses, and comprehensive comparisons against fixed operators, state-of-the-art algorithms, and traditional decoding strategies all demonstrate that the enhanced MOEA/D can accelerate convergence while maintaining converged solution quality and reduce mission completion time.

1. Introduction

In maritime environments utilizing multiple unmanned surface vehicles (USVs) for cooperative rescue operations, stringent time constraints and limited available resources necessitate that maritime rescue task allocation and sequencing (MRTAS) prioritize the optimization objectives of minimizing mission completion time and minimizing resource consumption [1,2]. When generating MRTAS schemes that meet these objectives, it is crucial to concurrently enhance both the efficiency of solution generation and mission execution for a higher survival rate of distressed personnel [3,4,5].
MRTAS refers to the assignment of specific USV and execution times to each rescue task [6,7]. Multi-objective optimization algorithms have emerged as the primary methodology for addressing such problems to overcome the inherent limitations of manual planning regarding timeliness and complexity [8,9]. Among these algorithms, the multi-objective evolutionary algorithm based on decomposition (MOEA/D) is well-suited for MRTAS, as it enables the generation of high-quality solutions within a limited number of iterations [8,10]. However, the traditional MOEA/D framework is limited by a fixed probability crossover and mutation operators [11,12]. Such fixed operators fail to respond dynamically to evolutionary states and induce misaligned perturbations during critical phases, thereby restricting the convergence efficiency and converged solution quality [13,14,15]. Furthermore, existing decoding strategies employed for MRTAS, such as the greedy algorithm, fail to proactively identify and utilize idle gaps in USV execution timelines, leading to an unnecessary prolongation of the mission completion time [16,17,18].
Given the above considerations, the following research questions should be addressed:
(1) Enhancing solution generation efficiency is essential for MRTAS [4]. Current MOEA/D enhancements prioritize structural modifications (e.g., weight vector adjustments [19]) and operator replacement strategies like multi-objective evolutionary algorithms based on decomposition with differential evolution variants (MOEA/D-DE, [12,20,21]) yet retain fixed crossover/mutation probabilities, restricting the convergence efficiency [13,14,15]. To overcome this limitation, we designed dual-dimensional adaptive operators leveraging iteration progress and population distribution status. This nonlinear mechanism stimulates global exploration initially while autonomously reducing perturbation intensity during convergence phases, accelerating optimization. Therefore, we pose Research Question 1: In MRTAS, can the proposed two-dimensional adaptive operators maintain the quality of the convergent solution while accelerating convergence compared to the fixed probability setting?
(2) Enhancing mission execution efficiency is equally critical for MRTAS [5]. Current decoding strategies, such as greedy algorithms, mechanically construct task sequences while failing to co-optimize temporal precedence constraints and idle gap utilization [16,18]. This invariably causes USVs to incur passive waiting periods due to incomplete predecessor tasks. To address this limitation, an idle-time-aware decoding strategy based on an in-degree embedded gap insertion is proposed. This strategy can dynamically detect idle gaps in USV execution timelines and proactively insert precedence-compatible independent tasks (e.g., environmental monitoring) into these gaps, thereby significantly reducing mission completion time. Therefore, we pose Research Question 2: In MRTAS mission execution, can the proposed idle-time-aware decoding strategy reduce the actual mission completion time compared to traditional greedy decoding?
To address the research questions, this study aims to implement MRTAS while ensuring solution generation and mission execution efficiencies. This encompasses (1) establishing the MRTAS model minimizing mission completion time and resource consumption; (2) designing adaptive operators considering iteration progress and population objective distribution status and idle-time-aware decoding strategy based on an in-degree embedded gap insertion; (3) employing adaptive operators and idle-time-aware decoding strategy to enhance MOEA/D for efficiency improvement in both solution generation and mission execution; and (4) employing the enhanced MOEA/D to solve the MRTAS model.
The contributions of this paper include the following: (1) It designs nonlinear dual-dimensional adaptive operators considering iteration progress and population objective distribution status, which helps to stimulate global exploration during initial iterations while autonomously reducing the perturbation intensity in later stages, effectively accelerating convergence and improving converged solution quality. (2) It proposes an idle-time-aware decoding strategy based on an in-degree embedded gap insertion, which helps to detect idle gaps in USV execution timelines and proactively fills these gaps with precedence-compatible independent tasks, thereby significantly reducing mission completion time. (3) It integrates the proposed adaptive operators and idle-time-aware strategy into MOEA/D to synchronously improve efficiency in solution generation and mission execution.
The remainder of this paper is organized as follows. Section 2 reviews the related works of MRTAS. Section 3 implements the MRTAS model construction and solution. Section 4 provides a numerical example. Afterward, a comparison and discussion are provided in Section 5. Finally, conclusions are drawn in Section 6.

2. Literature Review

2.1. Multi-Objective Optimization Algorithms for Maritime Rescue Task Allocation and Sequencing

MRTAS inherently constitute a multi-objective nonlinear optimization problem [3,22]. Given the inherent limitations of manual planning in addressing precedence constraints and handling complex dependencies, multi-objective evolutionary algorithms with global Pareto front search capabilities have become the preferred method for efficient problem-solving [23,24], such as MOEA/D [8,10], strength Pareto evolutionary algorithms (SPEAs) [25], non-dominated sorting genetic algorithms (NSGAs) [26], multi-objective particle swarm optimization algorithms [27], indicator-based evolutionary algorithms [28], etc. Among these, MOEA/D converts multi-objective problems into single-objective subproblems through Chebyshev decomposition and leverages neighborhood cooperative evolution mechanisms to accelerate convergence, demonstrating suitability for MRTAS [8]. However, the traditional MOEA/D framework is constrained by fixed probability crossover and mutation operators [11,12]. Fixed operators fail to dynamically respond to evolutionary states (e.g., population distribution in objective space) and induce misaligned perturbations during critical phases (e.g., excessive exploration in late iterations), thereby restricting the convergence efficiency and converged solution quality [13,14,15]. Furthermore, existing decoding strategies for MRTAS, such as greedy algorithms, fail to proactively identify and utilize idle gaps in USV execution timelines, resulting in the unnecessary prolongation of the mission completion time [16,17,18].

2.2. Efficiency Enhancement Methods for Solution Generation

MRTAS imposes stringent temporal requirements on solution generation efficiency. Researchers currently pursue three routes: task pre-screening [29,30], parallel computing optimization [31,32], and algorithm improvements [11,32]. Among them, algorithmic enhancement dominates because it is hardware-agnostic and delivers global optimization against temporal bottlenecks [32]. Within this domain, progress concentrates on weight vector adjustments [19] and adaptive operator design [33]. Weight vector adjustments improve solution-set distribution but cannot accelerate convergence [15]. Adaptive operators enhance search efficiency through dynamic mechanisms, falling into two classes: operator replacement [12] and parameter control [33]. Operator replacement schemes such as MOEA/D-DE expand global search, yet their static parameters (e.g., scaling factor and crossover rate) require manual tuning and destabilize convergence [12,20,21]. Parameter control methods promise a faster convergence by directly modulating operator intensity [11,34]. In MOEA/D, however, adaptive operators remain scarce; most studies retain fixed crossover and mutation probabilities, limiting both speed and quality [13,14,15]. Existing linear-adaptive operators ignore population distribution and cannot decouple exploration from exploitation under non-uniform convergence [33,35].
Among recent adaptive operator variants, operator replacement mainly focuses on the ensemble neighborhood search-based multi-objective evolutionary algorithm based on decomposition (ENS-MOEA/D) [36], the parameter control centers on the multi-objective evolutionary algorithm based on decomposition with Q-learning-based adaptive operator selection (MOEA/D-QL) [37], and the multi-objective evolutionary algorithm based on decomposition with classification tree-based adaptive operator selection (MOEA/D-CTAOS) [38]. These advanced adaptive operator variants attempt to accelerate convergence but still exhibit inherent limitations. As shown in Table 1, the ENS-MOEA/D only performs operator replacement at the linear weight level without touching the intrinsic optimization of operators. MOEA/D-QL and MOEA/D-CTAOS achieve parameter adaptation but require additional training or inference overhead, reducing real-time performance. To overcome these shortcomings, this paper proposes a nonlinear dual-dimensional adaptive operator, which integrates iteration progress and population objective distribution for the first time. This mechanism overcomes the linear limitation of operator replacement methods and avoids the computational burden of parameter control approaches. In disaster relief scenarios, this mechanism demonstrates unique advantages: through a nonlinear response curve, it maintains high perturbation intensity in early stages to rapidly cover the feasible region, and in later stages, it achieves distribution-sensitive decay based on crowding distance, significantly improving converged solution quality while ensuring convergence speed, ultimately achieving a breakthrough in the speed-quality Pareto front.
The dual-dimensional design becomes essential to simultaneously capture macro-level iteration progress and micro-level population distribution status, while the nonlinear characteristic is critical for maintaining high exploration intensity during the initial phases and rapidly decaying disruption during convergence stages—a capability unattainable by linear models. To address these compounded limitations, this work proposes nonlinear dual-dimensional adaptive operators that simultaneously consider iteration progress and population objective distribution status. This approach maintains a high perturbation intensity during the initial phases to stimulate global exploration while autonomously reducing the disruption strength as the population converges to enhance the MRTAS’s solution generation efficiency comprehensively.

2.3. Efficiency Enhancement Methods for Mission Execution

The stringent efficiency requirements of maritime mission execution make decoding strategies a core component of temporal optimization. Existing research typically relies on greedy algorithms to convert solutions generated by MOEA/D into executable MRTAS schemes [16,18]. During this decoding process, the greedy algorithm’s inability to simultaneously utilize dynamic idle gaps and satisfy temporal constraints results in USVs incurring compulsory waiting periods due to unsatisfied prerequisite dependencies. This results in the wastage of temporal idle resources, such as unnecessary waiting before medical supply delivery. Current researchers have proposed decoding strategies utilizing idle time for task sequences. For instance, Yun Wang and Xingquan [39] designed an idle time slot-aware decoding procedure to identify gaps in virtual machines using fixed-length thresholds. Shiming Yang et al. [40] proposed two decoding methods to insert tasks into the earliest available idle assembly machine. Kacem et al. [41] proposed improved active decoding to treat machine-worker-shared idle intervals as directly insertable regions. Existing research on decoding task sequences during idle periods has yielded inspiring results, yet room for further refinement remains. On one hand, current approaches often rely on intuitive criteria such as duration or the earliest idle time when judging gap availability; when the earliest start time of a task does not coincide exactly with the beginning of a gap, certain intervals may appear usable but prove infeasible. On the other hand, after each new task insertion, a global refresh of the idle list or the set of devices is customarily required, and computational overhead quietly accumulates as the number of tasks grows. Moreover, precedence dependencies among tasks have not yet been systematically incorporated into the gap selection logic, and occasional backtracking adjustments may exert subtle disturbances on overall efficiency.
To address these issues, this paper designs an idle-time-aware decoding strategy using a graph-theoretic in-degree metric [42] to quantify task dependencies. This strategy can dynamically detect idle gaps in USV execution timelines and proactively insert precedence-compatible independent tasks identified by an in-degree calculation into these gaps (e.g., executing environmental monitoring within such gaps), thereby significantly reducing mission completion time. This helps to achieve near-optimal resource utilization while significantly reducing the mission completion time for MRTAS.

3. Maritime Rescue Task Allocation and Sequencing Model Construction and Solving

To improve the solution generation and mission execution efficiencies for MRTAS, an enhanced MOEA/D integrating adaptive operators and an idle-time-aware decoding strategy is proposed. First, a mathematical model minimizing mission completion time and resource consumption for MRTAS is established. Second, adaptive operators that consider iteration progress and population objective distribution status, along with an idle-time-aware decoding strategy based on an in-degree embedded gap insertion, are proposed. The adaptive operators and idle-time-aware decoding strategy are employed to enhance MOEA/D for efficiency improvement in both solution generation and mission execution. The enhanced MOEA/D is then employed to identify Pareto-optimal schemes. The framework of this study is presented in Figure 1.

3.1. Maritime Rescue Task Allocation and Sequencing Model Construction

The symbols used in the MRTAS model are described in Table 2.
The MRTAS model is formulated as follows:
M i n   Z = { M C T , R C }   =   M C T   =   max s i + d i ,   i = 1,2 , , K R C   =   i = 1 K r i
Subject to:
m U i D i m = 1 ,   i = 1,2 , , K
d i = d i m ,   r i = r i m ,   D i m = 1 ,   i = 1,2 , , K ,   m U i
s j s i + d i ,   P i j = 1 ,   i , j = 1 , 2 , , K
s j s i + d i ,   X i j m = 1 ,   i , j = 1,2 , , K ,   m U i U j
Equation (1) represents two optimization objectives: minimum mission completion time and minimum resource consumption, where mission completion time is the latest completion time among all tasks and resource consumption is the comprehensive resource consumption of all tasks. Equation (2) represents the assignment uniqueness constraint, ensuring that each task can only be executed by one available USV [43]. Equation (3) represents the resource-execution dependency constraint; the actual execution time d i and actual resource consumption r i of task i are determined by the allocated USV m [42]. Equation (4) represents the global precedence constraint. If task i must be completed before task j, then the start time of task j must be later than the completion time of task i. Equation (5) represents the per-USV sequence constraint. If USV m executes task j next after task i, then the start time of j must be later than the completion time of i.

3.2. Maritime Rescue Task Allocation and Sequencing Model Solving Using Enhanced MOEA/D

To enhance both the solution generation efficiency and mission execution efficiency of MRTAS, adaptive operators and an idle-time-aware decoding strategy are designed to improve MOEA/D for solving the MRTAS model.

3.2.1. Process of the Enhanced MOEA/D

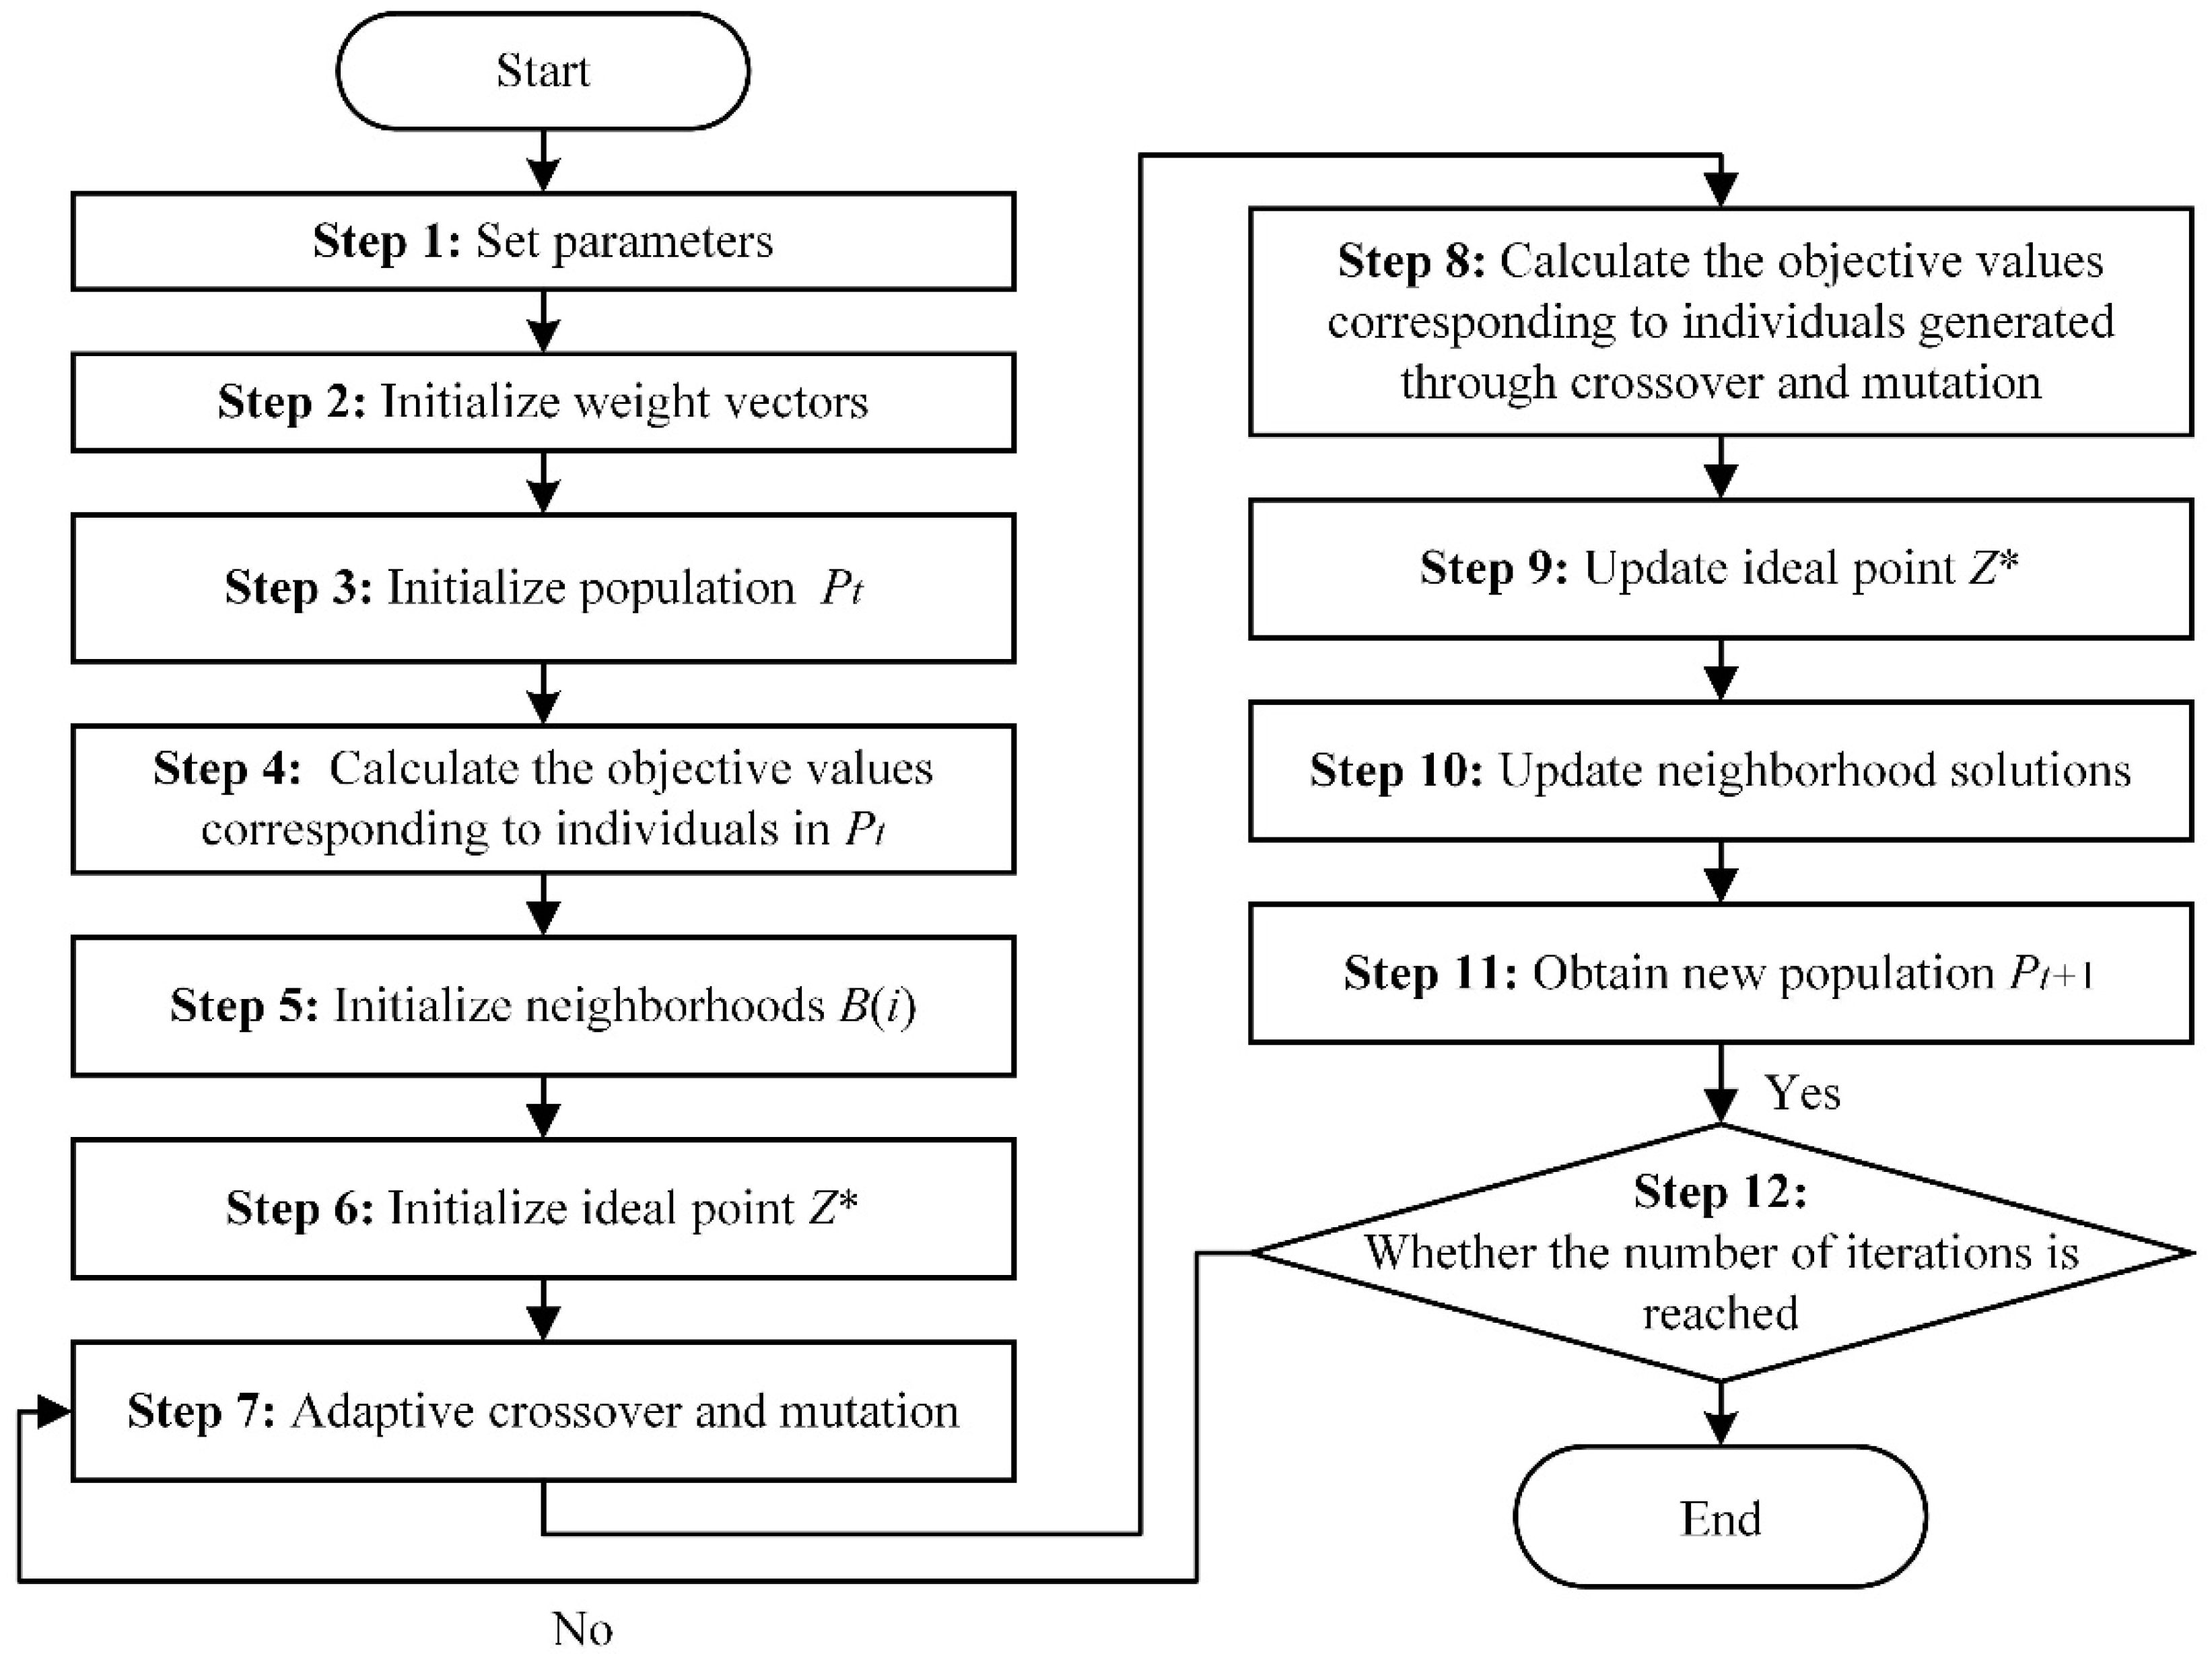
The flowchart of enhanced MOEA/D is shown in Figure 2.
The concrete steps of enhanced MOEA/D are described as follows:
Step 1: Set parameters.
Set population size N, number of iterations G, neighborhood size T, initial crossover rate p c r o _ 0 , initial mutation rate p m u t _ 0 , lower bound of crossover rate p c r o _ m i n , and lower bound of mutation rate p m u t _ m i n .
Step 2: Initialize weight vectors.
Generate N uniformly distributed weight vectors λ 1 , λ 2 , , λ N for decomposition.
Step 3: Initialize population Pt of size N.
Each MRTAS scheme jointly specifies the task sequence and the USV assigned to each task. Two-layer encoding [44] is utilized to establish the mapping between chromosomes and MRTAS schemes. As illustrated in Figure 3, the sequence chromosome is produced by permutation encoding [45] and arranges tasks in a strict order, where the gene at position i represents the i-th task to be scheduled, and its positional index dictates the order in which the task enters the decoding procedure. The USV chromosome is produced by integer encoding [46] and places the designated USV at the same position i, so the two chromosomes share the same length, and the genes at every index are paired. For instance, USV 2 executes task 2, and USV 4 executes task 17.
The decoding strategy takes the sequence order as input and, guided by an idle-time-aware decoding strategy, derives the mission completion time; the sequence therefore forms the temporal skeleton of the schedule, and the decoder performs only minor local refinements within this framework. To guarantee initial feasibility, the population Pt of size N is generated using the population initialization strategy in [47], ensuring that every sequence chromosome meets precedence constraints. In a scenario with four tasks, task 1 has no predecessor, task 2 must start after task 1 is finished, task 3 has no predecessor, and task 4 must start after task 3 is finished. The group order is preserved as task 1 → task 2 and task 3 → task 4, whereas the order between the two independent groups can be optimized. Given the sequence chromosome [3, 1, 4, 2] and the USV chromosome [1, 2, 1, 2], the decoder executes task 3 on USV 1, task 1 on USV 2, task 4 on USV 1, and task 2 on USV 2 in that exact order. If the sequence is altered to [1, 3, 2, 4], the schedule becomes task 1 → task 3 → task 2 → task 4, which changes idle intervals and ultimately alters the complete schedule. The sequence chromosome thus optimizes the mission completion time by controlling the relative priority between independent task groups.
Step 4: Calculate the objective values corresponding to individuals in Pt.
For each individual (each individual represents an MRTAS scheme), use the idle-time-aware decoding strategy to arrange each task to obtain the execution time lists of each USV, and employ Equation (1) to obtain the objective values. The idle-time-aware decoding strategy will be expanded in detail in Section 3.2.3.
Step 5: Initialize neighborhoods B(i).
For each weight vector λ i , find its T-closest neighbors using Euclidean distance, B ( i ) = i 1 , i 2 , , i T .
Step 6: Initialize ideal point Z*.
Based on all solutions in the current population, record the minimum value of each objective function as the ideal point Z*.
Step 7: Adaptive crossover and mutation.
Perform order crossover [48] and swap mutation [49] for sequence chromosomes, execute multi-point crossover [50], and swap mutation for USV chromosomes. The repair mechanism proposed in [47] is used to correct the generated infeasible sequence chromosomes. The adaptive crossover probability and mutation probability will be shown in Section 3.2.2.
Step 8: Calculate the objective values corresponding to individuals generated through crossover and mutation.
Perform the process described in Step 4 to decode individuals generated through crossover and mutation to obtain the objective values.
Step 9: Update the ideal point Z* with the new solution’s objective value (if the new solution is better for a certain objective).
Step 10: Compare the new solution with the old solutions in the neighborhood: if the new solution is better for a subproblem, replace the old solution in the neighborhood.
Step 11: Integrate the updated solutions to form a new population Pt + 1.
Step 12: Determine whether the number of iterations is reached; if so, terminate; otherwise, set t = t + 1 and return to Step 7.

3.2.2. Adaptive Operators

To overcome the constrained convergence efficiency caused by fixed operators, crossover and mutation probabilities are dynamically regulated based on iteration progress and population objective distribution status. The adaptive crossover probability p c r o and adaptive mutation probability p m u t are set as Equations (6) and (7). The code for the adaptive operators can be found in the supporting information, Code S1.
p c r o = p c r o _ 0 p c r o _ 0 p c r o _ m i n × g G + i = 1 M p c r o _ m i n + p c r o _ 0 p c r o _ m i n ( 1 m i n o b j i m e a n o b j i ) M + 1
p m u t = p m u t _ 0 p m u t _ 0 p m u t _ m i n × g G + i = 1 M p m u t _ m i n + p m u t _ 0 p m u t _ m i n ( 1 m i n o b j i m e a n o b j i ) M + 1
In Equations (6) and (7), p c r o _ 0 and p m u t _ 0 denote the initial crossover and mutation probabilities, while p c r o _ m i n and p m u t _ m i n represent their corresponding lower bounds. Here, g is the current iteration count, G is the preset maximum iteration count, and M is the number of optimization objectives. The terms m i n o b j i and m e a n o b j i denote the minimum and mean values of the i-th objective in the current population.
In Equation (6), the expression p c r o _ 0 p c r o _ 0 p c r o _ m i n × g G constitutes the iteration progress term. This component imposes a monotonic reduction in probabilities as iterations advance (g/G → 1), thereby suppressing late-stage random perturbations. Such suppression prevents the disruption of mature solutions and accelerates convergence to the Pareto front. The term i = 1 M p c r o _ m i n + p c r o 0 p c r o _ m i n   ( 1 m i n o b j i m e a n o b j i ) represents the population objective distribution term, which dynamically adapts to each objective’s convergence state. When objective i exhibits a low convergence maturity ( m i n o b j i m e a n o b j i → 0), the component approaches   p c r o _ 0 to promote exploration. When the objective i approaches convergence ( m i n o b j i m e a n o b j i → 1), it reduces toward p c r o _ m i n to maintain solution stability. For individual objectives, this adaptively assigns higher crossover probabilities to under-explored objectives while reducing probabilities for converged objectives. The final probability combines both components through normalization by M + 1, ensuring a balanced coordination between global evolutionary progress (temporal decay) and per-objective state feedback. This mechanism effectively coordinates multi-objective convergence. The same adaptive logic governs the mutation probability adjustment in Equation (7).

3.2.3. Idle-Time-Aware Decoding Strategy

The execution timelines of USVs generated by greedy algorithms often contain underutilized idle gaps, which may substantially prolong mission completion time. To address this inefficiency, this study proposes an idle-time-aware decoding strategy based on an in-degree embedded gap insertion. Specifically, for task t j in the sequence chromosome, its in-degree [42] (i.e., the number of direct predecessor tasks requiring completion before t j ) is calculated using Equation (8). If in-degree D j = 0 , the task initiates immediately; otherwise, execution awaits completion of all predecessors to satisfy the earliest start time s t while incorporating USV state constraints ( s c ). When s t > s c (indicating potential idle resource utilization), the strategy searches for available idle gaps p s , p e within the corresponding USV timeline, following an earliest-first policy. Task embeddability is verified through the condition p e   m a x ( s t ,   p s ) + d j (where d j is calculated using Equation (3)), ensuring the gap can accommodate task execution from the candidate start time max ( s t , p s ) while preserving precedence constraints. Qualified tasks are dynamically embedded into the earliest feasible gap with real-time timeline updates; others follow default sequential scheduling. This strategy synergistically helps to compress the mission completion time while preserving minimal resource consumption.
D j = i t h e   t a s k   s e t P i j ,       j t h e   t a s k   s e t
The pseudo-code of the idle-time-aware decoding strategy is shown in Algorithm 1. The code for Algorithm 1 can be found in the supporting information, Code S2. Algorithm 1 processes K tasks in a single loop, advancing one task at a time. At iteration x (x = 1, …, K), the algorithm first scans all direct predecessors among the first x tasks already scheduled to determine the latest finishing time; this step costs O(x) in the worst case. It then performs a linear scan over the current USV’s execution list EXEC_LIST[usv_id] to locate the first idle gap p s , p e with sufficient length and temporal overlap—again, O(x) in the worst case. Because these two linear operations are repeated for x = 1, …, K, the overall time complexity is Σ O(x) = O(K2).
Algorithm 1. Idle-Time-Aware Decoding Strategy
Input: the sequence chromosome   S f , the USV chromosome, the number of tasks K ,   the   P i j matrix of tasks
Output: the execution time lists of USVs
Initialize:
   Let EXEC_LIST be a collection of execution time lists, one for each USV
   For each USV: initialize its execution time list as empty
   Let   t j denote the j-th task object, with attributes duration d j .
   Let   s c be a scalar variable representing the earliest start time allowed by the current USV sequence.
   Let EXEC_LIST[usv_id] be a chronologically ordered list of non-overlapping time intervals already allocated to USV usv_id.
  1.for   x = 1   to   K   do
  2.     j the task number of xth task in S f // x is the task serial number and j is the task number
  3.     usv _ id   USV chromosome’s allocation for task j // Get assigned USV for this task
  4.     d j     calculate   the   duration   of   t j   using   Equation   ( 3 )   and   P i j
  5.  Calculate the in-degree D j   of   t j   in   S f using Equation (8)
  6.  if   D j = 0   then
  7.     s t 0 // Earliest start time considering global precedence constraint in Equation (4)
  8.  else
  9.     s t the maximum end time of pre-tasks of t j
10.  endif
11.  If   t j is the first task allocated to the usv_id then
12.      s c 0 // Earliest start time considering per-USV sequence constraint in Equation (5)
13.  else
14.     s c the end time of the last task executed by usv_id
15.  endif
16.  if   s t > s c   then
17.     s j s t // Start time determined by global constraints
18.     Schedule   task   t j   to   USV   usv _ id   at   time   s j
19.    Update execution time list for usv_id
20.  else // Search   for   earliest   available   idle   gap   p s , p e in EXEC_LIST[usv_id]
21.     found _ idle   false
22.    for   each   idle   gap   p s , p e in EXEC_LIST[usv_id] (earliest first) do
23.        candidate _ start   m a x ( s t , p s )
24.         if   p e c a n d i d a t e _ s t a r t + d j   then
25.             s j   candidate_start
26.            Schedule task t j to USV usv_id in this idle gap at time s j
27.            Update idle gaps in EXEC_LIST[usv_id]
28.             found _ idle   true
29.            break // Stop searching after the first valid idle gap
30.         endif
31.    endfor
32.    if not found_idle then
33.        s j s c // // No suitable idle gap, schedule sequentially
34.        Schedule   task   t j   to   USV   usv _ id   at   time   s j
35.       Update execution time list for usv_id
36.    endif
37.  endif
38.endfor
39.Return EXEC_LIST // Execution time lists for all USVs

4. Case Studies

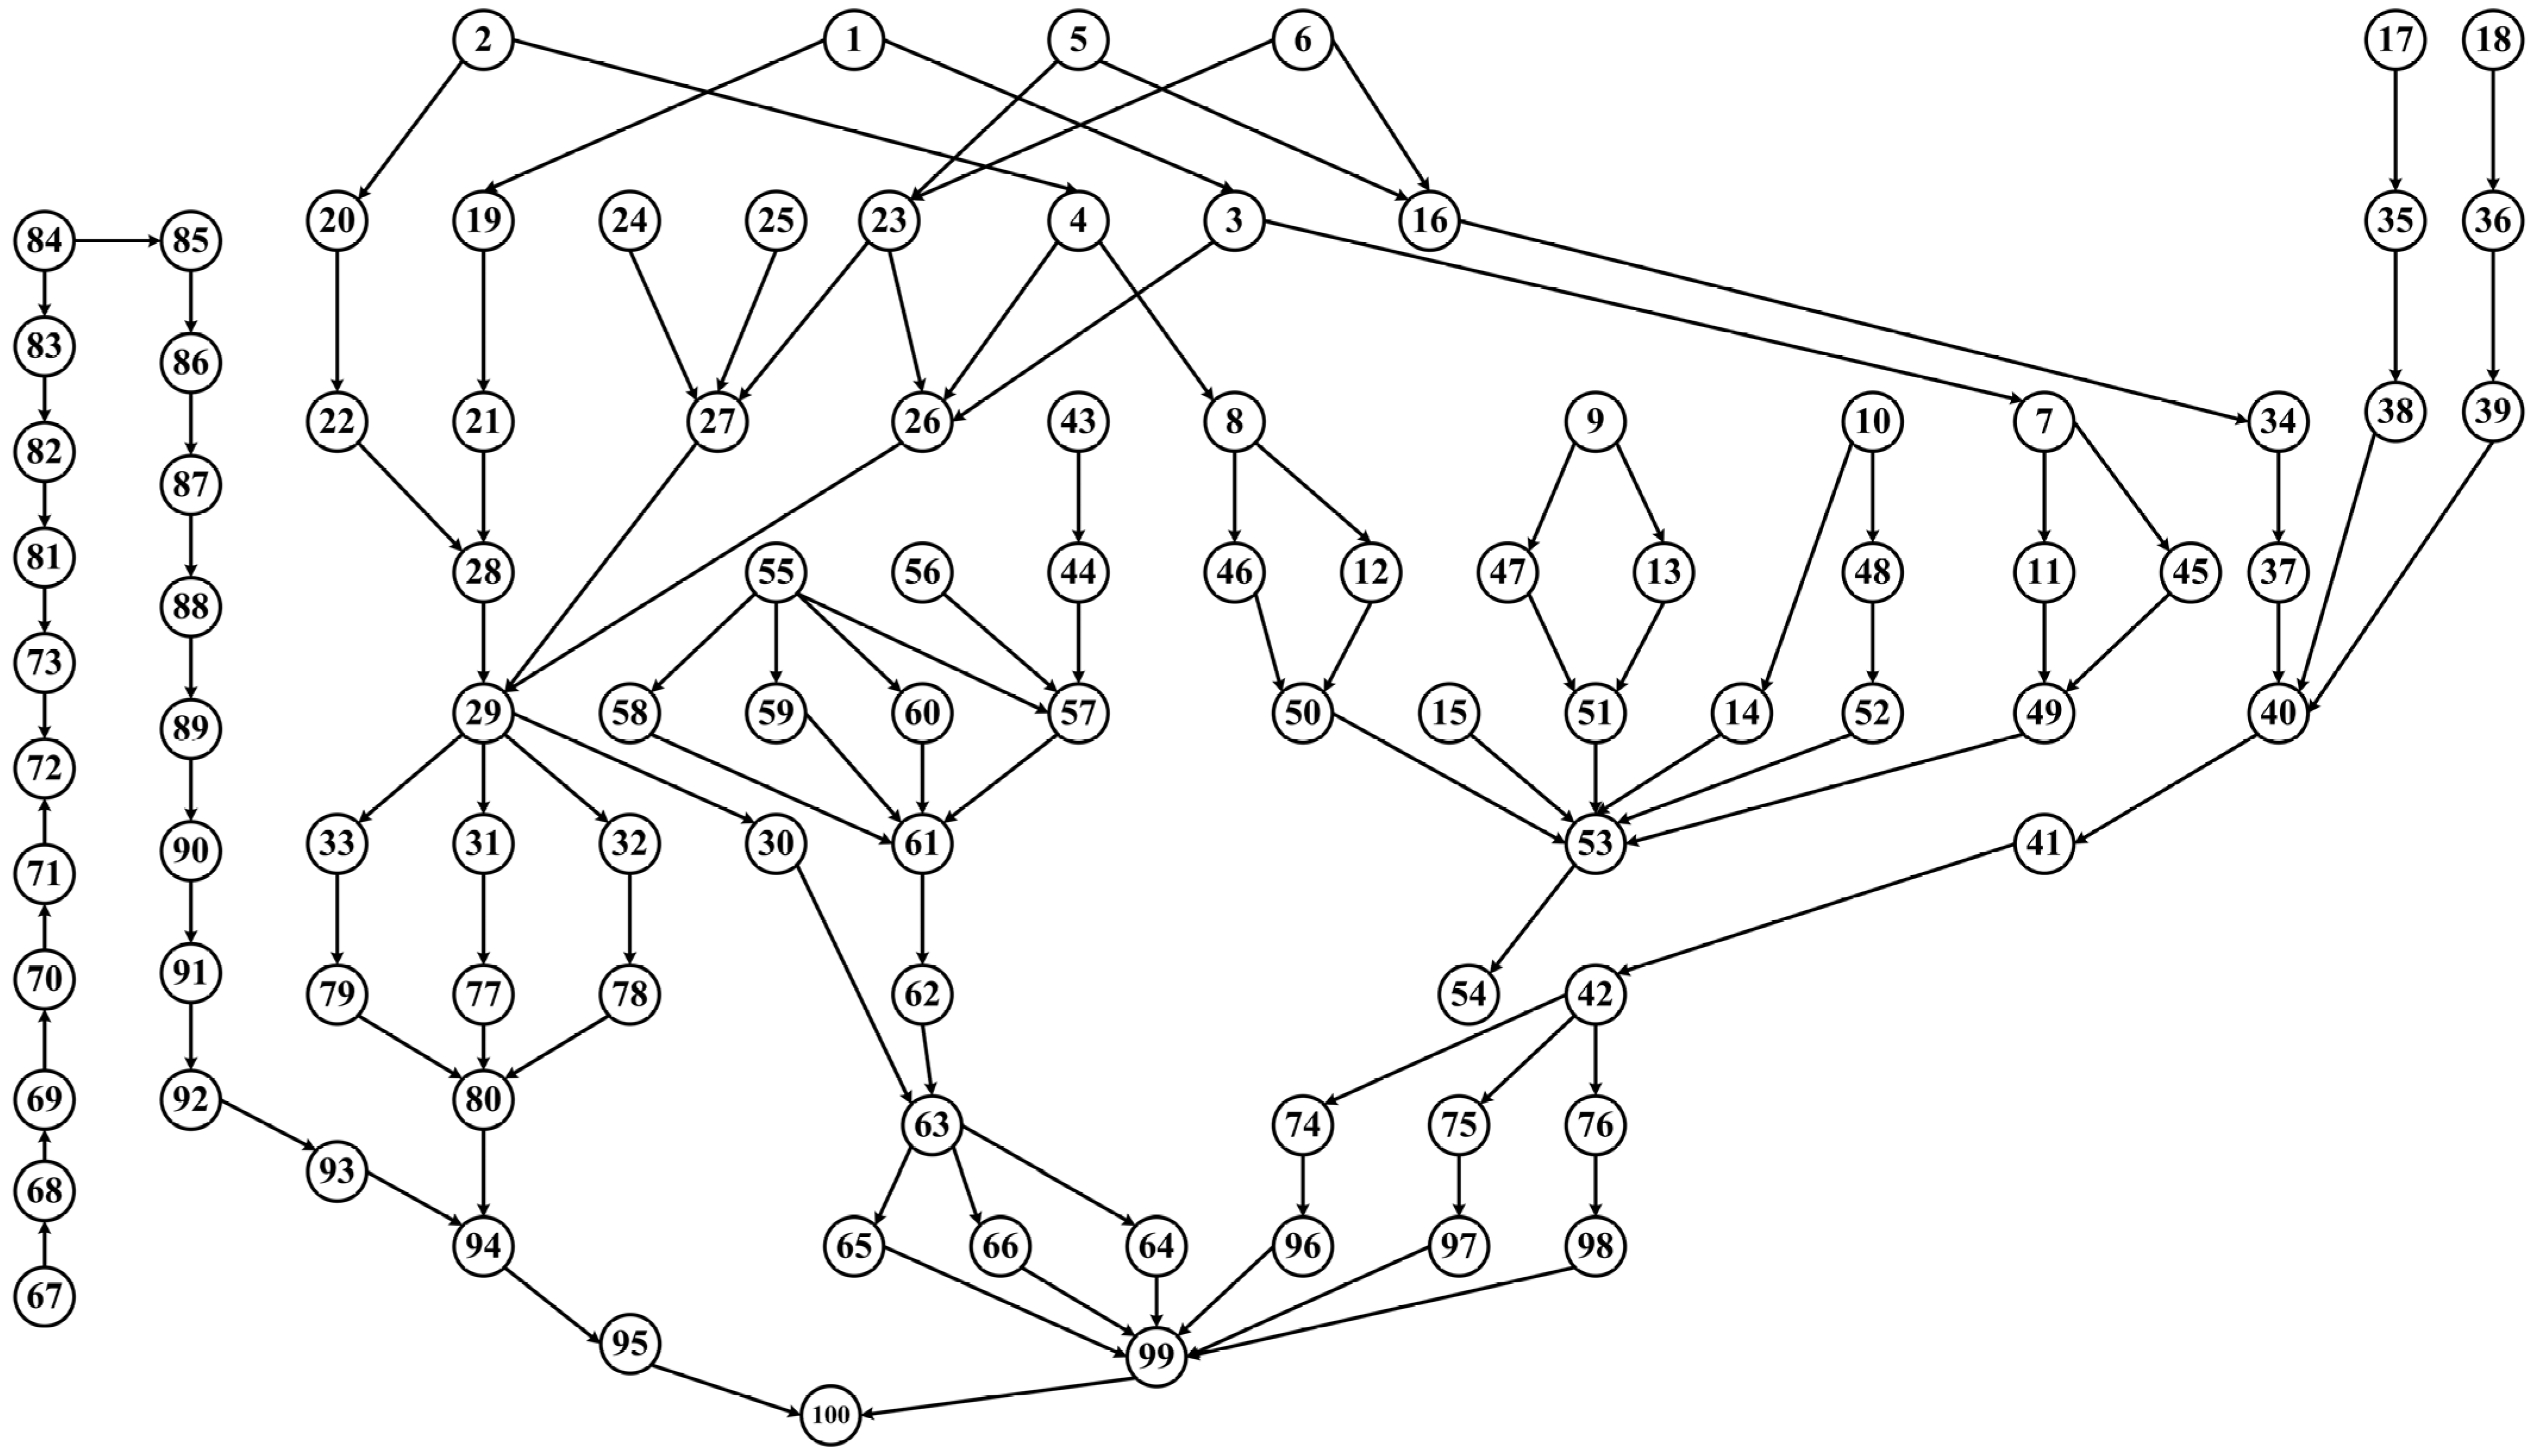
To validate the effectiveness of the proposed enhanced MOEA/D, two case studies are employed to solve the optimal MRTAS schemes. Case 1 employs the representative maritime rescue scenario mentioned in [51]. The environment comprises 18 temporally dependent rescue tasks (task precedence constraint shown in Figure 4), executed collaboratively by a heterogeneous USV cluster: deploying two scout-type USVs (high mobility, suitable for rapid reconnaissance tasks, numbered 1–2), one transport-type USV (large payload capacity, responsible for material/personnel transfer, numbered 3), and two engineering-type USVs (multi-functional equipment support, handling deployment/maintenance operations, numbered 4–5). A Delphi panel comprising three senior maritime rescue planners (>10 years offshore experience) establishes a capability evaluation framework that decomposes maritime rescue capability requirements into four 0–10 indices: communication, navigation energy, sensor payload, and battery consumption. The total resource is defined as the sum of the four indices (range 0–40). This additive scheme guarantees cross-dimensional comparability while avoiding unit mixing issues. Maritime rescue planners score the capability requirements of the task and the capability range of the USV according to sea-state-dependent speed and endurance. For instance, navigation energy scoring incorporates a nonlinear sea-state modifier: the wave height speed decay factor ∈ [0.55, 1.0], where 0 corresponds to the calmest sea (SS1) and 10 to extreme seas (SS5). Battery consumption scores embed a 20% endurance margin, ensuring mission feasibility even under SS5 conditions. The baseline demands of each task for the four indices are listed in Table 3, and the capability bounds of USV1–USV5 are given in Table 4. A task is assigned to any USV whose resource limits enclose the task’s requirement vector, yielding the feasible USV list, along with execution time, resource costs, and total cost, reported in Table 5. Case 2 is designed by the same expert group using open data and industry best practices. Based on the predecessor task matrix derived from IMO COLREGs and the SAR convention, the expert group constructs the precedence constraints between tasks (see Figure 5). Table 6 provides the task parameters obtained using the same procedure as in Case 1. Complete Table 6 can be found in the supporting information, Table S1.
The parameters of enhanced MOEA/D are based on the recommended parameters [32]. Case 1: N = 100, G = 200, T = 20, p c r o _ m i n = 0.07 , p c r o _ 0 = 1 , p m u t _ m i n = 0.015 , and p m u t _ 0 = 0.3 . Case 2: N = 200, G = 300, and all other parameters remain the same as in Case 1. The relevant data in Table 4 and Table 5 are, respectively, submitted into enhanced MOEA/D. The computational experiments are coded in Python 3.9.0 and run with an Intel (R) Core (TM) i7-10705H 2.60GHz CPU and 16 GB of memory.
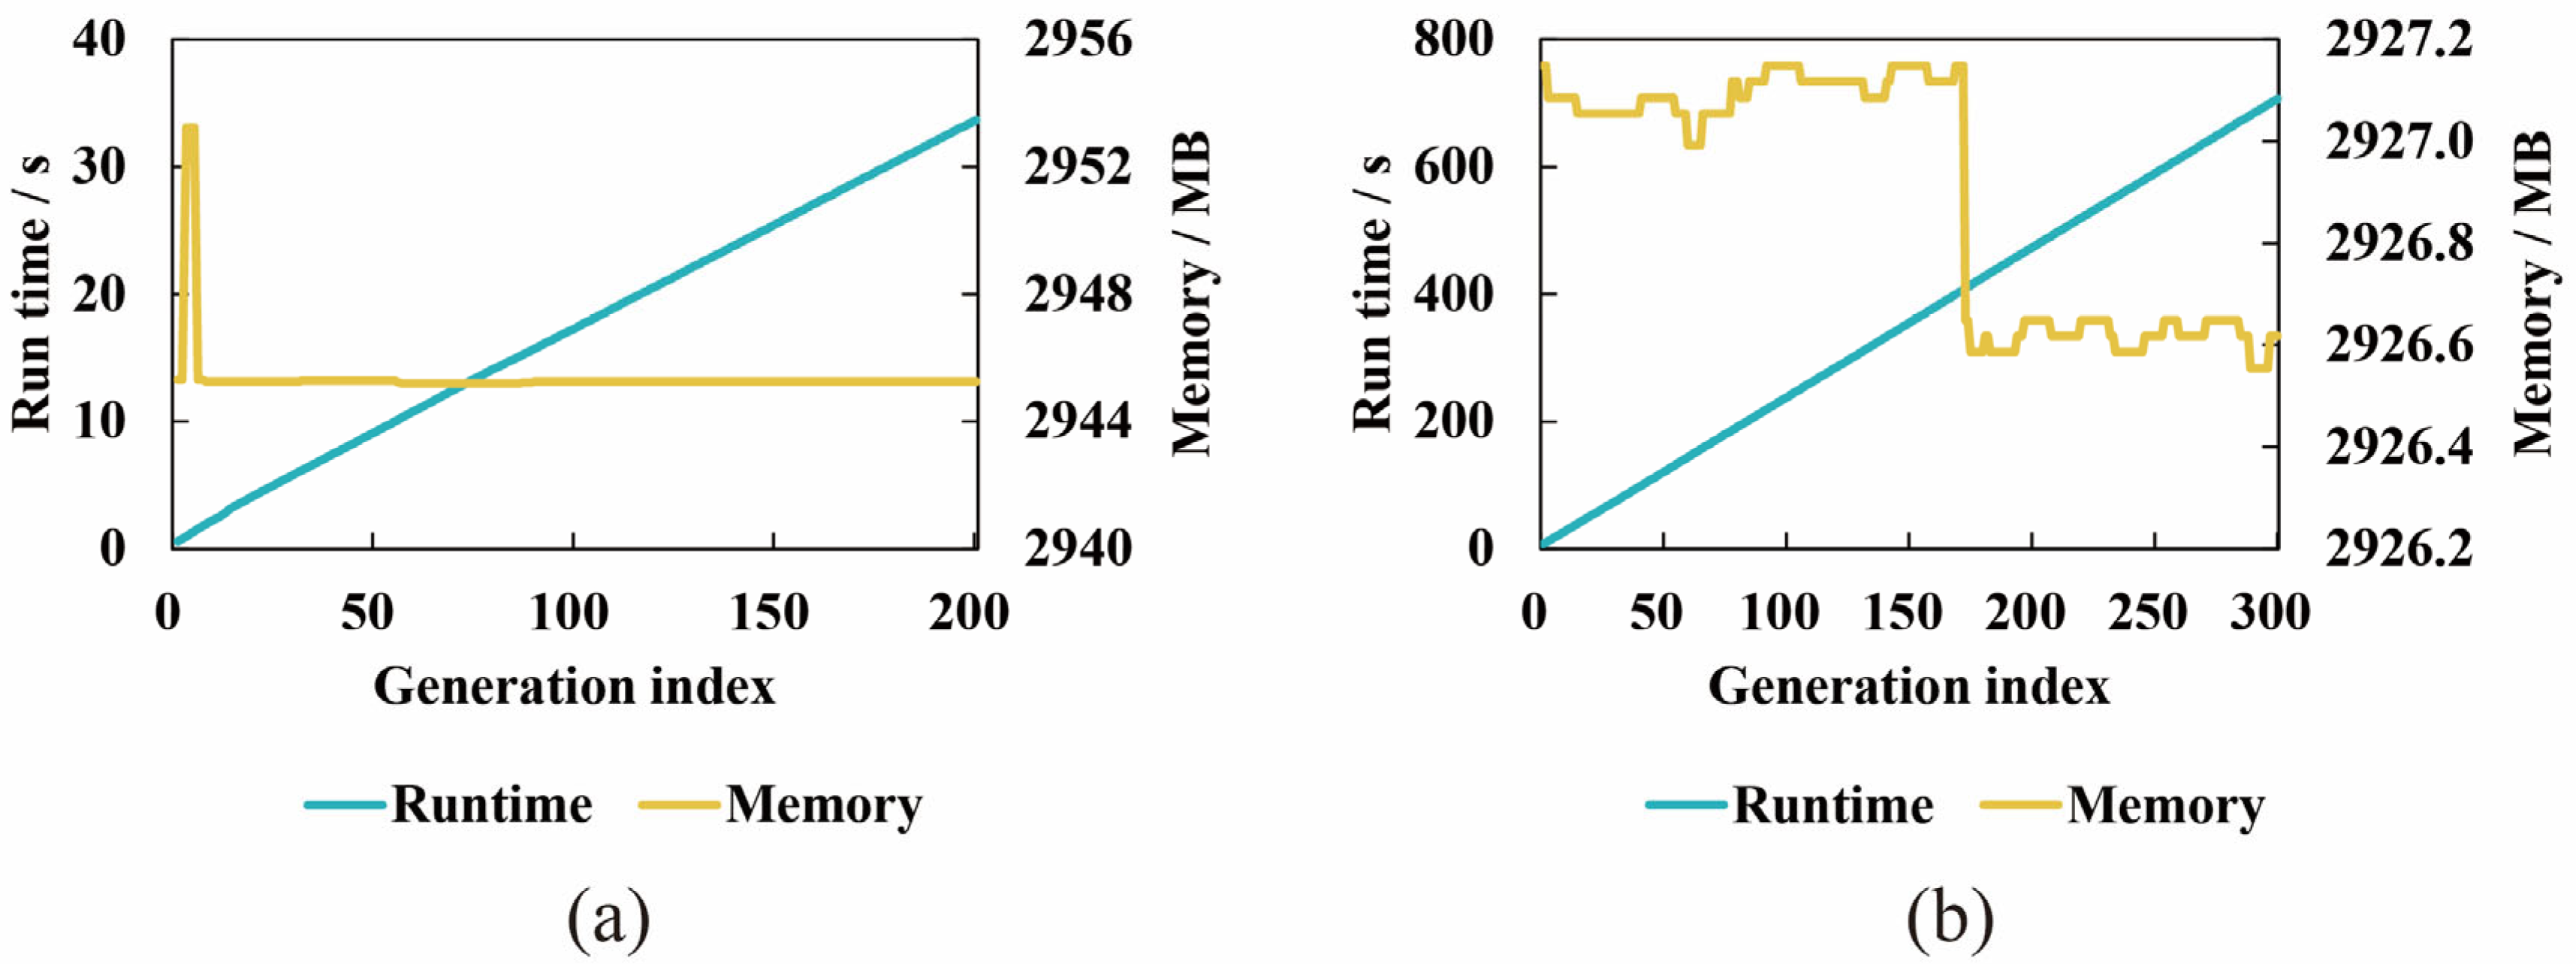
The runtime and memory consumption curves during iterations for Cases 1–2 are shown in Figure 6. As can be seen, the runtime of both cases increases approximately linearly with the number of generations, and the peak resident memory remains largely stable with no sign of memory bloat. This indicates that the proposed algorithm, when handling problems of different scales, not only has good time efficiency but also robust memory management, avoiding resource abuse or depletion as the number of iterations grows. The linear runtime growth and stable memory usage demonstrate the algorithm’s excellent scalability. It can effectively deal with expanding problem scales while maintaining system resource utilization and stability.
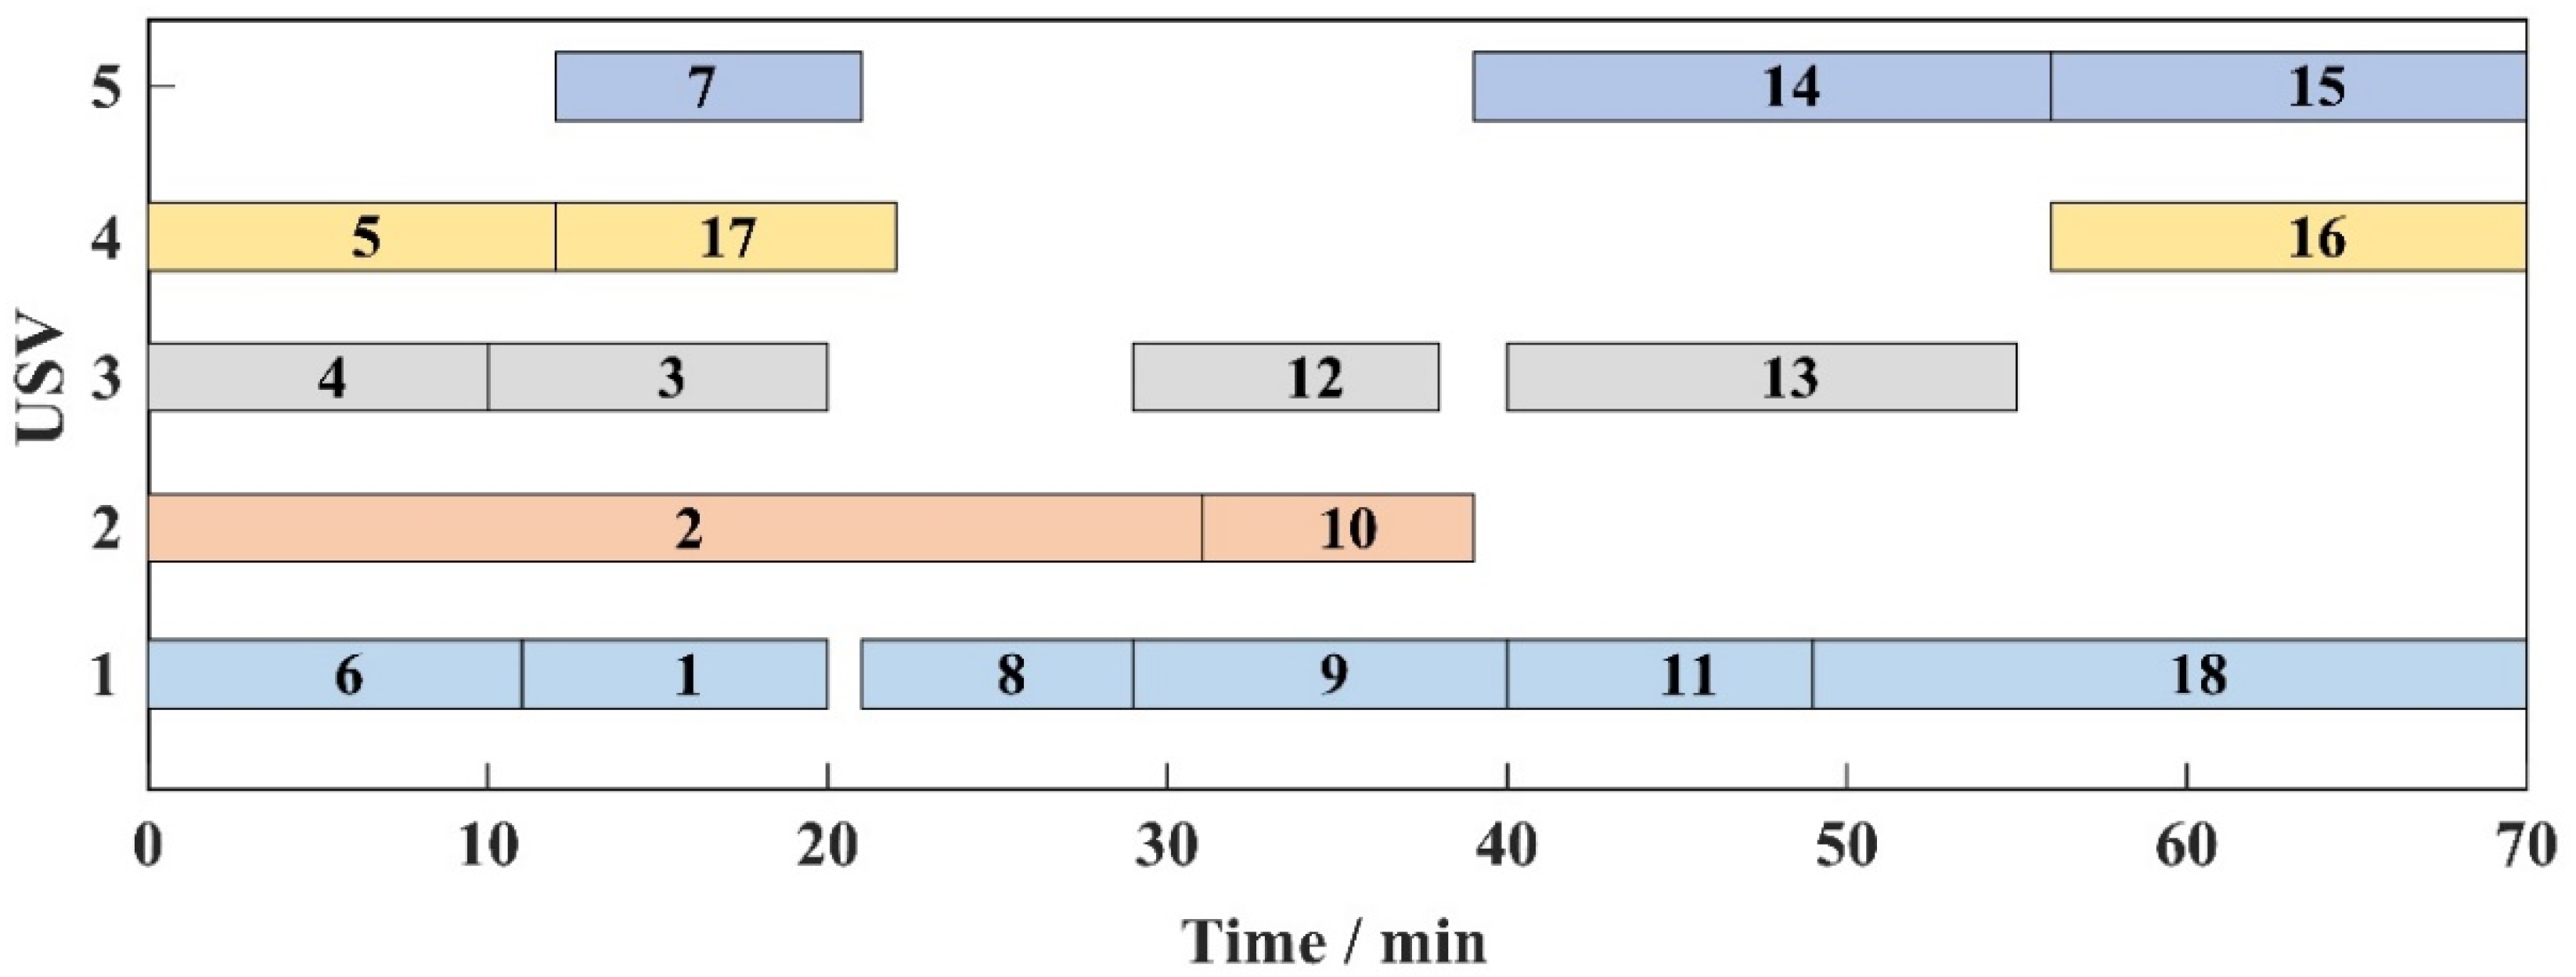
The Pareto solution distribution of Cases 1 and 2 is illustrated in Figure 7a,b (where each point represents a solution, with the x-axis indicating mission completion time and the y-axis showing resource consumption values). The solution sets for each iteration of Case 1 and Case 2 can be found in the supporting information, Tables S2 and S3, respectively. The detailed MRTAS schemes corresponding to the Pareto solution set of Cases 1 and 2 are presented in Table 7 and Table 8. Mission planners can flexibly select MRTAS schemes according to operational requirements. For time-sensitive scenarios, the solution with the shortest mission completion time can be selected and visualized through Gantt charts: (70,546) for Case 1 in Figure 8; (394,3951) for Case 2 in Figure 9. For resource-constrained operations, the solution with minimal resource consumption is prioritized: (90,525) for Case 1; (452,3932) for Case 2.
The Pareto sets reveal that optimal sequences diverge markedly under identical precedence constraints. These differences are not redundant but correspond to distinct rescue policies. The divergence stems from two degrees of freedom. Taking Case 1 as an example, first, task groups that do not reside on the critical path, such as the chains task 1 → task 9 and task 17 → task 18, are independent and may exchange positions within the sequence chromosome. Second, the USV assignment is flexible: executing task 7 with USV 3 yields a shorter duration at a higher energy cost, whereas assigning USV 4 conserves resources but increases completion time. Consequently, each sequence embodies a unique scheduling strategy and operational meaning. Solution 1 presents the sequence chromosome (5, 2, 6, 17, 4, 7, 8, 3, 12, 1, 10, 9, 11, 13, 14, 18, 15, 16) and the USV chromosome (4, 2, 1, 4, 3, 5, 1, 3, 3, 1, 2, 1, 1, 3, 5, 1, 5, 4). By prioritizing high-efficiency USVs, this plan reduces the total completion time to 70 min, which is 28% faster than the longest schedule while raising resource consumption to 546, making it suitable for the golden rescue phase that demands rapid personnel recovery. In contrast, solution 8 employs the sequence chromosome (2, 17, 6, 4, 1, 3, 5, 7, 8, 12, 9, 10, 13, 14, 11, 18, 15, 16) and the USV chromosome (2, 4, 1, 3, 1, 3, 5, 4, 2, 3, 1, 1, 3, 4, 1, 1, 4, 5). Favoring low-energy USVs, this scheme lowers resource consumption to 525, which is 4% below the highest resource consumption but requires 90 min of aligning with long-duration resource-scarce monitoring or cleanup missions. Both sequences lie on the same Pareto frontier, vividly illustrating the tradeoff between mission completion time and resource consumption objectives. Their coexistence confirms the engineering value of multiple optimal sequences, which provide switchable contingency plans for diverse rescue scenarios rather than redundant alternatives.
To validate the feasibility of the generated solutions, we invited three maritime rescue mission planning experts to independently assess the optimal Pareto solutions of Cases 1 and 2. Using the Delphi method [52], the panel unanimously establishes four validation criteria: scenario fitness, time reasonableness, resource reasonableness, and operational feasibility. These criteria are linked to quantitative thresholds via a five-point Likert scale [53], as detailed in Table 9. The experts’ scores for every criterion (Table 10) all meet or exceed the acceptance threshold (≥4) [53], demonstrating that the proposed solutions are indeed effective.

5. Comparison and Discussion

5.1. Ablation Studies

5.1.1. Comparison with Fixed Operators

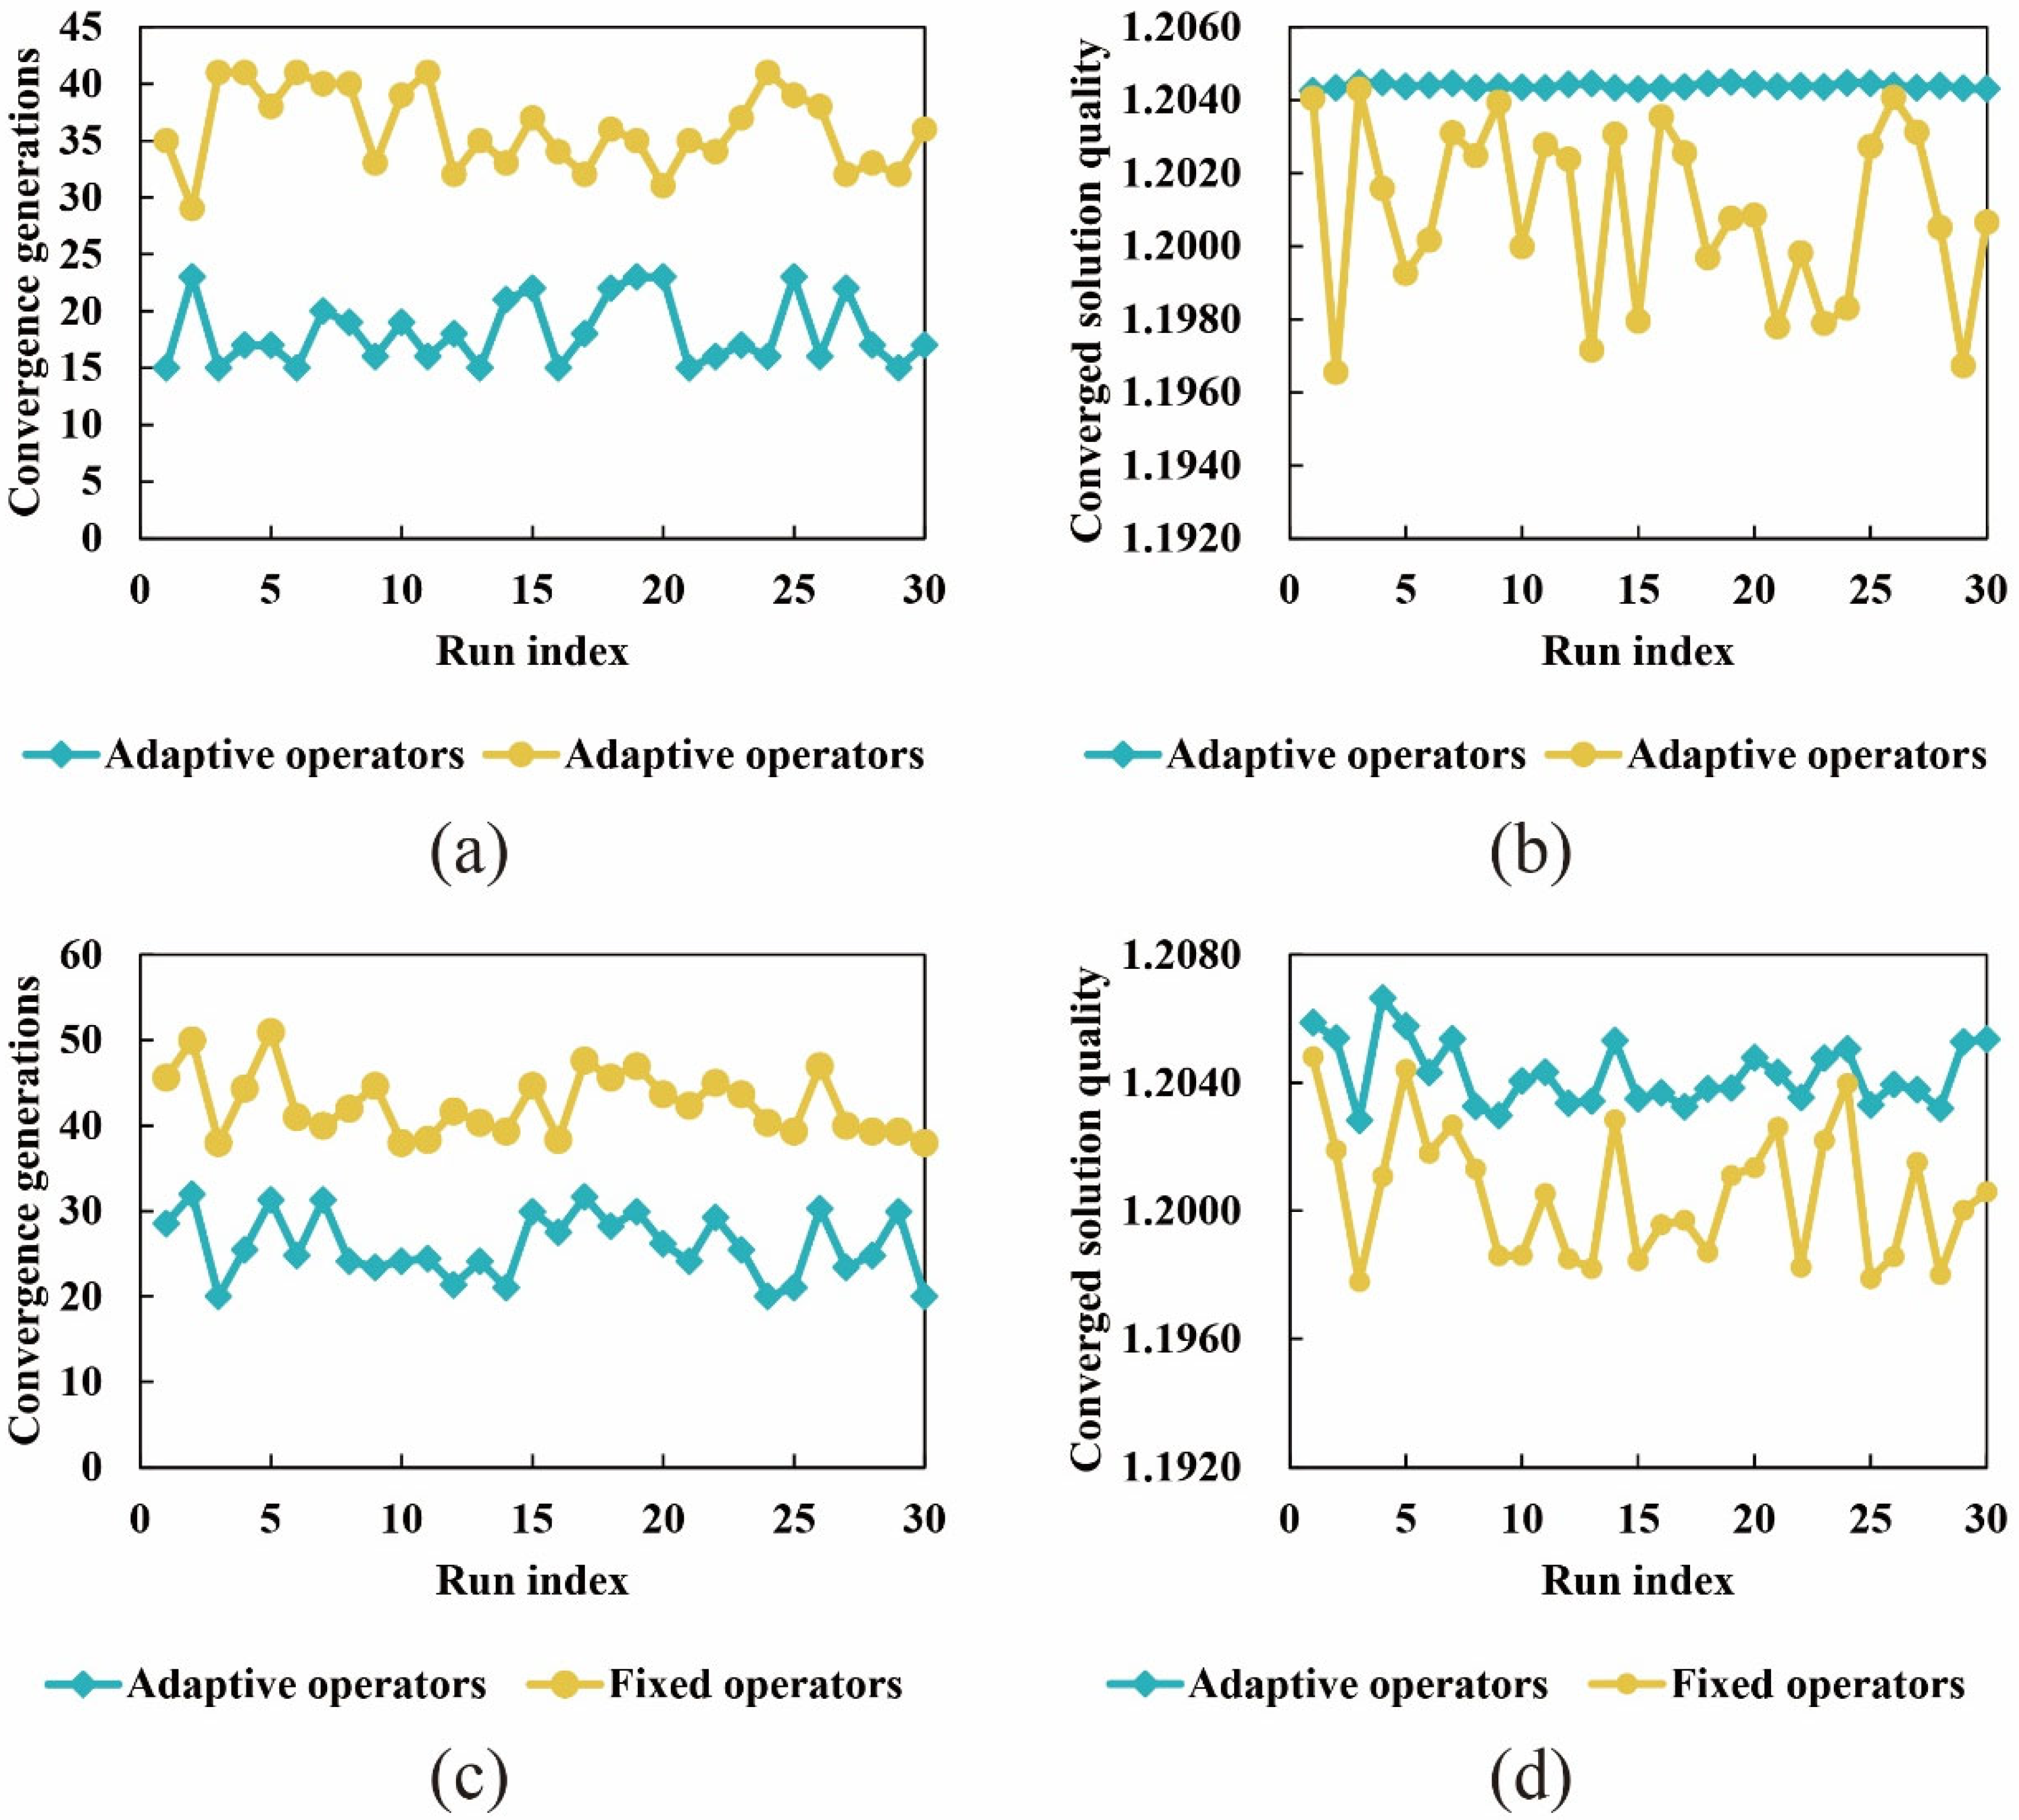
To validate that adaptive operators achieve a faster convergence while maintaining a higher converged solution quality, this study compares the convergence generations and the converged solution quality between adaptive operators and fixed operators. Both convergence generations and convergence quality are calculated using the Hypervolume (HV) metric. The HV metric integrates both convergence (degree of approximation to the true Pareto front) and diversity (uniformity of solution point coverage), with larger values indicating a superior solution set quality, thereby providing a comprehensive assessment of multi-objective optimization performance [54,55]. After normalizing the objective values based on the maximum and minimum values observed across both Pareto solution sets, the reference point is set to R = (1.1, 1.1) by adding a 10% safety margin [56]. The convergence criterion uses a relative HV change threshold of 0.1% monitored over a 30-generation detection window [57,58]. Convergence is determined when the relative variation in HV values remains below the threshold for 30 consecutive generations. The convergence quality is quantified by the average HV of the Pareto solution set after convergence. Both operators underwent 30 independent runs for both Case 1 and Case 2 to measure convergence generations and converged solution quality (see Figure 10).
In Case 1, the adaptive operators reach convergence in 18.1 ± 2.9 generations, significantly fewer than the 36.0 ± 3.5 generations required by the fixed operator (T = 0, p < 0.001, and |r| = 1.00), yielding an average reduction of approximately 49.7% in convergence generations. No significant difference in converged solution quality is observed (T = 465, p = 1.0000). In Case 2, the same pattern emerges: the adaptive operators converge in 57.7 ± 11.2 generations, significantly fewer than the 76.4 ± 11.1 generations required by the fixed operator (T = 0, p < 0.001, and |r| = 1.00), representing an average improvement of 32.0%, with converged solution quality again showing no significant difference (T = 465 p = 1.0000).
Collectively, these results demonstrate that adaptive operators accelerate convergence by 32.0–49.7% while preserving converged solution quality, thereby affirmatively answering Research Question 1.

5.1.2. Ablation Study on Adaptive Terms

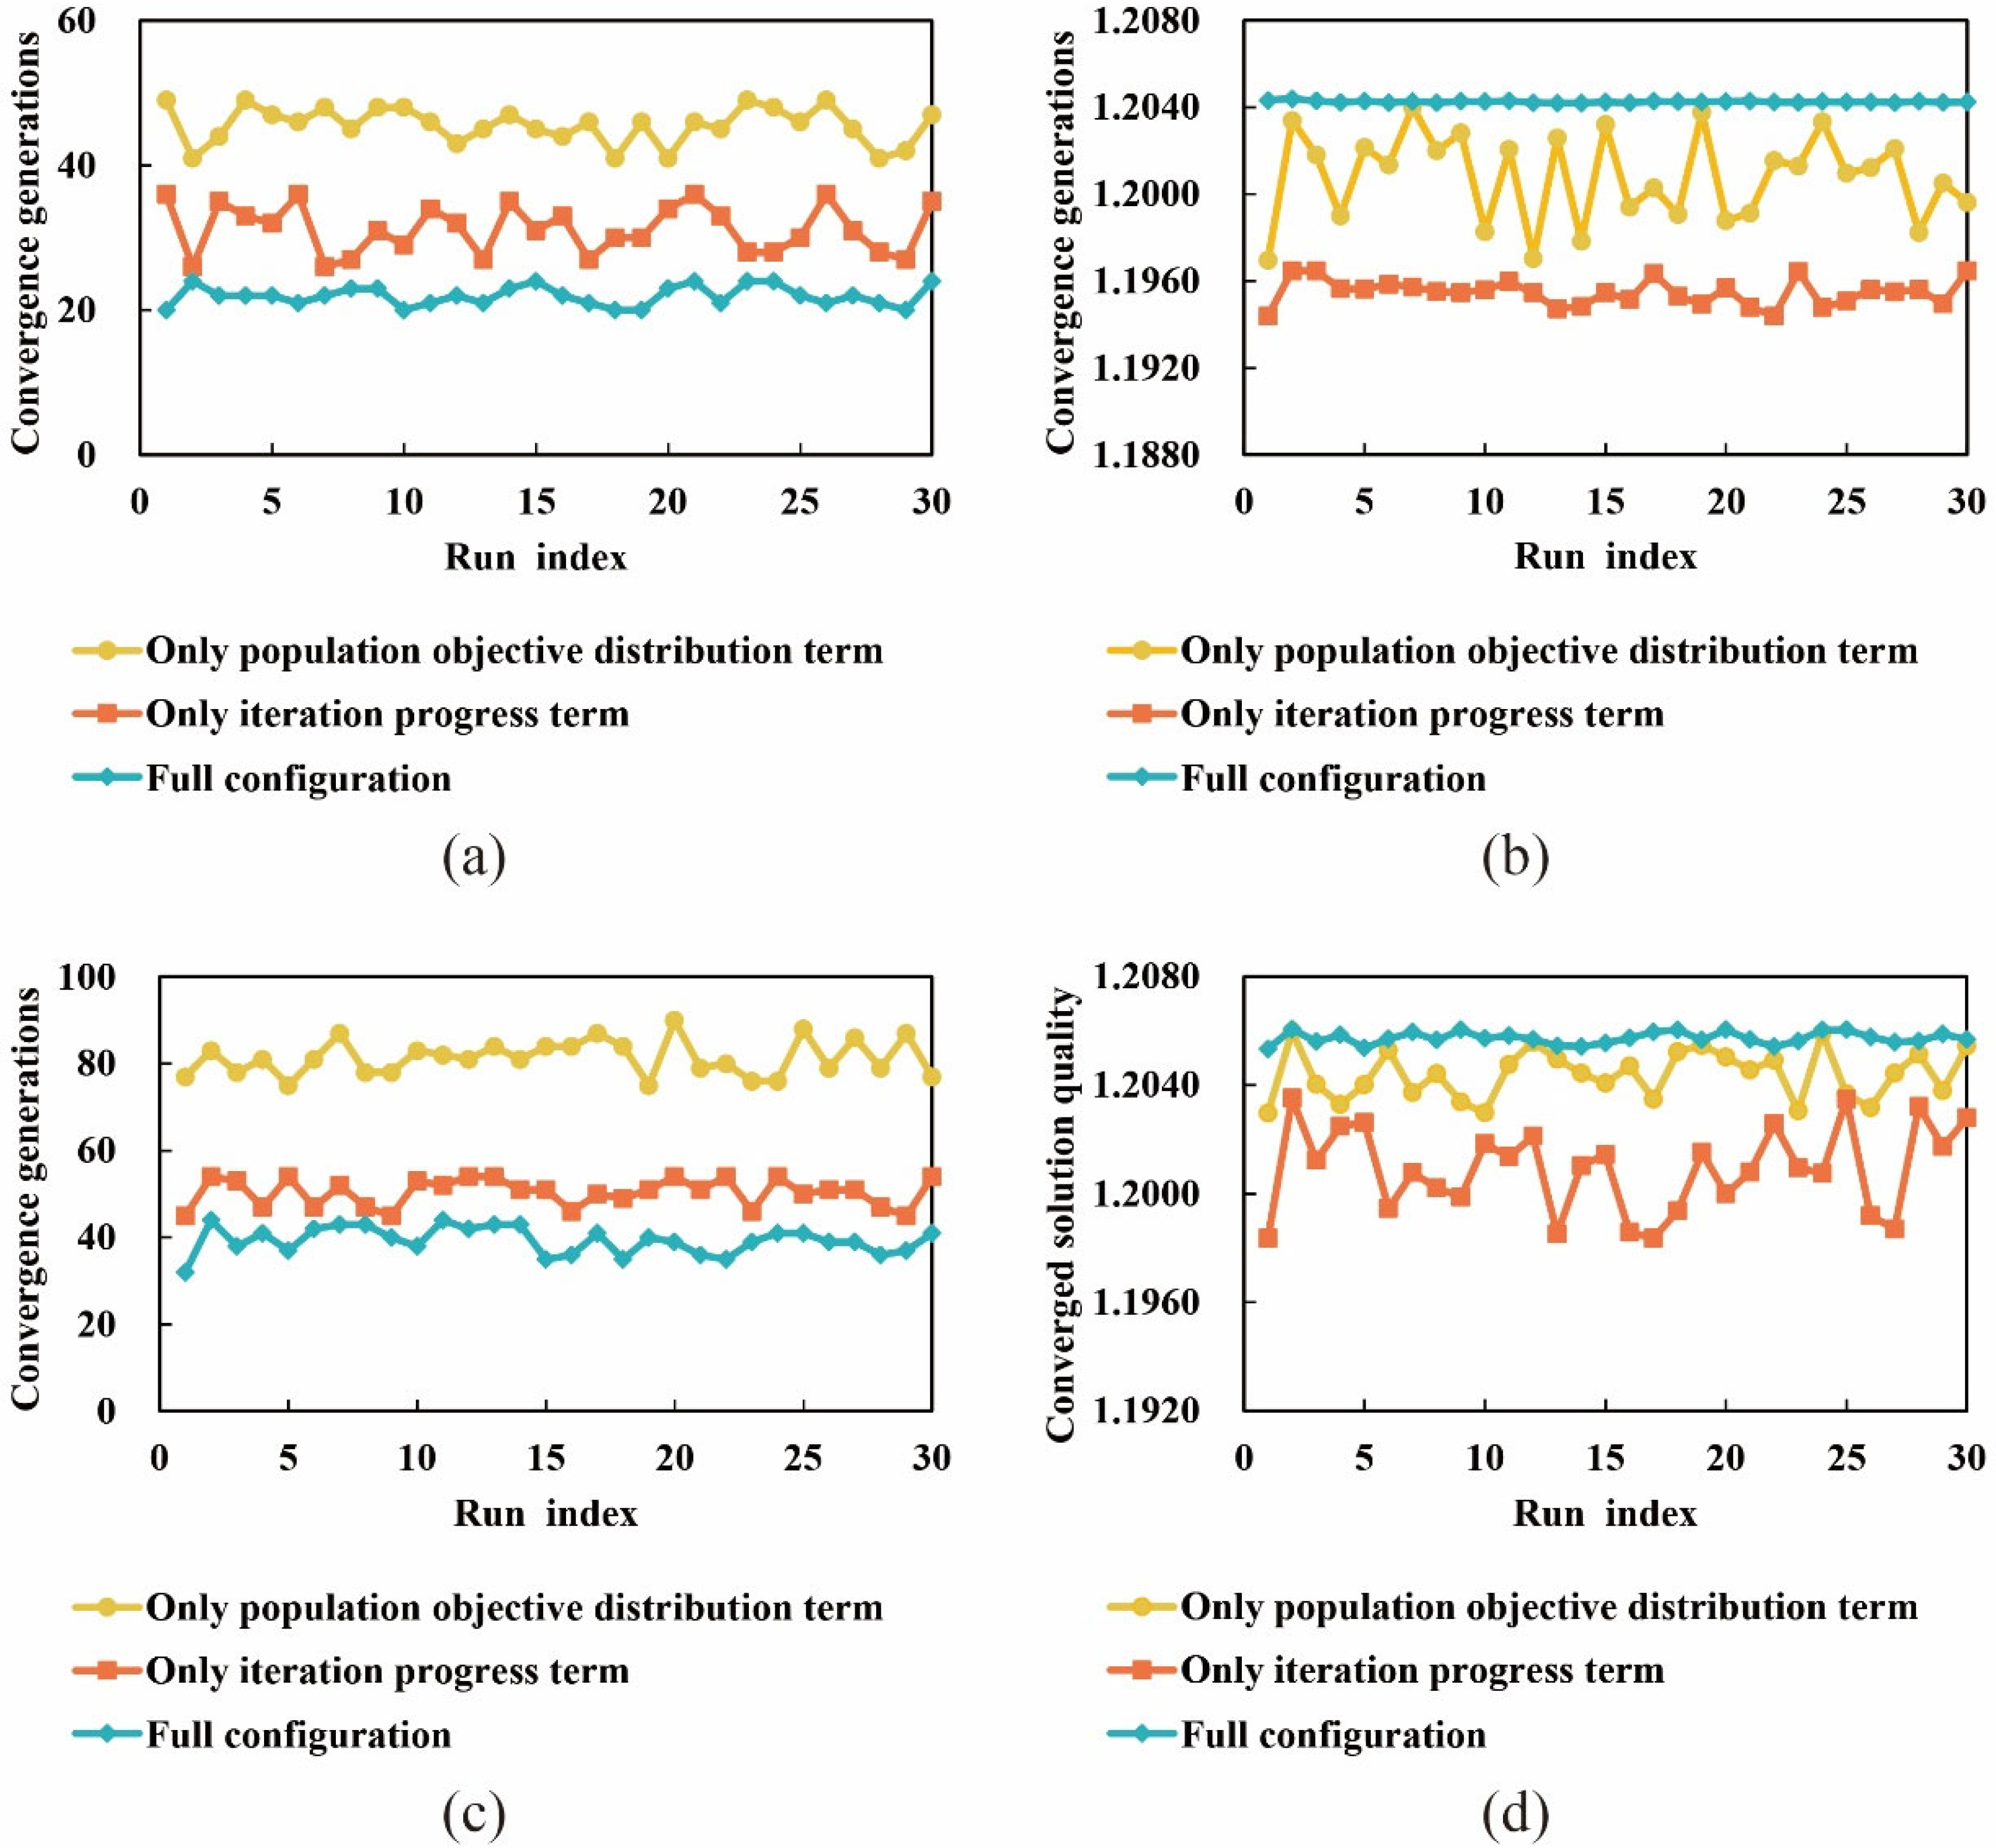
To validate the necessity of each adaptive term in adaptive operators shown in Equations (6) and (7), three configurations are constructed and evaluated: one containing only the population objective distribution term, one containing only the iteration progress term, and the full configuration retaining both terms. Each configuration undergoes 30 independent runs for both Case 1 and Case 2 to measure convergence generations and the converged solution quality (see Figure 11).
In Case 1, the full configuration reaches convergence in 22.2 ± 1.4 generations, significantly fewer than the 45.6 ± 2.5 generations required when only the population objective distribution term was active or the 31.2 ± 3.4 generations required when only the iteration progress term is active; both pairwise comparisons yield T = 465, p < 0.001, and |r| = 1.00. Whether the statistically significant difference in the converged solution quality is meaningful can be evaluated by the converged solution quality improvement. This improvement is calculated as the relative change Δ = (Q_new − Q_ref)/Q_ref × 100%, where Q_new and Q_ref denote the converged solution quality of the new and reference algorithms, respectively [59]. If the improvement remains below the 0.8% threshold, it is considered negligible [60]. Although the single-term setups differ statistically from the full configuration (T = 0, p < 0.001, and |r| = 1.00), this improvement remains below the 0.8 percent threshold and is therefore considered negligible. In Case 2, the same pattern is observed: the full configuration converges in 39.3 ± 3.1 generations, again significantly fewer than the 81.3 ± 4.2 generations required with the population-only term and the 50.4 ± 3.2 generations required with the iteration-only term, producing identical statistical outcomes (T = 465, p < 0.001, and |r| = 1.00) and negligible differences in converged solution quality (converged solution quality improvement < 0.8%).
This indicates that the full configuration achieves optimal convergence efficiency without compromising the converged solution quality, which stems from the synergistic action of the iteration progress term and the population objective distribution term. The iteration progress term uses the decay formula g G to minimize late-stage perturbations and speed up convergence. The population objective distribution term applies ( 1 m i n o b j i m e a n o b j i ) to dynamically boost operator probabilities for unconverged objectives, avoiding premature stagnation. Together, these terms quickly approximate the Pareto front while maintaining converged solution quality.

5.2. Comparison with State-of-the-Art Algorithms

To verify the faster convergence of our proposed MOEA/D with adaptive operators, we compare it with NSGA-II/III, SPEA2, a multi-objective evolutionary algorithm based on decomposition with dynamic resource allocation (MOEA/DD) [61], stable-state adaptive optimization multi-objective evolutionary algorithm based on decomposition (SAO-MOEA/D) [62], and sparse evolutionary algorithm with adaptive gradient descent strategy (SparseEA-AGDS) [63], in terms of convergence generations and quality. The results are shown in Figure 12.
In Case 1, Wilcoxon signed-rank tests (conducted in JAMOVI 2.2.5) show no significant differences between the MOEA/D with adaptive operators and SAO-MOEA in convergence generations (W = 188, p = 0.278, and |r| = 0.25) and converged solution quality (W = 226, p = 0.862, and |r| = 0.04). However, the MOEA/D with adaptive operators significantly outperforms other algorithms in convergence generations (W = 0, p < 0.001, and |r| = 1.00) and converged solution quality (W = 465, p < 0.001, |r| = 1.00, and converged solution quality improvement > 0.8%). In Case 2, similar non-significant differences are found between the MOEA/D with adaptive operators and SAO-MOEA in generations (W = 143, p = 0.165, and |r| = 0.36) and converged solution quality (W = 138, p = 0.088, and |r| = 0.37), but MOEA/D with adaptive operators again significantly surpasses others in generations (W = 0, p < 0.001, and |r| = 1.00) and quality (W = 0, p < 0.001, |r| = 1.00, and converged solution quality improvement > 0.8%).
In summary, the MOEA/D with adaptive operators shows significant and robust advantages in convergence generations. In the bi-objective MRTAS optimization of this paper, the MOEA/D with adaptive operators outperforms SparseEA-AGDS, MOEA/DD, NSGA-III, NSGA-II, and SPEA2 in convergence quality, with no significant difference compared to the SAO-MOEA/D. This is because the adaptive mechanism of MOEA/D with adaptive operators balances exploration and exploitation more efficiently, dynamically adjusts search directions, and reduces convergence generations while maintaining the converged solution quality. Although SAO-MOEA/D is comparable to MOEA/D with adaptive operators in convergence generations and quality, its surrogate model-based approach for filtering high-quality solutions is less flexible than the MOEA/D with adaptive operators. Thus, MOEA/D with adaptive operators has significant and robust advantages in both convergence generations and converged solution quality.

5.3. Sensitivity Analysis

5.3.1. Sensitivity Analysis on Algorithm Coefficients

To verify the effectiveness of the four coefficients p c r o _ 0 , p c r o _ m i n , p m u t _ 0 , and p m u t _ m i n in Equations (6) and (7), three levels (see Table 11) are set for each coefficient: baseline, lower limit (−20%), and upper limit (+20%). An L18(21 37) orthogonal experiment was designed (see Table 12), with coefficient configuration 17 representing the default combination ( p c r o _ 0 = 1 , p c r o _ m i n = 0.07 , p m u t _ 0 = 0.3 , and p m u t _ m i n = 0.015 ). Each coefficient configuration is run independently 30 times to record convergence generations and quality (see Figure 13). In both Case 1 and Case 2, the orange circle and blue triangle in Figure 13 highlight the identical configuration 17, which simultaneously achieves the highest converged solution quality and the fewest convergence generations among all tested configurations. In Case 1, Wilcoxon signed-rank tests confirm that coefficient configuration 17 has significantly fewer convergence generations than the other groups. Paired Wilcoxon tests show that 14 of 17 groups have W = 465 (p < 0.001, r = 1.00), and 3 groups have W = 388–449 (p < 0.001, |r| = 0.669–0.931). Coefficient configuration 17 also shows significant differences in convergence quality compared to the other groups (W = 0, p < 0.001, and |r| = 1.000), but the differences are negligible (converged solution quality improvement < 0.8%). In Case 2, the Wilcoxon signed-rank tests likewise confirm that coefficient configuration 17 has significantly fewer convergence generations. Paired Wilcoxon tests show that 12 of 17 groups have W = 465 (p < 0.001, |r| = 1.00), and 5 groups have W = 390–438 (p < 0.001, |r| = 0.6589–0.914). Differences in convergence quality are again significant (W = 0, p < 0.001, and |r| = 1.000) but still negligible (converged solution quality improvement < 0.8%).
Coefficient configuration 17 demonstrates a significant advantage in convergence speed while maintaining an equivalent convergence quality and showing strong robustness. This indicates that the default values not only deliver superior performance but are also highly reasonable and reliable.

5.3.2. Sensitivity Analysis to Input Perturbations

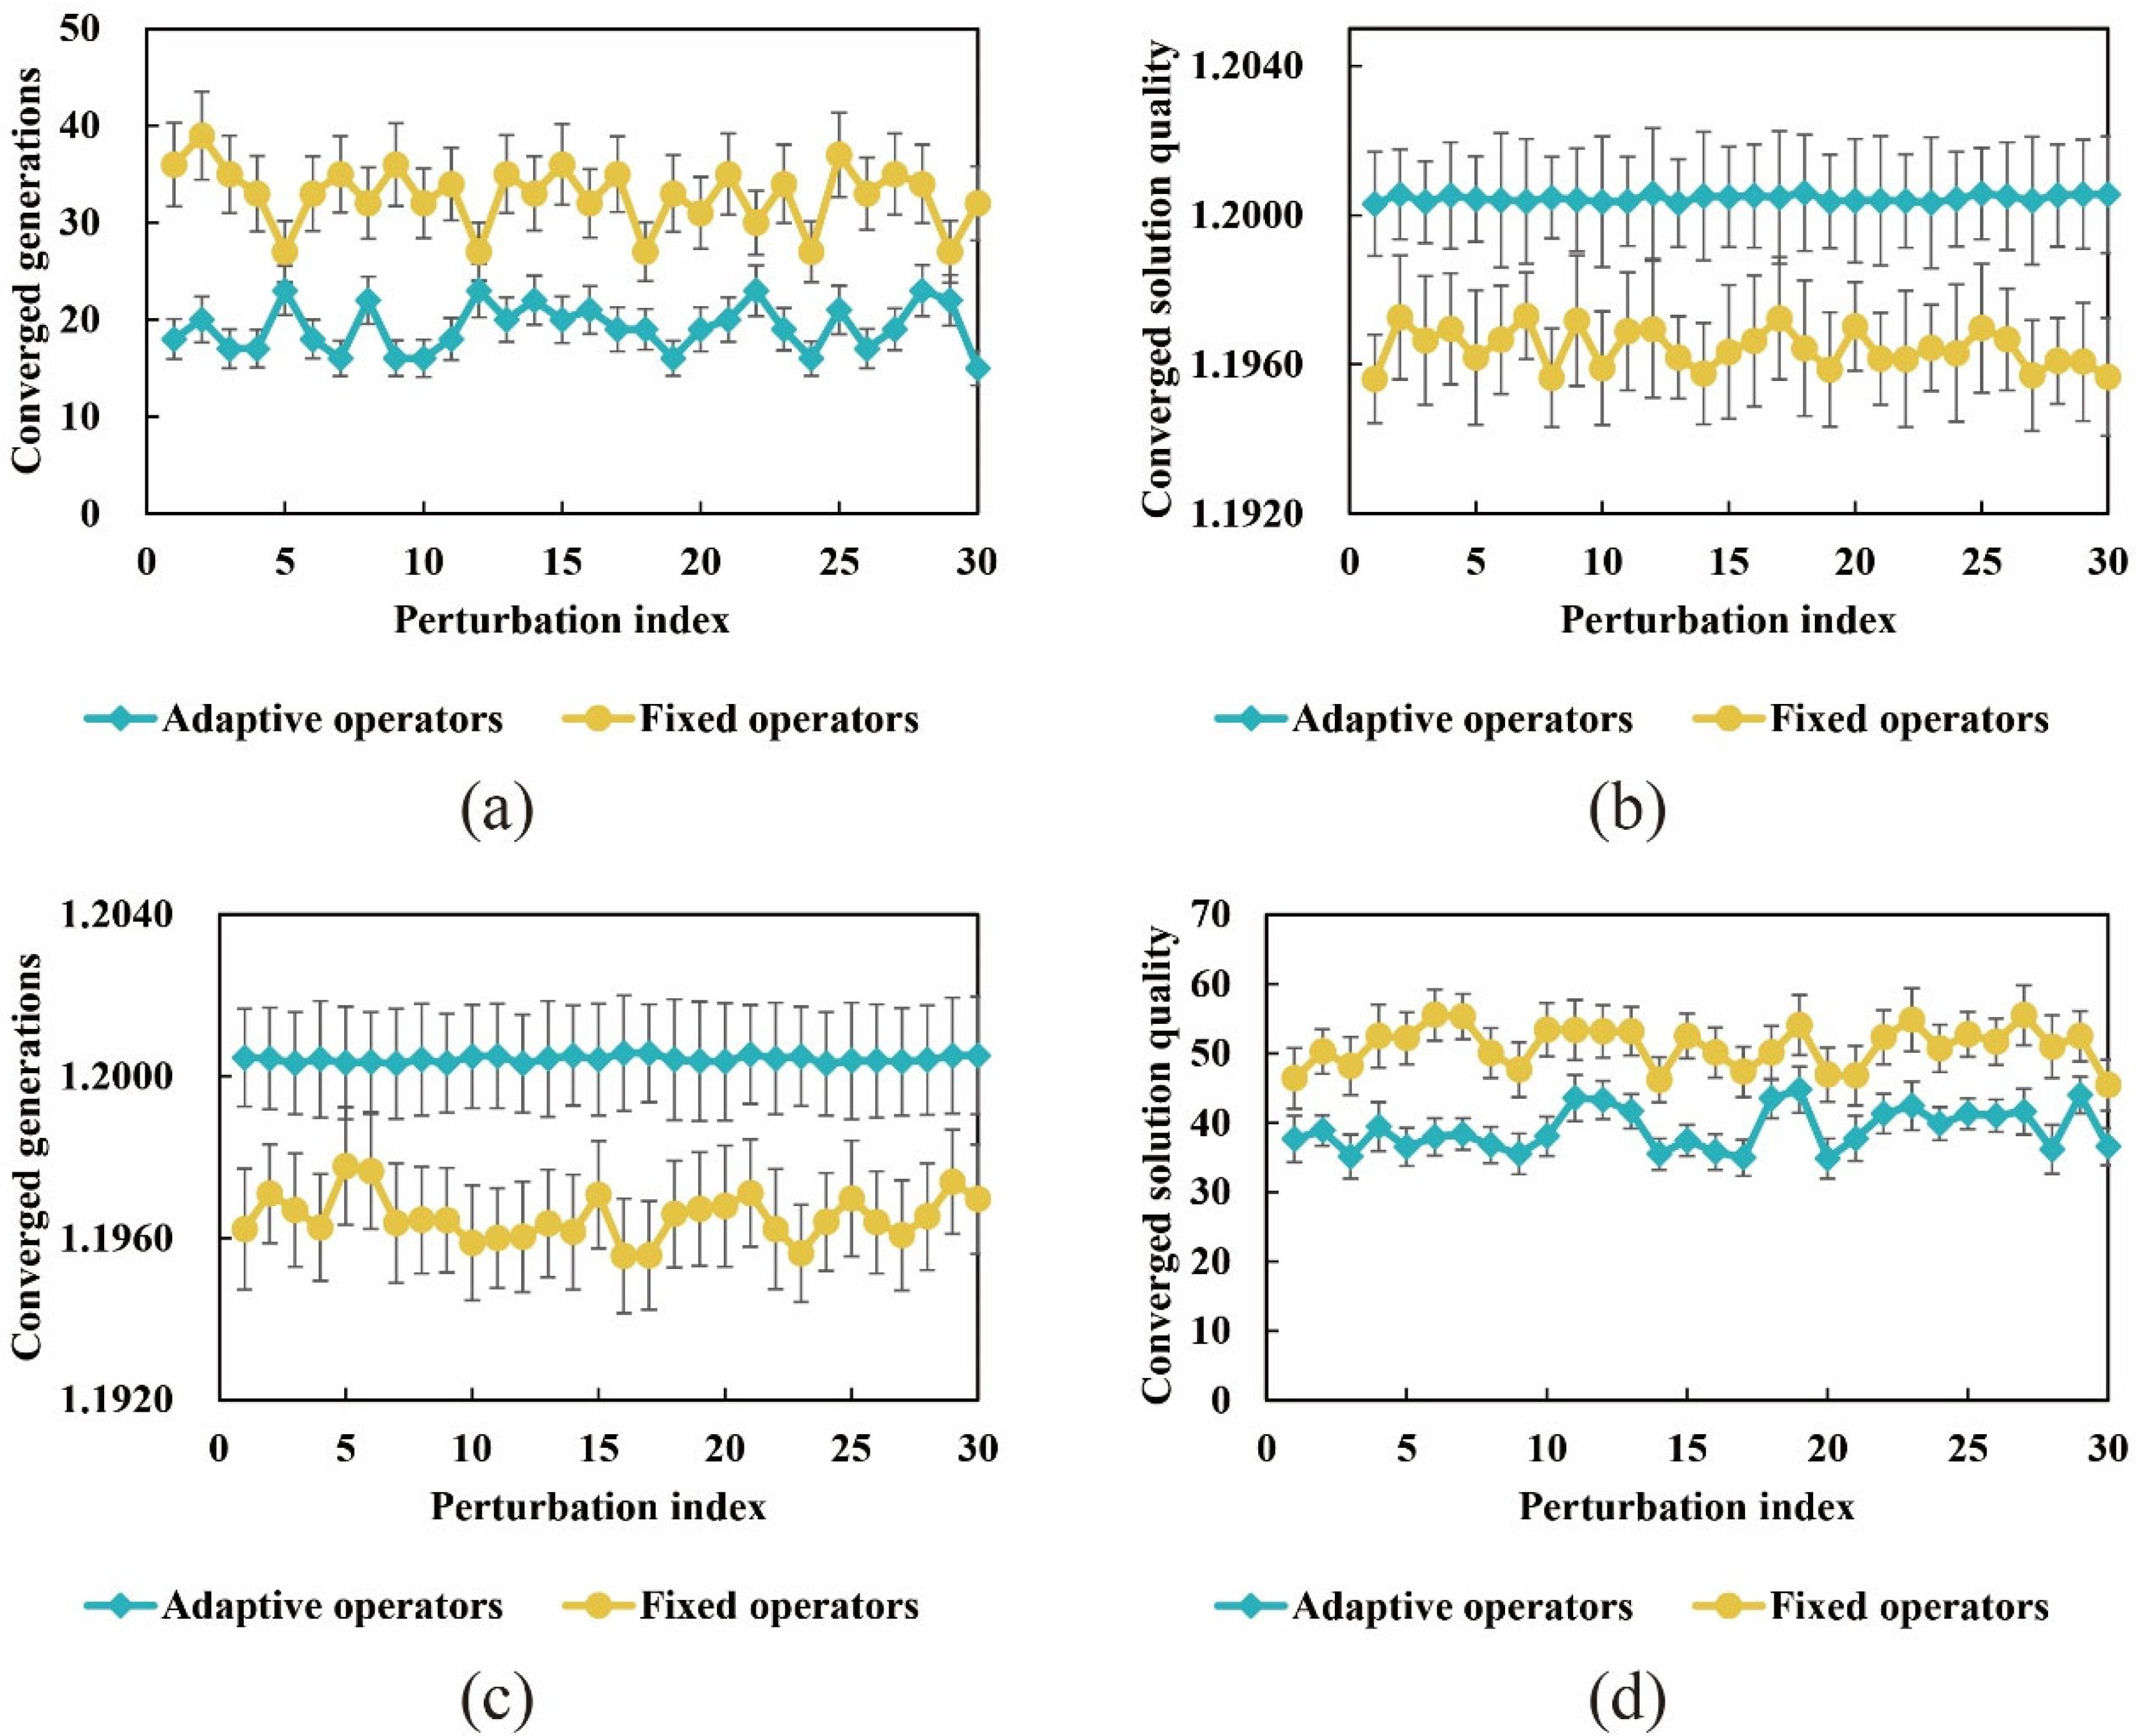
To verify the robustness of the MOEA/D with adaptive operators, ±10% random perturbations were imposed on task execution time and resource consumption, with 30 independent perturbation scenarios. Each scenario is followed by 30 algorithmic runs to record convergence generations and converged solution quality (see Figure 14). Wilcoxon signed-rank tests confirm that adaptive operators require significantly fewer generations across all 30 perturbation groups (Case 1: T = 0, p < 0.001, and |r| = 1.00; Case 2: T = 0, p < 0.001, and |r| = 1.00), while no practical difference in converged solution quality is observed (Case 1 and Case 2: T = 465, p = 1.00). This indicates that the proposed method demonstrates strong robustness to input perturbations, ensuring an efficient convergence speed and relatively stable convergence quality even in uncertain environments.

5.4. Comparison with Traditional Greedy Algorithm

To validate the decoding capability of the idle-time-aware decoding strategy for MRTAS, comparative experiments are performed on Cases 1 and 2.
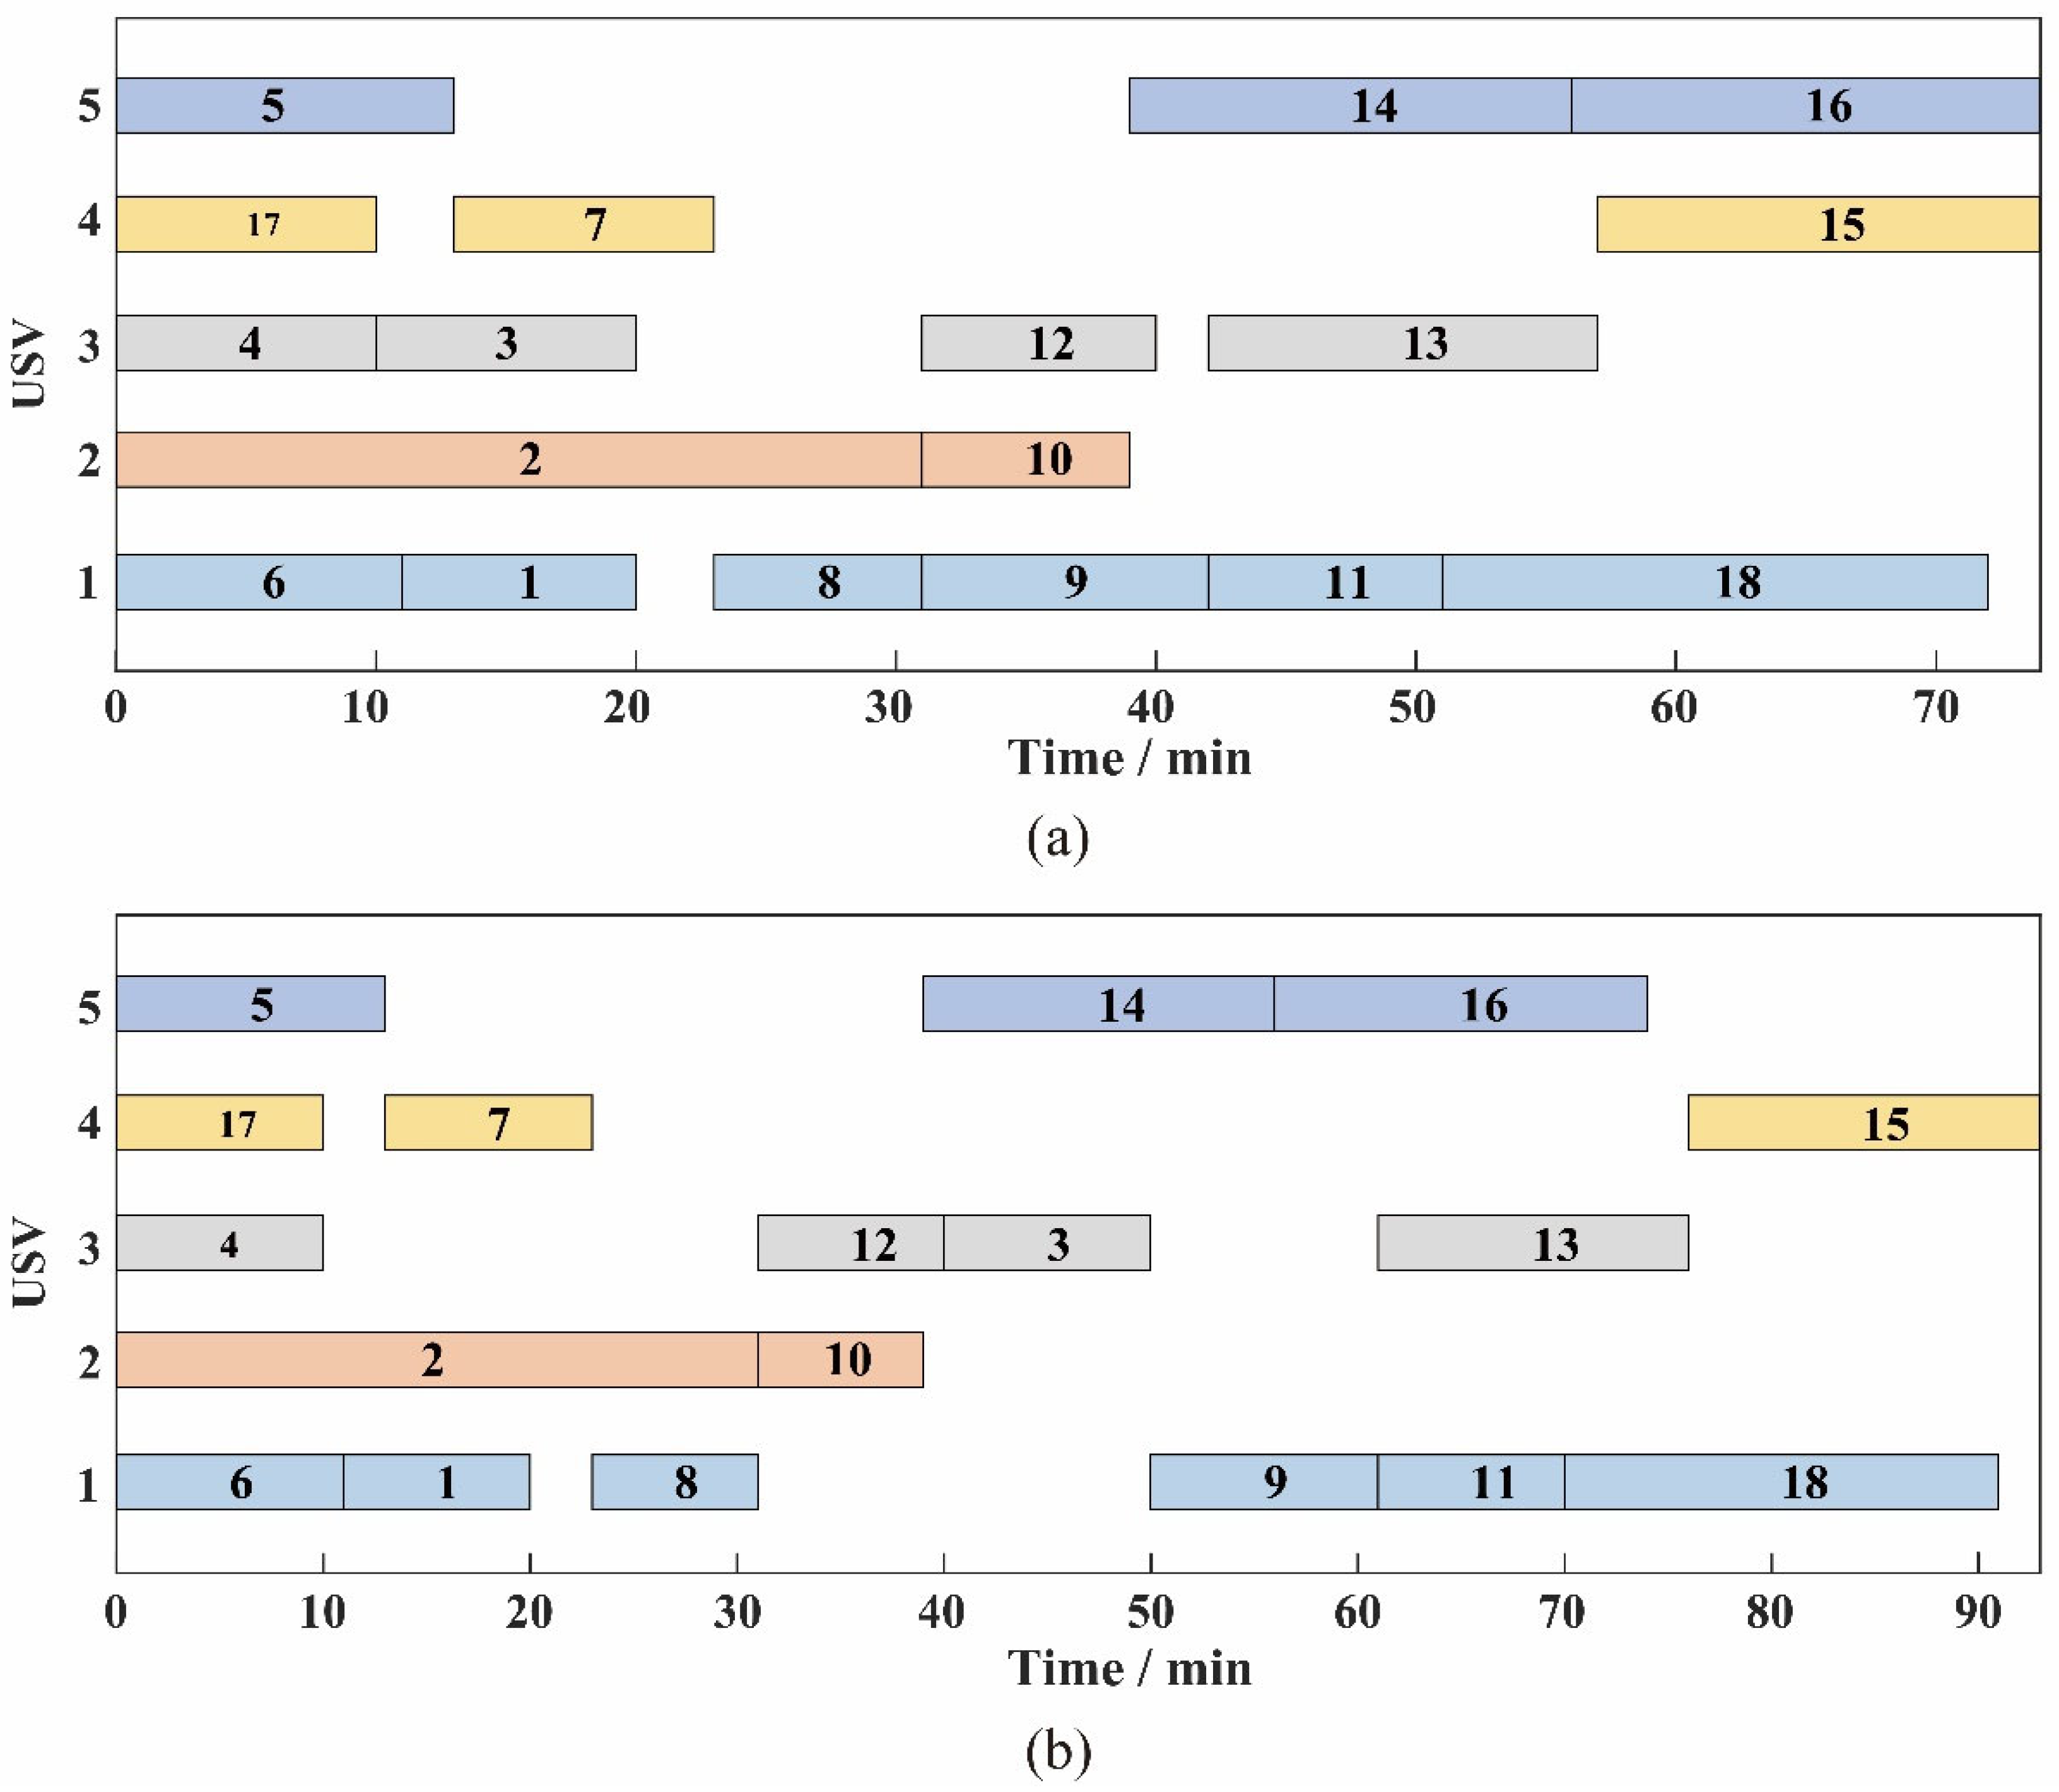
In Case 1, a randomly generated MRTAS scheme encoded as a sequence chromosome (4, 6, 17, 5, 2, 7, 1, 8, 10, 12, 3, 9, 13, 14, 11, 15, 18, 16) and a USV chromosome of (3, 1, 4, 5, 2, 4, 1, 1, 2, 3, 3, 1, 3, 5, 1, 4, 1, 5) is decoded, the task completion time obtained by the greedy algorithm is 93 min (see Figure 15b), and the idle-time-aware decoding strategy reduces the completion time to 74 minutes (see Figure 15a), which is a 20.4% reduction. In Case 2, a randomly generated MRTAS scheme encoded as a sequence chromosome (43, 15, 6, 1, 19, 21, 55, 60, 58, 24, 18, 5, 23, 16, 34, 67, 37, 10, 48, 52, 25, 27, 36, 39, 44, 9, 47, 13, 51, 68, 69, 70, 14, 56, 57, 3, 2, 20, 4, 8, 46, 12, 50, 22, 28, 7, 11, 45, 49, 53, 54, 59, 26, 29, 31, 77, 32, 78, 33, 79, 80, 30, 61, 62, 63, 66, 64, 65, 71, 72, 73, 81, 82, 83, 84, 85, 86, 87, 88, 89, 90, 91, 92, 93, 94, 95, 17, 35, 38, 40, 41, 42, 75, 76, 74, 96, 97, 98, 99, 100) and a USV chromosome of (1, 10, 4, 1, 1, 4, 4, 1, 1, 4, 4, 4, 4, 4, 4, 4, 4, 6, 8, 8, 4, 4, 4, 4, 1, 6, 8, 8, 8, 4, 1, 1, 10, 4, 1, 1, 1, 1, 1, 6, 8, 8, 8, 4, 6, 6, 8, 8, 8, 10, 6, 1, 1, 6, 6, 8, 6, 8, 6, 8, 8, 4, 4, 4, 6, 6, 6, 6, 1, 4, 4, 1, 4, 4, 4, 4, 4, 6, 6, 8, 8, 8, 8, 8, 1, 1, 4, 4, 4, 4, 6, 6, 6, 6, 6, 4, 4, 4, 6, 1) is decoded, the task completion time obtained by the greedy algorithm is 899 min (see Figure 16b), and the idle-time-aware decoding strategy reduces the completion time to 674 minutes (see Figure 16a), which is a 33.4% reduction. Notably, the decoding process finishes in 231 milliseconds for Case 1 and rises modestly to 709 milliseconds for Case 2, showing that the strategy retains high computational efficiency as the task complexity grows from limited to substantially larger scales.
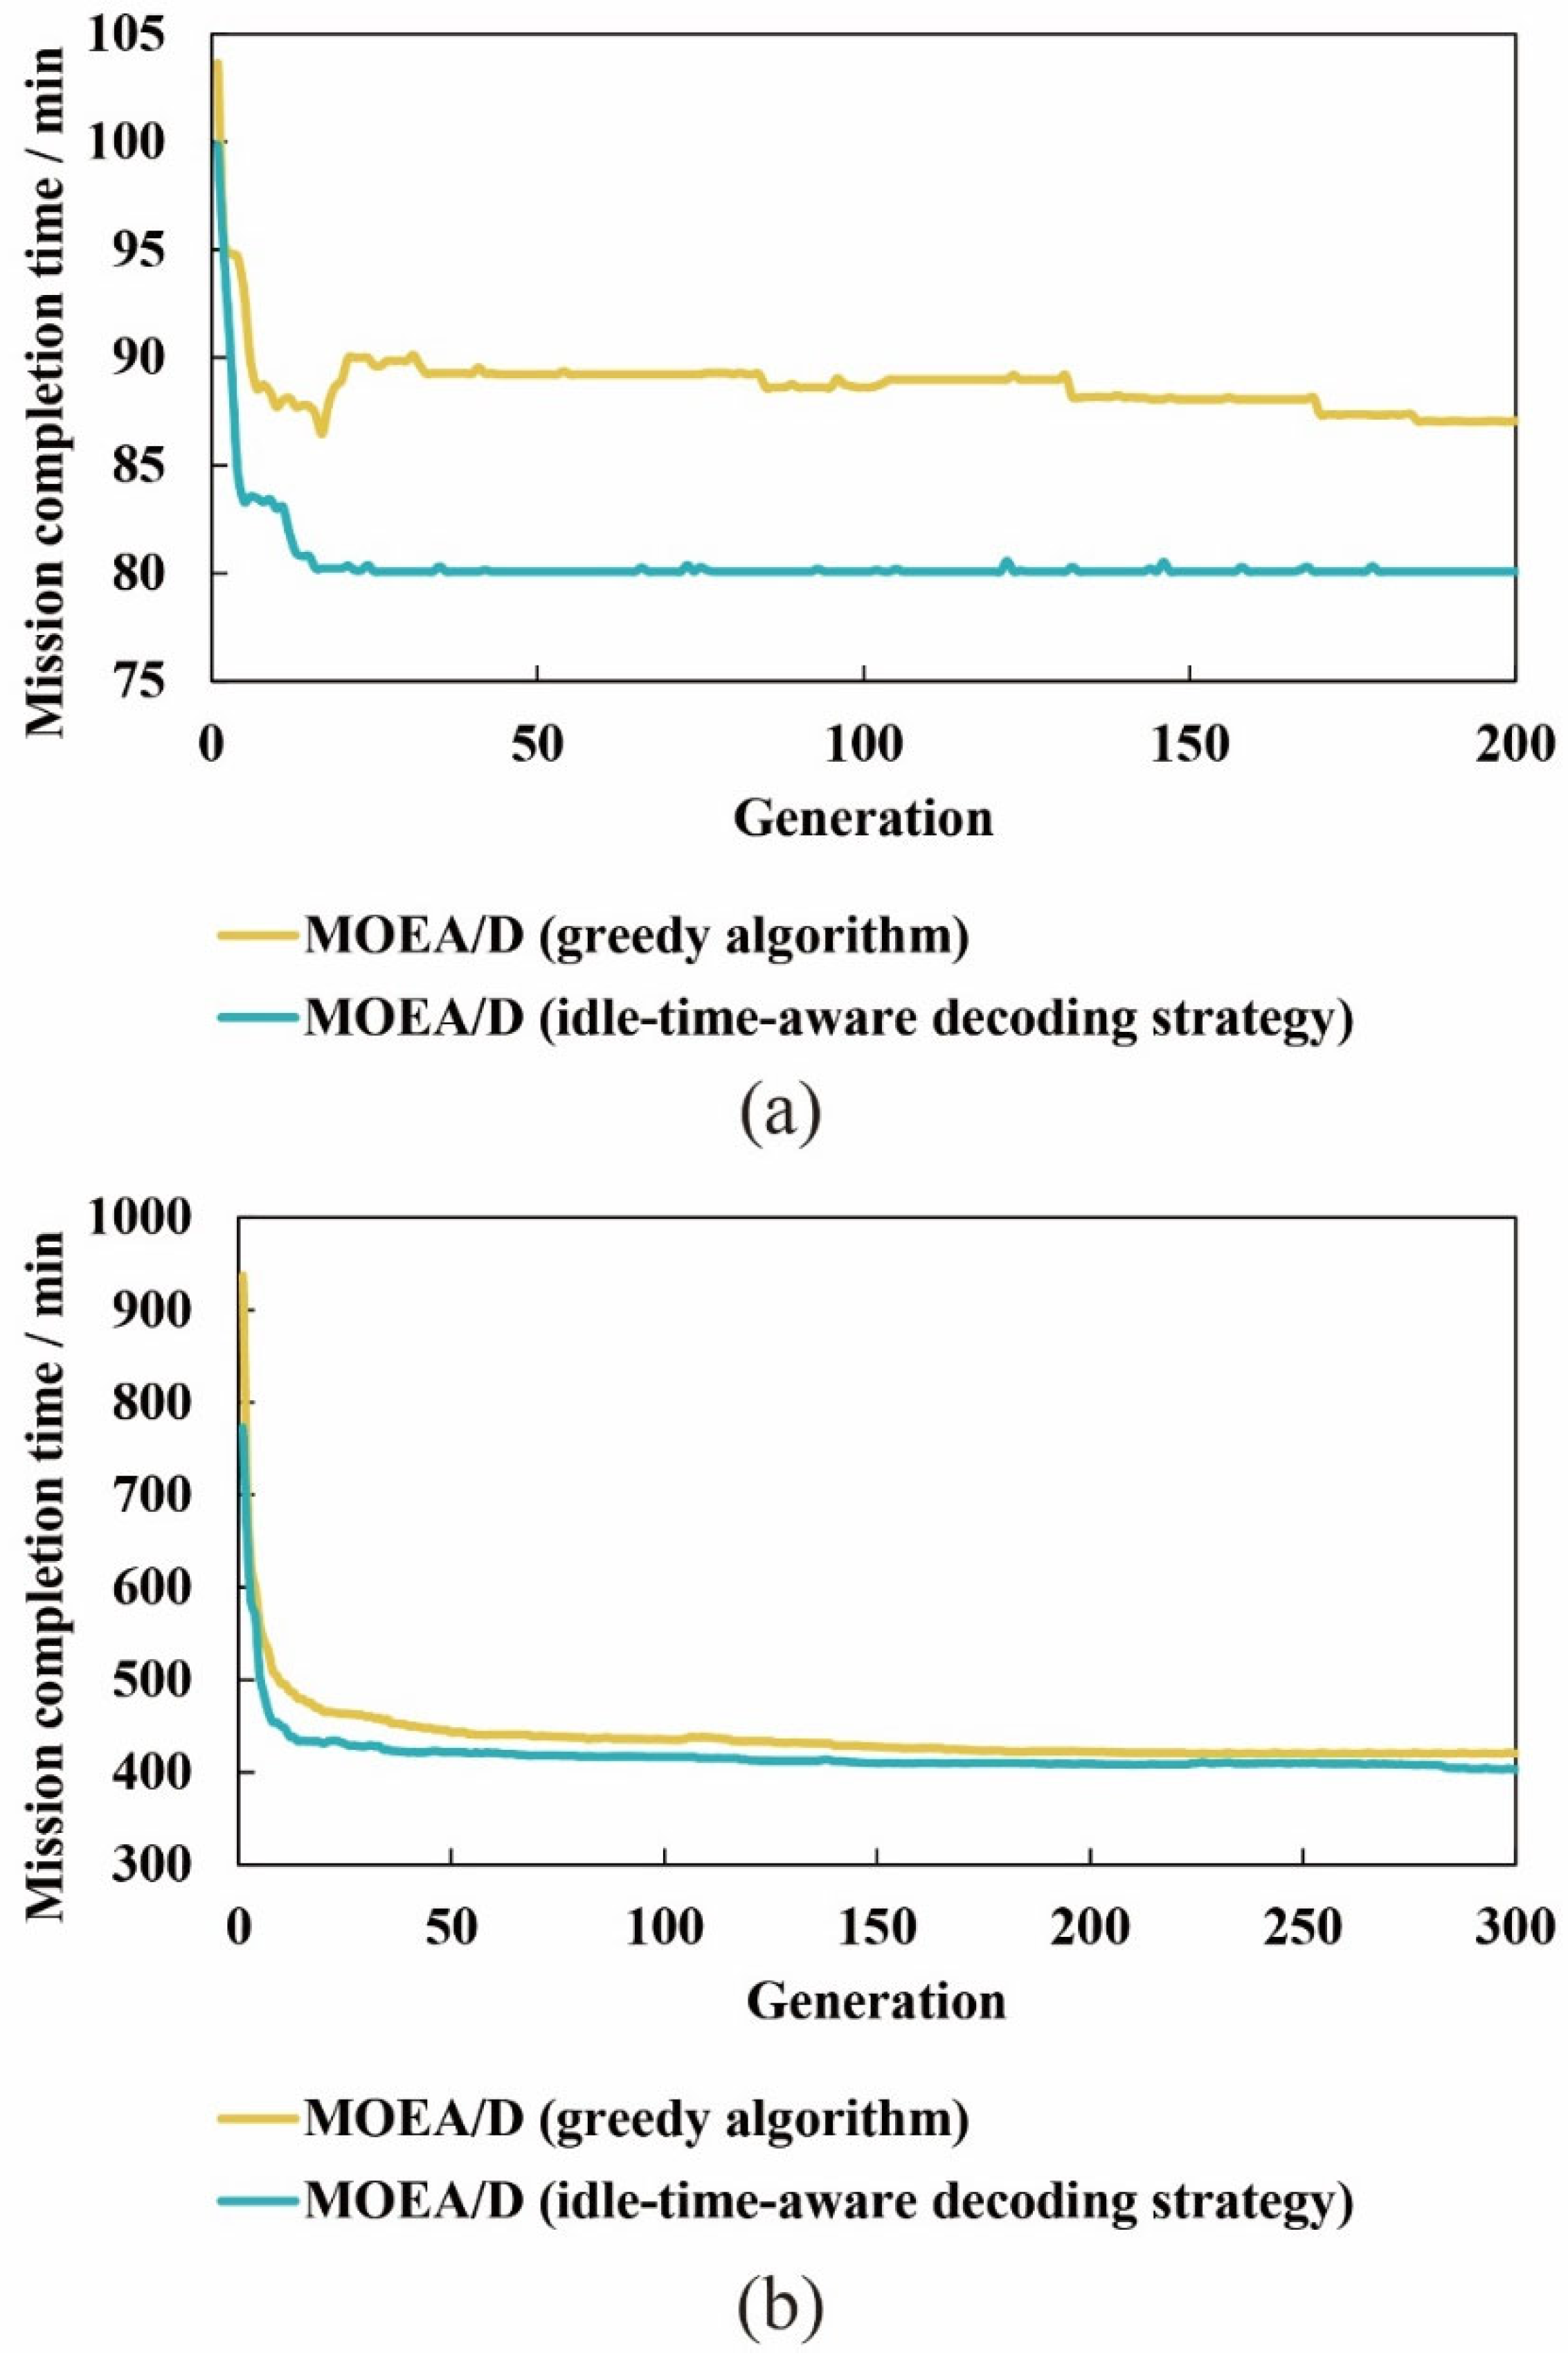
Throughout the entire enhanced MOEA/D run, the evolution of the mean mission completion time is monitored to confirm the global effectiveness of the idle-time-aware decoding strategy (Figure 17). In both cases, the resulting curves stay consistently below those produced by the traditional greedy algorithm and stabilize during the later generations. In Case 1, the idle-time-aware decoding strategy stabilizes the mean mission completion time at roughly 80.5 min, whereas the greedy algorithm stabilizes at 88 min, yielding an average reduction of about 8.5%. In Case 2, the same strategy stabilizes the mean mission completion time at roughly 403.5 min compared with 420.5 min for the greedy algorithm, yielding an average reduction of about 4.0%. The random single-decoding instances achieved reductions of 20.4% in Case 1 and 33.4% in Case 2, while the idle-time-aware decoding strategy shortened the mean mission completion time by 4.0–8.5% compared with the traditional greedy decoder across the entire enhanced MOEA/D evolution. Together, these results affirmatively answer Research Question 2 and confirm the strategy’s superiority in reducing actual mission completion time.

6. Conclusions

Optimizing solution generation efficiency and mission execution efficiency is essential for MRTAS to meet time-critical requirements and enhance the survival rate of affected individuals. MOEA/D, as a multi-objective optimization algorithm with rapid convergence speed, is well-suited for such time-sensitive scenarios. However, its use of a fixed probability crossover and mutation operators easily leads to ineffective perturbations or insufficient exploration, thereby slowing convergence. Simultaneously, the greedy algorithm employed for decoding the MRTAS scheme fails to actively utilize idle gaps within USV execution timelines, resulting in prolonged mission completion times. To address these limitations, this paper proposes adaptive operators considering iteration progress and population objective distribution status and an idle-time-aware decoding strategy detecting idle gaps to enhance MOEA/D. The enhanced MOEA/D is used to solve the MRTAS model that minimizes both mission completion time and resource consumption. Two case studies (Case 1–18 task, Case 2–100 task) are used to confirm the practicality and feasibility of the enhanced MOEA/D. Furthermore, ablation studies, sensitivity analyses, and comprehensive comparisons against fixed operators, state-of-the-art algorithms, and traditional decoding strategies all demonstrate that the enhanced MOEA/D can accelerate convergence (measured by HV) while maintaining converged solution quality (measured by HV) and reduce mission completion time. Notably, adaptive operators accelerate convergence by 32.0–49.7% while preserving the converged solution quality, thereby directly answering Research Question 1. The idle-time-aware decoding strategy shortened the mean mission completion time by 4.0–8.5% compared with the traditional greedy decoder, while the random single-decoding instances achieved reductions of 20.4% in Case 1 and 33.4% in Case 2. Together, these results directly address Research Question 2 and confirm the strategy’s superiority in reducing actual mission completion time. This suggests that the enhanced MOEA/D integrating both adaptive operators and idle-time-aware strategy is rationally effective and more suitable for MRTAS.
This study has several limitations. First, the study constructs an MRTAS model minimizing mission completion time and resource consumption, aligning with the core demands of resource-constrained scenarios. However, it fails to incorporate other factors such as environmental dynamics, limiting the practical utility of such solutions in high-risk real-world situations. Future work should integrate multi-dimensional objectives, such as introducing environmentally adaptive costs. Second, this study aggregates the switching time between different tasks into the task execution time, reducing problem complexity and avoiding combinatorial explosion from topology-specific distances and task-type combinations. It fails to consider the practical switching operations, which may lead to systematic deviations between the decoded schedules and actual execution. Future work needs to establish a switching time matrix and embed it dynamically within the decoding strategy. Finally, the enhanced MOEAD generates MRTAS solutions based on predefined task parameters, enhancing computational efficiency and fitting typical offline planning design principles. However, it cannot respond to stochastic maritime events, such as emergent task insertions or execution delays, reducing solution robustness in dynamic scenarios. To address this, future work should develop an algorithmic framework with rescheduling trigger mechanisms to support real-time MRTAS optimization.

Supplementary Materials

The following supporting information can be downloaded at: https://www.mdpi.com/article/10.3390/jmse13081518/s1, Code S1: adaptive_probs.py; Code S2: decode.py; Table S1: Task parameter input of Case 2.xlsx; Table S2: Objective values of the 200-generation population_Case 1.xlsx; Table S3: Objective values of the 300-generation population_Case 2.xlsx.

Author Contributions

Conceptualization, J.S. and S.Y.; methodology, J.S.; software, J.C.; validation, J.S., and R.L.; formal analysis, R.L.; investigation, S.Y.; resources, J.C.; data curation, S.Y.; writing—original draft preparation, J.S.; writing—review and editing, S.Y.; visualization, J.S.; supervision, J.C.; project administration, S.Y.; funding acquisition, S.Y. All authors have read and agreed to the published version of the manuscript.

Funding

This research was funded by the 111 Project, grant number B13044.

Data Availability Statement

The raw data supporting the conclusions of this article will be made available by the authors on request.

Conflicts of Interest

The authors declare no conflicts of interest.

Abbreviations

The following abbreviations are used in this manuscript:
MRTASMaritime rescue task allocation and sequencing
MOEA/DMulti-objective evolutionary algorithm based on decomposition
USVUnmanned surface vehicle
MOEA/D-DEMulti-objective evolutionary algorithms based on decomposition with differential evolution variants
SPEAsStrength Pareto evolutionary algorithms
NSGAsNon-dominated sorting genetic algorithms
ENS-MOEA/DEnsemble neighborhood search based multi objective evolutionary algorithm based on decomposition
MOEA/D-QLMulti objective evolutionary algorithm based on decomposition with Q learning based adaptive operator selection
MOEA/D-CTAOSMulti objective evolutionary algorithm based on decomposition with classification tree based adaptive operator selection
DAGTask directed acyclic graph
MOEA/DDmulti-objective evolutionary algorithm based on decomposition with dynamic resource allocation
SAO-MOEA/DStable-state adaptive optimization multi-objective evolutionary algorithm based on decomposition
SparseEA-AGDSSparse evolutionary algorithm with adaptive gradient descent strategy

References

  1. Ai, B.; Li, B.; Gao, S.; Xu, J.; Shang, H. An Intelligent Decision Algorithm for the Generation of Maritime Search and Rescue Emergency Response Plans. IEEE Access 2019, 7, 155835–155850. [Google Scholar] [CrossRef]
  2. Xiong, W.; van Gelder, P.H.A.J.M.; Yang, K. A Decision Support Method for Design and Operationalization of Search and Rescue in Maritime Emergency. Ocean Eng. 2020, 207, 107399. [Google Scholar] [CrossRef]
  3. Yan, L.; Jinsong, B.; Xiaofeng, H.; Ye, J. A Heuristic Project Scheduling Approach for Quick Response to Maritime Disaster Rescue. Int. J. Proj. Manag. 2009, 27, 620–628. [Google Scholar] [CrossRef]
  4. Ai, B.; Jia, M.; Xu, H.; Xu, J.; Wen, Z.; Li, B.; Zhang, D. Coverage Path Planning for Maritime Search and Rescue Using Reinforcement Learning. Ocean Eng. 2021, 241, 110098. [Google Scholar] [CrossRef]
  5. Rani, S.; Babbar, H.; Kaur, P.; Alshehri, M.; Shah, S. An Optimized Approach of Dynamic Target Nodes in Wireless Sensor Network Using Bio Inspired Algorithms for Maritime Rescue. IEEE Trans. Intell. Transp. Syst. 2022, 24, 2548–2555. [Google Scholar] [CrossRef]
  6. Xu, S.; Bi, W.; Zhang, A.; Mao, Z. Optimization of Flight Test Tasks Allocation and Sequencing Using Genetic Algorithm. Appl. Soft Comput. 2022, 115, 108241. [Google Scholar] [CrossRef]
  7. Lu, Y.; Jiang, X.; Song, Y.; Wang, H.; Wu, J. Recent Advances in Maritime Security Risk Detection and Rescue. Acad. J. Manag. Soc. Sci. 2025, 11, 13–22. [Google Scholar] [CrossRef]
  8. Chutima, P.; Arayikanon, K. Many-Objective Low-Cost Airline Cockpit Crew Rostering Optimisation. Comput. Ind. Eng. 2020, 150, 106844. [Google Scholar] [CrossRef]
  9. Zhan, H.; Zhang, Y.; Huang, J.; Song, Y.; Xing, L.; Wu, J.; Gao, Z. A Reinforcement Learning-Based Evolutionary Algorithm for the Unmanned Aerial Vehicles Maritime Search and Rescue Path Planning Problem Considering Multiple Rescue Centers. Memet. Comput. 2024, 16, 373–386. [Google Scholar] [CrossRef]
  10. Tanimu, M. Leveraging moea/d and echo state networks for solving complex optimization problems in time series prediction. Int. J. Digit. Innov. Built Environ. 2025, 1, 85–92. [Google Scholar]
  11. Wang, W.; Li, K.; Tao, X.; Gu, F. An Improved MOEA/D Algorithm with an Adaptive Evolutionary Strategy. Inf. Sci. 2020, 539, 1–15. [Google Scholar] [CrossRef]
  12. Tanabe, R.; Ishibuchi, H. Review and Analysis of Three Components of the Differential Evolution Mutation Operator in MOEA/D-DE. Soft Comput. 2019, 23, 12843–12857. [Google Scholar] [CrossRef]
  13. Zhou, H.; Qiao, J. Multiobjective Optimal Control for Wastewater Treatment Process Using Adaptive MOEA/D. Appl. Intell. 2019, 49, 1098–1126. [Google Scholar] [CrossRef]
  14. Konstantinidis, A.; Yang, K. Multi-Objective Energy-Efficient Dense Deployment in Wireless Sensor Networks Using a Hybrid Problem-Specific MOEA/D. Appl. Soft Comput. 2011, 11, 4117–4134. [Google Scholar] [CrossRef]
  15. Dong, Z.; Wang, X.; Tang, L. MOEA/D with a Self-Adaptive Weight Vector Adjustment Strategy Based on Chain Segmentation. Inf. Sci. 2020, 521, 209–230. [Google Scholar] [CrossRef]
  16. Xiang, D.; Lin, H.; Ouyang, J.; Huang, D. Combined Improved A* and Greedy Algorithm for Path Planning of Multi-Objective Mobile Robot. Sci. Rep. 2022, 12, 13273. [Google Scholar] [CrossRef]
  17. Jin, Y.; Wang, N.; Song, Y.; Gao, Z. Optimization Model and Algorithm to Locate Rescue Bases and Allocate Rescue Vessels in Remote Oceans. Soft Comput. 2021, 25, 3317–3334. [Google Scholar] [CrossRef]
  18. Yousefi, M.H.N.; Goudarzi, M. A Task-Based Greedy Scheduling Algorithm for Minimizing Energy of MapReduce Jobs. J. Grid Comput. 2018, 16, 535–551. [Google Scholar] [CrossRef]
  19. Xue, F.; Chen, Y.; Dong, T.; Wang, P.; Fan, W. MOEA/D with Adaptive Weight Vector Adjustment and Parameter Selection Based on Q-Learning. Appl. Intell. 2025, 55, 399. [Google Scholar] [CrossRef]
  20. Tan, Y.-Y.; Jiao, Y.-C.; Li, H.; Wang, X.-K. A Modification to MOEA/D-DE for Multiobjective Optimization Problems with Complicated Pareto Sets. Inf. Sci. 2012, 213, 14–38. [Google Scholar] [CrossRef]
  21. Yu, J. Intelligent Construction Scheduling Based on MOEA/D-DE, SPEA2+SDE, and NSGA-III by Integrating Safety Assessment with Resource Efficiency. Informatica 2025, 49, 17–28. [Google Scholar] [CrossRef]
  22. Chen, X.; Yan, R.; Wu, S.; Liu, Z.; Haoyu, M.; Wang, S. A Fleet Deployment Model to Minimize the Covering Time of Maritime Rescue Missions. Marit. Policy Manag. 2021, 50, 724–749. [Google Scholar] [CrossRef]
  23. Abdel-Basset, M.; Mohamed, R.; Mirjalili, S.; Chakrabortty, R.; Ryan, M. An Efficient Marine Predators Algorithm for Solving Multi-Objective Optimization Problems: Analysis and Validations. IEEE Access 2021, 9, 42817–42844. [Google Scholar] [CrossRef]
  24. Zhao, J.; Li, Y.; Bai, J.; Ma, L.; Shi, C.; Zhang, G.; Shi, J. Multi-Objective Optimization of Marine Nuclear Power Secondary Circuit System Based on Improved Multi-Objective Particle Swarm Optimization Algorithm. Prog. Nucl. Energy 2023, 161, 104740. [Google Scholar] [CrossRef]
  25. Maurya, V.K.; Nanda, S.J. Time-Varying Multi-Objective Smart Home Appliances Scheduling Using Fuzzy Adaptive Dynamic SPEA2 Algorithm. Eng. Appl. Artif. Intell. 2023, 121, 105944. [Google Scholar] [CrossRef]
  26. Zeng, S.; Wu, Y.; Yu, Y. Multi-Skilled Worker Assignment in Production System for the Trade-off between Production Efficiency and Workload Fairness. Kybernetes 2023, 52, 3495–3518. [Google Scholar] [CrossRef]
  27. Cui, Y.; Meng, X.; Qiao, J. A Multi-Objective Particle Swarm Optimization Algorithm Based on Two-Archive Mechanism. Appl. Soft Comput. 2022, 119, 108532. [Google Scholar] [CrossRef]
  28. Falcón-Cardona, J.; Coello, C. Indicator-Based Multi-Objective Evolutionary Algorithms: A Comprehensive Survey. ACM Comput. Surv. 2020, 53, 1–35. [Google Scholar] [CrossRef]
  29. Li, K.; Du, T.; Zhou, R.; Fan, Q. Multi-Objective Optimization of Material Properties for Enhanced Battery Performance Using Artificial Intelligence. Expert Syst. Appl. 2025, 288, 128179. [Google Scholar] [CrossRef]
  30. Zhang, C.; Dai, Z.; Liang, X.; Xu, G.; Zhang, C.; Zhang, B. An Evolutionary Generation Method of Deep Neural Network Sets Combined with Gaussian Random Field. Wirel. Netw. 2021, 7553, 1–10. [Google Scholar] [CrossRef]
  31. Schryen, G. Parallel Computational Optimization in Operations Research: A New Integrative Framework, Literature Review and Research Directions. Eur. J. Oper. Res. 2020, 287, 1–18. [Google Scholar] [CrossRef]
  32. Zhang, Y.; Wang, G.-G.; Li, K.; Yeh, W.-C.; Jian, M.; Dong, J. Enhancing MOEA/D with Information Feedback Models for Large-Scale Many-Objective Optimization. Inf. Sci. 2020, 522, 1–16. [Google Scholar] [CrossRef]
  33. Xue, Y.; Zhu, H.; Liang, J.; Słowik, A. Adaptive Crossover Operator Based Multi-Objective Binary Genetic Algorithm for Feature Selection in Classification. Knowl. Based Syst. 2021, 227, 107218. [Google Scholar] [CrossRef]
  34. Das, P.K.; Jena, P.K. Multi-Robot Path Planning Using Improved Particle Swarm Optimization Algorithm through Novel Evolutionary Operators. Appl. Soft Comput. 2020, 92, 106312. [Google Scholar] [CrossRef]
  35. Tian, Y.; Yao, L.; Shao, S.; Zhang, Y.; Zhang, X. Deep Reinforcement Learning Based Adaptive Environmental Selection for Evolutionary Multi-Objective Optimization. In Proceedings of the 2024 IEEE Congress on Evolutionary Computation (CEC), Yokohama, Japan, 30 June–5 July 2024. [Google Scholar]
  36. Cheng, H.; Li, L.; You, L. Dynamic Neighborhood Adjustment Strategy for Multi-Objective Evolutionary Algorithm Based on Decomposition. IEEE Access 2023, 11, 6574–6583. [Google Scholar] [CrossRef]
  37. Brambila-Hernández, J.A.; García-Morales, M.Á.; Fraire-Huacuja, H.J.; Cruz-Reyes, L.; Frausto-Solís, J. Novel Decomposition-Based Multi-Objective Evolutionary Algorithm Using Reinforcement Learning Adaptive Operator Selection (MOEA/D-QL). In New Horizons for Fuzzy Logic, Neural Networks and Metaheuristics; Castillo, O., Melin, P., Eds.; Springer Nature: Cham, Switzerland, 2024; pp. 149–165. ISBN 978-3-031-55684-5. [Google Scholar]
  38. Geng, H.; Xu, K.; Zhang, Y.; Zhou, Z. A Classification Tree and Decomposition Based Multi-Objective Evolutionary Algorithm with Adaptive Operator Selection. Complex Intell. Syst. 2023, 9, 579–596. [Google Scholar] [CrossRef]
  39. Wang, Y.; Zuo, X. An Effective Cloud Workflow Scheduling Approach Combining PSO and Idle Time Slot-Aware Rules. IEEE/CAA J. Autom. Sin. 2021, 8, 1079–1094. [Google Scholar] [CrossRef]
  40. Yang, S.; Meng, L.; Ullah, S.; Zhang, C.; Sang, H.; Zhang, B. MILP Modeling and Optimization of Three-Stage Flexible Job Shop Scheduling Problem with Assembly and AGV Transportation. Chin. J. Mech. Eng. 2025, 38, 115. [Google Scholar] [CrossRef]
  41. Zhang, H.; Chen, Y.; Zhang, Y.; Xu, G. Energy-Saving Distributed Flexible Job Shop Scheduling Optimization with Dual Resource Constraints Based on Integrated Q-Learning Multi-Objective Grey Wolf Optimizer. CMES—Comput. Model. Eng. Sci. 2024, 140, 1459–1483. [Google Scholar] [CrossRef]
  42. Afshar-Nadjafi, B. Multi-Skilling in Scheduling Problems: A Review on Models, Methods and Applications. Comput. Ind. Eng. 2021, 151, 107004. [Google Scholar] [CrossRef]
  43. Yannibelli, V.; Amandi, A. Project Scheduling: A Multi-Objective Evolutionary Algorithm That Optimizes the Effectiveness of Human Resources and the Project Makespan. Eng. Optim. 2013, 45, 45–65. [Google Scholar] [CrossRef]
  44. Wu, B.; Xiao, Y.; Ren, H.; Yang, L.; Lu, R. Design and Application of Workshop Production Scheduling Strategy Based on Manufacturing Big Data. In Proceedings of the 2023 IEEE 12th Data Driven Control and Learning Systems Conference (DDCLS), Xiangtan, China, 7 July 2023; pp. 1182–1189. [Google Scholar]
  45. Singh, K.; Sundar, S. Artificial Bee Colony Algorithm Using Permutation Encoding for the Bounded Diameter Minimum Spanning Tree Problem. Soft Comput. 2021, 25, 11289–11305. [Google Scholar] [CrossRef]
  46. Xing, H.; Zhou, X.; Wang, X.; Luo, S.; Dai, P.; Li, K.; Yang, H. An Integer Encoding Grey Wolf Optimizer for Virtual Network Function Placement. Appl. Soft Comput. 2019, 76, 575–594. [Google Scholar] [CrossRef]
  47. Sun, J.; Yu, S.; Chu, J.; Cun, W.; Wang, H.; Chen, C.; Li, F.; Huang, Y. A Crew Task Allocation and Sequencing Method Considering Workload Distribution and Minimum Task Completion Time. Kybernetes 2024, 1–29, ahead-of-print. [Google Scholar] [CrossRef]
  48. Naresh, R.; Sayeekumar, M.; Karthick, G.M.; Supraja, P. Attribute-Based Hierarchical File Encryption for Efficient Retrieval of Files by DV Index Tree from Cloud Using Crossover Genetic Algorithm. Soft Comput. 2019, 23, 2561–2574. [Google Scholar] [CrossRef]
  49. Barbulescu, A.; Șerban, C.; Indrecan, M.-L. Computing the Beta Parameter in IDW Interpolation by Using a Genetic Algorithm. Water 2021, 13, 863. [Google Scholar] [CrossRef]
  50. Zainuddin, F.; Abd Samad, M.F. A Review of Crossover Methods and Problem Representation of Genetic Algorithm in Recent Engineering Applications. Int. J. Adv. Sci. Technol. 2020, 29, 759–769. [Google Scholar]
  51. Chen, C.; Xu, Y.; Cheng, G.; Wang, H.; Zhang, Y. Task-Resource Matching Modeling and Optimization Algorithm. In Methods for Modelling and Optimizing Military Mission Plans; National Defense Industry Press: Beijing, China, 2019; pp. 89–92. [Google Scholar]
  52. Danacı, M.; Yıldırım, U. Comprehensive Analysis of Lifeboat Accidents Using the Fuzzy Delphi Method. Ocean Eng. 2023, 278, 114371. [Google Scholar] [CrossRef]
  53. Pescaroli, G.; Velazquez, O.; Alcántara-Ayala, I.; Galasso, C.; Kostkova, P.; Alexander, D. A Likert Scale-Based Model for Benchmarking Operational Capacity, Organizational Resilience, and Disaster Risk Reduction. Int. J. Disaster Risk Sci. 2020, 11, 404–409. [Google Scholar] [CrossRef]
  54. Guerreiro, A.; Fonseca, C.; Paquete, L. The Hypervolume Indicator: Problems and Algorithms. ACM Comput. Surv. 2020, 54, 1–42. [Google Scholar] [CrossRef]
  55. Bringmann, K.; Friedrich, T. Approximation Quality of the Hypervolume Indicator. Artif. Intell. 2013, 195, 265–290. [Google Scholar] [CrossRef]
  56. Meng, F.; Liu, J.; Tong, G.; Zhao, H.; Wen, C.; Zhou, Y.; Rasouli, V.; Rabiei, M. Multiobjective Optimization of CO2 Injection under Geomechanical Risk in High Water Cut Oil Reservoirs Using Artificial Intelligence Approaches. Sci. Rep. 2025, 15, 25643. [Google Scholar] [CrossRef] [PubMed]
  57. Chen, F.; Zhu, Q. Intelligent Optimization Method for Hazardous Materials Transportation Routing with Multi-Mode and Multi-Criterion Collaborative Constraints. Sci. Rep. 2025, 15, 7804. [Google Scholar] [CrossRef]
  58. Kalita, K.; Jangir, P.; Pandya, S.B.; Alzahrani, A.I.; Alblehai, F.; Abualigah, L.; Ezugwu, A.E. MORKO: A Multi-Objective Runge–Kutta Optimizer for Multi-Domain Optimization Problems. Int. J. Comput. Intell. Syst. 2025, 18, 3. [Google Scholar] [CrossRef]
  59. Böðvarsdóttir, E.B.; Stidsen, T. A Review of Multi-Objective Optimization Methods for Personnel Rostering Problems. J. Sched. 2025, 1–19. [Google Scholar] [CrossRef]
  60. Zhang, G.; Zhang, A.; Sun, C.; Ye, Q. An Evolutionary Algorithm for Multi-Objective Workflow Scheduling with Adaptive Dynamic Grouping. Electronics 2025, 14, 2586. [Google Scholar] [CrossRef]
  61. Castro, O.R.; Santana, R.; Lozano, J.A.; Pozo, A. Combining CMA-ES and MOEA/DD for Many-Objective Optimization. In Proceedings of the 2017 IEEE Congress on Evolutionary Computation (CEC), Donostia, Spain, 5–8 June 2017; pp. 1451–1458. [Google Scholar]
  62. Yang, Z.; Qiu, H.; Gao, L.; Chen, L.; Liu, J. Surrogate-Assisted MOEA/D for Expensive Constrained Multi-Objective Optimization. Inf. Sci. 2023, 639, 119016. [Google Scholar] [CrossRef]
  63. Wang, X.; Zhao, W.; Tang, J.-N.; Dai, Z.-B.; Feng, Y.-N. Evolution Algorithm with Adaptive Genetic Operator and Dynamic Scoring Mechanism for Large-Scale Sparse Many-Objective Optimization. Sci. Rep. 2025, 15, 9267. [Google Scholar] [CrossRef]
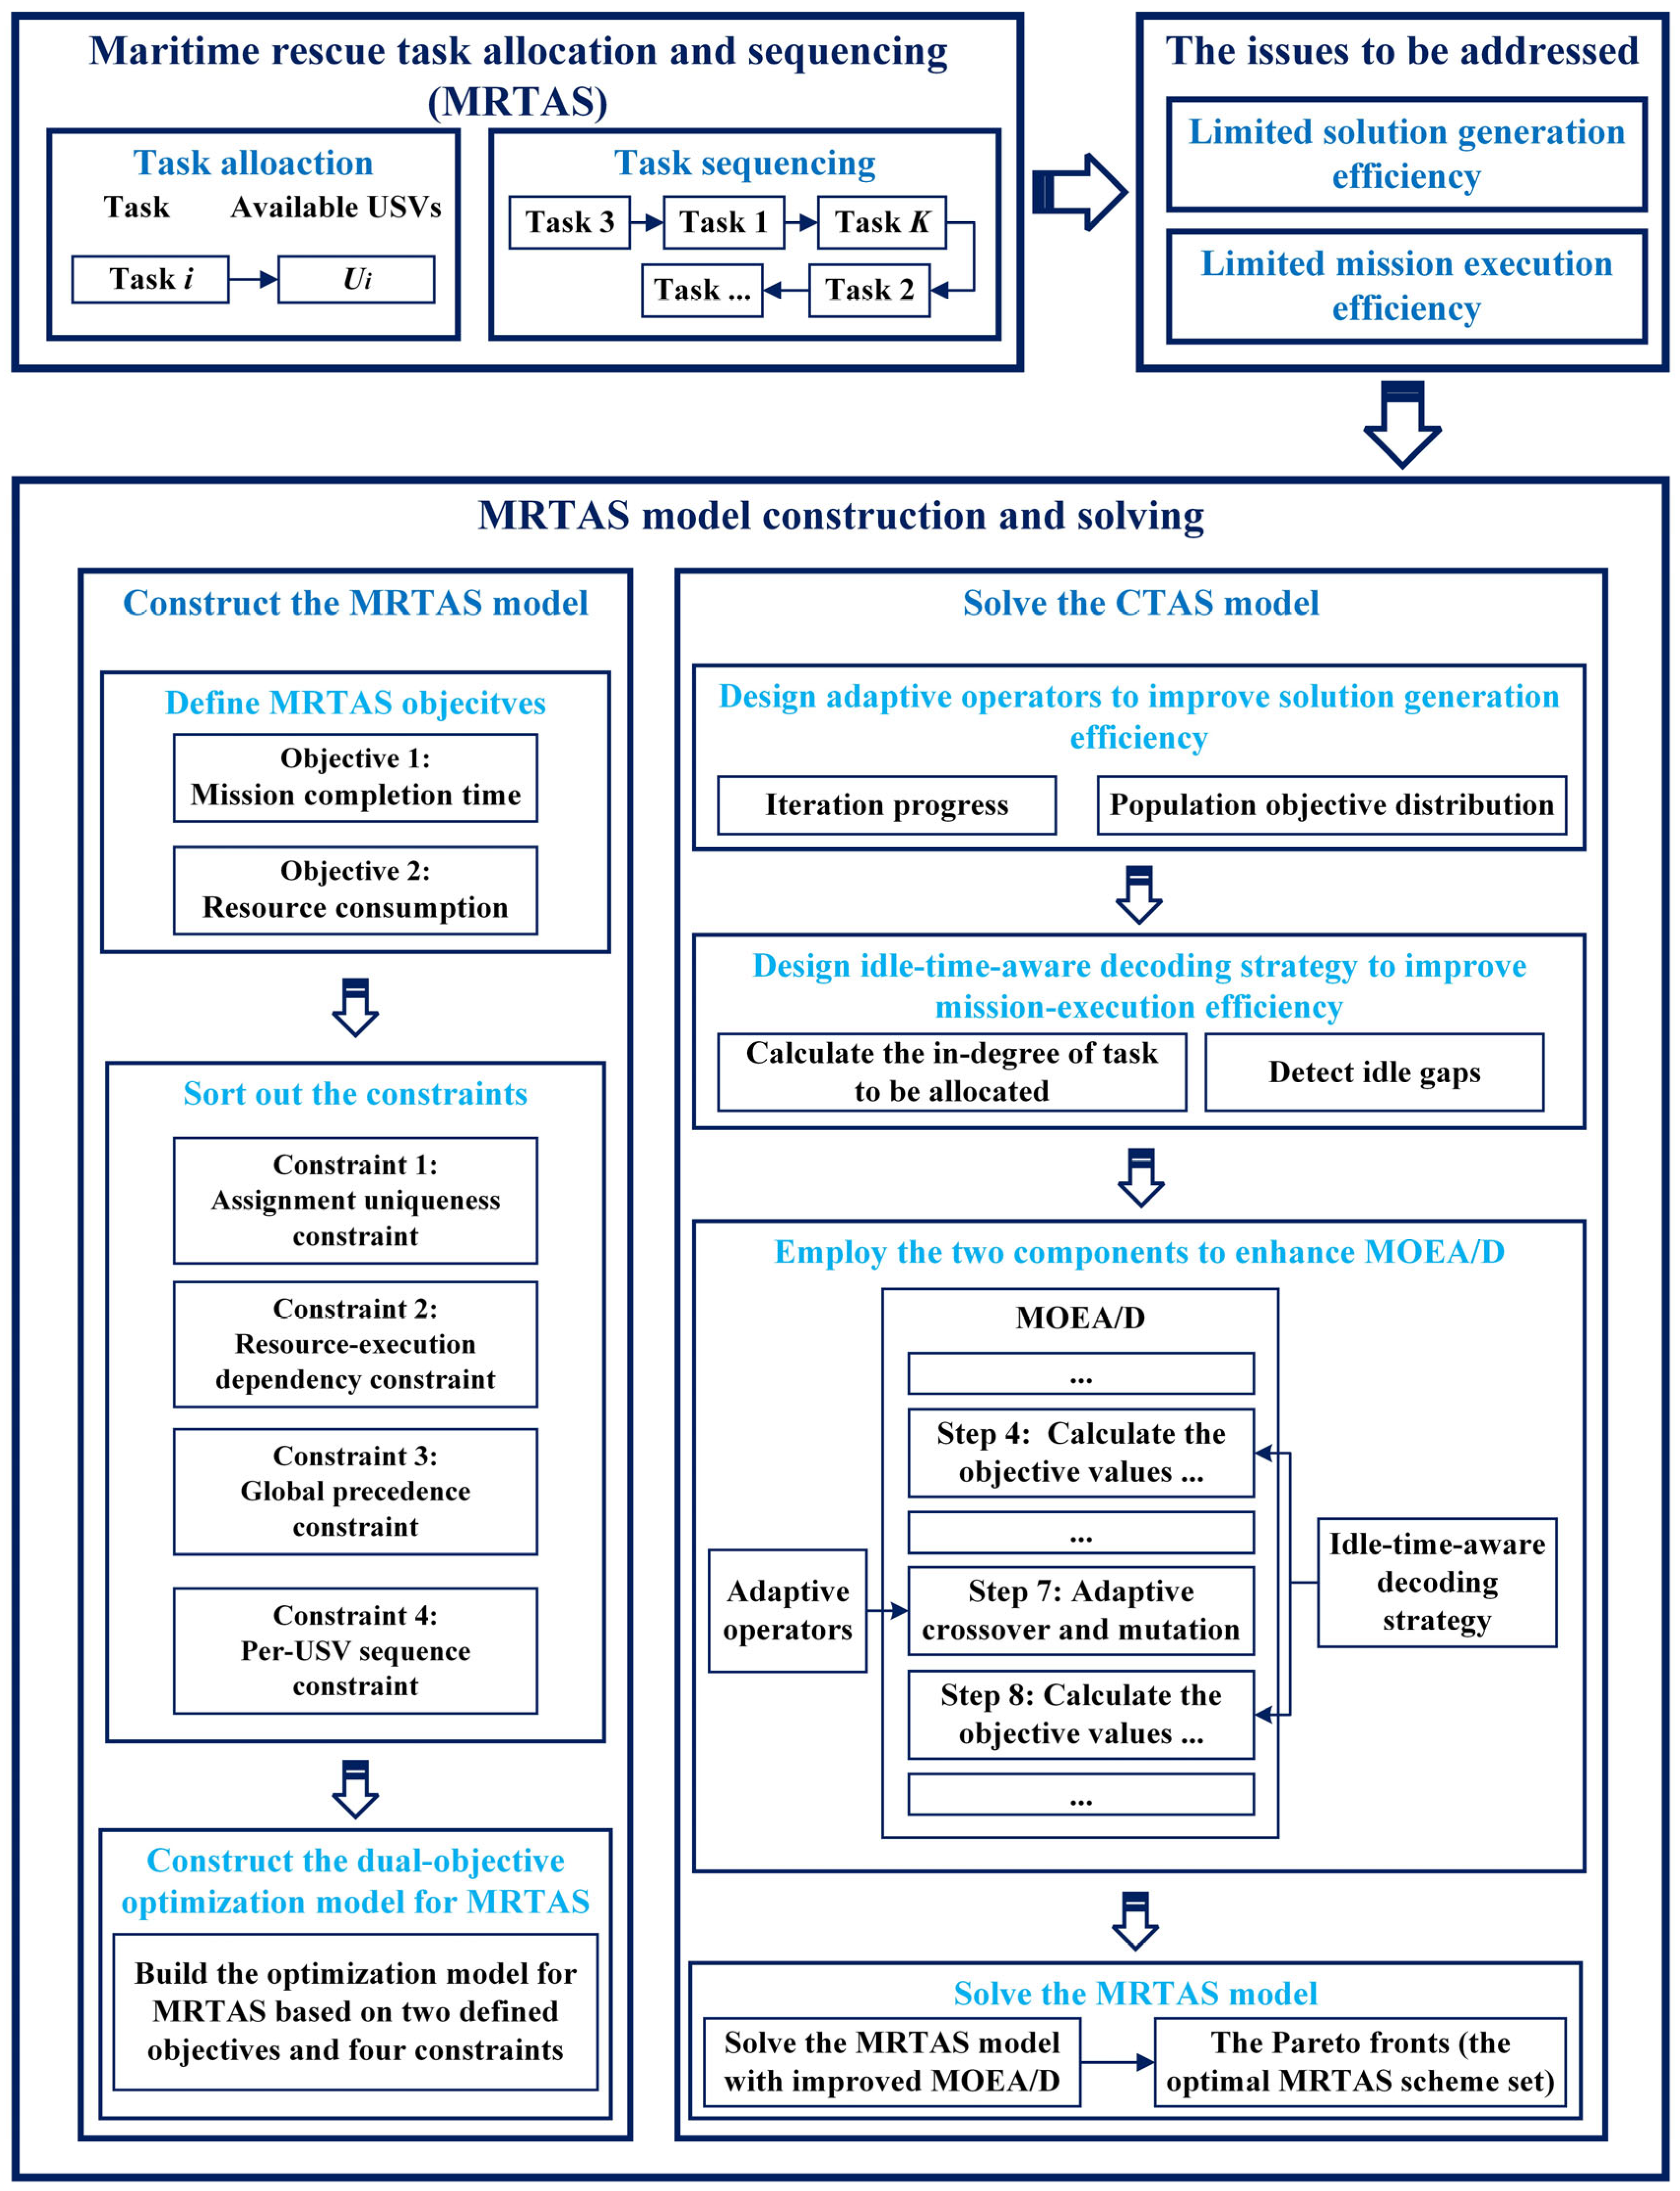
Figure 1. The framework of this study.
Jmse 13 01518 g001
Figure 2. The process of enhanced MOEA/D.
Jmse 13 01518 g002
Figure 3. An MRTAS scheme. The numbers in the sequence chromosome and USV chromosome represent the task number and USV number, respectively.
Jmse 13 01518 g003
Figure 4. Task directed acyclic graph (DAG) of Case 1 (tasks encoded 1–18).
Jmse 13 01518 g004
Figure 5. DAG of Case 2 (tasks encoded 1–100).
Jmse 13 01518 g005
Figure 6. The runtime and memory consumption curves. (a) Case 1. (b) Case 2.
Jmse 13 01518 g006
Figure 7. The Pareto solution set. (a) Case 1. (b) Case 2.
Jmse 13 01518 g007
Figure 8. Gantt chart of solution 1 (70,546) of Case 1. The number in each box denotes the task.
Jmse 13 01518 g008
Figure 9. Gantt chart of solution 1 (384,3951) of Case 2. The number in each box denotes the task.
Jmse 13 01518 g009
Figure 10. Comparison of adaptive and fixed operators on convergence generations and converged solution quality. (a,b) for Case 1. (c,d) for Case 2.
Jmse 13 01518 g010
Figure 11. Impact of adaptive term ablation on convergence generations and converged solution quality. (a,b) for Case 1. (c,d) for Case 2.
Jmse 13 01518 g011
Figure 12. Comparison with state-of-the-art algorithms on convergence generations and converged solution quality. (a,b) for Case 1. (c,d) for Case 2.
Jmse 13 01518 g012
Figure 13. Orthogonal experiment on coefficient sensitivity: convergence generations and converged solution quality. Orange circle denotes the highest converged solution quality, and blue triangle marks the fewest convergence generations. (a) Case 1. (b) Case 2.
Jmse 13 01518 g013
Figure 14. Robustness under ±10 % input perturbations: convergence generations and converged solution quality. (a,b) for Case 1. (c,d) for Case 2.
Jmse 13 01518 g014
Figure 15. The Gantt charts. (a) A mission completion time of 74 min; (b) a mission task completion time of 93 min. The number in each box denotes the task.
Jmse 13 01518 g015
Figure 16. The Gantt charts. (a) A mission completion time of 674 min; (b) a mission task completion time of 899 min. The number in each box denotes the task.
Jmse 13 01518 g016
Figure 17. The average mission completion time across the population. (a) Case 1. (b) Case 2.
Jmse 13 01518 g017
Table 1. Comparative analysis of adaptive operator variants.
Core CharacteristicsENS-MOEA/DMOEA/D-QLMOEA/D-CTAOSThis Paper
Adaptive mechanismLinear combination of neighborhood operator weightsQ-learning discrete decisionClassification tree threshold-based piecewise controlDual-dimensional composite response: temporal dimension (linear decay of iteration progress) and spatial dimension (nonlinear adjustment of objective distribution)
Exploration–exploitation balanceFixed intensity operator switchingε-greedy random explorationRule-constrained perturbationDynamic dual-mode adjustment: high perturbation in the early stage and linear plus distribution-sensitive decay in the later stage
Computational efficiencyRequires maintenance of multiple operator instancesQ-table training overheadDecision tree inference overheadAnalytical computation without iterative training, only requiring the calculation of objective value statistics
Engineering adaptabilityGeneral optimization requiring a preset operator libraryDynamic environment adaptationStrong rule interpretabilityEnsures convergence efficiency and precisely adapts to disaster relief scenarios
Table 2. The symbols.
CategorySymbolDescription
Decision Variables D i m Binary (0 or 1); 1 if task i is assigned to USV m
s i Start time of task i
X i j m Binary (0 or 1); 1 if USV m executes task j next after task i, not necessarily immediately, but with no other task in between
Derived
Variables
d i Actual execution duration of task i
r i Actual resource consumption of task i
Objective Functions M C T Mission completion time
R C Resource consumption
Parameters d i m The required duration for USV m to execute task i
r i m The required resource consumption for USV m to execute task i
U i Set of USVs capable of executing task i
P i j Task precedence relationship, 1 if task i must finish before task j starts
Indicesi, jTask indices
mUSV index
KNumber of tasks
Table 3. The resource demands of the tasks of Case 1.
TaskTask ContentResource Demands
CommunicationNavigation
Energy
Sensor
Payload
Battery
Consumption
1Coastal hazard mapping (north)7892
2Coastal hazard mapping (south)7892
3Medical supply delivery (north)87210
4Medical supply delivery (south)87210
5Submerged debris scanning41136
6Surface obstacle neutralization36153
7Northern logistics hub setup36911
8Southern beach assessment351010
9Coastal surveillance (north)6892
10Coastal surveillance (south)6892
11Evac route recon (north)28610
12Evac route recon (south)49511
13Maritime threat clearance (south)49511
14Maritime threat clearance (north)76412
15Port access coordination5798
16Airfield access coordination4789
17Refugee encampment setup6689
18Aid route blockade59103
Table 4. The resource capacity of the USVs of Case 1.
USVLower/Upper LimitResource Capacity
CommunicationNavigation EnergySensor PayloadBattery Consumption
1Lower limit2562
Upper limit791510
2Lower limit2562
Upper limit791510
3Lower limit36210
Upper limit891211
4Lower limit3636
Upper limit7111212
5Lower limit3636
Upper limit7111212
Table 5. The parameters of the tasks of Case 1.
TaskAvailable USVsExecution Duration/MinCommunicationNavigation EnergySensor PayloadBattery ConsumptionResource Consumption
11, 29, 117, 79, 912, 152, 230, 33
21, 229, 317, 78, 815, 132, 332, 31
33108931030
43108931030
54, 512, 137, 411, 114, 46, 628, 25
61, 211, 143, 36, 915, 154, 528, 32
73, 4, 58, 10, 93, 3, 36, 6, 612, 9, 1011, 11, 1132, 29, 30
81, 28, 107, 45, 510, 1010, 1032, 29
91, 211, 86, 79, 911, 142, 228, 32
101, 211, 86, 79, 911, 142, 228, 32
111, 29, 86, 78, 96, 710, 1030, 33
12394961130
133154961130
144, 520, 177, 76, 105, 412, 1230, 33
154, 517, 145, 77, 79, 119, 830, 33
164, 514, 187, 47, 79, 810, 1033, 29
174, 510, 96, 76, 78, 1010, 930, 33
181, 221, 175, 59, 910, 154, 328, 32
Table 6. The parameters of the tasks of Case 2.
TaskTask ContentAvailable USVsExecution Duration/MinResource Consumption
1Harbor entrance recon (north)1, 2, 37, 8, 933, 34, 35
2Harbor entrance recon (south)1, 2, 38, 9, 1034, 35, 36
3Coastal hazard map (north)1, 2, 310, 11, 1235, 36, 37
4Coastal hazard map (south)1, 2, 311, 12, 1336, 37, 38
5Aerial drone launch4, 55, 625, 24
6Aerial drone recovery4, 55, 624, 25
100Mission debrief and return to base1, 108, 1230, 35
Table 7. The MRTAS schemes corresponding to the Pareto solution set of Case 1.
SolutionMRTAS Scheme
1Sequence526174783121109111314181516
USV421435133121135154
2Sequence236541778121913101411181516
USV231534513113251154
3Sequence652378412110149131117181615
USV152341331251314145
4Sequence561727841231019131118141516
USV514241333211311454
5Sequence234567811291310171411181516
USV233514113132451145
6Sequence625378412191014131711181516
USV125341331124341145
7Sequence536217784121109131118141516
USV531244133111311445
8Sequence217641357812910131411181516
USV241313542311341145
Sequence = sequence chromosome; USV = USV chromosome.
Table 8. The MRTAS schemes corresponding to the Pareto solution set of Case 2.
SolutionMRTAS Scheme
1Sequence6768697024257120246565235560100
USV44122141154555611
2Sequence6755685926958456024170257156100
USV46412111515124151
3Sequence556768596922462558706047156154
USV64411254412111517
4Sequence556768596925244255870606715654
USV64411255141214157
5Sequence6755686524269595856231707143100
USV44444511114511111
6Sequence6755686524269595816435623170100
USV44444511115145111
7Sequence6755256524216686959585623170100
USV44544515411145111
8Sequence5616255567242585956231194320 100
USV4455445111451111 1
9Sequence5616255567242585956231194320 100
USV4455445111451111 1
10Sequence5625556716242585956231431920 100
USV4454455111451111 1
Sequence = sequence chromosome; USV = USV chromosome.
Table 9. Anchor description.
ScoreAnchor DescriptionQuantitative Threshold Example
5—ExcellentFully meets or exceeds expert benchmarks; no improvement needed. Time deviation ≤ ±2%; resource deviation ≤ ±2%; and zero conflicts.
4—GoodGenerally within expert range; minor deviations acceptable.Time deviation ≤ ±5%; resource deviation ≤ ±5%; and ≤1 minor conflict.
3—FairPartially meets criteria; small adjustments required.Time deviation ≤ ±10%; resource deviation ≤ ±10%; and ≤2 adjustable conflicts.
2—PoorNoticeably outside range; major revisions necessary.Deviation or conflicts exceed the “Fair” thresholds.
1—UnacceptableSeverely violates benchmarks; not implementable.Significant deviations or conflicts that lead to outright rejection.
Table 10. Expert rating.
Case 1Case 2
Expert 1Expert 2Expert 3MeanExpert 1Expert 2Expert 3Mean
Scenario Fit5454.675555
Time Reasonableness4544.674544.67
Resource Reasonableness55555555
Operational Feasibility55555454.67
Table 11. The coefficient values.
Baseline ValueLower LimitUpper Limit
p c r o _ 0 10.851.00
p c r o _ m i n 0.070.060.08
p m u t _ 0 0.30.260.36
p m u t _ m i n 0.0150.010.02
Table 12. The coefficient configurations.
p c r o _ 0 p c r o _ m i n p m u t _ 0 p m u t _ m i n
10.850.060.260.01
20.850.060.30.015
30.850.060.360.02
40.850.070.260.015
50.850.070.30.02
60.850.070.360.01
710.060.260.015
810.060.30.02
910.060.360.01
1010.070.260.02
1110.070.30.01
1210.070.360.015
1310.070.260.01
1410.070.30.015
1510.070.360.02
1610.070.260.01
1710.070.30.015
1810.070.360.01
Disclaimer/Publisher’s Note: The statements, opinions and data contained in all publications are solely those of the individual author(s) and contributor(s) and not of MDPI and/or the editor(s). MDPI and/or the editor(s) disclaim responsibility for any injury to people or property resulting from any ideas, methods, instructions or products referred to in the content.