Abstract
This study applies a deep neural network (DNN) to optimize the 22.5 m pontoon hull form of a small waterplane area twin hull (SWATH) vessel with fin stabilizers, aiming to reduce calm water resistance at a Froude number of 0.8 under even keel conditions. The vessel’s resistance is simplified into three components: pontoon, strut, and fin stabilizer. Four design parameters define the pontoon geometry: fore-body length, aft-body length, fore-body angle, and aft-body angle. Computational fluid dynamics (CFD) simulations using STAR-CCM+ 2302 provide 1400 resistance data points, including fin stabilizer lift and drag forces at varying angles of attack. These are used to train a DNN in MATLAB 2018a with five hidden layers containing six, eight, nine, eight, and seven neurons. K-fold cross-validation ensures model stability and aids in identifying optimal design parameters. The optimized hull has a 7.8 m fore-body, 6.8 m aft-body, 10 fore-body angle, and 35 aft-body angle. It achieves a 2.2% resistance reduction compared to the baseline. The improvement is mainly due to a reduced Munk moment, which lowers the angle of attack needed by the fin stabilizer, thereby reducing drag. The optimized design provides cost-efficient construction and enhanced payload capacity. This study demonstrates the effectiveness of combining CFD and deep learning for hull form optimization.
1. Introduction
Taiwan has recently developed wind-based renewable energy on a growing scale. However, its mountainous terrain and limited plains make offshore wind farms an increasingly attractive option. As offshore wind energy installations increase, the demand for crew transfer vessels (CTVs) transporting personnel and equipment also rises [1], as CTVs are vital for supporting wind turbine operation and maintenance. Small waterplane area twin hull (SWATH) vessels are commonly preferred as CTVs due to their superior seakeeping performance, but their low wave-induced forces, while advantageous, can lead to poor longitudinal stability [2]. Pontoon resistance is the most dominant component of the total resistance of a SWATH vessel. The pontoon’s shape influences pressure distribution, creating the Munk moment that brings longitudinal instability. While optimizing pontoon design can improve both resistance and stability, effective design methods are still limited, with only a few numerical studies available [3,4,5]. To counteract longitudinal instability, SWATH vessels typically use fin stabilizers that generate lift to balance Munk moments, especially at high speeds. This method enhances stability but increases total resistance [6], making fin stabilizer placement a key design factor. Computational fluid dynamics (CFD) software [7] is now widely used for ship design and performance analysis, providing advantages over physical model tests. However, accurately predicting ship resistance with free-surface effects remains computationally expensive, driving the need for simplified methods. In addition to simplifying computational methods, this study utilizes artificial intelligence techniques, particularly deep neural networks (DNNs), to aid in design optimization. DNNs, as a branch of artificial intelligence, can effectively model the nonlinear correlation between hull form and resistance, enabling the identification of optimal design parameters within a defined range. Although there have been numerous studies applying neural networks to SWATH hull optimization [8,9], no research focuses on a parameterized hull form design optimization for total resistance reduction. Hence, the main objective of this study is to propose a DNN model to address this research gap.
The concept of SWATH vessels has been under development since the 1970s. Over the decades, several successful applications of SWATH vessels have been realized, including oceanographic research vessels, such as the Ferdinand R. Hassler operated by the National Oceanic and Atmospheric Administration (NOAA) [10], offshore patrol vessels [11], and naval vessels, such as the Sea Shadow [12]. A SWATH vessel comprises two primary structural components. The first is the submerged pontoon, located below the free surface, which provides most of the vessel’s buoyancy. The second is the strut, which pierces the free surface and serves as the connection between the deck and the pontoon. SWATH vessels are known for superior seakeeping in high sea states compared to conventional ships [13]. Advantages include low resistance at high speeds, reduced wave-induced forces, and a large deck area. However, drawbacks remain, such as increased viscous resistance from the wetted surface, limited longitudinal restoring force due to the small waterplane area, the Munk moment of the pontoon, and the flow–structure interaction from hull-mounted fin stabilizers [14,15,16]. Reliable resistance estimates are to be obtained for conventional modern fast ferries to enable the evaluation of current energy use and emissions. Engineering accuracy is to be obtained for the resistance of hulls at reduced draft, representing foil supported operation or the take-off phase of hydrofoil catamarans [17]. As the pontoon largely contributes to both resistance and instability [18,19,20], this study focuses on optimizing its hull form.
Traditional hull form optimization often relies on statistical analysis of existing ships to correlate hydrodynamic performance with geometric parameters [21,22]. However, methods like linear regression can be highly constrained when the relationship between variables is not explicitly defined. As a result, advanced approaches such as neural networks are increasingly employed for hull form optimization. Neural networks have been widely and successfully applied in naval architecture. In hull form resistance optimization, studies such as [23,24] used free-form deformation techniques, while [25] applied principal component analysis (PCA) to reduce hull form parameters, which were then input into deep neural networks (DNNs) for resistance prediction. In [26], pressure distribution, free-surface elevation, and wake images were used to train a convolutional neural network (CNN) to predict hydrodynamic performance. Neural networks have also been used to account for sea conditions and ship motions: [27,28] predicted short-term sea states using wave descriptors, while [29] trained models to estimate seakeeping performance. Additionally, refs. [30,31] developed models to predict short-term ship motions. In structural analysis, refs. [32,33] employed neural networks to estimate the ultimate strength and fatigue failure of transverse structures. For engine power prediction, refs. [34,35] used hull form, environmental data, and ship speed, while [36] modeled fuel consumption using data from the engine, propulsion system, flow field, and cargo load. Finally, ref. [37] predicted the energy efficiency operational indicator (EEOI) using publicly available ship, engine, and meteorological data. Various types of neural networks exist, including recurrent neural networks (RNNs), long short-term memory (LSTM), convolutional neural networks (CNNs), and deep neural networks (DNNs). Among them, DNNs are classic feed-forward networks where data flows directly from input to output without recurrence. Since the hull form design parameters in this study are neither sequential nor spatial (e.g., image-like), a DNN model seems to be an appropriate choice.
This study proposes a pontoon design optimization process. First, the total resistance of the SWATH vessel is linearized into its main components. Next, a parametric pontoon model is created in Grasshopper3D using key design parameters. Resistance analyses of the pontoon, strut, and fin stabilizer are then performed independently with STAR-CCM+ 2302. The numerical results train a deep neural network (DNN) model, which is used to predict optimized design parameters. Finally, the optimized vessel’s total resistance is validated through CFD simulations.
2. Parametric Design and Resistance Modeling of SWATH Vessel
2.1. Principle Dimension of Baseline Design
The baseline SWATH vessel design has a displacement of 120 tons and a longitudinal center of buoyancy () at 12.88 m. Figure 1 illustrates various hull views and definitions, including length overall (), waterline length (), ship depth (), pontoon length (), and beam overall (). Table 1 summarizes the vessel’s principal dimensions.
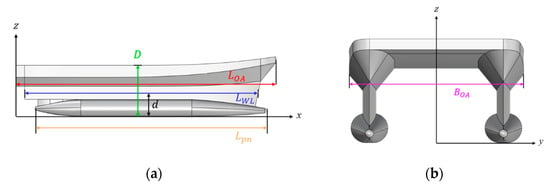
Figure 1.
Baseline SWATH vessel: (a) x–z plane; (b) y–z plane.

Table 1.
Principal dimensions of baseline SWATH vessel.
2.2. Design Parameters of Pontoon
This study proposes a parametric approach for pontoon design, with the pontoon length () fixed at 22.5 m. The design includes four independent parameters: fore-body length (), aft-body length (), fore-body angle (), and aft-body angle (). Two dependent parameters are defined accordingly, including the length of the parallel middle body (), which is calculated based on and as follows:
The radius of the pontoon () is a dependent parameter determined by , , , and , under the assumption of constant displacement and circular pontoon section. Figure 2 illustrates the pontoon design parameters, while Table 2 lists the ranges for each independent variable. and range from 1.8 m to 7.8 m in 1 m intervals. The angles and vary from 10 to 60 in 10 increments. The hub radius () is fixed at 0.15 m. A total of 1398 pontoon models is generated to perform resistance predictions based on the defined design parameter ranges.

Figure 2.
Design parameters of pontoon.

Table 2.
Design parameter range of pontoon.
2.3. Fin Stabilizer
Due to the inherent limitations in longitudinal stability of SWATH vessels, the installation of fin stabilizers is essential to ensure stable operation, particularly at speeds corresponding to a Froude number () greater than approximately 0.7, where dynamic lift and bow-up trim become significant [38]. Figure 3 shows the fin stabilizer arrangement on the baseline design. The fore-fin stabilizer is located 21.04 m from the stern, and the aft-fin stabilizer is located 10.06 m from the stern. Figure 4 shows the working mechanism of fin stabilizers, where is the moment produced by the fin stabilizer to balance the Munk moment. The baseline design is equipped with a control system that only drives the fore-fin stabilizer. During navigation, only the fore-fin stabilizer is an active device, while the aft-fin stabilizer is always parallel to the still-water line. Figure 5 presents the 3D views of the fin stabilizers, with (a) showing the aft-fin and (b) the fore-fin. The fins use symmetrical foil sections: NACA0015 for the aft and NACA0030 for the fore, with aspect ratios of 0.668 and 0.689, respectively. The projected areas are 11,132.73 cm2 for the aft-fin and 7961.66 cm2 for the fore-fin.

Figure 3.
Baseline SWATH vessel with fin stabilizer: (a) Bottom view; (b) Side view.

Figure 4.
Working principle of fin stabilizer (blue line represents the waterline).
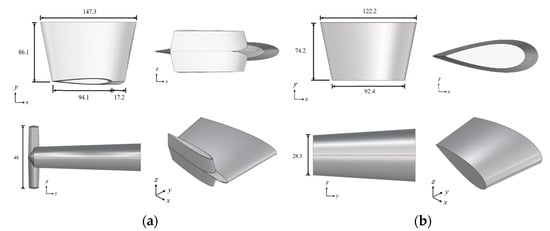
Figure 5.
The 3D views of fin stabilizers (in cm): (a) Aft; (b) Fore.
Figure 6 presents the lift and drag coefficients ( and ) for both fin stabilizers. In two-dimensional theory, the ideal lift slope is 2π [39]. The lift coefficient is estimated using Söding’s empirical formula [40]:
where denotes the aspect ratio and is applied for hydrofoils with sharp leading and trailing edges.
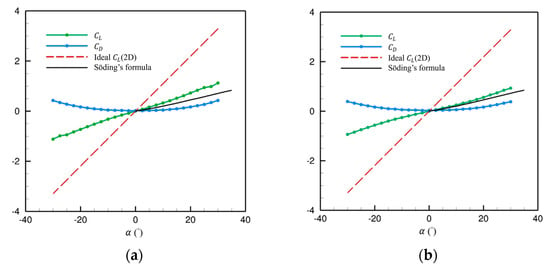
Figure 6.
Lift and drag coefficients for fin stabilizers: (a) NACA0015; (b) NACA0030.
2.4. Linearized Resistance Modeling of SWATH
To reduce computational effort in CFD simulations considering free-surface effects, this study adopts a simplified decoupling approach for SWATH resistance. The total resistance () of the SWATH is expressed as:
where is the strut resistance, is the resistance of the lower hull, is the resistance of the pontoon, and is the resistance of the fin stabilizer, which changes with the angle of attack and the draught. The pontoon resistance is separated into pressure and shear components, with pressure resistance decreasing rapidly with draught while shear remains nearly constant (Figure 7). This decomposition approach is consistent with findings from the literature, where SWATH resistance is typically analyzed by separating wave-making, viscous, and induced components across the strut, submerged hull, and appendages [41]. The final resistance model is:
where is the fully submerged pressure resistance, is the fully submerged shear resistance. The Munk moment of the hull () can be expressed as follows:
where is the moment of the strut, is the length of the lever arm from the center of gravity, and denote the lift forces generated by the fore- and aft-fin stabilizers, respectively, and are the pressure and shear stress of the pontoon under fully submerged conditions, is the surface area of the fully submerged pontoon.
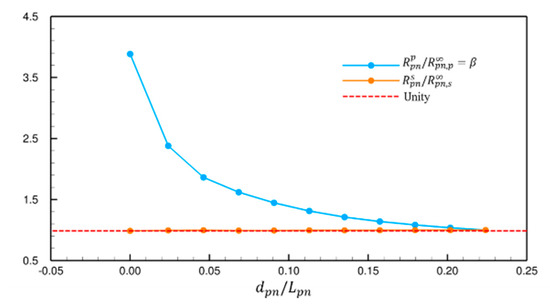
Figure 7.
Variation of pontoon resistance with draught.
3. Flow Model
3.1. Numerical Framework
In this study, the resistance of the SWATH vessel is evaluated using STAR-CCM+ 2302, commercial CFD software based on the finite volume method (FVM). Two types of flow simulations are conducted, pontoon simulation and free-surface simulation. For the axisymmetric pontoon model, the flow is assumed to be fully submerged and solved using continuity, momentum, and standard turbulence equations. For the full-scale SWATH vessel, the three-dimensional simulation incorporates the free surface and solves the continuity, momentum, , and volume of fluid (VOF) equations.
3.2. Computational Domain and Boundary Conditions
Figure 8a illustrates the computational domain for the fully submerged pontoon simulation. Table 3 summarizes the domain dimensions and boundary conditions applied in the two-dimensional axisymmetric flow field. The inlet boundary is located one pontoon length () upstream of the fore-end, and the outlet is placed two downstream of the aft-end. The radial extent of the domain is also set to . At the inlet, a uniform velocity corresponding to the vessel speed () of 24 knots is prescribed, while the outlet pressure is fixed at zero. The corresponding Froude number () is 0.81, calculated based on vessel speed, waterline length (), and gravitational acceleration ():
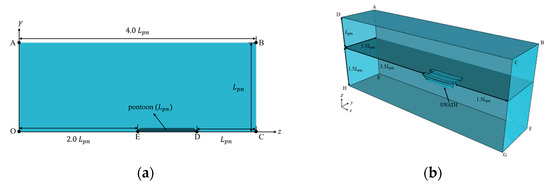
Figure 8.
Computational domain of (a) pontoon and (b) free-surface flow simulations.

Table 3.
Boundary conditions for pontoon flow simulation.
Figure 8b shows the computational domain for the free-surface simulation. To reduce computational cost, only the port-side half of the vessel is modeled, taking advantage of symmetry about the centerline plane (). The upstream boundary is positioned 1.5 ahead of the bow, and the downstream boundary is 3.5 behind the stern. The lateral (port) and bottom boundaries are both located 1.5 from the hull surface. Table 4 summarizes the boundary conditions. At the inlet, a velocity corresponding to the vessel’s design speed of 24 knots is applied. The pressure outlet enforces a hydrostatic pressure distribution to describe calm water conditions.

Table 4.
Boundary conditions for free-surface flow simulation.
3.3. Mesh Configuration
For the pontoon simulation, a two-dimensional Cartesian mesh is employed to discretize the computational domain. The background mesh has a base size of 1.4 m, corresponding to 1/16 of the pontoon length, resulting in approximately 250,000 cells. Four boundary layers are applied to resolve near-wall flows and transition to the background mesh. The mesh is refined in the vicinity of the pontoon to capture critical flow features, while a coarser mesh is used in the far field, as shown in Figure 9a.

Figure 9.
Mesh configuration for (a) pontoon and (b) free-surface flow simulations.
A three-dimensional Cartesian mesh with a base cell size of 1 m is used to discretize the computational domain of free-surface simulation. The initial mesh consists of approximately 3 million cells. To reduce computational cost while accurately capturing the free surface, the adaptive mesh refinement (AMR) module is employed. This module uses the gradient of the volume fraction to locate the free surface and dynamically refines or coarsens the mesh based on the transport equation. With AMR, the total mesh increases to approximately 6.15 million. The AMR setup includes two refinement layers near the free surface and a defined transition width to ensure a smooth gradation from refined to coarse cells. Notably, the surface mesh is not affected by AMR, necessitating sufficient initial mesh density on the hull surface. Figure 9b presents the final mesh of the free-surface simulation on plane .
3.4. Grid Dependency
The accuracy of numerical simulations is highly sensitive to the grid resolution. While finer meshes generally yield more accurate results, they also significantly increase computational cost. To achieve a balance between accuracy and efficiency, a grid convergence study is conducted. This analysis quantifies the impact of mesh density on simulation results and determines an optimal grid configuration. The grid-independent solution, denoted as , is estimated using the second-order Richardson extrapolation, given by:
where represents the field variable of interest, denotes the value obtained from the -th grid level, and is the corresponding cell number. In this study, the pontoon’s resistance under fully submerged conditions (), is selected as the target variable for the grid dependency analysis. Figure 10a shows the dependence of the cell number on . Figure 10b illustrates the relationship between the discretization error and the grid spacing . The discretization error closely aligns with that of an ideal second-order scheme. In this study, grid level 3 is adopted, yielding an error of less than 3%.
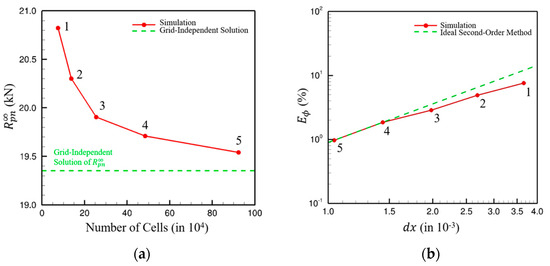
Figure 10.
(a) Dependence of on cell number; (b) Discretization error of .
3.5. Validation
This study validates the numerical simulation approach by comparing full-scale CFD results with experimental data from model tests. The tests were conducted in the Ship Tank, Qinetiq, Haslar, which is 260 m long, 12 m wide, and 5.5 m deep, with a water temperature of 13.2 °C and the model used was built at a 1:12 scale. The towing mechanism and instrumentation were provided and operated by the Wolfson Unit, UK [42]. Due to longitudinal instability observed at Fr = 0.8 during testing, a lower speed of 10 knots (Fr = 0.34) is selected for validation. Table 5 presents the comparison of total resistance and vessel attitude between the CFD simulation and the experimental results. The center of gravity (CG) of a SWATH vessel plays a crucial role in determining running trim () and resistance. As the experimental CG location was not reported, this likely contributes to discrepancies in trim and resistance between CFD predictions and model tests. Despite the nontrivial resistance deviation, the predicted free-surface pattern aligns well with experimental observations, as illustrated in Figure 11.

Table 5.
Comparison between experiment and simulation.

Figure 11.
Comparison of free-surface pattern between (a) experiment and (b) CFD.
4. Resistance Prediction
4.1. Case Description
In this study, all cases are categorized into 49 groups based on discrete combinations of fore- and aft-body lengths. Each group corresponds to a unique pair of fore- and aft-lengths, as summarized in Table 6. Due to geometric constraints, not all angle combinations yield valid pontoon shapes for a given length pair, resulting in a variable number of cases per group—ranging from 16 to 36. The complete dataset comprises 1398 valid pontoon designs.

Table 6.
Group numbers based on different fore-body () and aft-body () length combinations of the pontoon.
4.2. Resistance Characteristic of Pontoon
4.2.1. Fixed Length
Figure 12 presents resistance contour plots for four representative groups with fixed fore- and aft-lengths—Groups 7, 25, 37, and 43—under fully submerged conditions. The results indicate a general trend: resistance increases with larger fore- and aft-body angles and decreases with smaller angles. Most groups, such as Group 7, display a single low-resistance region, while others exhibit two or three, suggesting multiple optimal configurations. Although small angles generally yield lower resistance, some optimal solutions involve moderate or relatively large angles, highlighting the nonlinear nature of the resistance response.
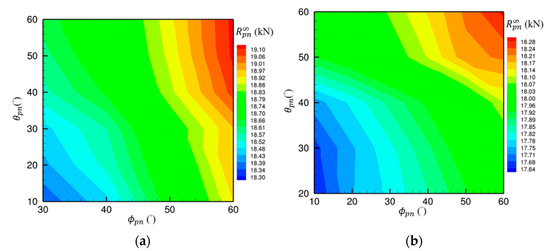
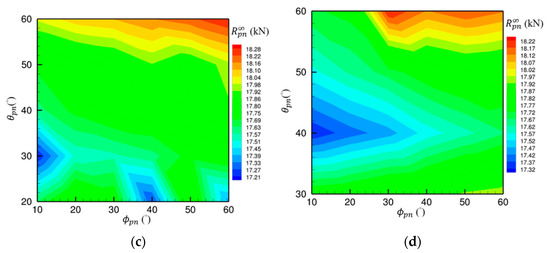
Figure 12.
Resistance contour plots for the pontoon: (a) Group 7; (b) Group 25; (c) Group 37; (d) Group 43.
4.2.2. Fixed Angle
Figure 13a,b present the normalized profile lines and shear stress distribution of three representative pontoons with varying fore- and aft-lengths but identical fore-body and aft-body angles. The fore- and aft-lengths are normalized by . Variations in length significantly influence hull shape: shorter lengths produce blunter profiles, while longer lengths result in sharper, more streamlined forms. Case 3, with the shortest fore-length and longest aft-length, exhibits a blunt bow and sharp stern, whereas Case 1, with the opposite configuration, shows a sharp bow and blunt stern. As summarized in Table 7, cases with shorter fore-sections tend to exhibit lower total resistance, highlighting the importance of fore-body design in hydrodynamic performance.
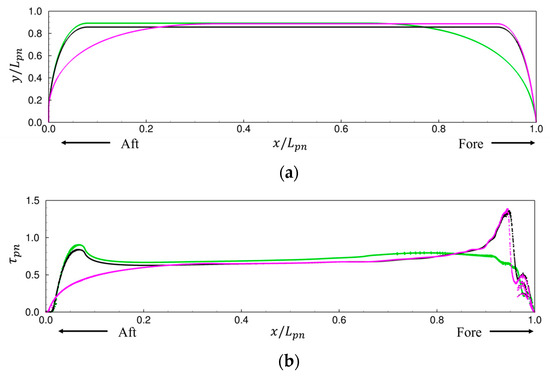
Figure 13.
Comparison of pontoon designs: (a) Profile; (b) Shear stress distribution.

Table 7.
The resistance of pontoon under immersed conditions.
4.3. Correlation Between Moment and Resistance
Figure 14a illustrates the correlation between total resistance and Munk moment from CFD simulations, where each red dot represents a single case. The results indicate that resistance decreases as the Munk moment approaches zero, implying that a fin stabilizer is necessary to counterbalance the moment. A larger Munk moment requires a greater angle of attack by the fin stabilizer, resulting in increased additional resistance. Thus, minimizing the Munk moment is essential for reducing overall resistance. Figure 14b shows the relationship between the longitudinal center of buoyancy () and the Munk moment. When is positioned closer to the stern, the Munk moment is reduced. This finding aligns with previous studies, which suggest that a slender pontoon with an aft-biased improves longitudinal stability by lowering the Munk moment.
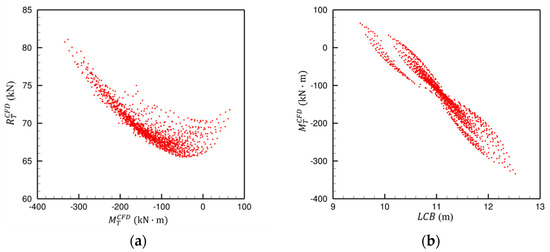
Figure 14.
Correlation between (a) Munk moment and total resistance; (b) and Munk moment.
5. DNN Model
5.1. Model Structure
A multi-layer perception (MLP), a type of deep neural network (DNN), is composed of an input layer, one or more hidden layers, and an output layer. The MLP operates in a feedforward manner, where each layer receives the output of the previous layer, applies a linear transformation, and passes it through a nonlinear activation function. The basic structure of the network can be expressed as:
where is the weight connecting neuron in layer to neuron in layer , is the bias of neuron in layer , is the activation function applied at layer , is the number of neurons in the previous layer , and denote the output from neuron in the previous layer. In this study, the Tansig (hyperbolic tangent sigmoid) activation function is used for all hidden layers while the Purelin (linear) activation function is applied to the output layer. The mathematical expressions of these two activation functions are given as follows:
The predicted output of the neural network, , is compared with the CFD reference value . The loss function is defined as the mean squared error (MSE) between the predicted and reference outputs:
where is the number of outputs. The loss function is backpropagated through the network to update weights and biases via gradient descent. This iterative process continues until the prediction error () converges to a minimum. In this study, Bayesian regularized backpropagation is employed to enhance generalization and mitigate overfitting.
5.2. Model Parameter
In this study, the input consists of four pontoon design parameters, and the output is the predicted resistance. Figure 15 outlines the employed DNN framework. The architecture is explored with one to five hidden layers. The first three layers contain 5–9 neurons, while subsequent layers have 3–8 neurons. A total of 10,005 model configurations are evaluated to identify the best-performing model. If the optimal model reaches the preset bounds, the search space is expanded for retraining. Model accuracy is assessed using the mean absolute percentage error (MAPE), defined as:
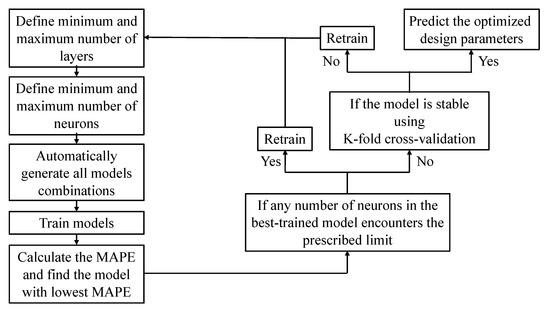
Figure 15.
Framework of the adopted DNN Model.
To generate the training dataset, 1398 CFD simulations were performed, each requiring approximately 15 min, resulting in a total of around 349.5 h of computation. These CFD results were used to train the DNN model over 10,005 configurations, which took approximately 24 h. Once trained, the model can predict resistance for new pontoon designs in under 3 min, enabling rapid evaluation and significantly reducing the need for additional CFD simulations. This integration of CFD and deep learning significantly enhances computational efficiency and scalability, offering a practical approach to hull form optimization that would be computationally prohibitive using CFD alone. Figure 16 presents the relationship between the total number of neurons in the hidden layers and the corresponding MAPE values. Each color denotes a different number of hidden layers. In general, increasing the number of neurons and layers tends to reduce the minimum achievable MAPE. However, a larger network does not always result in improved accuracy, indicating diminishing returns or possible overfitting beyond a certain model complexity. The best-trained model consists of five hidden layers with six, eight, nine, eight, and seven neurons, respectively. To evaluate model robustness, K-fold cross-validation is applied. The dataset of 1398 samples is divided into nonoverlapping folds. The model is trained on folds and tested on the remaining fold, repeating this process k times. The resulting MAPE values from each fold, listed in Table 8, are used to assess the model’s stability. After K-fold cross-validation, the finalized model was applied for prediction and parameter optimization. The model was trained on all 1398 data points from the original database, achieving a MAPE of 0.19% (Figure 17a). Additionally, 80 new test samples were used for evaluation, resulting in a MAPE of 0.37% (Figure 17b).
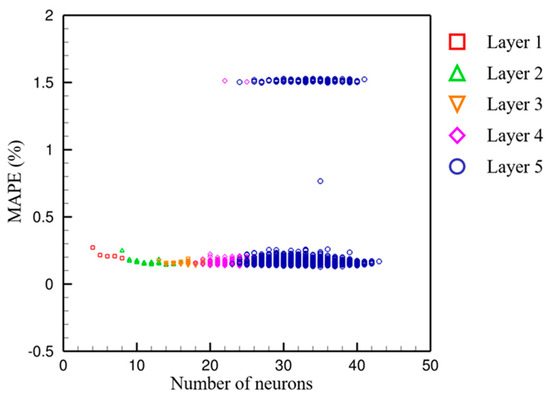
Figure 16.
MAPE of all evaluated DNN model configurations.

Table 8.
MAPE values obtained from K-fold cross-validation.
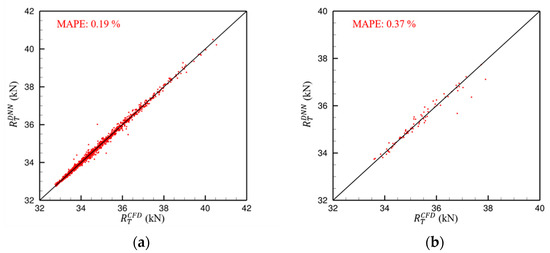
Figure 17.
Prediction of the best-trained DNN model and CFD results for (a) training and (b) test data.
5.3. Optimized Parameter Prediction
After establishing the DNN model, the design parameter search range for resistance optimization was defined, as summarized in Table 9. These ranges were selected based on resistance and moment trends observed in Figure 14a. The optimization target was set to 0 kN, allowing the model to identify the lowest achievable resistance and corresponding parameter combinations. The DNN model selected top 25 optimized parameter sets, which were subsequently validated via CFD to confirm their effectiveness in minimizing resistance.

Table 9.
Design parameter search range of pontoon.
6. Pontoon Optimization
6.1. Hull Form and Resistance
With the DNN model implemented, the optimized pontoon design for the SWATH vessel is obtained. Table 10 summarizes the optimized design parameters alongside those of the baseline. Due to the nonaxisymmetric nature of the baseline pontoon, some geometric parameters are unavailable. Figure 18 illustrates the line drawing of both baseline and optimized designs. Compared to the baseline, the optimized pontoon features a longer fore-body and a shorter aft-body, with the longitudinal center of buoyancy () positioned at 12.13 m—closer to the stern—indicating a possible reduction in the Munk moment. The optimized hull form reduces the longitudinal moment compared to the baseline, leading to a decreased fin stabilizer angle of attack and thus lower resistance. Table 11 and Table 12 summarize the simulation results for the optimized and baseline designs. Here, denotes the pontoon’s longitudinal (Munk) moment, while and represent the total resistance predicted by the DNN model and CFD, respectively. The fore-fin stabilizer’s angle of attack is denoted by . Moment interpolation across different stabilizer angles is used to determine the zero-moment condition. Resistance components include strut (), pontoon (), fore-fin (), and aft-fin () resistances, with the superscript indicating free-surface flow. The optimized design exhibits a significantly smaller due to its pontoon shape. Although discrepancies exist between DNN and CFD total resistance predictions, attributed to the linearization of resistance components, the relative resistance trends remain consistent, validating the proposed decoupling approach. The pontoon resistance of the optimized design is 8.6% higher than the baseline, owing to its slightly larger volume. However, a substantial reduction in fin resistance results in a 2.2% decrease in total resistance compared to the baseline.

Table 10.
Design parameter comparison between baseline and optimized SWATH designs.
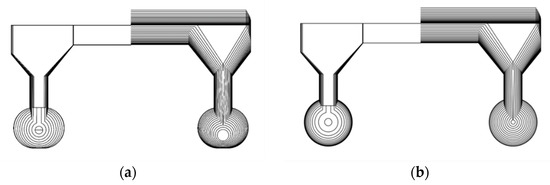
Figure 18.
Line drawing of SWATH hull form: (a) Baseline; (b) Optimized.

Table 11.
Comparison of the longitudinal moment between baseline and optimized SWATH designs.

Table 12.
Comparison of the resistance components between baseline and optimized SWATH designs (in kN).
Figure 19 compares the free-surface elevations, while Figure 20 presents the pressure coefficient distributions in the flow field and on the hull surfaces. The optimized design exhibits slightly higher wave elevations compared to the baseline. However, as shown in Figure 20, its hull surface pressure distribution is smoother, with no abrupt low-pressure regions. This is attributed to the optimized pontoon’s more continuous curvature, which promotes a more uniform pressure field. Figure 21 presents the nominal wake distribution at the propeller plane. The nominal wake fraction is defined as
where A is the propeller’s swept area and represents the dimensionless axial velocity component. The baseline design exhibits a nominal wake of 0.13, while the optimized design shows a higher value of 0.24. It is concluded that the pontoon with a circular cross-section has an apparently unfavorable impact on the nominal wake at the propeller plane, compared to its elliptic counterpart (baseline). Figure 22 presents the dimensionless axial velocity component along the circumferential direction (). The zone of low axial velocity component between 120 and 240 explains a large nominal wake of the optimized design. Figure 23 and Figure 24 present the dimensionless radial and tangential velocity components, i.e., and , along the circumferential direction, respectively. In the region between 120 and 240, the radial and tangential velocity components exhibit a pronounced increase compared to those of the baseline design. Despite improvements in resistance and Munk moment, the optimized design yields a less favorable wake distribution, potentially degrading propulsion efficiency.
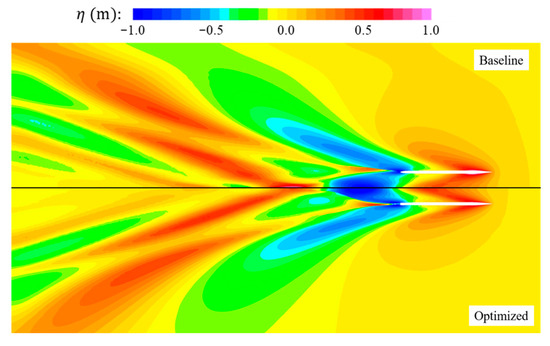
Figure 19.
Comparison of free-surface elevation between baseline and optimized SWATH designs.

Figure 20.
Pressure coefficient distribution of hull surface: (a) Baseline; (b) Optimized.
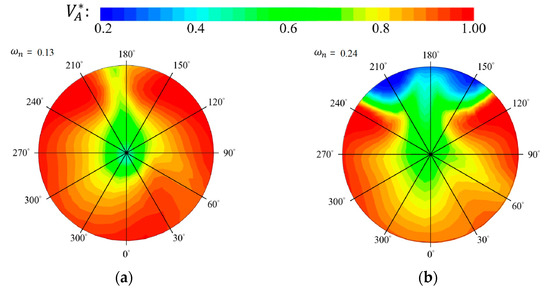
Figure 21.
Nominal wake at propeller plane: (a) Baseline; (b) Optimized.

Figure 22.
Dimensionless axial velocity () vs. azimuthal angle (): (a) Baseline; (b) Optimized.

Figure 23.
Dimensionless radial velocity () vs. azimuthal angle (): (a) Baseline; (b) Optimized.

Figure 24.
Dimensionless tangential velocity () vs. azimuthal angle (): (a) Baseline; (b) Optimized.
6.2. Total Resistance in Full Speed Range
The optimized hull form in the previous section was developed for a target speed of Froude number 0.8. To assess the applicability of the optimized hull to other velocity, this section investigates still-water resistance over a range of speeds from 0.2 to 0.8. Fixed-running CFD simulations were conducted, with fin stabilizer angles estimated based on moment equilibrium. The estimated angles are listed in Table 13. Figure 25a,b illustrate the convergence of total resistance and Munk moment at a Froude number of 0.8. The results indicate that periodic oscillations occur after 20 s; therefore, the average value beyond this point is extracted for further analysis. Figure 26a shows the bare hull resistance, while Figure 26b includes the resistance from the fin stabilizer. Without the stabilizer, the baseline design generally outperforms the optimized hull across the full speed range. However, once the stabilizer is included, the optimized design shows superior performance at higher speeds. This is critical, as omitting the stabilizer at high speeds would compromise longitudinal stability and potentially lead to the danger of capsizing. The benefit of the reduced hull-induced moment is highlighted in Figure 27. In the speed range from 0.2 to 0.8, the maximum Munk moment arising in the optimized design is 160 kNm at 0.5, while the maximum Munk moment produced by the baseline design is about 400 kNm at 0.8. This implies that a more powerful motor is required to drive the stabilizer fin in the baseline design, which may lead to additional cost and weight implications. In contrast, the optimized design offers the advantage of lower construction cost and higher payload capacity.

Table 13.
Estimated angle of fin stabilizer for baseline and optimized designs.
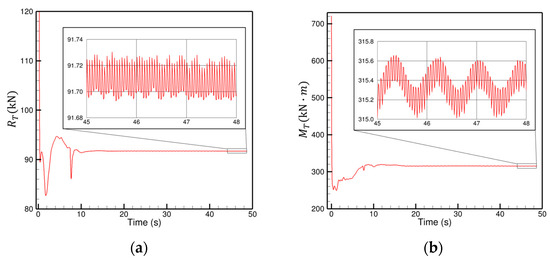
Figure 25.
The temporal convergence of (a) total resistance and (b) Munk moment at Fr = 0.8.
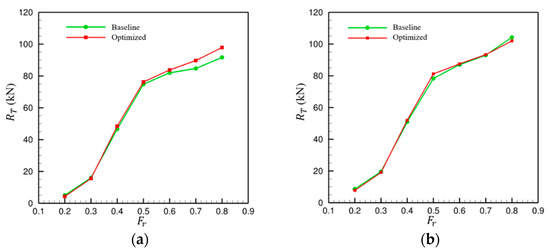
Figure 26.
Comparison of total resistance between baseline and optimized designs: (a) Bare hull; (b) Hull with fin stabilizers.
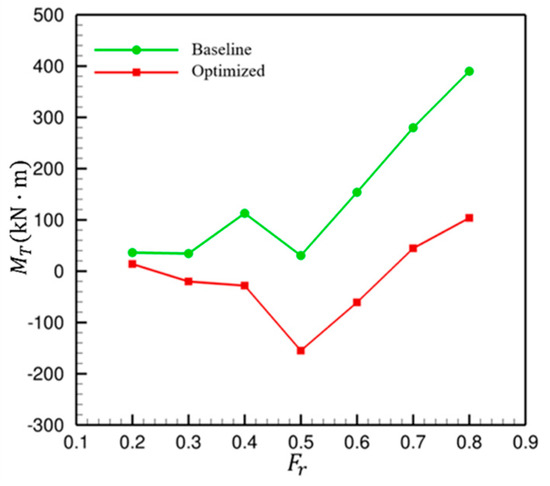
Figure 27.
Comparison of Munk moment between baseline and optimized designs.
7. Conclusions
This study proposes a parameterized SWATH underwater pontoon design method, integrating resistance analysis and deep neural network (DNN) modeling to identify an optimized design with reduced total resistance and Munk moment at a high Froude number. To simplify calculations, the resistance of the SWATH vessel is decomposed into contributions from the pontoon, strut, superstructure, and fin stabilizers. The pontoon is identified as the largest resistance contributor and is thus the primary target for optimization. The pontoon design is based on an axisymmetric body defined by fore- and aft-lengths and body angles. After optimizing pontoon resistance using the DNN model, computational fluid dynamics (CFD) simulations are conducted to predict the total resistance of the SWATH in a full three-dimensional flow field, serving as the final validation step. The DNN model employed comprises five hidden layers with six, eight, nine, eight, and seven neurons, respectively, achieving a mean absolute percentage error (MAPE) of 0.19%. The optimized design parameters suggested by the model include a fore-body length of 7.8 m, an aft-body length of 6.8 m, a fore-angle of 10°, and an aft-angle of 35°. The longitudinal center of buoyancy () of the optimized design shifts closer to the stern compared to the baseline design. Correspondingly, the longitudinal moment is reduced by 127.8%, and the fin stabilizer’s angle of attack decreases by 121.7%. After accounting for the resistance contributions of all components via CFD, the total resistance of the optimized SWATH is reduced by 2.2% relative to the baseline. Performance evaluation across different speeds reveals that the optimized design exhibits better resistance characteristics at high Froude numbers, primarily due to the significant reduction in the Munk moment, which allows for a smaller stabilizer angle and reduced fin drag. In summary, minimizing the Munk moment during pontoon design is critical not only to enhance vessel stability and prevent capsizing but also to reduce overall resistance. The optimized design also offers the advantage of lower construction costs and higher payload capacity. This integrated approach combining DNN-based optimization with CFD validation offers an effective framework for designing high-performance SWATH vessels.
Author Contributions
Conceptualization, S.-W.C.; methodology, C.-L.T.; software, C.-M.W.; validation, C.-M.W.; resources, C.-H.H.; writing—original draft preparation, C.-L.T.; writing—review and editing, S.-W.C.; visualization, C.-M.W. All authors have read and agreed to the published version of the manuscript.
Funding
This research received no external funding.
Institutional Review Board Statement
Not applicable.
Informed Consent Statement
Not applicable.
Data Availability Statement
The raw data supporting the conclusions of this article will be made available by the authors on request.
Conflicts of Interest
Author Chia-Hao Hsu was employed by the company Lungteh Shipbuilding Co., Ltd. The remaining authors declare that the research was conducted in the absence of any commercial or financial relationships that could be construed as a potential conflict of interest.
Abbreviations
| Nomenclature | |||
| The surface area of the pontoon | The pressure on the surface of the pontoon | ||
| Beam overall | Radius of pontoon | ||
| Lift coefficient | Hub radius | ||
| Transfer-flow resistance coefficient | Total resistance | ||
| Depth of ship | Resistance of lower hull | ||
| Draught | Resistance of strut | ||
| Cell size of grid | Resistance of super structure | ||
| Discretization error | Resistance of pontoon | ||
| Froude number | Resistance of fin stabilizer | ||
| The lift force of fore-fin stabilizer | Resistance of pontoon in infinite water depth | ||
| The lift force of aft-fin stabilizer | Total resistance predicted from DNN model | ||
| Gravitational acceleration | Total resistance calculated from CFD solver | ||
| Length of fore-body | Vessel speed | ||
| Moment arm length of center of gravity | Normalized axial velocity | ||
| Length of parallel middle body | Normalized radial velocity | ||
| Length of aft-body | Normalized tangential velocity | ||
| Length overall | Weight of hidden layer | ||
| Length of water line | Predicted output of the neural network | ||
| Length of pontoon | CFD value | ||
| Lift force of fin stabilizer | The angle of attack | ||
| Total moment | Degree of propeller plane | ||
| Moment of pontoon in infinite water depth | The angle of fore-body | ||
| Pressure moment of pontoon in infinite water depth | Aspect ratio | ||
| Shear moment of pontoon in infinite water depth | The angle of aft-body | ||
| Moment of pontoon in free-surface condition | Grid-independent solution | ||
| Moment of strut in free-surface condition | th grid | ||
| Number of grids | th grid | ||
| th grid | Nominal wake | ||
| th grid | |||
References
- Global Wind Report 2021; GWEC, Global Wind Energy Council: Brussels, Belgium, 2021.
- Dalgic, Y.; Lazakis, I.; Turan, O. Investigation of Optimum Crew Transfer Vessel Fleet for Offshore Wind Farm Maintenance Operations. Wind. Eng. 2015, 39, 31–52. Available online: https://www.jstor.org/stable/90006858 (accessed on 15 June 2025). [CrossRef]
- Pérez-Arribas, F.; Calderon-Sanchez, J. A Parametric Methodology for the Preliminary Design of SWATH Hulls. Ocean Eng. 2020, 197, 106823. [Google Scholar] [CrossRef]
- Lin, Y.; Yang, Q.; Guan, G. Automatic Design Optimization of SWATH Applying CFD and RSM Model. Ocean Eng. 2019, 172, 146–154. [Google Scholar] [CrossRef]
- Brizzolara, S.; Vernengo, G. Automatic Optimization Computational Method for Unconventional S.W.A.T.H. Ships Resistance. Int. J. Math. Models Methods Appl. Sci. 2011, 5, 882–889. [Google Scholar]
- Begovic, E.; Bertorello, C.; Mancini, S. Hydrodynamic Performances of Small Size Swath Craft. Brodogradnja 2015, 66, 1–22. [Google Scholar]
- Ferziger, J.H.; Perić, M.; Street, R.L. (Eds.) Computational Methods for Fluid Dynamics, 4th ed.; Springer International Publishing: Cham, Switzerland, 2020. [Google Scholar]
- Yang, Q.; Lin, Y.; Guan, G. Improved Sequential Sampling for Meta-Modeling Promotes Design Optimization of SWATH. Ocean Eng. 2020, 198, 106958. [Google Scholar] [CrossRef]
- Collette, M.; Lin, W.M.; Li, J. Applying Advanced Simulation in Early Stage Unconventional Ship Design. In Proceedings of the GCMS ‘10: Proceedings of the 2010 Conference on Grand Challenges in Modeling & Simulation, Ottawa, ON, Canada, 11–14 July 2010; pp. 344–351. [Google Scholar]
- LCDR Ben Evans, Expedition 3: Coastal Ocean Mapping Aboard the NOAA Ship Ferdinand R. Hassler. Available online: https://oceanexplorer.noaa.gov/okeanos/explorations/acumen12/hassler/welcome.html (accessed on 15 June 2025).
- AHMD Ltd. Available online: https://www.adhocmarinedesigns.co.uk/latest (accessed on 15 June 2025).
- Historical Programs—Sea Shadow, Lockheed Martin. 2020. Available online: https://www.lockheedmartin.com/en-us/news/features/history/sea-shadow.html (accessed on 15 June 2025).
- Brizzolara, S.; Bovio, M.; Federici, A.; Vernengo, G. Hydrodynamic Design of a Family of Hybrid SWATH Unmanned Surface Vehicles. In Proceedings of the 11th International Conference on Fast Sea Transportation, FAST 2011—Proceedings, Honolulu, HI, USA, 25–28 September 2011. [Google Scholar]
- Zaraphonitis, G.; Papanikolaoy, A.; Androulakakis, M. Preliminary Design of a High-Speed SWATH Passenger/Car Ferry. Mar. Technol. 1991, 28, 129–141. [Google Scholar]
- Macedo, P. SWATH SOV Hull Concept and Optimisation for Seakeeping. Master’s Thesis, University of Technology, Gothenburg, Sweden, 2018. [Google Scholar]
- Ali, A.; Maimun, A.; Ahmed, Y.M. Analysis of Resistance and Generated Wave around Semi SWATH Hull at Deep and Shallow Water. J. Adv. Res. Fluid Mech. Therm. Sci. 2020, 58, 247–260. Available online: https://akademiabaru.com/submit/index.php/arfmts/article/view/2586 (accessed on 15 June 2025).
- Godø, J.M.K.; Steen, S.; Faltinsen, O.M. An Efficient Method for Design and Powering Prediction of Fast Slender Catamarans. Ocean Eng. 2023, 286, 115589. [Google Scholar] [CrossRef]
- Ge, W.; Guo, Z. Motion Stability of SWATH. Shipbuild. China 2000, 3, 28–34. [Google Scholar]
- Dong, Z.; Dong, W. A Simplified Criterion and An Analysis of Some Influence Factors on Longitudinal Motion Stability of Small Waterplane Area Twin─Hull Ships. Shipbuild. China 1994, 4, 36–48. [Google Scholar]
- Renaud, P.; Sacher, M.; Scolan, Y. Multi-objective Hull Form Optimization of a SWATH Configuration Using Surrogate Models. Ocean Eng. 2022, 256, 111209. [Google Scholar] [CrossRef]
- Fairlie-Clarke, A.C. Regression Analysis of Ship Data. Int. Shipbuild. Prog. 1975, 22, 227–250. [Google Scholar] [CrossRef]
- Holtrop, J.; Mennen, G.G.J. An Approximate Power Prediction Method. Int. Shipbuild. Prog. 1982, 29, 166–170. [Google Scholar] [CrossRef]
- Wang, P.; Chen, Z.; Feng, Y. Many-Objective Optimization for a Deep-Sea Aquaculture Vessel Based on an Improved RBF Neural Network Surrogate Model. J. Mar. Sci. Technol. 2021, 26, 582–605. [Google Scholar] [CrossRef]
- Wang, Y.; Joseph, J.; Unni, T.P.A.; Yamakawa, S.; Farimani, A.B.; Shimada, K. Three-Dimensional Ship Hull Encoding and Optimization via Deep Neural Networks. J. Mech. Des. 2022, 144, 1–15. [Google Scholar] [CrossRef]
- Yu, D.C.; Wang, L. Hull Form Optimization with Principal Component Analysis and Deep Neural Network. arXiv 2018. [Google Scholar] [CrossRef]
- Kim, J.H.; Roh, M.I.; Kim, K.S.; Yeo, I.C.; Oh, M.J.; Nam, J.W.; Lee, S.H.; Jang, Y.H. Prediction of the Superiority of The Hydrodynamic Performance of Hull Forms Using Deep Learning. Int. J. Nav. Archit. Ocean. Eng. 2022, 14, 100490. [Google Scholar] [CrossRef]
- Mittendorf, M.; Nielsen, U.D.; Bingham, H.B. The Prediction of Sea State Parameters by Deep Learning Techniques using Ship Motion Data. In Proceedings of the 7th World Maritime Technology Conference 2022, Copenhagen, Denmark, 26–28 April 2022. [Google Scholar]
- Tsai, C.P.; Lin, C.; Shen, J.N. Neural Network for Wave Forecasting Among Multi-Stations. Ocean Eng. 2002, 29, 1683–1695. [Google Scholar] [CrossRef]
- Tello, P.R.; Romero, J.E.G.; Camas, B.S. Prediction of Seakeeping in the Early Stage of Conventional Monohull Vessels Design Using Artificial Neural Network. J. Ocean Eng. Sci. 2023, 8, 344–366. [Google Scholar] [CrossRef]
- Liu, Y.C.; Duan, W.Y.; Huang, L.M.; Duan, S.L.; Ma, X.W. The Input Vector Space Optimization for LSTM Deep Learning Model in Real-Time Prediction of Ship Motions. Ocean Eng. 2020, 213, 107681. [Google Scholar] [CrossRef]
- Rashid, M.; Zhang, J.; Zhao, M. Real-Time Ship Motion Forecasting Using Deep Learning. In Proceedings of the 2nd International Conference on Computing and Data Science (CONF-CDS 2021), Stanford, CA, USA, 28–30 January 2021; pp. 1–5. [Google Scholar] [CrossRef]
- Rizzuto, E.; Ruggiero, V. Deep Neural Network (DNN) Method to Predict the Displacement Behavior of Neutral Axis for Ships in Vertical Bending. In Technology and Science for the Ships of the Future, Proceedings of the NAV 2022: 20th International Conference on Ship & Maritime Research, La Spezia, Italy, 15–17 June 2022; IOS Press: Amsterdam, The Netherland, 2022; Volume 6, pp. 95–103. [Google Scholar]
- Cui, H.; Turan, O.; Sayer, P. Learning-based Ship Design Optimization Approach. Comput.-Aided Des. 2012, 44, 186–195. [Google Scholar] [CrossRef]
- Khairuddin, J.; Maimun, A.; Hiekata, K.; Siow, C.L.; Ali, A. Web Application with Data Centric Approach to Ship Powering Prediction Using Deep Learning. Software Impacts. 2022, 11, 100226. [Google Scholar] [CrossRef]
- Lee, J.B.; Roh, M.I.; Kim, K.S. Prediction of Ship Power Based on Variation in Deep Feed-Forward Neural Network. Int. J. Nav. Archit. Ocean Eng. 2021, 13, 641–649. [Google Scholar] [CrossRef]
- Lei, L.; Wen, Z.; Peng, Z. Prediction of Main Engine Speed and Fuel Consumption of Inland Ships Based on Deep Learning. J. Phys. Conf. Ser. 2021, 2025, 012012. [Google Scholar] [CrossRef]
- Kim, S.H. A Study on the Method for the Estimation of Energy Efficiency Operational Indicator of a Ship Based on Technologies of Big Data and Deep Learning. Master’s Thesis, Seoul National University, Seoul, Republic of Korea, 2018. [Google Scholar]
- Yun, L.; Bliault, A.; Rong, H.Z. High Speed Catamarans and Multihulls: Technology, Performance, and Applications, 1st ed.Springer: New York, NY, USA, 2019. [Google Scholar]
- Tietjens, O.G. Fundamentals of Hydro- and Aeromechanics; Based on Lectures of L. Prandtl.; Rosenhead, L., Translator; Engineering Societies Monographs; Dover Publications: New York, NY, USA, 1957. [Google Scholar]
- Söding, H. Manoeuvring Technical Manual Part 2; Seehafen Verlag: Hamburg, Germany, 2019. [Google Scholar]
- Nazari, H.; Ghassemi, H.; Ghaisi, M.; He, G.; Vakilabadi, K.A. Review of Resistance and Seakeeping Characteristics of SWATH Ships. Ships Offshore Struct. 2025, 1–20. [Google Scholar] [CrossRef]
- Wolfson Unit, Towing Tank Tests in Support of the Design of a 26m SWATH; University of Southampton: Southampton, UK, 2017.
Disclaimer/Publisher’s Note: The statements, opinions and data contained in all publications are solely those of the individual author(s) and contributor(s) and not of MDPI and/or the editor(s). MDPI and/or the editor(s) disclaim responsibility for any injury to people or property resulting from any ideas, methods, instructions or products referred to in the content. |
© 2025 by the authors. Licensee MDPI, Basel, Switzerland. This article is an open access article distributed under the terms and conditions of the Creative Commons Attribution (CC BY) license (https://creativecommons.org/licenses/by/4.0/).