1. Introduction
The growing concerns over energy resource depletion and global climate change are accelerating the development of sustainable energy sources [
1]. Among various alternatives, wind energy has emerged as a key substitute for fossil fuels. Renowned for its cleanliness and reliability, wind power has attracted global attention and has achieved significant advancements in both onshore and offshore applications [
2]. Compared to nearshore wind energy, deep-sea wind resources are more abundant and offer greater development areas, with reduced impact on coastal communities, fisheries, and marine ecosystems. This makes deep-sea offshore wind a viable direction regarding wind energy development in marine environments. Floating offshore wind turbines (FOWTs) offer a more practical option in deep waters, as they are not constrained by depth, allowing for simplified installation and reduced costs, thereby enhancing the feasibility of deep-sea wind exploitation [
3]. In fact, FOWTs have already been deployed in operational settings. The Hywind Demo project, situated off Norway’s western coast, was the first FOWT in the world [
4]. Its remarkable power generation has showcased the immense possibilities of FOWTs, providing a strong impetus to drive forward FOWT technology. In addition, the Scottish government approved the installation of a floating wind farm in the North Sea [
5], where the water depth exceeds 100 m. These applications demonstrate the feasibility of FOWTs as a viable solution for offshore wind energy.
FOWTs have demonstrated exceptional safety and dynamic performance in deep-water regions, making them a key technology for unlocking the potential of deep-sea wind energy resources [
6]. In the design of FOWT mooring systems, the design wave condition is typically used for structural assessment. The design wave refers to a representative sea state selected for engineering calculations and safety evaluations, often corresponding to the most severe conditions expected within a given return period, such as 100 years. It is generally modeled using irregular waves to replicate complex sea states. However, compared to such irregular waves with equivalent significant wave height, rogue waves can exhibit much larger peak amplitudes. As a result, a mooring system designed solely based on the design wave cannot be assumed to remain safe under rogue wave impact. Therefore, the applicability of design wave conditions does not extend to all extreme scenarios, and additional considerations are necessary for rare but severe sea states. Rogue waves, also known as extreme or freak waves, are prone to happen in extreme sea states, which are highly unpredictable nonlinear waves with abnormally enlarged wave heights and focused wave energy. Rogue waves constantly threaten the safety of offshore structures, including FOWTs in the deep-water regions. Many researchers have investigated the influence of rogue waves on FOWTs. Zeng et al. [
7] generated rogue wave trains with high crests and deep troughs, along with random wave trains of the same sequence, using a modulated wave profile method in physical experiments. They investigated the impacts of extreme wave crests and troughs on the dynamics of FOWTs, with a focus on nacelle acceleration, mooring line tension, and wave-induced loads. Li et al. [
8] applied potential flow theory to study the transient motion response of FOWTs under extreme wave action. Their mooring system was modeled using a catenary model, a quasi-static algorithm designed to predict mooring line tension. Similarly, Zhou et al. [
9] applied computational fluid dynamics (CFD) tools to motion response of FOWTs to rogue waves with varying steepness. Their findings revealed that increasing wave steepness amplified both hydrodynamic loads and motion responses, introducing greater nonlinearity. Rogue waves not only amplify platform motion responses and increase mooring system loads but also cause fluctuations in wind turbine power output and introduce potential structural damage. Therefore, the influences of rogue waves must be carefully considered in the development and functioning of FOWTs to ensure the prolonged safety and dependability.
To address extreme loads and various safety risks, optimization of the FOWT with mooring system is essential. As offshore renewable energy projects increasingly adopt floating solutions, mooring systems have become a critical subsystem that influences both the survivability and cost-effectiveness of these devices [
10,
11]. Existing studies on mooring system optimization has mainly concentrated on geometric enhancements to improve performance and safety. Li et al. [
12] demonstrated that using optimal grouped weights or heavy chains can enhance mooring system performance. Similarly, Li et al. [
13] carried out multiple simulation studies and proposed key design recommendations for mooring structures of mid-depth floating wind turbines under typhoon conditions, focusing on parameters such as line scope, fairlead position, line number, and line length. Benassai et al. [
14] performed numerical analyses on two different mooring configurations, catenary and tensioned mooring systems, highlighting the optimal mooring design for a given depth. Liu et al. [
15] investigated system responses in cases of wind-wave misalignment and identified suitable mooring configurations to minimize loads on the turbine, mooring system, and support structure. Their study introduced three different mooring system configurations, featuring either six mooring lines with varying angles. Haider et al. [
16] conducted an analysis of conventional mooring systems (CMS) and novel mooring systems (NMS), finding that NMS provided more effective stress distribution and reduced mooring line tension, thereby enhancing structural durability and safety. Chen et al. [
17] investigated the design refinement, enhancement of performance, and risk evaluation of floating wind turbine mooring systems, evaluating mooring chain diameters to determine their effects on ultimate strength and fatigue damage. Ye et al. [
18] proposed an optimization approach for FOWT mooring systems using anchor chain length and radial anchor spacing as key variables, aiming to minimize slamming, yaw motion, and nacelle acceleration. They employed a full-factorial design of experiments to generate mooring system configurations and simulated the system response using the open-source OpenFAST program in the temporal domain. Yan et al. [
19] examined how varying water depths and mooring configurations influence the mooring system’s nonlinear dynamics and the motion response of a FOWT. Pillai et al. [
20] proposed a multi-objective optimization method for mooring. This approach effectively reduced both mooring costs, leading to the identification of a set of optimal design solutions. The performance of mooring systems significantly influences the durability and operational efficiency of FOWTs, making them an essential element in advancing sustainable offshore renewable energy. Additionally, the resilience of FOWTs in harsh weather conditions largely relies on strong mooring designs, as malfunctions in these systems are a main cause of operational disruptions [
21]. Ongoing advancements in mooring technology are pivotal to bolstering the performance of FOWTs, leading the way for the development of wind resources in marine environments.
On the one hand, existing studies have explored various optimization approaches for FOWTs, utilizing different models for hydrodynamic and mooring system analysis. Generally, potential flow theory and CFD methods are usually employed for hydrodynamic modeling, while dynamic and quasi-static (QS) models are commonly used for mooring system modeling. For hydrodynamic modeling comparisons, Li and Bachynski [
22] investigated wave interactions with FOWTs using potential flow theory and CFD, validating their results against experimental data. Their study showed that CFD correctly estimates the phase in higher-order wave loads, with turbulence models yielding the most reliable predictions. While potential flow theory is effective for large floating structures, it lacks the ability to capture viscous effects and directly simulate nonlinear fluid phenomena. In contrast, CFD offers a more accurate depiction of fluid viscosity and turbulence characteristics, making it well-suited for modeling fluid–structure interactions. Moreover, nonlinearity of sharp waves and two-way coupling effect of the fluid–structure interaction can be considered more precisely using CFD. With its higher computational accuracy, CFD is preferable for detailed investigations and extreme condition analyses. In the meanwhile, for mooring system analysis, Zhong et al. [
23] evaluated six mooring system modeling methods, comprising three dynamic and three quasi-static models, highlighting key differences in their applicability. Their findings indicate that the lumped mass (LM) and local discontinuous Galerkin finite element method (LDG-FEM) models are well-suited for FOWT hydrodynamic studies. LDG-FEM, utilizing a high-order finite element approach, excels in simulating transient loads and capturing nonlinear tension variations, making it particularly effective for high-frequency dynamic response studies. In contrast, the LM method is suitable for predicting global motions but is less accurate in capturing transient impact loads. Therefore, for applications requiring precise analysis of mooring line transient loads, slack-snap behavior, and higher-order dynamic effects, LDG-FEM may be the optimal choice. Collectively, these studies demonstrate the advantages of CFD-FEM modeling in capturing dynamic effects, predicting loads, and aligning with experimental data.
On the other hand, most existing studies on mooring system design focused on conventional operating conditions, with limited attention to the performance of the optimization under extreme sea states. This research gap poses potential safety risks, as mooring systems optimized for typical conditions may lack sufficient safety margins when subjected to extreme external loads, such as rogue waves, severe storms, or high-energy wave events. Further evaluation of the optimized mooring system under extreme conditions is necessary due to the highly nonlinear and transient nature of extreme external loads acting on FOWTs with mooring systems. For instance, rogue waves release concentrated energy within a short duration, causing abrupt platform motion changes and inducing peak tension in mooring lines. Conventional mooring design methods, which often rely on statistical wave models or assumption of steady-state loads, may fail to accurately capture these extreme transient effects. As a result, mooring systems designed for normal wave conditions may experience unexpectedly high loads when encountering rogue waves, leading to increased damage and failure risk. Design evaluation of floating offshore structures with mooring systems under extreme sea state, such as under rogue wave conditions, not only enhances the safety and dependability of FOWT but also provides insights on design investigations from a new perspective.
This research employs a coupled CFD-FEM for study the response of a parked FOWT platform with its mooring system in response to rogue wave environments. The generation of rogue waves and the coupled CFD-FEM model are verified by comparing with available experimental and simulation data. The response of the FOWT induced rogue waves are examined and compared with the ones induced by a peak-clipped rogue wave. However, we conduct this study not only to investigate the FOWT’s response features but also to show the advancement of simulation methodology and necessity of mooring scheme evaluation under extreme waves. Additionally, a further analysis of four different mooring schemes is conducted to evaluate their effectiveness in reducing platform and mooring tension responses. Mooring systems are typically designed based on standard operational conditions, with minimal consideration given to extreme wave conditions like rogue waves, making their suitability under such conditions uncertain. This study addresses that gap by comparing the motion and tension responses of several mainstream mooring configurations under rogue wave conditions and identifying the most balanced solution in terms of safety and cost. By doing this, this work can gain a deeper understanding of their performance in extreme wave conditions. Innovations of this study lie in three aspects. Firstly, the coupled CFD-FEM model not only provides a more precise simulation on nonlinear hydrodynamics and two-way wave-structure interaction, but it also obtains more reliable results of the mooring structural dynamics considering the transient nonlinear loads induced by extreme waves. Secondly, analysis of the motions and tensions of the FOWT with its mooring line are conducted to reveal the characteristics of the FOWTs’ responses under rogue wave conditions, which are less frequently considered in the design and examination of FOWTs. Lastly, evaluations of four commonly used mooring schemes are further carried out to show their performances and effectiveness under rogue wave conditions, which addresses the research gap in the lack of consideration of mooring design schemes in extreme wave environment. This study may provide new insights in the safety design of FOWTs and the choice of mooring schemes, which may have reference significance from an engineering perspective.
4. Numerical Simulation
4.1. Interaction Between the Rogue Wave and Platform
This section utilizes the previously established numerical wave tank and floating platform model to simulate and analyze the dynamic response of the platform under rogue wave excitation. The objective is to investigate how nonlinear wave loads induced by extreme waves influence the mooring system’s motion behavior and stability. To better understand the coupled dynamics between rogue waves and the platform, the interaction process was described.
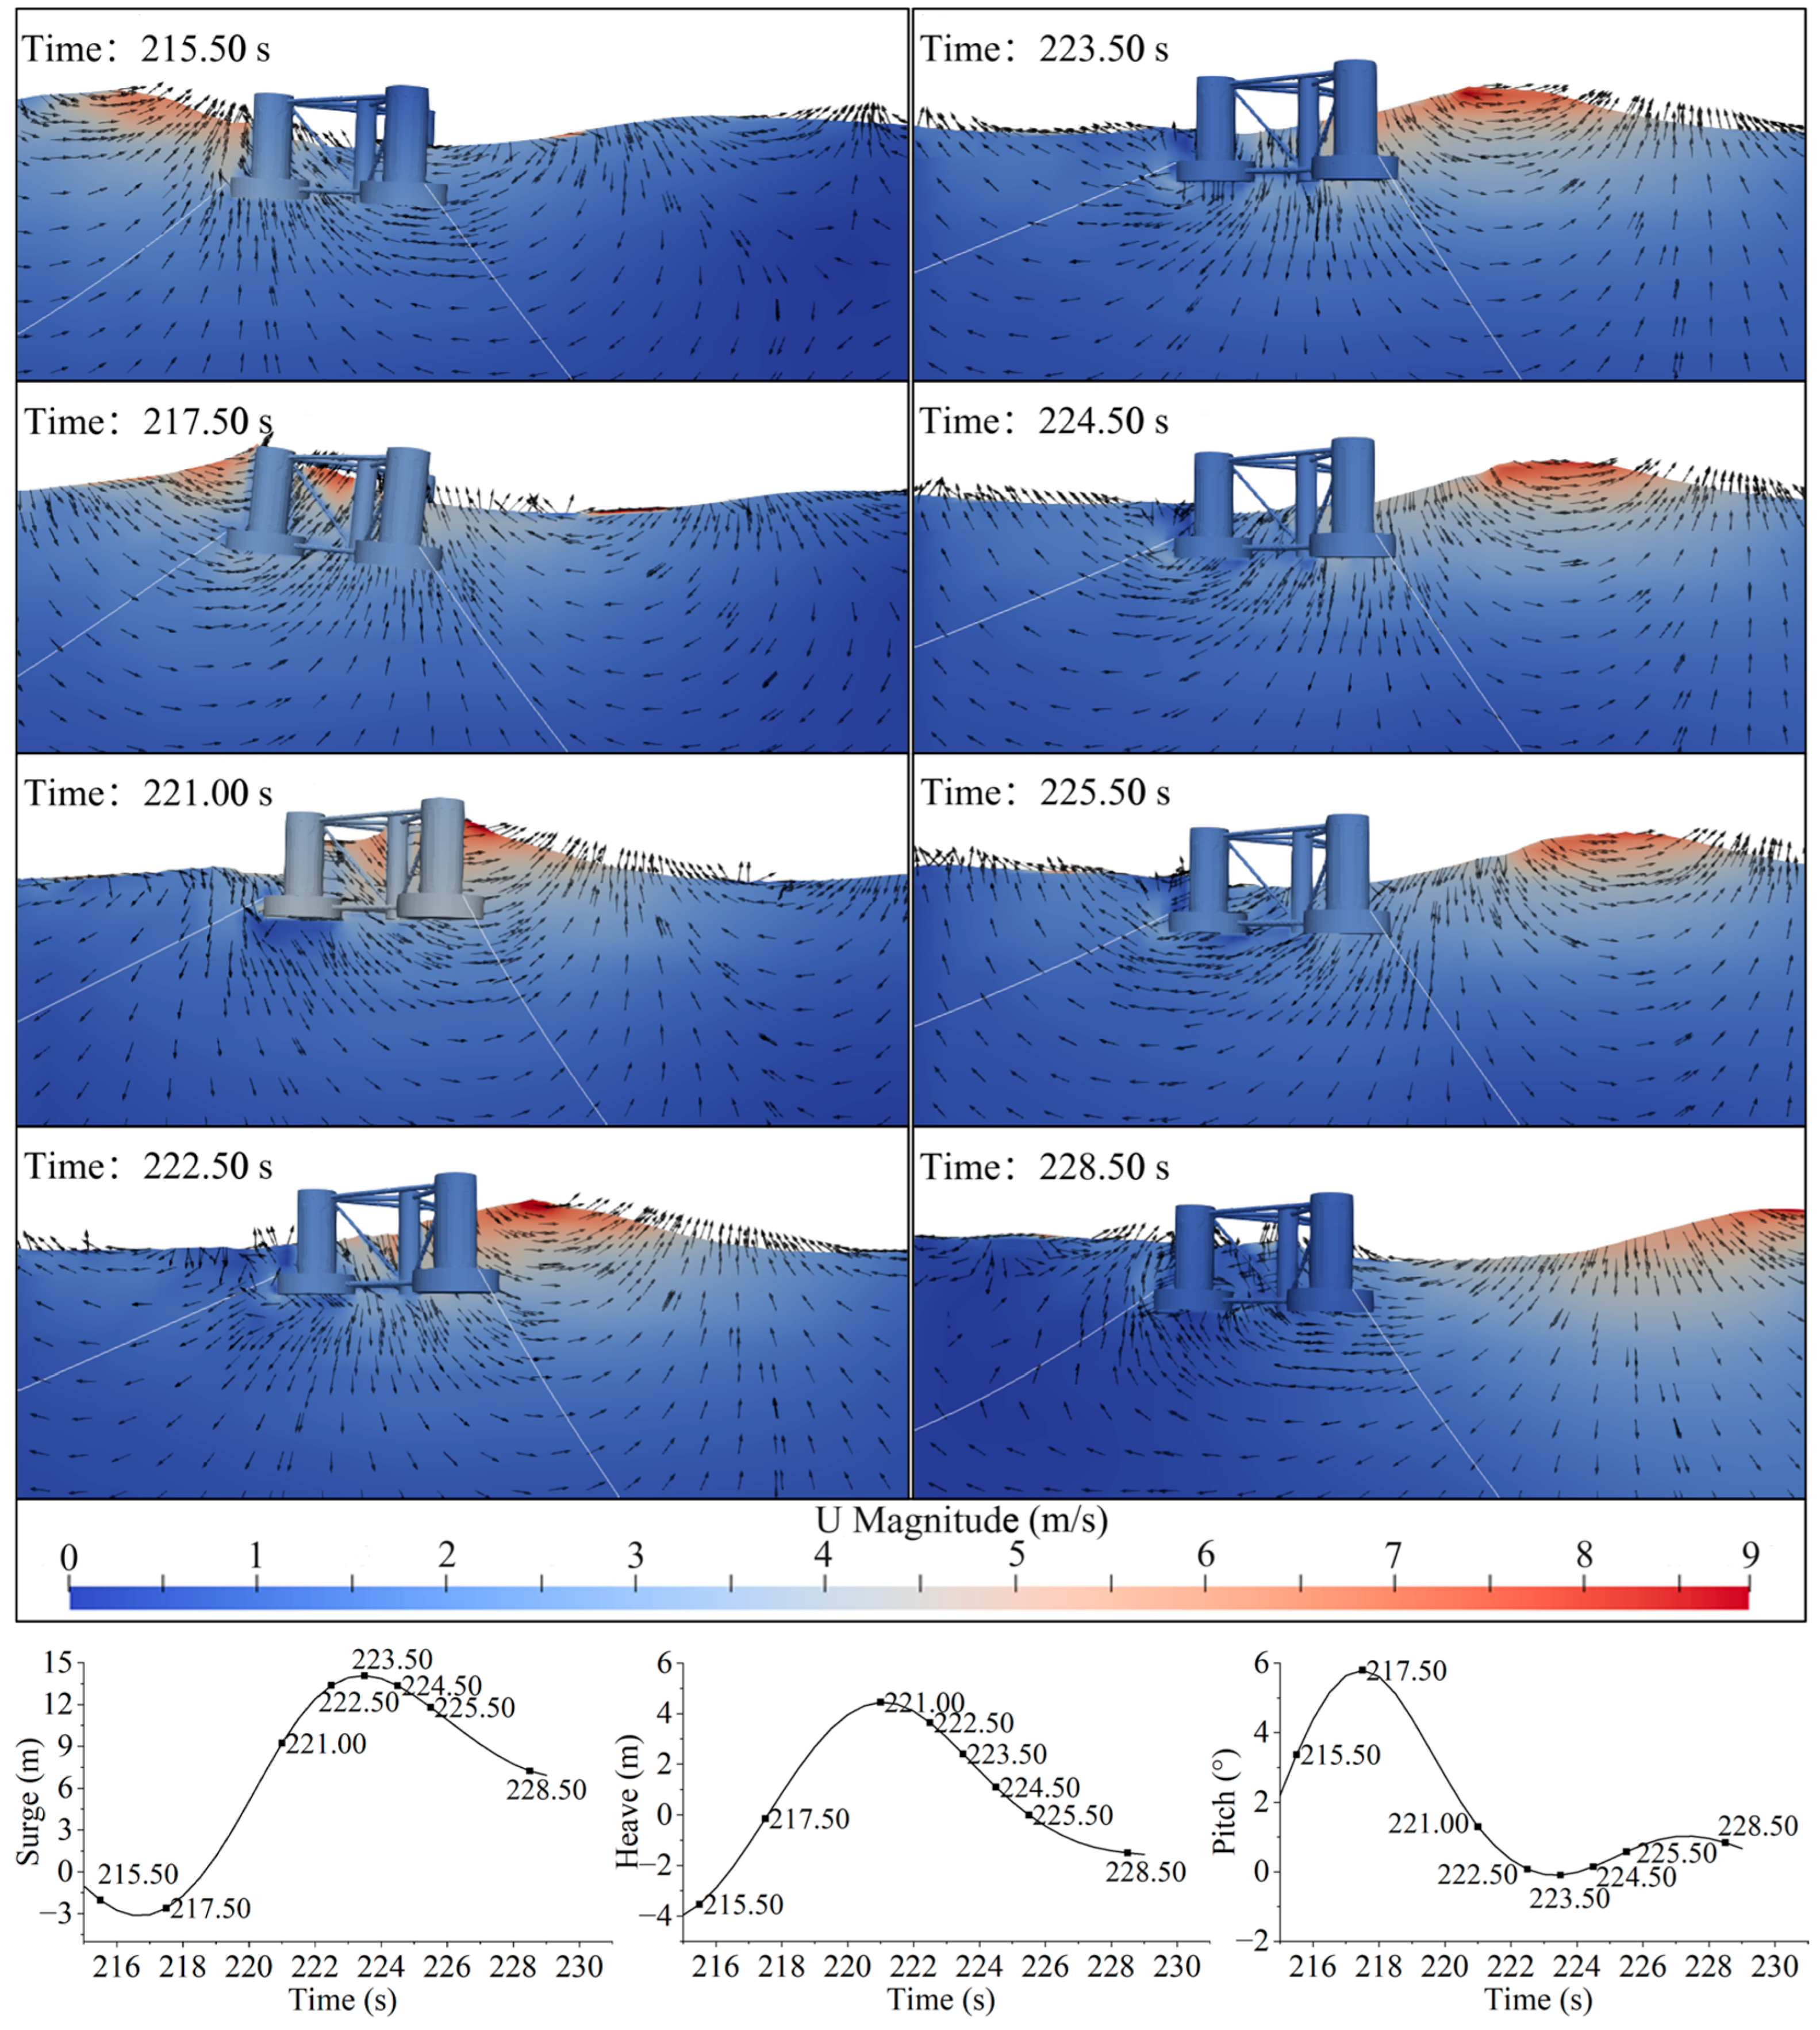
Figure 9 illustrates the evolution of wave profiles and flow field characteristics at key time steps, along with the platform’s motion response under rogue wave conditions. As the rogue wave approaches, a sharp rise in the local free surface occurs due to concentrated wave energy, leading to a sudden change in loading conditions on the platform.
The analysis proceeds as follows: at t = 215.5 s, the crest of the rogue wave reaches the front of the platform, causing a rapid increase in water level and triggering a pronounced heave motion. The wave impact also induces significant surge and pitch responses. Notably, at t = 217.5 s, the pitch angle reaches its maximum, indicating the moment of full wave-structure interaction. By t = 221 s, the wave crest has completed its interaction with the platform. During this phase, both heave and pitch reach peak values, signifying substantial energy transfer from the focused rogue wave to the platform. This energy concentration results in maximum dynamic response and represents the highest wave load condition. At t = 222.5 s, most of the wave peaks have already crossed the platform, leading to a gradual reduction in heave and surge motions. However, due to significant horizontal velocity components, the surge continues to intensify even after the crest has passed. By t = 223.5 s, the rogue wave crest has fully cleared the platform.
Subsequently, the following wave trough begins interacting with the platform. At t = 224.5 s, as the free surface drops, the platform exhibits a noticeable downward response, with heave and pitch motions occurring in the opposite direction to those triggered by the crest. Here, the motion of the platform is influenced by both the rogue wave trough and mooring system, resulting in a new trend of motion reversal in heave and pitch. At t = 228.5 s, the direct interaction between rogue wave trough and platform concludes.
4.2. Motion and Tension Responses Caused by the Rogue Wave
To quantify the effects of rogue wave crests on platform motion, numerical results are systematically analyzed and compared with platform responses under without the rogue wave peak (referred to as peak-clipped rogue wave) using the same significant wave height (6.90 m) but lower peak amplitude (3.88 m). The comparison between the rogue wave and the peak-clipped rogue wave is conducted to isolate the effect of the rogue wave crest on platform motion by eliminating the influence of background waves. A similar study was conducted by Deng et al. [
45]. Different background wave fields may cause variations in the platform’s motion state before and after the crest impact. By using the same background wave conditions, these factors can be excluded to better evaluate the isolated impact of the rogue wave crest. The rogue wave is generated at a 0° incident angle, directly impacting the platform’s central column, simulating the most extreme loading scenario.
Figure 10 illustrates the wave evolution, showing that at
t = 200 s, rogue and peak-clipped rogue waves start to diverge, and by
t = 220 s, the rogue wave reaches its peak, significantly exceeding the peak-clipped rogue wave in height and impact force. At this moment, the platform experiences its strongest excitation, with severe dynamic motion. After
t = 230 s, the rogue wave gradually dissipates, and its waveform converges toward the peak-clipped rogue wave.
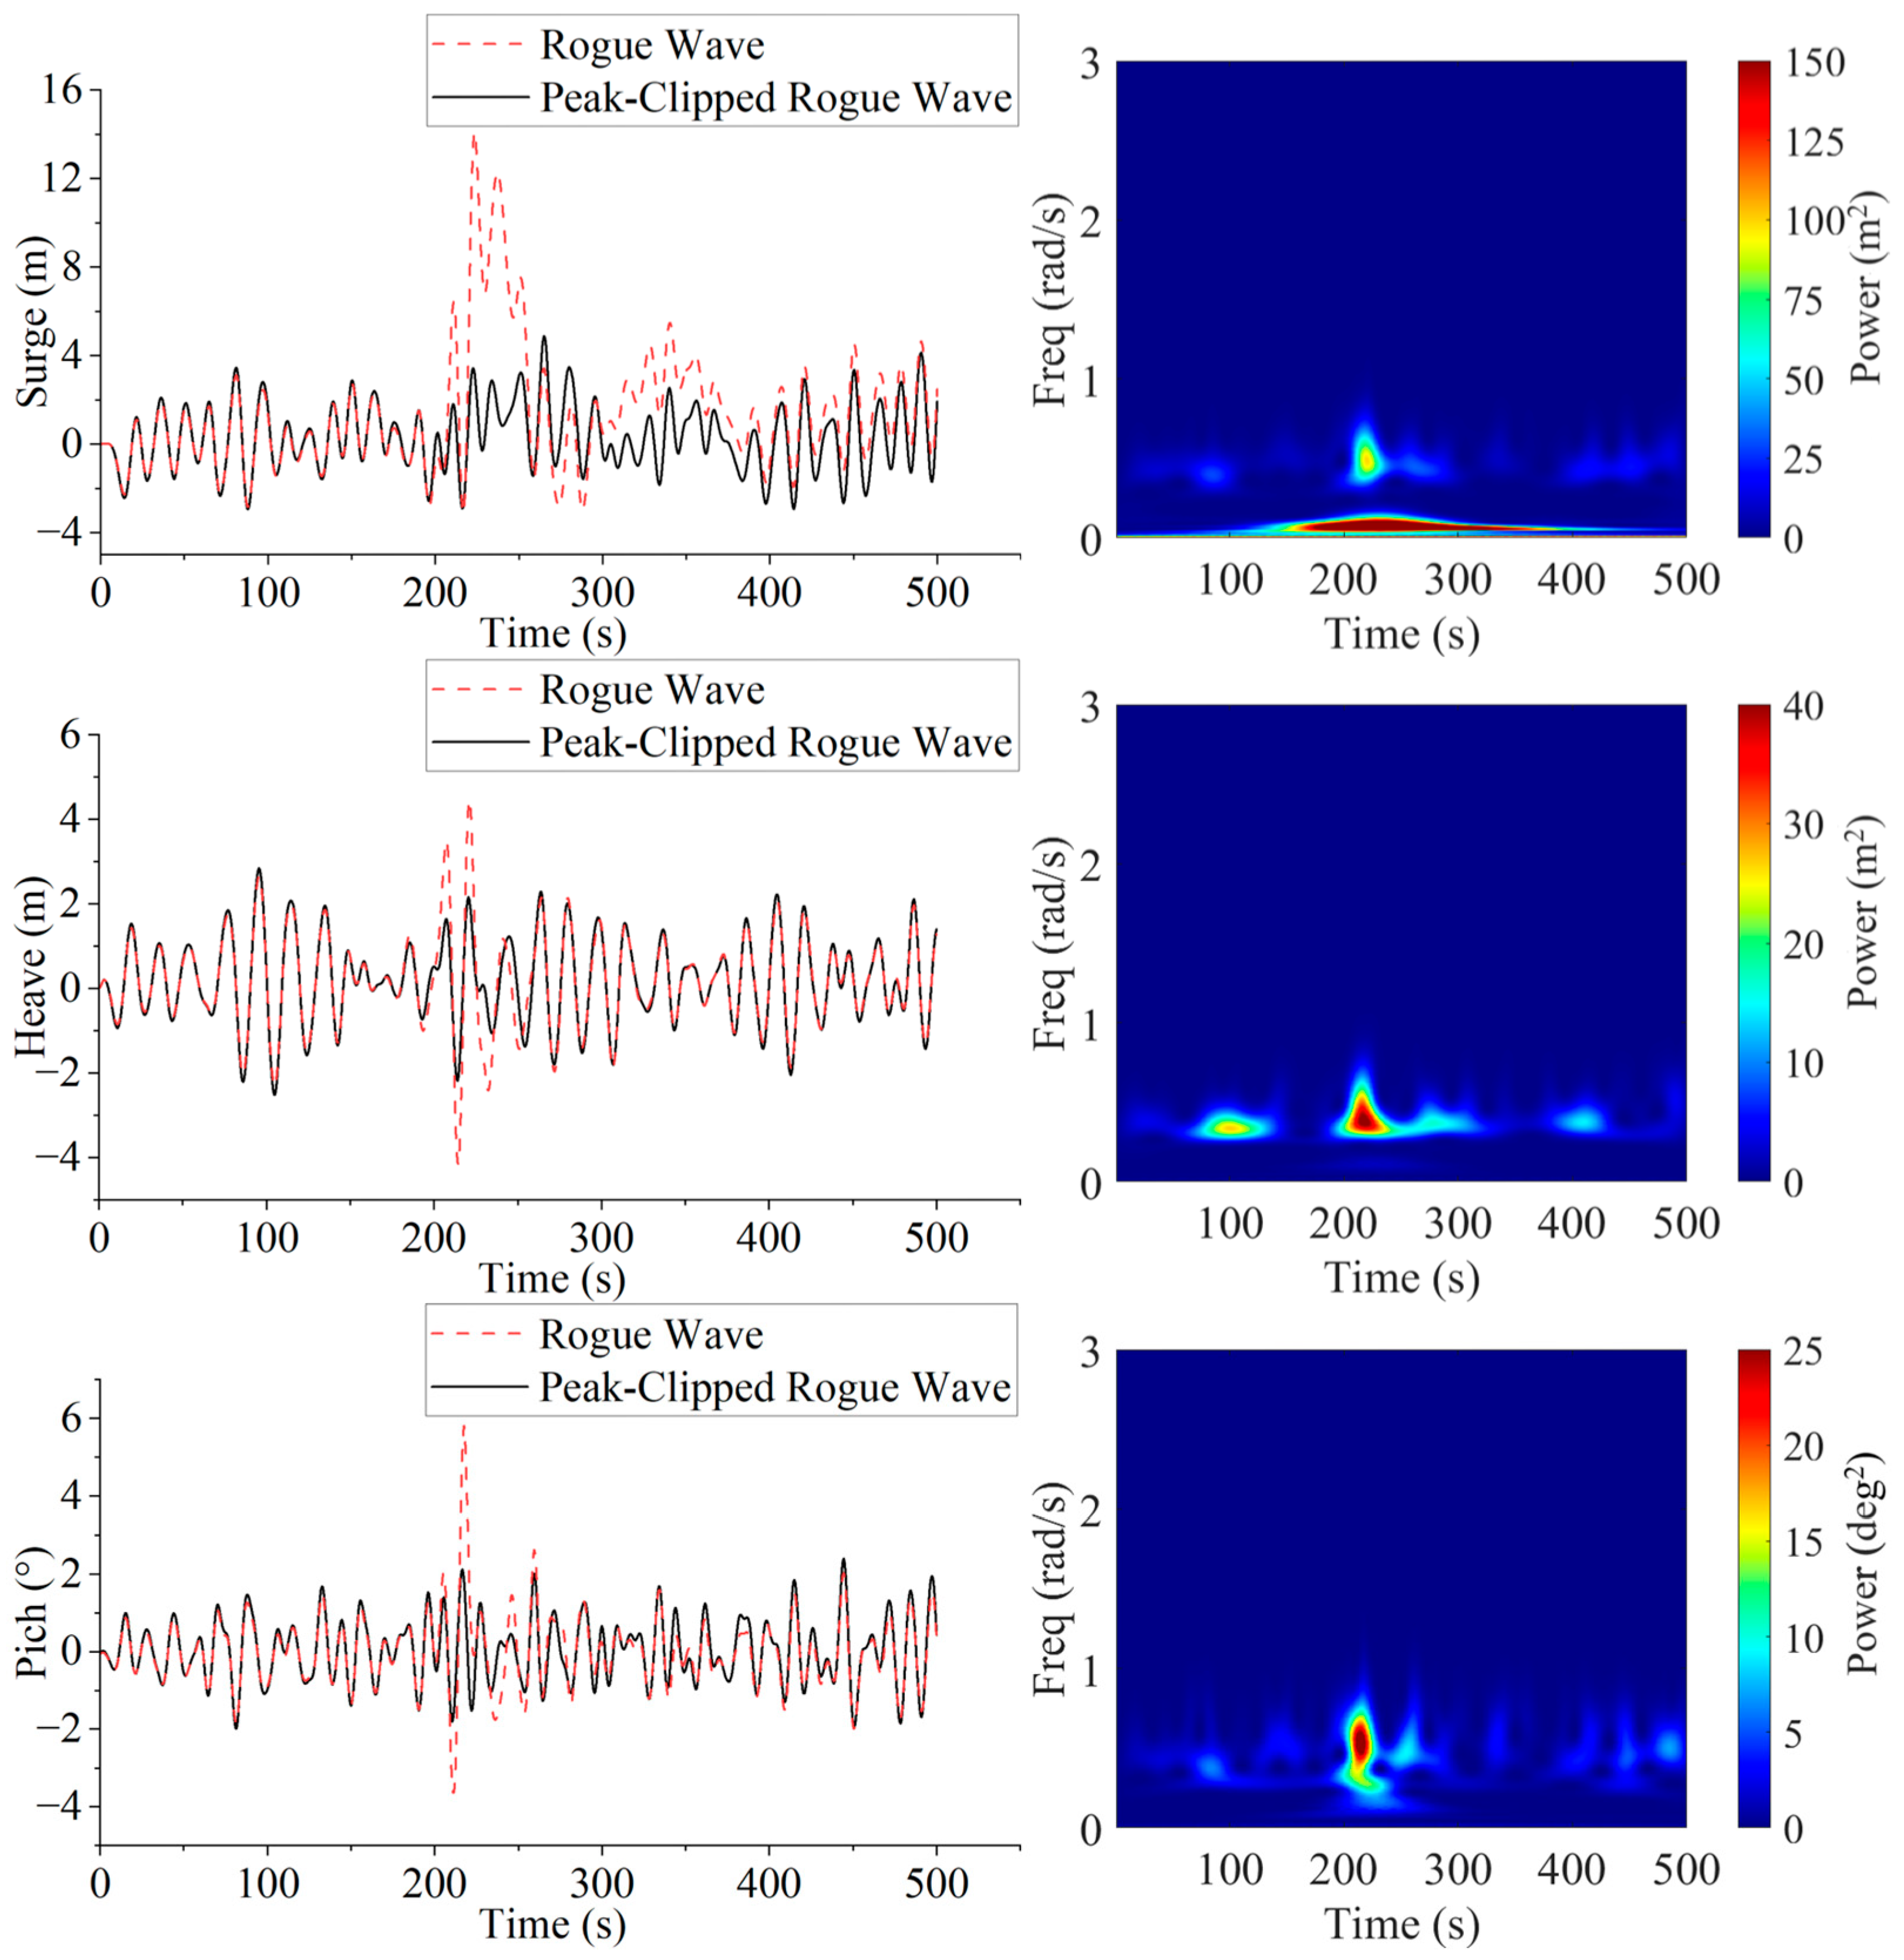
Figure 11 compares the responses of the platform under rogue and peak-clipped rogue wave conditions. Wavelet power spectrum analysis is also conducted to study the platform’s responses under rogue wave conditions. The results indicate that rogue waves strongly amplify platform motion across all degrees of freedom. The wavelet power spectrum reveals that under rogue wave conditions, the platform’s motion exhibits highly localized energy across all degrees of freedom, with minimal energy distribution at elevated frequencies. Along the surge direction, the platform undergoes the most extreme response, with peak displacement occurring at
t = 223.5 s, far exceeding that under peak-clipped rogue waves. Simultaneously, owing to the offset of the platform, the wavelet power spectrum indicates that the energy is concentrated in the vicinity of extremely low frequencies. This highlights the stronger horizontal impact forces from rogue waves, inducing greater forward-backward motion and significant drift. Over time, surge motion gradually attenuates, stabilizing at a level comparable to the peak-clipped rogue wave scenario.
In the heave direction, rogue waves also generate intense vertical motion. Around t = 221 s, as the rogue wave crest passes, heave amplitude increases sharply, exceeding the response under peak-clipped rogue waves. This suggests that the concentrated energy released by the rogue wave severely affects vertical stability, leading to violent up-and-down oscillations, which may compromise the platform’s overall safety. Similarly, pitch motion is significantly influenced, with a peak pitch angle at t = 217.5 s, far exceeding that of the peak-clipped rogue wave case. The enhanced pitch response indicates stronger forward-backward tilting effects, which could impose additional complex loads on the tower and upper structures, affecting the operational safety of platforms.
Overall, rogue wave crests have a profound impact on platform motion. Compared to the peak-clipped rogue wave scenario, peak surge and pitch responses increase by 4.0 and 2.7 times, respectively, while heave amplitude doubles. The higher crest elevation and concentrated energy of rogue waves significantly amplify the platform’s dynamic response, subjecting both the platform and mooring system to extreme loads. Across all degrees of freedom, rogue waves induce greater oscillation amplitudes, with motion responses reaching critical levels during crest impact. This underscores the severe influence of rogue waves on platform structural safety, motion behavior, and mooring system integrity.
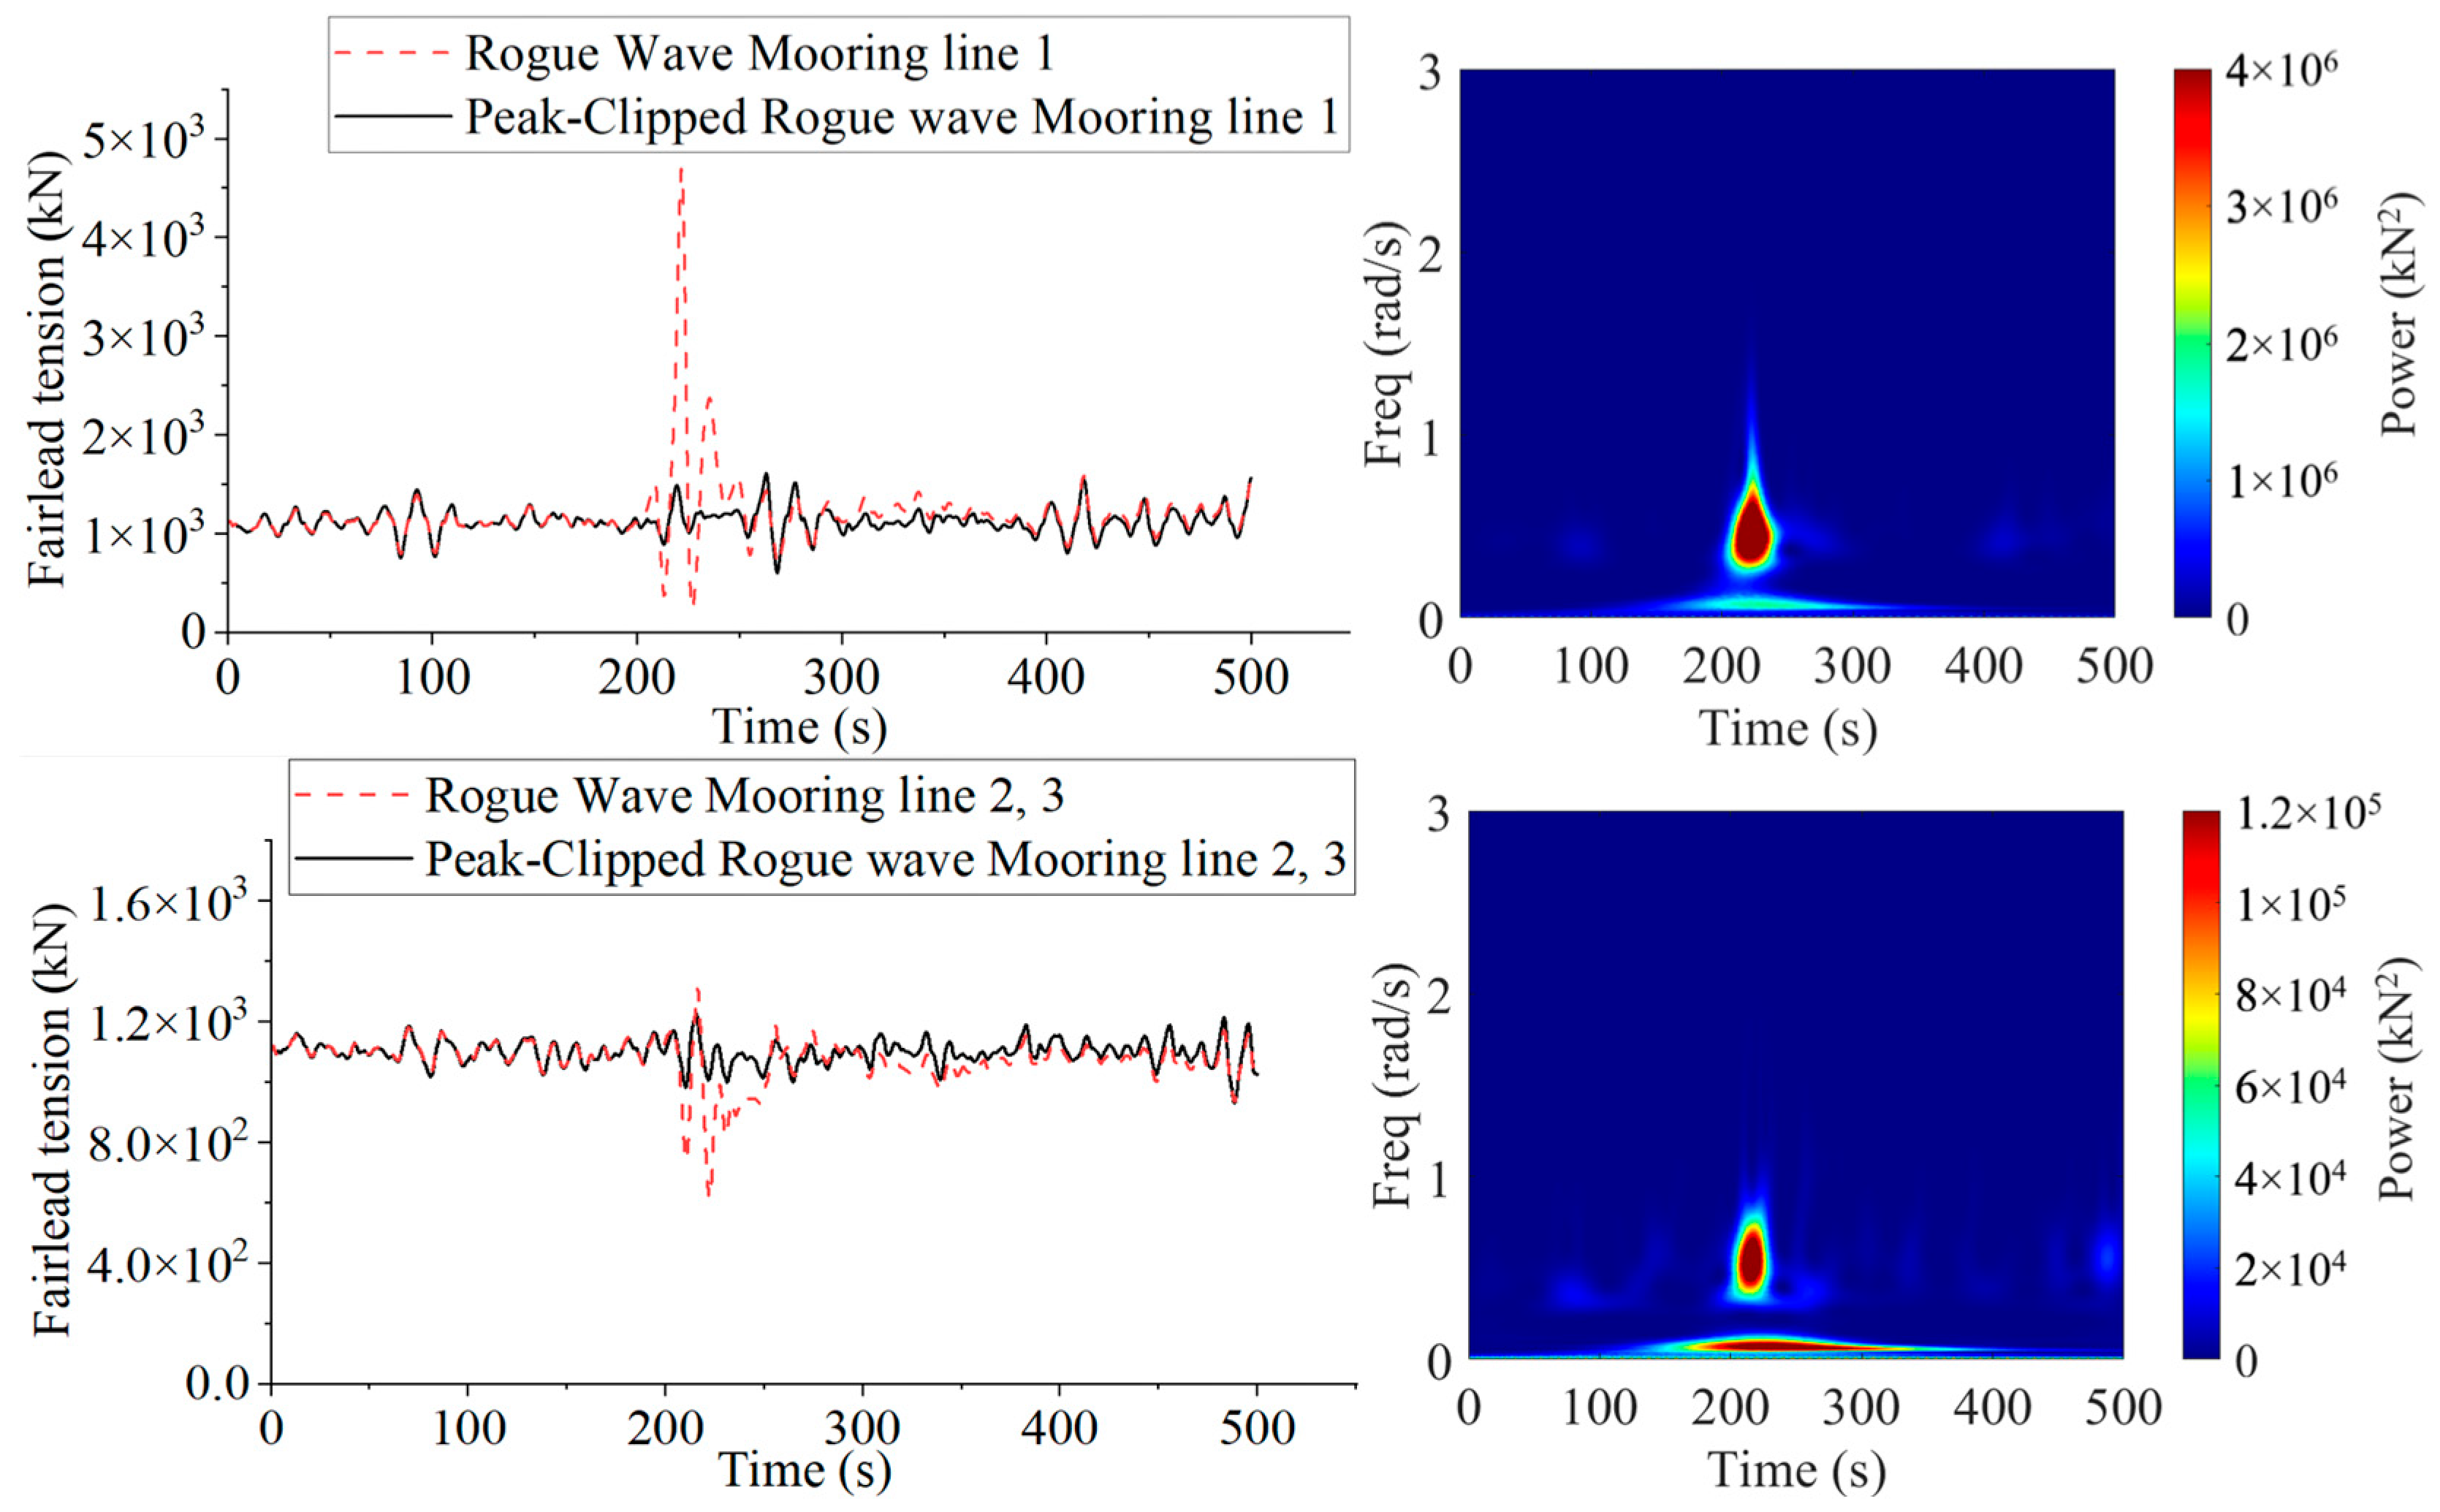
Additionally, rogue waves significantly alter mooring system loads.
Figure 12 presents the mooring line tension behavior of the platform under both rogue and peak-clipped rogue wave conditions, along with the wavelet power spectrum of the tension under rogue wave impact. The results reveal distinct tension variations among the three mooring lines. During rogue wave impact, mooring line 1 experiences a pronounced tension peak, particularly when the wave crest reaches the platform, indicating that the mooring line is subjected to extreme loading. The wavelet power spectrum reveals that the mooring line tension exhibits minimal energy distribution at higher frequencies. Under rogue wave conditions, the tension in mooring line becomes highly localized. During the wave impact, the tension of mooring lines 2 and 3 decreases, indicating that the uneven load distribution caused by the rogue wave affects the overall platform motion characteristics.
Compared to peak-clipped rogue wave conditions, rogue waves induce more intense and erratic mooring line tension fluctuations, with higher peak values, highlighting their greater impact on mooring system dynamics. Notably, the effects of rogue waves persist beyond the crest impact. Because of the elastic restorative force from the mooring system, low-frequency damped oscillations continue even after the wave trough passes. These oscillations, primarily controlled by mooring system elasticity, indicate its role in stabilizing platform motion following extreme wave events. Such low-frequency damping behavior is critical to maintaining overall dynamic safety under extreme sea states.
The results demonstrate that mooring line tension increases significantly under rogue wave conditions, reaching extreme peak loads. This underscores the importance of incorporating adequate safety margins in mooring system design to withstand the extreme forces induced by rogue waves. Proper consideration of high-tension scenarios is essential to ensuring mooring system resilience and enhancing platform survivability in harsh offshore environments.
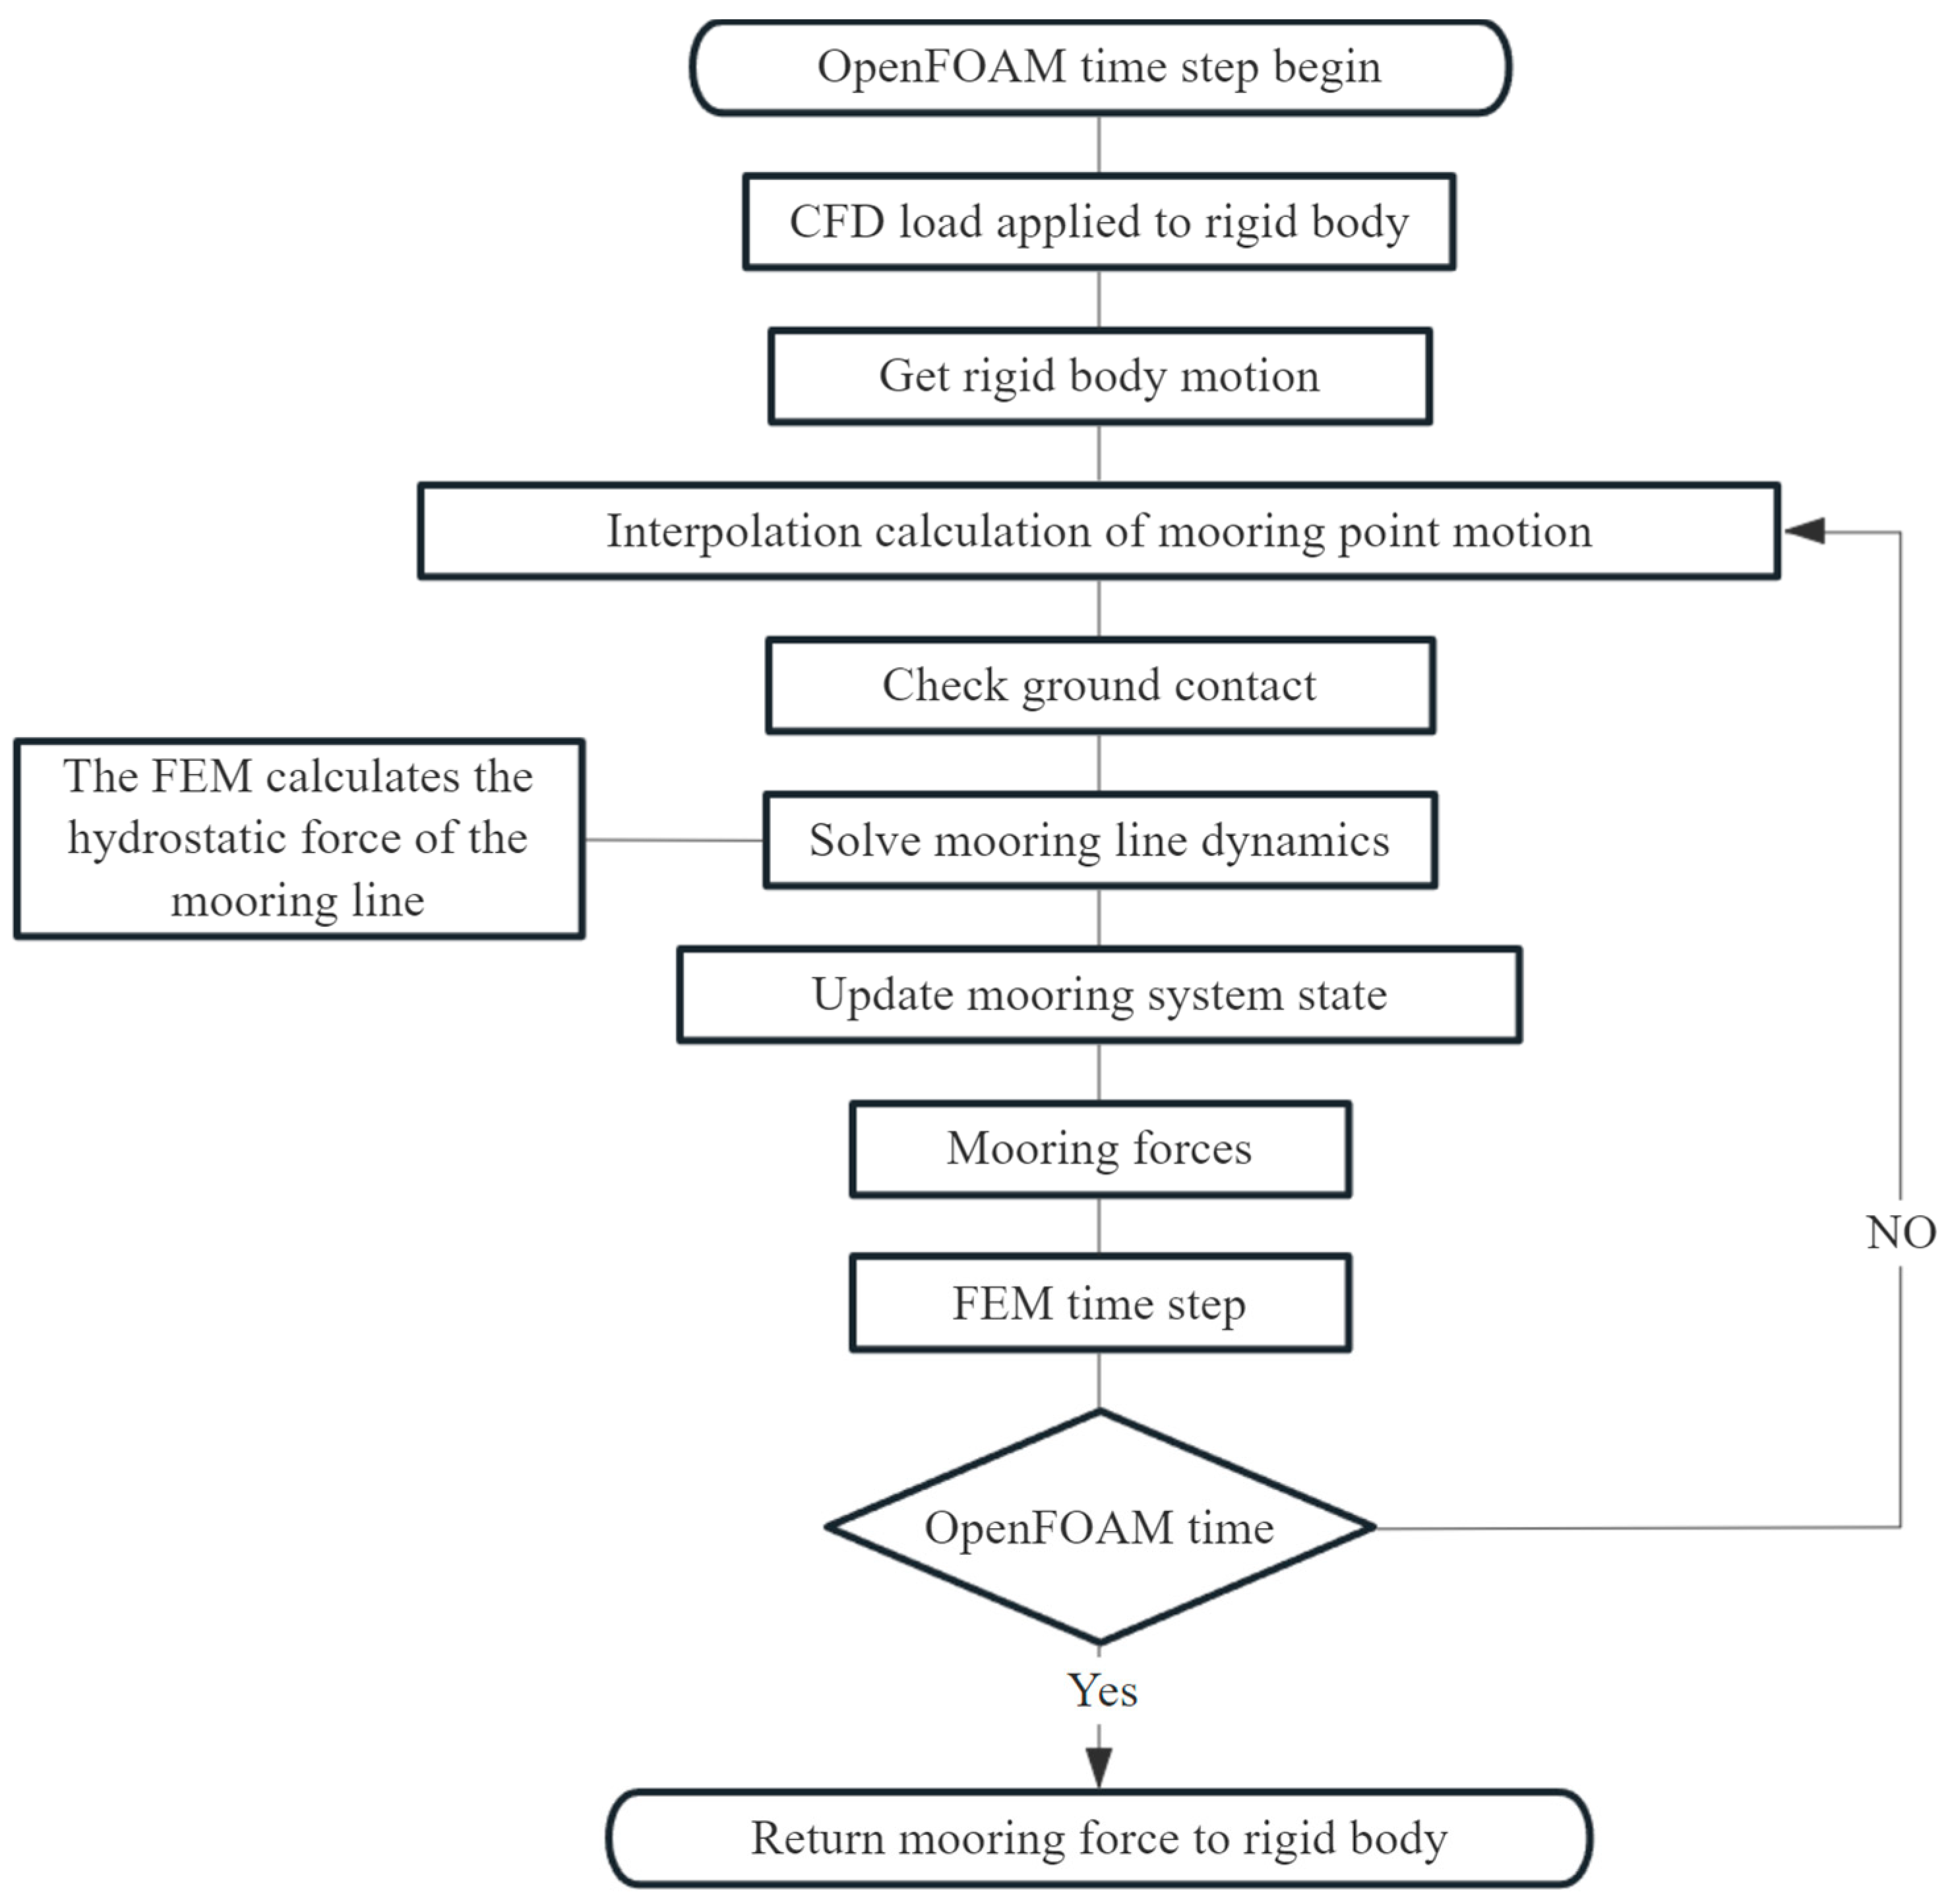
4.3. Motion and Tension Induced by Rogue Waves Using CFD-FEM and OpenFAST
OpenFOAM and OpenFAST are commonly used tools for simulating floating offshore wind turbines. OpenFAST adopts potential flow theory for hydrodynamic modeling and uses the lumped mass method for mooring analysis, suitable for global motion under normal sea states. In contrast, CFD enables a more detailed representation of nonlinear wave behavior and accurately captures the two-way interaction between waves and floating structures. It allows for the simulation of complex wave phenomena such as wave deformation and breaking, making it suitable for analyzing strong fluid–structure coupling under extreme sea conditions. It also uses high-order finite element methods such as LDG-FEM for mooring dynamics. The two tools differ significantly in wave loading methods, modeling accuracy, and application scenarios. To illustrate the differences between the coupled CFD-FEM approach and the LM-based method, this section presents a comparison of simulation results obtained using two numerical tools, OpenFOAM and OpenFAST, under identical wave conditions.
As illustrated in
Figure 13, the platform motion responses and mooring line tensions obtained from the CFD-FEM simulations are generally higher than those predicted by OpenFAST. At the beginning of the simulation, the CFD-FEM model shows a delayed response due to the time required for wave propagation from the generation boundary to the platform. In contrast, OpenFAST does not resolve wave propagation directly; instead, wave loads are applied at the platform location, resulting in a noticeably larger initial motion amplitude. After the crest of the rogue wave impacts the platform, the motion responses from the CFD-FEM model become more pronounced compared to those from OpenFAST. Notably, the surge motion response predicted by CFD-FEM is 32.31% greater than that of OpenFAST. While differences in heave and pitch are less significant, they are still observable.
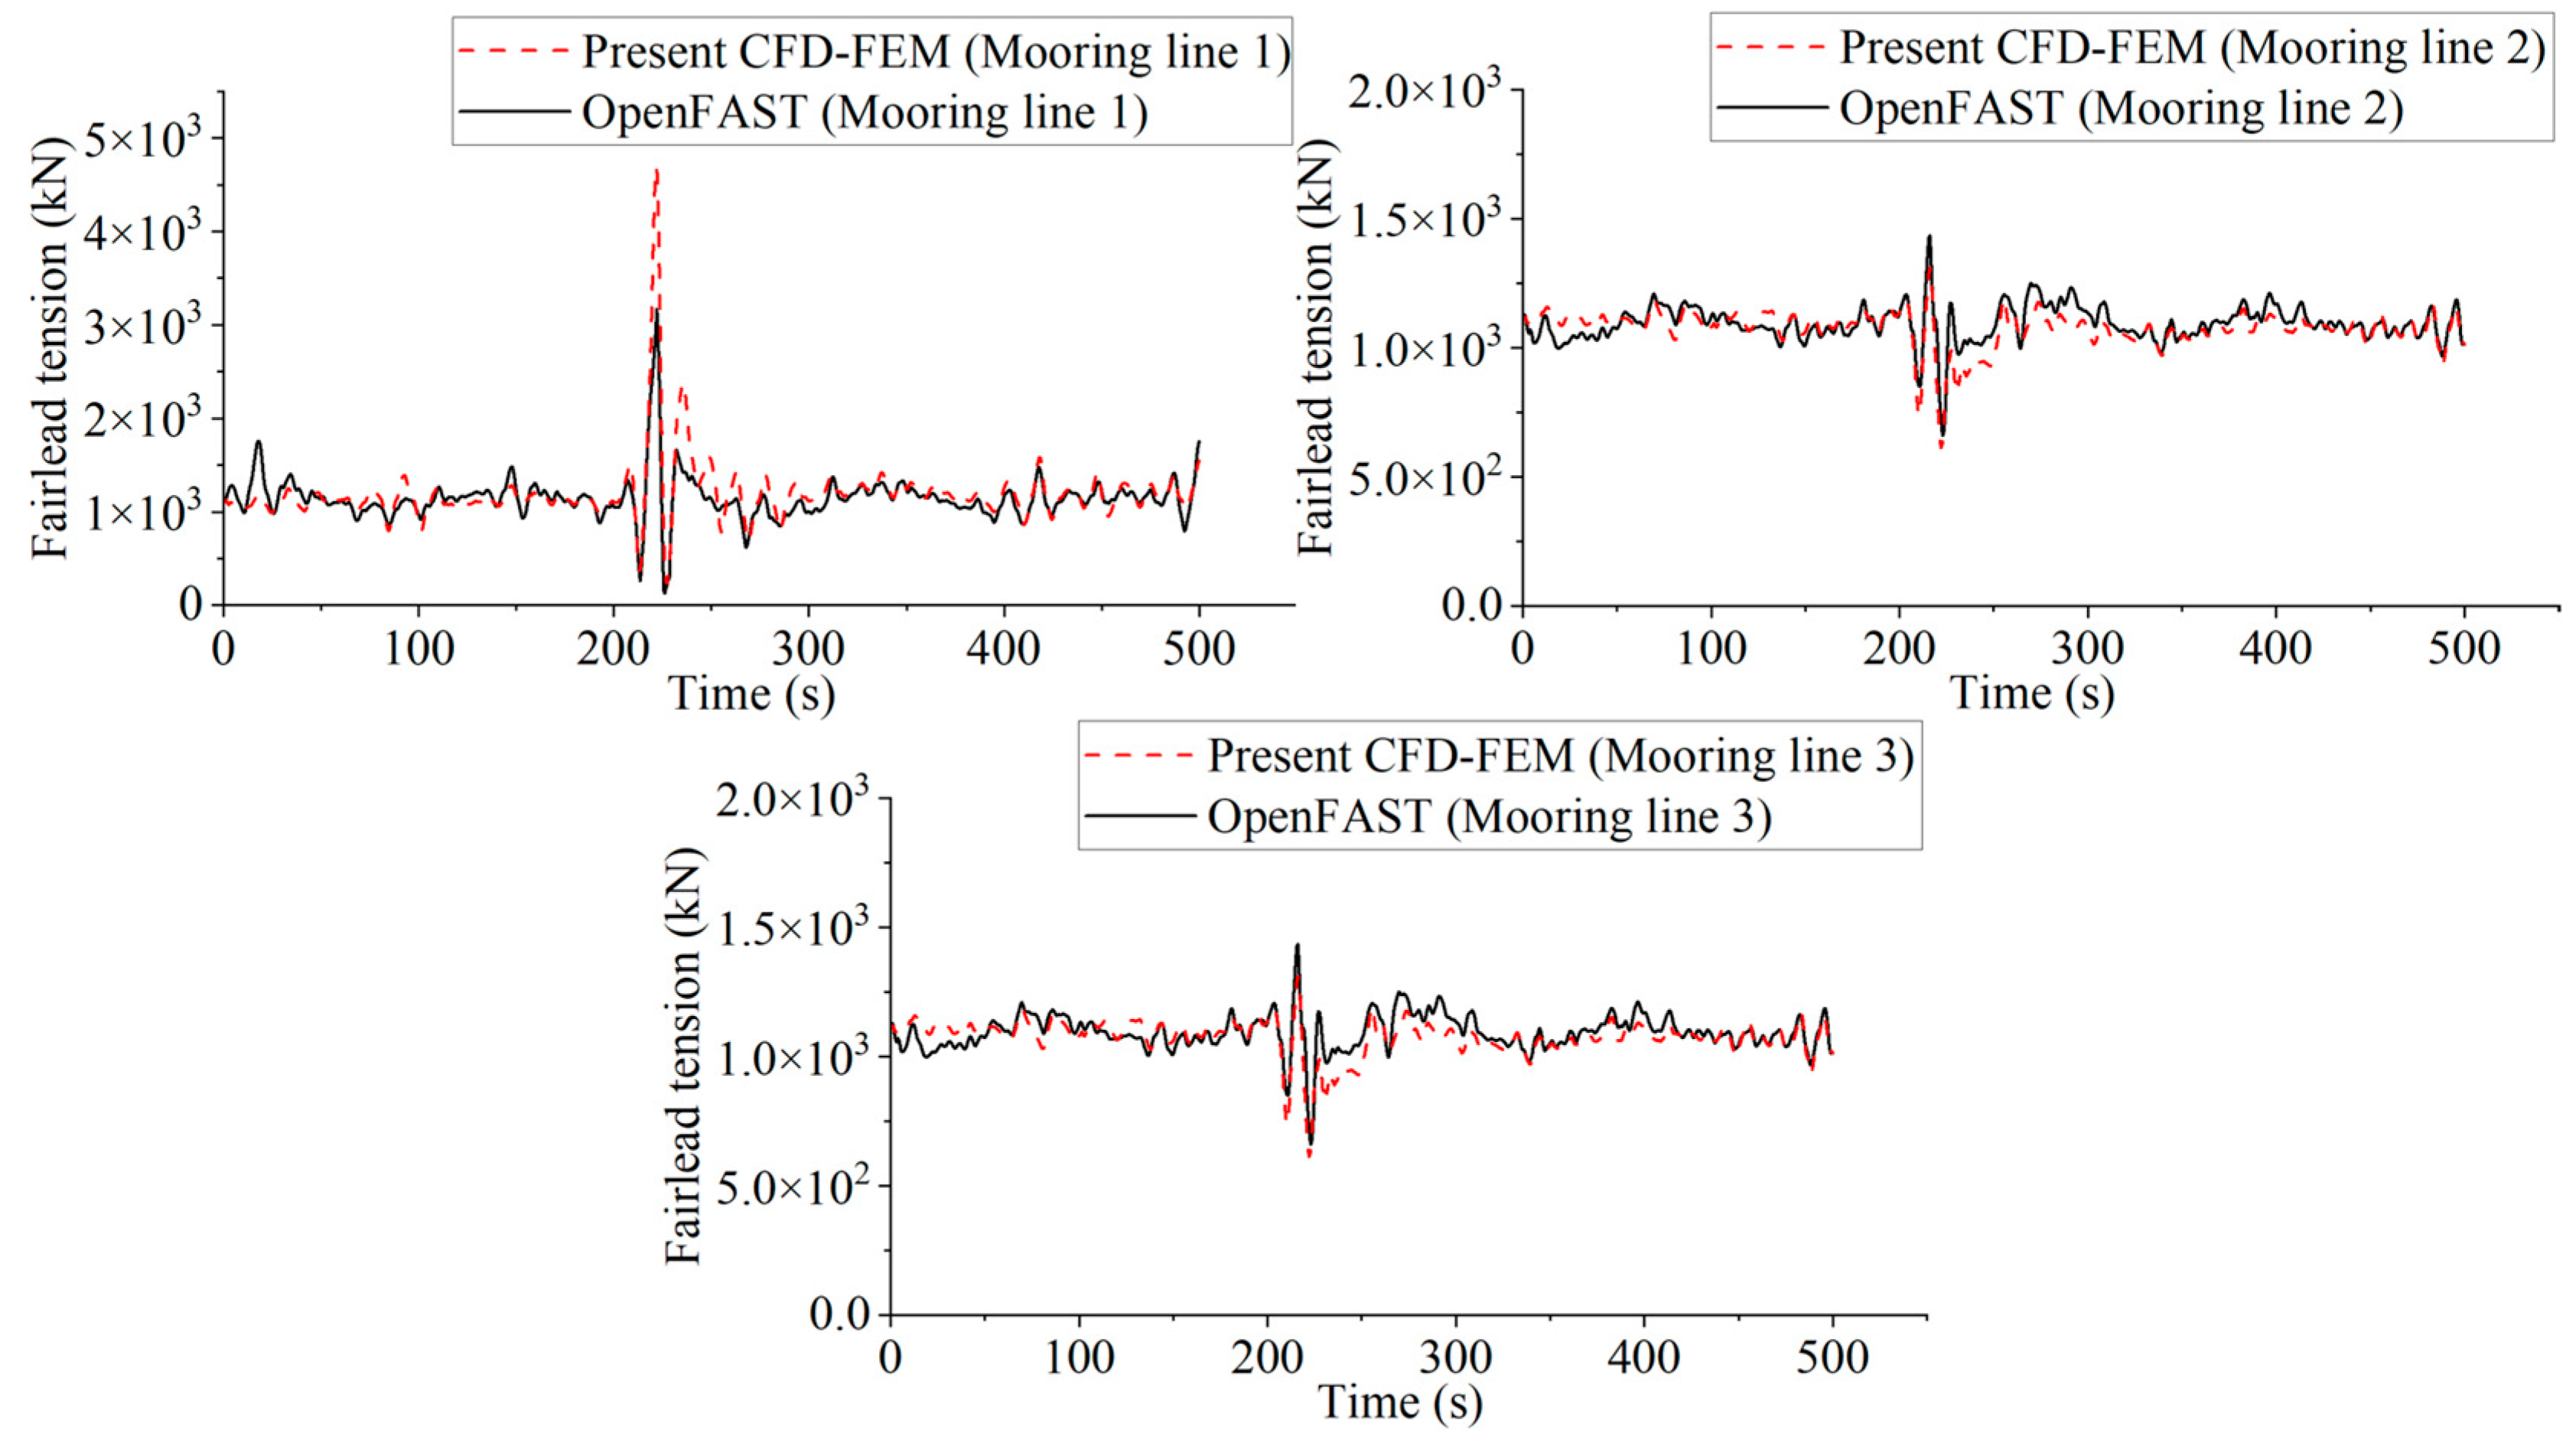
These discrepancies in platform motions lead to corresponding differences in mooring line tensions. As shown in
Figure 14, the peak tension in mooring line 1 from the CFD-FEM simulation exceeds that from OpenFAST by 32.45%. However, the tensions in mooring lines 2 and 3 exhibit only minor variations between the two approaches.
The discrepancies observed between the simulation results of OpenFOAM and OpenFAST are likely attributable to differences in their underlying modeling approaches. OpenFOAM employs CFD, while OpenFAST is based on potential flow theory. According to the findings of Li and Bachynski [
22], although potential flow theory is effective for large-scale floating structures, it lacks the capability to capture viscous effects and cannot directly simulate nonlinear fluid phenomena. In potential flow theory, wave loads are applied to the platform without resolving the actual wave propagation and interaction processes. In contrast, CFD offers a more accurate representation of fluid behavior, making it particularly well-suited for modeling fluid–structure interactions. Furthermore, CFD provides enhanced accuracy in capturing wave nonlinearity and enables two-way coupling between waves and structures. These features are especially important for analyzing sharp-crested waves and extreme wave conditions, and they may explain why the motion responses predicted by OpenFAST are generally smaller.
In addition to differences in hydrodynamic modeling between CFD and potential flow theory, the two approaches also differ in how mooring systems are represented. CFD-FEM employs a mooring model based on the LDG-FEM, while OpenFAST uses a LM method. As reported by Zhong et al. [
23], the LDG-FEM utilizes high-order finite elements and demonstrates strong capabilities in simulating transient loads and capturing nonlinear variations in mooring line tension, which facilitates the analysis of high-frequency dynamic responses. In contrast, the LM method is generally more suited to predicting global platform motions, with relatively lower accuracy in resolving localized transient loads.
As a result of the aforementioned differences in hydrodynamic and mooring system modeling approaches, the simulation results produced by the two models exhibit noticeable discrepancies. These discrepancies highlight the influence of modeling strategies on the accuracy and characteristics of dynamic response predictions. Understanding such differences is essential for selecting appropriate tools based on the objectives of specific offshore engineering applications.
5. Interaction Between Rogue Waves and Different Mooring System Models
Previous studies have explored mooring design schemes, and numerous design schemes have been proposed. However, only a limited number of investigations have assessed the effectiveness of these mooring design schemes under extreme wave conditions, particularly in determining which schemes perform best. Typically, mooring system designs are based on standard operating conditions, with insufficient consideration of extreme environmental loads. This section focuses on evaluating the performance of various mooring configurations under the impact of rogue waves, analyzing platform motion behavior and mooring line tensions to assess their reliability and effectiveness in such severe conditions.
5.1. Description of the Mooring Model
Based on the previous discussion, it is clear that rogue waves significantly impact the platform’s safety, especially with regard to mooring line tension. The intense fluctuations caused by the waves can lead to excessive mooring line tension, potentially causing mooring line breakdown and disrupting the platform’s operation. To reduce platform motion and improve the safety factor of the mooring system, this section proposes four different mooring design schemes. The platform’s physical parameters, including its weight, remain consistent across all mooring design schemes. The different weights of the mooring chains are taken into account during the simulations, leading to a different draft of the platform. The specific design plans are as follows:
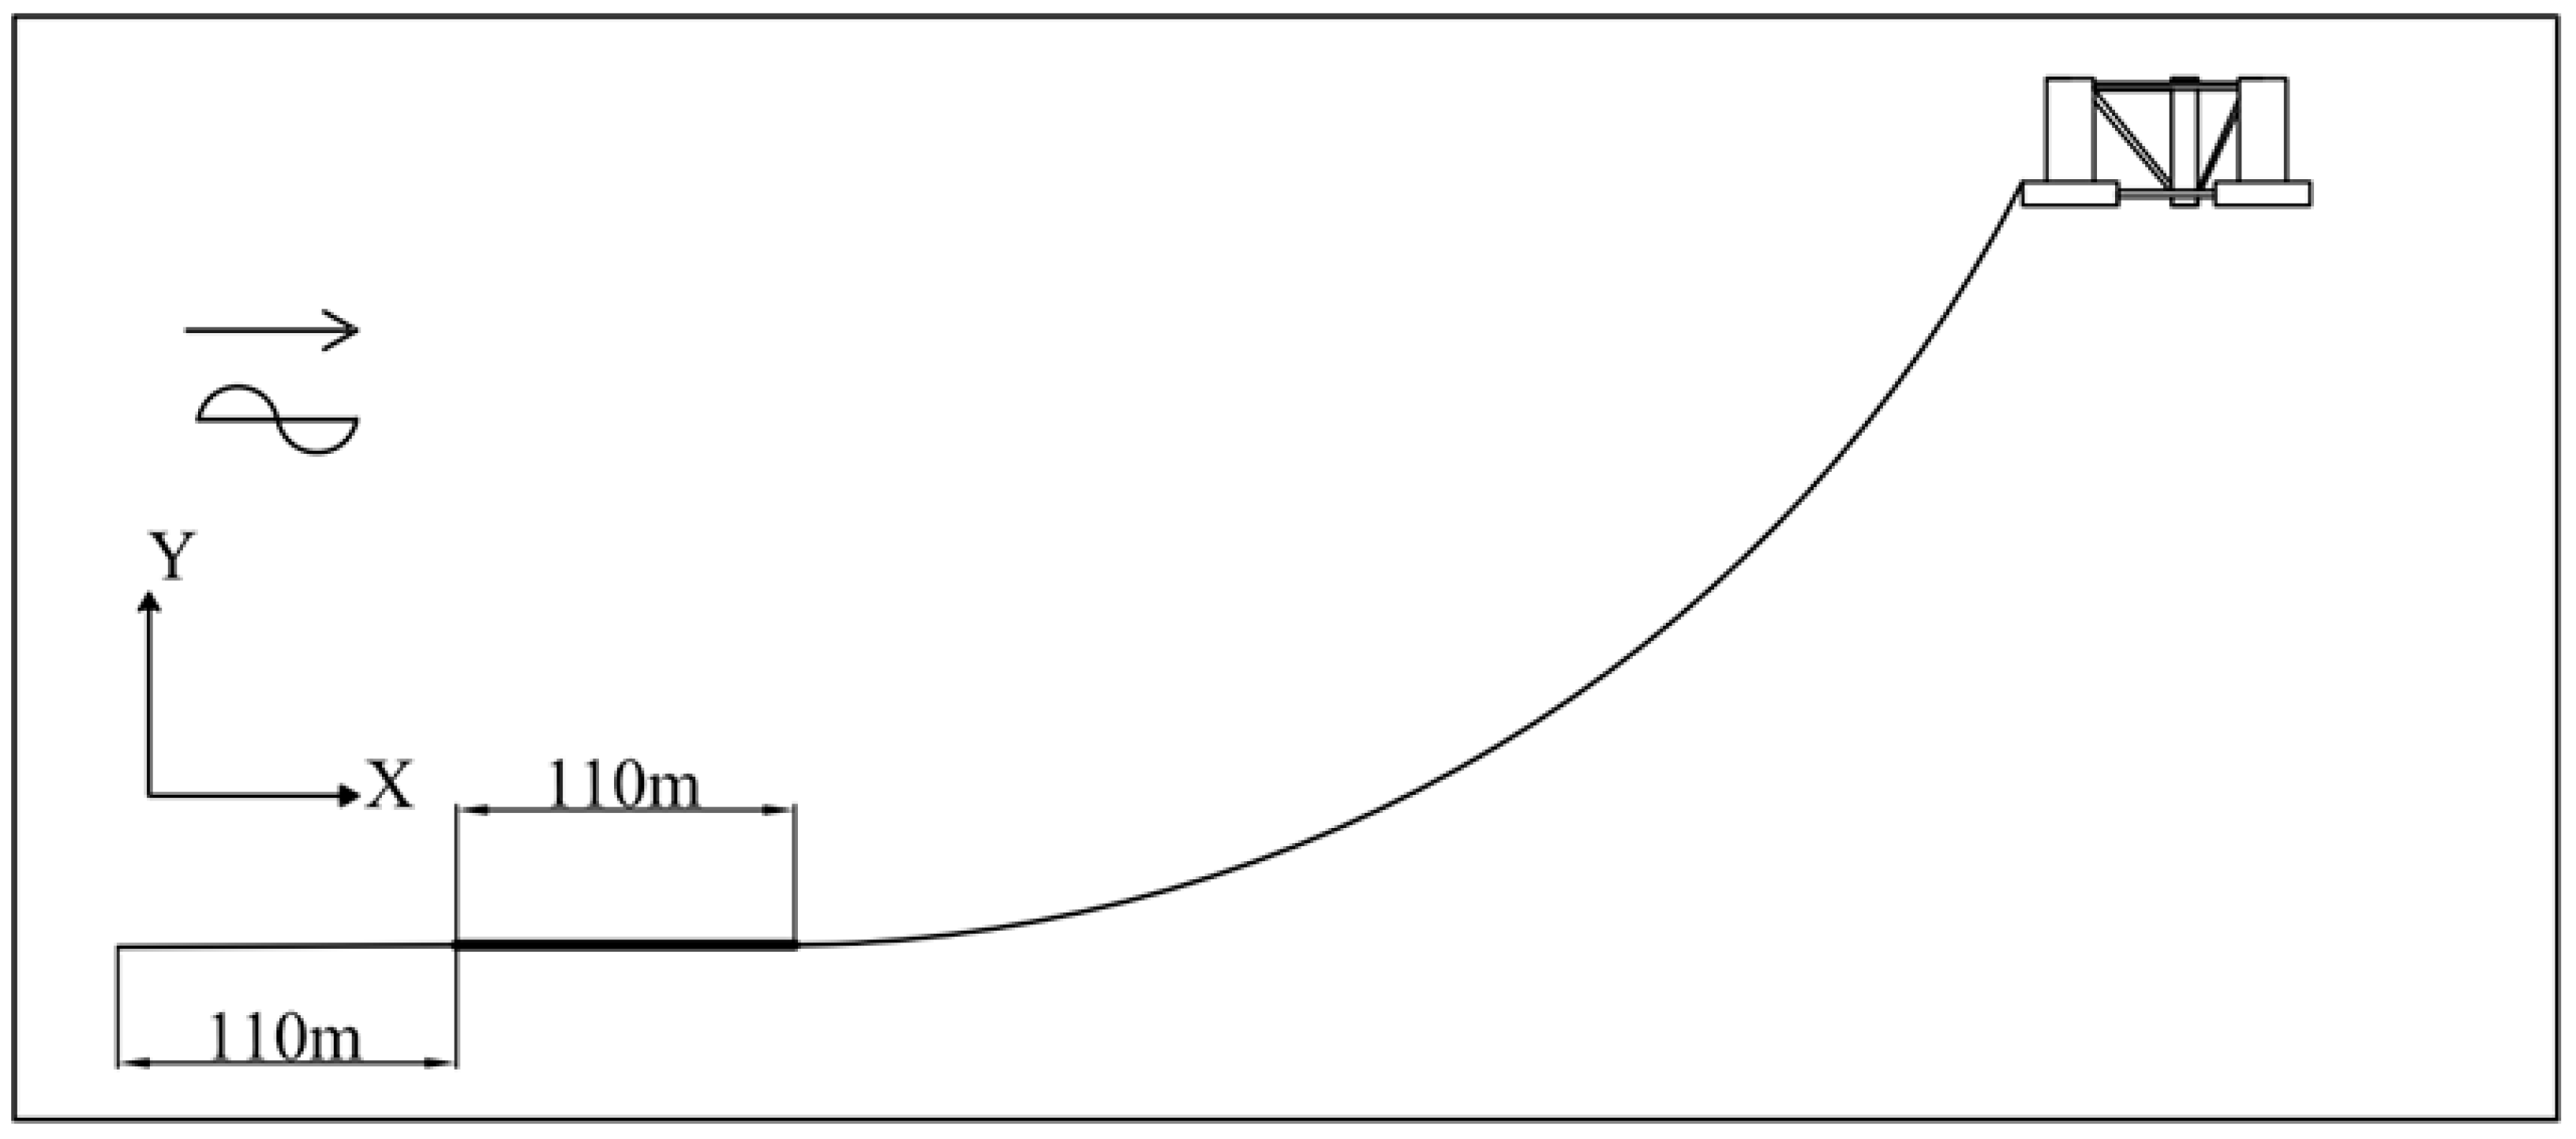
Model 1: This configuration adds a heavy chain segment to each mooring line [
12]. The length of the heavy chain is 110 m, and the unit weight in air is 454.55 kg/m (as shown in
Figure 15). Aside from the heavy chain segment, other parameters, such as the fairlead, anchor point setup, and the number of mooring lines remain unchanged from the original model.
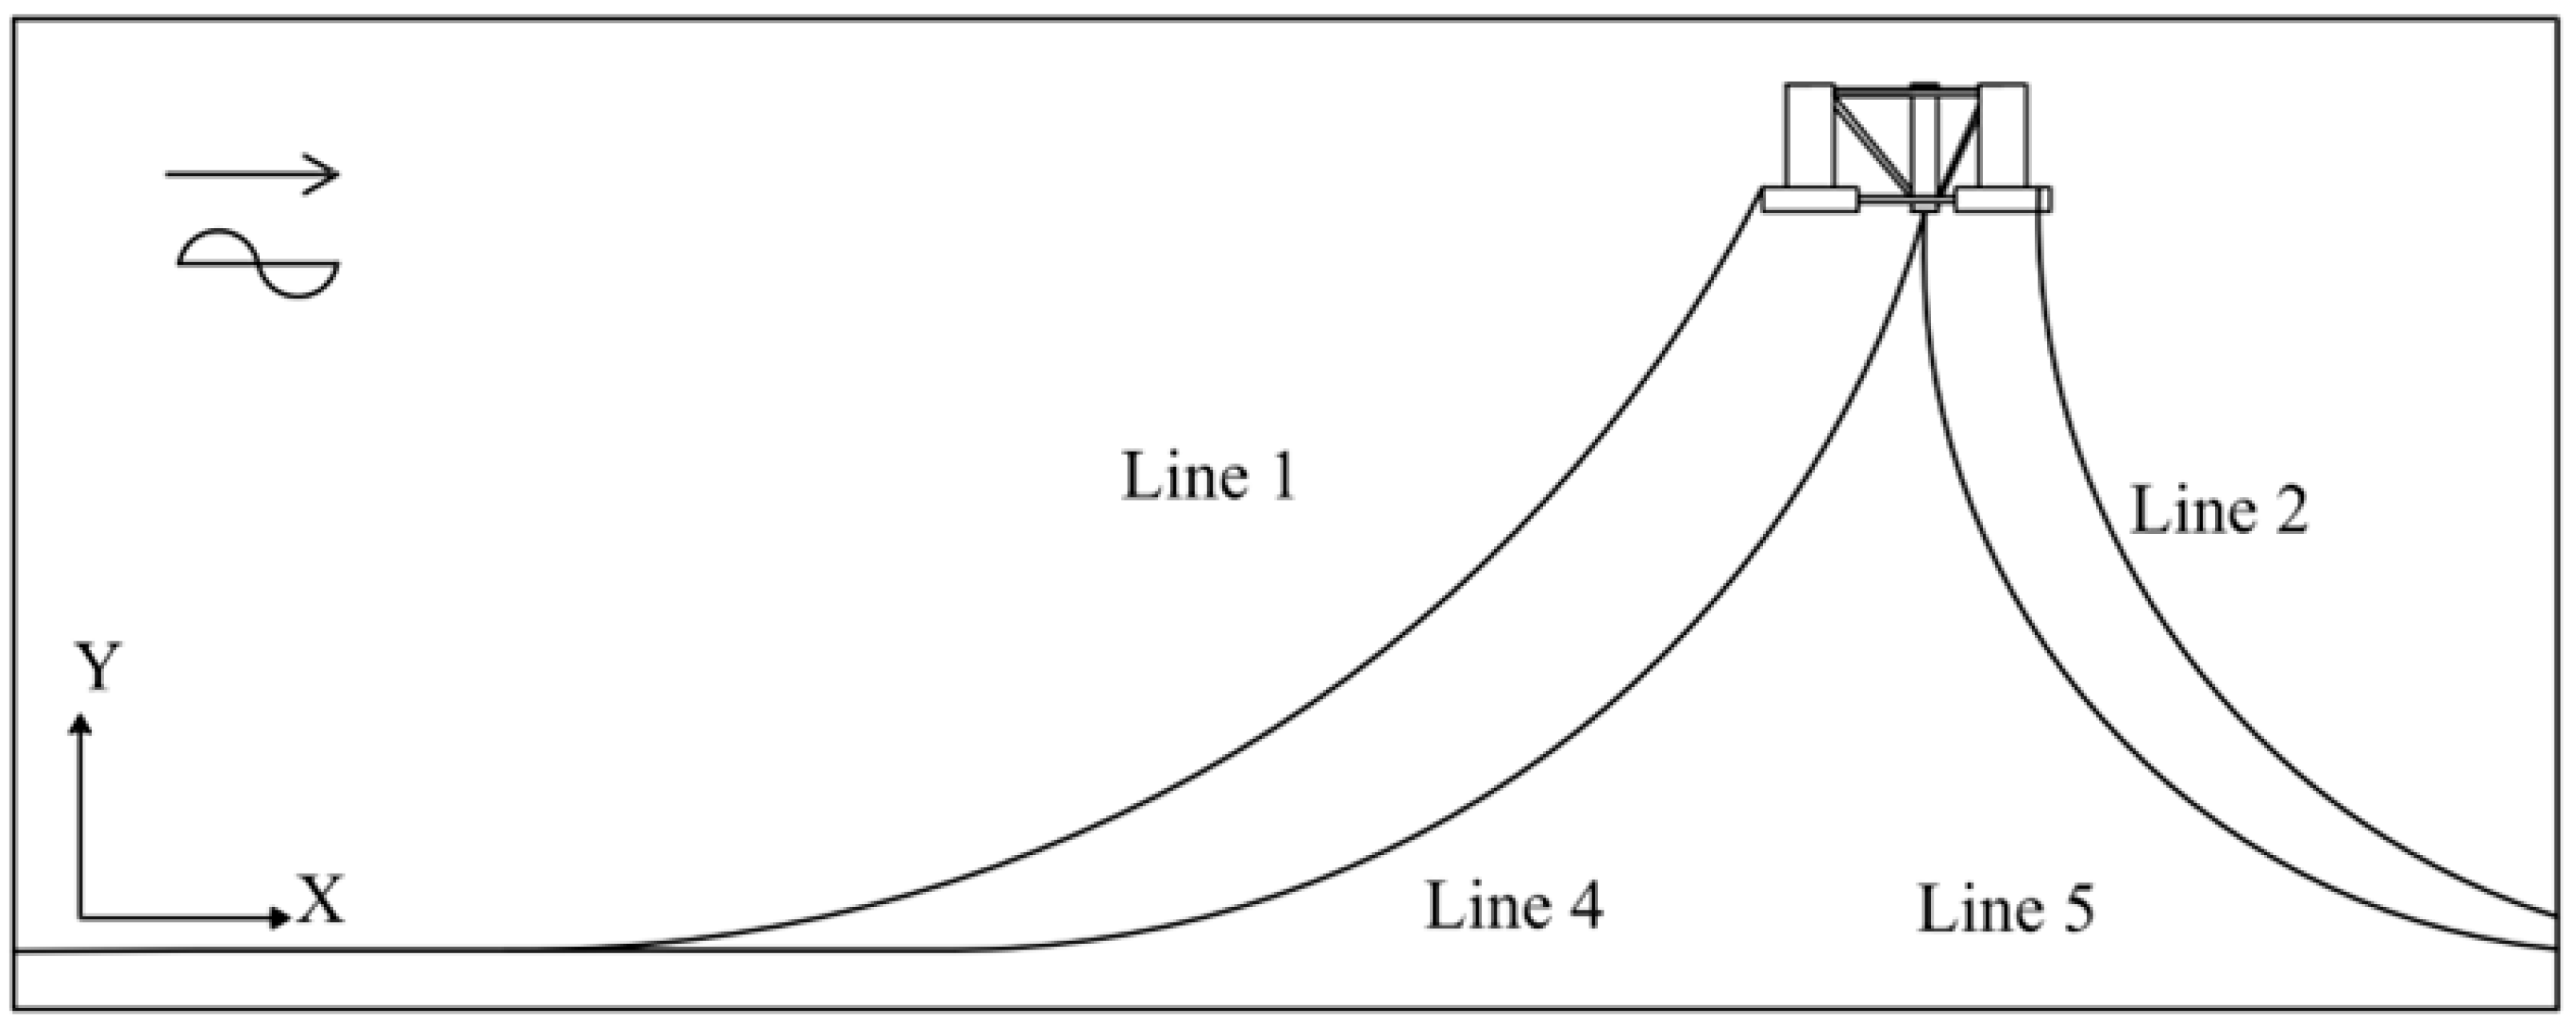
Model 2: In the original model, the fairlead for the mooring lines is located at the top of the foundation column. Model 2 enhances this system by adding three additional mooring lines [
16]. In addition to the initial mooring line, extra mooring lines are installed at the base of the central column, beneath the average water level. These extra mooring lines are anchored via single-point mooring, fixed at the base of the central column (0, 0, 0).
Figure 16 shows the side view of the platform, highlighting the original mooring lines 1 and 2 (mooring line 3 is not shown) along with the newly added mooring lines 4 and 5 (mooring line 6 is not shown). Other design parameters are the same as the original system.
Model 3: This model optimizes the original mooring system by adding three mooring lines and adjusting the angle between the anchor points of two mooring lines to 30° and 60°, respectively [
15].
Figure 17 illustrate the schematic of Model 3. All other parameters of the mooring lines are consistent with the original model.
Model 4: In the original mooring system, mooring lines with a diameter of 76.60 mm are used. In order to study the effect of mooring line diameter on platform movement and mooring tension, this model considers three different diameters: 120 mm, 152 mm, and 185 mm. Other design parameters remain consistent with the original model. A diameter of 120 mm is determined as the minimum required to meet the standard mooring safety factor, whereas the 152 mm and 185 mm values are chosen with reference to the study by Chen et al. [
17].
These designs adjust the mooring system configuration to reduce platform motion, improve safety under extreme sea conditions, enhance the system’s fatigue resistance, and increase the overall safety and reliability of the mooring system.
The main objective of a mooring system is to ensure that the mooring chains possess adequate load-bearing strength to endure environmental forces and platform dynamic responses. Insufficient chain strength may lead to sudden failure, causing platform drift, structural damage, or even casualties. According to the rules [
46], the minimum safety factor for mooring lines is 2.25 during operational conditions and 1.67 in mooring conditions. The research presented here employs R4-grade offshore mooring chains. The safety factor of the mooring lines is calculated as follows:
In the equation,
Tmax represents the maximum tension. When analyzing the tension response of mooring lines in the time domain, the determination of maximum mooring tension can follow the approach used for assessing the maximum offset of floating structures.
PB denotes the rupture strength of the mooring chain, which varies depending on the material [
47]. The rupture strength of an R4-grade mooring line is calculated using the following equation:
where
d is the diameter of the mooring line, measured in millimeters.
5.2. Model 1 Mooring System Interacts with Rogue Waves
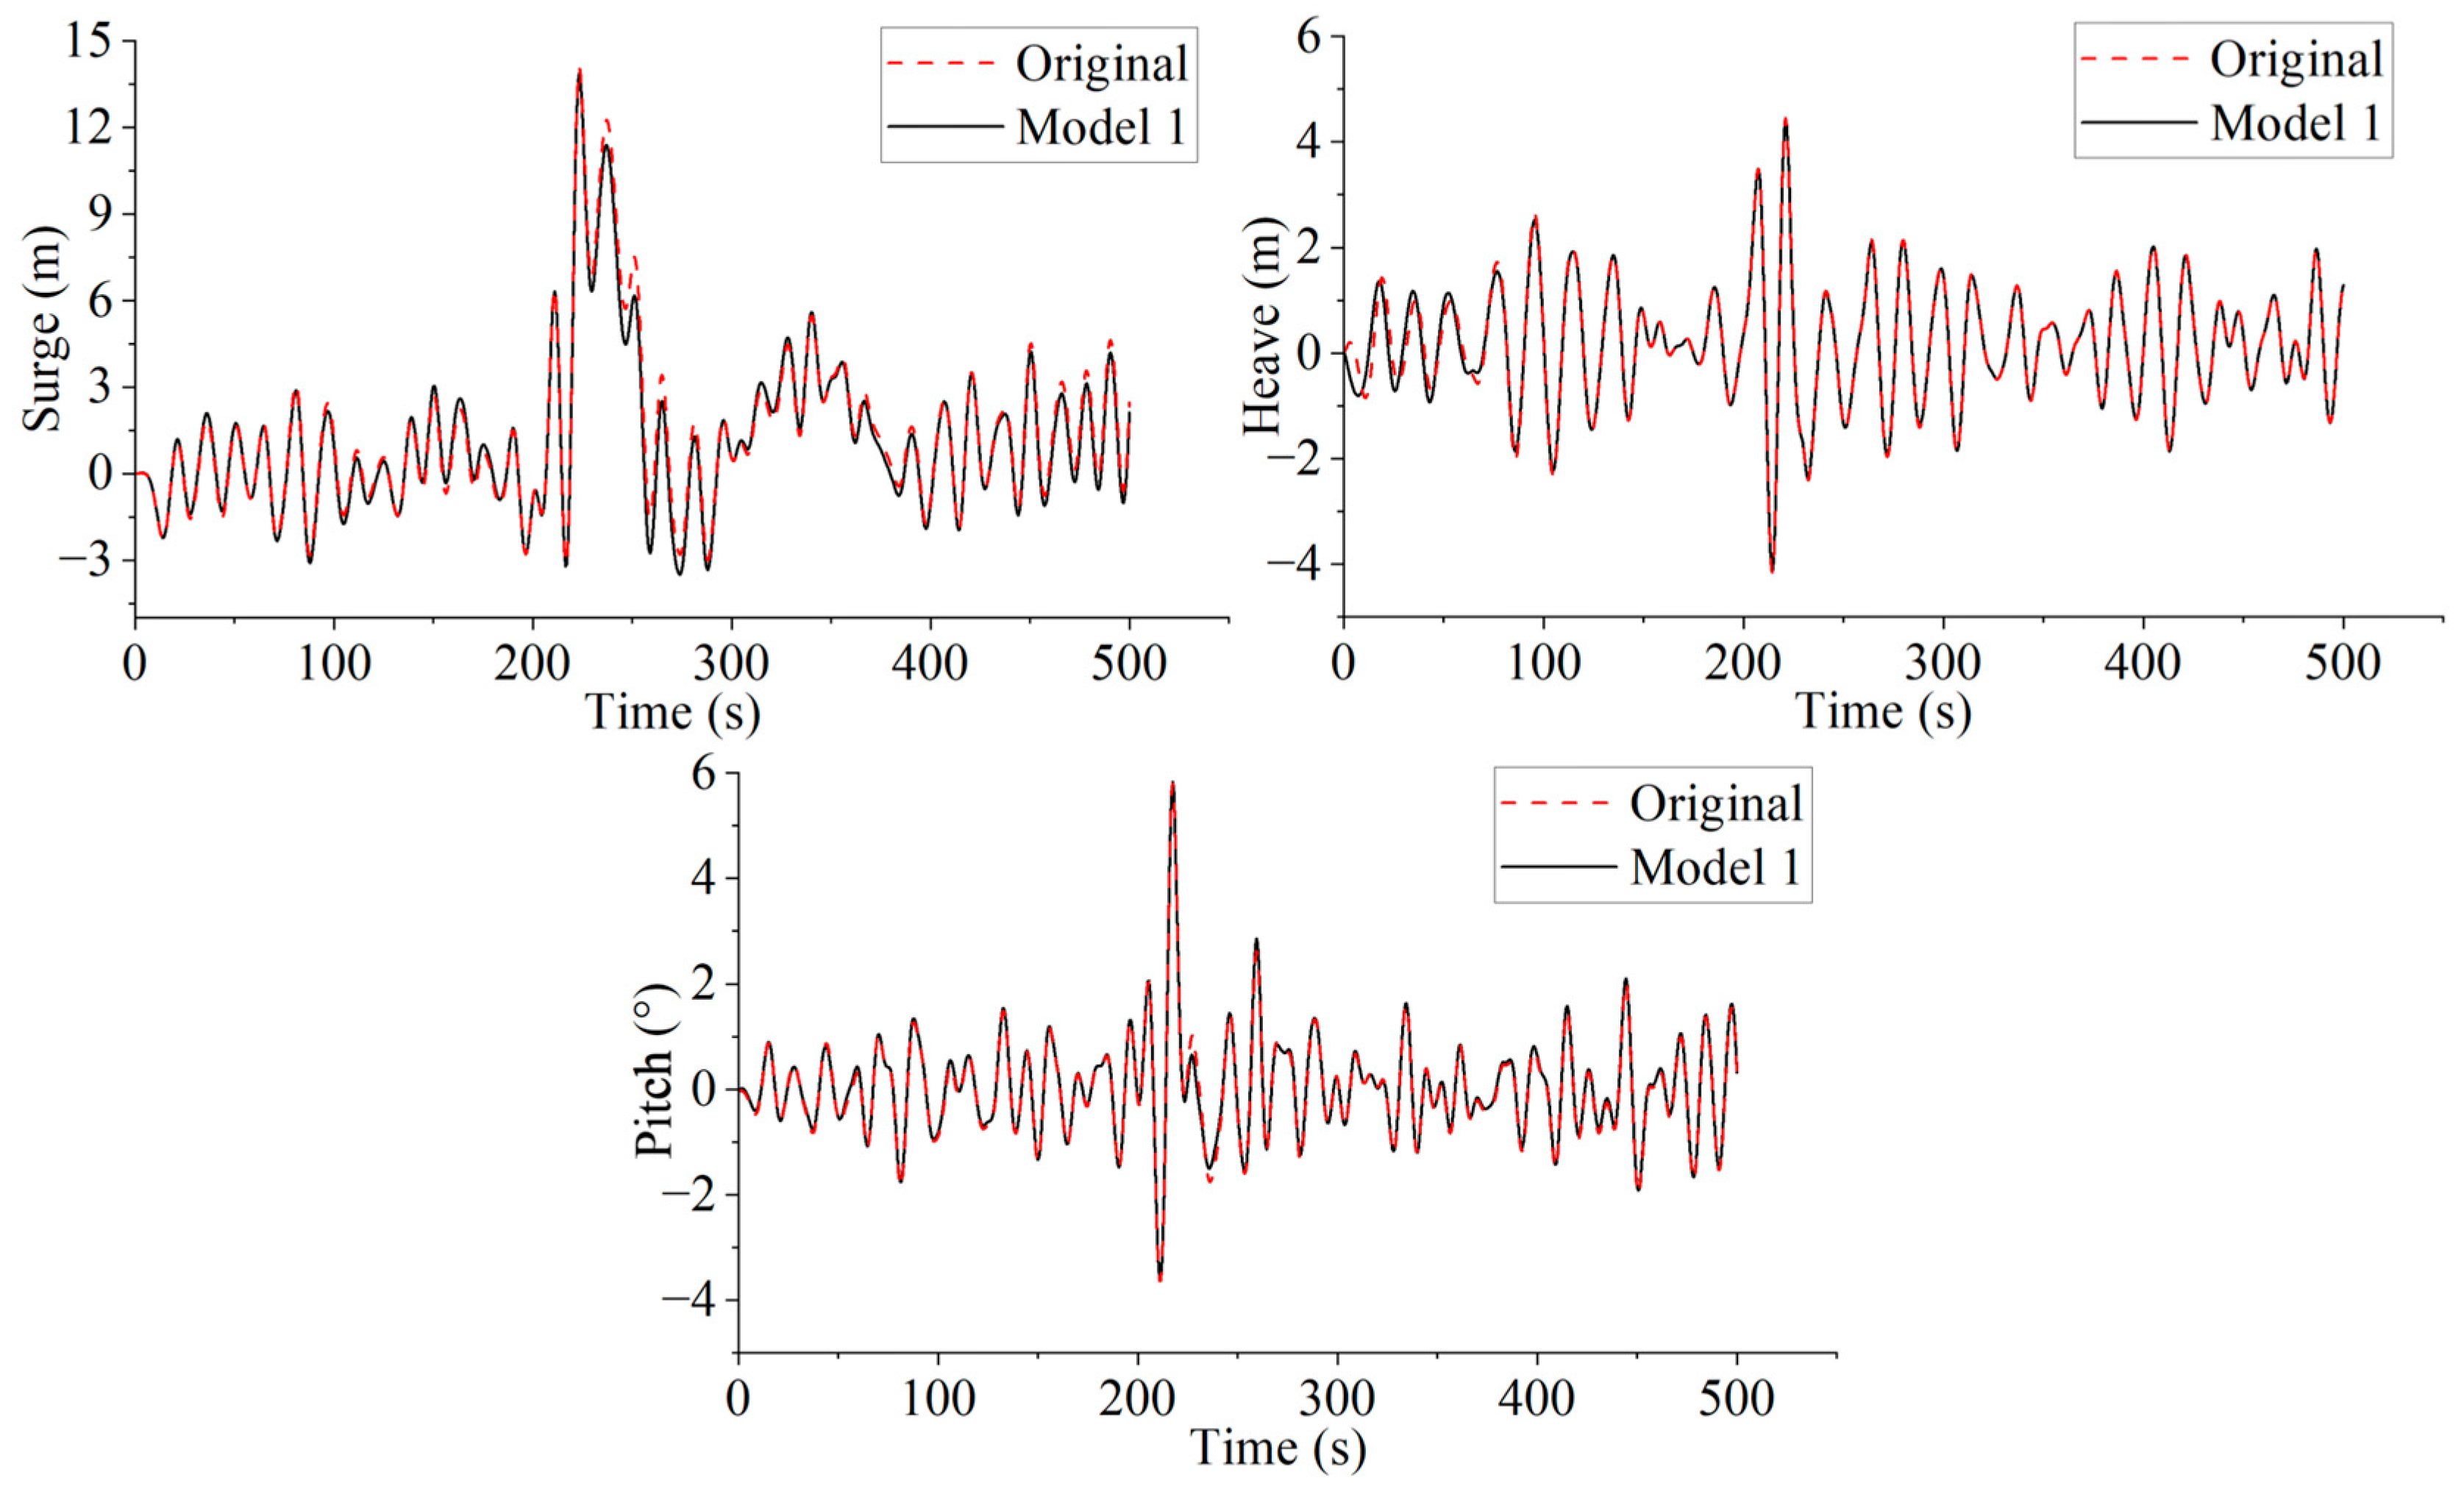
This section contrasts the motion behaviors of the original mooring system and Model 1 under the influence of rogue waves. As illustrated in
Figure 18, notable differences can be observed in the surge motion responses between the two systems. During the initial phase (0–220 s), both models exhibit comparable motion trends; however, Model 1 demonstrates reduced amplitude fluctuations, indicating a suppression of longitudinal platform displacements. Beyond 220 s, the original system continues to experience pronounced surge oscillations, whereas Model 1 displays further attenuation in response amplitude. This behavior suggests that Model 1 provides enhanced restoring capability, thereby improving the safety and horizontal stability of the platform under wave excitation. Therefore, the heavy-chain mooring system in Model 1 performs better at suppressing longitudinal motion, though its effect on reducing horizontal longitudinal displacement is limited.
As shown in
Figure 18, the heave motion comparison shows that the motion curves of both systems follow a similar trend for most of the time, with the vertical motion amplitudes being nearly identical. This suggests that the heavy-chain section, which maintains contact with the seabed, exerts minimal influence on the vertical motion of the platform. Regarding pitch motion, as shown in
Figure 18, during the key period between 200 and 250 s, both models exhibit significant pitch angle variations, which are quite similar. This indicates that the Model 1 mooring system has only a slight improvement in controlling pitch motion, reducing the pitch amplitude under wave action to a small extent.
In the analysis of mooring line forces (
Figure 19), both the original system and Model 1 exhibit significant peak tensions under rogue wave conditions. Mooring line 1 has a peak tension in the original mooring system is about 4.69 × 10
3 kN, while the peak tension in Model 1 is higher at 5.16 × 10
3 kN. However, after the rogue wave impact, the tension fluctuations in both systems converge. For mooring line 2 (and mooring line 3, which has a similar tension curve due to system symmetry, omitted from further comparison), both the original and Model 1 mooring lines show noticeable changes in tension. The tension in Model 1’s heavy-chain mooring line is slightly higher, but the tension fluctuations for both models are almost identical.
The results demonstrate that Model 1 experiences a higher peak mooring line tension during the interaction with the rogue wave crest. Reducing the peak load is crucial because such circumstances tend to lead to abrupt weakening or snapping of the mooring lines. The higher maximum load in Model 1 suggests a reduced safety margin and a decreased ability to withstand extreme conditions. Over time, this may lead to increased stress and wear.
5.3. Model 2 Mooring System Interacts with Rogue Waves
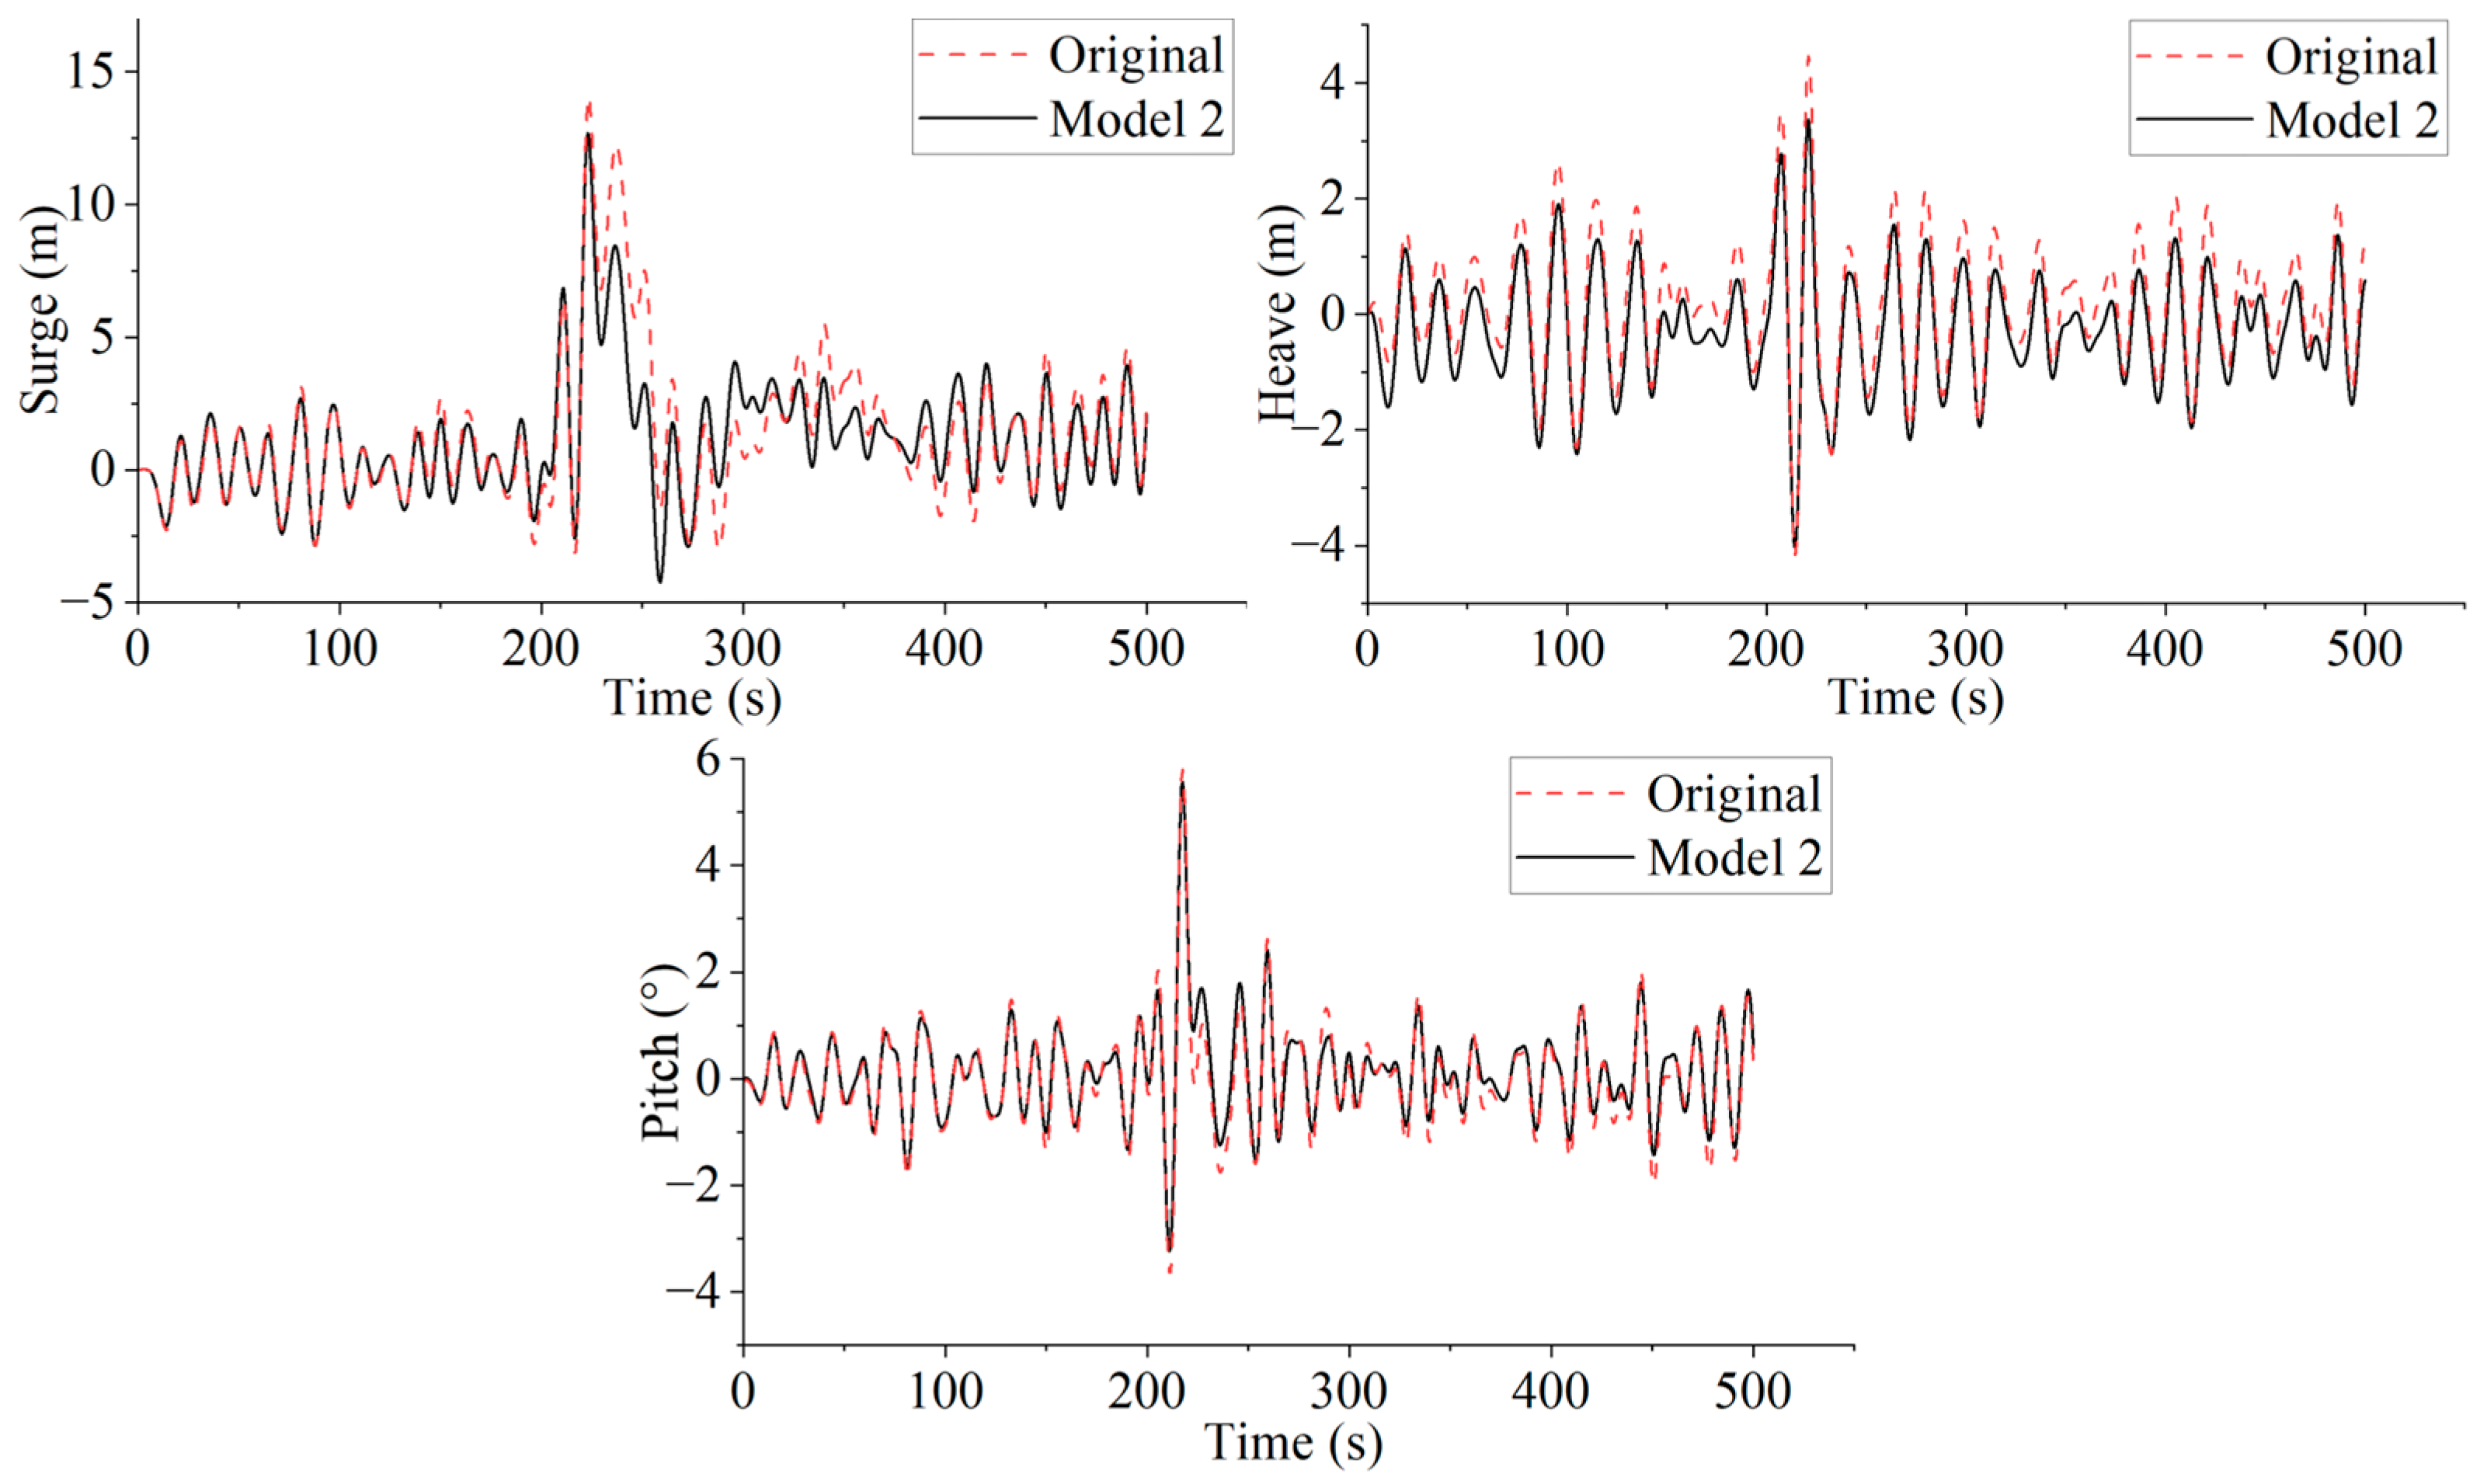
This part compares the surge motion results of the original mooring system and Model 2, as shown in
Figure 20. The surge motion Model 2 is relatively small compared to the original model. The maximum surge displacement observed in Model 2 is 9.97% smaller than in the original system, indicating that Model 2 provides a safer and more stable mooring system under average operating conditions. After the rogue wave impact, the surge motion in Model 2 is markedly attenuated compared to that observed in the original system. This indicates that the addition of three mooring lines in Model 2 provides greater restoring forces, which helps mitigate extreme motions, particularly under excessive strain or challenging operational environment, thereby potentially extending the structural stability of FOWT.
Figure 20 shows the difference in heave motion between the original system and Model 2. For heave motion, Model 2 exhibits a noticeable reduction compared to the original system. The maximum heave displacement in Model 2 is 14.12% smaller than in the original system. The increase in the number of mooring lines in Model 2, which adds weight to the system, significantly reduces the heave motion. This demonstrates that Model 2 has a clear advantage in reducing extreme heave movements, which is crucial for the platform’s overall safety.
As shown in
Figure 20, comparison between the original model and Model 2 for pitch motion. Model 2 shows a slight reduction in pitch motion compared to the original system. The overall trend in pitch motion is consistent across both systems. The maximum pitch displacement in Model 2 is 4.06% smaller than in the original system. The improvement in pitch control offered by Model 2 is limited, since the three additional mooring lines are connected to one location, leading to only a marginal reduction in pitch motion.
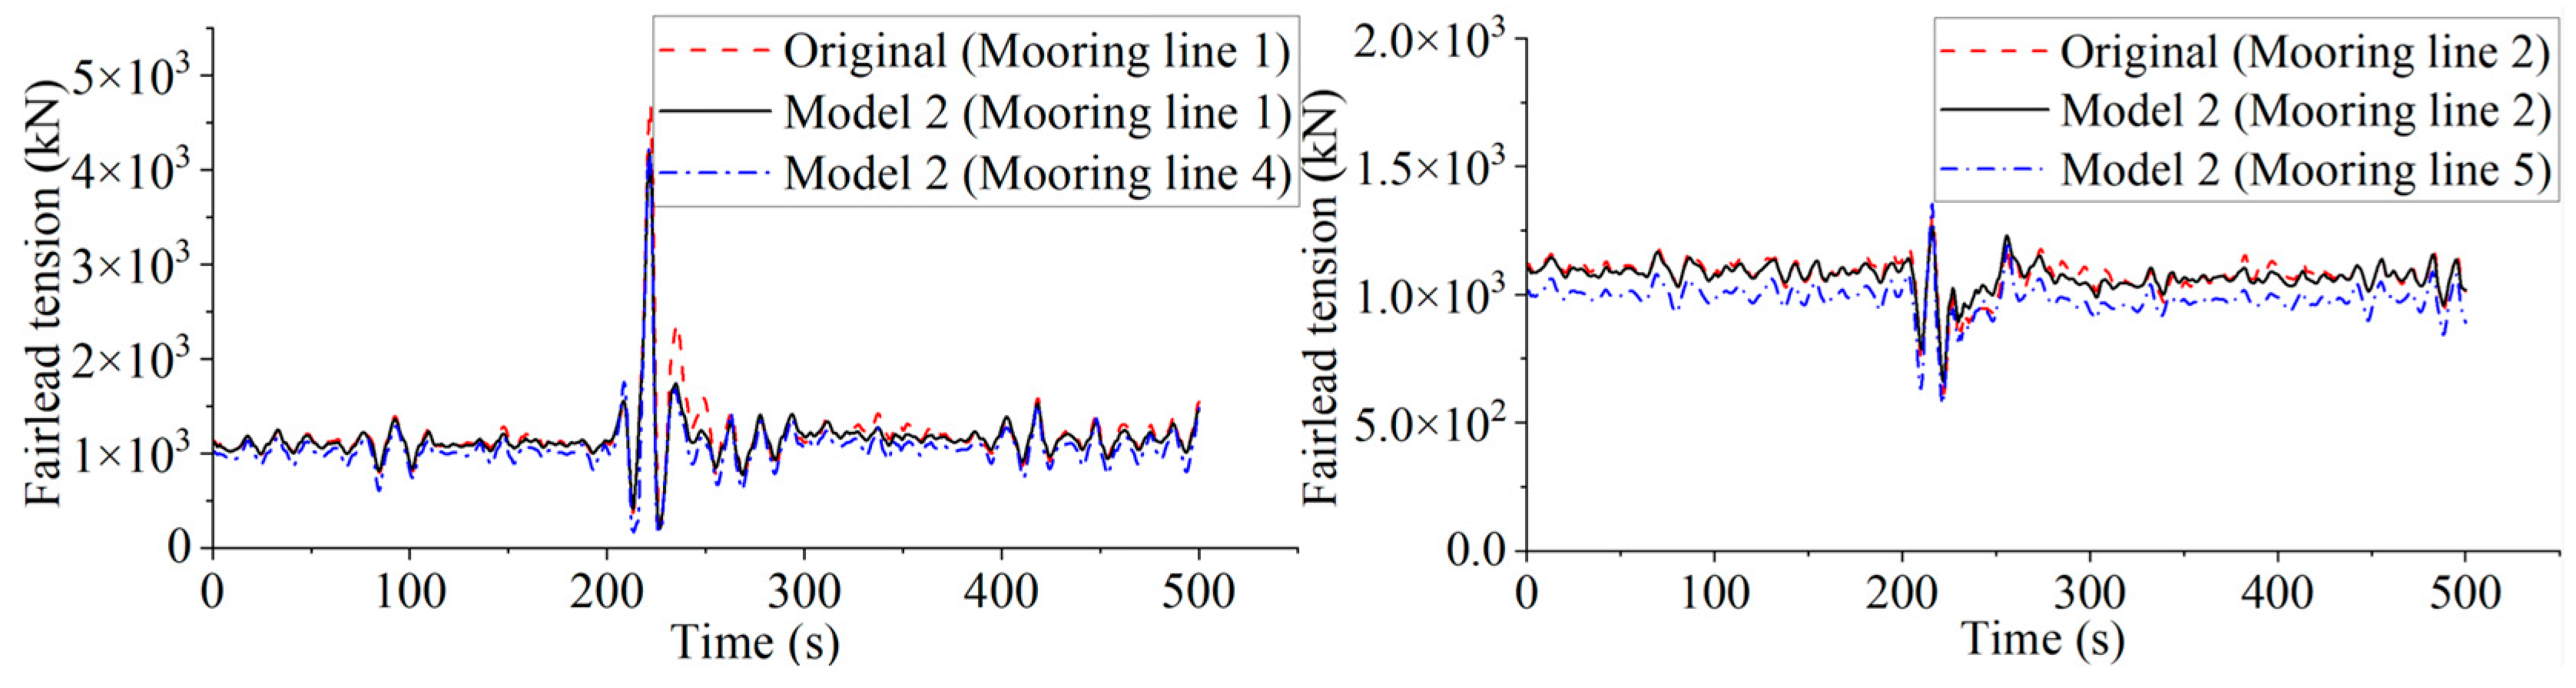
When comparing the performance of the original model with Model 2, significant differences are observed in the mooring lines along the wave propagation direction (mooring line 1 in the original system and mooring lines 1 and 4 in Model 2), as illustrated in
Figure 21. These findings indicate a moderate improvement in the performance of Model 2. The observed reduction implies that the mooring system in Model 2 is more effective in mitigating loads along the wave propagation direction. For the maximum load values, the peak load in mooring lines 1 and 4 in Model 2 is reduced by 10.92% and 9.79%, respectively. The decrease in peak load is crucial, since these situations are the most likely to lead to abrupt breakdown of mooring lines.
The comparison of mooring line 2 in the original system and mooring lines 2 and 5 in Model 2 (with mooring lines 3 and 6 in Model 2 being symmetric to lines 2 and 5, so omitted from the analysis) reveals significant differences in the performance of the mooring lines at this location. The maximum tension of mooring lines 2 and 5 in Model 2 decreased by 3.32% and 3.33%, respectively. These results indicate a general reduction in the tension load of mooring lines in Model 2, suggesting a potential improvement in overall safety and durability. The lower loads in Model 2 indicate an enhanced safety margin and enhanced capacity to endure extreme conditions.
Model 2 exhibits improved motion performance across all three degrees of freedom compared to original system. In addition, the mooring line loads are moderately reduced. This results in a decrease in platform motion, enhancing the platform’s safety under extreme sea conditions. Furthermore, it improves the platform’s fatigue resistance, extending its operational lifespan. By improving the motion state of the platform, the new mooring system better handles complex marine environments, ensuring the safe operation of the platform in harsh wave conditions.
5.4. Model 3 Mooring System Interacts with Rogue Waves
This section presents a detailed assessment of the motion characteristics of three distinct mooring model under the influence of the same rogue waves, with a particular focus on comparing the original mooring system and Model 3, which incorporates two six-line mooring systems with 30° and 60° angles. The analysis includes the platform’s motion variations, and mooring system response.
In
Figure 22, the analysis of the surge motion between the original mooring model and the two Model 3 systems (with 30° and 60° angles) shows that the surge response reaches its maximum at 220 s for all three models. The original mooring system exhibits larger displacements under the influence of rogue waves, which could lead to significant platform oscillations. However, in Model 3 (30°) and Model 3 (60°), the maximum surge motion is reduced by 9.26% and 4.89%, respectively, compared to the original model. The response fluctuations in Model 3 systems are notably smaller than in the original system, particularly in the 30° configuration, where the displacement under extreme waves is minimized, demonstrating its superior capability to suppress surge motion. On the other hand, the 60° configuration shows slower recovery of the surge displacement after the rogue wave impact, indicating a lower lateral restoring force from the mooring lines. Overall, the surge displacement curves for the 30° mooring system in Model 3 demonstrate that the new system effectively reduces surge motion caused by waves, enhancing the platform’s safety under harsh sea conditions.
Figure 22 compares the response of heave motion. The original model displays more pronounced fluctuations during the rogue wave event, particularly around 220 s, where the maximum heave displacement indicates a significant response of the platform under the influence of rogue waves. Compared to the original system, the maximum heave displacement in Model 3’s two configurations, Model 3 (30°) and Model 3 (60°), is reduced by 14.90% and 4.95%, respectively. This demonstrates that both configurations of Model 3 provide better safety under extreme wave conditions. Additionally, the inclusion of three extra mooring lines increases the system’s weight and vertical restoring force, thereby contributing to the reduction in the platform’s heave motion. This indicates that the new mooring system optimizes heave motion performance under the same wave conditions.
In
Figure 22, the analysis of pitch motion between the original model and the two six-line mooring systems in Model 3 (30° and 60° angles) reveals that all three mooring models show significant fluctuations in pitch angle, with the highest peak occurring around 220 s, indicating platform tilting due to rogue wave effects. In Model 3 (30°) and Model 3 (60°), the maximum pitch displacement is reduced by −1.35% and −0.54%, respectively, compared to the original system. Model 3 (30°) shows a larger pitch angle after the rogue wave impact, while Model 3 (60°) shows a relatively smaller pitch angle. This indicates that Model 3 (60°) has limited effectiveness in reducing extreme platform tilting. The pitch response trends of the 30° and 60° systems are similar, but Model 3 (60°) exhibits a more stable response, suggesting better safety under wave impact.
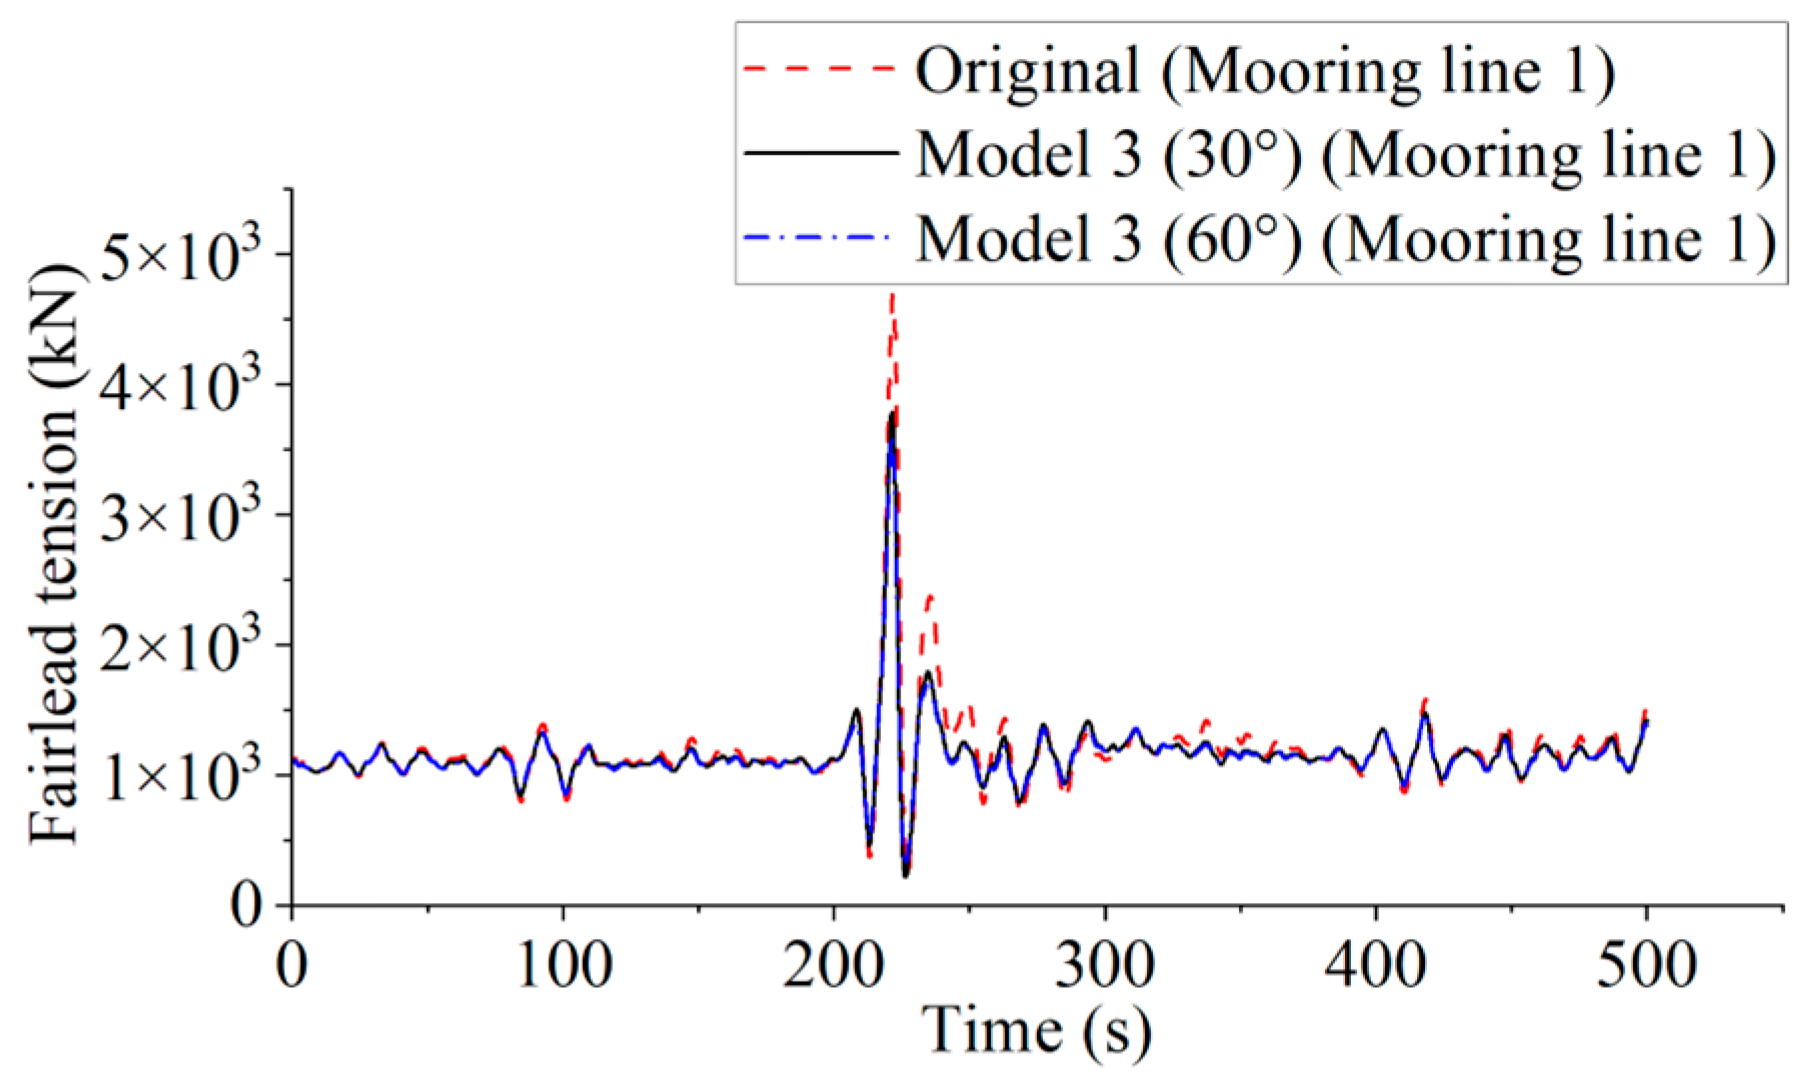
Figure 23 shows the comparison of mooring line 1 tension between the original model and the two six-line mooring systems in Model 3 (with 30° and 60° angles) under the same rogue wave conditions. As the tension changes in the other mooring lines of Model 3 are relatively small and remain within safe limits compared to the original mooring system, the comparison of those tensions is omitted. Different colored curves in the figure illustrate the performance of the various mooring systems. The tension in the original mooring system fluctuates significantly, with a sharp peak occurring during the rogue wave impact. This fluctuation is likely related to the platform’s dynamic response, with large wave impacts generating high instantaneous loads.
In the Model 3 (30°) system, the tension variations are smoother and exhibit smaller fluctuations compared to the original system, reducing in reduced overall amplitude and severity of tension changes. The maximum tension in mooring line 1 of the Model 3 (30°) system is reduced by 19.29% compared to the original system. The Model 3 (60°) system shows similar fluctuation patterns to the 30° system, but with even lower amplitude. Compared to the original system, the maximum tension in mooring line 1 of Model 3 (60°) is reduced by 22.90%. The larger angle in the 60° system helps to distribute the forces on the platform more evenly, enhancing the system’s shock resistance, particularly under extreme wave conditions. This indicates that the 60° configuration of the new six-line mooring system provides better safety in response to rogue waves, likely reducing the system’s instantaneous response through optimized mooring angles and layout.
Thus, the two six-line mooring systems in Model 3 (30° and 60° angles) exhibit much smoother tension variations under the influence of rogue waves compared to the original mooring system. The configuration of these two systems reduces peak instantaneous loads and improves system safety, effectively reducing the platform’s dynamic response, extending its lifespan, and enhancing its safety in extreme conditions.
The analysis of the motion response and mooring line tension under identical rogue wave conditions indicates that the two six-line mooring configurations in Model 3 (with 30° and 60° angles) are more effective in suppressing platform motion compared to the original system. Furthermore, under extreme wave conditions, the mooring line tensions in both systems decrease significantly, with Model 3 (60°) standing out for its improved mooring safety for floating platforms.
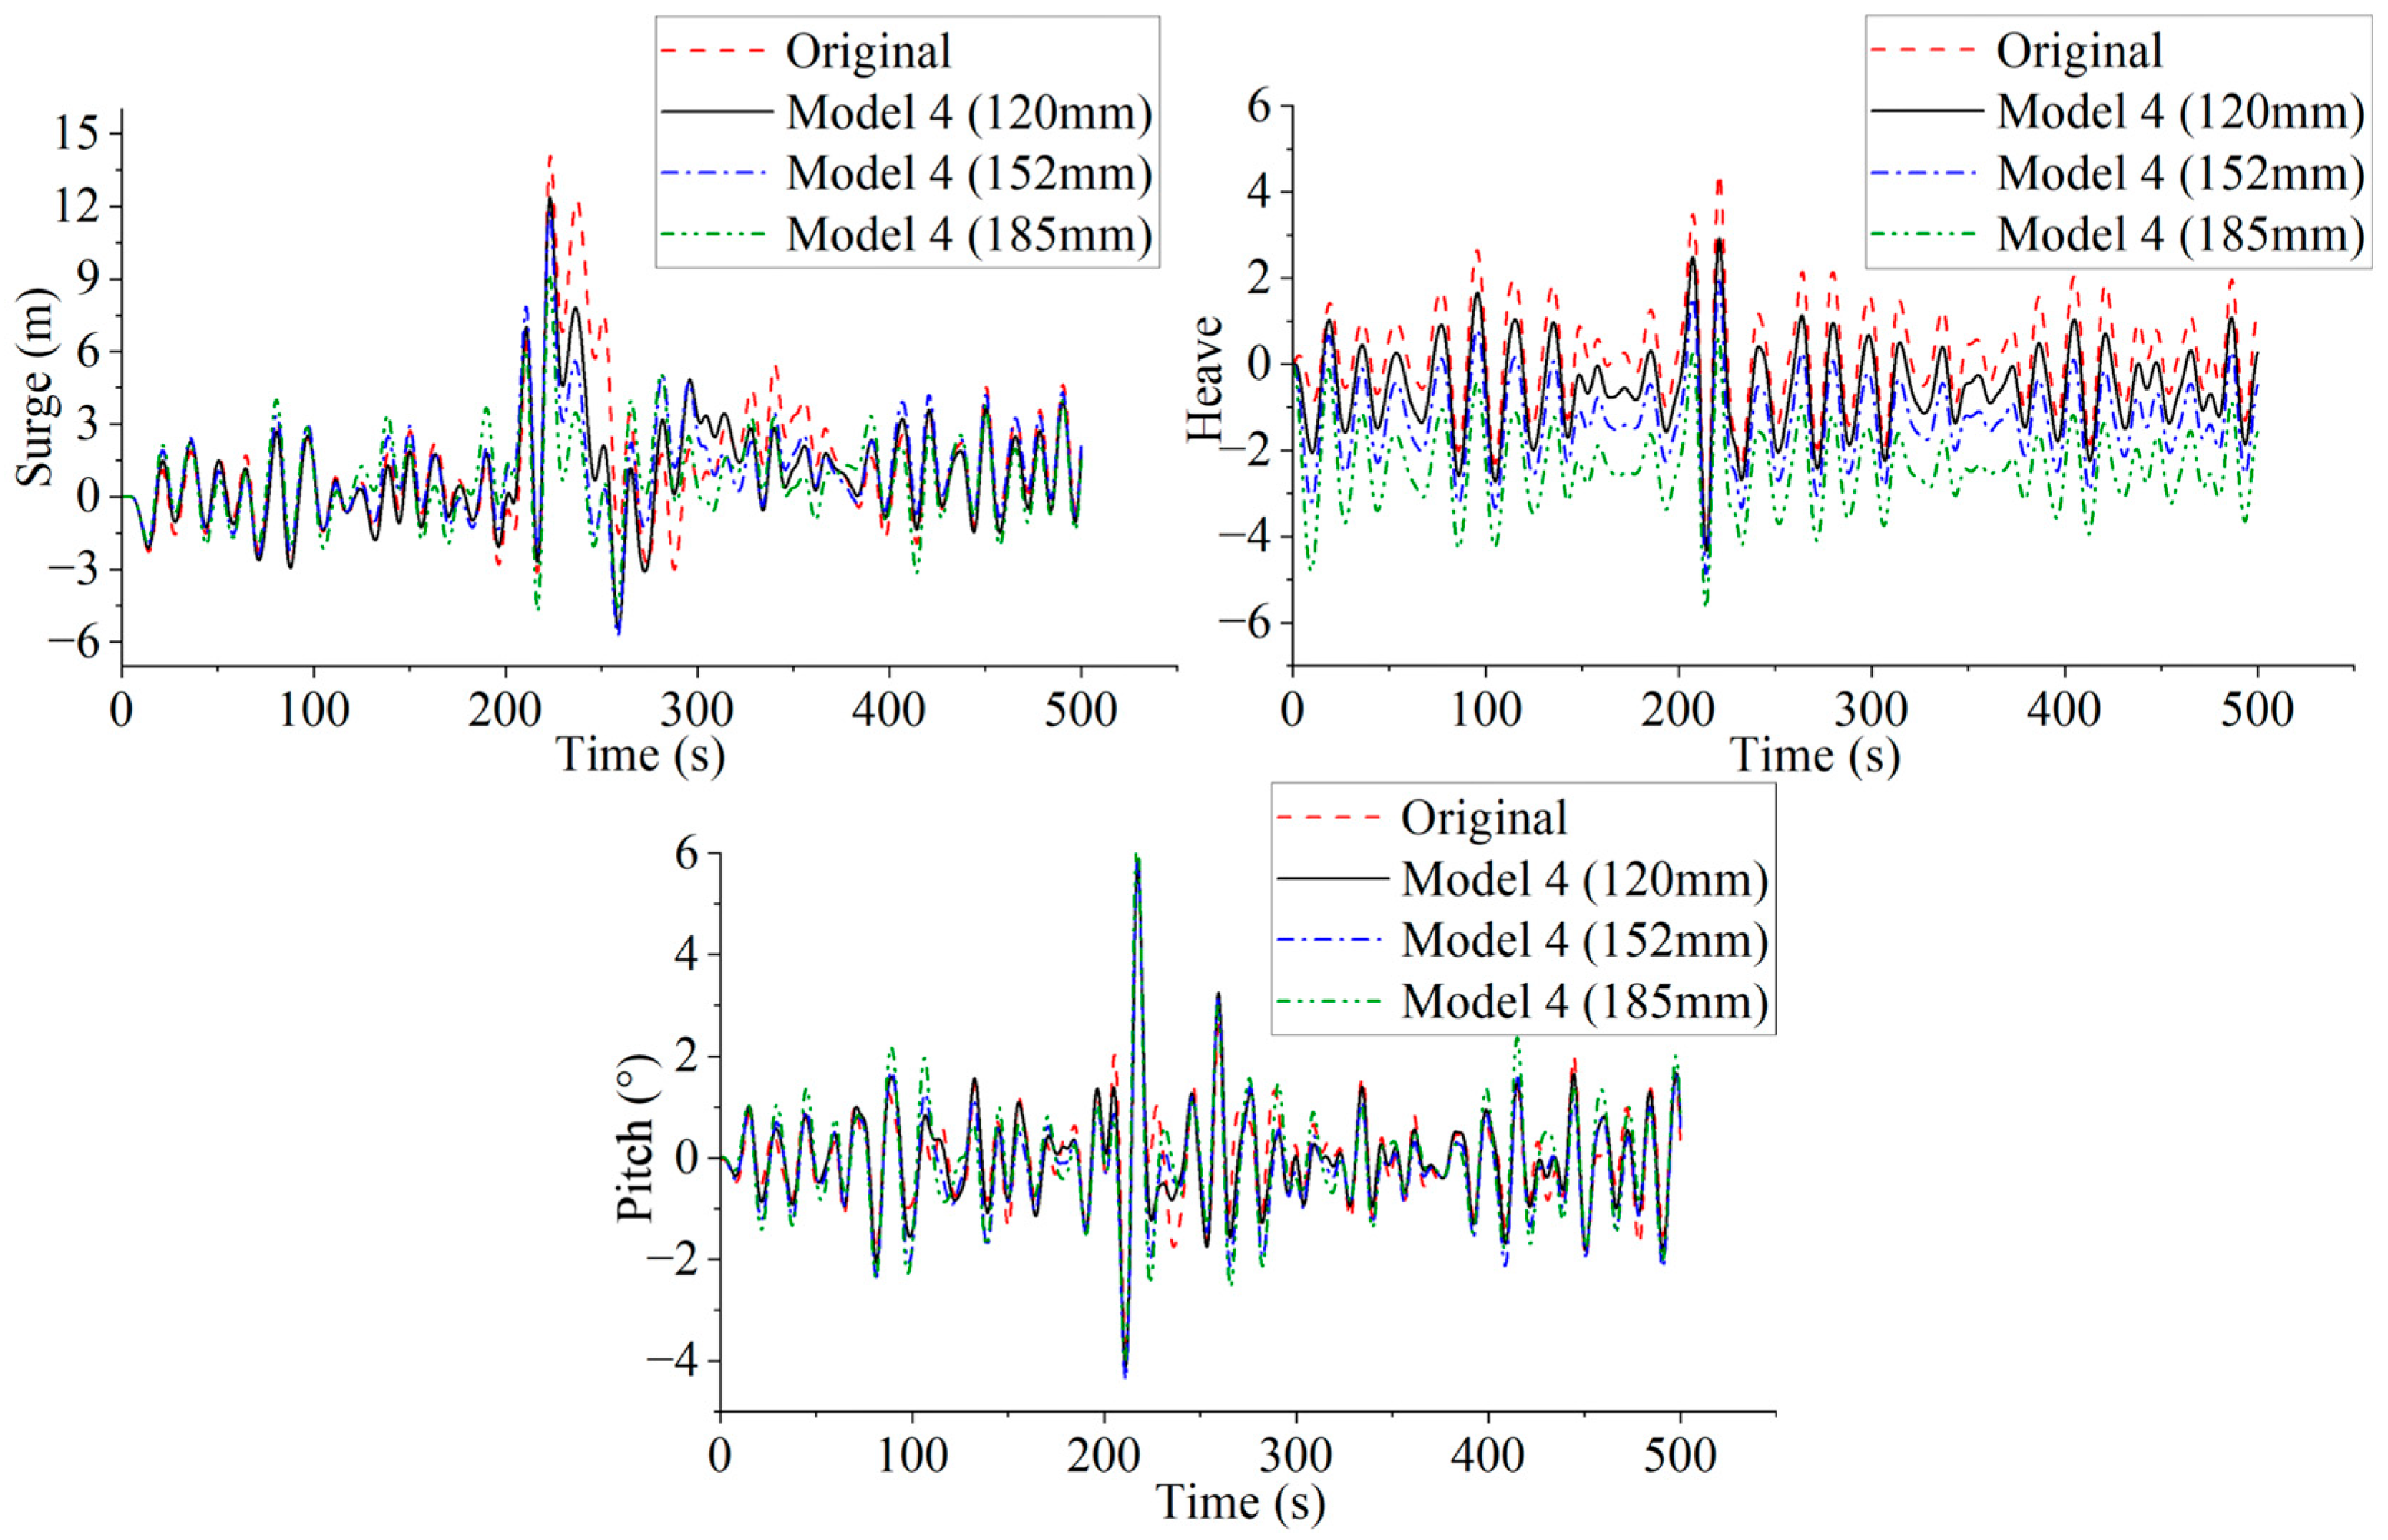
5.5. Model 4 Mooring System Interacts with Rogue Waves
This section conducts a comparison of the influence of mooring line diameter on the motion characteristics of mooring system and the mooring loads. As illustrated in
Figure 24, increasing the mooring line diameter alters the platform’s surge motion. Specifically, the maximum surge displacement in the Model 4 (120 mm) mooring system is reduced by 12.17% compared to the original model. Similarly, the maximum surge displacements for Model 4 (152 mm) and Model 4 (185 mm) systems are reduced by 16.43% and 34.50%, respectively. Compared to the original system, increasing the mooring line diameter effectively reduces the platform’s horizontal displacement under rogue wave conditions, particularly during wave peaks, where the platform’s response is smaller. The increase in mooring line diameter results in enhanced axial stiffness, providing greater lateral restoring force, which effectively suppresses the platform’s oscillations and thus improves safety.
As shown in
Figure 24, for heave motion, the platform’s behavior under the three Model 4 mooring systems exhibits trends similar to the original system. However, the Model 4 systems effectively mitigate the vertical displacement of the platform, particularly during periods of intense fluctuation. The maximum heave displacement for the Model 4 (120 mm) system is reduced by 15.76% compared to the original system. Similarly, the maximum heave displacements for the Model 4 (152 mm) and Model 4 (185 mm) systems are reduced by 21.00% and 27.13%, respectively. The platform’s heave amplitude is smoother compared to the original system, indicating that the new mooring systems better absorb and distribute vertical motions, thereby reducing excessive oscillations. This characteristic enhances the platform’s safety under extreme marine conditions.
The comparison of pitch motion reveals that the improving impact on pitch motion is minimal for the three Model 4 mooring systems, as illustrated in
Figure 24. Under the original mooring system, the platform experiences significant tilting due to rogue wave effects, especially at the wave peak, where the pitch angle changes drastically. For the Model 4 (120 mm) system, the maximum pitch displacement increases by 1.16% compared to the original system. Similarly, the maximum pitch displacements for the Model 4 (152 mm) and Model 4 (185 mm) systems increase by 1.36% and 8.89%, respectively. These results indicate that increasing the diameter of mooring lines has a limited impact on optimizing the platform’s pitch motion.
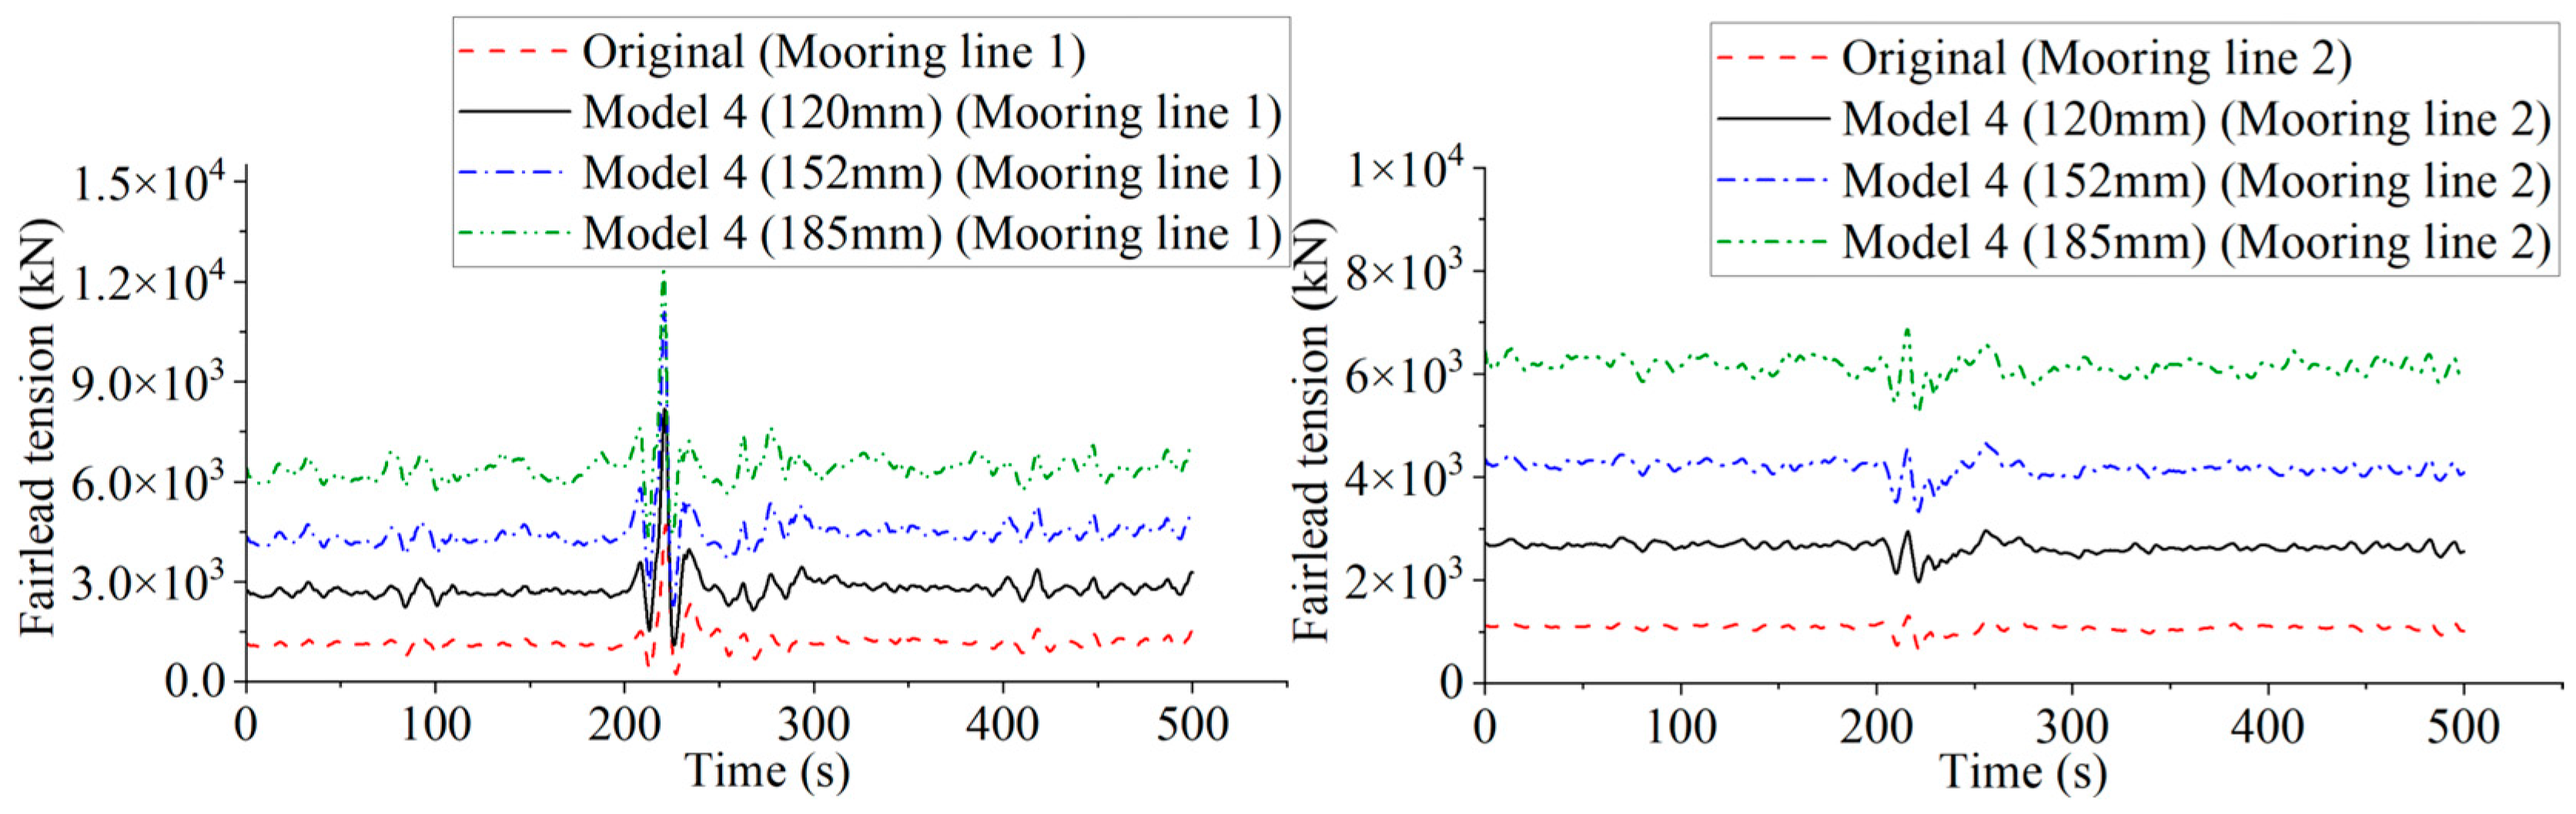
Figure 25 compares the tension of mooring line 1 between the original model and the three Model 4 mooring systems. From the mooring line tension curves, it is observed that the tension variation trends for both the original system and the three Model 4 systems are quite similar, but the magnitude of the tension varies significantly. Specifically, the initial load increases markedly with larger mooring line diameters, as the greater mass per unit length significantly enhances the vertical tension induced by the mooring line’s self-weight. However, as the mooring line diameter increases, its breaking strength also increases, leading to a higher safety factor.
For mooring line 2 (with mooring line 3 showing the same tension curve as mooring line 2), the tension variation under the rogue wave effect follows a similar trend as mooring line 1. The tension fluctuations for both models are almost identical. The increase in cable diameter leads to a higher mass, which significantly increases the tension caused by its own weight. The increase in diameter directly enhances the tensile strength of the mooring line, thus reducing the risk of cable failure under extreme sea conditions (for example rogue waves or typhoons).
5.6. Results and Discussion
This study explores the balance between safety, performance, and cost for floating platforms under the effect of rogue waves, drawing from the analysis of the different mooring design schemes. A comparative analysis of the initial model and the enhanced models (as shown in
Figure 26 and
Table 4) reveals the impact of different mooring system configurations on platform safety. According to previous research [
48,
49], the installation and maintenance costs of a mooring system are influenced by the number of mooring lines and anchors, as well as the selected installation method. Based on their findings, the installation and maintenance costs for each configuration are calculated and are summarized in
Table 5.
The manufacturing cost of the mooring line is proportional to its weight, at approximately
$2.11 per kilogram [
49]. Regarding installation costs, two installation methods are considered. One involves the use of barges and tugboats, while the other relies on Anchor Handling Vessels (AHV), which are specifically designed for such tasks. AHV install anchors directly onto the seabed, thereby reducing the need for additional subsea equipment during installation. In this study, the cost estimation is based on the AHV-based installation method. The calculation of mooring and anchoring installation costs is as follows [
48]:
Here,
CAHV represents the daily rental cost of the AHV (55,211.8
$/day),
CDL refers to the cost of diving and lowering equipment (6391.3
$/day),
Nanchors is the total number of anchors, and
TAHV denotes the number of anchors that can be installed per day by the AHV (7 anchors/day). The maintenance cost is proportional to the manufacturing and installation costs. The number of anchors is calculated using the following formula [
48]:
NWT is the number of FOWT, Nsub is the number of substation platforms, Nacc is the number of accommodation platforms, and Np is the average number of mooring lines per platform.
The platform’s motion response varies across different mooring configurations, as shown in
Figure 26. Surge motion: The original model exhibits the largest lateral displacement, indicating more pronounced motion response. The first three mooring design schemes show limited improvement in surge motion. In Model 4 (varying mooring line diameters), an increase in mooring line diameter progressively reduces surge amplitude, highlighting its role in enhancing lateral stability. Heave motion: The original model experiences significant heave variation. While Models 1, 2, and 3 provide limited improvement, they still demonstrate some reduction in heave amplitude. Model 4 shows a clear trend where larger mooring diameters effectively suppress heave motion, with the 185 mm mooring line offering the best performance. Pitch motion: Pitch fluctuations remain relatively minor across all models, with less variation compared to surge and heave. Model 3, particularly with the 30° and 60° configurations, shows slight improvement in pitch stability, with the 60° setup performing marginally better. Model 4’s larger mooring diameters contribute minimally to pitch motion reduction. Mooring tension: Model 1 exhibits slightly higher mooring tension compared to the original system. In contrast, Models 2 and 3 show significant reductions in tension. However, Model 4 experiences a substantial increase in mooring tension due to the larger mooring line diameters. The analysis indicates that the first three mooring design schemes have a limited impact on improving platform motion, whereas Model 4 demonstrates relatively better performance. However, there are significant variations in mooring line tension among the models. Among them, Model 3 exhibits the lowest mooring line tension.
As presented in
Table 4 and
Table 5, the original mooring system offers the lowest cost but yields a safety factor of only 1.30. This value is considerably below the minimum recommended threshold of 1.67, indicating insufficient safety, particularly under extreme environmental conditions where the platform is subjected to elevated risks. Although Model 1 provides some improvement in surge and heave motion, its safety factor decreases to 1.18, further below the acceptable standard. Despite a slight increase in cost, the performance gains are minimal, suggesting limited applicability in real-world operations.
Model 2 achieves more noticeable improvements, particularly in reducing heave, and increases the safety factor to 1.46. However, this value still falls short of the required 1.67, which implies that the design enhances structural performance to some extent but does not eliminate safety concerns. Model 3 with a 30° mooring angle results in moderate motion reductions and improves the safety factor to 1.61, which is close to the minimum standard and suggests relatively improved reliability. Model 3 with a 60° arrangement shows greater fluctuations in surge and heave, although the safety factor exceeds 1.67. This indicates a gain in structural safety but a less favorable response in terms of motion behavior.
Model 4 with a 120 mm mooring line diameter shows clear improvement in reducing surge and heave motion and reaches a safety factor of 1.66, very close to the standard threshold. However, this configuration leads to a significant rise in cost, reducing its economic feasibility. Model 4 with a 152 mm diameter offers outstanding performance in controlling heave and produces a safety factor of 1.82, exceeding the minimum requirement. Nevertheless, the increased cost remains a concern for practical use. The 185 mm version of Model 4 provides the most effective performance by substantially reducing surge motion and achieving a safety factor of 2.20. This result indicates the highest level of safety, although its considerable expense may limit its adoption in engineering practice.
In summary, Model 4 (185 mm) provides the highest safety factor of 2.20, far exceeding the minimum required safety factor of 1.67, demonstrating the best platform safety. However, increasing mooring line diameter significantly improves platform safety, but also leads to a substantial rise in cost. Especially with large-diameter mooring lines (such as Model 4 (185 mm)), which enhance safety but incur very high costs, this design may not be suitable for all practical applications. When selecting large-diameter mooring lines, a balance must be struck between platform safety and economic cost. Some mooring design schemes have shown improvements in platform safety; however, certain configurations, particularly the original model, Model 1, and Model 2, fail to meet the standard safety factor of 1.67, posing potential risks under extreme sea states. Increasing the number of mooring lines offers advantages in both cost-effectiveness and enhanced safety. In addition to the four mooring configurations examined in this study, many other alternative designs exist, and it is possible that more suitable configurations could be identified. Consequently, in practical engineering applications, it is essential to strike an appropriate balance between safety enhancements and economic feasibility, taking into account specific technical requirements, operational environments, and budgetary limitations. The selection of an optimal mooring configuration is vital to guarantee the long-term safety and operational reliability of the floating platform.
It should be noted that the conclusions drawn in this study are based on simulations that excluded aerodynamic loads. Rogue waves typically occur under extreme sea states, which are often accompanied by severe wind conditions. However, due to numerical limitations, wind-induced aerodynamic forces were not incorporated in the current CFD-FEM simulations. Previous studies [
50,
51] have shown that the mooring line tensions caused by the combined action of wind and waves are generally greater than those induced by waves alone. The coupled wind-wave interaction can amplify the platform motion and exacerbate mooring loads. Therefore, to achieve a more comprehensive assessment of mooring system performance, future research should incorporate the influence of wind loads, particularly under extreme environmental conditions where coupled wave-wind interactions may govern the dynamic response of the floating platform.


