Article

Risk Assessment of Storm Surge Disasters in a Semi-Enclosed Bay Under the Influence of Cold Waves: A Case Study of Laizhou Bay, China

1
School of Hydraulic and Civil Engineering, Ludong University, Yantai 264025, China
2
Institute of Coastal Research, Ludong University, Yantai 264025, China
*
Authors to whom correspondence should be addressed.
These authors contributed equally to this work and should be considered co-first authors.
J. Mar. Sci. Eng. 2025, 13(8), 1434; https://doi.org/10.3390/jmse13081434 (registering DOI)
Submission received: 22 June 2025 / Revised: 24 July 2025 / Accepted: 25 July 2025 / Published: 27 July 2025
(This article belongs to the Section Physical Oceanography)

Abstract

Laizhou Bay, a semi-enclosed bay, is prone to storm surges from cold waves due to its geographic and environmental characteristics. This study uses satellite data, in situ measurements, and the MIKE numerical model to analyze storm surges along Laizhou Bay’s coast under no-dike conditions. It examines the surges caused by cold waves with different intensities and directions. This study provides the storm surge disaster risk levels along Laizhou Bay’s coast. The results show that the maximum sustained wind speed during cold waves is distributed between the NW and NE. The NE wind direction causes the most severe storm surge along Laizhou Bay. Under NE-directed cold waves with level 12 wind, the maximum risk areas for Level III and IV are approximately 1341 km2 and 1294 km2, respectively. Dongying, Shouguang, and Hanting exhibit large Level I and II risk zones. The maximum seawater intrusion distance along the Kenli coast is about 41 km. The coastal segment from Kenli to Changyi is most severely affected by storm surges. It is recommended to effectively maintain and heighten seawalls along this segment to mitigate storm surge disasters caused by strong NE winds.

1. Introduction

Cold waves, driven by cold air from high latitudes, cause rapid temperature drops, strong winds, snowfall, and freezing conditions, severely impacting production and daily life [1,2]. In China, cold waves mainly follow northwest, west, and north paths, forming short-to-medium-term patterns like developing troughs, eastward-moving troughs, and transverse troughs [1,3]. Affected by its mid-latitude geographical location and climatic characteristics, cold waves and cold air activities in northern China are mainly concentrated in spring and autumn [4,5]. Their intensity and duration are shaped by atmospheric systems like the polar vortex, the Siberian High, and jet stream shifts [6,7,8,9]. Additionally, the Arctic Oscillation modulates the intensity of cold waves, the North Atlantic Oscillation regulates the movement path of cold waves, and sea surface temperature affects the duration of cold waves [10,11,12]. Climate change intensifies the frequency and severity of extreme cold waves through Arctic amplification and sea ice loss, posing significant threats to ecosystems and society. Therefore, studying extreme cold wave events is critically important [13,14].
Cold waves trigger intense atmospheric disturbances, like strong winds and pressure drops, causing sea level anomalies and storm surges [15,16]. When storm surges align with astronomical tides, higher sea levels result, leading to seawater intrusion, coastal erosion, soil salinization, infrastructure damage, and economic losses [17,18,19,20,21]. Coastal areas, globally vital for economic activity, face growing losses as development heightens income inequality [22,23]. In 2023, marine disasters (primarily including storm surges, waves, and sea ice) along China’s coast caused direct economic losses of 2.48 billion CNY, with losses from storm surges alone accounting for a striking 99% of the total [24].
Risk assessment forms the foundation of disaster prevention. However, significant coastal variations in geophysical profiles, climatic regimes, and environmental conditions preclude a universal storm surge risk methodology. Traditional statistical approaches, numerical simulations, and AI techniques each present complementary capabilities and constraints, necessitating context-specific methodological selection [25,26]. Advancing storm surge risk assessment methodologies, Hsu et al. fused the joint probability method with surge response functions into a probabilistic framework, balancing precision and computational efficiency for storm surge risk assessment [27]. Complementarily, a physics-based numerical model integrated with GIS enables precise, spatially explicit storm surge impact prediction and comprehensive quantitative risk characterization [28,29]. Artificial intelligence techniques leverage machine and deep learning to process complex storm surge variables, capturing nonlinear interactions for enhanced risk assessment accuracy and efficiency [20,30,31]. Regionally, Liu et al. implemented exposure sensitivity-adaptive capacity metrics for vulnerability assessment along Laizhou Bay [32], while Li et al. developed continuous vulnerability functions focused on critical infrastructure [33]. These granular approaches enable dynamic risk differentiation across emergency phases and incorporate post-disaster recovery considerations. The novel Kuykendall storm surge scale integrates water height and velocity with economic loss data, enhancing risk assessment accuracy by 20% [34]. Wang et al. developed a Wenchang typhoon storm surge risk system, integrating modeling, vulnerability analysis, and risk aggregation [35]. Grey et al. developed a TELEMAC-2D-based storm surge risk assessment system for the Bahamas, validated against four hurricanes and optimized for nationwide scalability [36].
Current storm surge risk assessments predominantly focus on methodological innovations and typhoon-induced mechanisms, with systematic research on cold wave storm surges remaining critically underdeveloped. However, against the backdrop of global warming and declining cold wave frequency, recent extreme cold wave events have exhibited anomalous regional intensification [37,38]. This necessitates explicit investigation of contemporary extreme cold wave phenomena. This study establishes a comprehensive cold wave storm surge risk assessment framework for Laizhou Bay, addressing this methodological void to provide a scientific underpinning for coastal disaster risk reduction.
Laizhou Bay (37°30′ N–37°49′ N, 118°54′ E–120°20′ E), situated in eastern China along the southern expanse of the Bohai Sea, ranks among the three principal bays of the Bohai Sea. Extending from the Yellow River Estuary in the west to Qimu Island in Longkou in the east, it boasts a coastline spanning approximately 319 km and an area of about 7000 square km. Its geographical location and elevation are depicted in Figure 1. The western and central coastal zones of Laizhou Bay have low-lying, flat topography, with elevations mostly between 0 and 15 m. Its eastern coastal areas have higher elevations.
The Laizhou Bay coastline represents a high-impact zone for cold wave-induced storm surges [39]. Due to the low-lying topography in its central–western sectors, storm surge inundation exhibits significant spatial variability. Regional exposure encompasses critical socioeconomic assets—including fisheries, agriculture, industrial and mining infrastructure, and built environments—along with vulnerable ecological systems. This convergence of high-value exposure and inherent vulnerability indicates substantial disaster loss potential from storm surges [40]. Consequently, a comprehensive risk assessment for the Laizhou Bay coastal zone is essential for developing proactive mitigation strategies. This study employs numerical modeling to analyze the propagation and inundation dynamics induced by cold wave storm surges along the Laizhou Bay coast. Based on a comprehensive assessment integrating the vulnerability of exposed elements and the hazard intensity of cold wave-induced storm surges, we evaluated the storm surge disaster risk for the Laizhou Bay region and delineated risk zones by severity level. This research aims to enhance disaster prevention and mitigation capabilities against cold wave storm surges in the coastal areas of Laizhou Bay, ultimately aiming to reduce their impacts and support sustainable coastal economic development.

2. Analysis of the Characteristics of Cold Waves in Laizhou Bay

2.1. Classification of Cold Wave Types in Laizhou Bay

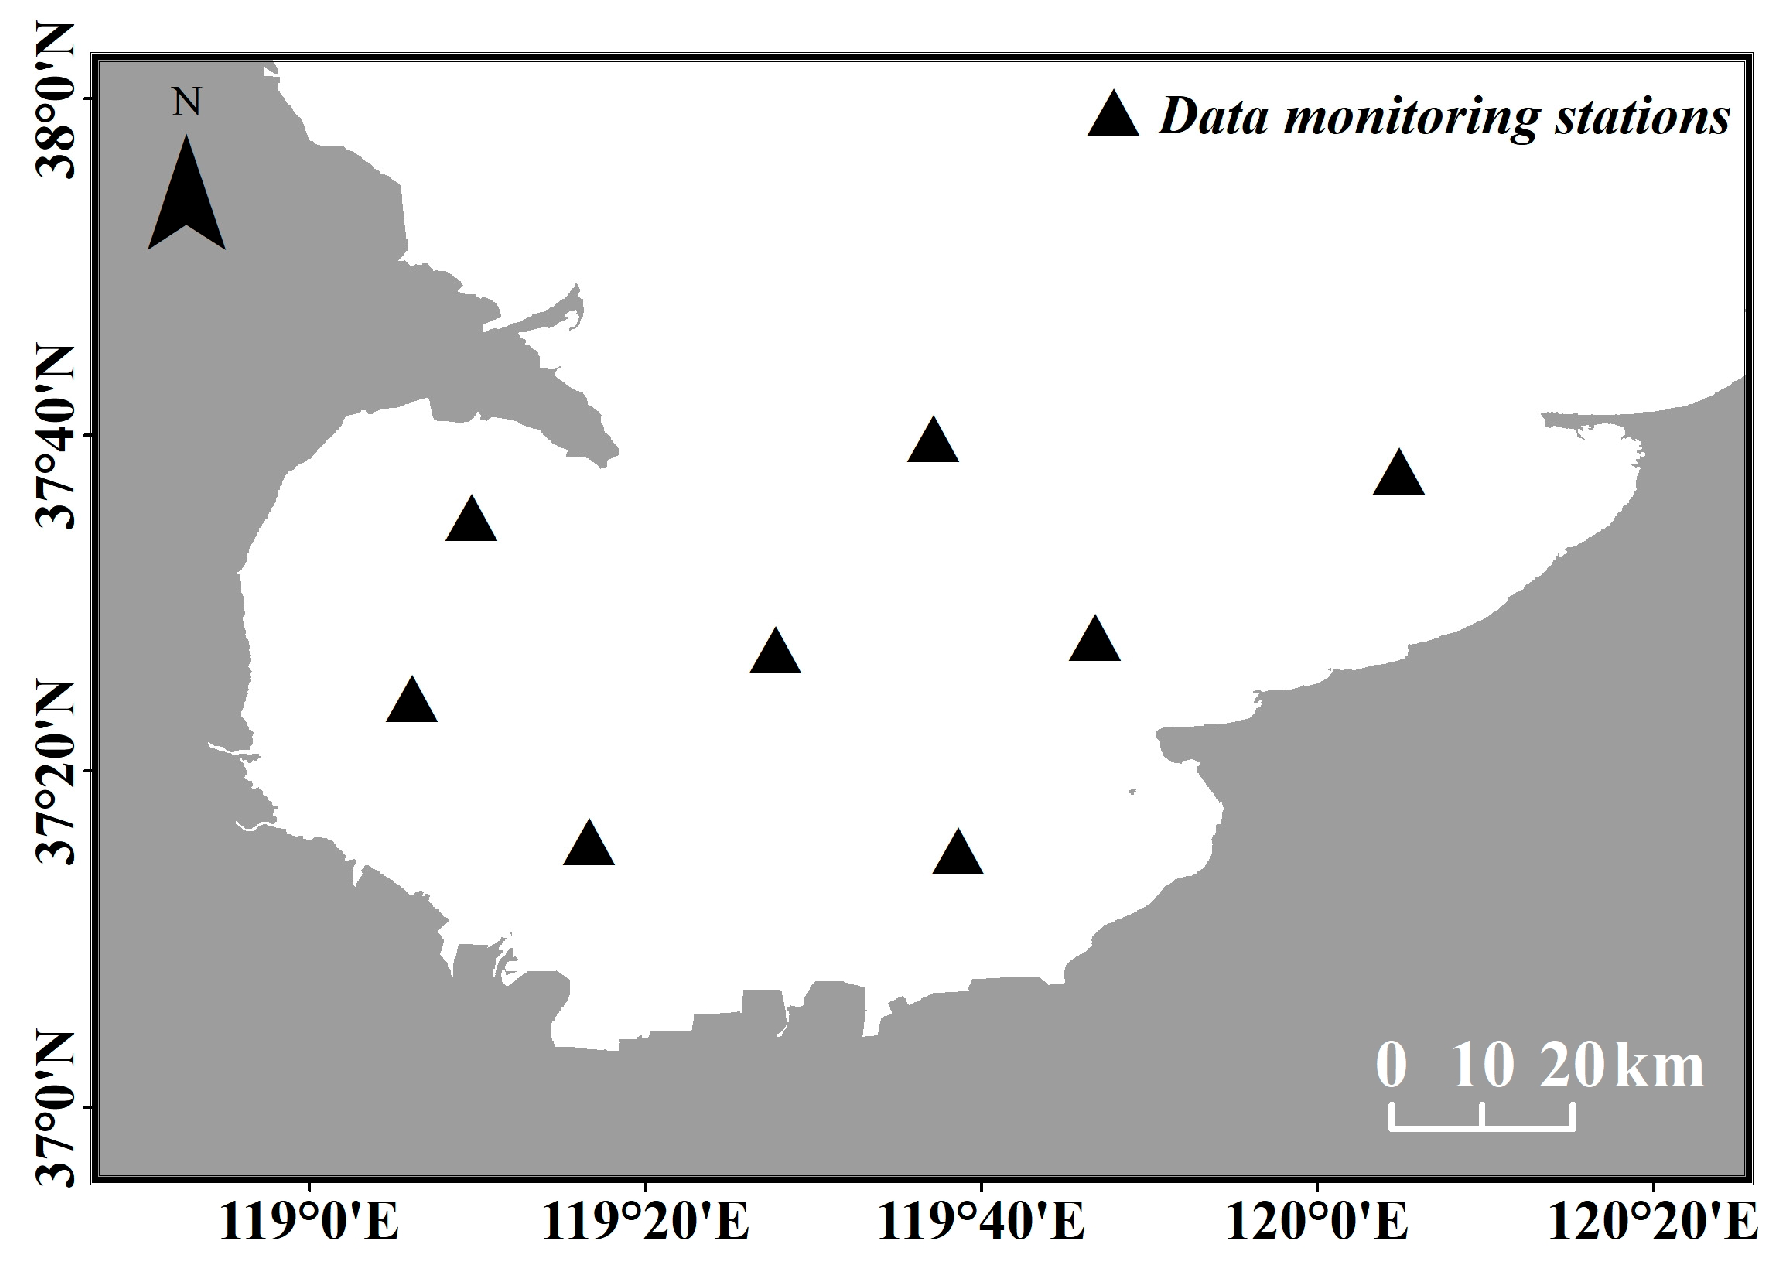
According to the national standard of the People’s Republic of China, “Cold Wave Grades” (GB/T 21987−2017), cold waves are classified into three levels (Table 1): cold wave, severe cold wave, and extremely severe cold wave [41]. A cold wave event is identified in Laizhou Bay when over 50% of the monitoring stations within the bay area meet the cold wave criteria during an outbreak. This study establishes a multi-site observation system using eight ERA5 data point locations selected within the Laizhou Bay region. The positions of these ERA5 points in the Laizhou Bay area are shown in Figure 2 below.
Cold wave events are classified according to the formation location and pathway characteristics of their cold air masses [1,2,3]. Northern-Path Cold Waves: Cold air originating from the Kara Sea and East Siberian Sea moves southward via Northern Asia into China, ultimately intruding into the Laizhou Bay. Northwestern-Path Cold Waves: Cold air formed in the White Sea and Barents Sea traverses Russia and Mongolia before entering China and invading the Laizhou Bay. Western-Path Cold Waves: Cold air developing over the ocean south of Iceland advances through the Mediterranean–Caspian corridor into China, eventually reaching the Laizhou Bay.
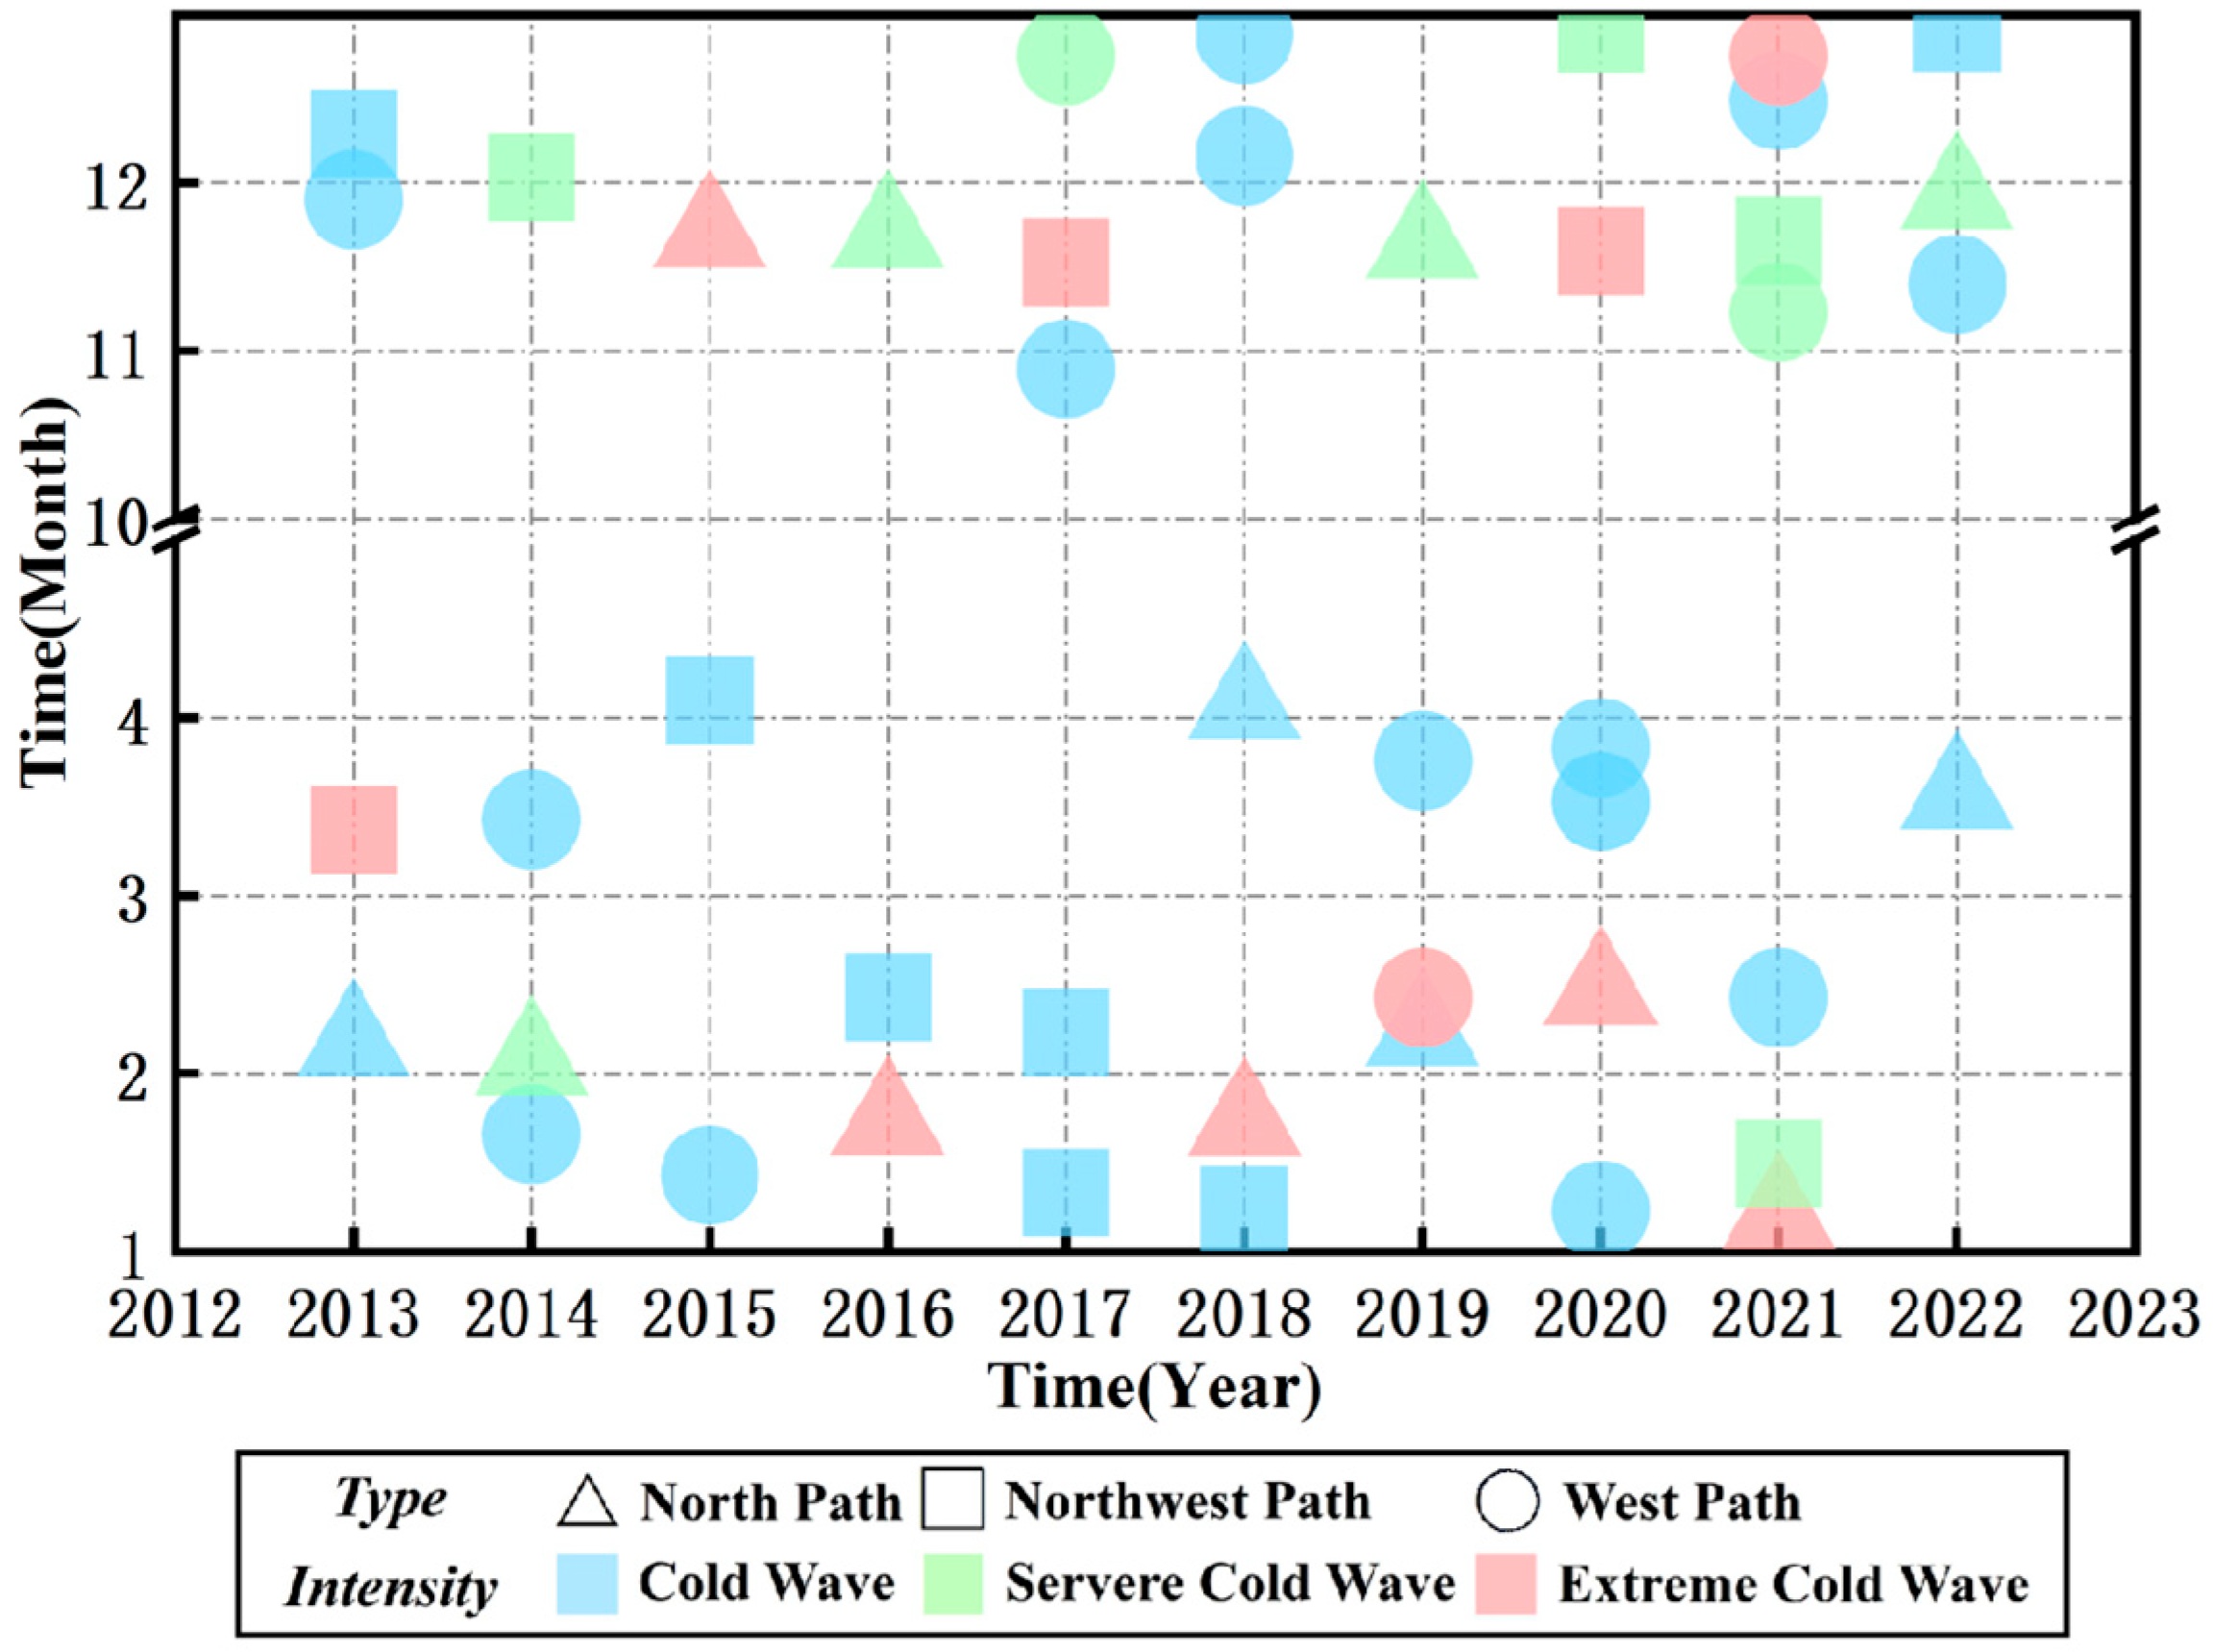
Since the period from 2013 to 2022 falls within the extended phase of the climate reference period, and cold waves occurred relatively frequently during this period, the fact that there were many cold wave events but they were classified into few categories makes it possible to capture recent extreme cold wave events [37,38]. This study utilized the ERA5 dataset provided by the European Centre for Medium-Range Weather Forecasts (ECMWF) to classify and statistically analyze the cold waves entering Laizhou Bay from 2013 to 2022. The ERA5 dataset, with a spatial resolution of 1° × 1° and a temporal resolution of 6 h [42], has been validated for its applicability in China by researchers [43]. The analysis results for different types of cold waves are presented in Figure 3. Against the backdrop of global warming, cold wave outbreaks have increased in number while maintaining a decreasing frequency trend. During 2013–2022, Laizhou Bay experienced relatively more frequent cold wave occurrences compared to the past [37,38]. Additionally, from the perspective of atmospheric circulation evolution, cold waves following the western path were the most frequent.

2.2. Characteristics of Cold Waves in Laizhou Bay

Statistics on the maximum sustained wind speed and wind direction during cold wave processes in the coastal areas of Laizhou Bay from 2013 to 2022 were conducted, with the results displayed in Figure 4. Figure 4a–c represent the statistical results for the northern path, northwestern path, and western path, respectively. It was observed that the wind directions associated with the maximum sustained wind speeds varied across the different paths without a consistent pattern. However, for the overall paths, the wind directions were predominantly between the NW and NE. Consequently, the storm surge disaster risk in the coastal areas of Laizhou Bay under the influence of cold waves was analyzed based on the NW, N, and NE wind directions.
This study classifies cold wave wind speeds along Laizhou Bay’s coast into four levels (Force 9 to 12; Table 2), incorporating the maximum sustained wind speed during cold waves and temperate weather intensity criteria from the “Technical Guidelines for Storm Surge Disaster Risk Assessment and Zoning”. Based on this classification, wind fields were constructed for different levels of storm surge weather systems.

3. Analysis of Storm Surge Processes During Cold Wave Events

3.1. Model Construction and Validation

3.1.1. Model Overview

The MIKE21 FM model, developed by the Danish Hydraulic Institute (DHI), is a two-dimensional numerical model widely applied in hydrodynamic, wave, sediment transport, water quality, and ecological simulations for coastal zones, estuaries, river systems, and nearshore regions. This study employs the hydrodynamic module coupled with the wave module of MIKE21 FM to simulate storm surge inundation processes induced by cold wave events along the coastal area of Laizhou Bay.
The hydrodynamic module of the MIKE21 FM model is formulated based on the three-dimensional incompressible Reynolds-averaged Navier–Stokes equations, incorporating the Boussinesq approximation and hydrostatic pressure assumption. The main control equations of the hydrodynamic module are the mass conservation equation and the momentum equation, which have been widely verified [44].
Waves play an extremely important role in the model simulation of storm surge inundation. The MIKE21 SW model is a next-generation spectral wave model established on unstructured meshes, applicable for engineering applications and predictive modeling of wave conditions in coastal and estuarine regions [45]. The SW module is formulated based on the wave action conservation equation, where the wave field is represented by wave action density N ( σ , θ ) , with relative wave frequency σ and wave direction θ serving as independent variables in the governing equations. The relationship between the wave action density spectrum and wave energy spectral density E ( σ , θ ) is expressed as follows:
N ( σ , θ ) = E ( σ , θ ) σ
In Cartesian coordinates, the wave action conservation equation of MIKE21 SW is the following:
N t + · ( v N ) = S σ
In the governing equations, denotes a four-dimensional differential operator in the x ¯ , σ , and θ coordinate space; v ¯ represents wave propagation velocity, with v = ( c x , c y , c σ , c θ ) ; c x and c y indicate wave propagation velocities in different directions; c σ corresponds to the relative frequency variation induced by water depth changes and current effects; c θ describes refraction caused by depth and current variations (note: symbol conflict exists as c g also represents wave group velocity); k is the wave number; and x signifies a two-dimensional operator, where the key relationships are expressed through the following formulations:
( c x , c y ) = d x d t = c g + U
c σ = d σ d t = σ d σ t + U · x d c g k · U s
c θ = d θ d t = 1 k σ d d m + k · U m
c g = σ k = 1 2 1 + 2 k d s i n h ( 2 k d ) σ k
In the MIKE21FM model, the hydrodynamic module calculates water levels and flow fields and passes them to the wave module as input conditions. The wave module then calculates the wave radiation stress and passes it back to the hydrodynamic module as a driving force to continue calculating water levels and flow fields [46].

3.1.2. Model Setup

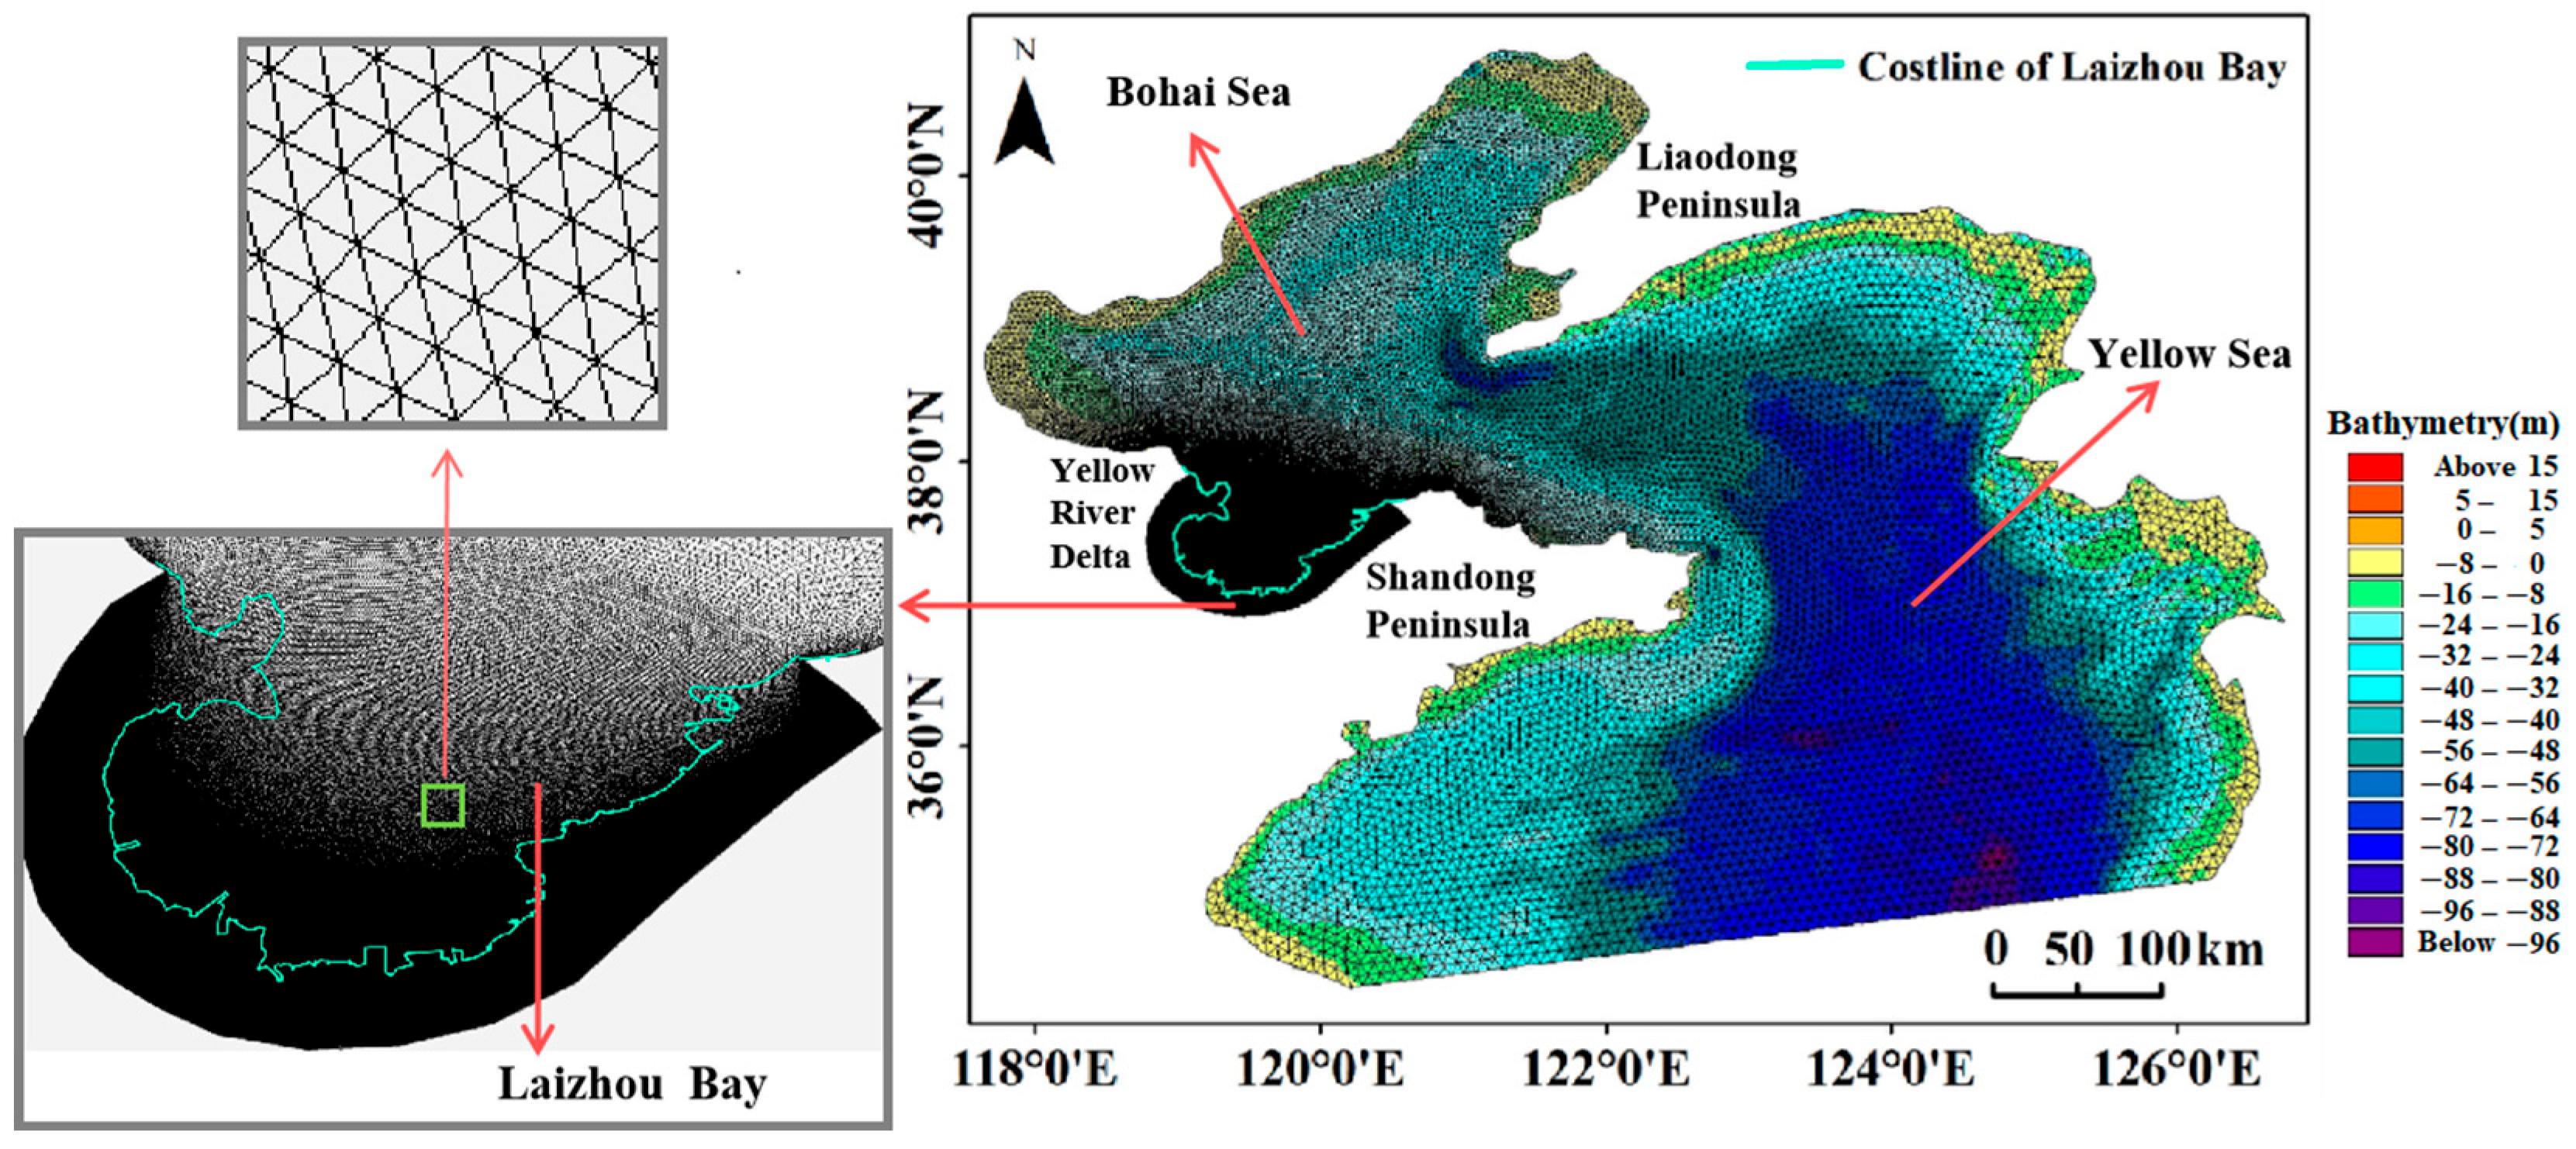
The computational grid for this study spans the region from 117°43′ E to 126°39′ E and 34°5′ N to 40°57′ N, with the terrestrial domain covering the coastal area of Laizhou Bay. The computational domain utilizes an unstructured grid for spatial discretization. The grid resolution at the open boundary is 10,000 m, gradually refining to 100 m along the coast of Laizhou Bay. The entire computational domain comprises 466,026 nodes and 927,638 grid cells. The Courant−Friedrichs−Lewy (CFL) condition prescribes the relationship between the time step, spatial grid size, and flow velocity, requiring the CFL number to satisfy 0 < CFL < 1. Failure to meet this criterion may induce numerical instability, manifesting as solution divergence or unphysical oscillations. In the present model, the critical CFL number is set to 0.8. To ensure computational stability, the time step is dynamically adjusted within the range of 0.01 to 30 s. For turbulence closure, MIKE 21 employs the Smagorinsky model with eddy viscosity, utilizing the default Smagorinsky constant of 0.28. Bed roughness is controlled using a Manning’s coefficient, and the inverse of the Manning’s coefficient is set to 42 s/m1/3.
Topographic data for the coastal region of Laizhou Bay were sourced from the Geospatial Data Cloud (https://www.gscloud.cn/), using SRTMDEM 90 M with an elevation resolution of 90 m. Bathymetric data were obtained from the ETOPO2022 global bathymetry dataset and Chinese coastal nautical charts. The bathymetry and land elevation are depicted in Figure 5, indicating that water depths within Laizhou Bay range from 0 to 24 m, with greater depths near the bay’s head and shallower depths near the bay’s mouth. Land elevations along the coast of Laizhou Bay range from 0 to 15 m, with higher elevations in the eastern coastal areas and relatively lower elevations in the central to western coastal regions.

3.1.3. Validation of Model Results

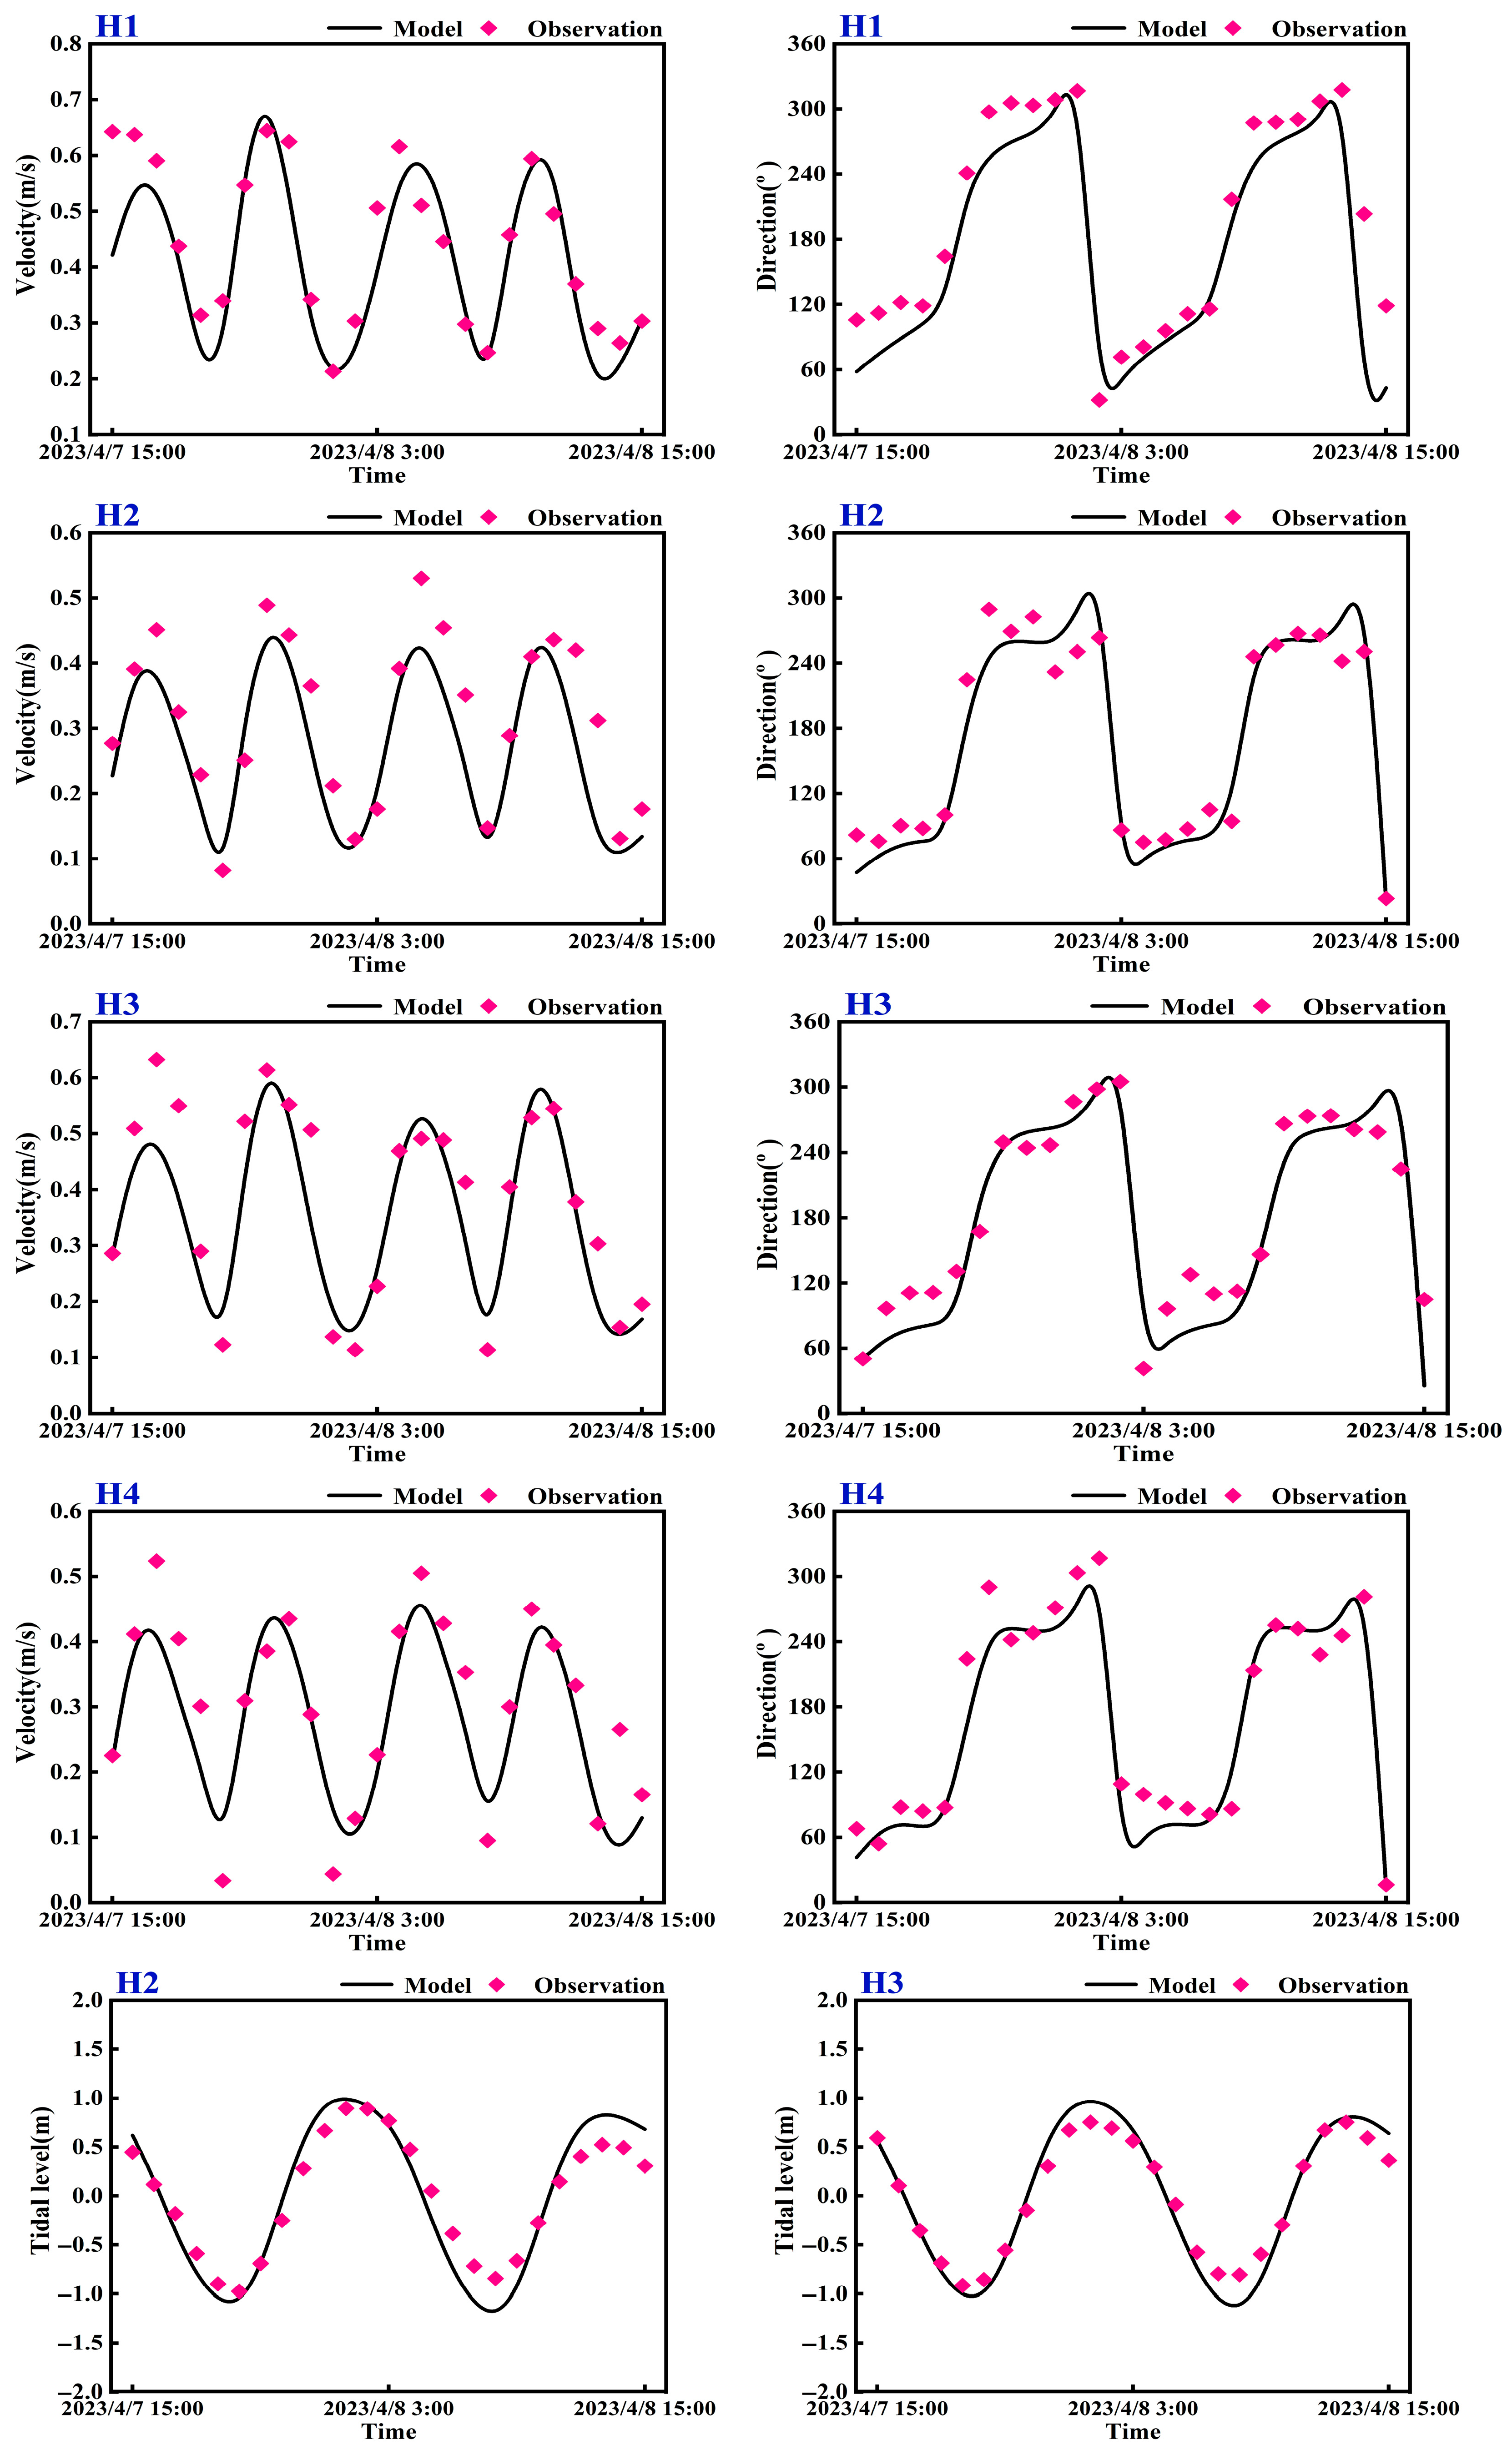
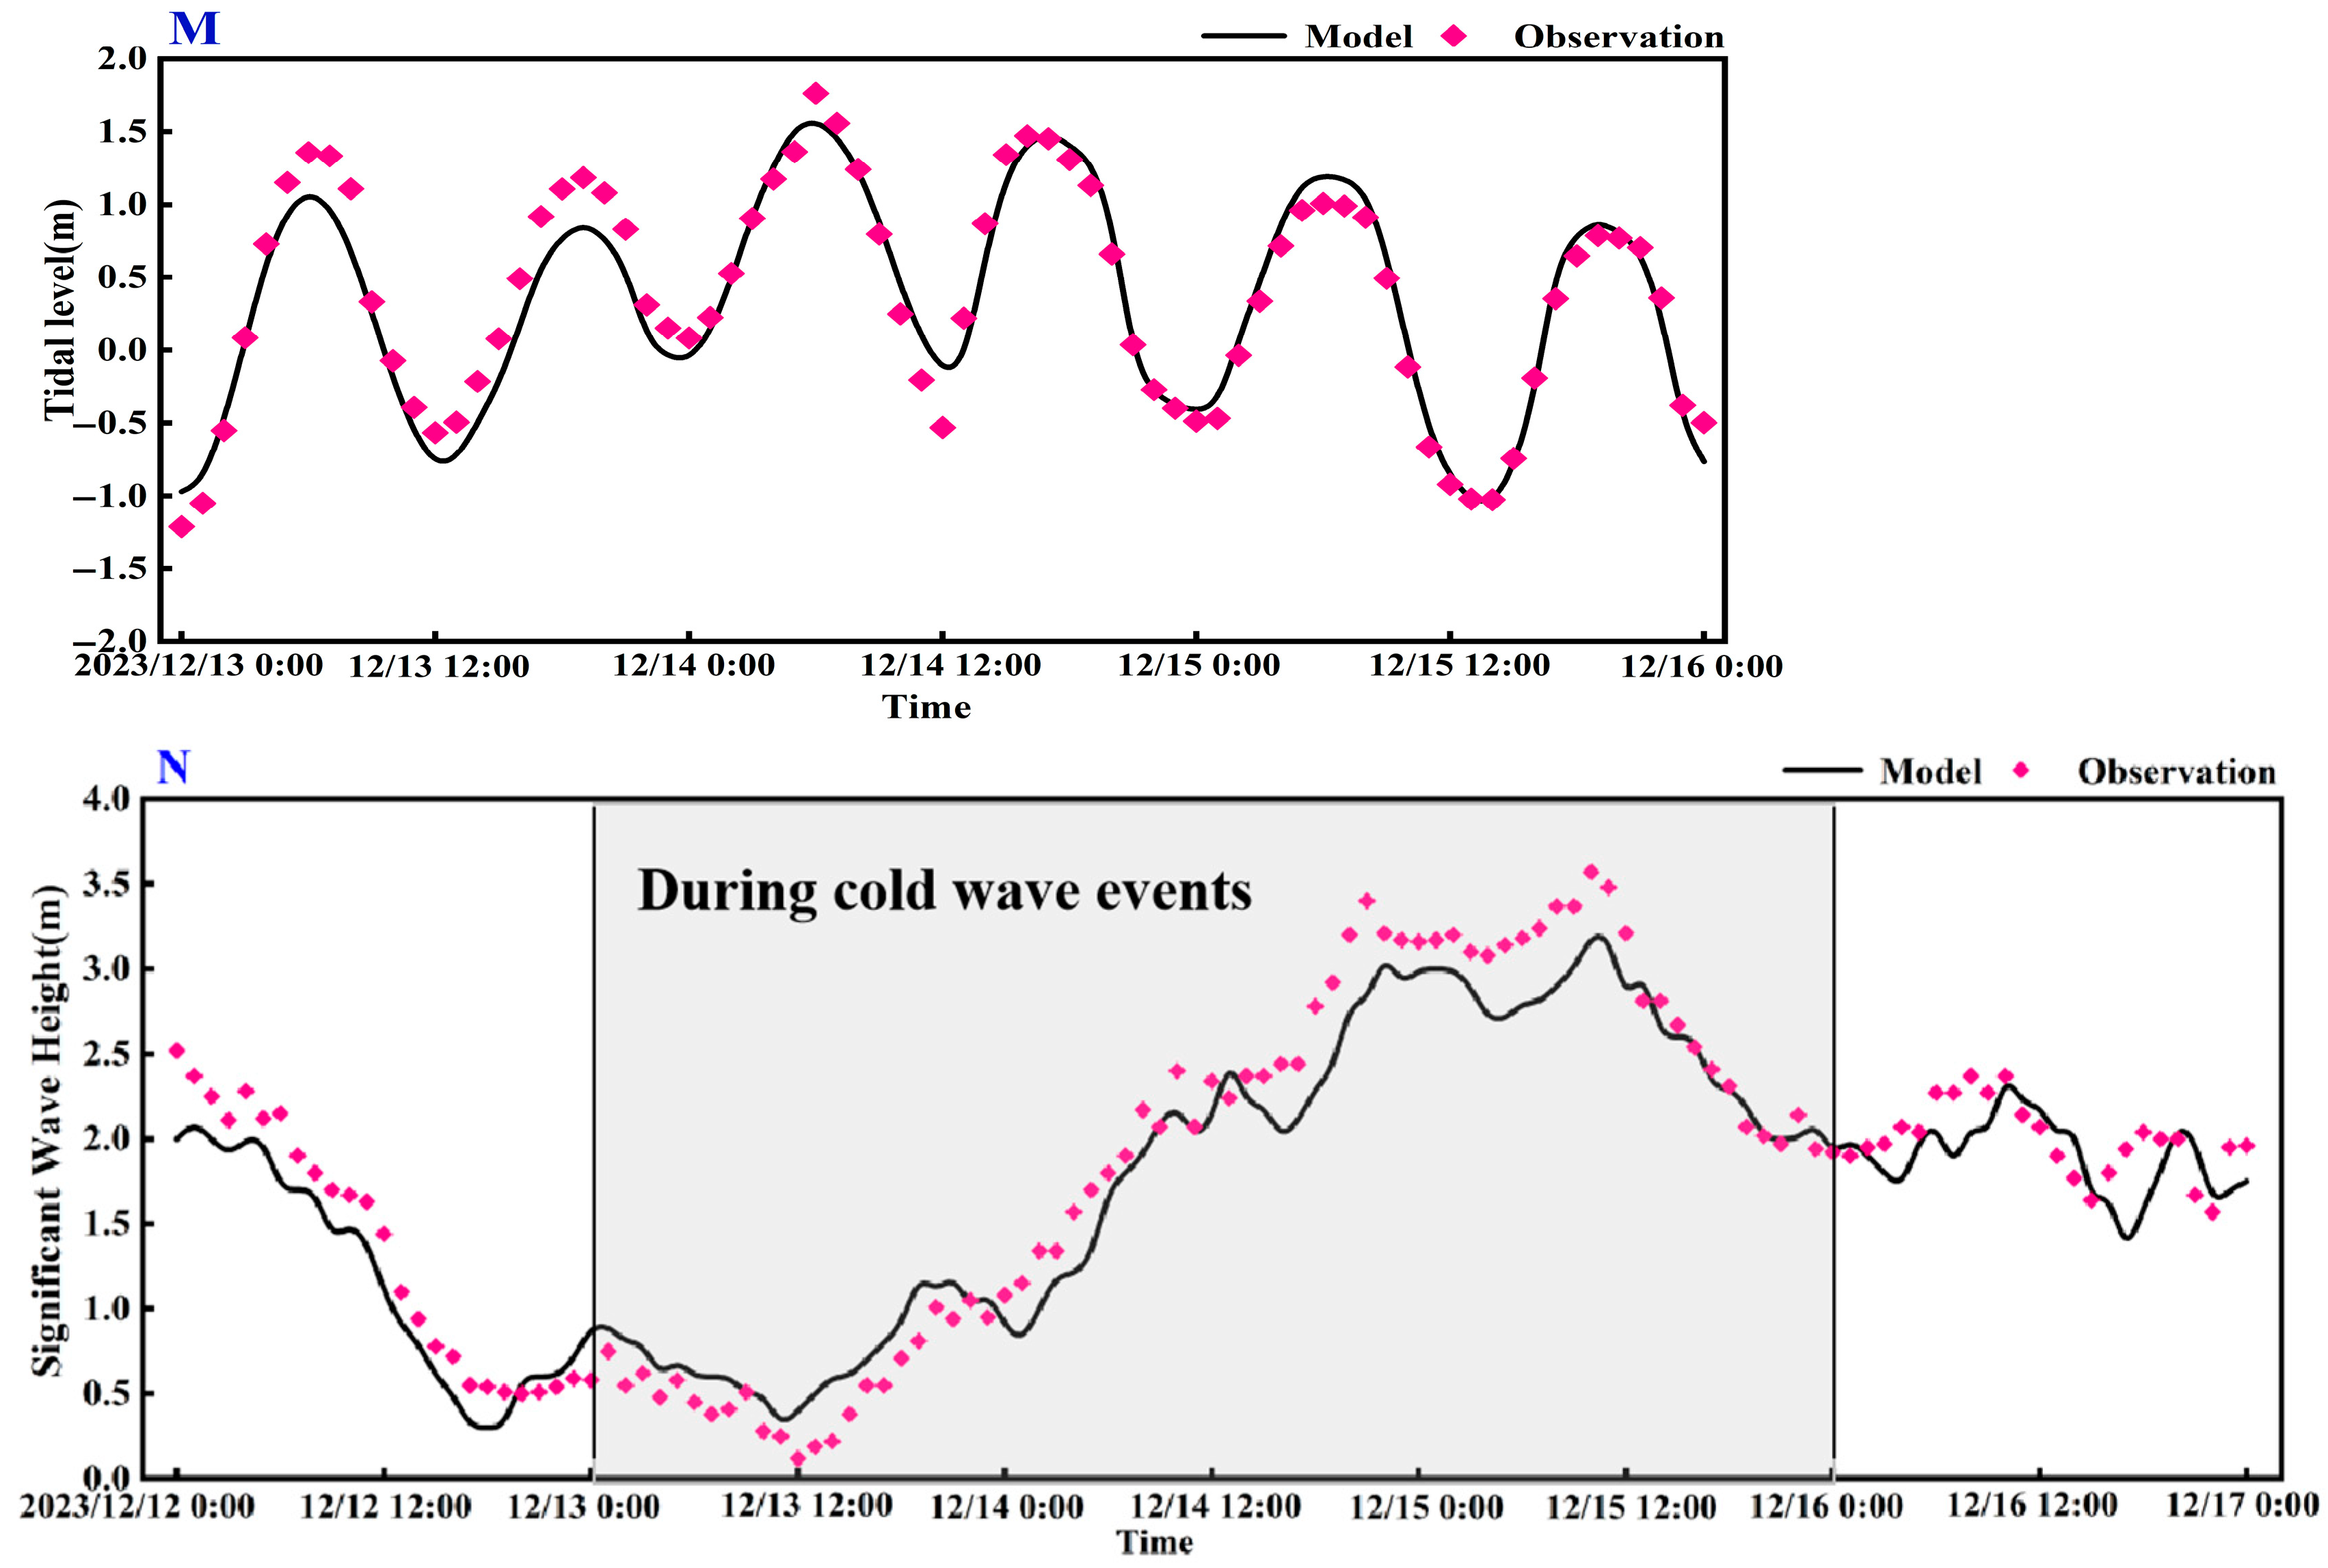
To validate the model’s accuracy, measured data on tidal levels, flow velocities, and wave conditions were utilized. Specifically, flow velocity and direction validation employed data from stations H1, H2, H3, and H4 in the western part of Laizhou Bay, recorded from 15:00 on 7 April 2023 to 15:00 on 8 April 2023. Tidal level validation was based on data from stations H2 and H3. Wave validation utilized data from station N, located near the eastern part of Laizhou Bay, during a cold wave event from 13 December to 15 December 2023, with storm surge tidal levels also verified using data from station M. The specific coordinates and geographical locations of these validation points are detailed in Table 3 and Figure 1. A comparison between the measured data and simulated results is presented in Figure 6.
To further evaluate the simulation performance of the MIKE21 flow and wave coupled model, this study applied the model skill parameter analysis method (skill) and the root mean square error (RMSE) [47]. The formulas for calculating the skill score and RMSE are shown below:
s k i l l = 1 i = 1 n M D 2 i = 1 n M D ¯ + D D ¯ 2
R M S E = D M 2 N
In the formulas: M represents the model-calculated values, D represents the measured values, D ¯ denotes the mean of the measured values, and N is the number of statistical variables. The skill value ranges from 0 to 1. A skill value of 1 indicates perfect agreement between the simulated and observed values. Values exceeding 0.65 represent excellent performance; those between 0.65 and 0.5 denote very good results; values from 0.5 to 0.2 indicate good performance; and skill scores below 0.2 are considered poor. Conversely, lower RMSE values signify smaller model errors and closer alignment with actual measurements. The results of these assessments are summarized in Table 4.
The comparison shows that the skill values for all station elements exceeded 0.8, with RMSE values for tidal levels below 0.25 m for flow velocities below 0.4 m/s, for flow directions below 50°, and for significant wave heights below 0.3 m. The simulated tidal levels and flow velocities closely aligned with the measured data, suggesting that the model parameters are reasonable and capable of effectively simulating the tidal dynamics in the study area. Therefore, the model was deemed suitable for further research and the prediction of storm surges.

3.2. Storm Surge Inundation Analysis

3.2.1. Scenario Setup

The storm surge hazard depends on the water level height simulated by the inundation model at the location of the exposed assets. Storm surges induced by cold waves of varying intensities are classified based on historical cold wave weather processes, considering the maximum sustained wind speed and direction to determine intensity levels. Wind fields for these weather systems are constructed to calculate inundation extents and depths, generating inundation maps and depth profiles for different storm surge intensity levels. Taking into account the intensity levels of temperate weather processes and the prevailing wind directions during cold wave events in the coastal areas of Laizhou Bay, this study selected four wind intensity levels (Force 9–12) and three wind directions (NW, N, and NE), resulting in a total of 12 computational scenarios.

3.2.2. Analysis of Storm Surge Inundation Results

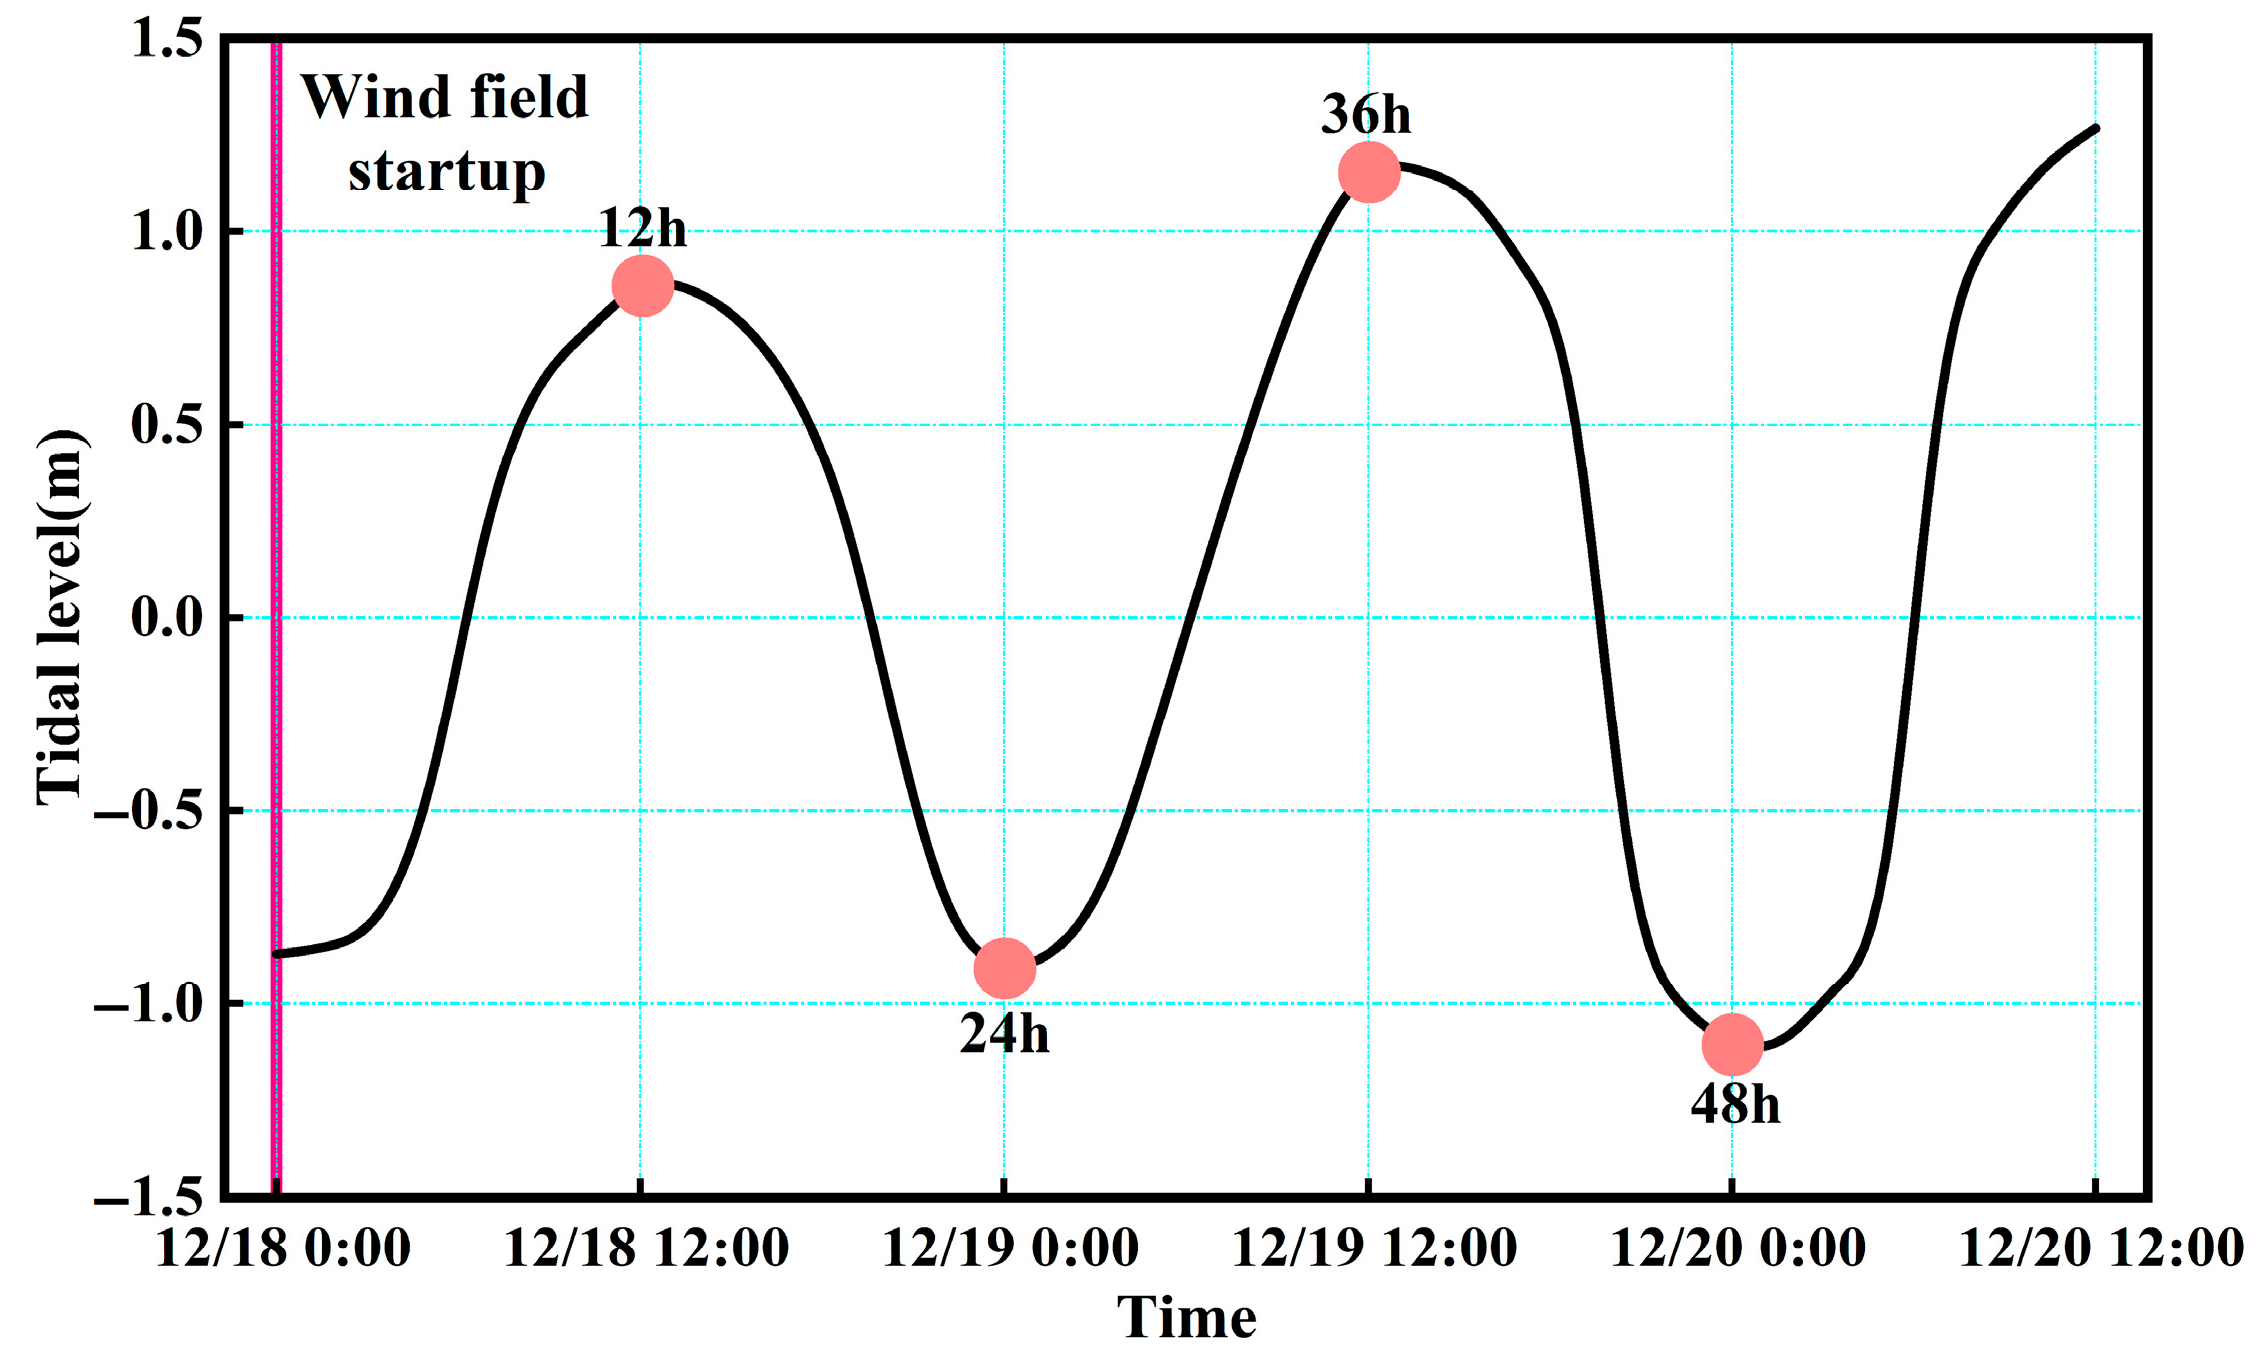
The survey data indicated that the cold wave impacts in Laizhou Bay typically persist for no more than 48 h. Consequently, this study simulates inundation dynamics within 2 days following wind field activation. Due to variations in bathymetry and topography within the bay, differential tidal wave propagation velocities between deep water and shallow water zones create temporal disparities in the tidal phases between the bay mouth and its apex. Considering the greater spatial extent and severity of storm surge impacts along the western bay margin, a representative monitoring site was selected at the 10 m isobath (approximating the average bay depth) on the western flank. The model initialization coincided with both spring tide and cold wave onset at 00:00 on 18 December 2021, with tidal level data output at 12 h intervals to prioritize analysis of critical node water level variations. Tidal sequences from 12 to 48 h post-wind field activation were extracted and phase-calibrated to align the data points with wave crests/troughs (Figure 7). Analysis reveals that higher astronomical high tide levels during cold wave wind action correlate with amplified inundation extent and severity. Consequently, the maximum tidal elevation at 36 h was adopted for storm surge inundation risk assessment.
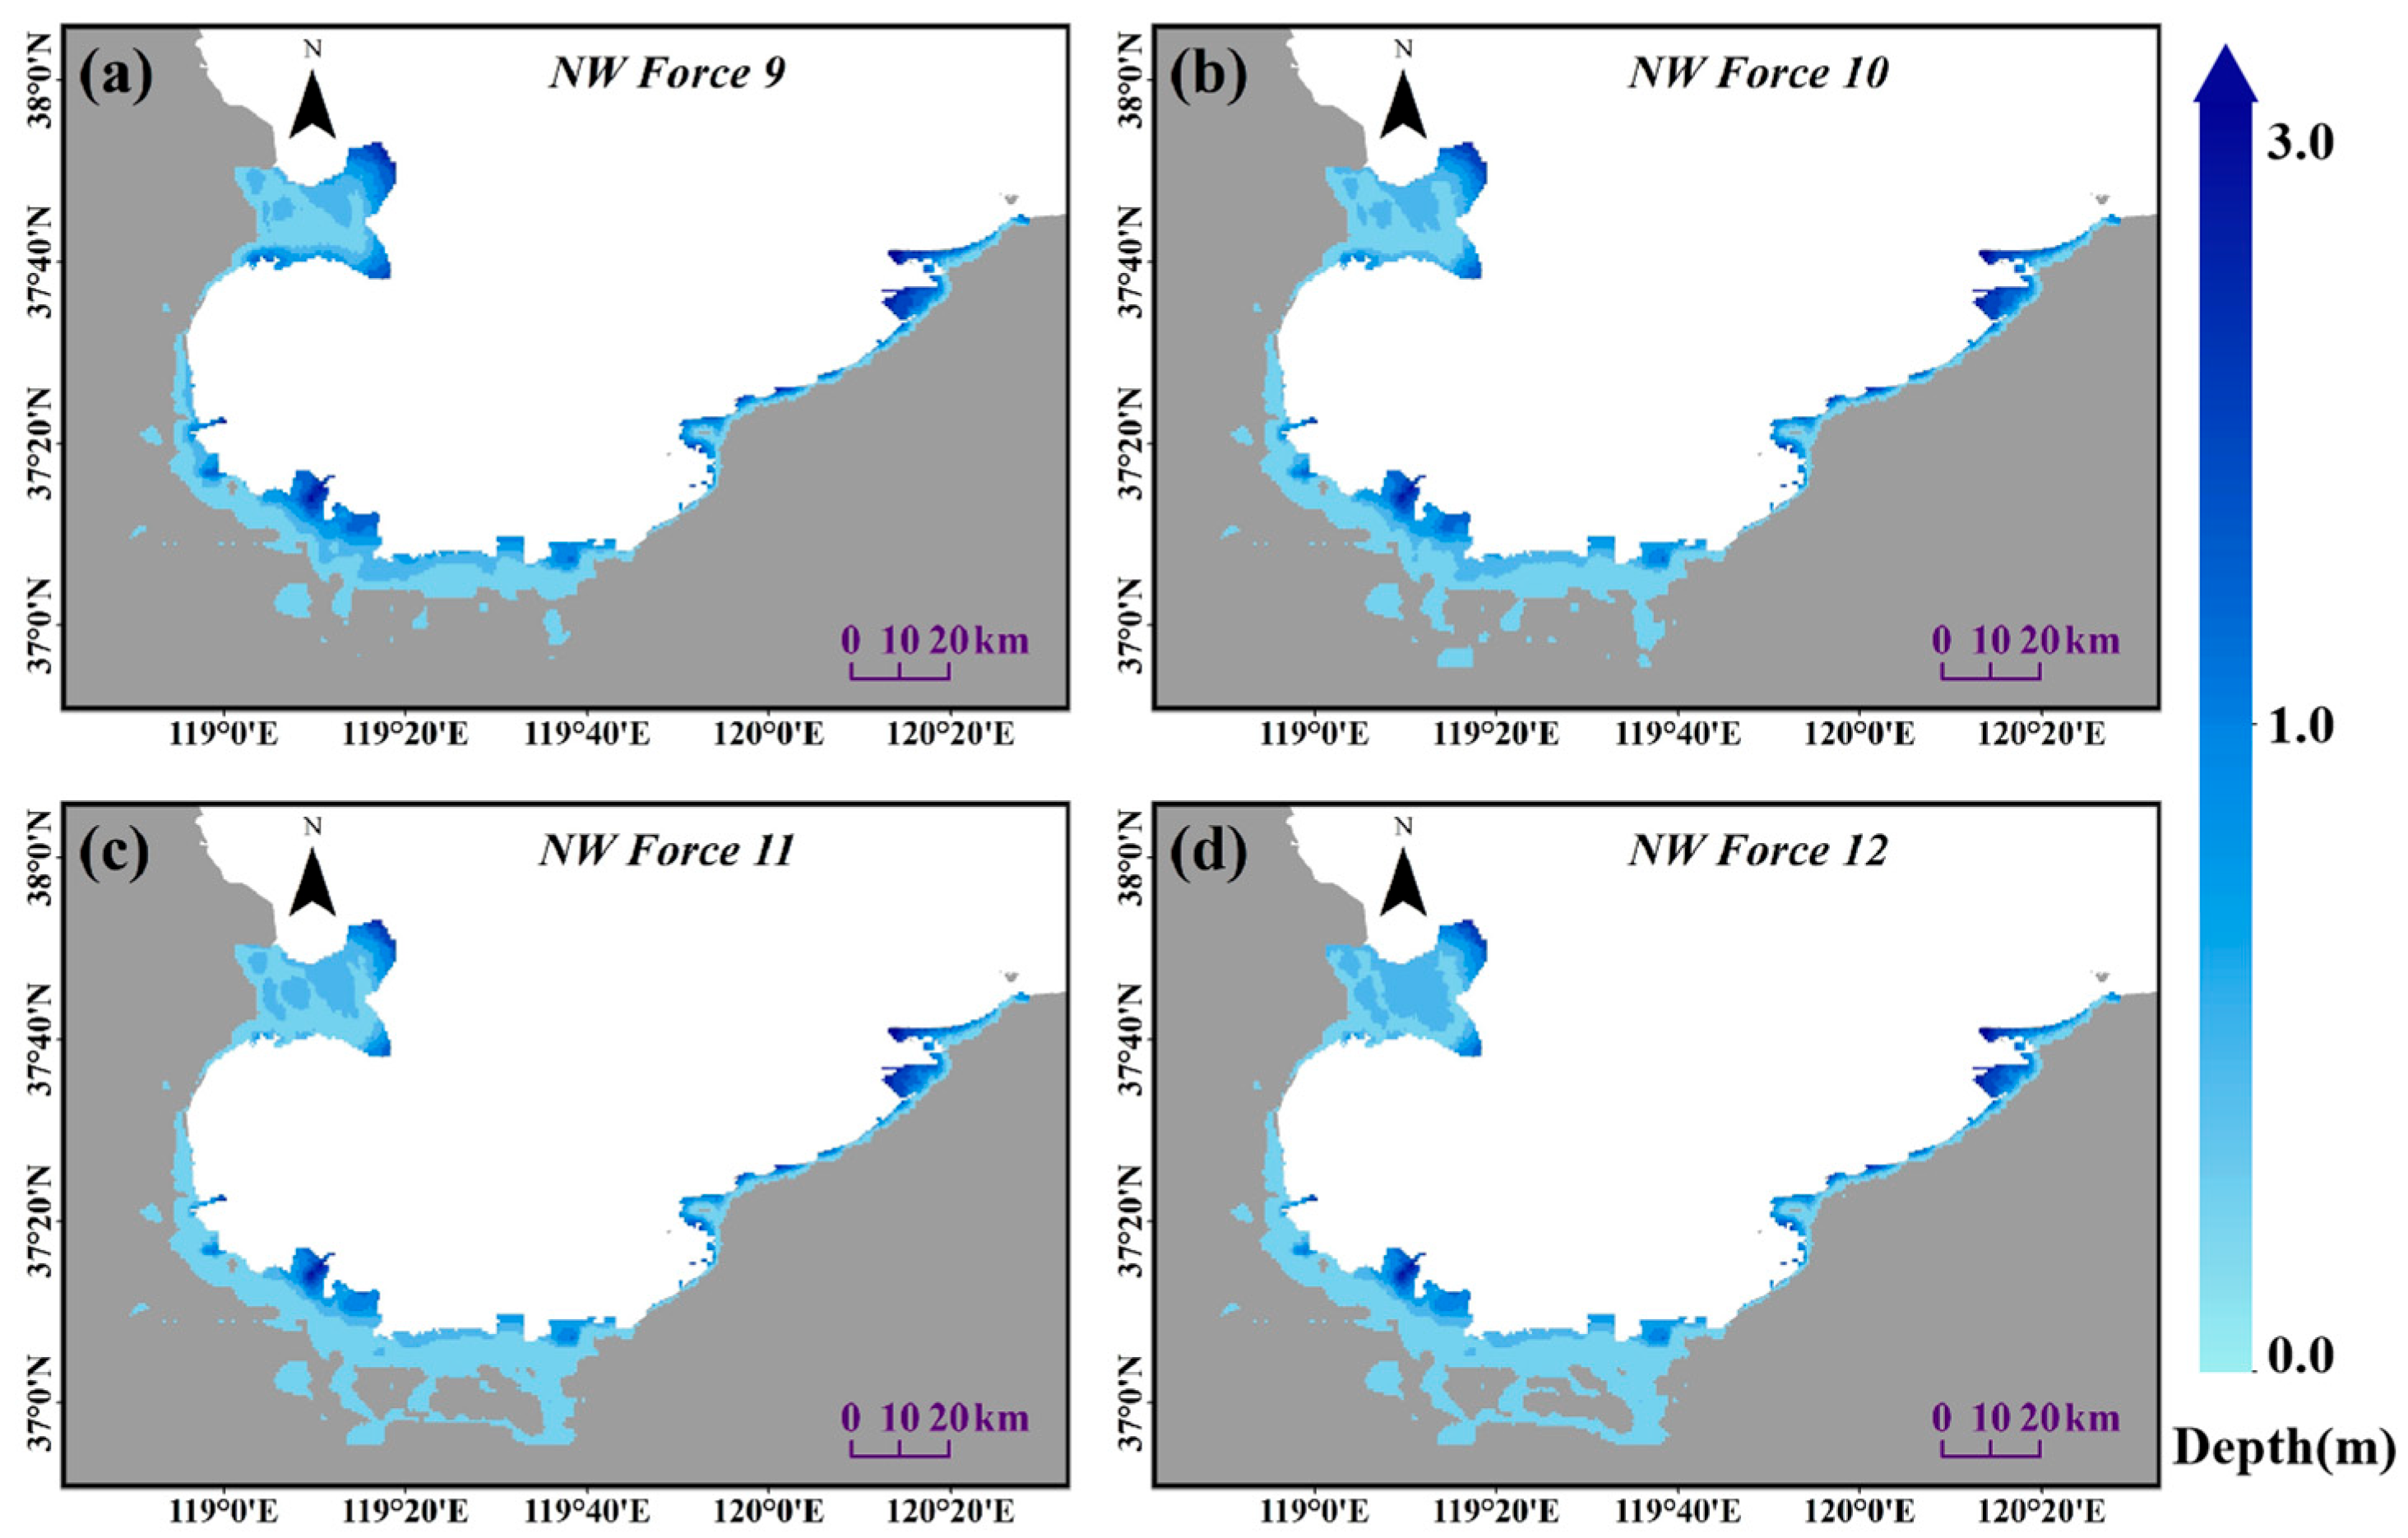
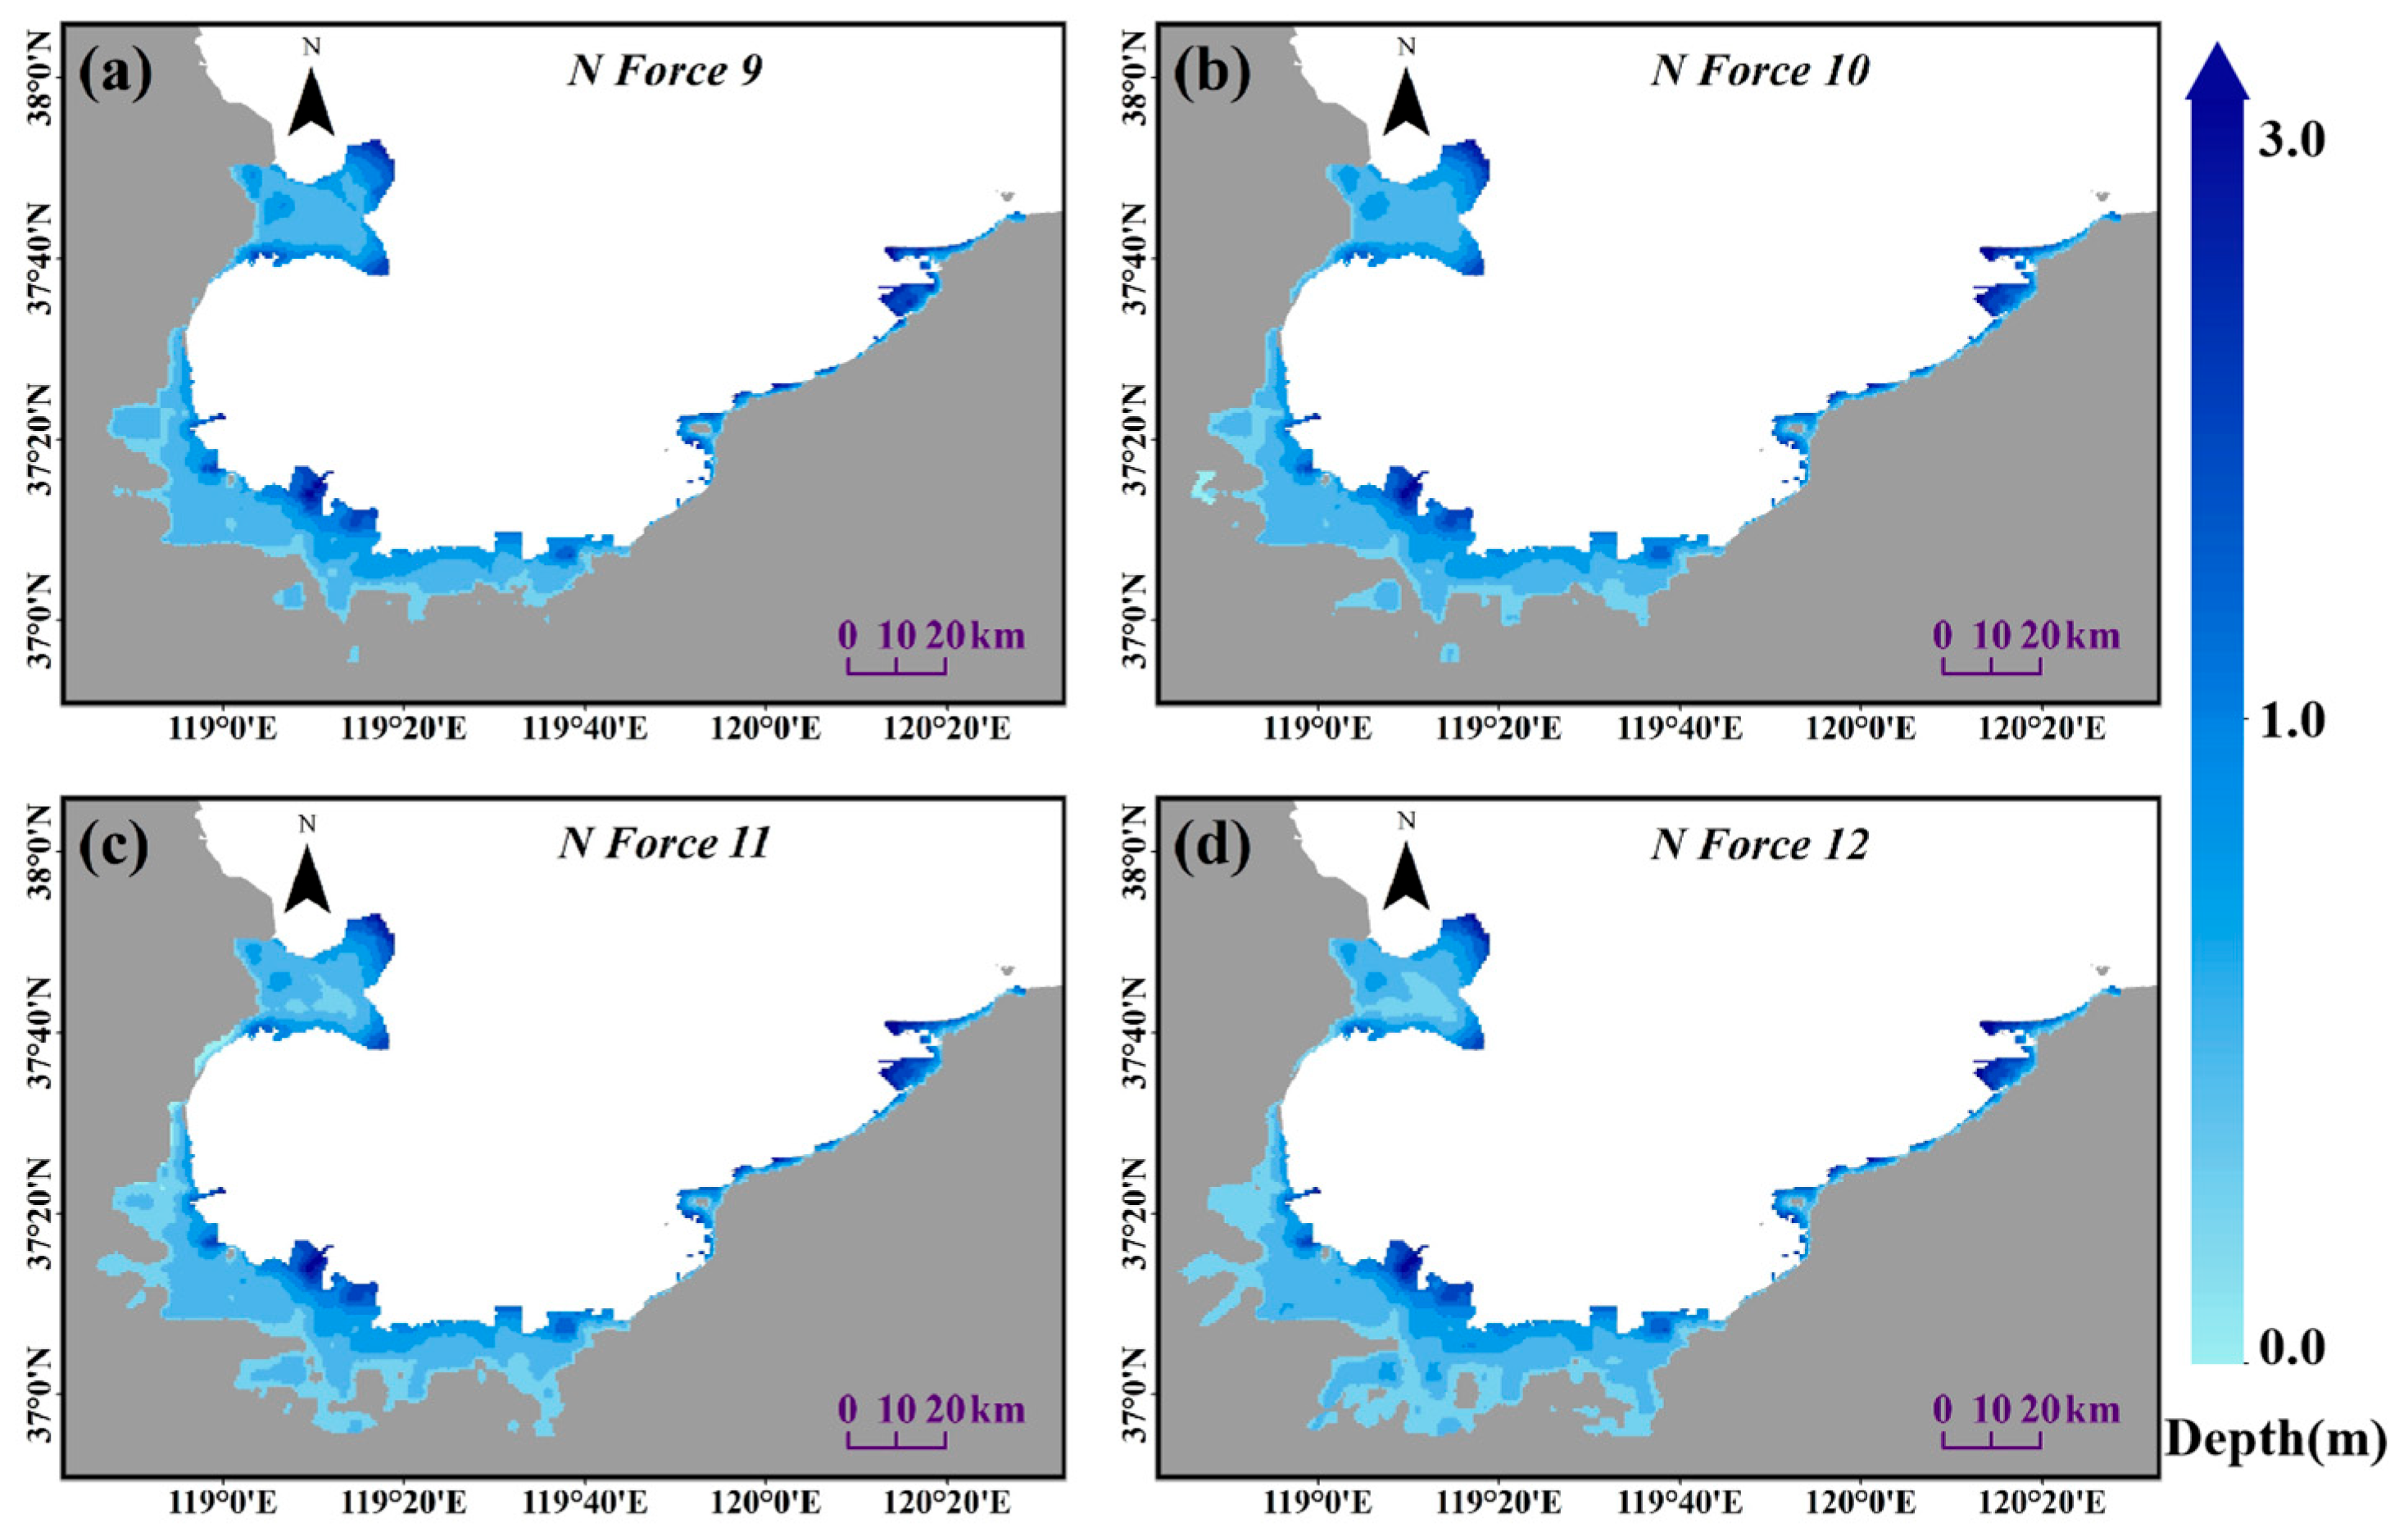
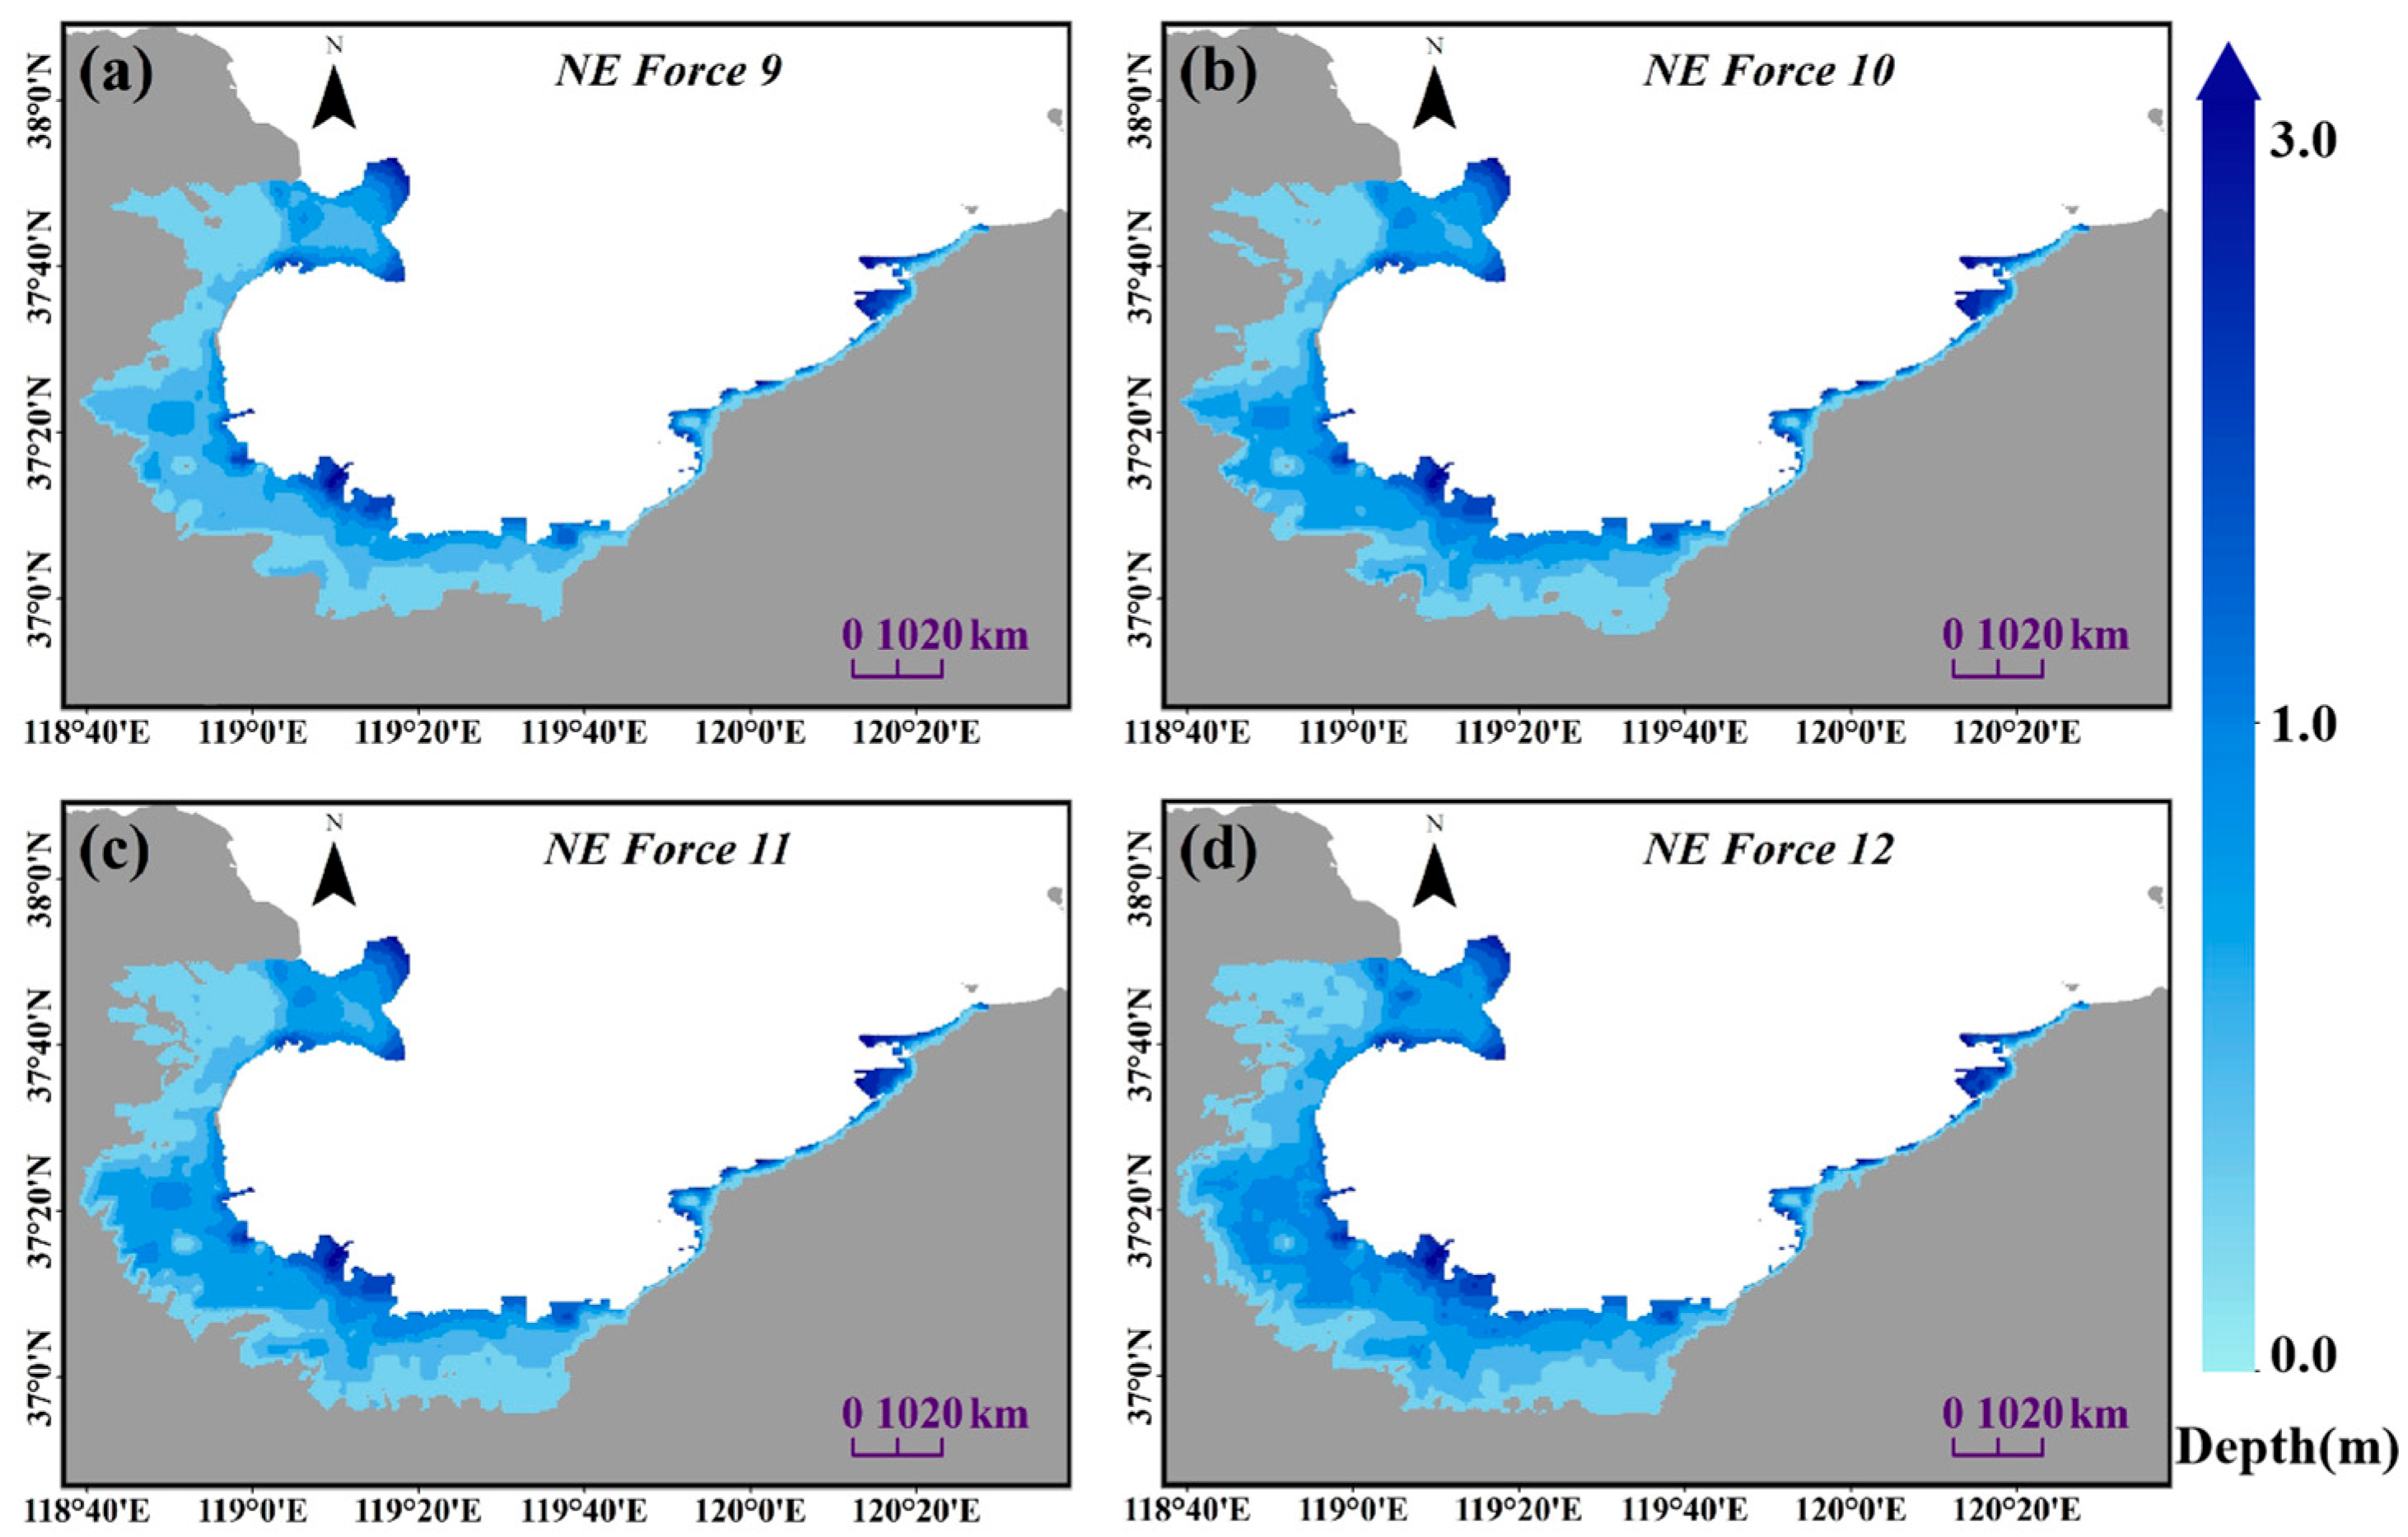
Storm surge inundation risks induced by cold wave events exhibit significant variations across wind speed categories. Figure 8, Figure 9 and Figure 10 demonstrate storm surge patterns under NW, N, and NE wind directions after 36 h wind forcing during cold wave episodes. Notably, NE wind conditions generate more extensive and severe inundation compared to NW and N scenarios. The western-to-central coastal zones of Laizhou Bay, characterized by low-lying terrain, experience widespread inundation. At Weifang Port, water depths consistently reach approximately 3 m across all conditions. Conversely, the elevated topography along the eastern coastal areas concentrates higher inundation depths near shorelines, with Yulong Island maintaining around a 2.5 m water depth despite varying scenarios. Mechanistically, the western bay apex under NW/N winds restricts seawater intrusion through topographic constraints. In contrast, NE winds induce progressive inundation expansion with increasing wind speeds due to the absence of coastal barriers. This differential response highlights the critical role of bay morphology in modulating storm surge dynamics.

4. Results

4.1. Storm Surge Vulnerability Assessment

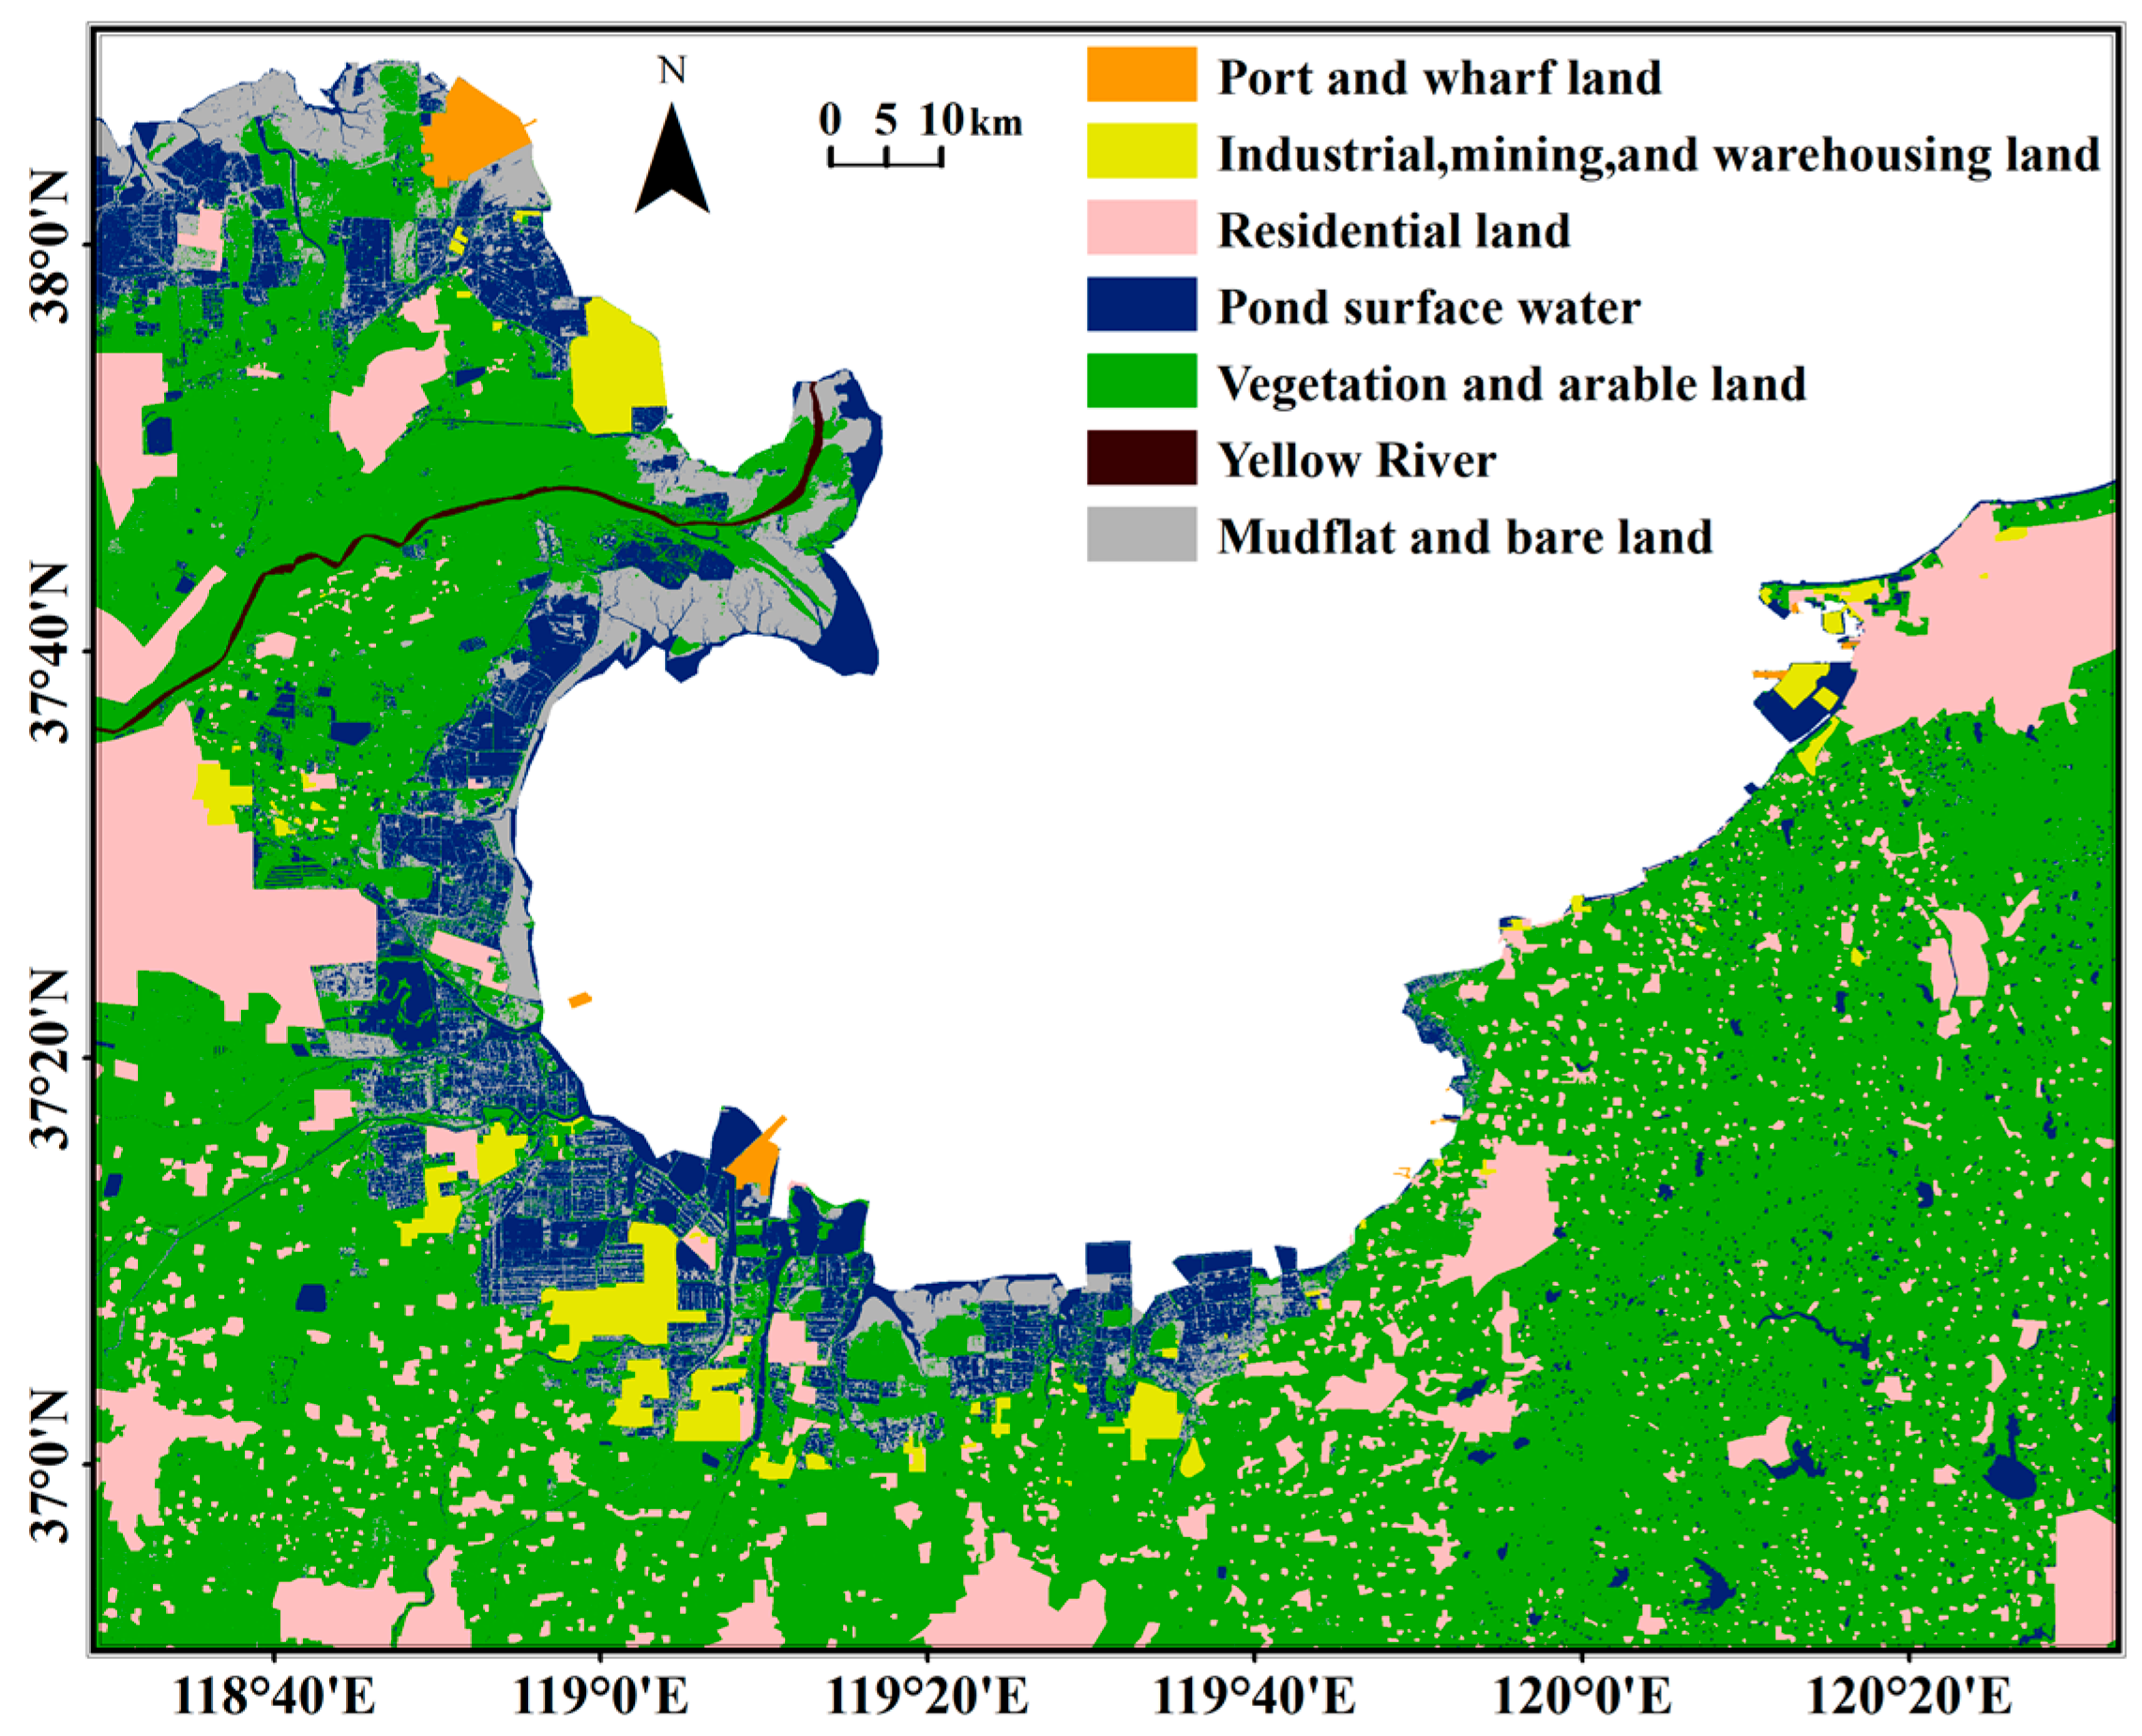
Storm surge vulnerability is fundamentally determined by the coping capacity of exposed elements against storm surge impacts, with the vulnerability of disaster-bearing entities typically defined by current land use patterns within the study area. Land use classification follows China’s National Standard GB/T 21010-2017 “Current Land Use Classification”. This study utilized Landsat8 OLI_TIRS satellite imagery from the Geospatial Cloud Platform (https://www.gscloud.cn/). Based on remote sensing images, the land use types in the coastal areas of Laizhou Bay were classified, and the results are shown in Figure 11 below.
Six primary land use types characterize the Laizhou Bay coastal zone: residential land, vegetation and cultivated land, port and wharf facilities, industrial and mining storage sites, pond surface water, and tidal flats. The eastern coast is dominated by clustered residential zones and vegetation and cultivated land, while the central and western coasts feature extensive tidal flats and aquaculture ponds. Notably, the central coast also contains concentrated industrial and mining storage complexes. Residential areas exhibit clustered or patchy distributions; aquaculture ponds comprise fish farming zones and salt evaporation fields; tidal flats form narrow belts with the highest concentration in the east; and industrial sites densely adjoin aquaculture ponds. Port facilities remain sparse due to natural constraints.
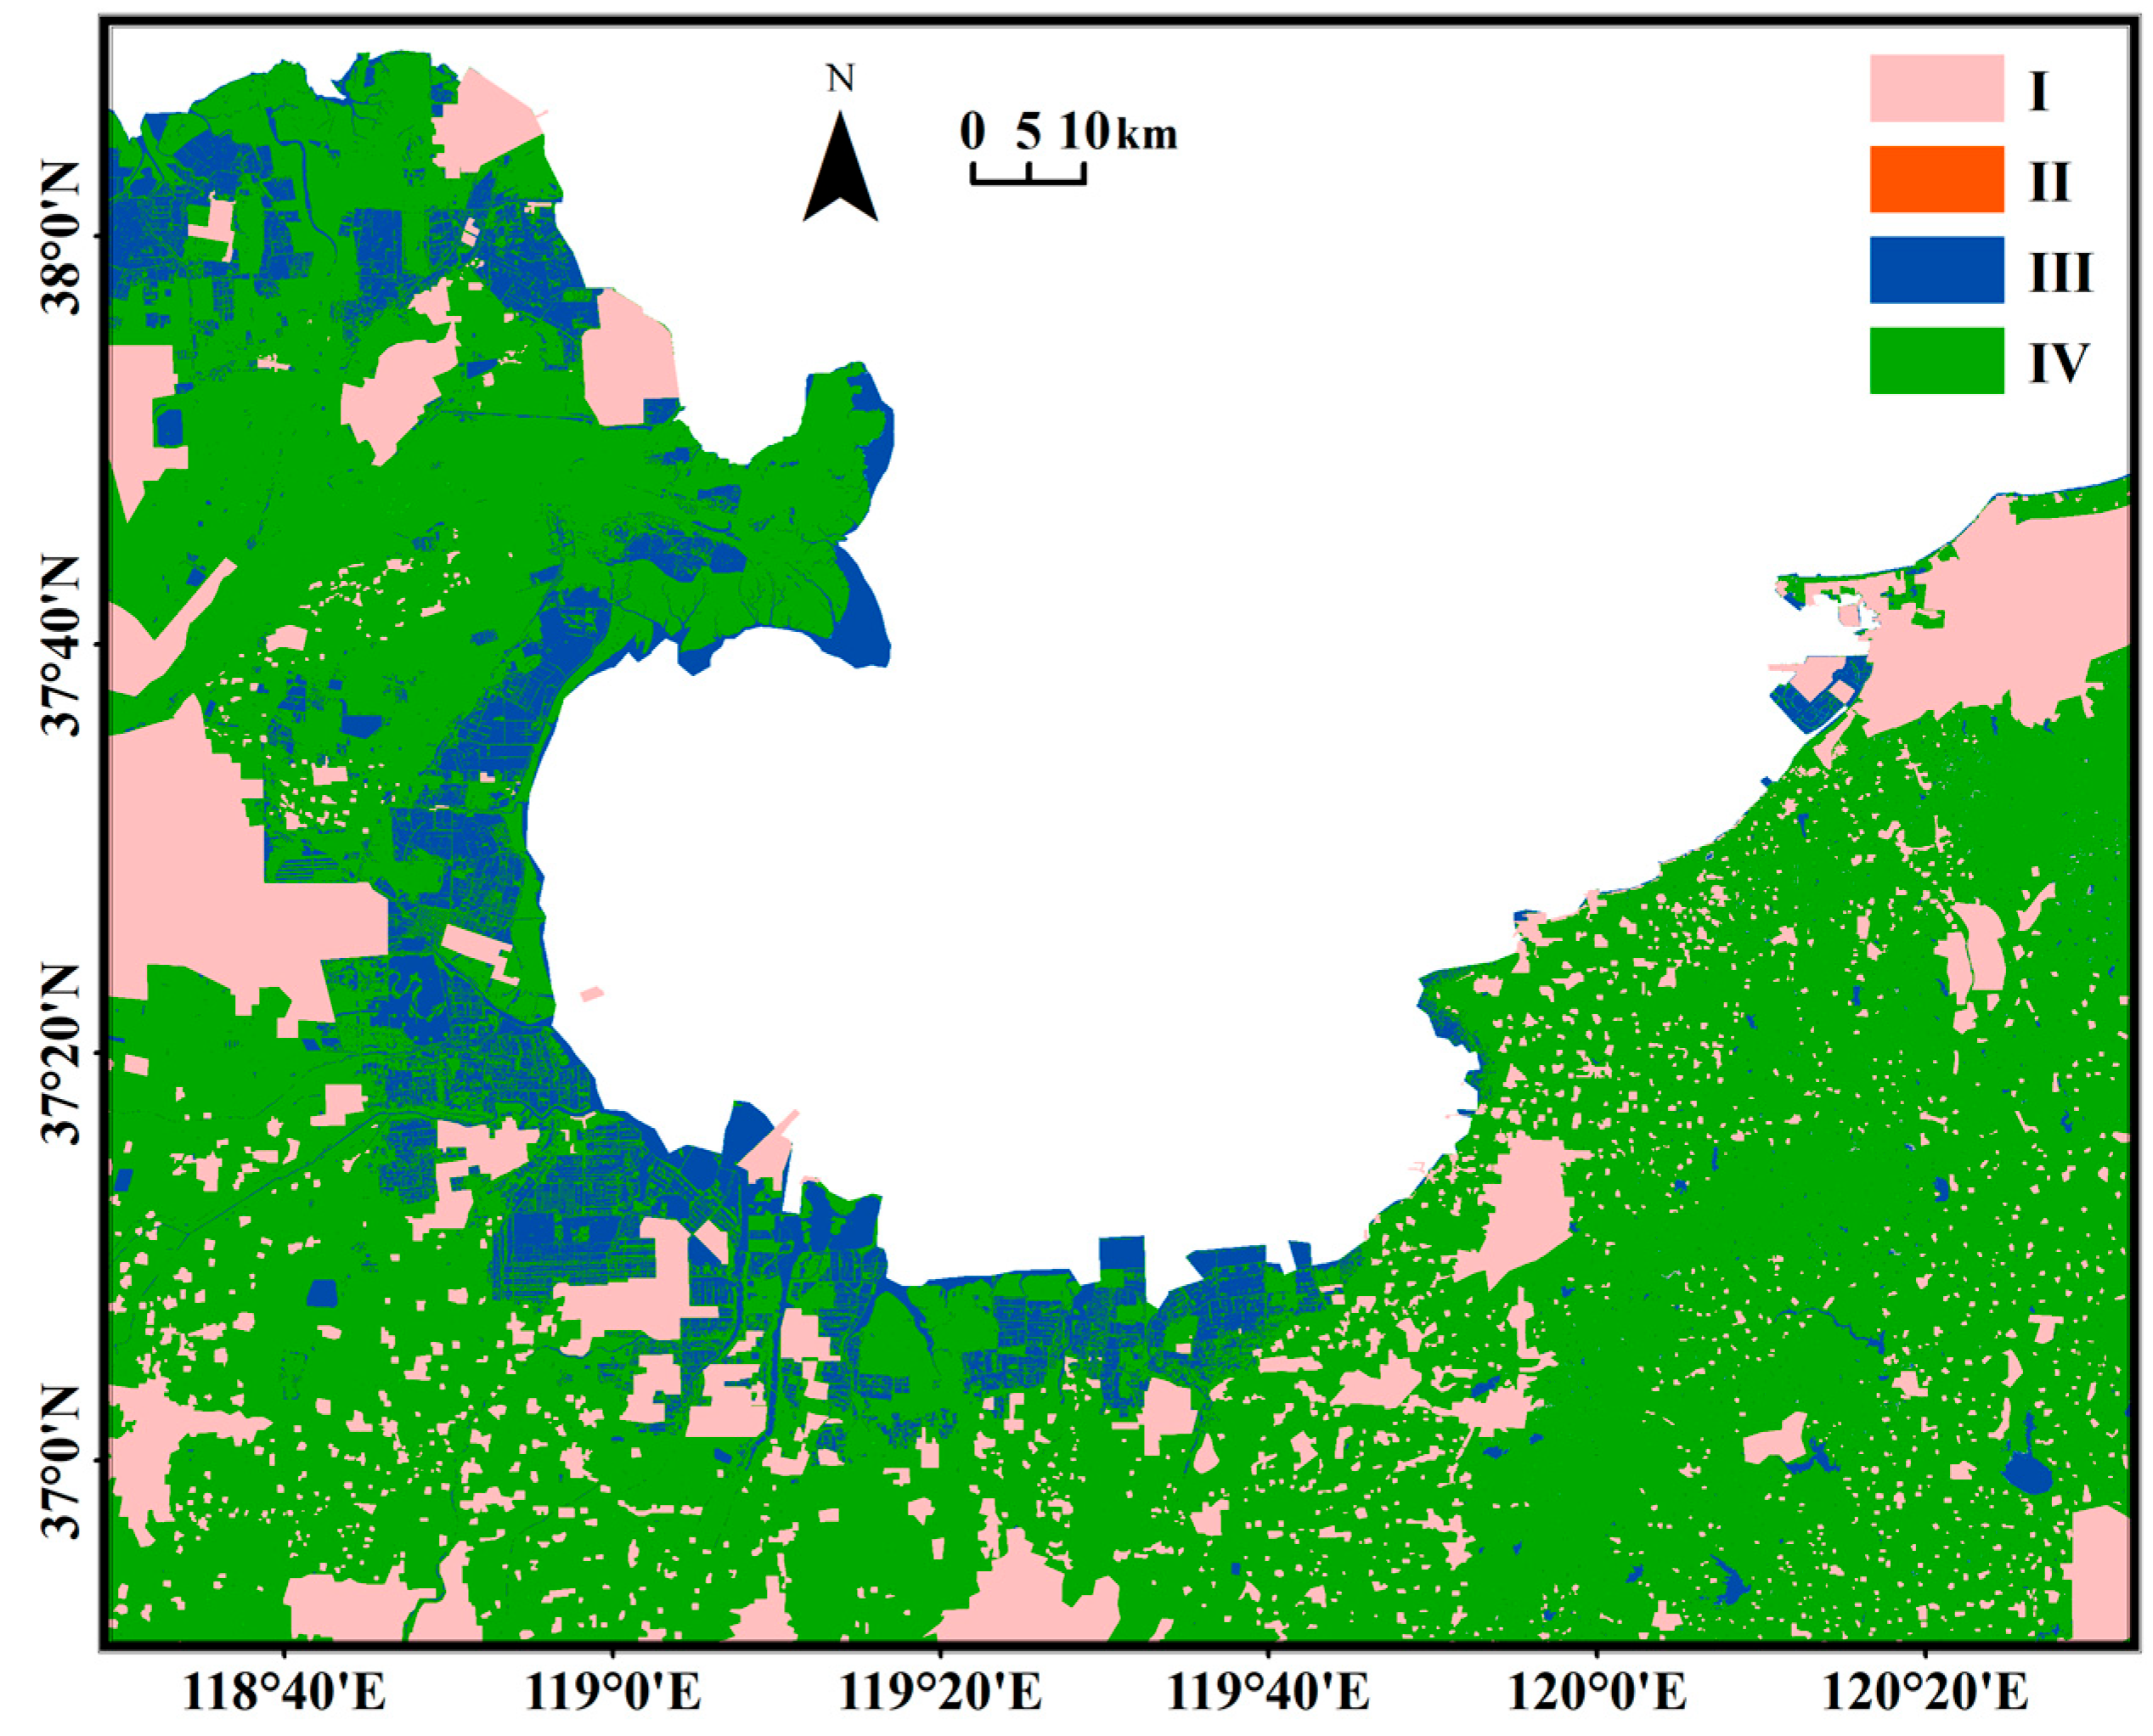
The coastal vulnerability levels along Laizhou Bay were determined using first-level land use classification parcel units as spatial assessment elements based on the vulnerability ranges and grades for current land use types specified in Table 5 and Table 6. The resulting vulnerability zoning is presented in Figure 12. Residential areas, industrial–mining–storage zones, and port facilities along the coast exhibited a high susceptibility to structural damage from storm surge flooding, and were consequently assigned to Vulnerability Levels I-II. Vulnerability Level III corresponds predominantly to salt production and aquaculture pond water body zones, which are extensively distributed across the study area. Level IV encompasses regions dominated by vegetated croplands and coastal mudflats, reflecting their distinct ecological and geomorphological characteristics.

4.2. Storm Surge Risk Assessment

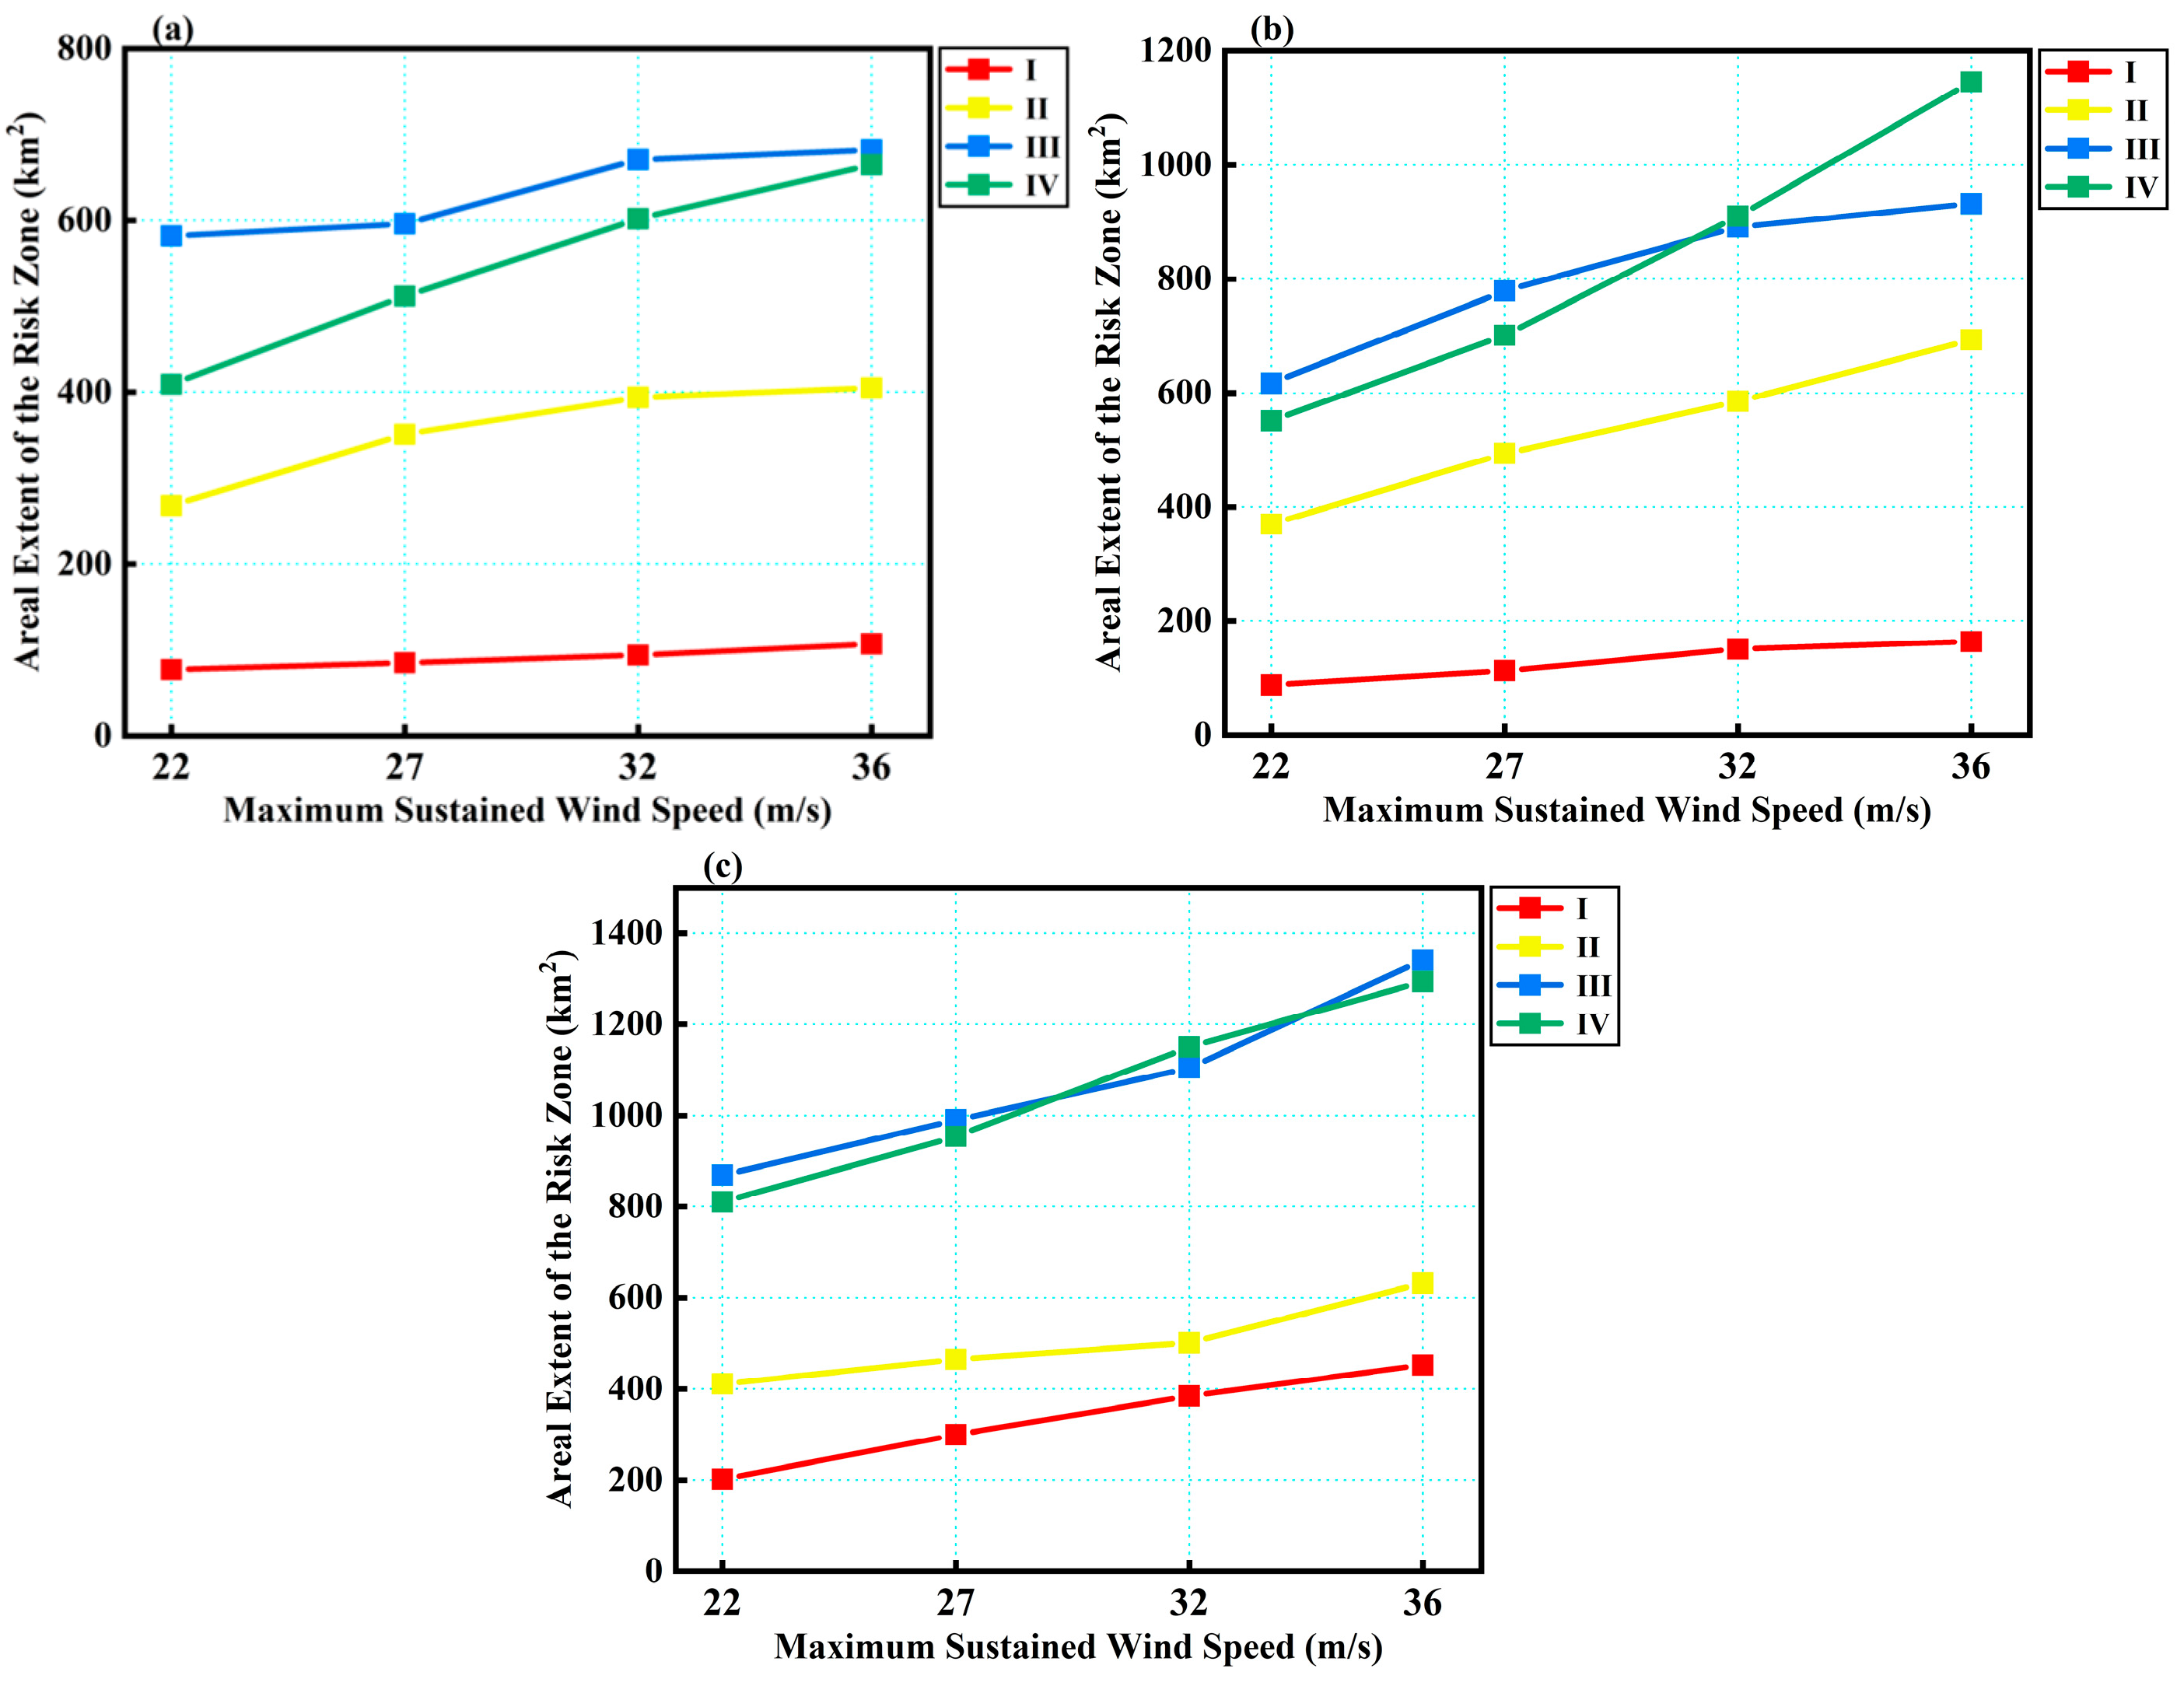
The risk level along the Laizhou Bay coast can be comprehensively determined based on the vulnerability of exposed elements and the hazard of storm surges. Based on the evaluation results of vulnerability and hazard levels, the risk levels of inundated areas along the Laizhou Bay coast are determined according to Table 7 and Table 8, with the assessment results presented in Section 4.2.1, Section 4.2.2 and Section 4.2.3. Under strong winds of different grades, the distribution of storm surge risk areas along the Laizhou Bay coast tends to align with the distribution of storm surge inundation areas. As wind speed grades increase, the areas of all risk levels expand accordingly. The areas of storm surge disaster risk levels during cold wave processes along the Laizhou Bay coast are shown in Figure 13, where Figure 13a, 13b, and Figure 13c represent the storm surge disaster risk areas under the influence of the NW, N, and NE wind directions, respectively.

4.2.1. Risk Zone Analysis for Storm Surge Under NW Winds During Cold Wave Events

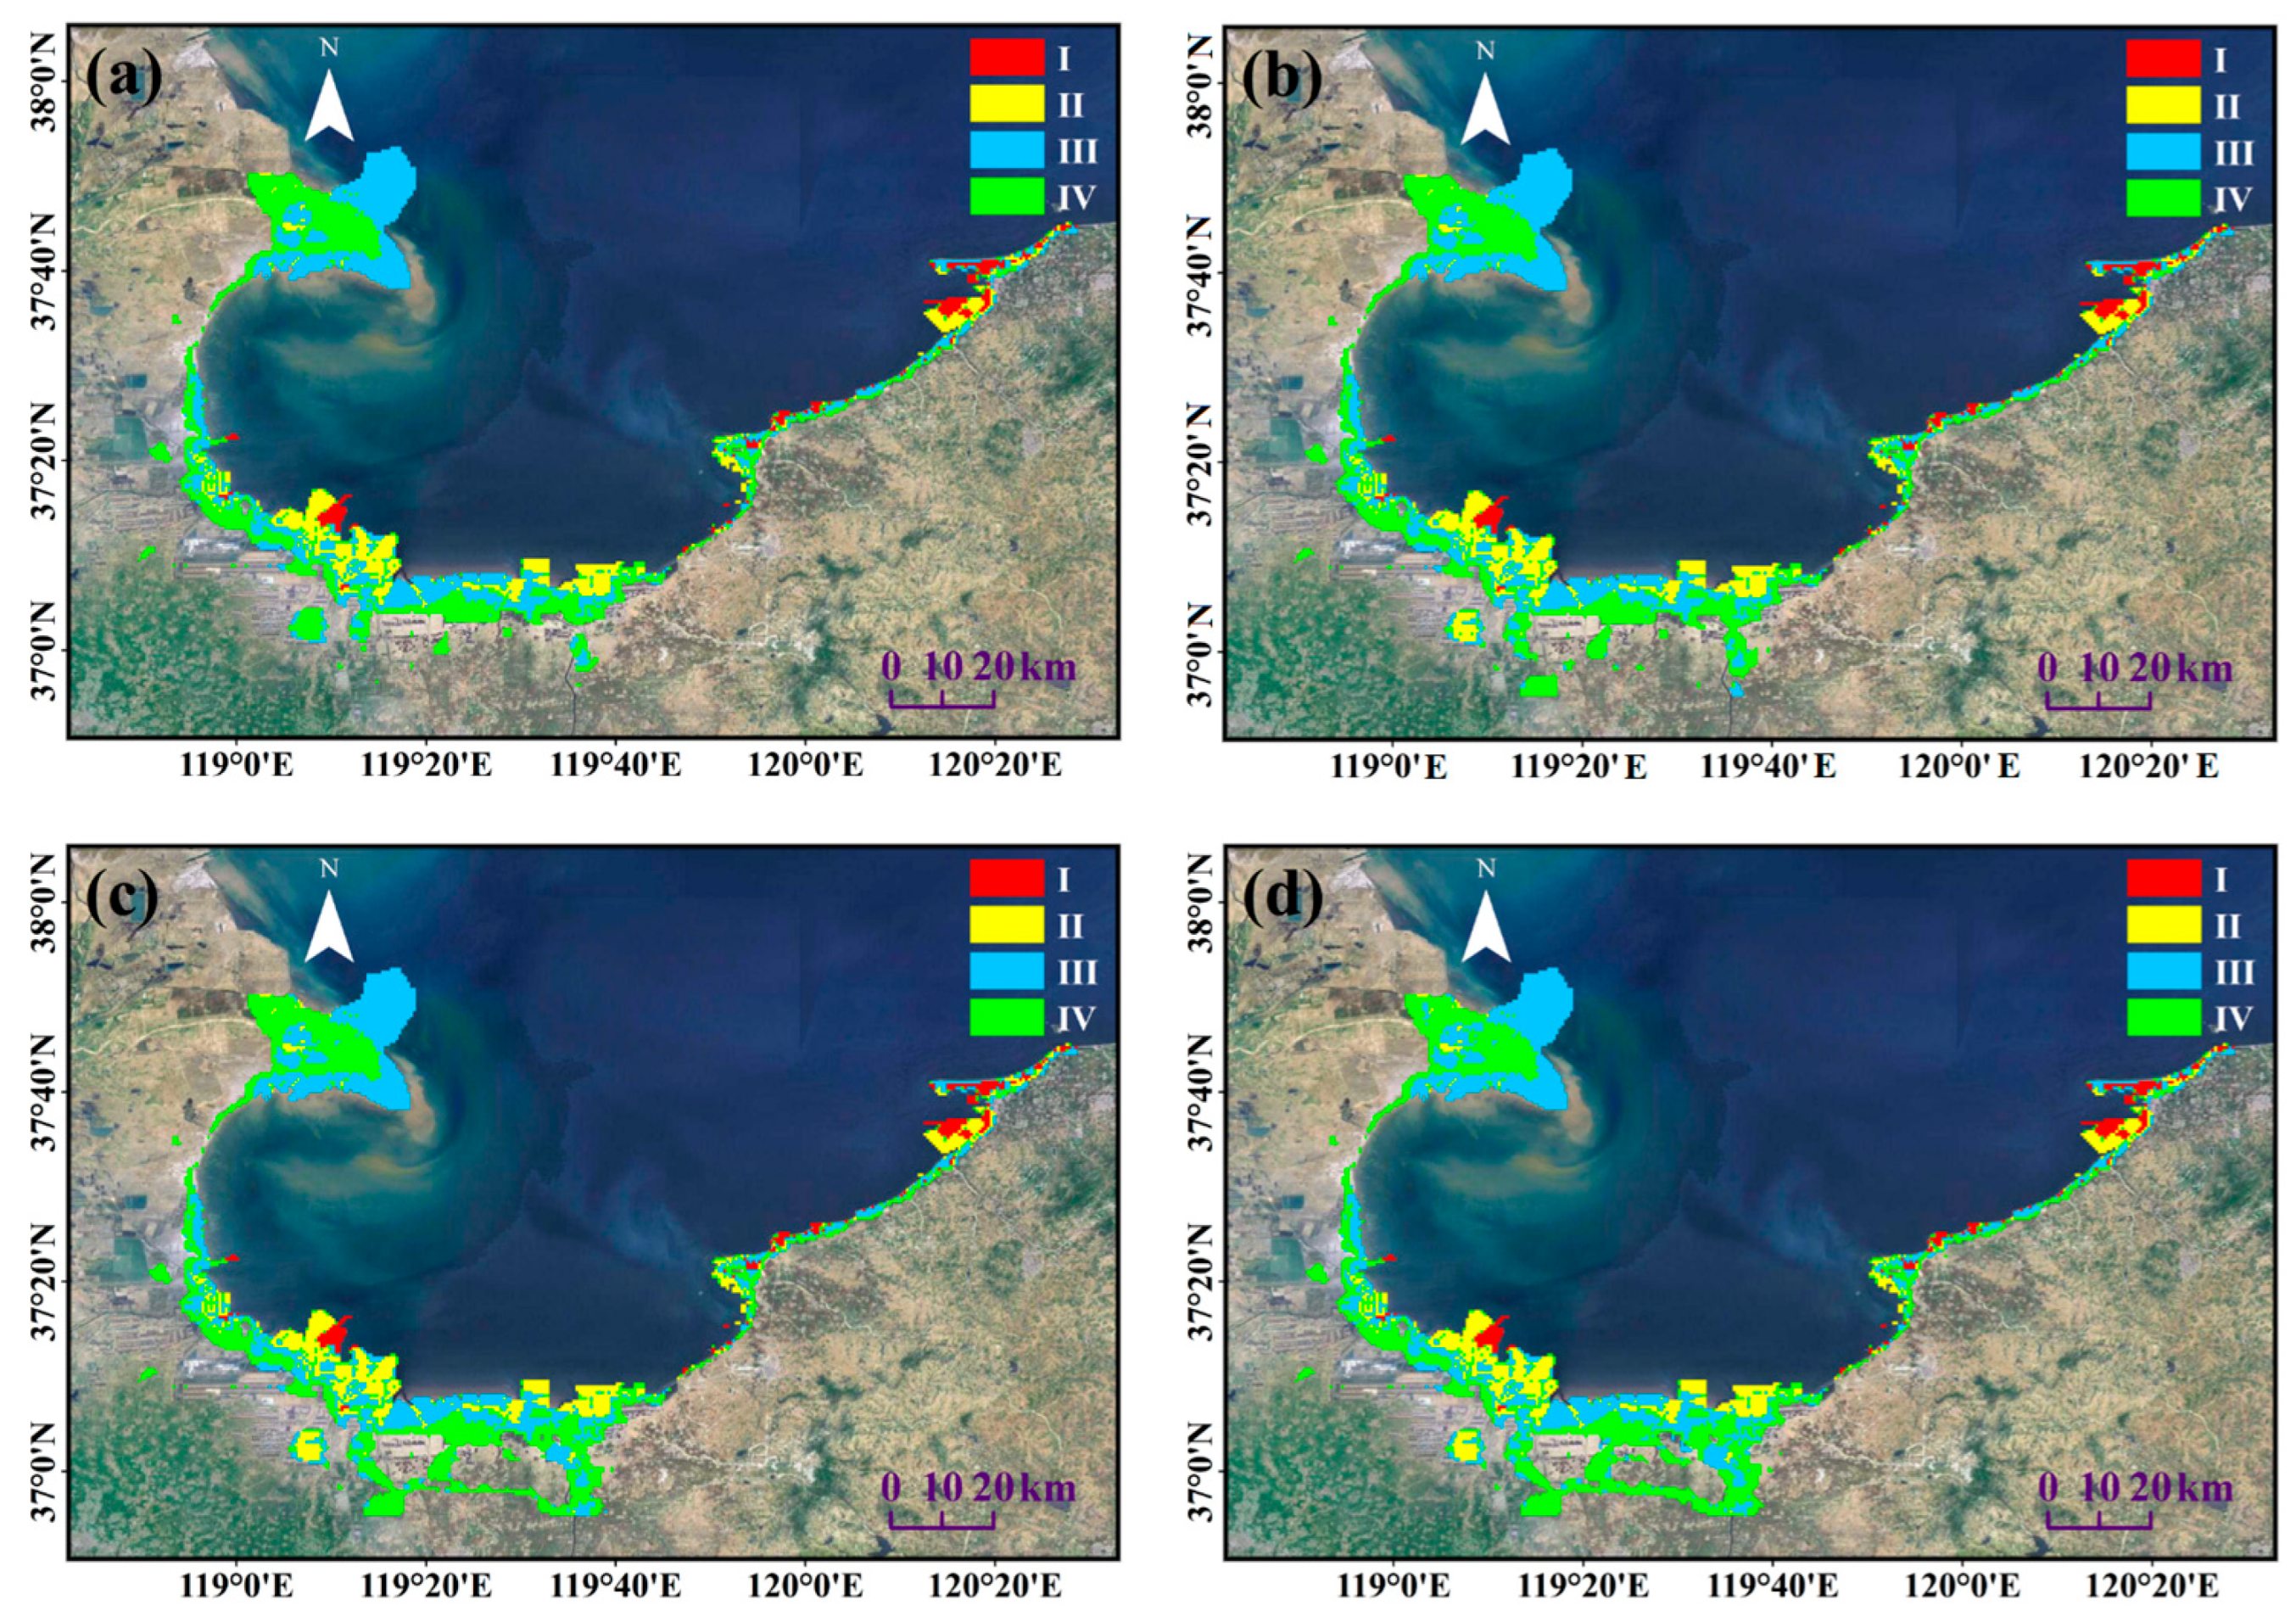
Figure 14a–d illustrate the storm surge disaster risk classification maps under the NW wind direction with 9th-, 10th-, 11th-, and 12th-level wind speeds during cold wave events. The results indicate that the western side of Laizhou Bay’s apex provides partial protection under NW winds. The bay apex reduces seawater intrusion from the outer bay into the inner bay, thereby limiting storm surge overtopping and subsequent inland flooding. Compared to the N (north) and NE (northeast) wind directions, the NW wind scenario results in smaller storm surge impacts and the reduced spatial extent of high-risk zones. Under NE winds, as wind speed increases, the area of all risk levels expands, with Level IV risk zones exhibiting the highest growth rate. Level III risk zones reach a maximum area of approximately 682 km2, and the maximum seawater intrusion distance along the Shouguang coastal section is approximately 28 km. Coastal infrastructure, including ports and industrial facilities (e.g., Weifang Port and Yulong Island), exhibits high inherent vulnerability to storm surges and faces elevated inundation hazards, warranting their designation as Level I risk zones.

4.2.2. Risk Zone Analysis for Storm Surge Under N Winds During Cold Wave Events

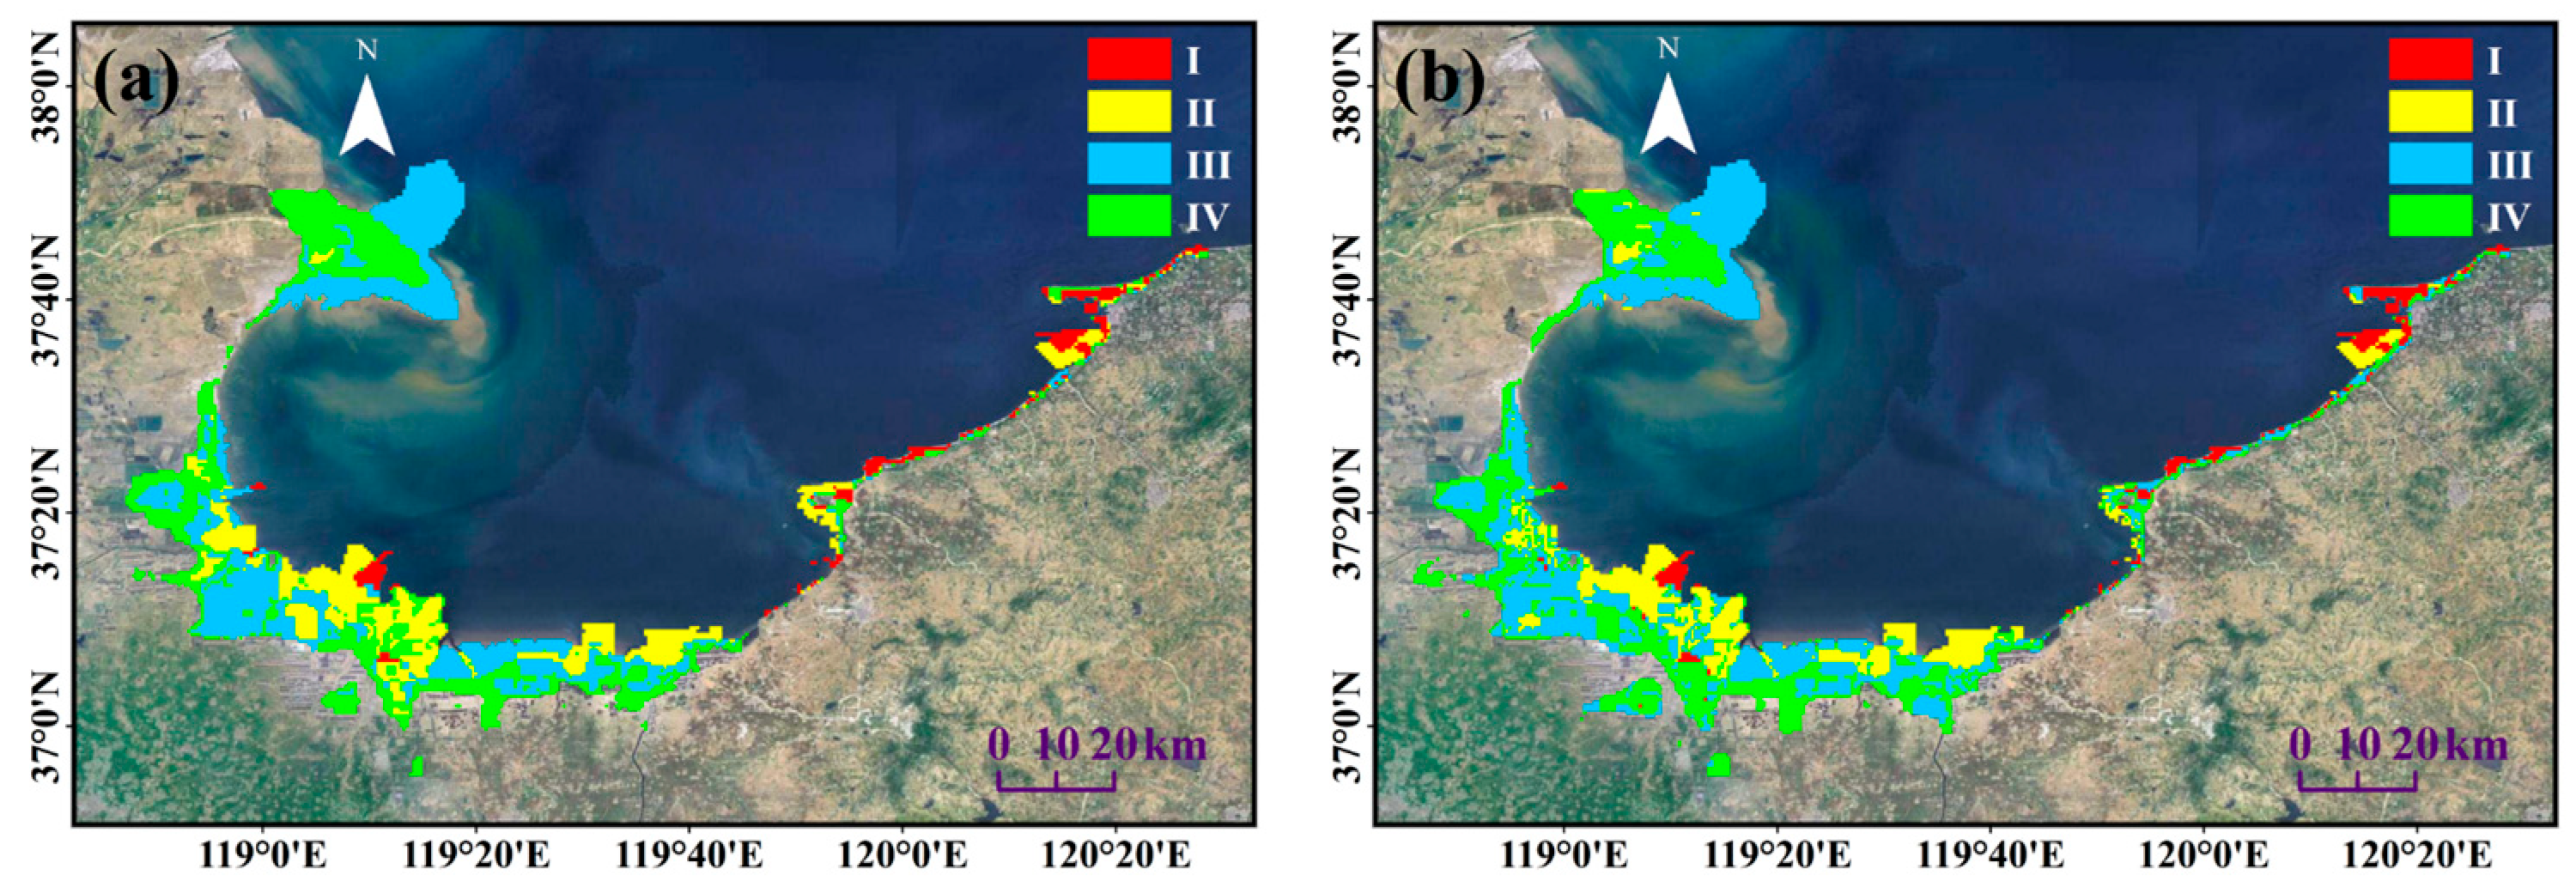
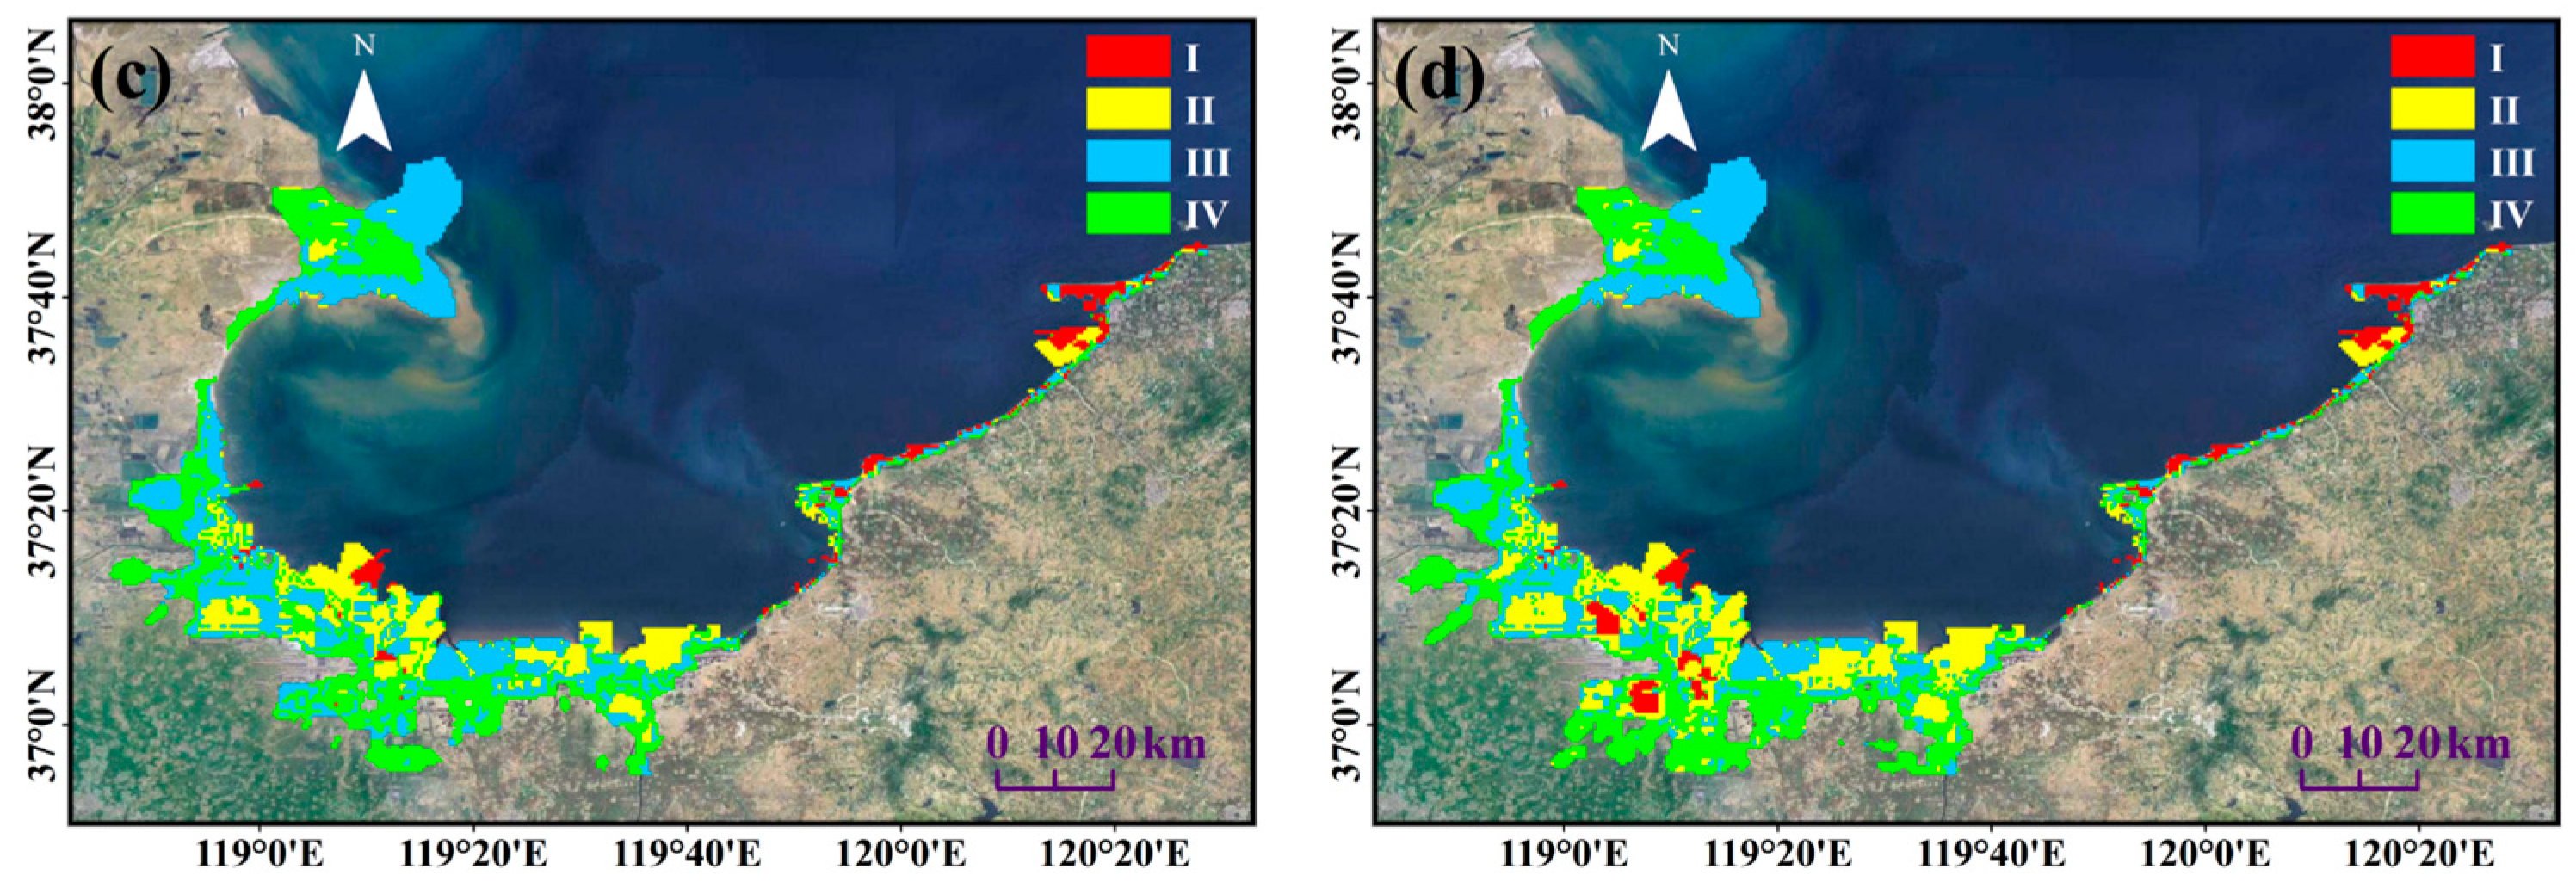
Figure 15a–d present the storm surge risk classification maps under the N wind direction with 9th–12th-level wind speeds. The spatial extent of the risk zones under N winds is larger than under NW winds. Influenced by Laizhou Bay’s topography—higher elevations in the east and lower elevations in the central and western regions—seawater intrusion due to storm surge overtopping is concentrated in the central and central-western areas. The western apex of Laizhou Bay partially restricts seawater intrusion under N winds, resulting in intermediate risk levels and impacts compared to the NW and NE wind scenarios. With increasing wind speeds under N winds, Level II and IV risk zones expand most rapidly, while Level I zones show minimal growth. Level IV risk zones attain a maximum area of ~1146 km2, with a maximum seawater intrusion distance of ~33 km along the Shouguang coast. Hanting exhibits the fastest-growing and highest-risk storm surge zones under N winds. As wind speeds intensify, inundation areas extend into residential zones, where the Level I vulnerability of residential infrastructure elevates overall risk levels.

4.2.3. Risk Zone Analysis for Storm Surge Under NE Winds During Cold Wave Events

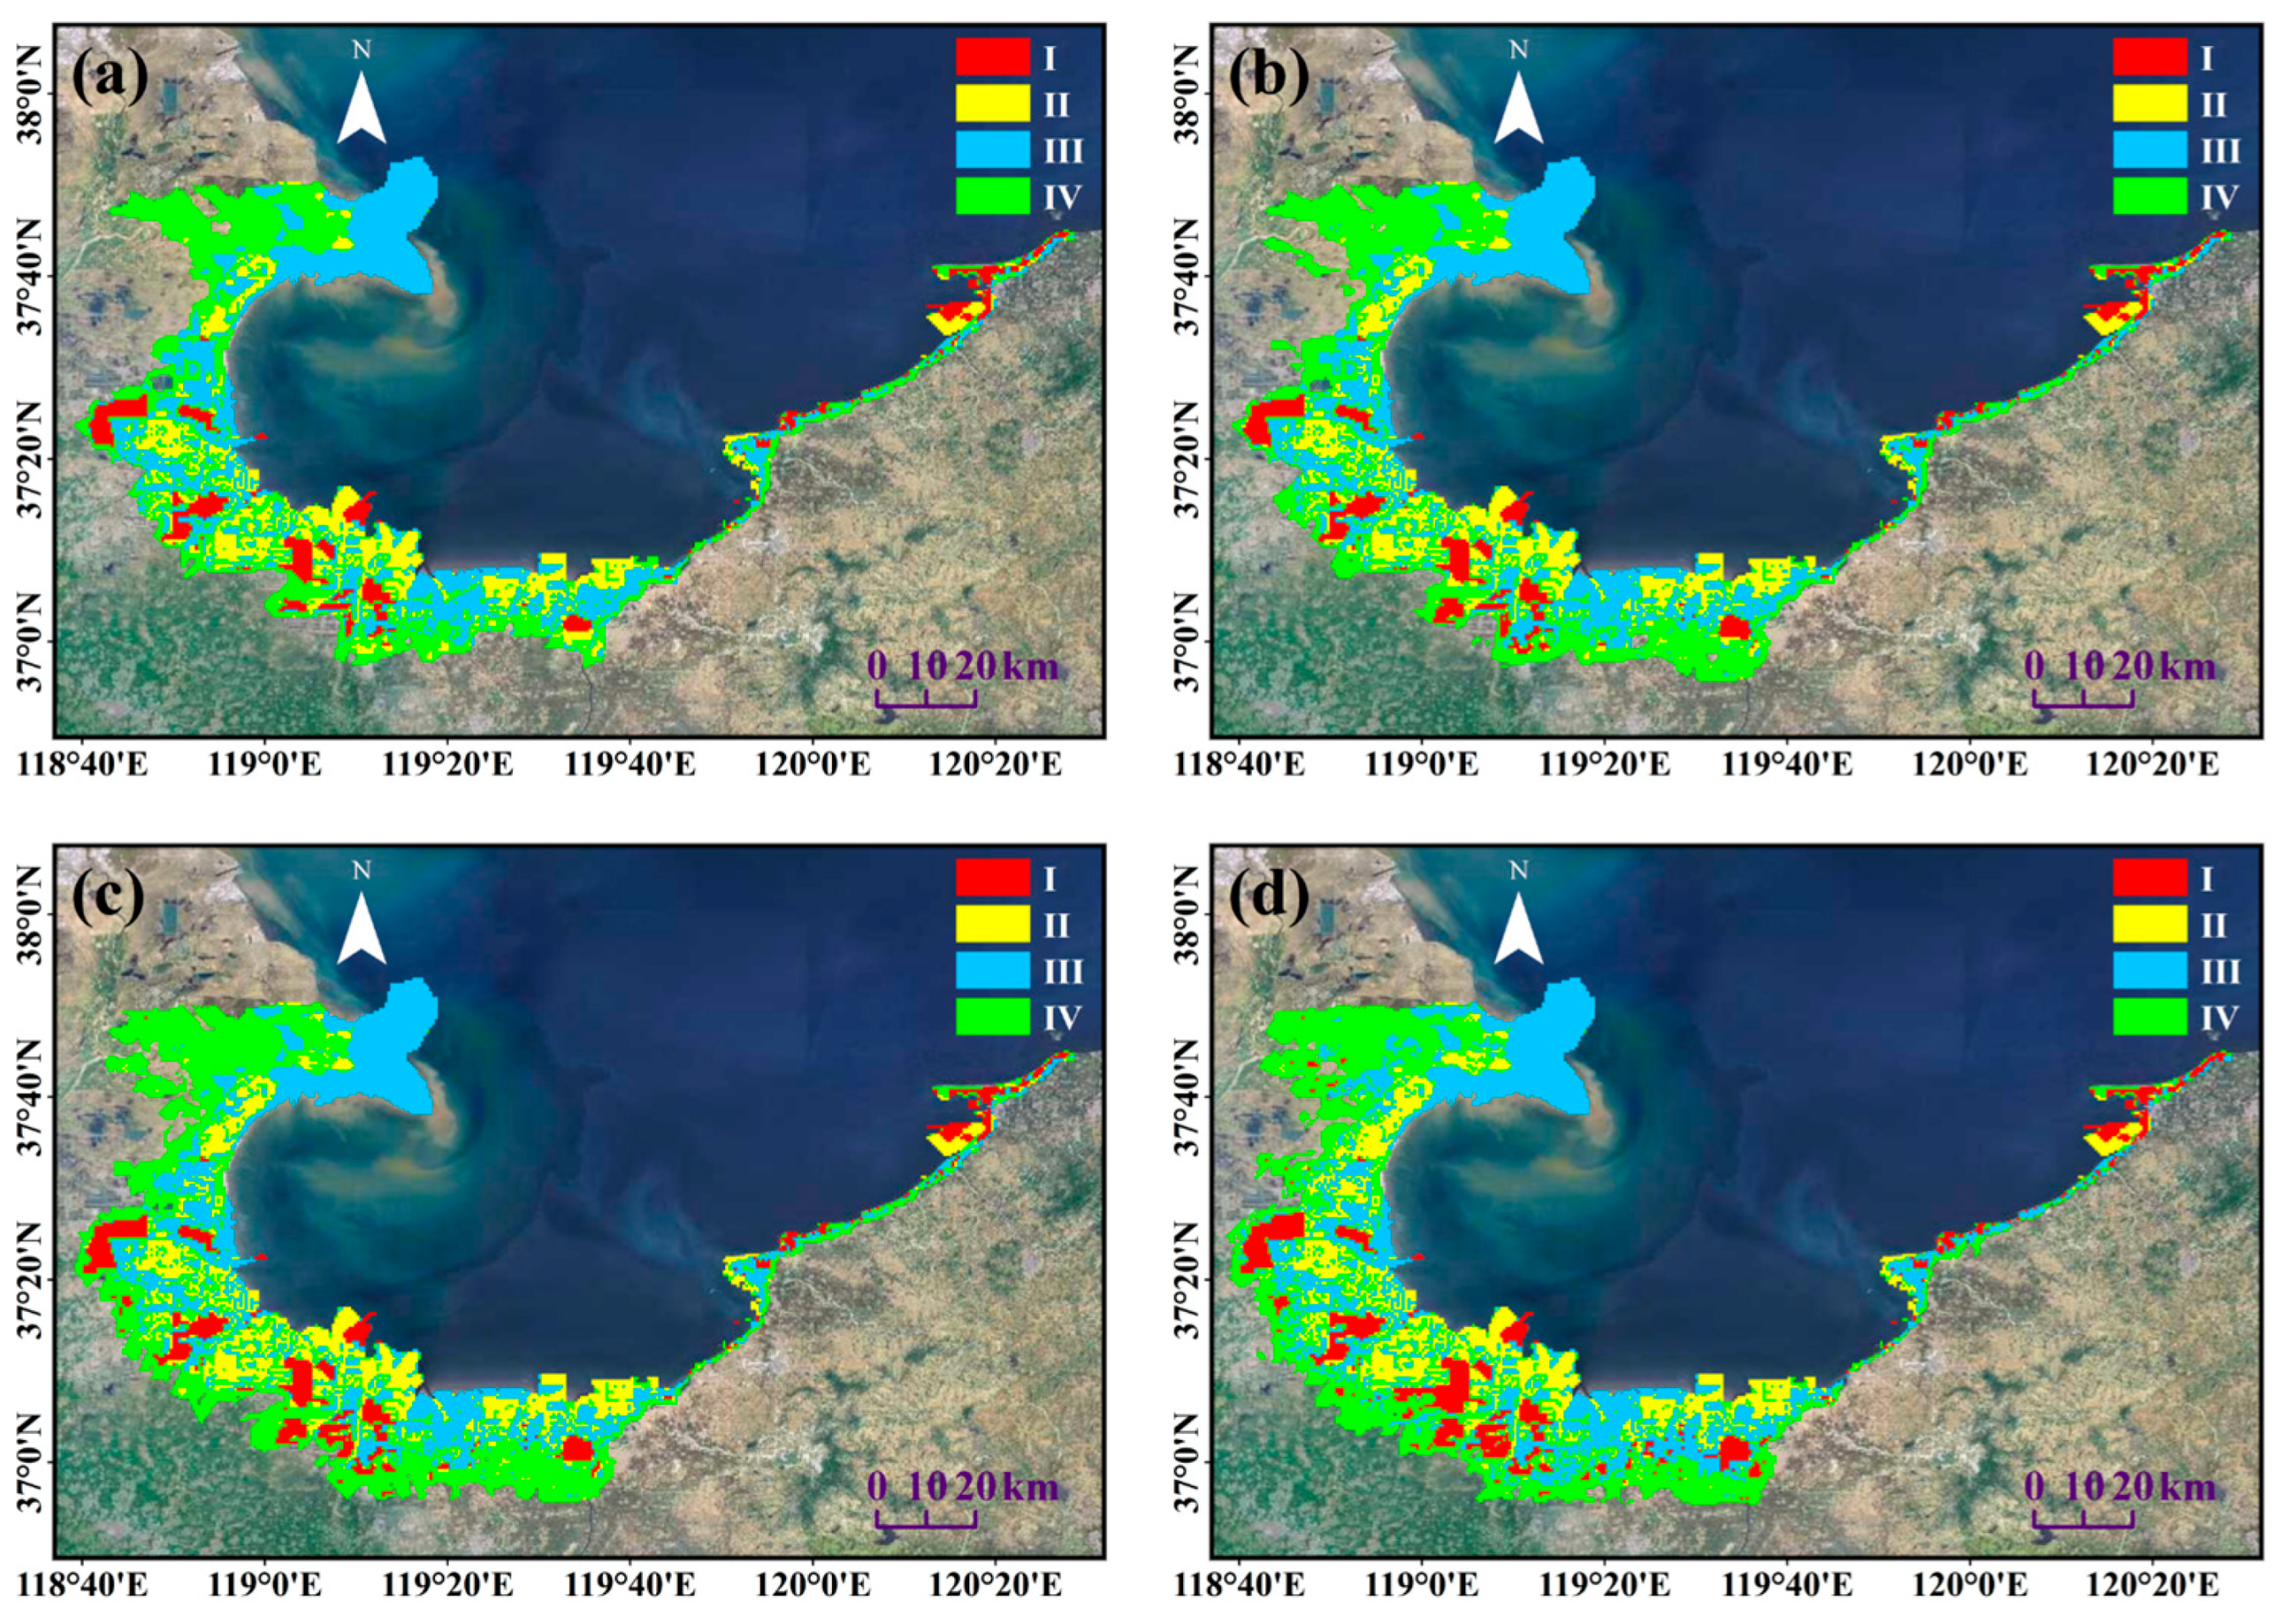
Figure 16a–d display the storm surge risk classification maps under the NE wind direction with 9th–12th-level wind speeds. The absence of topographic barriers on the western side of Laizhou Bay allows substantial seawater inflow from the outer bay into the inner bay as NE wind speeds increase. Under NE winds, Level III and IV risk zones expand rapidly, covering areas of ~1341 km2 and 1294 km2, respectively. Under a 9th-level NE wind, coastal regions including Kenli, Dongying, Guangrao, Shouguang, Hanting, and Changyi experience severe storm surge impacts. Higher elevations in the eastern bay limit inundation extents, while central and western low-lying areas suffer intensified flooding with increasing wind speeds. Dongying, Shouguang, and Hanting exhibit extensive Level I and II high-risk zones, with a maximum seawater intrusion distance of ~41 km along the Kenli coast. These NE winds generate significantly larger storm surge risk areas compared to NW and N winds. Under a 12th-level NE wind, storm surge zones encompass nearly all the areas affected by N and NW winds while exhibiting the highest risk levels. Consequently, the NE wind scenario under 12th-level wind speeds was selected to delineate Laizhou Bay’s storm surge risk map, as it represents the most severe and spatially extensive hazard conditions.

5. Discussion and Conclusions

5.1. Discussion

This study focuses on storm surge disasters in Laizhou Bay triggered by cold wave weather systems. From 2013 to 2022, this study analyzed the maximum sustained wind speeds and directions during Laizhou Bay coastal cold wave events. This statistical analysis was combined with examination of corresponding cold wave weather systems. The results show that maximum sustained winds predominantly originate between the northwest (NW) and northeast (NE) directions. This finding aligns with Wang et al., who used the MM5 model to simulate wind fields in the Yellow River Delta and identified higher wind speeds associated with the N and NE wind directions [48]. Building on this consistency, this study investigates the storm surge inundation risk under N and NE wind conditions. Mo et al. [39], using the ROMS numerical model, studied storm surges induced by cold waves and found that storm surges primarily occur along coastlines perpendicular to the wind direction. In Laizhou Bay, the central and western coastal areas, characterized by lower terrain, experience exacerbated storm surge disasters under N and NE winds, resulting in larger high-risk zones in these regions. Huang et al. established a hydrodynamic storm surge model for the western part of Laizhou Bay and determined that storm surge disasters were most severe under NE wind conditions [49]. Their study reported a 29.26 km2 Level I high-risk zone in Dongying City over a 100-year return period. In contrast, this study, under a wind speed of Beaufort Scale 9, identifies a larger Level I high-risk area of approximately 36 km2. This discrepancy arises because this research incorporates the effect of wave-induced water level increases, unlike Huang et al. [49]. Li et al. demonstrated through model simulations that wave-induced surface radiation stress increases both inundation area and average depth; this underscores the necessity of incorporating wave effects in storm surge-induced coastal inundation modeling [50]. Furthermore, Wang identified heightened storm surge risks in northern Laizhou Bay and adjacent coastal segments, including Shouguang, Hanting, and Changyi [51]. These findings show general consistency with the simulation results of the present study.
Differences in storm surge vulnerability assessment methods can lead to variations in risk assessment outcomes. Liu et al. defined vulnerability as the superposition of land use type exposure and disaster probability, integrating exposure, sensitivity, and adaptability [32]. Their study emphasized the influence of the natural environment on exposure, using elevation, slope, and distance to water systems as comprehensive indicators, while sensitivity and adaptability were determined through various social metrics. Li et al. developed a risk assessment framework tailored to the Laizhou Bay coast in China’s Bohai Sea based on hazard-causing factors, the vulnerability of natural and man-made infrastructure, and the emergency response and recovery capacity for relief supplies [33]. This framework refines risk assessment by focusing on infrastructure and accounting for risk differences before and after emergency responses, as well as post-disaster recovery capabilities—directions that future risk assessment studies should further explore. In this study, exposure in the storm surge vulnerability assessment was primarily based on qualitative evaluations of different land use types by the State Oceanic Administration of China. Consequently, variations in vulnerability assessment methods result in differing vulnerability levels, ultimately affecting the storm surge risk assessment outcomes.
Unlike typhoons, which are low-pressure cyclonic systems, cold waves are high-pressure anticyclonic systems. These high-pressure systems compress seawater, causing a drop in sea level. However, the cold wave process is accompanied by widespread and prolonged strong winds, and the interaction between the wind and waves can lead to an increase in the negative water level over a short period. This study categorized and analyzed cold wave weather systems but found no distinct response of Laizhou Bay storm surges to the three identified cold wave weather system types. Exploring other cold wave characteristics may reveal patterns. This warrants further study to improve coastal storm surge risk assessment accuracy. Amid global warming, rising seas, and frequent marine disasters, robust multi-hazard assessment systems are essential, lest they ultimately reduce coastal residents’ lives and result in property losses.

5.2. Conclusions

This study utilized statistical methods to analyze the weather systems associated with cold wave events in Laizhou Bay. By leveraging satellite and observational data, a MIKE storm surge numerical model was developed to simulate storm surge increments along the Laizhou Bay coast under various cold wave conditions, assuming the absence of coastal dikes. Based on the simulation results of storm surges during cold wave events, combined with an assessment of the vulnerability of storm surge receptors along the Laizhou Bay coast, a risk level map for storm surge disasters during cold wave events in the Laizhou Bay coastal region was established (as shown in Figure 16d). This map provides a scientific reference for coastal zone management in Laizhou Bay. The key conclusions are as follows:
(1)
Cold waves in the Laizhou Bay coastal region predominantly occur along the western path, with the highest frequency of events. The maximum sustained wind speeds during these cold wave events are typically observed between the northwest (NW) and northeast (NE) directions;
(2)
The Laizhou Bay coastal area experiences the most severe storm surge impacts, both in terms of extent and degree, from NE winds during cold wave events. Under the influence of NE winds reaching Beaufort scale 12, the areas classified as risk levels III and IV span approximately 1341 km2 and 1294 km2, respectively. Large areas at high-risk levels I and II are observed in Dongying, Shouguang, and Hanting, with the maximum seawater intrusion distance in the Kenli coastal segment reaching approximately 41 km;
(3)
The semi-enclosed morphology of Laizhou Bay offers a degree of protection at lower wind speeds by limiting the inland spread of seawater from the bay. However, this same semi-enclosed shape, coupled with the flat terrain in the western and central parts of the bay, also contributes to the intensification of storm surge disasters.

Author Contributions

Conceptualization, H.S. and Q.W.; methodology, C.Z.; software, L.S.; validation, L.S.; formal analysis, R.Z.; investigation, H.W.; resources, Q.W.; data curation, S.Z.; writing—original draft preparation, S.Z.; writing—review and editing, S.Z.; visualization, H.W.; supervision, C.Z.; project administration, H.S.; funding acquisition, H.S. All authors have read and agreed to the published version of the manuscript.

Funding

This research was supported by the National Natural Science Foundation Key Project (42330406, 42476163) and the Yantai Science and Technology Innovation Project (2023JCYJ097, 2023JCYJ094).

Data Availability Statement

The original contributions presented in this study are included in the article. Further inquiries can be directed to the corresponding author.

Conflicts of Interest

We declare that there are no conflicts of interest.

References

  1. Tao, S.Y. A decade of research on cold waves in East Asia in China. Acta Meteorol. Sin. 1959, 30, 226–230. [Google Scholar]
  2. Zhu, Q.G.; Lin, J.R.; Shou, S.W.; Tang, D.S. Principles and Methods of Meteorology; China Meteorological Press: Beijing, China, 2000; pp. 267–268. (In Chinese) [Google Scholar]
  3. Li, X.Z. Research on Cold Wave Intrusion in East Asia; Beijing Science Press: Beijing, China, 1955; pp. 35–117. [Google Scholar]
  4. Fu, D.X.; Ding, Y.H. The study of changing characteristics of the winter temperature and extreme cold events in China over the past six decades. Int. J. Climatol. 2021, 41, 2480–2484. [Google Scholar] [CrossRef]
  5. Wang, Z.Y.; Ding, Y.H. Climate change of the cold wave frequency of China in the last 53 years and the possible reasons. Trans. Atmos. Sci. 2006, 6, 1068–1076. (In Chinese) [Google Scholar]
  6. Chen, S.F.; Chen, W.; Wei, K. Recent trends in winter temperature extremes in eastern China and their relationship with the Arctic. Adv. Atmos. Sci. 2013, 30, 1712–1724. [Google Scholar] [CrossRef]
  7. Overland, E.J.; Wang, M. Impact of the winter polar vortex on greater North America. Int. J. Climatol. 2019, 39, 5815–5821. [Google Scholar] [CrossRef]
  8. Xu, X.P.; He, S.P.; Zhou, B.T.; Wang, H.J.; Outten, S. The role of mid-latitude Westerly Jet in the impacts of November Ural Blocking on early-winter warmer Arctic-Colder Eurasia pattern. Geophys. Res. Lett. 2022, 49, e2022GL099096. [Google Scholar] [CrossRef]
  9. Zhang, Y.J.; Yin, Z.C.; Wang, H.J.; He, S.P. 2020/21 record-breaking cold waves in east of China enhanced by the ‘Warm Arctic-Cold Siberia’ pattern. Environ. Res. Lett. 2021, 16, 094040. [Google Scholar] [CrossRef]
  10. Fang, Y.H.; Lin, Y.T.; Zhao, C.Y.; Xu, S.Q.; Lin, Y.; Yu, Y.Q. Two types of cold waves affecting northeast China and the corresponding different key regions of precedent sea ice and sea surface temperature. Int. J. Climatol. 2022, 16, 10451–10463. [Google Scholar] [CrossRef]
  11. Liu, Y.S.; Sun, C.; Gong, Z.Q.; Li, J.Q.; Shi, Z. Multidecadal seesaw in cold wave frequency between central Eurasia and Greenland and its relation to the Atlantic Multidecadal Oscillation. Clim. Dyn. 2021, 5–6, 1403–1418. [Google Scholar] [CrossRef]
  12. Song, W.; Ye, X.C. Possible associations between the number of cold days over East Asia and arctic oscillation and arctic warming. Atmosphere 2021, 7, 842. [Google Scholar] [CrossRef]
  13. Li, C.X.; Dai, G.K.; Mu, M.; Han, Z.; Ma, X.Y.; Jiang, Z.N.; Zheng, J.Y.; Zhu, M.B. Influence of Arctic sea-ice concentration on extended-range forecasting of cold events in East Asia. Adv. Atmos. Sci. 2023, 40, 2224–2241. [Google Scholar] [CrossRef]
  14. Tao, W.; Ni, Y.M.; Lu, C.H. Cold waves in East China and their response to two types of Arctic amplification. Atmosphere 2020, 11, 612. [Google Scholar] [CrossRef]
  15. Fang, J.Y.; Liu, W.; Yang, S.N.; Brown, S.; Nicholls, R.J.; Hinkel, J.; Shi, X.W.; Shi, P.J. Spatial-temporal changes of coastal and marine disasters risks and impacts in Mainland China. Ocean Coast. Manag. 2017, 139, 125–140. [Google Scholar] [CrossRef]
  16. Martzikos, N.T.; Prinos, P.E.; Memos, C.D.; Tsoukala, V.K. Key research issues of coastal storm analysis. Ocean Coast. Manag. 2021, 199, 105389. [Google Scholar] [CrossRef]
  17. Bacopoulos, P.; Clark, R.R. Coastal erosion and structural damage due to four consecutive-year major hurricanes: Beach projects afford resilience and coastal protection. Ocean Coast. Manag. 2021, 209, 105643. [Google Scholar] [CrossRef]
  18. Ji, T.; Li, G.S. Contemporary monitoring of storm surge activity. Prog. Phys. Geogr. Earth Environ. 2020, 44, 299–314. [Google Scholar] [CrossRef]
  19. Lyddon, C.; Brown, J.M.; Leonardi, N.; Plater, A.J. Flood hazard assessment for a hyper-tidal estuary as a function of tide-surge-morphology interaction. Estuaries Coasts 2018, 41, 1565–1586. [Google Scholar] [CrossRef]
  20. Paldor, A.; Michael, H.A. Storm surges cause simultaneous salinization and freshening of coastal aquifers, exacerbated by climate change. Water Resour. Res. 2021, 57, e2020WR029213. [Google Scholar] [CrossRef]
  21. Sergio, F.; Priestas, A.M. Back-barrier flooding by storm surges and overland flow. Earth Surf. Process. Landf. 2012, 37, 400–410. [Google Scholar]
  22. Lin, J.J.; Wang, S.; Zhao, Y.N.; Xue, X.Z. The inequality of economic development increases the direct economic loss of storm surge disaster in China. Ocean. Coast Manag. 2024, 258, 107427. [Google Scholar] [CrossRef]
  23. Liu, R.J.; Wang, Y.H.; Qian, Z.Q. Hybrid SWOT-AHP analysis of strategic decisions of coastal tourism: A case study of Shandong peninsula blue economic zone. J. Coast. Res. 2019, 94, 671–676. [Google Scholar] [CrossRef]
  24. Bulletin of China Marine Disaster. Bulletin of China Marine Disaster; Bulletin of China Marine Disaster: Beijing, China, 2022. (In Chinese) [Google Scholar]
  25. Dababneh, A.; Oskamp, J.A.; Edwards, T. Probabilistic storm surge hazard assessment for a site on lake huron. Int. J. Offshoreand Polar Eng. 2016, 26, 401–407. [Google Scholar] [CrossRef]
  26. Zhang, Y.X.; Zhang, T.Y. A comprehensive review of assessing storm surge disasters: From traditional statistical methods to artificial intelligence-based technique. Atmosphere 2024, 15, 359. [Google Scholar] [CrossRef]
  27. Hsu, C.H.; Olivera, F.; Irish, J.L. A hurricane surge risk assessment framework using the joint probability method and surge response functions. Nat. Hazards 2018, 91, S7–S28. [Google Scholar] [CrossRef]
  28. Wang, K.; Hou, Y.J.; Li, S.Q.; Du, M.; Li, R. Numerical study of storm surge inundation in the southwestern hangzhou bay region during typhoon Chan-Hom in 2015. J. Ocean Univ. China 2015, 19, 263–271. [Google Scholar] [CrossRef]
  29. Wang, S.; Qin, H.; Mu, L.; Wang, L.Z.; Yao, Z.F.; Zhao, E.J. The utilization of physically based models and GIS techniques for comprehensive risk assessment of storm surge: A case study of Huizhou. Front. Mar. Sci. 2022, 9, 939380. [Google Scholar] [CrossRef]
  30. Ayyad, M.; Hajj, M.R.; Marsooli, R. Artificial intelligence for hurricane storm surge hazard assessment. Ocean Eng. 2022, 245, 110435. [Google Scholar] [CrossRef]
  31. Lan, V.K.; Tang, S.K.; Pau, G. Comparative analysis of BALSSA and conventional NWP methods: A case study in extreme storm surge prediction in Macao. Atmosphere 2023, 14, 1597. [Google Scholar] [CrossRef]
  32. Liu, Q.R.; Guo, J.T.; Li, J.; Lian, X.H.; Yin, Z.H.; Fu, D.; Zhong, S. Storm surge hazard assessment of the levee of a rapidly developing city-based on LiDAR and numerical models. Remote Sens. 2020, 12, 3723. [Google Scholar] [CrossRef]
  33. Li, Z.; Li, S.; Hu, P.; Mo, D.; Li, J.; Du, M.; Yan, J.; Hou Yin, B. Numerical study of storm surge-induced coastal inundation in Laizhou Bay, China. Front. Mar. Sci. 2022, 9, 952406. [Google Scholar] [CrossRef]
  34. Walker, A.M.; Titley, D.W.; Mann, M.E.; Najjar, R.G.; Miller, S.K. A fiscally based scale for tropical cyclone storm surge. Weather Forecast. 2018, 33, 1709–1723. [Google Scholar] [CrossRef]
  35. Wang, Y.X.; Guo, Z.X.; Zhang, S.X.; Shu, X.J.; Luo, J.; Qiu, L.G.; Gao, T. Risk assessment for typhoon-induced storm surges in Wenchang, Hainan Island of China. Geomat. Nat. Hazards Risk 2021, 12, 880–899. [Google Scholar] [CrossRef]
  36. Grey, S.; Turnbull, M.; Simmons, J. Hurricane surge and inundation in the Bahamas. part 1: Storm surge model. J. Flood Risk Manag. 2024, 18, e13018. [Google Scholar] [CrossRef]
  37. Hermanson, L.; Smith, D.; Seabrook, M.; Bilbao, R.; Doblas-Reyes, F.; Tourigny, E.; Lapin, V.; Kharin, V.V.; Merryfield, W.J.; Sospedra-Alfonso, R.; et al. WMO Global Annual to Decadal Climate Update: A prediction for 2021–25. Bull. Am. Meteorol. Soc. 2022, 103, 1117–1129. [Google Scholar] [CrossRef]
  38. Li, L.; Zhou, T.; Zhang, W. Updating the Baseline Period Affects the Detection of Extreme Climate Change in China. J. Geophys. Res. Atmos. 2025, 130, e2024JD042704. [Google Scholar] [CrossRef]
  39. Mo, D.X.; Hou, Y.J.; Li, J.; Liu, Y.H. Study on the storm surges induced by cold waves in the Northern East China Sea. J. Mar. Syst. 2016, 160, 26–39. [Google Scholar] [CrossRef]
  40. Yu, L.J. Study on influencing factors of urban disaster resilience basedon DEMATEL-ISM. J. Catastrophol. 2021, 36, 13–17. [Google Scholar]
  41. Grade of Cold Wave (GB/T 21987−2017); General Administration of Quality Supervision, Inspection and Quarantine of the People’s Republic of China, Standardization Administration of China. China Standards Press: Beijing, China, 2017; pp. 1–15. (In Chinese)
  42. Hersbach, H.; Bell, B.; Berrisford, P.; Hirahara, S.; Horányi, A.; Muñoz-Sabater, J.; Nicolas, J.; Peubey, C.; Radu, R.; Schepers, D.; et al. The ERA5 global reanalysis. Q. J. R. Meteorol. Soc. 2020, 146, 1999–2049. [Google Scholar] [CrossRef]
  43. Li, P.P.; Sun, Y.K.; Zhao, S.N.; Li, L.S.; Shi, H.Y.; Hong, X. Sea level change in the Chinese Sea area from 1993 to 2050 based on ERA5. Mar. Sci. 2024, 45, 1–8. [Google Scholar]
  44. MIKE 21 & MIKE 3 Flow Model FM Hydrodynamic Scientific Documentation. DHI Water & Environment: Hørsholm, Denmark, 2007; pp. 14–16.
  45. Ganesh, R.; Gopaul, N. A predictive outlook coastal erosion on a log-spiral bay (trinidad) by wave and sediment transport modelling. J. Coast. Res. 2014, 65, 488–493. [Google Scholar] [CrossRef]
  46. MIKE 21 Spectral Wave Module Scientific Documentation. DHI Water & Environment: Hørsholm, Denmark, 2007; pp. 14–16.
  47. Willmott, C.J. On the validation of models. Phys. Geogr. 1981, 2, 184–194. [Google Scholar] [CrossRef]
  48. Wang, Y.; Ji, X.M. Environmental characteristics and changes of coastal ocean as land-ocean transitional zone of China. Sci. Geogr. Sin. 1973, 31, 129–135. [Google Scholar]
  49. Huang, L.; Chen, S.L.; Pan, S.Q.; Li, P.; Ji, H.Y. Impact of storm surge on the Yellow River Delta: Simulation and Analysis. Water 2022, 14, 3439. [Google Scholar] [CrossRef]
  50. Li, J.; Mo, D.X.; Li, R.; Hou, Y.J.; Liu, Q.R. Establishing a Risk Assessment Framework for Marine Assets and Assessing Typhoon Lekima Storm Surge for the Laizhou Bay Coastal Area of the Bohai Sea, China. J. Mar. Sci. Eng. 2022, 10, 298. [Google Scholar] [CrossRef]
  51. Wang, N. Storm Surge and Wave Interaction and its Application in Risk Assessment of Storm Surge Disasters in Shandong Peninsula. Ph.D. Thesis, University of Chinese Academy of Sciences (Institute of Oceanology, Chinese Academy of Sciences), Qingdao, China, 2022. (In Chinese). [Google Scholar]
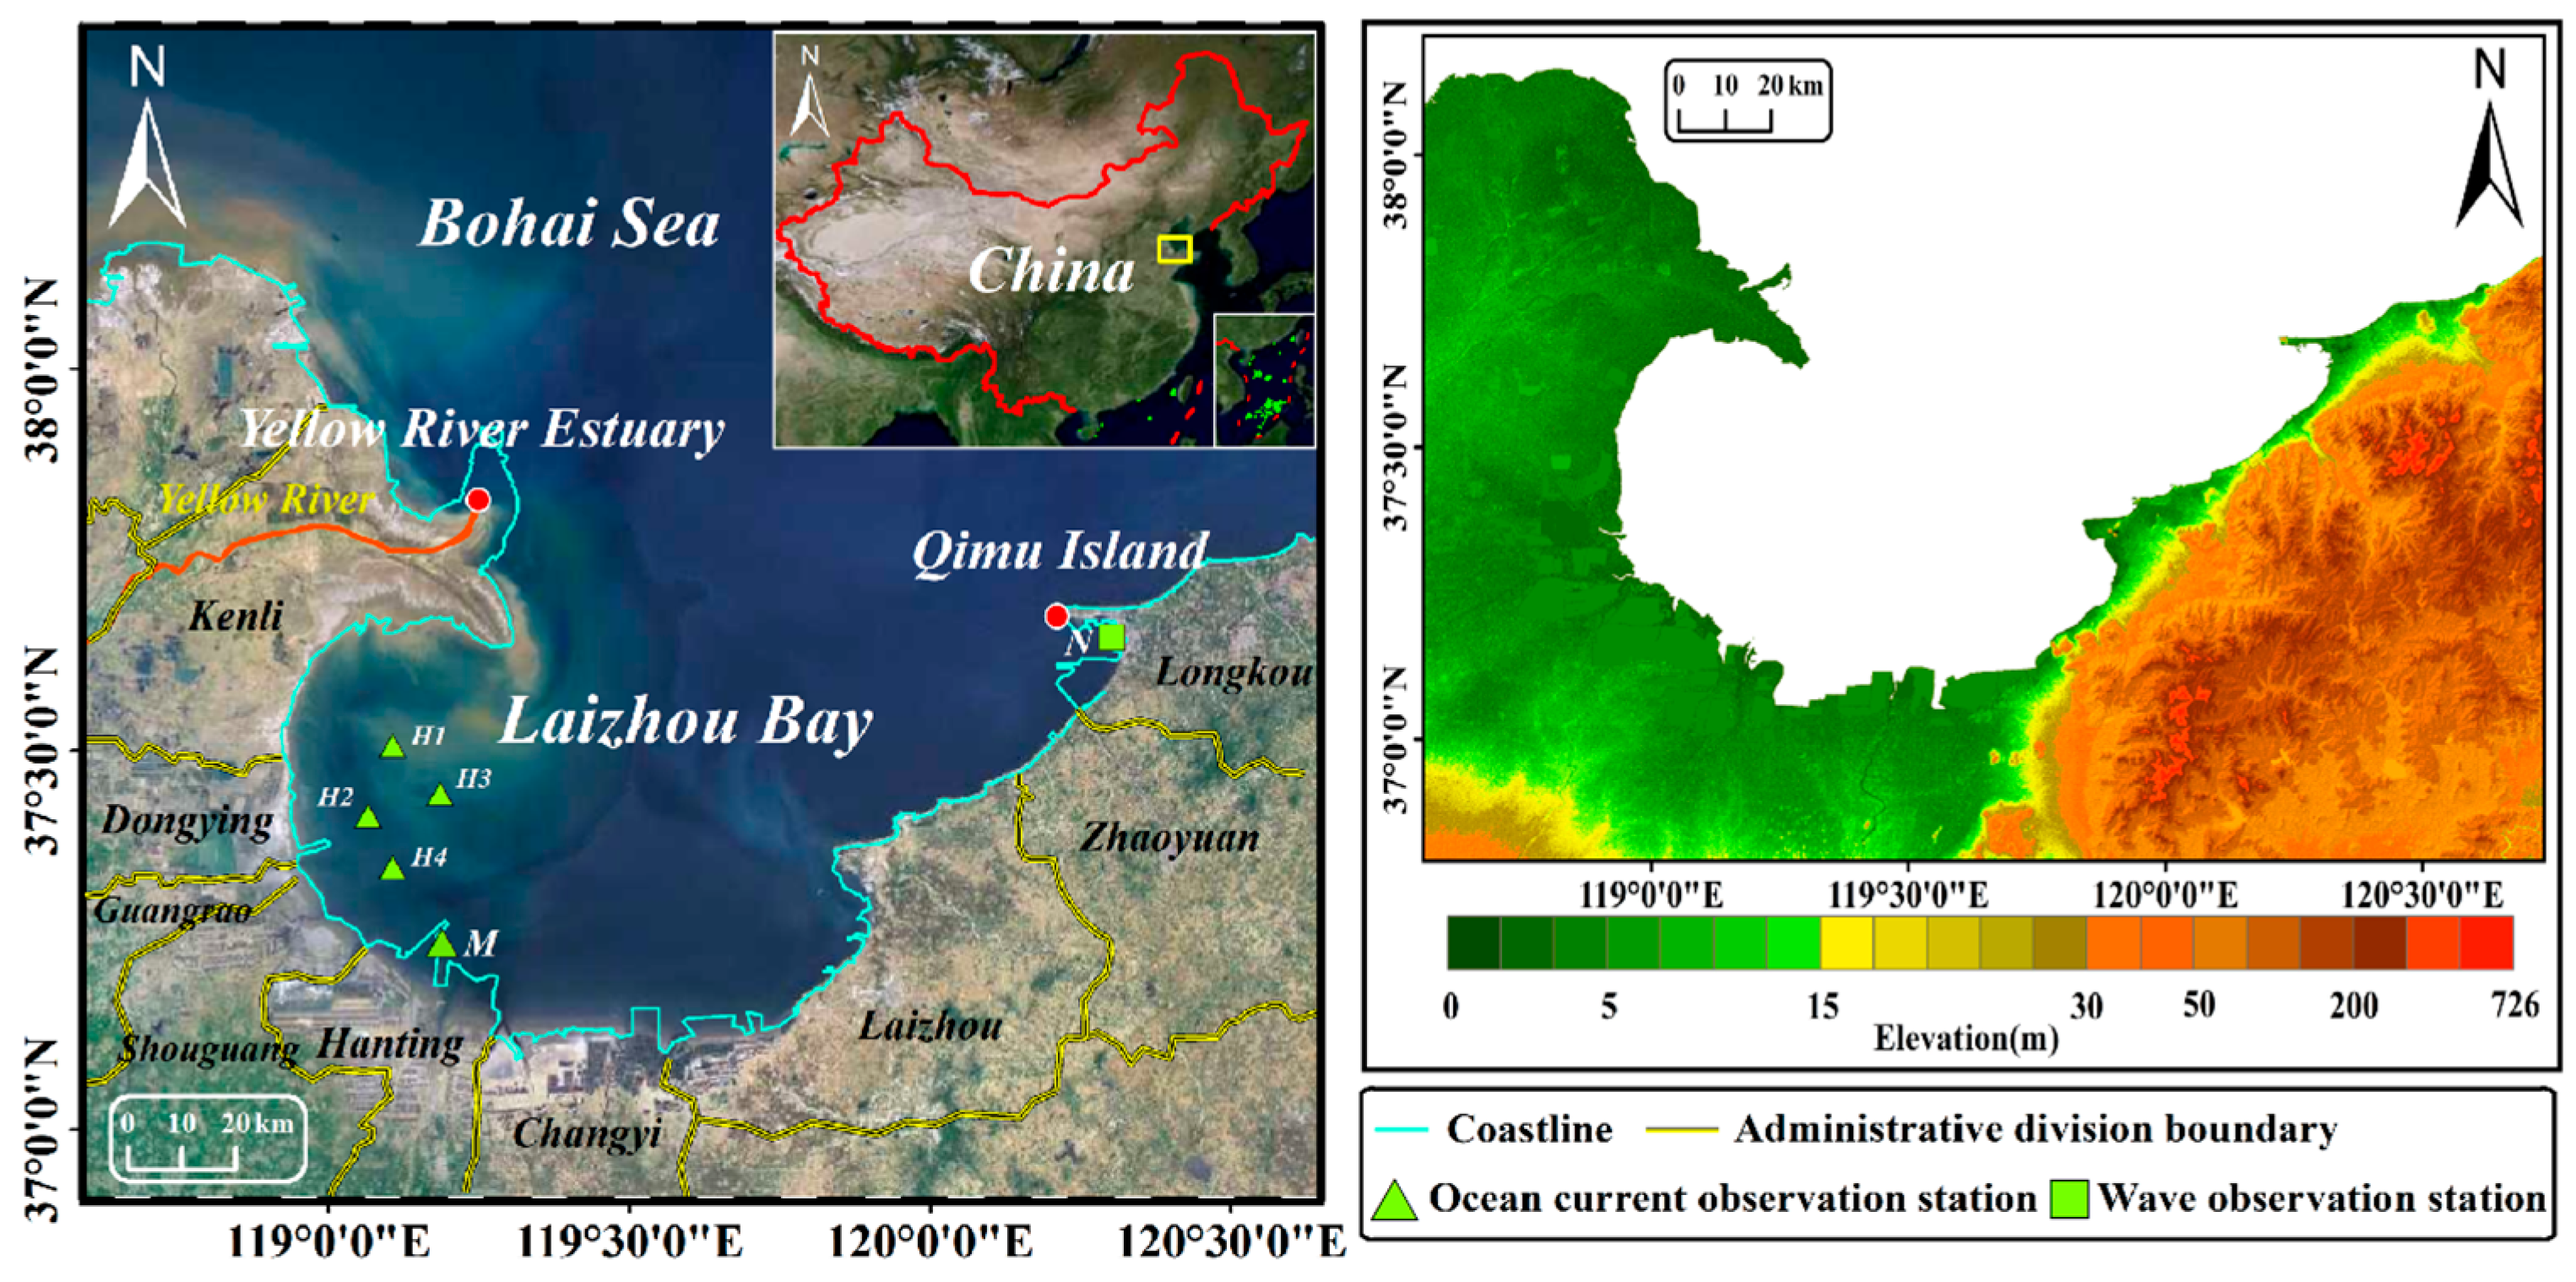
Figure 1. Geographical location of Laizhou Bay and elevation of its coastal areas.
Jmse 13 01434 g001
Figure 2. ERA5 data monitoring locations in the Laizhou Bay area.
Jmse 13 01434 g002
Figure 3. Statistical analysis of cold wave weather systems along the Laizhou Bay coast (2013–2022).
Jmse 13 01434 g003
Figure 4. Maximum sustained wind speed and direction during cold wave events along the Laizhou Bay coast (2013–2022).
Jmse 13 01434 g004
Figure 5. Bathymetric and topographic data of the study area grid.
Jmse 13 01434 g005
Figure 6. The comparison between the measured values and simulated values at each station.
Jmse 13 01434 g006aJmse 13 01434 g006b
Figure 7. Tide level changes at key time nodes.
Jmse 13 01434 g007
Figure 8. Inundation under various wind speed levels from the NW direction during cold wave events along the Laizhou Bay coastal areas. (a) Force 9; (b) Force 10; (c) Force 11; (d) Force 12.
Jmse 13 01434 g008
Figure 9. Inundation under various wind speed levels from the N direction during cold wave events along the Laizhou Bay coastal areas. (a) Force 9; (b) Force 10; (c) Force 11; (d) Force 12.
Jmse 13 01434 g009
Figure 10. Inundation under various wind speed levels from the NE direction during cold wave events along the Laizhou Bay coastal areas. (a) Force 9; (b) Force 10; (c) Force 11; (d) Force 12.
Jmse 13 01434 g010
Figure 11. Distribution of receptors along the Laizhou Bay coastal areas.
Jmse 13 01434 g011
Figure 12. Coastal vulnerability levels in Laizhou Bay.
Jmse 13 01434 g012
Figure 13. Areas of risk zones for different levels of storm surge hazards along the Laizhou Bay coastal areas. (a) NW wind directions; (b) N wind directions; (c) NE wind directions.
Jmse 13 01434 g013
Figure 14. Storm surge risk levels under different sustained wind speeds from the NW direction during cold wave events along the Laizhou Bay coastal areas. (a) Force 9; (b) Force 10; (c) Force 11; (d) Force 12.
Jmse 13 01434 g014
Figure 15. Storm surge risk levels under different sustained wind speeds from the N direction during cold wave events along the Laizhou Bay coastal areas. (a) Force 9; (b) Force 10; (c) Force 11; (d) Force 12.
Jmse 13 01434 g015aJmse 13 01434 g015b
Figure 16. Storm surge risk levels under different sustained wind speeds from the NE direction during cold wave events along the Laizhou Bay coastal areas. (a) Force 9; (b) Force 10; (c) Force 11; (d) Force 12.
Jmse 13 01434 g016
Table 1. Grades of cold waves.
GradesCriteria (GB/T 21987−2017)
Daily Average Temperature Drop Within 24 h, 48 h, and 72 hDaily Minimum Temperature
Cold Wave≥8.0 °C in 24 h, or ≥10.0° in 48 h, or ≥12.0° in 72 h≤4.0 °C
Severe Cold Wave≥10.0 °C in 24 h, or ≥12.0° in 48 h, or ≥14.0° in 72 h≤2.0 °C
Extreme Cold Wave≥12.0 °C in 24 h, or ≥14.0° in 48 h, or ≥16.0° in 72 h≤0.0 °C
Table 2. Classification table for the intensity levels of weather phenomena.
Wind Force LevelMaximum Sustained Wind Speed of Weather Phenomena (m/s)
Force 922
Force 1027
Force 1132
Force 1236
Table 3. Specific locations of verification points. (Specific locations are shown in Figure 1).
Verification Point NameLongitudeLatitude
H1119.106°37.524°
H2119.054°37.405°
H3119.144°37.435°
H4119.107°37.316°
M119.181°37.271°
N119.181°37.271°
Table 4. Verification of parameter calculation results.
Verification Point NameSkillRMSE
H1 (Velocity)0.890.37
H1 (Direction)0.9348.67
H2 (Velocity)0.910.28
H2 (Direction)0.9630.24
H3 (Velocity)0.930.29
H3 (Direction)0.9534.65
H4 (Velocity)0.920.31
H4 (Direction)0.9728.18
H2 (Tidal level)0.970.21
H3 (Tidal level)0.980.18
M (Significant wave height)0.900.26
N (Tidal level)0.860.23
Table 5. Vulnerability range and level of current land use situation.
Current Land Use SituationVulnerability RangeVulnerability Level
CodeName
01, 02Arable land, Orchard land0.1~0.3IV
03, 04Forest land, Grassland0.1IV
06Industrial, mining, and warehousing land0.6~1II~I
07Residential land1I
114Pond surface water0.3IV
115, 116(Coastal, Inland) mudflat0.1IV
122Agricultural facility land0.2~0.5IV~III
124, 127Saline-alkali land, Bare land0.1IV
Table 6. Reference table for vulnerability levels of key secondary disaster receptors.
Current Land Use SituationExample of Key CarriersRange of Carrier Vulnerability
CodeSecondary CategoryNameIndicator0.60.70.80.91
052Accommodation and catering landAccommodation and catering landPopulation densityGeneralHigh density
061Industrial landNuclear power plantAll
Petrochemical industryScaleSmallMediumLargeExtra large
106Port and wharf landSeaportGeneralMediumSignificant
Fishing portTertiaryTertiaryPrimaryCenter
Table 7. Classification standards for hazard level of inundation depth.
Hazard LevelInundation Water Depth (cm)
I[300, +∞)
II[120, 300)
III[50, 120)
IV[15, 50)
Table 8. Correspondence between storm surge disaster risk levels, hazard levels, and vulnerability ranges.
Hazard LevelVulnerability Ranges
Low (IV)
[0.1, 0.3]
Lower (III)
(0.3, 0.5]
Higher (II)
(0.5, 0.8]
High (I)
(0.8, 1]
Low
(IV)
Low risk
(IV)
Low risk
(IV)
Lower risk
(III)
Lower risk
(III)
Lower
(III)
Low risk
(IV)
Lower risk
(III)
Higher risk
(II)
Higher risk
(II)
Higher
(II)
Lower risk
(III)
Higher risk
(II)
Higher risk
(II)
High risk
(I)
High
(I)
Lower risk
(III)
Higher risk
(II)
High risk
(I)
High risk
(I)
Disclaimer/Publisher’s Note: The statements, opinions and data contained in all publications are solely those of the individual author(s) and contributor(s) and not of MDPI and/or the editor(s). MDPI and/or the editor(s) disclaim responsibility for any injury to people or property resulting from any ideas, methods, instructions or products referred to in the content.