1. Introduction
Coastal sediment dynamics and grain size distribution are key indicators of morphodynamic processes and anthropogenic impacts on sandy coasts [
1,
2]. The distribution, differentiation, and transport of sediment grains influence beach morphology, resilience, and ecological functions [
3]. It is well established that wave energy, sediment supply, and eolian transport potential shape beach–dune systems [
4,
5].
In addition to natural forces, coastal engineering structures such as groynes, breakwaters, and seawalls significantly alter sediment transport dynamics [
6,
7]. These structures interfere with natural alongshore sediment transport, disrupting the sediment balance along the coast [
8,
9]. As a result, local hydrodynamic conditions selectively transport and deposit different sediment fractions, leading to altered grain size distributions [
10]. Reflective beaches typically retain coarser sediments, while dissipative systems with wider profiles and gentler slopes promote the deposition of finer sediments and enhance eolian transport toward dunes [
5,
11]. Numerous studies have documented such effects, particularly around groynes and jetties, which often cause sediment accumulation on the updrift side and erosion on the downdrift side [
7,
8,
12]. Typically, coarser particles dominate in erosional areas, while finer sediments are more common in depositional zones [
13]. Alongshore transport tends to result in progressively finer and better-sorted sediments [
13,
14], with coarser grains generally concentrated closer to the shoreline and finer sediments accumulating in the foredune [
15,
16,
17].
Grain size is widely recognized as a key sedimentological parameter [
18], closely linked to coastal morphology [
15,
19] and sediment transport patterns or transport mechanisms [
11,
20]. The presence of coarse sediment particles typically indicates proximity to the sediment source, a high-energy transport environment, or recent input from riverine systems [
21]. These factors are closely linked to the underlying geological framework, which plays a critical role in shaping surface sediment texture [
2,
22,
23,
24].
To mitigate coastal erosion, various strategies are implemented, including engineering structures; nearshore, beach, and foredune nourishment; bypassing; or a combination of these approaches. However, these interventions can significantly alter local hydrodynamic regimes, morphodynamic responses, and sedimentological characteristics, disrupting natural sediment transport both alongshore and cross-shore. Nourishment sands can differ from native sediments in grain size, mineral composition, and carbonate content [
25], and are later modified by wave and wind sorting processes [
26]. Since sediment transport is highly sensitive to grain size variability, such changes can affect beach stability and foredune development [
4,
11,
14].
In the Baltic Sea region, the influence of coastal engineering structures on sediment dynamics remains insufficiently understood, largely because of a lack of long-term, high-resolution field data on sediment texture. This gap limits our ability to assess how different types and scales of coastal infrastructure influence grain size distributions and their interaction with hydrometeorological regimes and geological settings. A deeper understanding of these interactions is essential for evaluating the impacts of coastal modifications and informing sustainable coastal management strategies.
This study addresses this knowledge gap by investigating the spatial and temporal variability in coastal surface sediment texture along modified sandy coasts of the Baltic Sea. Based on in situ sediment samples collected between 1993 and 2018, the analysis considers the effects of engineering interventions, hydrometeorological factors, and geological context on grain size patterns. The aim of this study is to investigate how engineering interventions, hydrometeorological conditions, and the geological framework influence coastal surface sediment texture. We hypothesize that hydrotechnical structures, sediment nourishment, and short-term hydrometeorological events influence the variability in coastal sediment texture along sandy shores. Specifically, downdrift zones are expected to exhibit coarser, poorly sorted sediments because of erosion and exposure of deeper layers, while updrift zones accumulate finer, well-sorted sands through longshore transport. However, the geological framework plays a decisive role in controlling sediment texture over the long term.
2. Study Area
The Lithuanian coast extends approximately 90 km in length from the southwest to the north and is primarily exposed to westerly, southwesterly, and northwesterly winds and waves. It is divided by the Klaipėda Strait into two distinct segments: the mainland coast, which is 39 km long, and the Curonian Spit coast, which extends for 51 km (
Figure 1). The beach width varies between 20 and 100 m, while the beach height at the foredune toe ranges from 1 to 3 m. Along the mainland coast, the beach sediments are predominantly quartzo-feldspathic sand enriched with heavy minerals. Where erosion prevails, the beach surface is covered with pebbles or cobbles. The mainland beaches are generally backed by foredunes, with short stretches bordered by moraine cliffs. In the nearshore zone, one to three sandbars are typically present, or the seabed consists of complex moraine ridges.
The Curonian Spit coast is characterized by less variable beach sediments, which range from very fine sand to pebbles. These beaches are backed exclusively by foredunes. The Curonian Spit coast is characterized by beaches that are 30 to 80 m wide and 1 to 3 m high. The nearshore zone extends to a depth of approximately 8 m and contains between one and five sandbars [
30].
Since the Baltic Sea is non-tidal, with a tidal range of less than 0.05 m, sediment transport is primarily influenced by wind, waves, and currents. On the southeastern Baltic Sea coast, westerly winds (SW, W, and NW) are predominant, with an average frequency exceeding 40 percent [
31]. The annual mean wind speed ranges from 4.0 to 6.0 m/s, and the average significant wave height is approximately 0.65 m, with wave periods ranging from 4 to 9 s. The storm season typically lasts from October to April. On average, there are 50 to 60 days per year with wind speeds exceeding 15 m/s, and approximately 15 days per year with wind speeds exceeding 20 m/s. During extreme storms in the cold season, wind speeds can reach up to 30 m/s, with corresponding wave heights ranging from 5 to 6 m.
The alongshore sediment transport along the Lithuanian coast is predominantly controlled by wave-driven currents [
27,
28,
29]. Sediment transport originates from the Sambian Peninsula and continues along the Curonian Spit and mainland coast. This transport is largely governed by southwesterly storm surges, which generate currents directed northward. Conversely, northwesterly storm surges induce reversing currents directed southward. Alongshore sediment transport is disrupted by hydrotechnical engineering structures (
Figure 1).
Hydrotechnical engineering structures. On the Lithuanian coast, there are two ports (Šventoji and Klaipėda) protected by hard engineering structures, such as jetties or jetty-breakwaters, while a groyne is installed at Būtingė (
Figure 1). The main characteristics of hydrotechnical engineering structures are given in
Table 1.
Further details of the historical review relating to the development of the hydrotechnical engineering structures of the Šventoji and Klaipėda Sea Ports are available in the following articles [
7,
32].
Geological framework. Lithological data on the coastal zone were used to describe the geological framework (
Figure 2), based on information from the “
Geological Atlas of the Lithuanian Baltic Sea Coast” [
30]. The recent beach and foredune sediments along the Lithuanian coast primarily consist of quartzo-feldspathic sand. In certain beach areas, pebble–cobble deposits formed by wave impact create an armor layer that protects the underlying sand. The sedimentary deposits of the Baltic Sea coast are of Quaternary age and are associated with the transgressive phases of the Litorina Sea, which occurred approximately 8.3 to 4.1 ka BP. The first Litorina transgression (L1) began around 8.3–8.2 ka BP, followed by the second transgression (L2) at approximately 7.5–7.0 ka BP, and the third transgression (L3) at around 4.7–4.1 ka BP [
33]. The major geological and geomorphological features of the Baltic Sea coast were largely formed during the post-Litorina stage, between approximately 3.7 and 0.7 ka BP. In general, recent beach sediments (lithostratigraphic unit mk IV) range from fine sand to pebbles. The average thickness of these deposits is 1.0–2.0 m, although in some locations it reaches up to 5.0 m.
On the southern side of the Klaipėda and Šventoji port jetties, fine sand sediments dominate. In contrast, the beach north of Šventoji port consists of variable sand textures overlain by pebbles. In the downdrift zone of the Klaipėda port jetties, sediment thickness reaches approximately 5.0 m and consists of coarse sand to pebbles. Older sediment strata in this area are overlain by coarse-to-very-coarse sand. The texture of coastal eolian sediments (lithostratigraphic unit v IV) is closely linked to marine sediment sources and ranges from very-fine-to-medium sand. The average thickness of these eolian deposits is 6.0–7.0 m, although in the updrift zones of the Šventoji and Klaipėda port jetties, it reaches 11.0–12.0 m.
3. Materials and Methods
3.1. Hydrometeorological Data
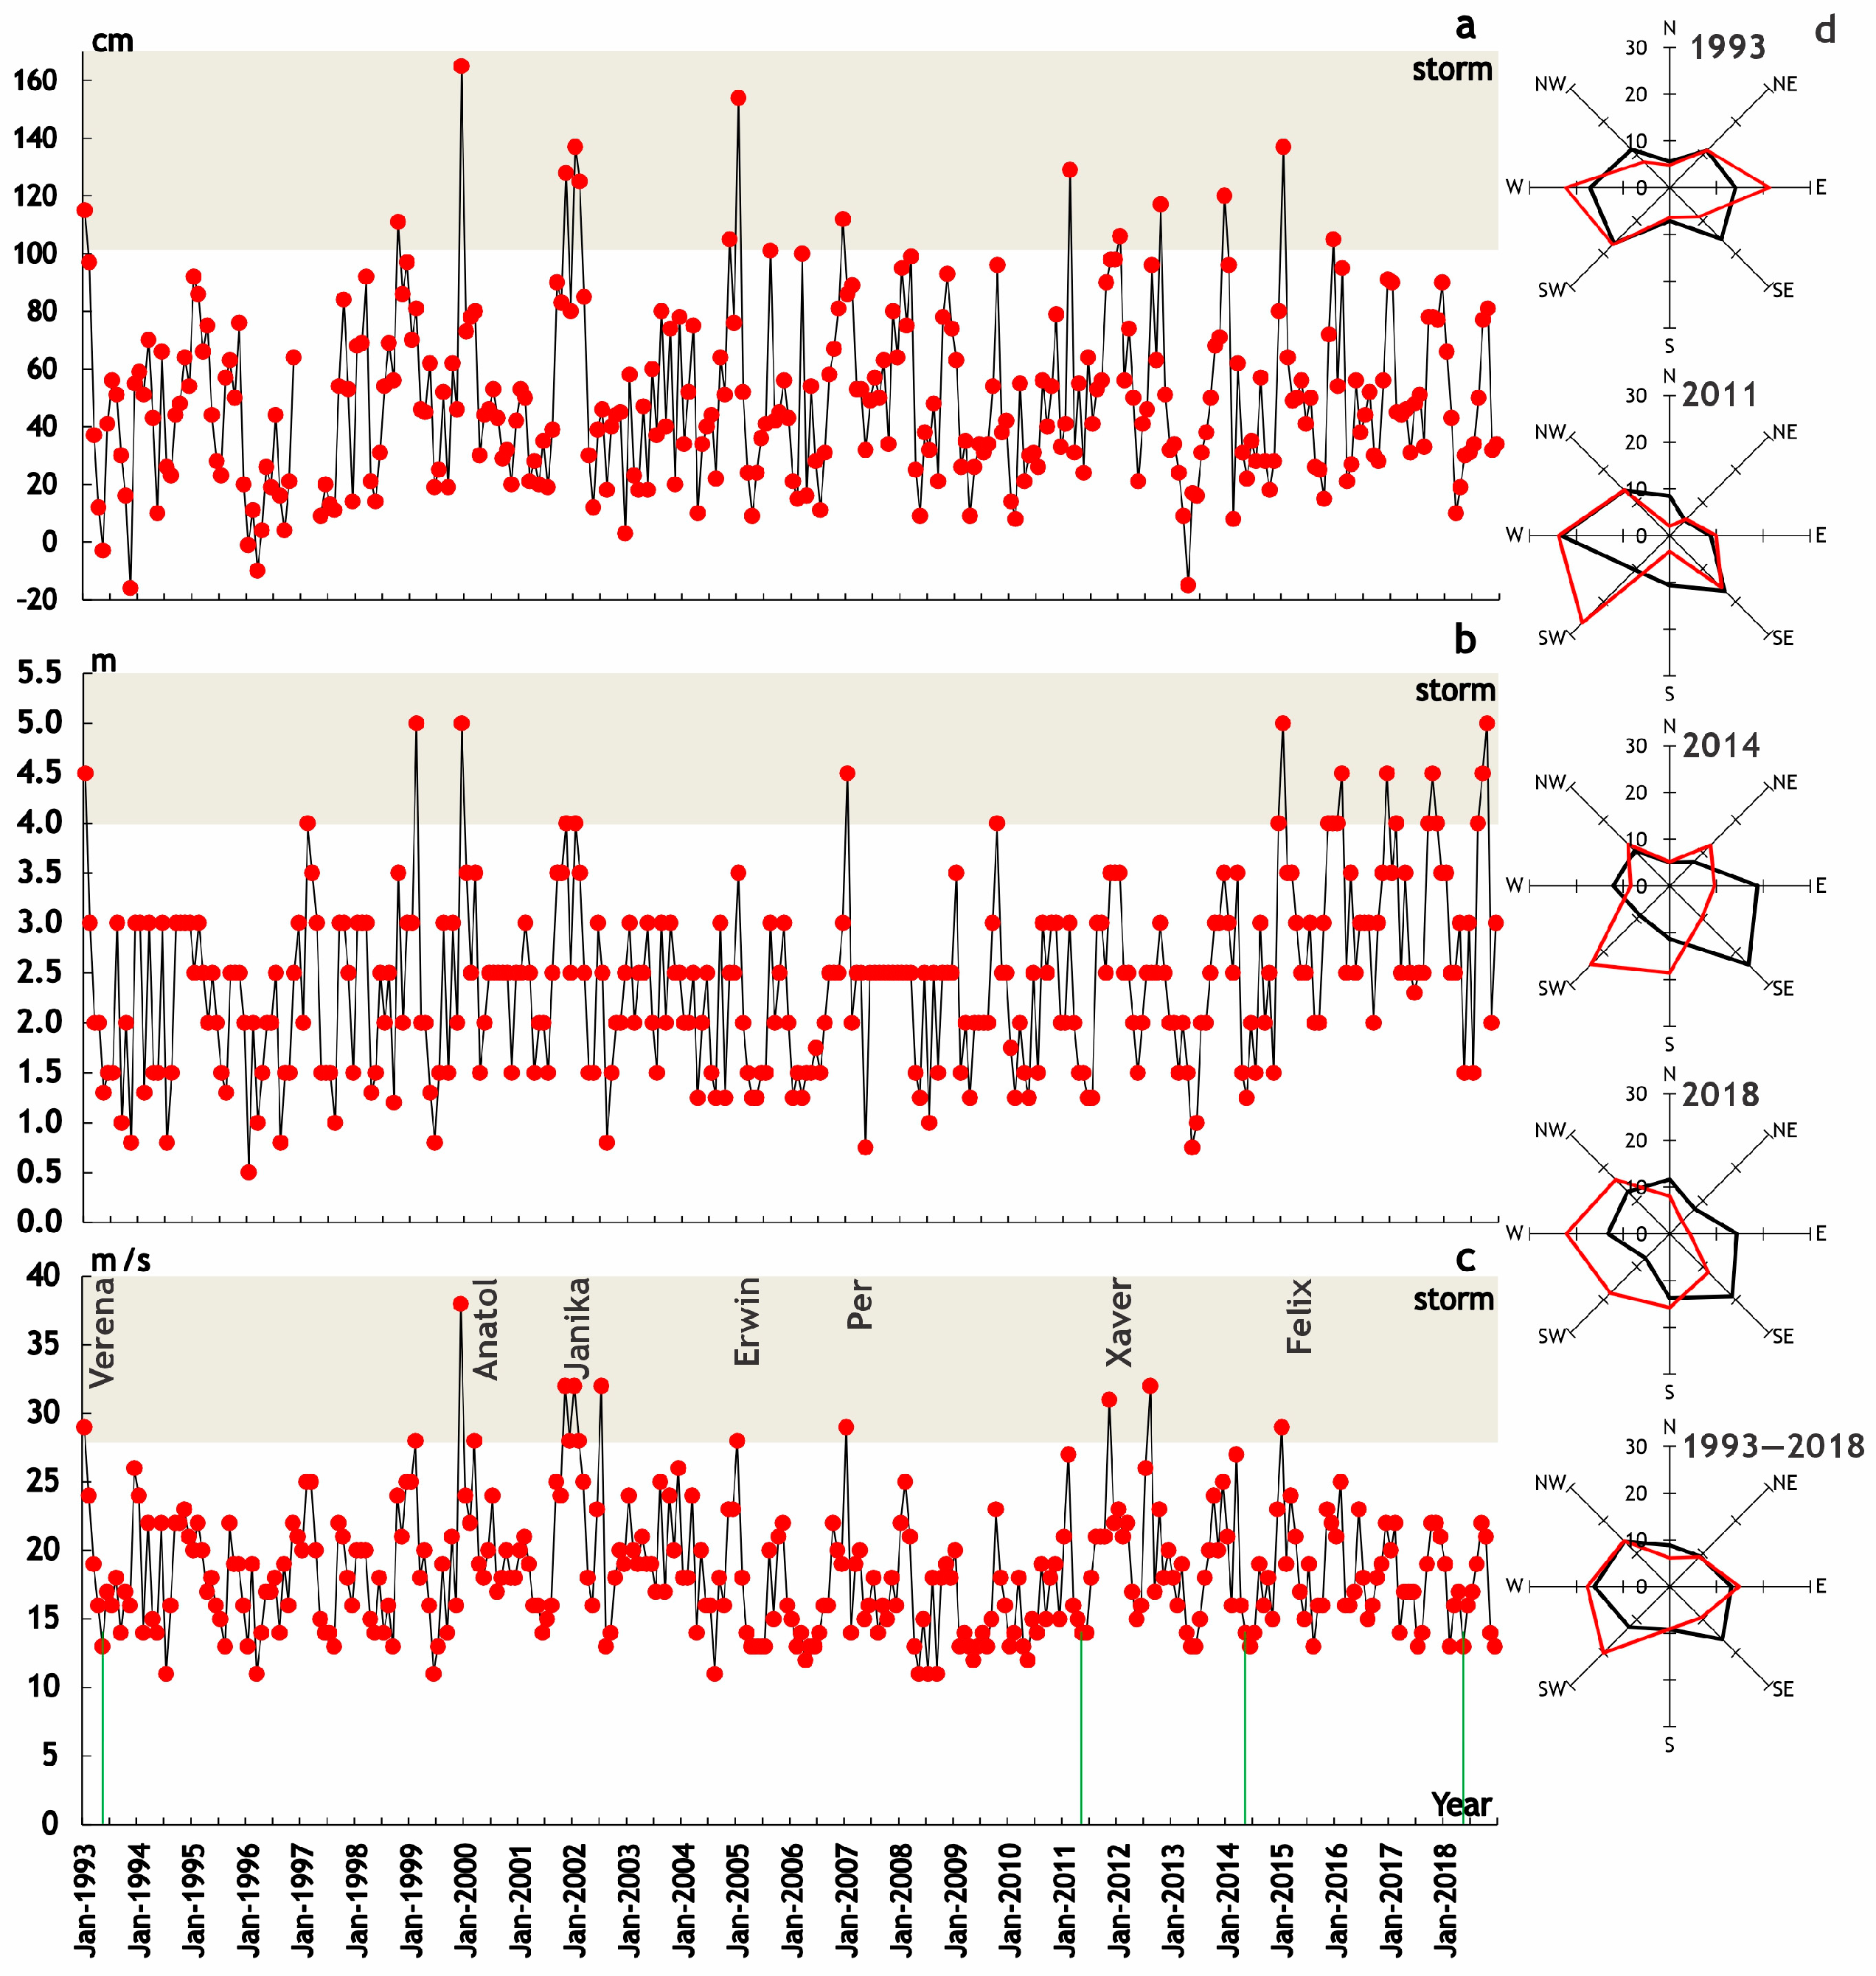
Hydrometeorological data (wind speed and direction, wave height, and maximum sea level) were obtained from the Lithuanian Hydrometeorological Service under the Ministry of Environment and the Environmental Protection Agency. To assess hydrodynamic conditions, wave data were obtained from the Klaipėda open sea visual observation station, and sea level data were collected from the Klaipėda Sea Port water level measuring station. Wind speed data were acquired from the Klaipėda automatic meteorological station. The maximum monthly values of wind speed, sea level, and wave height were used to assess storm conditions that have the greatest impact on shoreline changes. A storm is defined as an event in which the mean wind speed measured over a 10 min period reaches or exceeds 15 m/s [
34]. However, this threshold includes many storms occurring during the warm season that do not produce significant storm surges, sea level rise, or substantial changes in shore deposits. Therefore, based on national recommendations [
35], we selected a threshold of maximum wind speed exceeding 28 m/s, recorded during a storm. In addition, we identify a storm event when the sea level exceeds 100 cm and the wave height is greater than 4 m. Storms meeting these criteria are classified as disaster-level events and are known to cause significant impacts on the seashore. To analyze prevailing wind and wave direction changes, eight rhumb wind and wave roses were constructed: one for each year and one summarizing the entire period.
3.2. Coastal Dynamics Data
Coastal dynamic tendencies were assessed using cross-shore leveling monitoring data from 1993 to 2018 [
36] to evaluate coastal development trends on both sides of the Klaipėda and Šventoji port hydrotechnical engineering structures. In addition, spatial shoreline dynamics were analyzed by comparing shoreline positions derived from aerial photographs taken in 1991, 2010, 2013, and 2018. Shoreline trends were calculated using the Digital Shoreline Analysis System (DSAS) version 6 [
37], following the methodology described in [
38]. Changes in the shoreline were analyzed at 100-metre intervals along perpendicular transects from the shore. The linear regression rate method (LRR) was applied to estimate shoreline change rates. As noted in [
14], this approach reduces the disproportionate influence of recent extreme storm events.
3.3. Sand Grain Size Data
Surface sand samples were collected from four designated pilot areas along the Lithuanian coast. Each area consisted of a 10 km long stretch, divided by hydrotechnical structures into two segments of 5 km each (
Figure 1). Within each segment, sampling sites were established at regular intervals of 500 m. Samples were collected from two zones: the middle part of the beach and the foredune slope.
In total, 246 surficial sand samples were collected during the spring seasons (April–May) of 1993, 2011, 2014, and 2018. Sampling during this period ensured relatively stable sea and wind conditions. The geographic coordinates of each sampling site were recorded using a handheld GPS Oregon 550 (Garmin Ltd., Olathe, KS, USA) device (±3 m accuracy, Garmin specification). Although the beach changes from year to year, it retains its general morphometric parameters [
35]. To ensure spatial consistency across sampling years, GPS positioning was supplemented with cross-shore profile leveling data referenced to fixed benchmarks. To minimize positioning error, a Topcon HiPer SR GNSS (Topcon Positioning Systems, Inc., Livermore, CA, USA) system was used, offering horizontal accuracy of ±1.0 cm and vertical accuracy of ±1.5 cm. The collected samples were air-dried and subsequently analyzed at the laboratory of the Nature Research Centre. Mechanical sieving was performed using a Fritsch Analysette 3 Spartan Pulverisette 0 (FRITSCH GmbH—Milling and Sizing, Idar-Oberstein, Germany) vibratory sieve shaker for 15 min. A stack of 11 sieves was used, following established methodologies [
39].
3.4. Data Analysis
Grain size data were analyzed using GRADISTAT 8.0 software [
40], which calculates, using the geometric method of moments, the following grain size parameters: mean and sorting. The analyzed sediments were classified according to the Wentworth [
41] grain size classification, and sorting was classified based on Trask’s [
39] sorting coefficient. Plots of mean grain size versus sorting were used to identify the dominant sediment transport processes and to assess the extent of the impact of the hydrotechnical engineering structures. The relationship between grain size distributions on the beach and foredune was assessed using Pearson’s correlation coefficient (
p < 0.05), and correlation matrices were generated to further explore these associations.
4. Results
4.1. Hydrometeorological Regime
During the study period, 22 storms with maximum wind speeds exceeding 28 m/s were registered. The highest number of events occurred in 2002 (six cases), while the lowest frequency was observed in 1993, 1999, and 2001 (three occurrences each). The most intense storms, with wind velocities exceeding 30 m/s, took place in 1999, 2001, 2002, 2011, and 2012. The majority of these storms developed during the cold season (November–March), with only two major events recorded during the warm season: in July 2002 and August 2012 (
Figure 3a). The strongest wind speed, 38 m/s, was measured on 5 December 1999 during Storm Anatoly.
Storm activity in the Baltic Sea generated waves reaching heights of ≥4 m (22 events) and sea level rises of ≥100 cm (17 events). Although 22 wave events exceeding 4 m were identified during the study period, 13 of them were concentrated in the last three years (2015–2018). Waves attaining 5 m were documented only four times: twice in 1999, and once in both 2015 and 2018 (
Figure 3b). Sea level surges of ≥100 cm were more frequent between 1993 and 2006 (11 events). The highest water levels were recorded in December 1999 (Storm Anatoly, 164 cm), November 2001 (Storm Janika, 128 cm), January 2002 (137 cm), January 2005 (Storm Erwin, 154 cm), February 2011 (129 cm), and January 2015 (Storm Felix, 137 cm).
Depending on prevailing marine conditions, water elevation, and wind strength and direction, the peaks of wind velocity, wave height, and sea level during storms did not always coincide (
Figure 3). In the southeastern Baltic region, the two dominant wind directions over the period 1993–2018 were SE and W (both with 16% occurrence), while N (8.9%) and NE (9.2%) were the least frequent (
Figure 3d). In 1993, the prevailing wind directions were W (17.0%) and SW (16.9%), while by 2018 they had shifted to E (14.3%) and SE (18.9%). Between 1993 and 2018, the most common wave approaches were from the SW (20.1%) and W (17.6%). Interestingly, the occurrence of SW and W waves was 39.5% and 40.1% in 1993 and 2018, respectively. However, 21.4% of waves originated from the east in 1993, compared with just 4.3% in 2018 (
Figure 3d).
4.2. Coastal Dynamic Tendencies
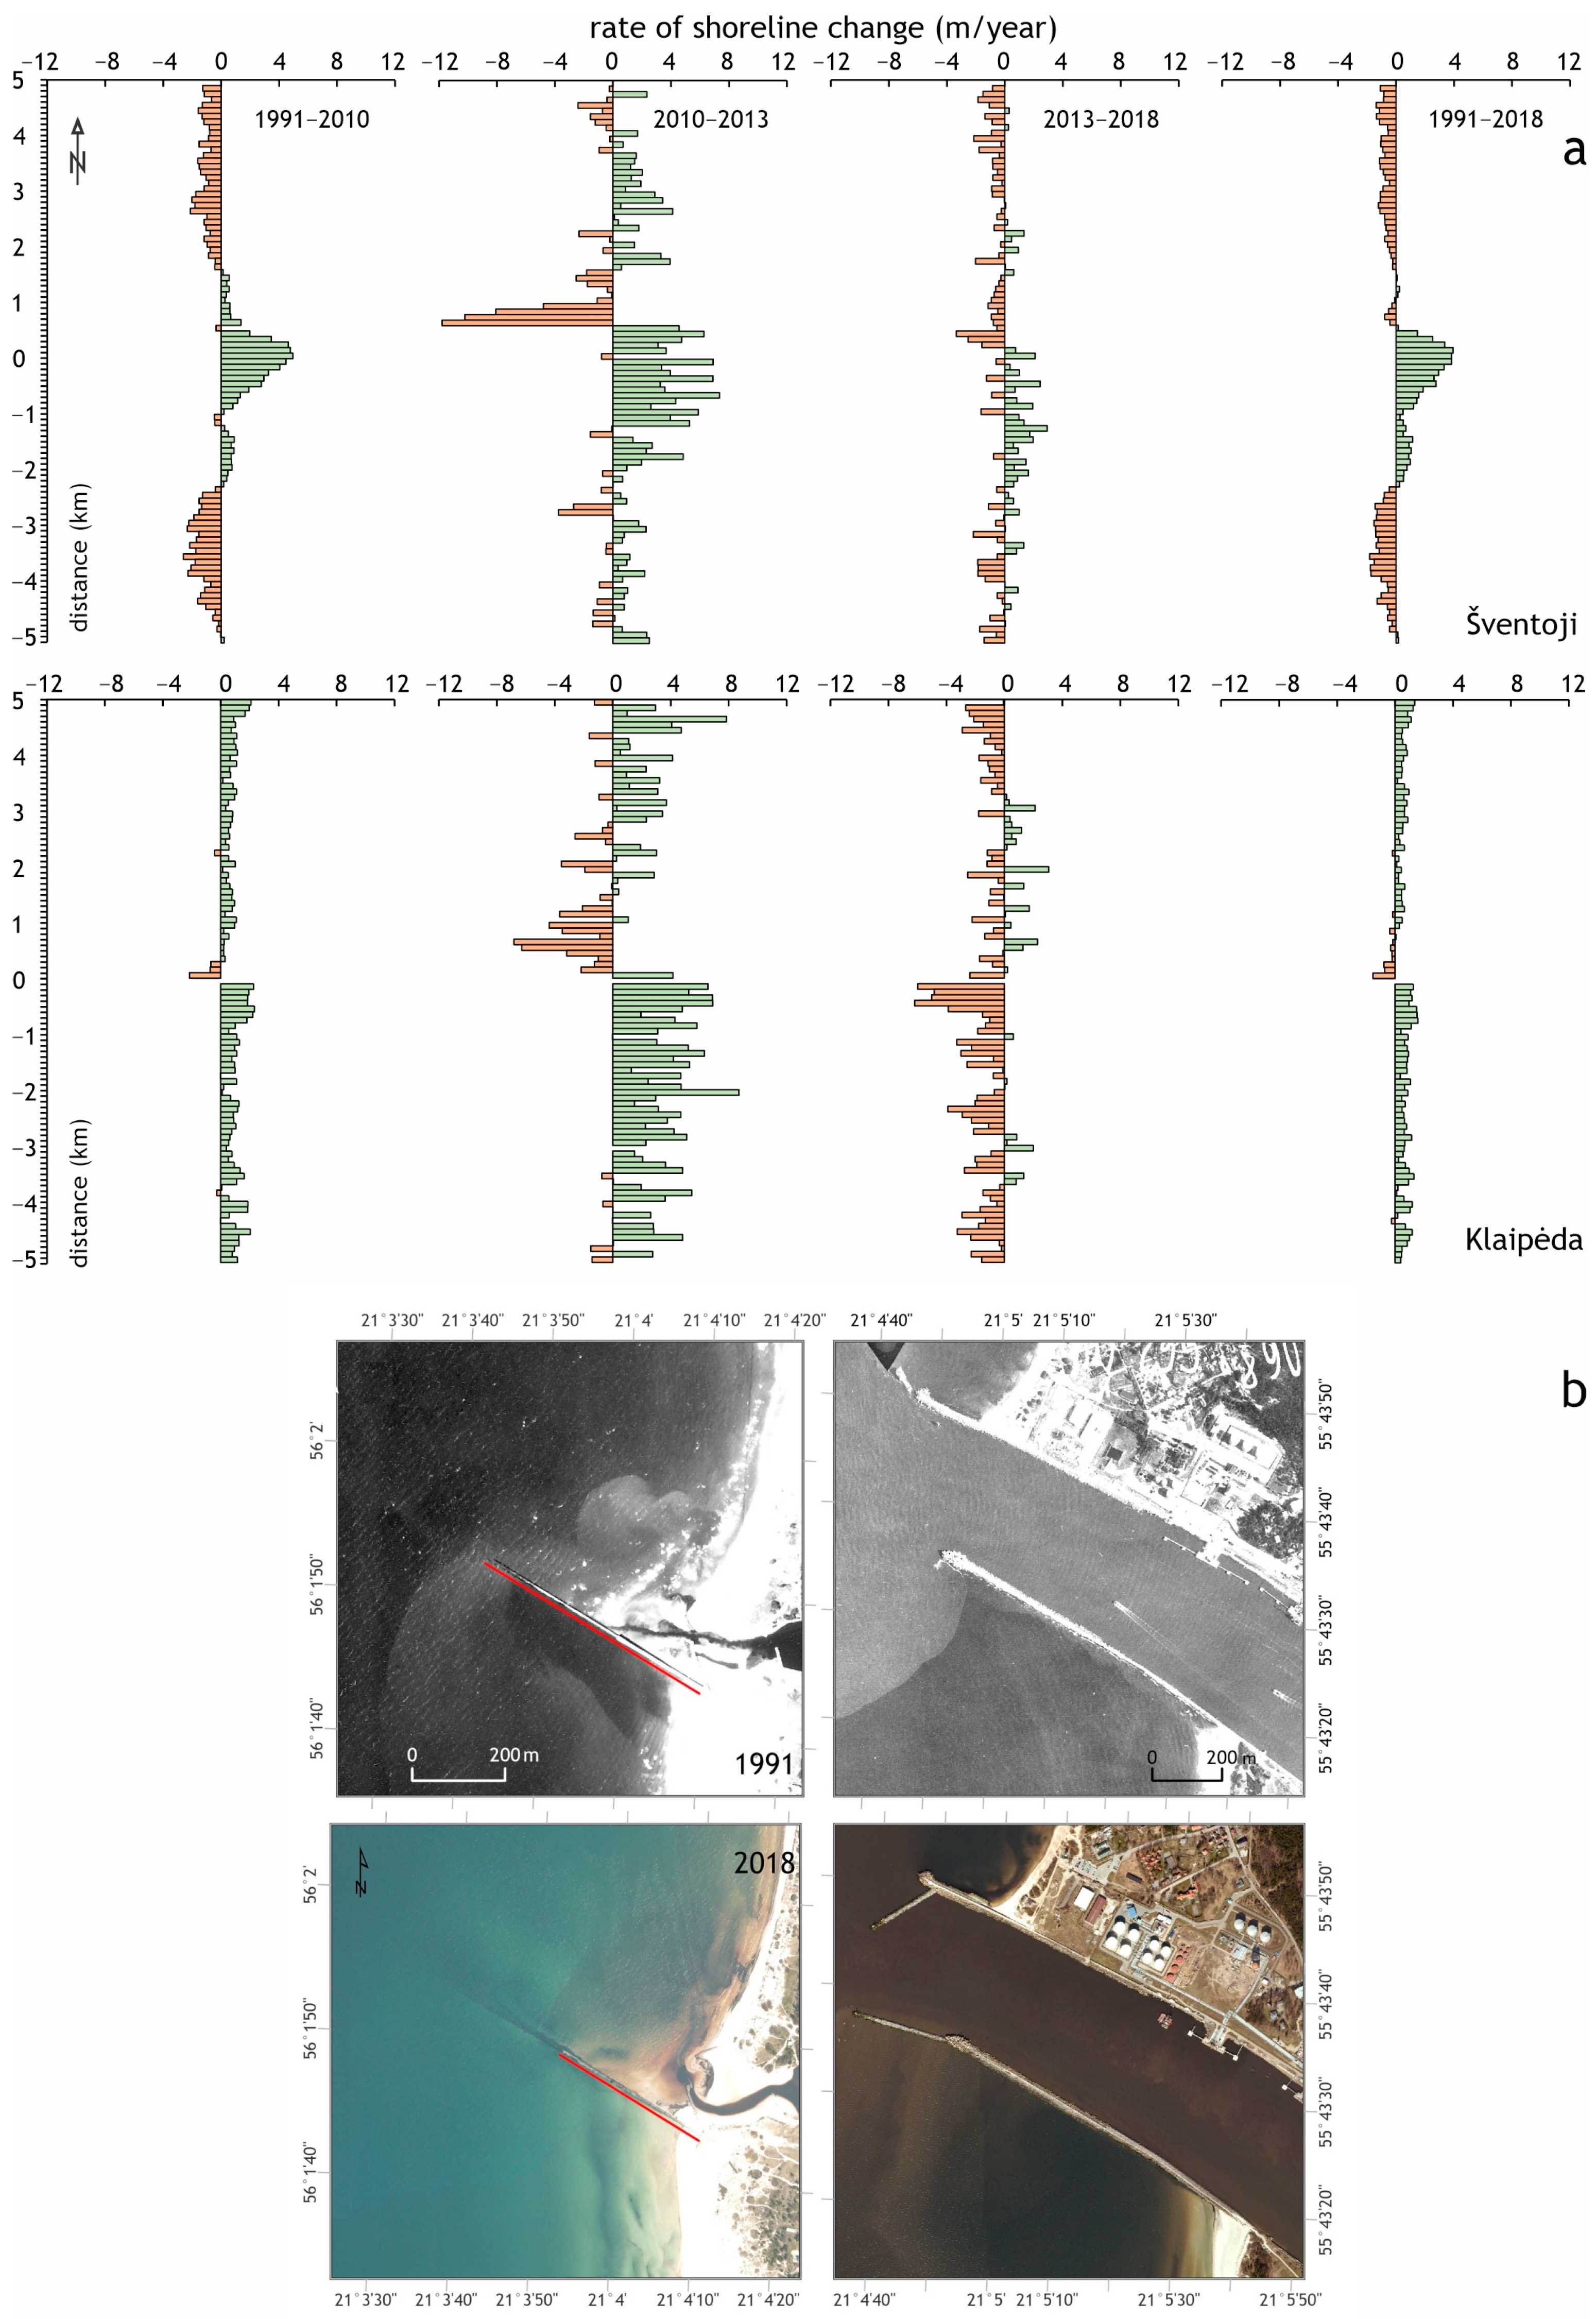
Significant shoreline retreat was identified in the downdrift zones of the Šventoji and Klaipėda port jetties; however, both the length of the erosion zones and the rates of retreat varied considerably (
Figure 4a). The erosion zone in the downdrift area of Klaipėda port extends for 1.2 km, with retreat rates ranging from −1.52 to −0.15 m/year in 1991–2018. In contrast, erosion predominates along nearly the entire downdrift sector of the Šventoji port jetties, where shoreline retreat rates vary from −1.37 to −0.09 m/year. In the downdrift zone, shoreline accretion occurred only in short stretches—at rates of 0.14–3.80 m/year over distances of 0.0–0.6 km, and 0.01–0.42 m/year over shorter stretches between 1.2 and 1.6 km during the period from 1991 to 2018.
The updrift zones of the Šventoji and Klaipėda port jetties demonstrate different long-term shoreline development tendencies. In the case of Klaipėda, accretion dominates the entire 5 km stretch, with shoreline accretion ranging from 0.12 to 1.57 m/year. In contrast, Šventoji exhibits a pronounced accumulation–erosion pattern. The shoreline accretion zone is 2.1 km long, with rates ranging from 0.24 to 3.82 m/year. The erosion zone covers the southernmost 2.5 km of the coastline, with rates of shoreline retreat ranging from −0.26 to −1.83 m/year (
Figure 4a).
The highest amplitudes of shoreline advancement occurred in the Klaipėda port jetties impact zone in 2010–2013 (σ = 3.01) and 2013–2018 (σ = 1.66), and in the Šventoji port jetty impact zone in 1991–2010 (σ = 1.60) and 2010–2013 (σ = 2.98). When comparing trends in shoreline position change in the downdrift and updrift zones, it was found that the downdrift zone experienced the strongest fluctuations. In both pilot areas, the updrift zone showed greater shoreline position change than the downdrift zone during the 2013–2018 period, when shoreline retreat was predominant.
The changes in cross-shore profile dynamics are illustrated in
Figure 2. The shoreline evolution corresponds well with the cross-shore leveling monitoring data collected between 1993 and 2018. The analysis of cross-shore profile changes during this period demonstrated that substantial erosion prevailed in the downdrift zones, while accumulation was dominant in the updrift sectors of both the Klaipėda and Šventoji port jetties.
During the study period, sediment redistribution is observed, with net accretion occurring along much of the coast. However, erosion processes continue to dominate in the downdrift sectors of the Klaipėda and Šventoji ports jetties. Sediment supply through alongshore transport in the updrift zones, together with eolian processes, contributes to reshaping the foredunes. Nevertheless, sediment deficits in the downdrift sectors result in substantial foredune degradation. The retreat rates of the foredunes in these downdrift zones are comparable to the rates of shoreline retreat. As the shoreline recedes and beach width narrows, waves increasingly erode the beach and western slopes of the foredunes. Subsequently, the beach recovers as sediments are redistributed from the foredunes. Overall, beaches in the updrift zones have widened and increased in elevation, while those in the downdrift zones have narrowed and degraded [
35]. However, the most significant changes were observed in the updrift area of Šventoji port and the downdrift area of Klaipėda port (
Figure 2).
4.3. Hydrotechnical Engineering Structures
Based on the analysis of aerial photographs, it is identified that the longest southern jetty of Šventoji port underwent significant changes during the study period as a result of severe storms. The southern jetty of the Šventoji port was shortened by 60 m between 1991 and 2010, and by a further 20 m in the two subsequent periods. Between 1991 and 2018, the length of the southern jetty’s overwater section was reduced by 100 m (
Figure 4b). This contributed to an increase in alongshore sediment transport from south to north [
7,
27,
28,
29]. In contrast, the wooden Būtingė groyne (53 m in length), located approximately 1 km from the Latvia–Lithuania border, remained unchanged over the same period.
The hydrotechnical structures of Klaipėda port were reconstructed between 2001 and 2002. During this reconstruction, the jetties were extended and reoriented. The northern jetty was lengthened by 205 m, and its terminal orientation was shifted from NW–SE to SW–NE. The southern jetty was extended by 278 m and was slightly rotated toward the WNW. These structural modifications substantially altered the wave regime [
36], affecting nearshore bathymetry, shoreline configuration, and sediment transport patterns [
8,
14].
4.4. Grain Size Changes
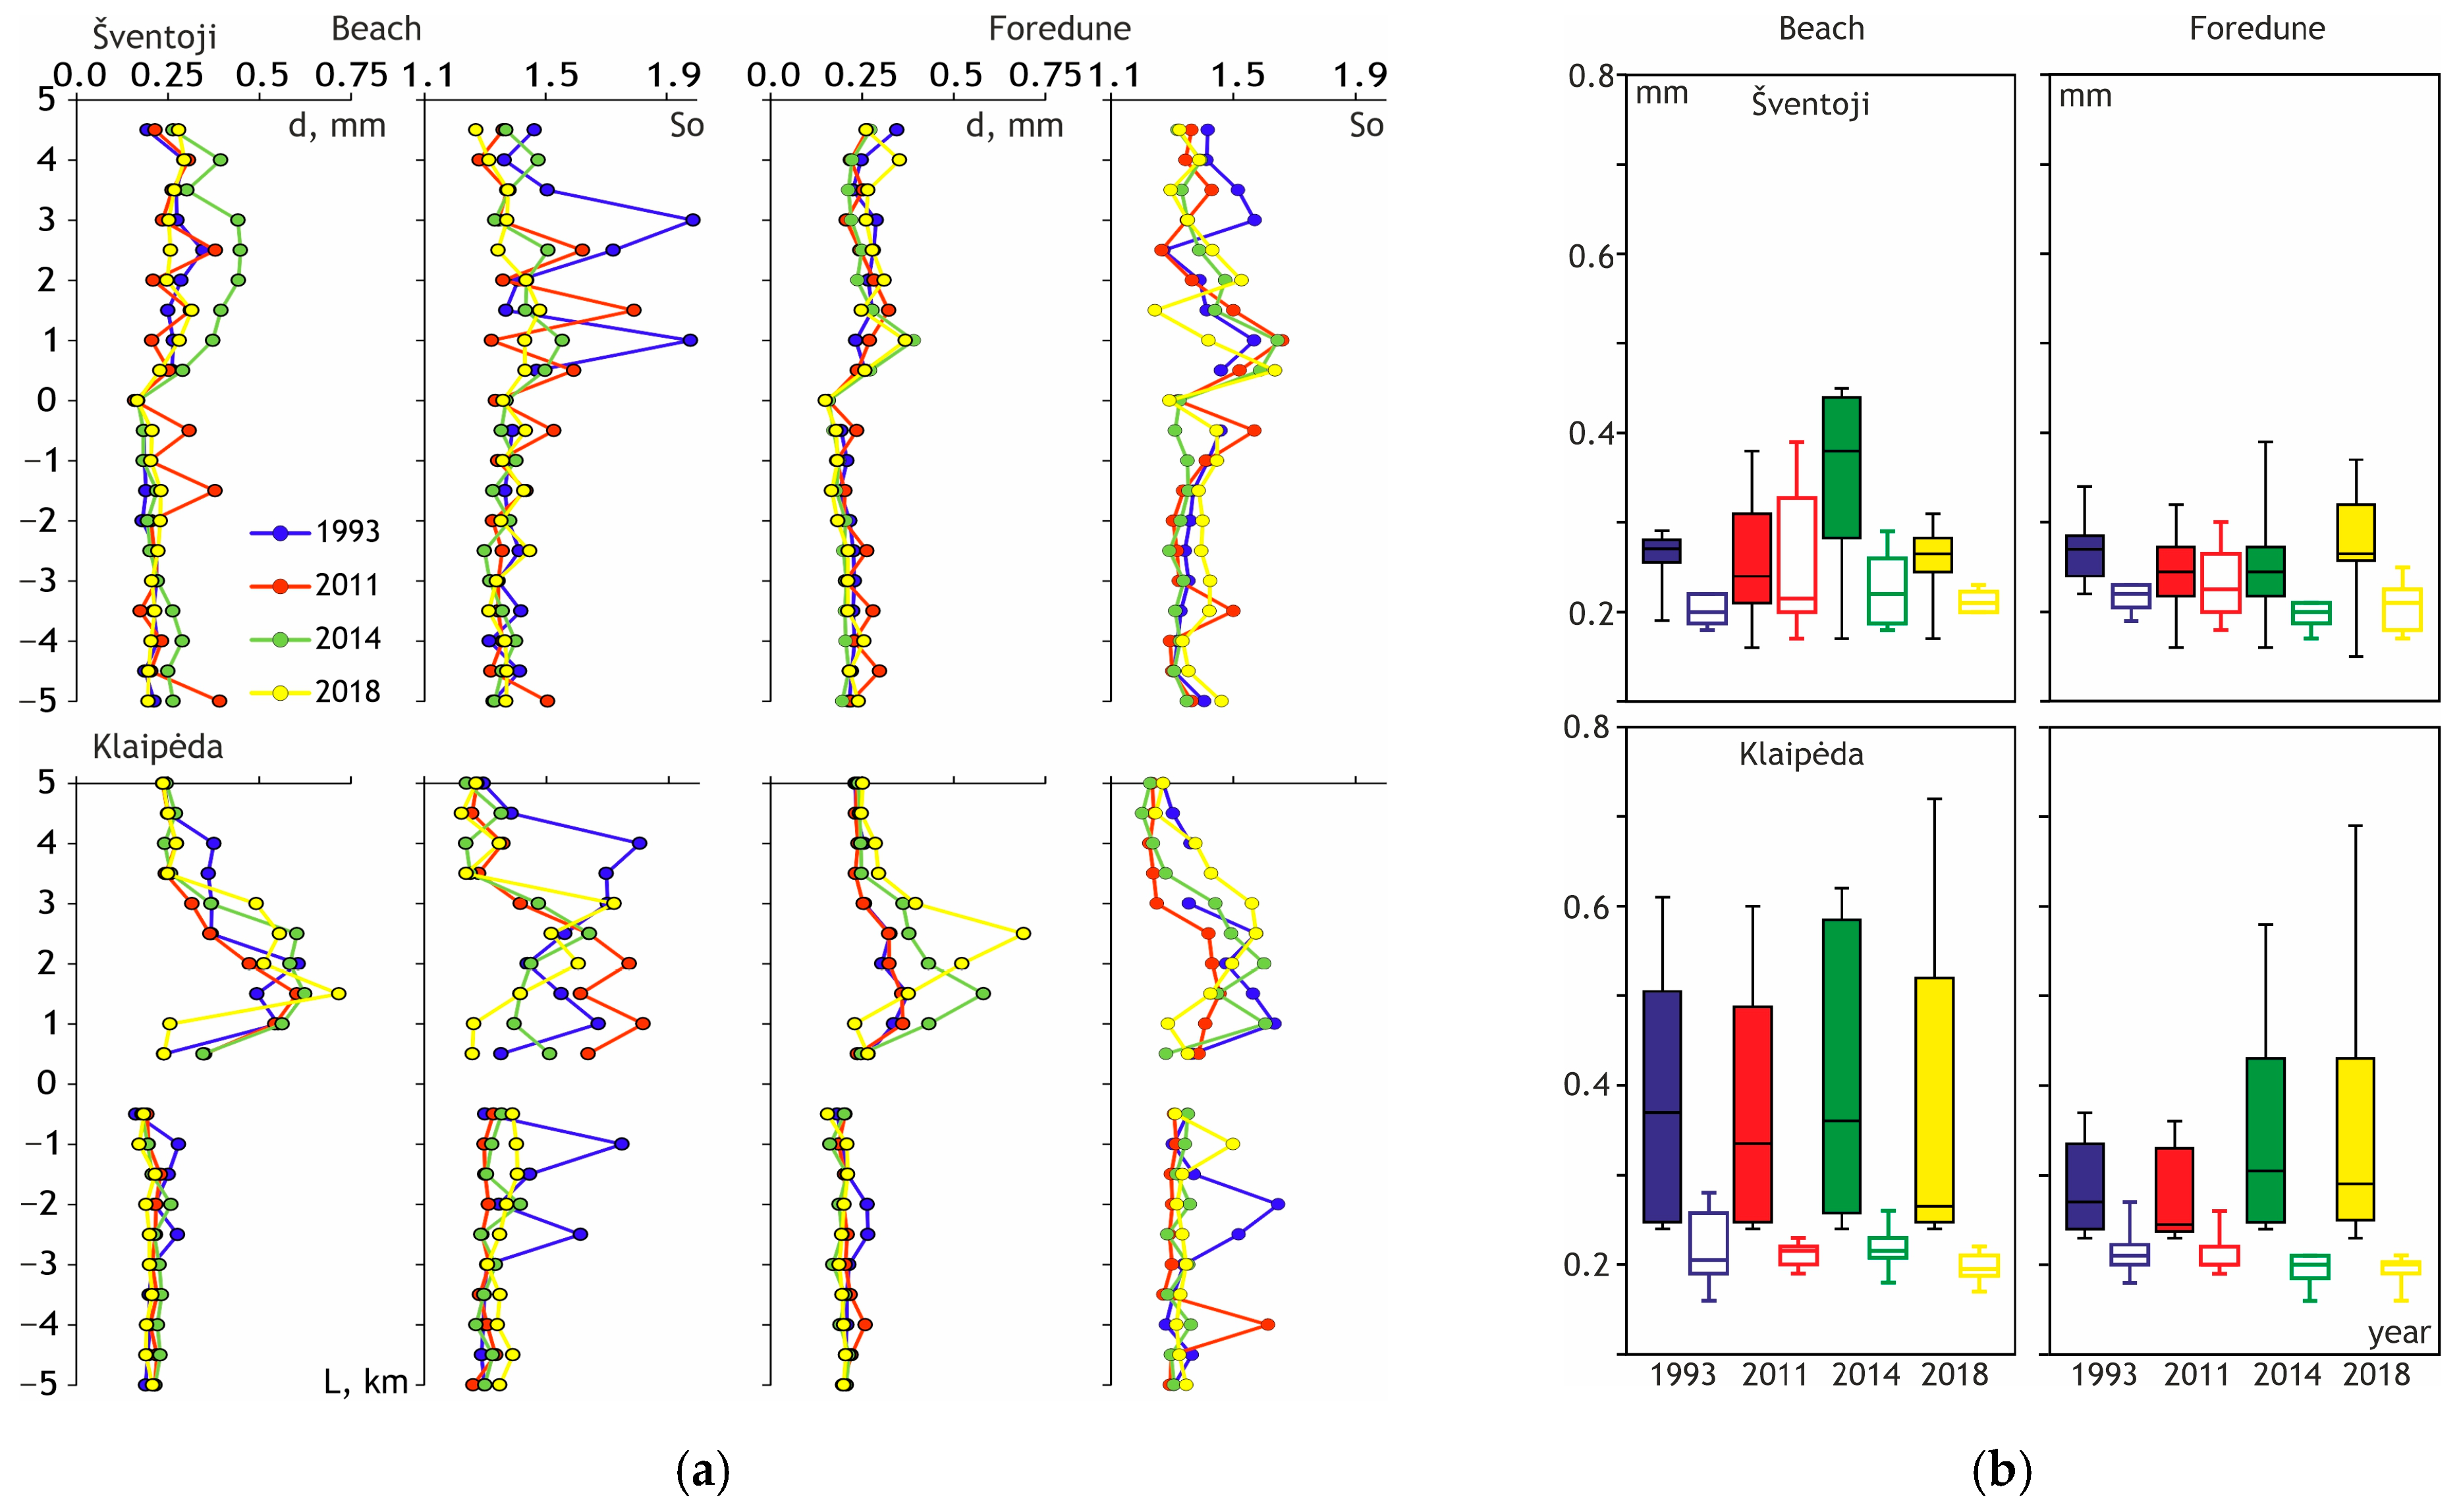
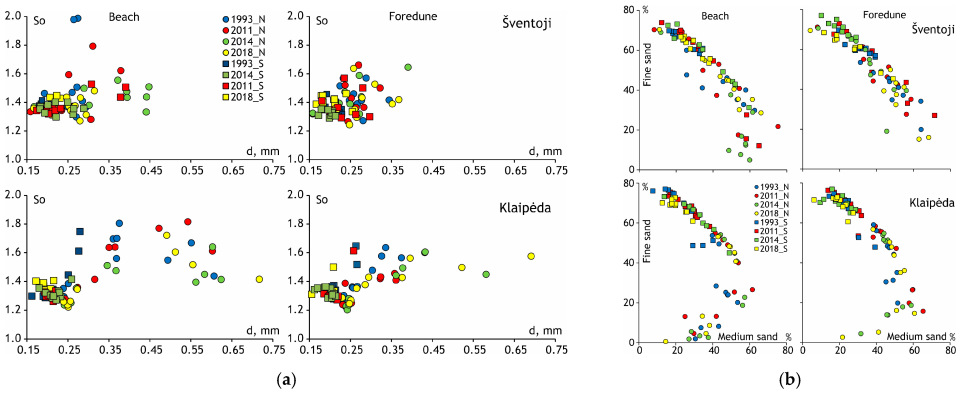
Surface sediments in the middle of the beach and on the slope of the foredune range from very-fine-to-coarse sand, with average particle (
d) sizes between 0.20 and 0.38 mm. The sand is predominantly well and moderately well sorted, with average sorting values from 1.34 to 1.47. Coarse and moderately well-sorted sand dominates in the downdrift zone, while fine and well-sorted sand prevails in the updrift zone (
Figure 5a). Moderately sorted sand (
So = 1.62–2.00) appears in the downdrift zone of Šventoji port only in 1993 and 2011, while at Klaipėda port, it is consistently observed in the downdrift zone throughout the study period and in the updrift zone in 1993 (
Figure 5a).
A comparison of sediments from the coastal stretches near the Šventoji and Klaipėda ports shows that sediment grain size variability in the updrift zone is lower than in the downdrift zone during the analyzed period (
Figure 5b). In the downdrift coastal zone of the Šventoji port, these differences may also be caused by the Būtingė groyne, as it can modify the local wave and current regimes. Smaller variations in sediment grain size are observed on the foredune slope compared with the beach, as the foredunes are composed mainly of eolian sediments (
Figure 5b).
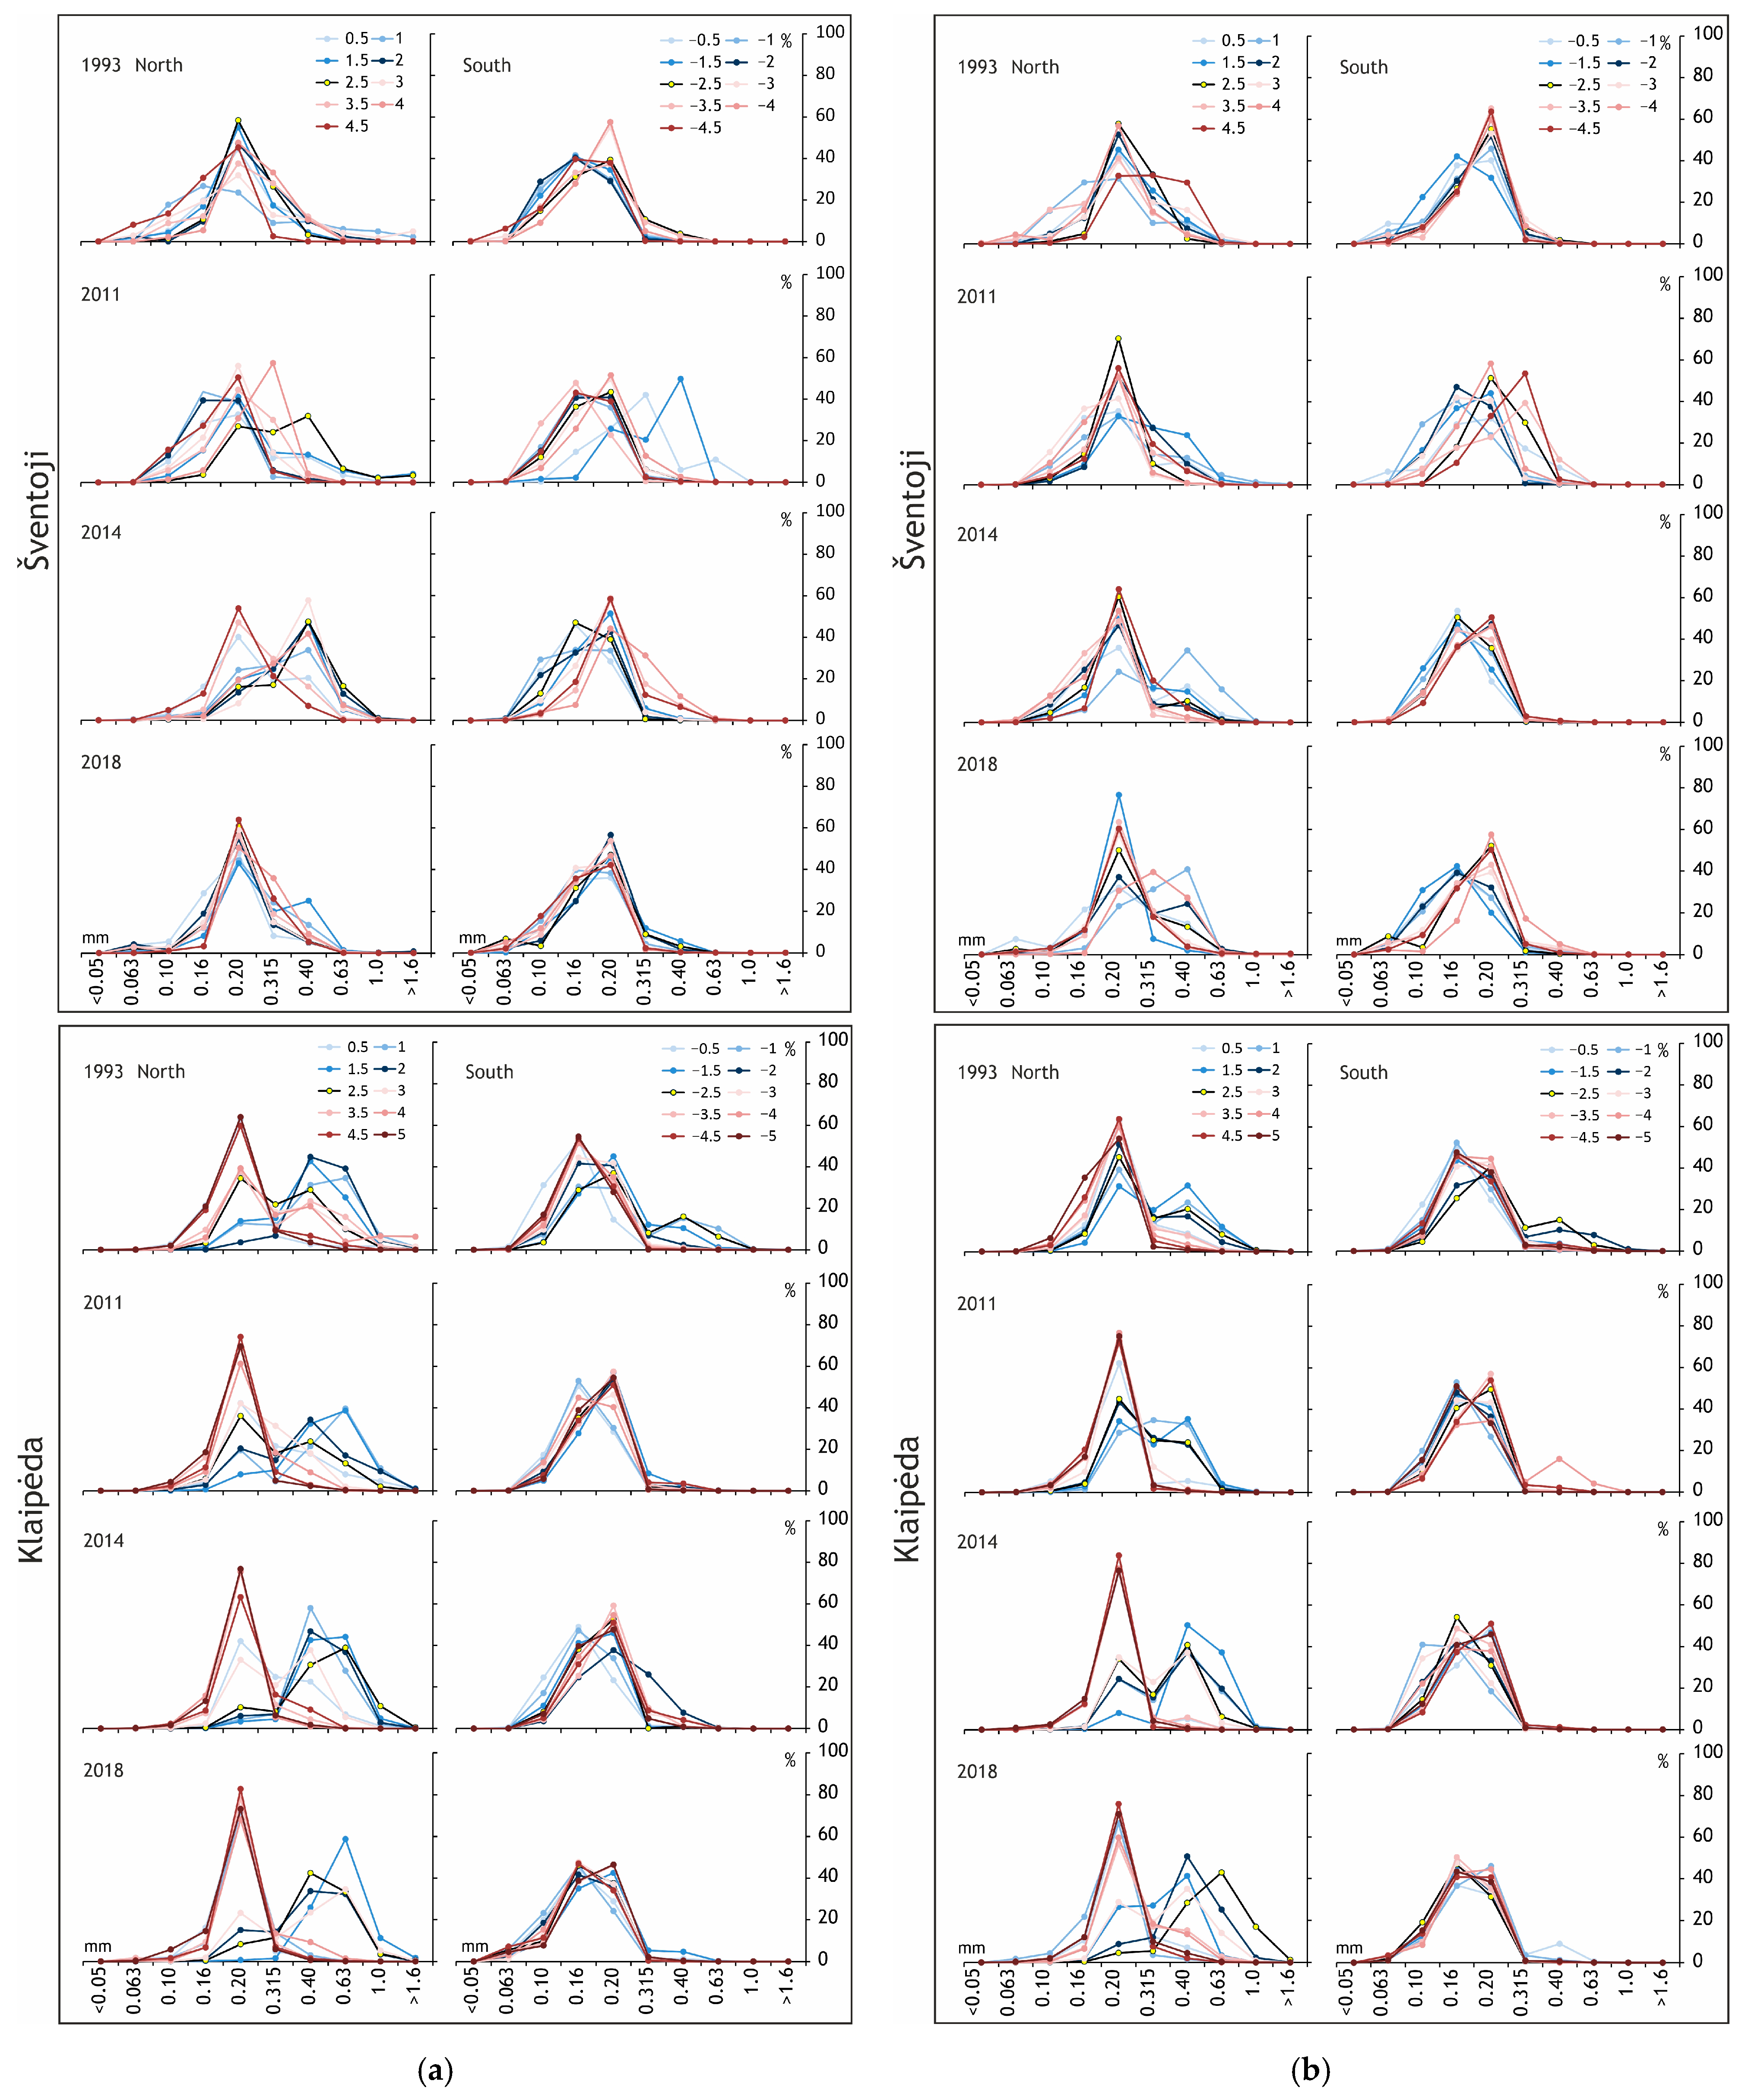
However, significant changes in sand grain size are recorded on the beach in 2011 and 2014, and on the foredune slope in 2014 and 2018 along the coastal zone of Šventoji and Klaipėda ports. In the downdrift zone of Klaipėda port, a bimodal grain size distribution dominates both the beach and foredune slope throughout the study period, while in the updrift zone, this distribution is observed only in 1993 (
Figure 6). Such changes in sediment texture reflect the dynamic nature of the coast, which depends on the frequency and duration of stormy and calm periods.
Similarly, a bimodal distribution is observed in the downdrift zone of Šventoji port between 2011 and 2018, and in the updrift zone in 2011. In the downdrift zones near the ports of Šventoji and Klaipėda, the underlying geological strata consist of medium-to-very-coarse sand (
Figure 2,
Figure 6 and
Figure 7). During extreme storms, intensified hydrodynamic processes such as waves, storm surges, rising sea levels, and runup result in shoreline retreat and erosion of finer, lighter sediments. This causes beach lowering and the exposure of older strata containing coarser sediments (
Figure 3 and
Figure 4). This exposure alters the texture of the surface sediments and highlights the significant impact of the underlying strata on the observed sediment characteristics, especially in coastal areas with limited sediment supply where alongshore sediment transport is disrupted by engineering structures [
24,
27,
28,
29]. This exposure highlights the influence of the underlying geological framework, which plays a key role in determining grain size characteristics. The grain size of beach sediments largely reflects the geological framework of the respective coastal section [
2,
18]. The geological framework can be regarded as a primary control on sediment distribution at a given site or region over the long term, as sediment composition is directly influenced by the onshore geological setting [
2,
18,
42,
43]. However, sediment texture can also be modified by short-term processes such as storm events [
43,
44].
4.5. Effects of Storm Events and Human Interventions on Grain Size Distribution
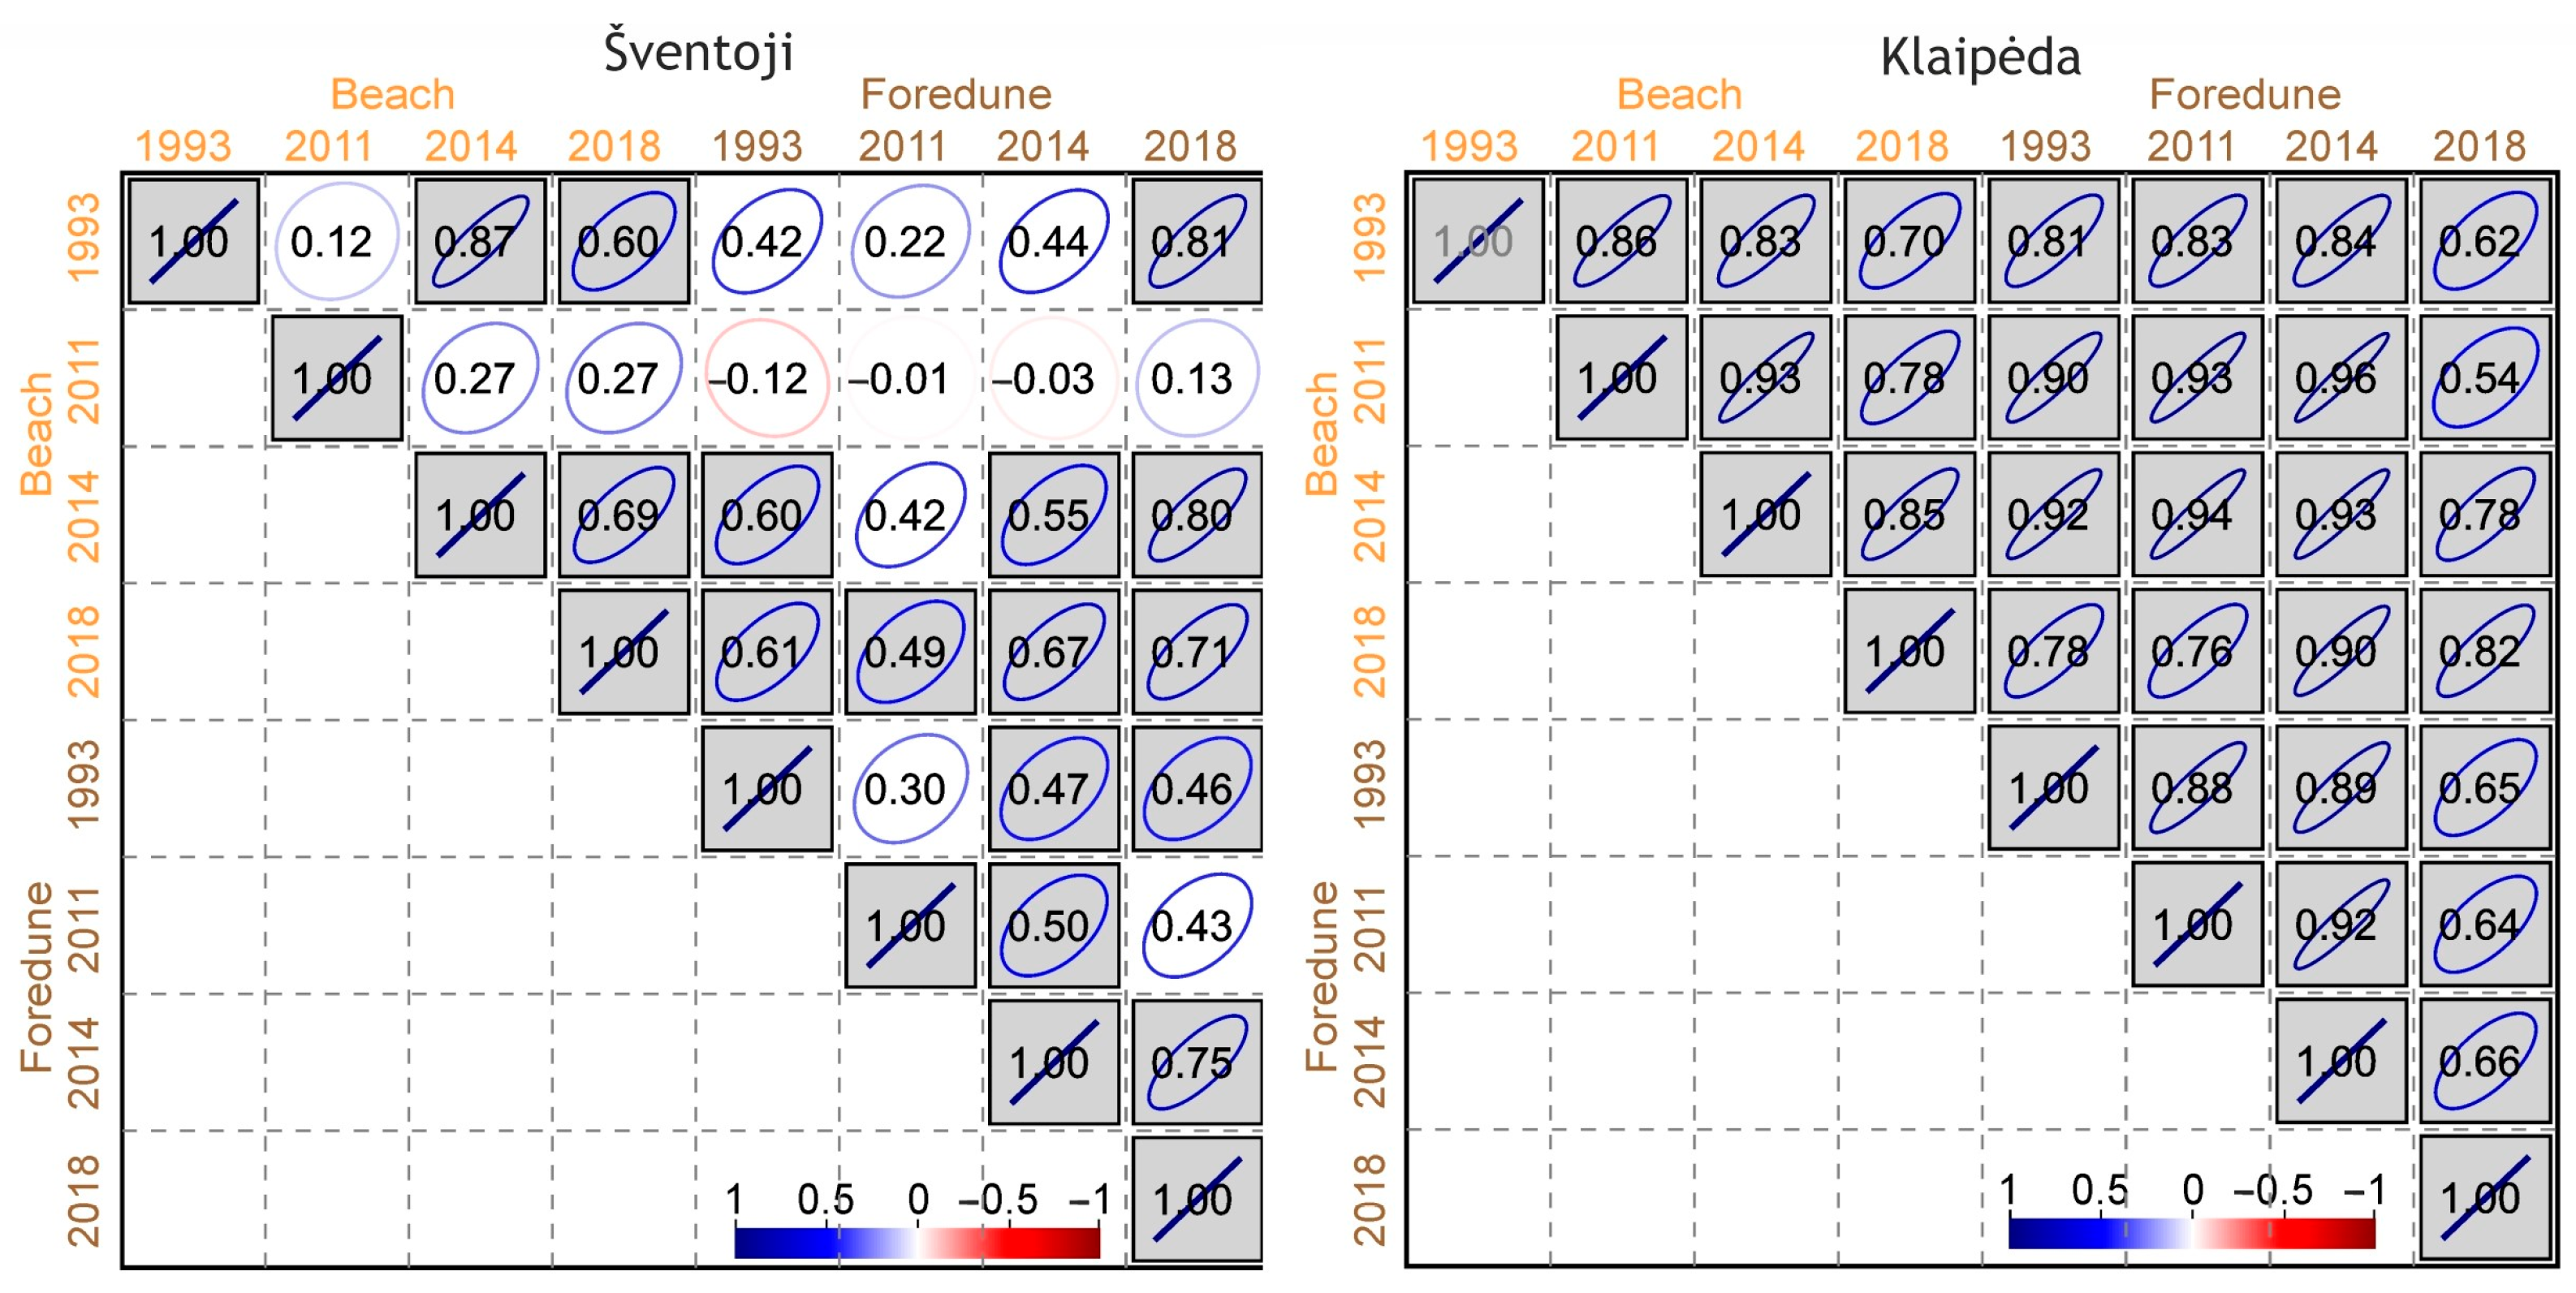
Significant positive correlations in mean grain size distribution between the beach and foredune slope indicate a strong beach–dune interaction along the Klaipėda and Šventoji coastal stretches. The correlation coefficients range from 0.54 to 0.96 at Klaipėda and from 0.46 to 0.87 at Šventoji. These correlations (
r = 0.46–0.96,
p < 0.05) are present in most years, with the exception of 1993 and 2011 at the Šventoji port stretch, where no statistically significant relationships were detected (
r = −0.01 to 0.43,
p > 0.05;
Figure 8).
The sand samples collected in 1993 differ from those collected later (in 2011–2014) in that they do not exhibit a bimodal grain size distribution. The composition of the 1993 sand samples is notably different, as they were collected in spring following the Verena storm, which had caused severe coastal erosion and resulted in moderately sorted sediments on the beach. Additionally, the beach and foredune sediments that year were not affected by any direct human interventions, such as beach nourishment or inlet channel dredging. The significant changes in grain size distribution in the updrift zone of Šventoji port in the period 2011–2014 were triggered by a stormy summer in 2011 and anthropogenic impact, when the proportion of medium and coarse sand fractions increased by a factor of 1 to 10 as a result of these processes (
Figure 6). This change is likely influenced by dredging activities at the Šventoji River entrance channel and within the port basin. A total of 28,500 m
3 of sediment was planned for excavation; however, the exact amount excavated could not be determined, as some was washed away during a storm. This occurred because the dredged material (
d = 0.29 mm,
So = 1.53) was stored too close to the shoreline on the upwind side. These sediments were subsequently transported northwards by longshore currents [
45], during which the steady sediment transport was disrupted, and atypical sediments entered the shore zone (
Figure 8).
In addition, the temporary sand coarsening observed in the southern part of the Šventoji port during 2011–2014 may be attributed to the input of coarser sediment from the Palanga shore, where beach nourishment was conducted using 40,000 m3 of sand from the Kunigiškiai sand quarry (d = 0.37 mm, So = 2.17) and sand 534,648 m3 of dredged from the Baltic Sea bottom (d = 0.33–0.38 mm, So = 1.67–1.82) between 2006 and 2018. It is important to note that 9000 m3 of sediment dredged from the Šventoji River entrance channel and stored on the shore in 2012 was used for foredune recultivation in Palanga in 2018.
The clustering of data points in the mean grain size versus sorting plot (
Figure 7a) indicates that smaller coastal structures, such as the Šventoji port jetty and Būtingė groyne, exert a limited influence on natural alongshore and cross-shore sediment transport. In contrast,
Figure 7 illustrates that the larger jetties at the Klaipėda and Šventoji ports significantly alter both wave regimes and sediment movement. Significant alterations in the wave regime on the updrift side of the jetties are reflected in the coarser and moderately to moderately well-sorted sediments. The mean grain size versus sorting plot further demonstrates that the scale of coastal engineering structures plays an important role in controlling the hydrodynamic regime, with larger structures such as breakwaters and jetties clearly influencing sediment grain size in beach and foredune environments, while smaller structures such as groynes may have little or no observable effect on sediment distribution. These variations in sand grain size distribution are well illustrated by the ratio of fine-to-medium-grained sand (
Figure 7b), which reflects the dominant sedimentary processes operating along the coast. When erosion prevails, the proportion of medium sand increases while the amount of fine sand decreases; conversely, under depositional conditions, the ratio shifts in favor of finer sediments.
The influence of hard engineering structures on sediment grain size distribution is confined to a narrow coastal stretch, approximately 1 km north and 4 km south of the structures. Although sediment grain size distributions show similar tendencies in 1993, 2014, and 2018, anthropogenic activities, such as entrance channel dredging in the Šventoji River, and the effects of the 2011 storm significantly altered the situation that year. In 2011, both the beach and foredune slope exhibited marked changes in grain size distribution along the studied coastal stretches (
Figure 5 and
Figure 6).
In addition to dredging, other anthropogenic interventions, such as shore nourishment, result in alterations of sediment textures (
Figure 6). For instance, to mitigate foredune erosion at the distal end of the Curonian Spit, 3000 m
3 of borrowed sand (
d = 0.21 mm,
So = 1.35) were deposited in December 2013. The placement of sand at the foredune toe temporarily increased the amount of medium and coarse-grained sand on the beach and foredune in 2014 and 2018 in the vicinity of the southern jetty of Klaipėda port. It is worth noting that the long-term effects of nearshore nourishment on grain size and texture in the vicinity of Klaipėda harbor’s hydrotechnical structures have not been clearly identified.
Furthermore, the nearshore nourishment project in Melnragė–Giruliai, located 2.5–5 km north of the Klaipėda port’s northern jetty, began on 27 February 2001. According to data from Klaipėda State Sea Port, a total of 1,162,345 m
3 of sand (
d = 0.18 mm,
So = 1.30) was deposited between 2001 and 2018. The nourishment was not carried out periodically; specifically, during the periods 2001–2004, 2005–2010, 2010–2014, and 2014–2018, 537,282 m
3, 306,958 m
3, 80,325 m
3, and 237,780 m
3 of sand were deposited, respectively. Sediment discharged offshore is sorted by hydrodynamic processes, ensuring that the texture of sediment deposited onshore does not differ significantly from that of natural beach sediments [
26].
5. Discussion
The present study provides comprehensive evidence that the distribution of beach and foredune sediment grain size along the Lithuanian Baltic Sea coast in the vicinity of hard engineering structures is influenced by a complex interplay of the geological framework, hydrodynamic forcing, and anthropogenic interventions. Our results show that, overall, beach surface sediments in the Šventoji port impact zone largely retain their original characteristics, whereas in the Klaipėda port impact zone, beach surface sediments tend to become slightly finer. However, the opposite trend is found on the foredune slope, with sand becoming finer in the Šventoji port impact zone and coarser in the Klaipėda port impact zone. In downdrift zones, finer sand typically only appears after very strong storm events, when the foredune composed of finer sand is eroded and the sand is deposited on the beach [
24,
36]. In our case, finer sediments may also be introduced because of human interference, such as replenishing the nearshore area with additional fine sediments [
32]. These findings are partly consistent with earlier observations [
32], which documented similar grain size differentiation along the southeastern Baltic coast [
13]. However, it should be noted that in previous studies, sediment coarsening in the downdrift zone has been associated with interruptions to longitudinal sediment transport [
6], the intensification of erosion, and the offshore removal of finer particles [
17,
46].
The permanent sediment coarsening observed in the Klaipėda downdrift zone between 1 and 4 km (
Figure 5) is associated with changes in the hydrodynamic regime after port jetties reconstruction, especially wave parameters [
10,
15], which cause shoreline retreat and nearshore erosion [
32]. Coastal erosion processes expose older sediment strata containing coarser sand, which are then reworked and incorporated into the active coastal sediment system (
Figure 2).
Sediment fining in the updrift zone is primarily the result of alongshore sediment transport, since finer sand particles are more mobile and can be transported over greater distances [
14,
47,
48]. However, it is important to note that even during severe storms, sediments in the updrift zone do not become coarser, or if they do, it occurs only episodically and for a very short period of time [
36], as the deeper sediment strata contain only small amounts of coarser sand or pebbles [
30,
33]. We assume that sediment texture variation trends are more strongly influenced by the geological framework, which is consistent with earlier studies emphasizing the role of geological setting in shaping beach sediments [
2,
23].
Beach nourishment and storm events contribute to increased alongshore heterogeneity of sediments. However, the effects of storms are typically short-term [
21,
23], lasting from a few months to a few years, whereas the impacts of beach nourishment are longer term, persisting for several years to decades. These findings align with previous studies [
25], indicating that nourished sand is less readily entrained by eolian processes, thereby persisting longer on the beach post-nourishment. Based on our research, storm events caused rapid but temporary coarsening of sediments through erosion and exposure of subsurface strata in downdrift zones, while nourishment, depending on the composition of the deposited sand, produced more persistent textural changes, especially in the vicinity of port hydrotechnical structures. The persistence of nourished material, even years after placement, highlights its stronger and longer-lasting influence on sediment texture compared with episodic storm-driven changes. However, the impact of nourishment largely depends on the grain size and volume of the nourished sediment, as well as the type and frequency of the intervention.
In comparison, hard engineering structures may influence sediment dynamics over timescales of up to a hundred years [
32,
43], while the geological framework exerts control over millennial scales [
22,
46]. Recognizing the distinct temporal scales of sedimentary change helps guide coastal management by aligning short-term responses with long-term planning goals.
The first limitation of our study is the lack of high-frequency temporal sediment sampling, which may obscure short-term sedimentary fluctuations driven by extreme storm events or by the modification or degradation of hard engineering structures. A second limitation concerns the spatial resolution of sediment sampling, which does not allow for a detailed assessment of the effects of smaller-scale hard structures on sediment texture.
Since traditional surface sediment sampling and laboratory methods require considerable labor and financial resources, the application of new surface sediment detection methods using unmanned aerial vehicle (UAV) datasets, combined with machine learning models [
49], could enable more frequent and timely investigations.
6. Conclusions
The direct impact of hydrotechnical engineering structures is highly localized, typically affecting only a 1 to 2 km stretch in the downdrift zone and 4 to 5 km in the updrift zone. While hard structures such as port infrastructure do not directly control the texture of coastal sediments, their design, size, and function can induce localized changes in hydrodynamic conditions, including current patterns, wave parameters, and local sea level. These alterations influence both alongshore and cross-shore sediment transport, leading to changes in sediment texture and coastal morphology.
Disruptions in sediment transport pathways result in spatial variations in coastal dynamics, with sediment accumulation generally occurring on the updrift side and erosion prevailing on the downdrift side. As a result, coarser sediments are often found in downdrift zones, where finer fractions have been removed or bypassed. In the short term, sediment texture may also fluctuate because of extreme events, which drive dynamic responses within the coastal system. Over longer timescales, however, sediment texture is more strongly governed by the underlying geological framework, which defines the composition and availability of sediments along the coast. This contrast emphasizes that the geological framework exerts a stable, long-term influence on sediment texture, whereas short-term fluctuations are primarily driven by storm events.
This study also demonstrates that sediment texture in areas influenced by hydrotechnical structures undergoes significant alteration following beach or nearshore nourishment. These anthropogenic interventions affect not only the nourishment site itself but also adjacent downdrift areas, where changes in sediment texture can extend beyond the immediate zone of intervention. The method of nourishment, whether applied directly on the beach or in the nearshore zone, plays a critical role in determining both the extent of textural alteration and the timescale of recovery toward the natural sediment state. In some cases, recovery may be minimal or delayed for several years or even decades.
Storm-driven changes in sediment texture tend to be short-lived, often returning to pre-disturbance conditions within a few months to years. However, nourishment-induced alterations, especially those involving coarser or poorly sorted material, can persist for 5 to 20 years or longer, depending on the local hydrodynamic regime and sediment transport dynamics.
To mitigate the unintended impact on shore development and native sediment texture, nearshore placement of sediment that closely matches the native grain size should be prioritized in nourishment efforts. These efforts should be implemented with consideration of the prevailing transport directions. Additionally, a buffer zone of at least 1–2 km both downdrift and updrift should be incorporated into the planning and environmental impact assessments for future port expansions or coastal engineering projects to account for the spatial extent of sediment redistribution and hydrodynamic alteration. These insights are critical for informing future coastal engineering strategies that balance shore protection with sediment texture integrity.
Author Contributions
Conceptualization, D.P. and A.D.; methodology and fieldworks, D.P., D.K., D.J. and G.Ž.; software, D.P., A.D. and D.K.; validation, D.P., A.D., D.J., G.Ž. and D.K.; formal analysis, D.P., A.D. and D.K.; writing—original draft preparation, D.P., A.D. and D.K.; writing—review and editing, D.P., A.D., D.J., G.Ž. and D.K.; visualization, D.P., A.D. and D.K.; supervision, D.P.; project administration, D.P.; funding acquisition, D.P., D.J. and G.Ž.; All authors have read and agreed to the published version of the manuscript.
Funding
This research received no external funding.
Data Availability Statement
The data presented in this study are available on request from the corresponding author (the data are not publicly available due to privacy).
Conflicts of Interest
The authors declare no conflicts of interest.
Abbreviations
The following abbreviations are used in this manuscript:
| DSAS | Digital Shoreline Analysis System |
| LRR | Linear Regression Rate method |
References
- Wright, L.D.; Short, A.D. Morphodynamics Variability of Surf Zones and Beaches: A Synthesis. Mar. Geol. 1984, 56, 93–118. [Google Scholar] [CrossRef]
- Thieler, E.R.; Foster, D.S.; Himmelstoss, E.A.; Mallinson, D.J. Geologic framework of the northern North Carolina, USA inner continental shelf and its influence on coastal evolution. Mar. Geol. 2014, 348, 113–130. [Google Scholar] [CrossRef]
- Hesp, P.A.; Smyth, T.A.G. Surfzone-Beach-Dune interactions: Review; and flow and sediment transport across the intertidal beach and backshore. J. Coast. Res. 2016, SI75, 8–12. [Google Scholar] [CrossRef]
- Short, A.D.; Hesp, P.A. Wave, beach and dune interactions in southeastern Australia. Mar. Geol. 1982, 48, 259–284. [Google Scholar] [CrossRef]
- Cohn, N.; Ruggiero, P.; de Vries, S.; Kaminsky, G.M. New Insights on Coastal Foredune Growth: The Relative Contributions of Marine and Aeolian Processes. Geophys. Res. Lett. 2018, 45, 4965–4973. [Google Scholar] [CrossRef]
- Komar, P.D. Beach Processes and Sedimentation, 2nd ed.; Prentice Hall: Englewood Cliffs, NJ, USA, 1998; 544p. [Google Scholar]
- Kriaučiūnienė, J.; Žilinskas, G.; Pupienis, D.; Jarmalavičius, D.; Gailiušis, B. Impact of Šventoji port jetties on coastal dynamics of the Baltic Sea. J. Environ. Eng. Landscape Manag. 2013, 21, 114–122. [Google Scholar] [CrossRef]
- Davis, R.A.; Fitzgerald, D.M. Beaches and Coasts; Blackwell: Malden, MA, USA, 2004; 419p. [Google Scholar]
- Tönisson, H.; Mannikus, R.; Kont, A.; Palginomm, V.; Alari, V.; Suuroja, S.; Vaasma, T.; Vilumaa, K. Application of Shore Sediments Accumulated in Navigation Channel for Restoration of Sandy Beaches around Parnu City, SW Estonia, Baltic Sea. J. Mar. Sci. Eng. 2024, 12, 394. [Google Scholar] [CrossRef]
- Nordstrom, K.F. Downdrift coarsening of beach foreshore sediments at tidal inlets: An example from the coast of New Jersey. Earth Surf. Process. Landf. 1989, 14, 691–701. [Google Scholar] [CrossRef]
- Hesp, P.A. Surfzone, beach and foredune interactions on the Australian southeast coast. J. Coast. Res. 1988, SI3, 15–25. Available online: http://www.jstor.org/stable/40928722 (accessed on 15 May 2025).
- Frihy, O.E.; Komar, P.D. Patterns of Beach-Sand Sorting and Shoreline Erosion on the Nile Delta. J. Sediment. Res. 1991, 61, 544–550. [Google Scholar] [CrossRef]
- Žilinskas, G.; Jarmalavičius, D.; Pupienis, D. The influence of natural and anthropogenic factors on grain size distribution along the southeastern Baltic spits. Geol. Q. 2018, 62, 375–384. [Google Scholar] [CrossRef]
- Hallin, C.; Almström, B.; Larson, M.; Hanson, H. Longshore transport variability of beach face grain size: Implications for dune evolution. J. Coast. Res. 2019, 35, 751–764. [Google Scholar] [CrossRef]
- Gallagher, E.L.; MacMahan, J.; Reniers, A.J.H.M.; Brown, J.; Thornton, E.B. Grain size variability on a rip-channeled beach. Mar. Geol. 2011, 287, 43–53. [Google Scholar] [CrossRef]
- Dean, R.G. Equilibrium beach profiles: Characteristics and applications. J. Coast. Res. 1990, 7, 53–84. Available online: https://www.jstor.org/stable/4297805 (accessed on 15 May 2025).
- Gallagher, E.; Wadman, H.; McNinch, J.; Reniers, A.; Koktas, M. A conceptual model for spatial grain size variability on the surface of and within beaches. J. Mar. Sci. Eng. 2016, 4, 38. [Google Scholar] [CrossRef]
- Blatt, H.; Middleton, G.; Murray, R. Origin of Sedimentary Rocks, 2nd ed.; Prentice–Hall Inc.: Englewood Cliffs, NJ, USA, 1980; 782p. [Google Scholar]
- Bujan, N.; Cox, R.; Masselink, G. From fine sand to boulders: Examining the relationship between beach-face slope and sediment size. Mar. Geol. 2019, 417, 106012. [Google Scholar] [CrossRef]
- Martewicz, J.; Kalińska, E.; Weckwerth, P. What hides in the beach sand? A multiproxy approach and new textural code to recognition of beach evolution on the southern and eastern Baltic Sea coast. Sediment. Geol. 2022, 435, 106154. [Google Scholar] [CrossRef]
- Abuodha, J.O.Z. Grain size distribution and composition of modern dune and beach sediments, Malindi Bay coast, Kenya. J. Afr. Earth Sci. 2003, 36, 41–54. [Google Scholar] [CrossRef]
- Browder, A.G.; McNinch, J.E. Linking framework geology and nearshore morphology: Correlation of paleo-channels with shore-oblique sandbars and gravel outcrops. Mar. Geol. 2006, 231, 141–162. [Google Scholar] [CrossRef]
- Jarmalavičius, D.; Žilinskas, G.; Pupienis, D. Geologic framework as a factor controlling coastal morphometry and dynamics. Curonian Spit, Lithuania. Int. J. Sediment Res. 2017, 32, 597–603. [Google Scholar] [CrossRef]
- Riggs, S.R.; Cleary, W.J.; Snyder, S.W. Influence of inherited geologic framework on barrier shoreface morphology and dynamics. Mar. Geol. 1995, 126, 213–234. [Google Scholar] [CrossRef]
- van der Wal, D. The impact of the grain-size distribution of nourishment sand on aeolian sand transport. J. Coast. Res. 1998, 14, 620–631. Available online: https://www.jstor.org/stable/4298816 (accessed on 15 May 2025).
- Guillén, J.; Hoekstra, P. Sediment distribution in the nearshore zone: Grain size evolution in response to shoreface nourishment (Island of Terschelling, The Netherlands). Estuar. Coast. Shelf Sci. 1997, 45, 639–652. [Google Scholar] [CrossRef]
- Knaps, R.J. Sediment transport near the coasts of the Eastern Baltic. In Development of Sea Shores Under the Conditions of Oscillations of the Earth’s Crust, Valgus, Tallinn; 1965; pp. 21–29. Available online: https://www.geokniga.org/books/13623 (accessed on 15 May 2025). (In Russian)
- Žaromskis, R.; Gulbinskas, S. Main patterns of coastal zone dvelopment of the Curonian Spit. Lithuania. Baltica 2010, 23, 149–156. [Google Scholar]
- Žaromskis, R.; Gulbinskas, S. Characteristics of Sand Transport Migration on the Mainland Coast of the Lithuanian Baltic Sea. In Proceedings of the 5th Scientific–Practical Conference “Marine and Coastal Research—2011”, Proceedings, Palanga, Lithuania, 13–15 April 2011; Klaipėda University: Klaipėda, Lithuania, 2011; pp. 272–277. (In Lithuanian). [Google Scholar]
- Bitinas, A.; Aleksa, P.; Damušytė, A.; Gulbinskas, S.; Jarmalavičius, D.; Kuzavinis, M.; Minkevičius, V.; Pupienis, D.; Trimonis, E.; Šečkus, R.; et al. Geological Atlas of Lithuanian Coast of the Baltic Sea; Lithuanian Geological Survey under Ministry of Environment: Vilnius, Lithuania, 2004; 94p. (In Lithuania) [Google Scholar]
- Galvonaitė, A.; Kilpys, J.; Kitrienė, Z.; Valiukas, D. Mean Climatic Indicators in Lithuania for the Period 1981–2010; Climatology Division, Lithuanian Hydrometeorological Service under the Ministry of Environment: Vilnius, Lithuania, 2013; p. 24. [Google Scholar]
- Žilinskas, G.; Janušaitė, R.; Jarmalavičius, D.; Jukna, L.; Pupienis, D. Possibilities for Mitigating Coastal Erosion in the Downdrift Zone of Port Jetties Using Nearshore Nourishment: A Case Study of Klaipėda Port, Lithuania. J. Mar. Sci. Eng. 2025, 13, 628. [Google Scholar] [CrossRef]
- Damušytė, A. Post-Glacial Geological History of the Lithuanian Coastal Area. Doctoral Dissertation, Vilnius University, Vilnius, Lithuania, 2011; 84p. [Google Scholar]
- Jaagus, J.; Suursaar, Ü. Long-term storminess and sea level variations on the Estonian coast of the Baltic Sea inrelation to large-scale atmospheric circulation. Est. J. Earth Sci. 2013, 62, 73–92. [Google Scholar] [CrossRef]
- Parliament of the Republic of Lithuania. Law on the Classification of Emergency and Disaster Events (No. XI-2226). 2010. Available online: https://e-seimas.lrs.lt/portal/legalAct/lt/TAD/9cbe44a09ae811ef955ff95815eb5ce5?jfwid=inojht4gh (accessed on 12 July 2025).
- Himmelstoss, E.A.; Henderson, R.E.; Farris, A.S.; Kratzmann, M.G.; Bartlett, M.K.; Ergul, A.; McAndrews, J.; Cibaj, R.; Zichichi, J.L.; Thieler, E.R. Digital Shoreline Analysis System Version 6.0; U.S. Geological Survey Software Release; U.S. Geological Survey: Reston, VA, USA, 2024. [Google Scholar] [CrossRef]
- Bagdanavičiūtė, I.; Kelpšaitė, L.; Daunys, D. Assessment of shoreline changes along the Lithuanian Baltic Sea coast during the period 1947–2010. Baltica 2012, 25, 171–184. [Google Scholar] [CrossRef]
- Blott, S.J.; Pye, K. Gradistat: A Grain Size Distribution and Statistics Package for the Analysis of Unconsolidated Sediments. Earth Surf. Process. Landf. 2001, 26, 1237–1248. [Google Scholar] [CrossRef]
- Jarmalavičius, D.; Žilinskas, G.; Pupienis, D.; Janušaitė, R. Resilience of beach morphometric characteristics on decadal time scale: A case study from the Lithuanian Baltic Sea. Oceanologia 2025, in press. [Google Scholar] [CrossRef]
- Wentworth, C.K. A scale of grade and class terms for clastic sediments. J. Geol. 1922, 30, 377–392. [Google Scholar] [CrossRef]
- Trask, P.D. Origin and environment of source sediments of petroleum. Geol. Soc. Am. Bull. 1932, 43, 925–936. [Google Scholar] [CrossRef]
- Eisma, D. Composition, origin and distribution of Dutch coastal sands between Hoek van Holland and the island of Vlieland. Neth. J. Sea Res. 1968, 4, 123–150. [Google Scholar] [CrossRef]
- Huisman, B.J.A.; De Schipper, M.A.; Ruessink, B.G. Sediment sorting at the Sand Motor at storm and annual time scales. Mar. Geol. 2016, 381, 209–226. [Google Scholar] [CrossRef]
- Van der Molen, J. The influence of tides, wind and waves on the net sand transport in the North Sea. Cont. Shelf Res. 2002, 22, 2739–2762. [Google Scholar] [CrossRef]
- Karlonienė, D.; Pupienis, D.; Jarmalavičius, D.; Dubikaltinienė, A.; Žilinskas, G. The Impact of Coastal Geodynamic Processes on the Distribution of Trace Metal Content in Sandy Beach Sediments, South-Eastern Baltic Sea Coast (Lithuania). Appl. Sci. 2021, 11, 1106. [Google Scholar] [CrossRef]
- McCave, I.N. Grain-size trends and transport along beaches: Example from eastern England. Mar. Geol. 1978, 28, M43–M51. [Google Scholar] [CrossRef]
- McLaren, P.A.; Bowles, D. The effects of sediment transport on grain-size distributions. J. Sediment. Petrol. 1985, 55, 457–470. [Google Scholar] [CrossRef]
- Poizot, E.; Anfuso, G.; Méar, Y.; Bellido, C. Confirmation of beach accretion by grain-size trend analysis: Camposoto beach, Cádiz, SW Spain. Geo-Mar. Lett. 2013, 33, 263–272. [Google Scholar] [CrossRef]
- Zhang, Y.; Chen, Q.; Zong, Y.; He, F.; Tan, K.; Li, W.; Wang, Y.P.; Jia, J. Using machine learning to analyse coastal sediment characteristics from unmanned aerial vehicle data: A case study of the Dasha sandy beach, China. Sedimentology 2025. [Google Scholar] [CrossRef]
| Disclaimer/Publisher’s Note: The statements, opinions and data contained in all publications are solely those of the individual author(s) and contributor(s) and not of MDPI and/or the editor(s). MDPI and/or the editor(s) disclaim responsibility for any injury to people or property resulting from any ideas, methods, instructions or products referred to in the content. |
© 2025 by the authors. Licensee MDPI, Basel, Switzerland. This article is an open access article distributed under the terms and conditions of the Creative Commons Attribution (CC BY) license (https://creativecommons.org/licenses/by/4.0/).


 ,
, 

