Article

Experimental Study on Mechanical Integrity of Cement and EICP-Solidified Soil for Scour Protection of Pile Foundations

1
China Road & Bridge Corporation, Beijing 100011, China
2
College of Civil Engineering and Architecture, Wenzhou University, Wenzhou 325006, China
3
Zhejiang Engineering Research Center of Disaster Prevention and Mitigation for Coastal Soft Soil Foundation, Wenzhou 325035, China
4
School of Civil Engineering, Southeast University, Nanjing 211189, China
5
Advanced Ocean Institute of Southeast University, Southeast University, Nantong 226010, China
*
Authors to whom correspondence should be addressed.
J. Mar. Sci. Eng. 2025, 13(7), 1323; https://doi.org/10.3390/jmse13071323
Submission received: 4 June 2025 / Revised: 2 July 2025 / Accepted: 7 July 2025 / Published: 10 July 2025
(This article belongs to the Section Ocean Engineering)

Abstract

Among the scour protection measures for pile foundations, the use of solidified mud has demonstrated effective protection against scour. However, research on the mechanical integrity of this protective measure is relatively scarce. Therefore, a series of experiments were performed on cement-solidified soil and Enzyme-Induced Carbonate Precipitation (ECIP) solidified soil to analyze fluidity, disintegration, and unconfined compressive strength, along with an analysis of influencing parameters. Test results show the following: for cement-solidified soil, fluidity decreases with higher cement content, while its disintegration rate decreases with more cement and its unconfined compressive strength increases with a longer curing time and higher cement content. For ECIP-solidified soil, fluidity decreases with higher soy powder concentration but increases with higher binder solution concentration. ECIP’s initial disintegration rate increases with binder concentration, but after 7 days curing, its disintegration rate decreases with both higher binder concentration and higher soy powder concentration. ECIP’s strength increases with higher soy powder concentration. Crucially, both types of solidified soil exhibit decreased unconfined compressive strength with higher initial water content. The research results can provide a reference for the construction of solidified soil in the field of scour protection.

1. Introduction

Pile foundations are widely used in bridges, ports, and offshore wind turbines [1,2], but they are often subjected to scour-related challenges [3,4,5]. Scour protection measures are categorized into active and passive types. Active protection measures aim to alter flow characteristics, reduce flow volume, or change flow direction, thereby mitigating the scouring effects of downflow and horseshoe vortices around foundations. Passive protection involves placing a protective layer around the foundation to increase resistance to fluid shear forces, preventing the erosion of underlying erodible sediments. Silt solidified soil technology is an emerging scour countermeasure. It involves mixing additives, binders, and soil with water to form a composite soil mass that possesses fluidity during placement and achieves specific strength and erosion resistance after solidification.
Cement-solidified soil is a construction material formed by mixing cement, soil, and water, which hardens through chemical reactions. It is commonly used in foundation reinforcement, road construction, soil stabilization, and erosion control. Its primary characteristics are enhancing the soil’s bearing capacity and stability, by improving its engineering properties. With increasingly diverse engineering demands and complex environmental conditions, research on the rheological and strength properties of cement-solidified soil has become more crucial. Strength is a key engineering property of cement-solidified soil, encompassing compressive strength, shear strength, and elastic modulus. These strength characteristics directly affect the bearing capacity and service life of the solidified soil mass. Horpibulsuk et al. [6] discussed laboratory and field strength development in cement-stabilized coarse-grained and low-plasticity soils, developed a strength prediction model, and proposed road rehabilitation techniques. Abu-Farsakh et al. [7] investigated the effectiveness of cement stabilization for loose foundation soil under cyclic loading. Through laboratory tests, the study examined the influence of different cement contents on the soil’s elastic modulus and permanent deformation. Ifediniru et al. [8] further investigated the stabilization of soft subgrades with varying cement contents, highlighting how safety factors change with different treatment depths and embankment heights using the limit equilibrium method. Ardah et al. [9] evaluated the effectiveness of different mixtures of cement and lime powder for treating soft foundation soil, focusing on their elastic modulus and permanent deformation characteristics under cyclic loading. Laboratory tests revealed correlations between the water–cement ratio and both elastic modulus and deformation. Pongsivasathit et al. [10] studied the mechanical properties of cement-stabilized materials through extensive laboratory testing. The results showed that the 28-day compressive strength, flexural strength, and modulus all increased with higher cement content. Wei et al. [11] experimentally explored the effects of water content and cement content on the unconfined compressive strength of cement-stabilized sand. Wang et al. [12] investigated the effectiveness of using solidified soil as scour protection for offshore wind turbine foundations, evaluating its anti-scour performance via Simplified Scour Resistance Testing (SSRT) and unconfined compressive strength testing. The study found that solidified soil can effectively enhance scour resistance, with a power function relationship existing between strength and scour protection performance. Ouyang et al. [13] focused on local and edge scour around monopile foundations under combined wave–current action with cement-improved soil as a reinforcement measure. Ouyang et al. [14] further investigated the responses of semi-rigid piles in clay under multistage loading and unidirectional cyclic loading before and after cement-soil reinforcement.
Enzyme-Induced Carbonate Precipitation (EICP) solidified soil is a method that utilizes biotechnology to enhance soil strength and stability. This technique catalyzes the precipitation of calcium carbonate (CaCO3) within the soil via microbial or enzymatic induction, thereby improving the soil’s engineering properties. In the EICP process, a solution containing enzymes (such as urease) and urea is typically injected into the soil. These enzymes catalyze the hydrolysis of urea into carbonate and ammonia; the carbonate then reacts with calcium ions in the soil to form calcium carbonate precipitates. These CaCO3 crystals form bridges between soil particles, increasing the soil’s shear strength and reducing its permeability. Zahri et al. [15] provided a comprehensive review of both traditional and non-traditional chemical stabilizers for soft soils, focusing on their mechanisms, advantages, and limitations. Almajed et al. [16] studied the application of EICP technology in different natural sandy soils, comparing its effectiveness with traditional cement and lime stabilization techniques and exploring the potential of EICP to reduce cement consumption. Lee et al. [17] experimentally investigated the feasibility of using soybean-derived urease for EICP soil stabilization, comparing the differences in carbonate precipitation efficiency and soil enhancement between EICP and Microbial-Induced Carbonate Precipitation (MICP). Almajed et al. [18] reviewed the applications and challenges of MICP and EICP technologies in soil stabilization and environmental fields, discussing their advantages, disadvantages, and mechanisms for improving soil mechanical and environmental properties. Saif et al. [19] provided an updated review of EICP technology, emphasizing its potential for field application to practical problems. Compared to conventional cement-based stabilization, enzyme-induced carbonate precipitation (EICP) demonstrates the following key advantages: (1) reduced environmental footprint; (2) operational efficiency and adaptability.
To support sustainable infrastructure development, this study promotes the use of low-carbon materials in geotechnical engineering, which aligns with national policies in China. Although China has made notable progress in reducing carbon intensity, cement and other high-emission materials remain dominant, posing ongoing challenges for ecological protection and emission reduction. While laboratory strength testing of solidified soil is relatively abundant, research on its fluidity is comparatively scarce. Studying flow properties is crucial for understanding the behavior and stability of cement-solidified soil under load and environmental influences. The flow properties of cement-solidified soil are affected by numerous factors, such as cement type, mix ratio, curing conditions, and soil type. Furthermore, in actual construction, solidified soil is typically placed via pumping, which is directly related to its fluidity and permeability. The cementation solution concentration significantly impacts fluidity, posing greater challenges for achieving optimal mix design. Additionally, when pumped the solidified soil around the piles, the solidified soil exits in a fluid state before fully setting and is highly susceptible to being washed away by wave and currents. This imposes more stringent requirements on its underwater anti-scour resistance (dispersibility) [20,21]. Existing research has not adequately considered the construction methods for silt solidified soil, where processes like pumping, hydraulic filling, and underwater placement impose higher demands on fluidity, anti-scour resistance, strength. Therefore, it is necessary to conduct research specifically targeting these three key characteristics (fluidity, disintegration characteristic, strength) of solidified soil.

2. Materials and Methods

To investigate the fluidity, disintegration and strength characteristics of cement-solidified soil and EICP-solidified soil, fluidity tests, disintegration tests, and unconfined compressive strength tests were designed for both cement- and EICP-solidified soils.

2.1. Experimental Soil

The experimental soil was sampled from silty clay in the Qinhuai River, Nanjing City, Jiangsu Province, China. The Qinhuai River silty clay was selected as the test material due to its widespread occurrence in riverbed foundations in the Nanjing area. According to the Jiangsu Provincial Geological Archives, this soil has a high silt content, low natural density, and weak particle cohesion, making it highly susceptible to erosion under fluctuating flow conditions. According to the Chinese code [22], laboratory geotechnical tests were conducted on oven-dried and sieved soil samples. The soil properties are presented in Table 1, and its particle size distribution curve is shown in Figure 1.
The experimental soil was mixed with cement and a high-urease solution, respectively, to prepare cement-solidified soil and EICP-solidified soil specimens for subsequent fluidity, disintegration, and unconfined compressive strength tests.
It should be noted that to ensure the consistency and reliability of EICP performance across different batches of soybean powder, the enzymatic activity of the extracted urease solution was quantitatively evaluated prior to use. The measurement followed the conductivity-based method proposed by Whiffin et al. [23], which establishes a linear relationship between the rate of urea hydrolysis and the increase in solution conductivity. Specifically, 5 mL of urease extract—prepared from a 100 g/L soybean powder solution—was added to 45 mL of 1.11 mol/L urea solution and kept at 25 °C under static conditions. The solution conductivity was recorded at one-minute intervals over a 5 min period using a calibrated conductivity probe. The average rate of conductivity change (in mS/cm·min) was then computed. Based on Whiffin’s calibration, an increase of 1 mS/cm corresponds to approximately 11 mM of urea hydrolyzed. The enzymatic activity was therefore calculated by multiplying the average conductivity increase by 11 and then adjusting for the dilution factor (×10), yielding the final activity in mM urea hydrolyzed per minute. This standardized procedure was consistently applied to all soybean powder batches to ensure controlled enzymatic performance throughout the experiments.

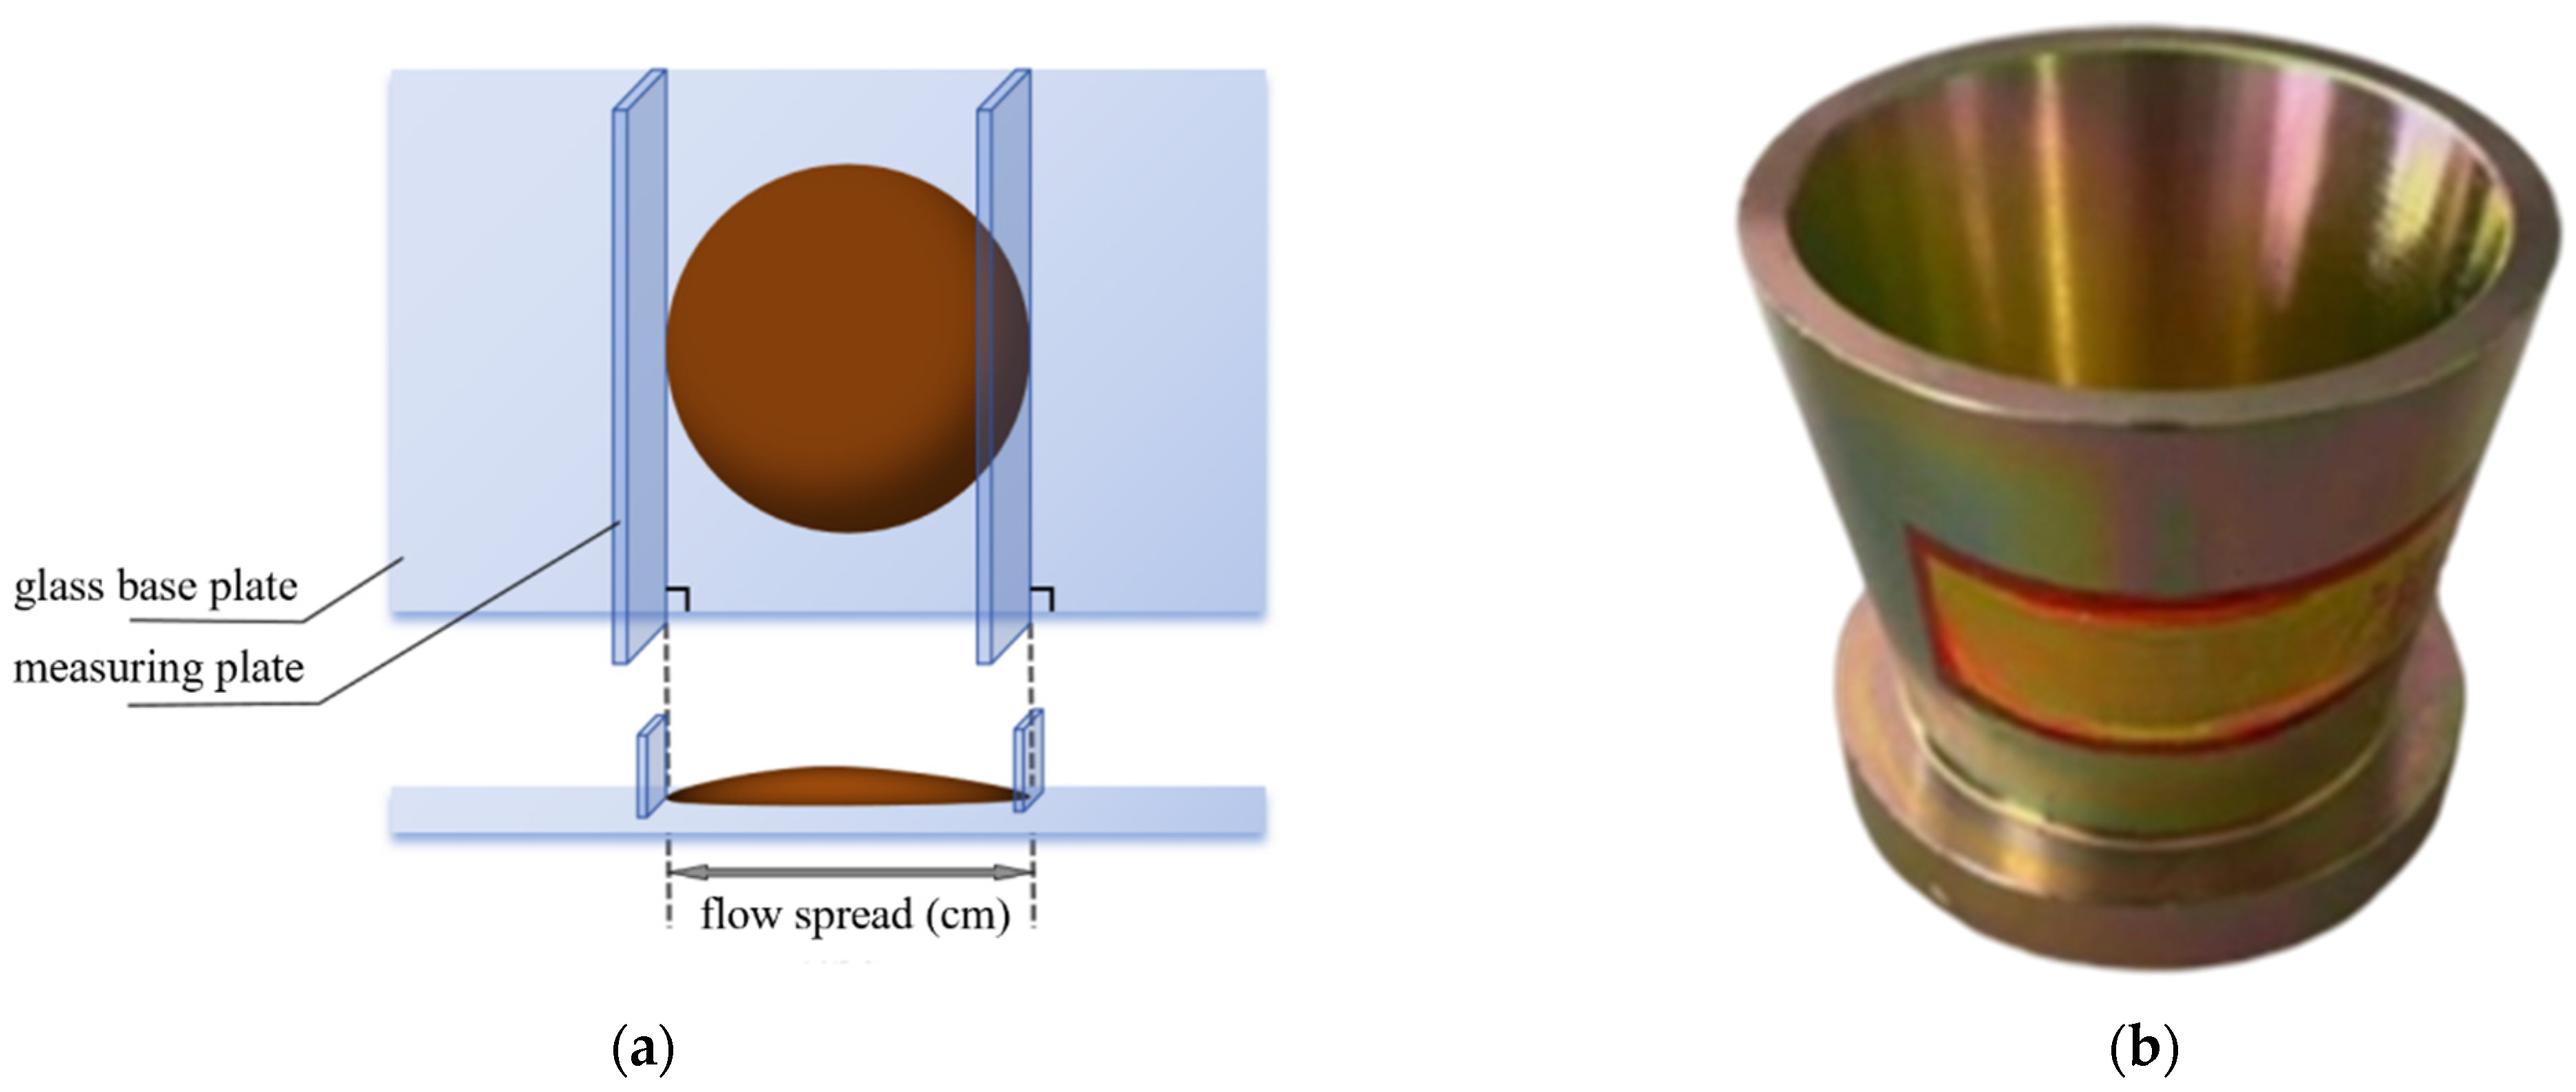
2.2. Fluidity Test Setup of Cement and ECIP-Solidified Soil

The fluidity of solidified soil significantly impacts actual construction processes. Fluidity can be characterized by multiple metrics. For instance, concrete typically employs the slump test to evaluate fluidity; self-compacting concrete, due to its high fluidity, generally uses the horizontal spread diameter [24]; cement mortar fluidity is assessed via the flow table test [25]. Given that the experimental silt particles are ≤2 mm and cement particles are similarly fine, the truncated conical mold apparatus (base diameter: 60 mm, top diameter: 36 mm, height: 60 mm) for cement-solidified soil testing was adopted to measure its fluidity. As shown in Figure 2, flow spread (i.e., the maximum diameter of the paste after being poured into the mold, demolded, and allowed to flow freely on a horizontal glass plate) serves as the fluidity indicator.
To investigate the fluidity of cement-solidified soil with varying mix proportions, an experimental matrix design was implemented, as follows: 1. fixed cement dosage: the effect of different initial water contents on fluidity was examined; 2. fixed water content: the impact of varying cement dosages on fluidity was examined.
For EICP-solidified soil, the following process was implemented: 1. fixed cementation solution concentration: at different initial water contents, the effect of varying soybean powder concentrations was tested; 2. fixed soybean powder concentration: at different initial water contents, the influence of varying cementation solution concentrations was analyzed. The complete test setup is summarized in Table 2.

2.3. Disintegration Test Setup of Cement and ECIP-Solidified Soil

Disintegration tests were conducted on soil specimens following the Chinese code [26]. These tests evaluated the improvement effects of different cement formulations and EICP technology on soil. Additionally, the disintegration characteristics of solidified soil samples were assessed at two critical stages: 1. a fresh state (immediately after mixing); and 2. a cured state (after completion of curing). The test matrix is provided in Table 3. The curing method adopted in this study was established with reference to the findings reported by Zhao et al. [27], which systematically investigated the influence of environmental factors on the performance of EICP-treated soils. The study concluded that urease-induced carbonate precipitation imparts strong resistance to variations in ambient humidity and temperature, thereby ensuring favorable water and thermal stability of the solidified specimens. Based on these findings, all samples in this work were subjected to an air-drying process at a controlled room temperature of 20 °C. This standardized curing condition was maintained throughout the experimental program to ensure consistency.
For the quantitative assessment of disintegration characteristics at different curing stages, mass loss rates (Rv for fresh state, Rm for 7-day-cured) were introduced. The fresh-state test procedure was as follows: a pre-wetted aluminum container was filled with freshly mixed solidified soil, leveled using a steel straightedge, and weighed (ma) on a precision electronic scale; the container was then immersed in 300 mL distilled water for 10 min, during which soil particles and binders underwent suspension and sedimentation; after removal and drainage, the container was reweighed (mb); Rv was subsequently calculated using Equation (1), incorporating measured soil density (ρs) and container volume (VAl), as illustrated in Figure 3.
R v = m a m b ( ρ s ρ w ) V Al
In the equation, the following values hold: Rv, mass loss rate (%) of fresh-state solidified soil; ma, total mass of aluminum container with solidified soil before immersion (g); mb, total mass of aluminum container with solidified soil after immersion (g); ρs, density of solidified soil under different mix proportions (g/cm3); ρw, density of water (g/cm3); VAl, volume of container (cm3).
The mass loss rate (Rm) for 7-day-cured solidified soil specimens was determined as follows: a dried aluminum container holding the specimen was weighed (ma) on a precision electronic scale; after immersion in 300 mL distilled water for 10 min, the container was oven-dried at 105 °C for 2 h and reweighed (mb); Rm was then calculated using Equation (2).
R m = m a m b m a
In the equation, Rm is the mass loss rate (%) of 7-day-cured solidified soil specimens; ma is the mass of the aluminum container with the cured specimen before immersion (g); mb is the post-immersion dried mass of the container with the cured specimen (g).

2.4. Unconfined Compression Strength Test Setup of Cement and ECIP-Solidified Soil

Solidified soil must achieve sufficient strength after curing to withstand marine erosion during its service life. Prior to construction, laboratory tests shall confirm that the 28-day-cured unconfined compressive strength (UCS) of solidified soil exceeds 400 kPa [28]. UCS testing was conducted in accordance with the Chinese code [22], with triplicate specimens tested for each mix proportion. Tests were terminated when specimens reached their peak strength followed by significant rupture. The detailed test program is presented in Table 4.

3. Results Analysis and Discussion

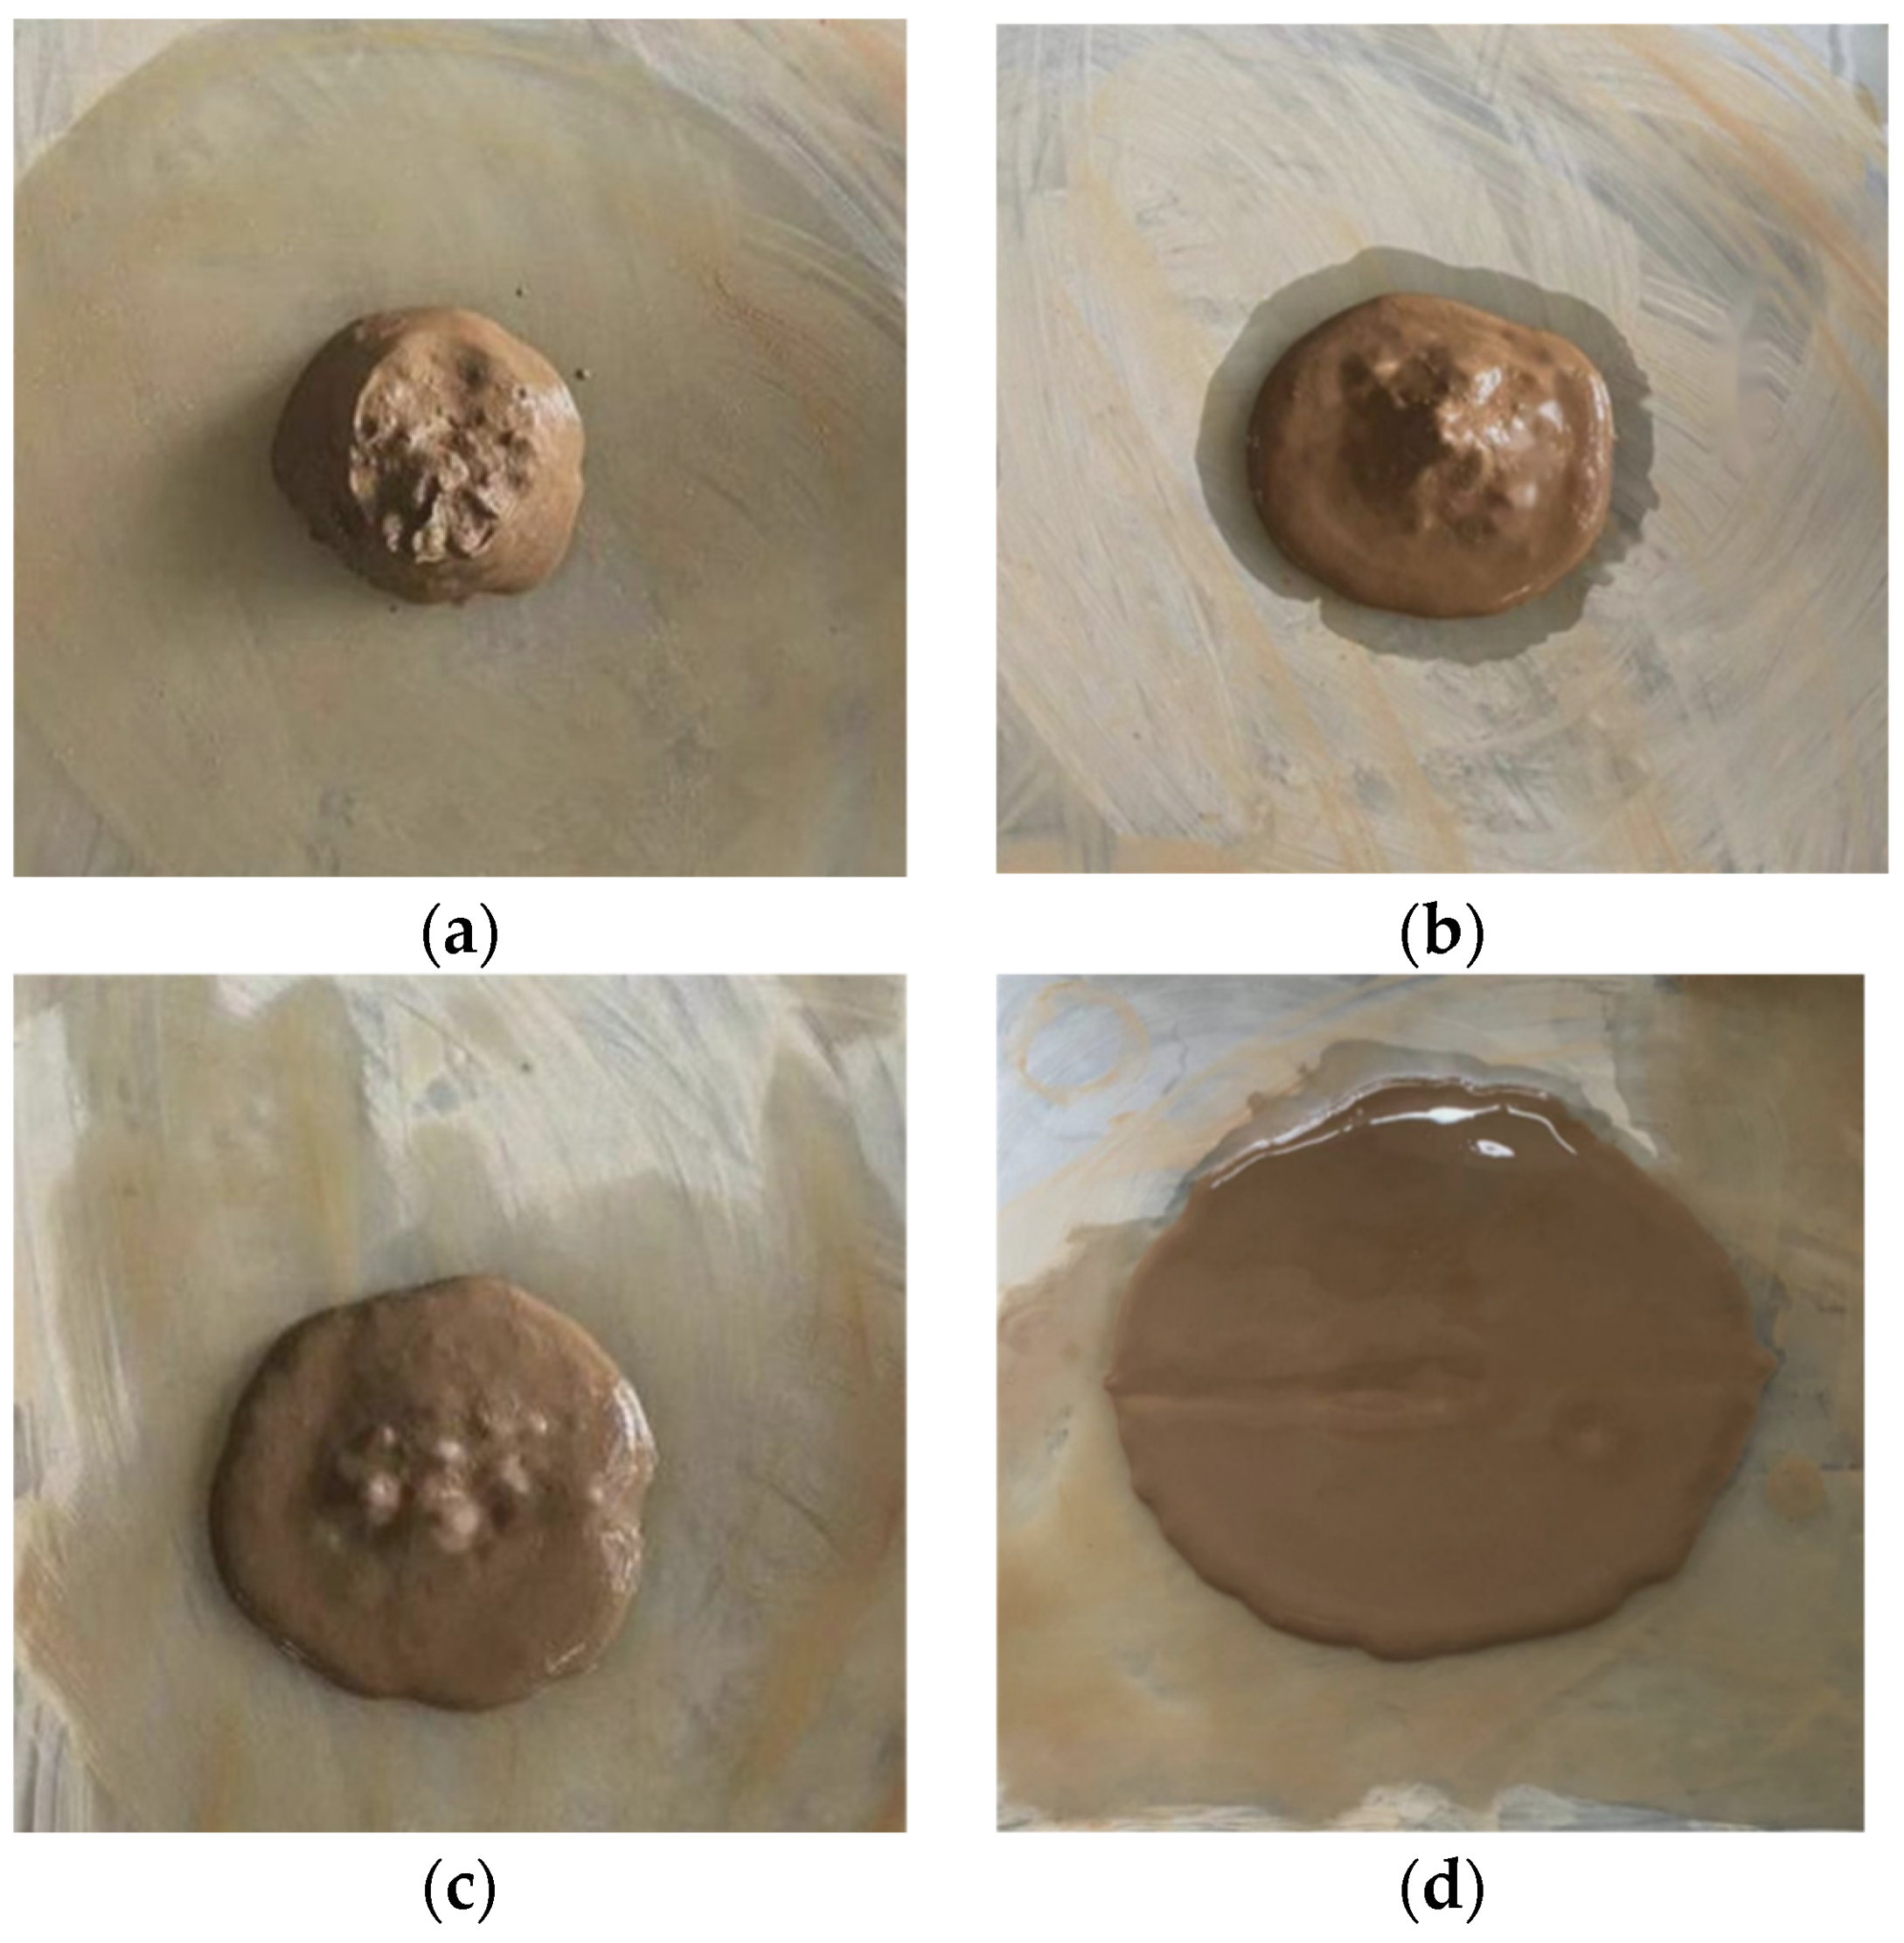
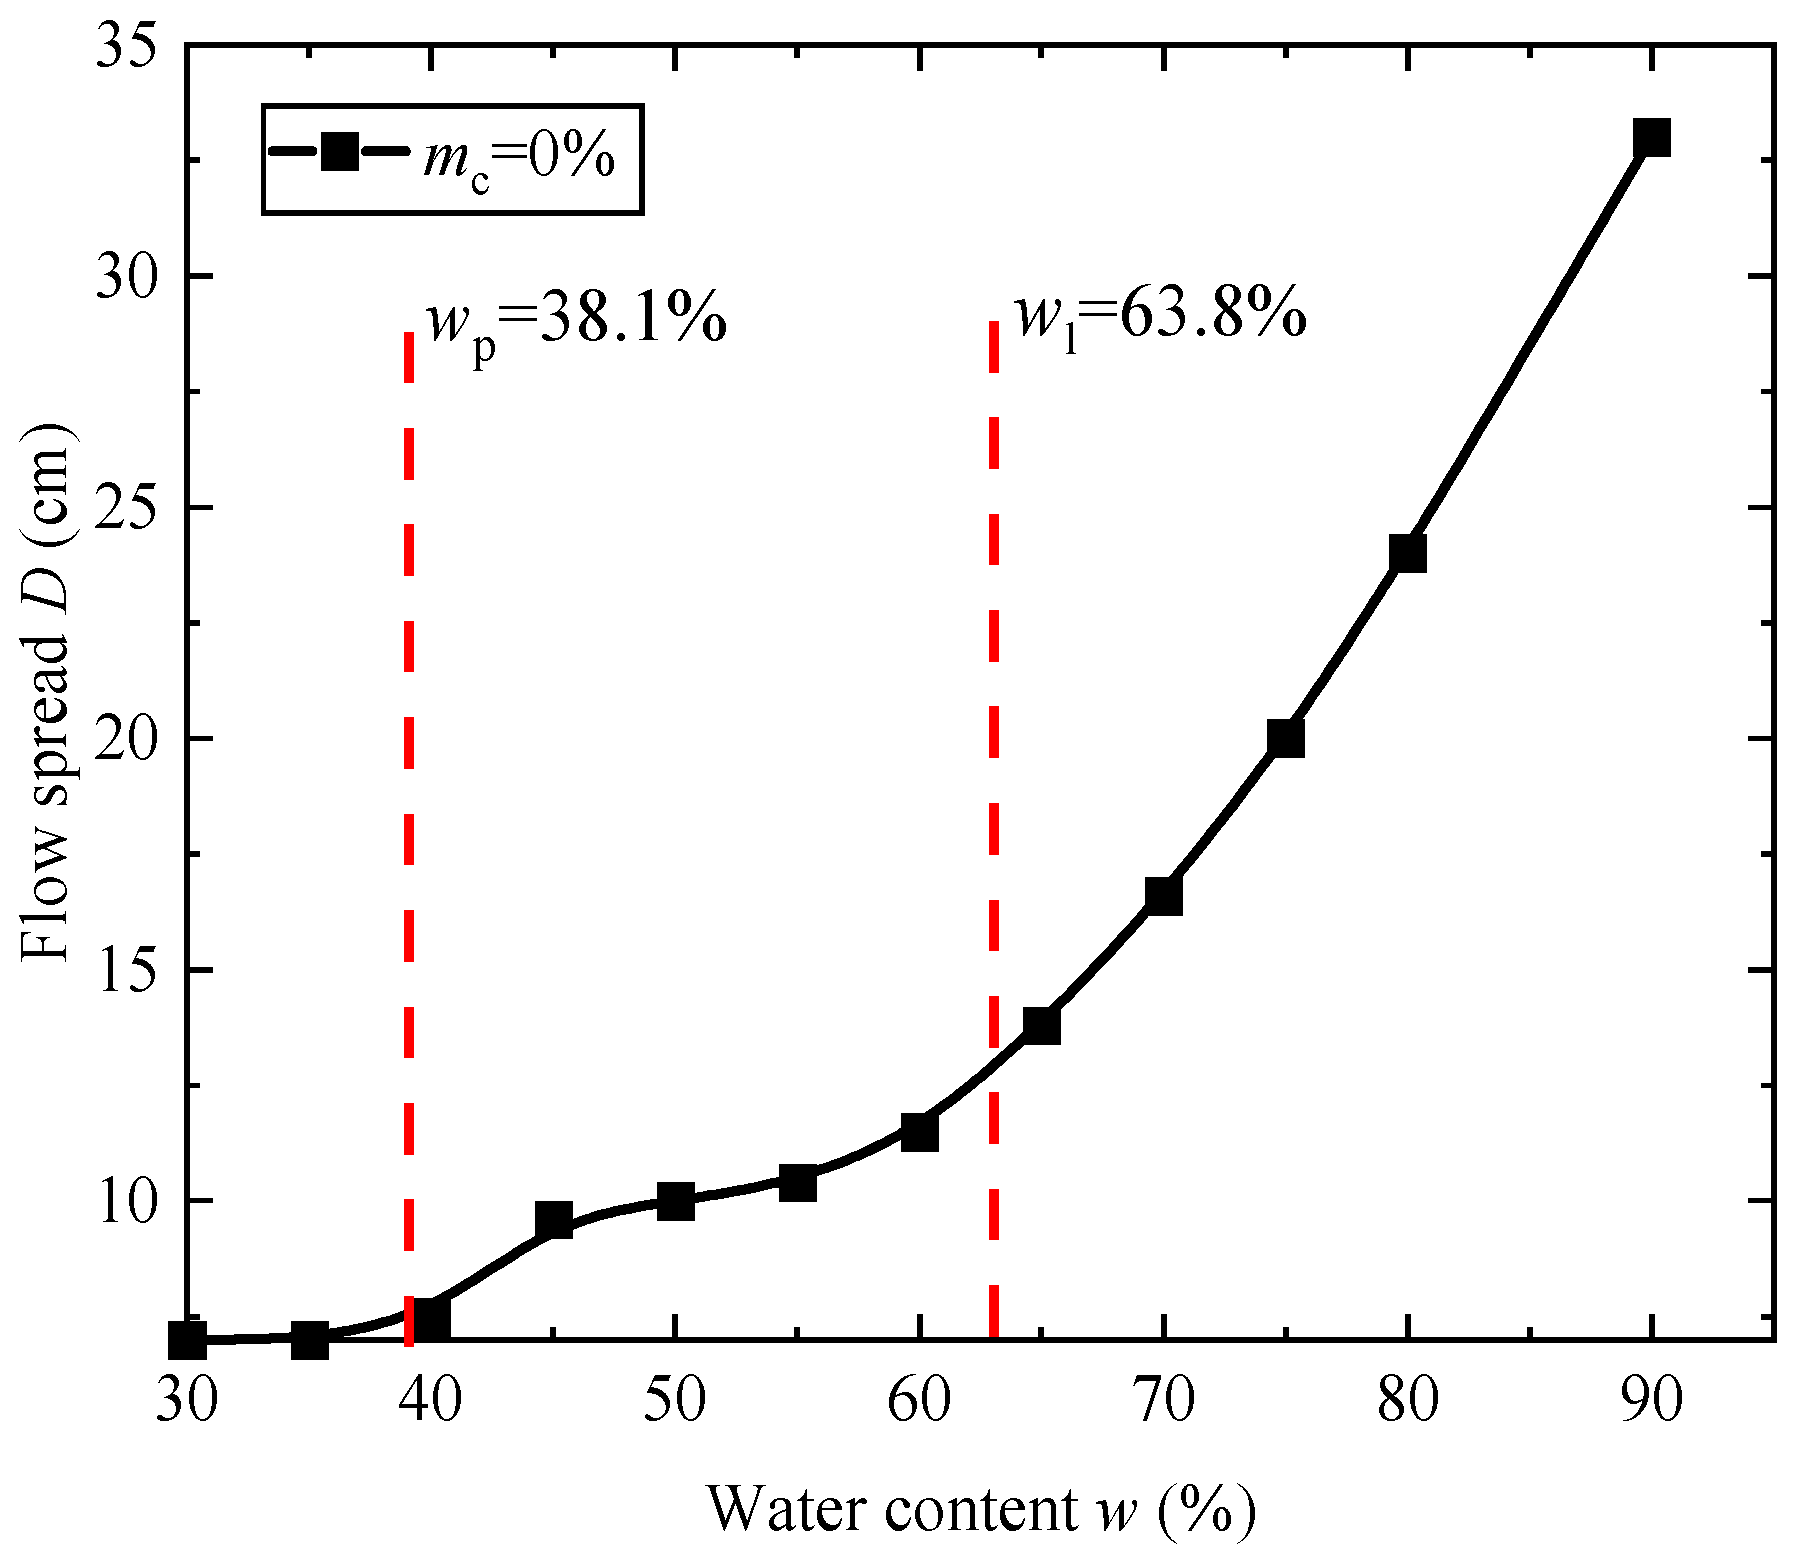
3.1. Fluidity of Original Soil

Figure 4 demonstrates that the flow spread of original soil specimens increases with the increase in water content (w), with three distinct flow regimes classified by the liquid limit (wl) and plastic limit (wp): (1) When w > wl, specimens exhibit high fluidity—upon demolding, the soil rapidly flows radially into a thin, regular disk with minimal self-supporting capacity, showing substantially greater horizontal spread than vertical height; (2) when wp < wwl, the soil enters a fluid-plastic state with moderate fluidity—demolding triggers rapid circular spreading but with reduced horizontal extension, improved self-support, and increased vertical height compared to the first regime; (3) when wwp, the soil behaves plastically with poor fluidity—minimal or no movement occurs after demolding, flow spread approaches the mold’s base diameter, self-support is excellent, vertical height nears the mold’s height, and the morphology resembles a frustum.
Figure 5 illustrates the relationship between flow spread and water content in original soil specimens. The flow spread decreases with reduced water content, confirming water content as a critical factor influencing soil fluidity. Notably, the flow spread–water content curve exhibits three distinct phases: (1) between the plastic limit and liquid limit, flow spread increases moderately with rising water content; (2) above wl, fluidity accelerates dramatically; (3) below wp, fluidity declines rapidly. The plastic and liquid limits constitute critical transition points where the curve’s slope changes abruptly.

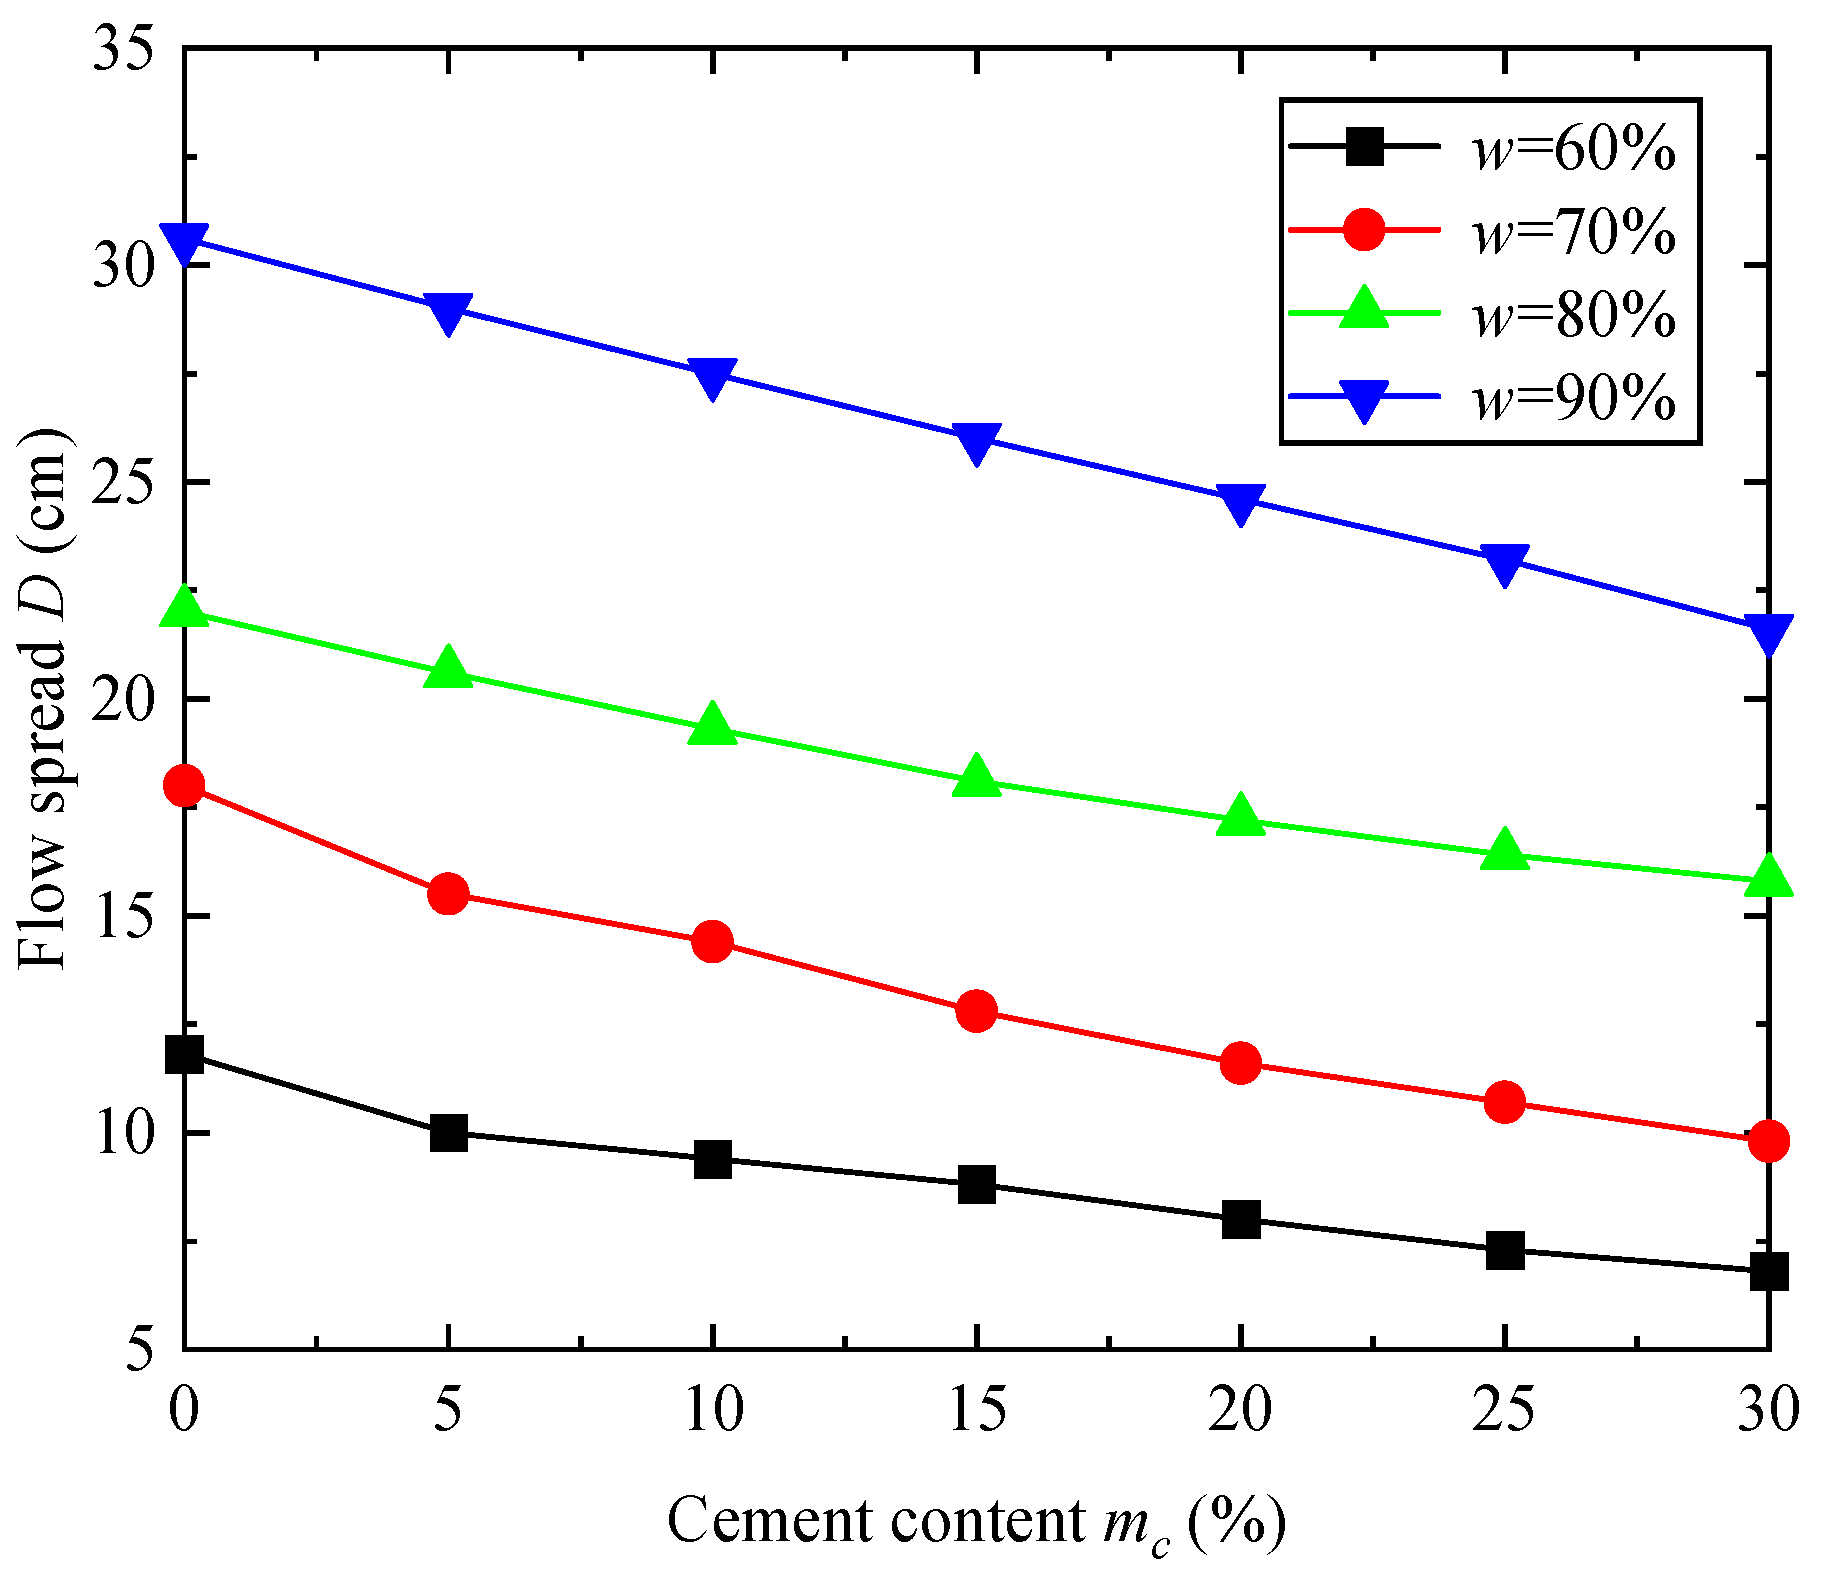
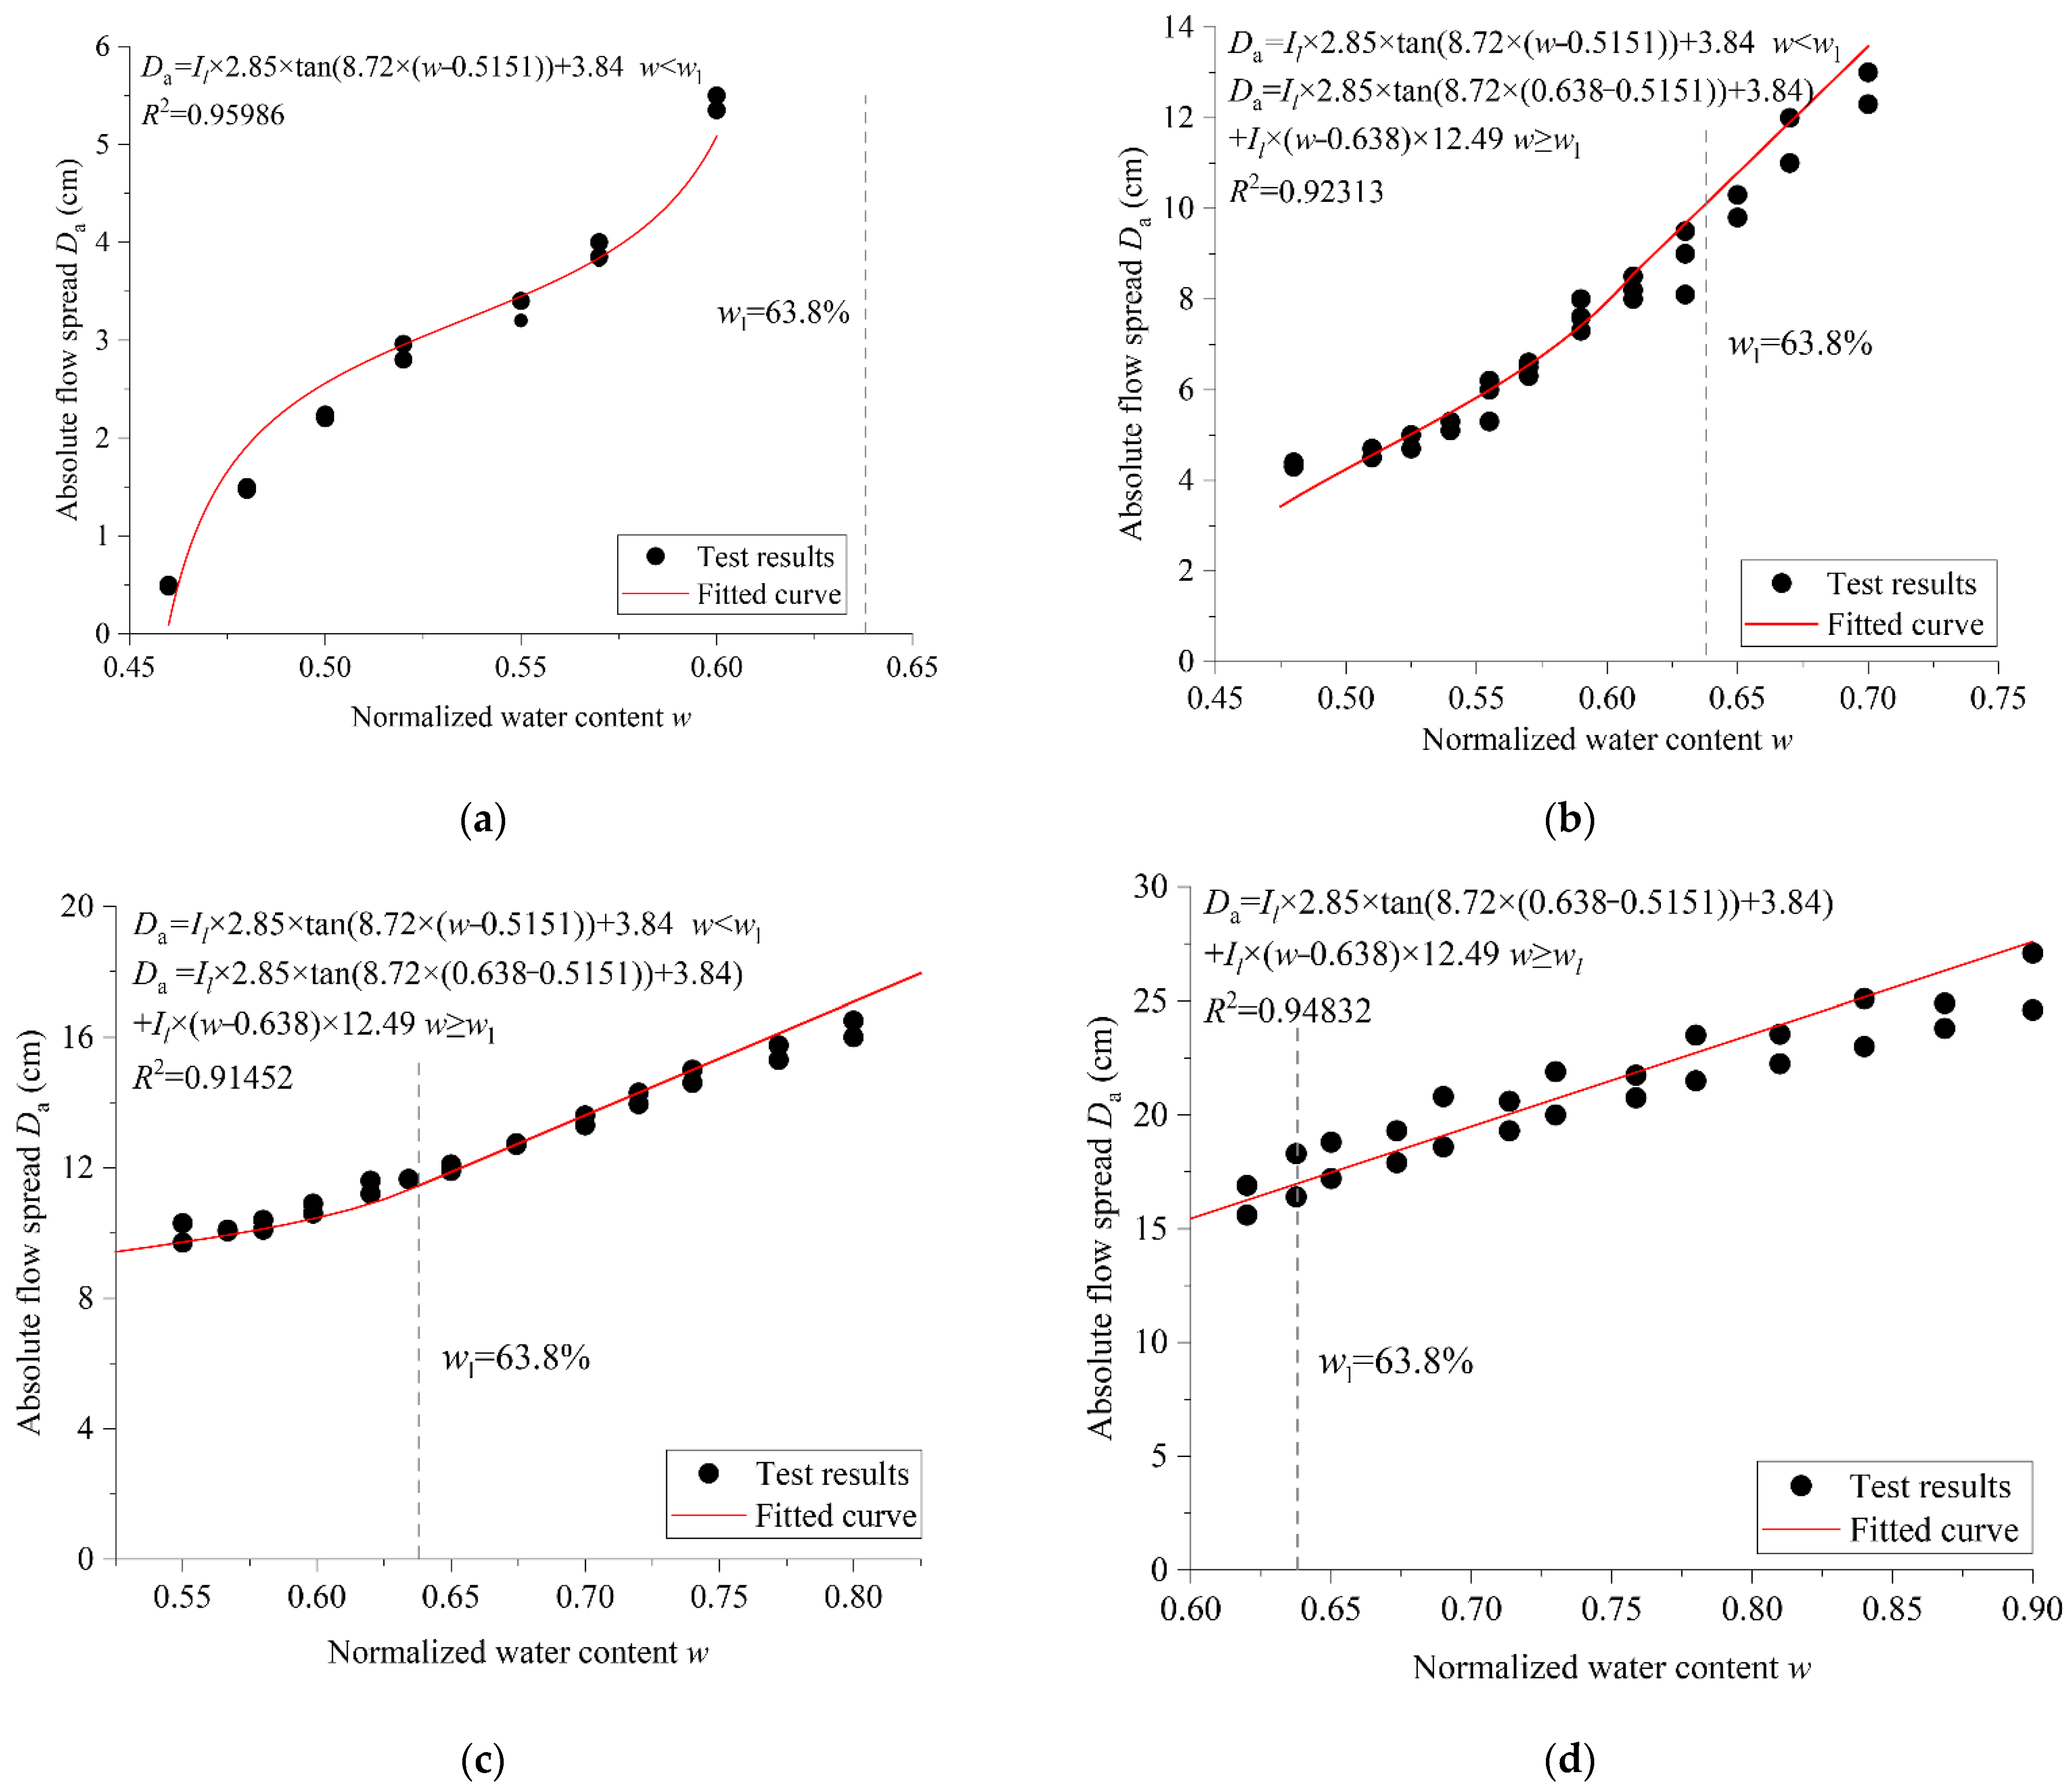
3.1.1. Fluidity of Cement-Solidified Soil

Figure 6 presents flow spread test results for cement-solidified soils with varying water contents and cement dosages. At a fixed initial water content of 60%, higher cement content significantly reduced fluidity: specimens with w = 60% and mc = 30% exhibited virtually no fluidity (D = 60 mm, equivalent to the mold’s base diameter; horizontal spread: 0 mm). Conversely, at a constant cement dosage, increased initial water content enhanced fluidity: specimens with w = 60% and mc = 20% showed D = 67 mm, while those with w = 70% and mc = 20% achieved D = 113 mm.
Figure 7 presents the flow spread of cement-solidified soil versus cement content at varying initial water contents. The flow spread decreases progressively with increasing cement content under constant initial water content. The trend exhibits nonlinear characteristics: at lower initial water contents (60–70%), the curve demonstrates a steep descent rate when cement content is below 5%, while the descent rate of curves decelerates within the 5% to 30% cement content range. This indicates that cement addition significantly enhances silt consistency and reduces fluidity, with even a low content exerting substantial impact on flow spread in low-water-content specimens. Conversely, at higher initial water contents (80–90%), the flow spread–cement content relationship shows a gradual linear reduction.
Figure 8 illustrates the variation in flow spread with initial water content for cement-solidified soils at different cement contents. Under a constant cement content, a higher initial water content consistently increased flow spread. Similarly to Figure 5 (original soil with 0% cement added), the flow spread–water content curve for cement-solidified soil also exhibits three distinct phases.
The results demonstrate that both cement content and initial water content significantly influence the fluidity of solidified soil. In this study, the initial water content was normalized using cement content, the normalized water content w ¯ as defined in Equation (3). Additionally, since truncated conical molds have varying base dimensions, the absolute flow spread Da was proposed—calculated as the difference between measured flow spread and the mold’s bottom diameter d1 (=7.0 cm in this study) (Equation (4)).
w ¯ = w ( 1 + 1.5 m c )
D a = D d l
Figure 9 shows the variation in absolute flow spread (Da) with normalized water content ( w ¯ ) for cement-solidified soils at different initial water contents. Three distinct regimes are readily observable: (1) between the plastic and liquid limit, the relationship approximates a tangent function; (2) above the liquid limit, the linear trend resumes. Incorporating the liquidity index as a modification factor to account for water content effects, the relationship between Da and w ¯ is expressed as follows:
D a = I l × a × tan ( b × ( w ¯ c ) ) + d w p <   w ¯ < w l
D a = I l × ( a × tan ( b × ( w l c ) ) + d ) + I l × e × ( w ¯ w l )   w l <   w ¯
I l = ( w w p ) ( w l w p )
where the coefficients in the equation are defined as follows: a = 2.85, b = 8.72, c = 0.5151, d = 3.84, e = 12.49.

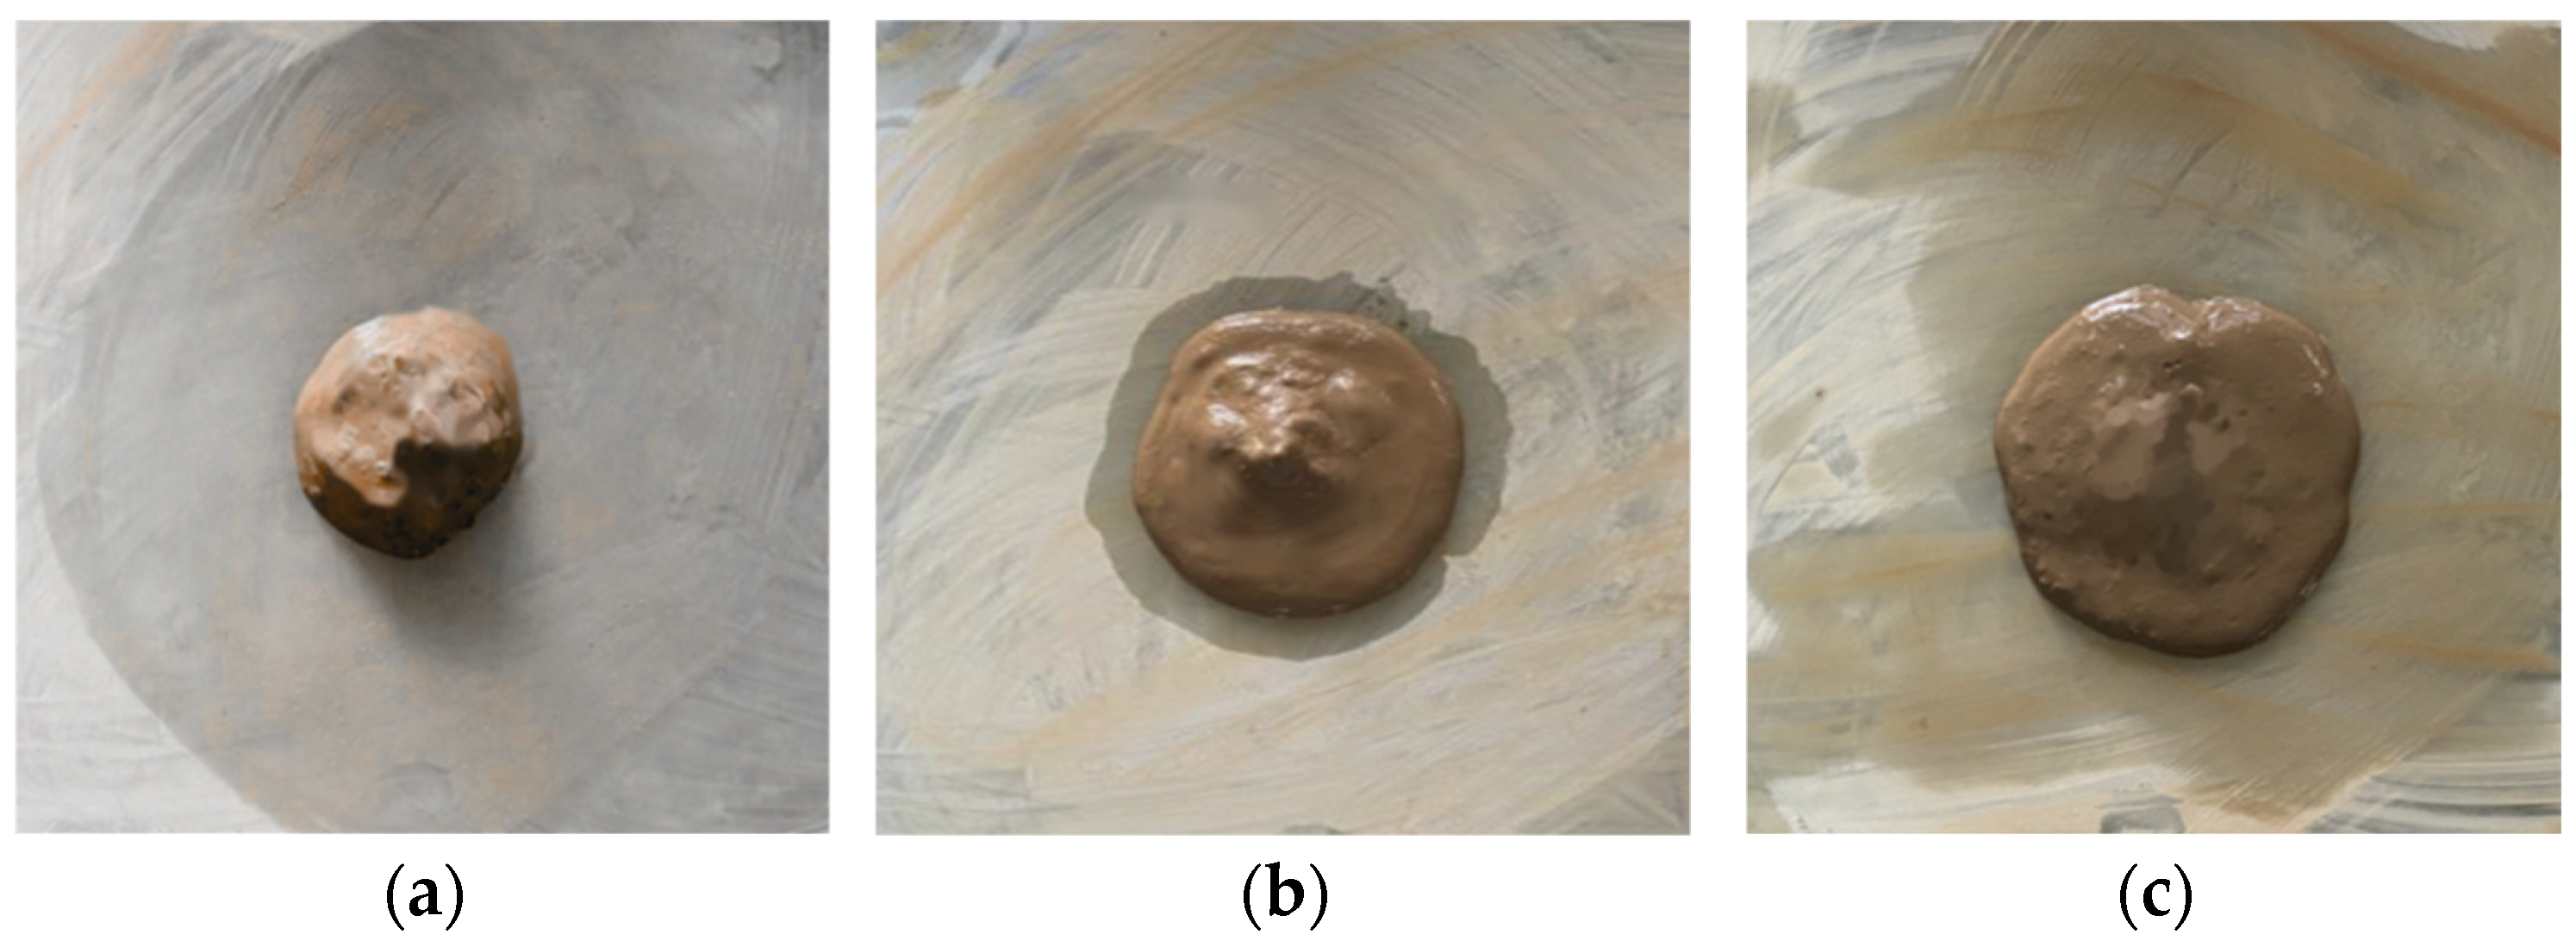
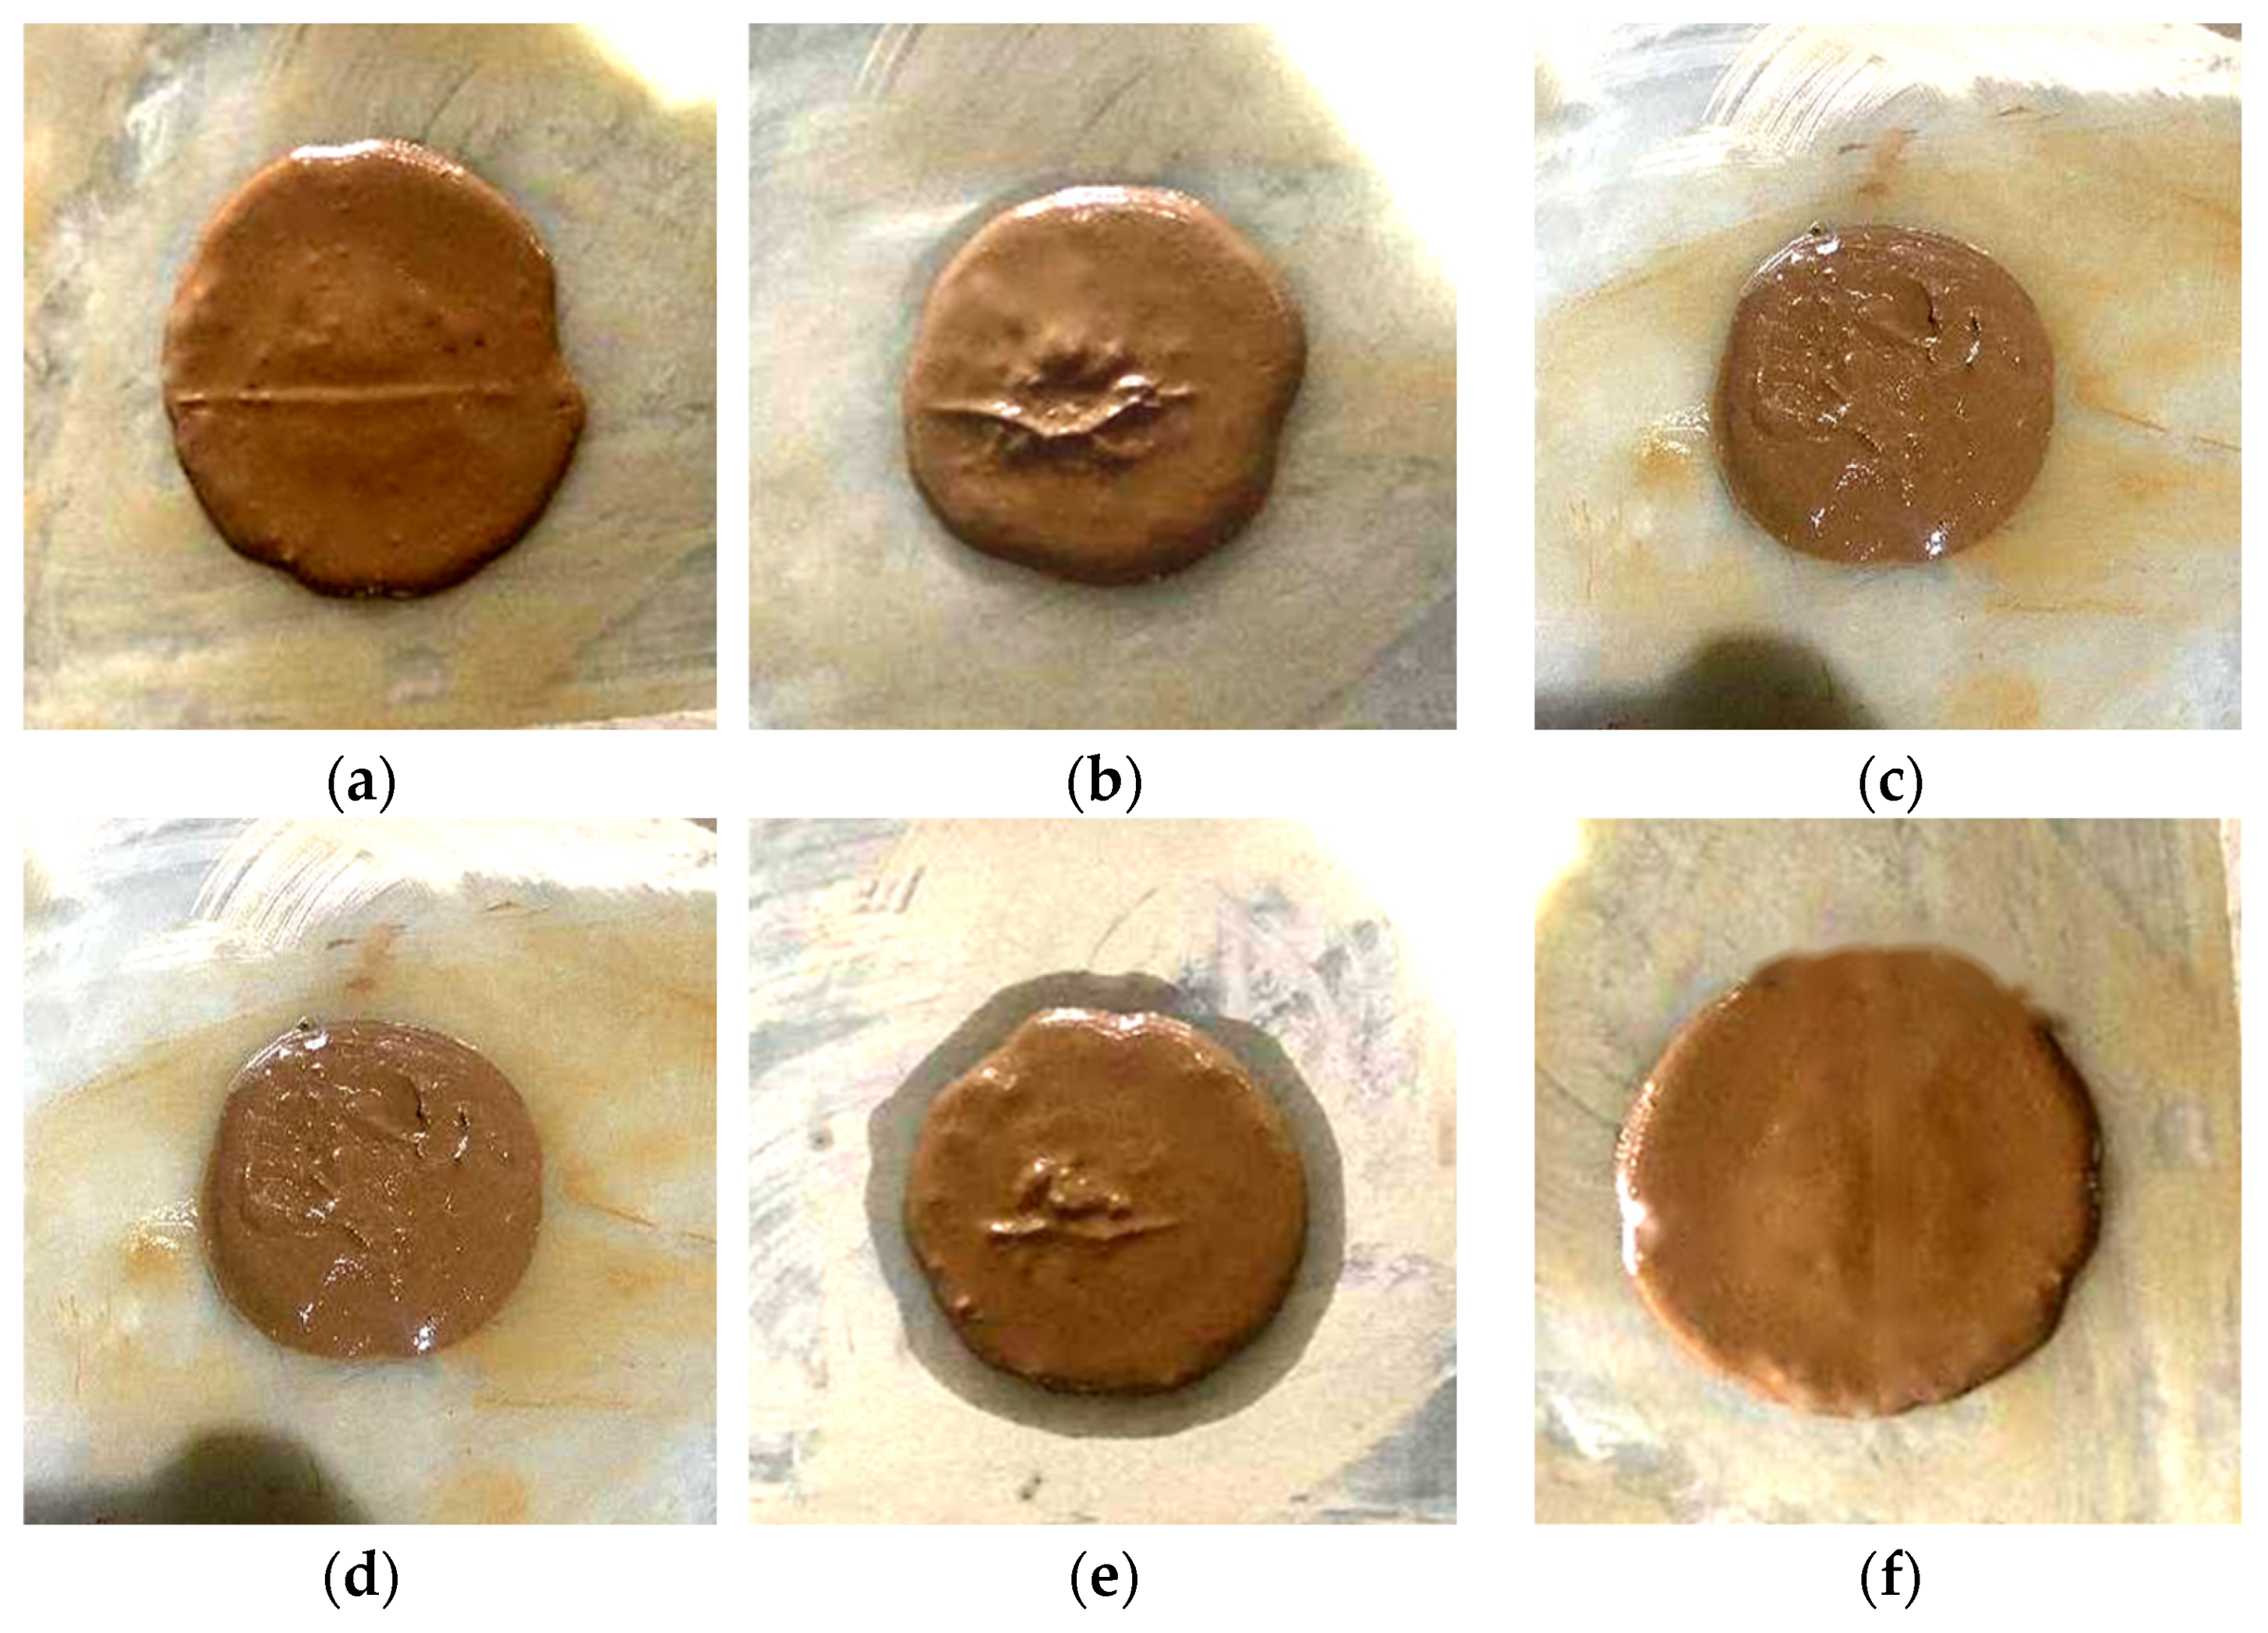
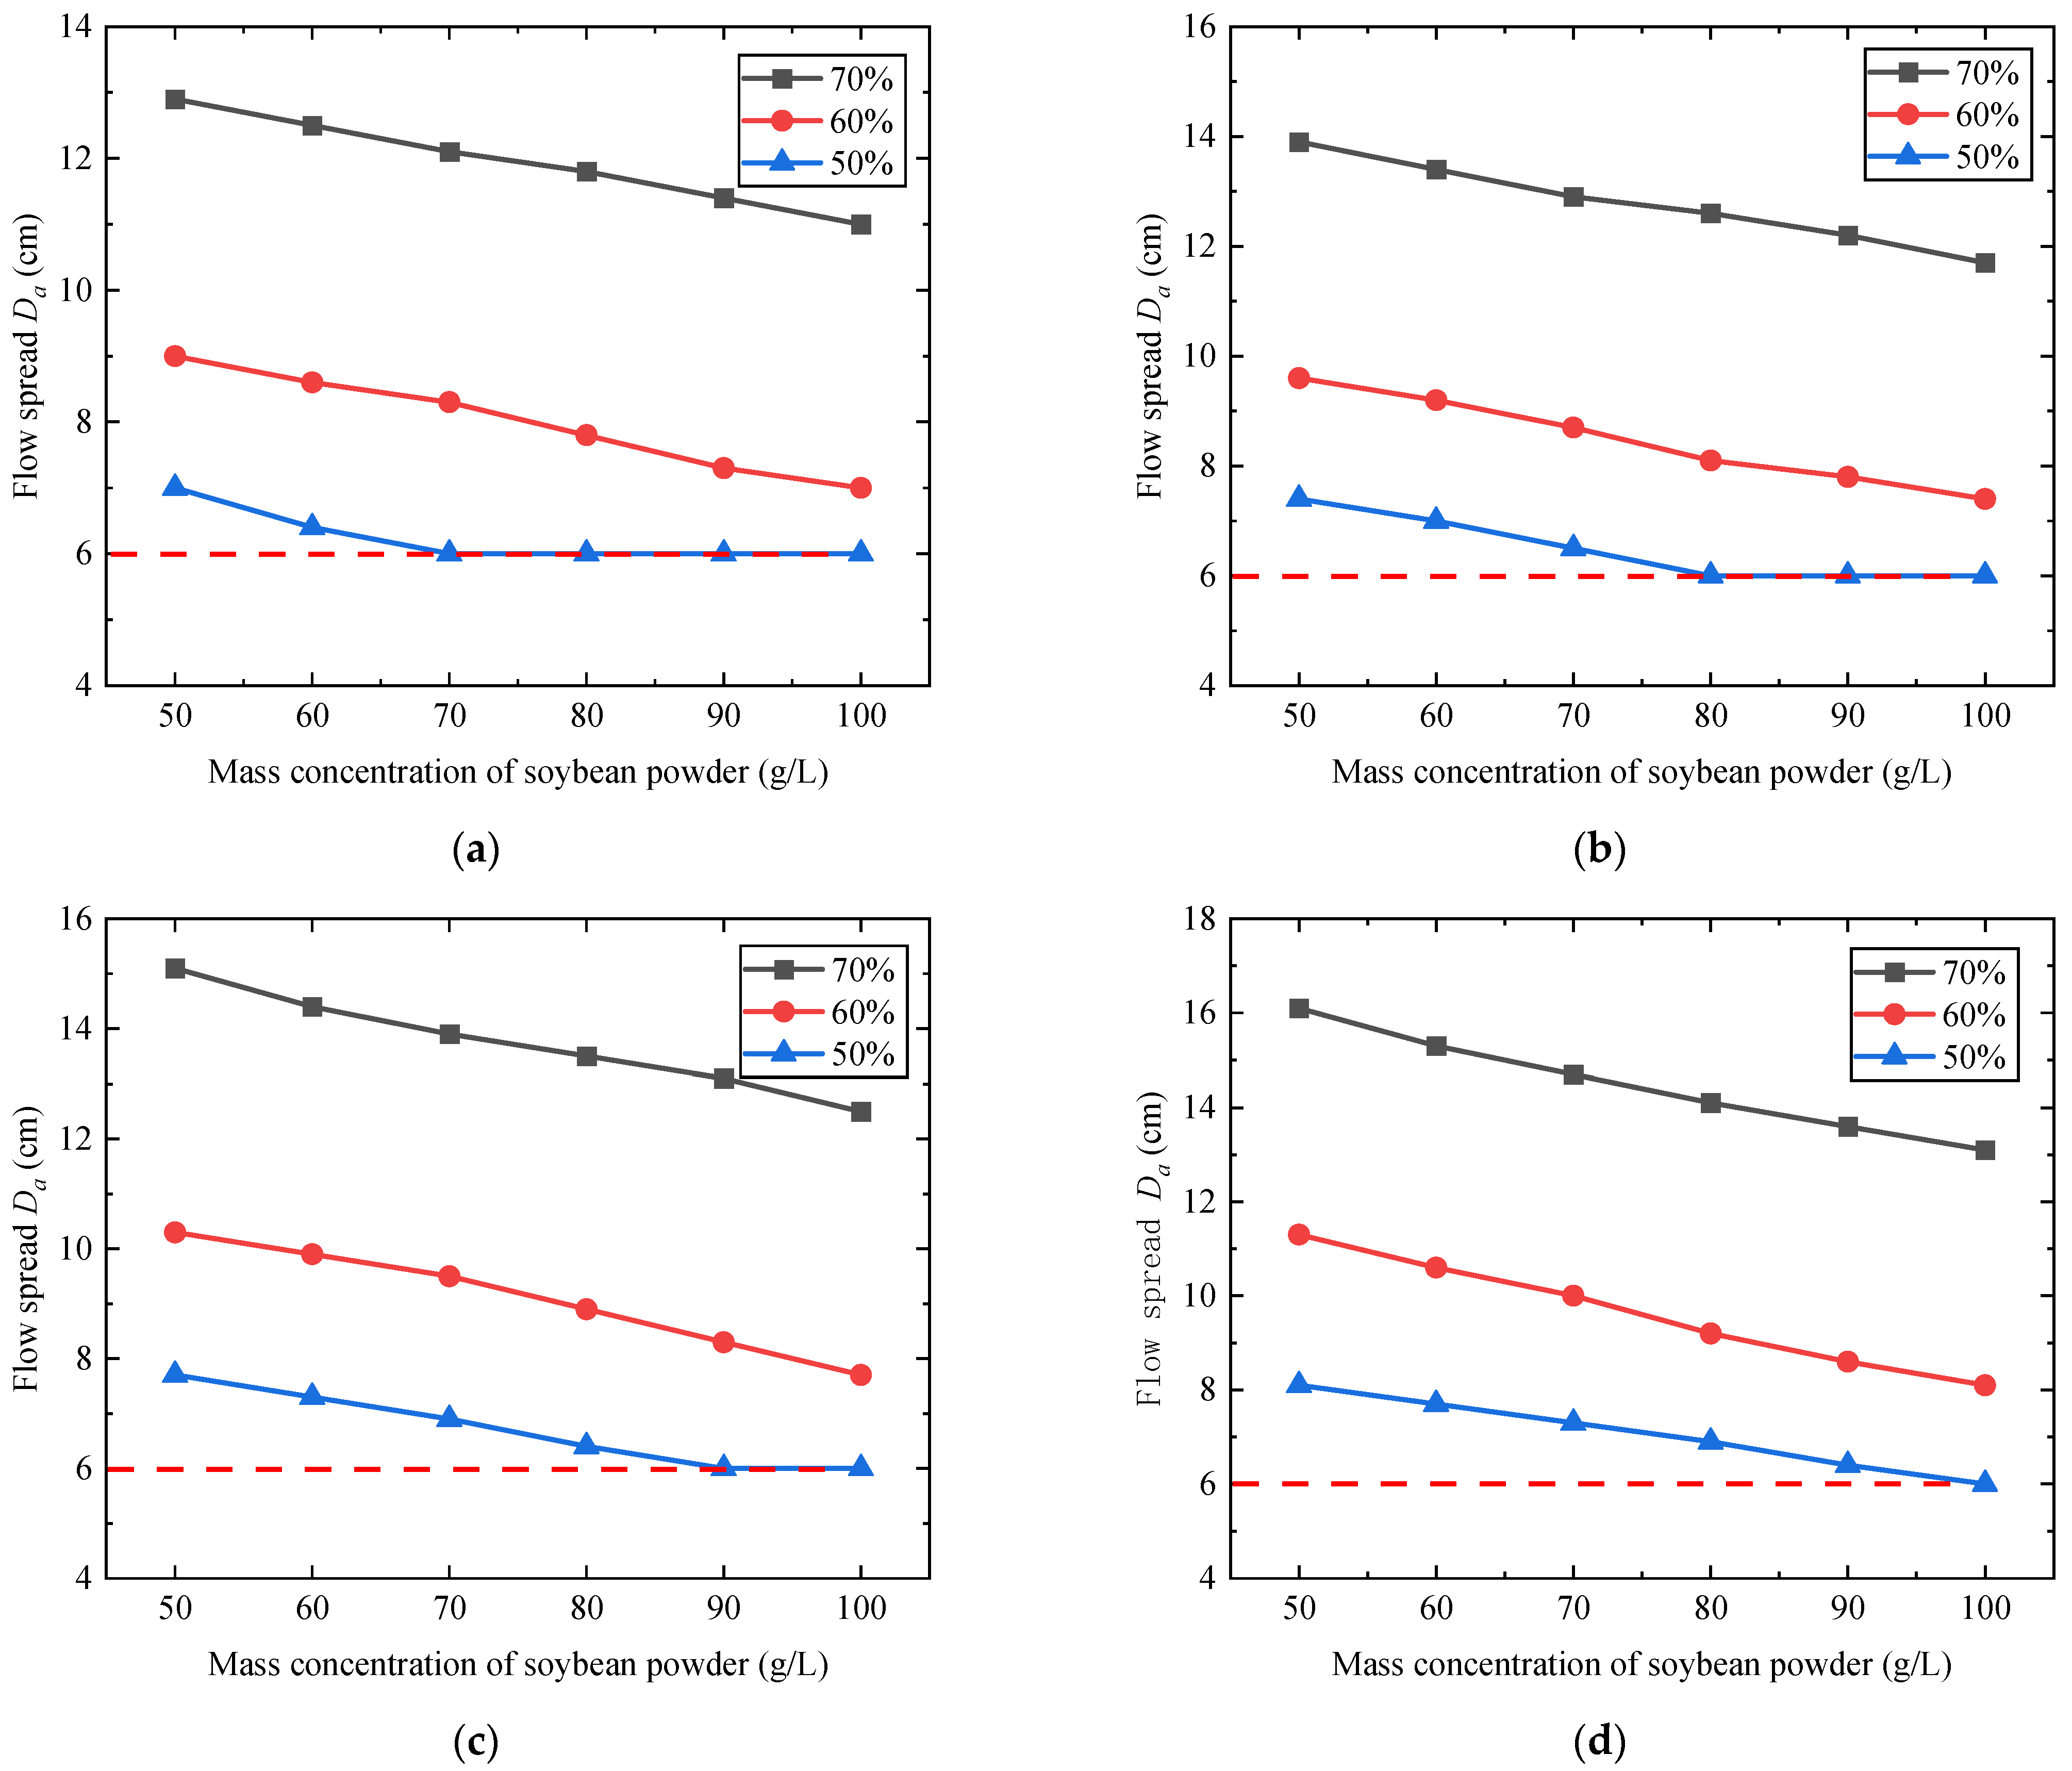
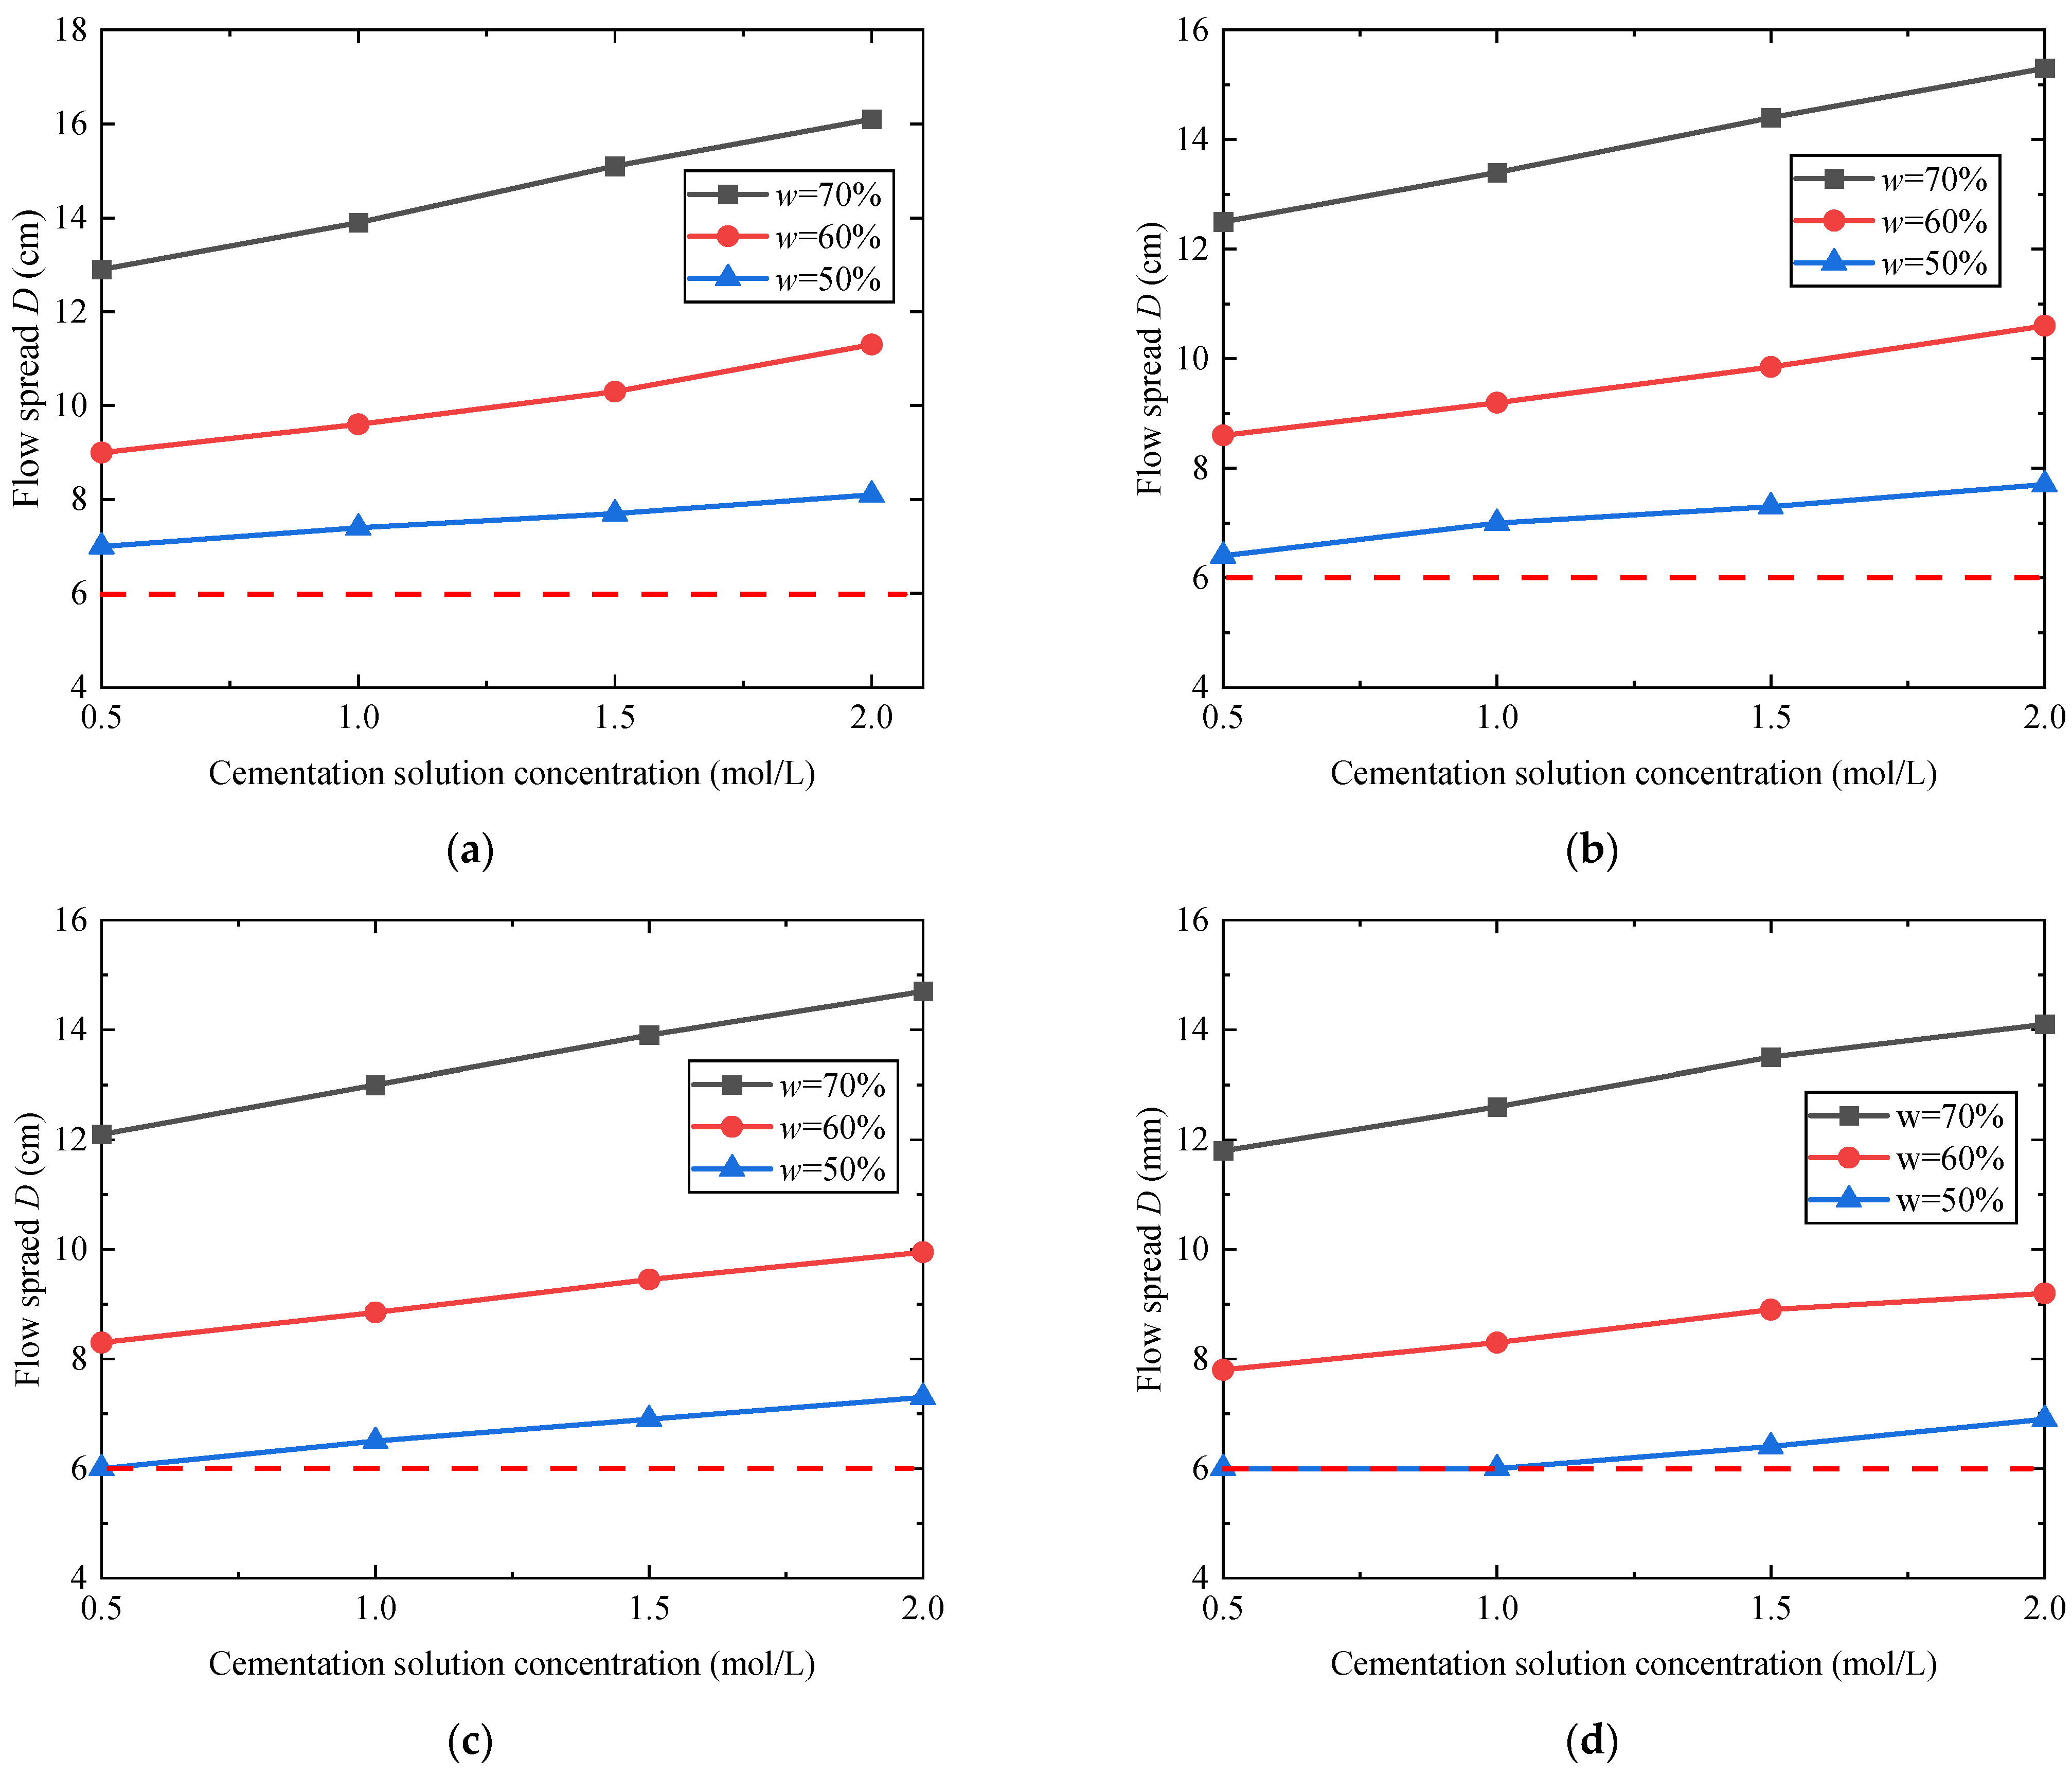
3.1.2. Fluidity of ECIP-Solidified Soil

From the comparison in Figure 10a–c, it is observed that at an initial water content of 60% and cementation solution concentration of 0.5 mol/L, EICP-solidified soil with a higher soybean powder mass concentration exhibits significantly reduced fluidity. Specifically, when w = 60%, cementation solution concentration = 0.5 mol/L, and soybean powder mass concentration = 100 g/L, the flow spread D = 70 mm. There is around a 20% reduction compared to EICP-solidified soil with a 50 g/L soybean powder mass concentration under identical conditions.
From the comparison in Figure 10d–f, it is evident that increasing the cementation solution concentration enhances the fluidity of EICP-solidified soil when the initial water content w = 60% and soybean powder mass concentration = 100 g/L. Specifically, in the case where w = 60%, cementation solution concentration = 0.5 mol/L, and soybean powder mass concentration = 100 g/L, the flow spread D = 70 mm. However, under identical water and soybean powder conditions, when the cementation solution concentration was increased to 2.0 mol/L, the flow spread decreases to D = 81 mm.
Figure 11 presents the variation in flow spread in EICP-solidified soil with soybean powder mass concentration across three initial water contents. As shown in Figure 11a, at a constant cementation solution concentration (0.5 mol/L) and 60% water content, EICP-solidified soil’s flow spread decreases from 90 mm to 71 mm (21.1% reduction) as soybean powder concentration increases from 50 g/L to 100 g/L, demonstrating that higher soybean powder concentrations increase viscosity and reduce fluidity through elevated urease activity. Additionally, at a constant 0.5 mol/L cementation solution and 50 g/L soybean powder concentration, increasing initial water content from 50% to 70% increases EICP-solidified soil’s flow spread by 84% (from 70 mm to 129 mm), confirming water content critically enhances fluidity by reducing viscosity, consistent with cement-solidified soils. Flow spread decreases linearly with higher soybean powder concentration, though reduction rates vary by initial water content—at 0.5 mol/L cementation solution, w = 70% shows a 15.4% decrease versus 21.1% at w = 60%—indicating higher water content lessens reduction, while comparative analysis shows increased cementation solution concentration enhances flow spread under identical mixtures.
Figure 12 illustrates the flow spread of EICP-solidified soil versus cementation solution concentration at three initial water contents. As shown in Figure 12a, under constant soybean powder mass concentration, the flow spread increases with rising cementation solution concentration: at w = 50% and soybean powder = 50 g/L, the flow spread measures 70 mm at 0.5 mol/L cementation solution but rises to 81 mm (+ 15.7%) at 2.0 mol/L. This occurs because high-concentration cementation solutions reduce viscosity and enhance fluidity, primarily due to abundant cations (e.g., Ca2+) thinning the double electric layers of soil particles. At concentrations reaching 1.5–2.0 mol/L [29], this ionic effect transforms bound water into free water within the soil. Additionally, under an identical cementation solution concentration, increased initial water content significantly enhances the flow spread of EICP-solidified soil. The relationship demonstrates an approximately linear trend, with flow spread increasing linearly with cementation solution concentration. However, the rate of increase varies with initial water content: as shown in Figure 12a at 50 g/L soybean powder mass concentration, the flow spread curve for w = 70% increases by 24.8% (cementation solution concentration increase from 0.5 to 2.0 mol/L), while for w = 50% it rises by 15.7%, indicating that higher initial water content yields greater increase rates.

3.2. Disintegration Characteristics of Cement and ECIP-Solidified Soil

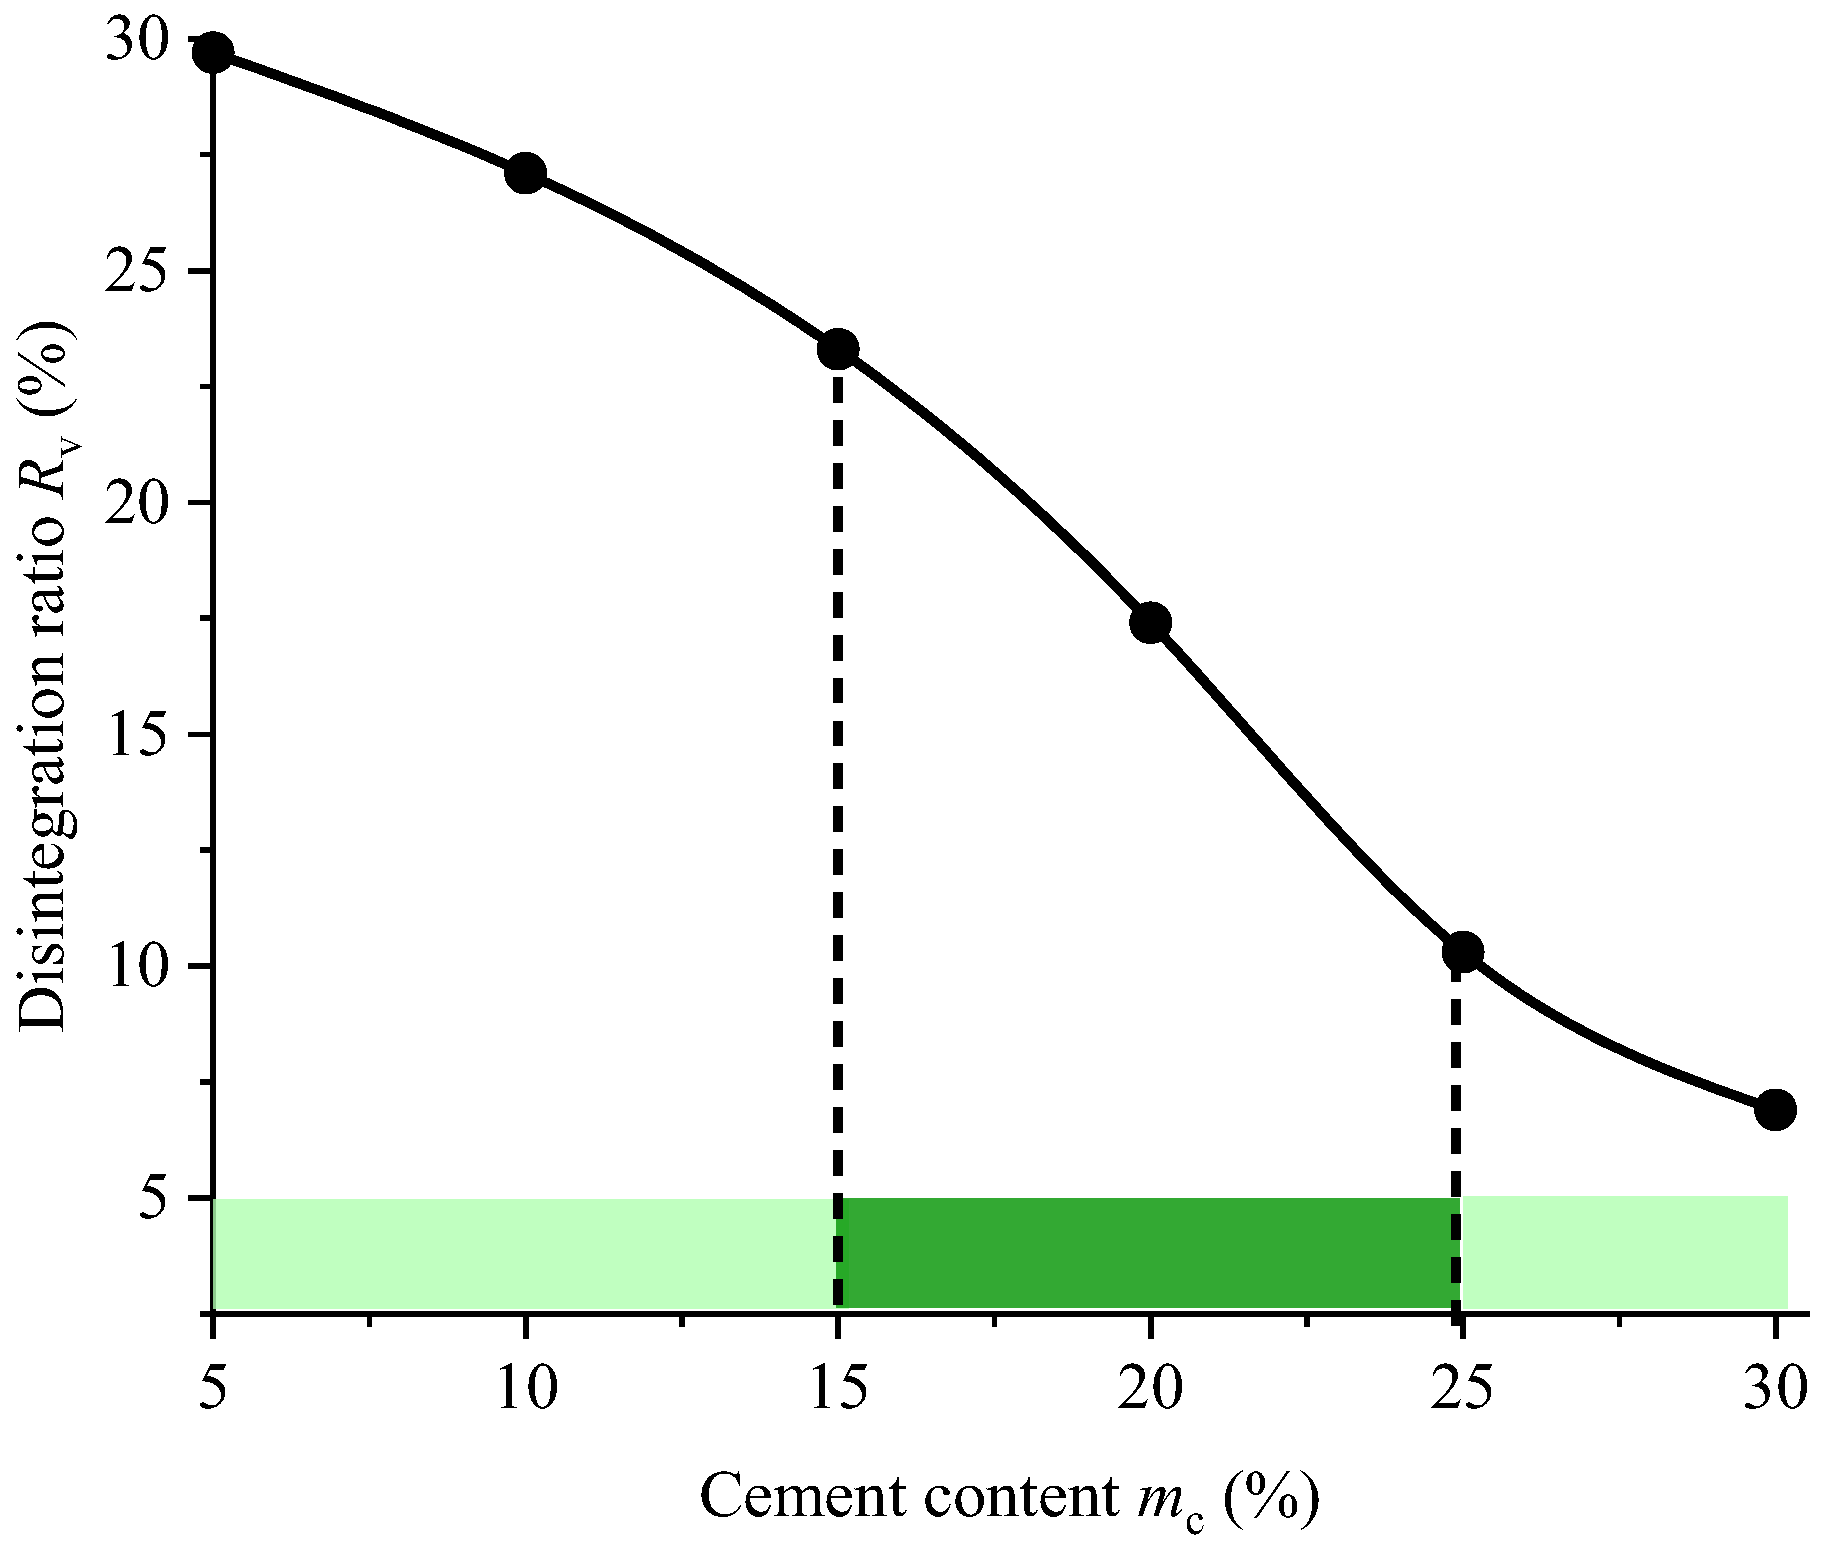
3.2.1. Disintegration Characteristics of Cement-Solidified Soil

(1)
Cement-solidified soil (no curing age)
After immersing solidified soil specimens with varying mix proportions in distilled water for 10 min, selected test results are presented in Figure 13. Figure 13a displays the disintegration test of cement-solidified soil with 10% cement content, revealing that the specimen gradually disintegrated into suspended particles, resulting in highly turbid water—indicating limited improvement in erosion resistance at this cement content. Comparative analysis of Figure 13a–c demonstrates that under identical conditions, increasing cement content progressively yields clearer water in the beakers, confirming that higher cement content enhances anti-dispersion capacity of cement-solidified soil with no curing age (fresh state).
The disintegration ratio Rv of cement-solidified soil with no curing age, calculated via Equation (1), is presented in Figure 14 for varying cement contents. The results demonstrate a progressive reduction in Rv with increasing cement content, exhibiting a nonlinear trend. Within the 15 to 25% cement-content range (demarcated by the dark green band), the disintegration ratio displays the steepest decrease rate, indicating that this specific range provides the most pronounced enhancement in anti-dispersion capacity for solidified soil.
(2)
Cement-solidified soil (curing 7 days)
After immersing specimens of solidified soil with varying mix proportions in distilled water for 10 min following 7 days of curing, partial test results are shown in Figure 15. Figure 15a displays the disintegration test of a specimen with 10% cement content: the soil exhibited dispersive behavior, with most fragments disintegrating into granular accumulations at the aluminum container base accompanied by flocculent precipitates, while partial blocks remained intact. The turbid water indicates that 10% cement content provides limited improvement to the original soil’s dispersion resistance. Figure 15b presents results for 20% cement content: the specimen maintained structural integrity with only partial particle disintegration, minor flocculent precipitates, and relatively clear water—demonstrating that 20% cement content effectively enhances anti-dispersion capacity. Figure 15c shows the 30% cement content specimen: it preserved near-complete morphology with minimal particle shedding, no flocculent precipitates, and clear water, confirming that 30% cement dosage significantly improves dispersion resistance in original soil.
The disintegration ratio Rm of cement-solidified soil specimens after 7-day curing, calculated using Equation (2), is shown in Figure 16 for varying cement contents. The results reveal a progressive reduction in Rm with increasing cement content—consistent with the trend observed for cement-solidified samples with no curing age in Figure 14. This nonlinear decrease exhibits the steepest descent rates within two critical intervals—5–10% and 15–20% cement dosage (demarcated by dark green bands)—indicating these ranges provide the most substantial enhancement in dispersion resistance for cured specimens.

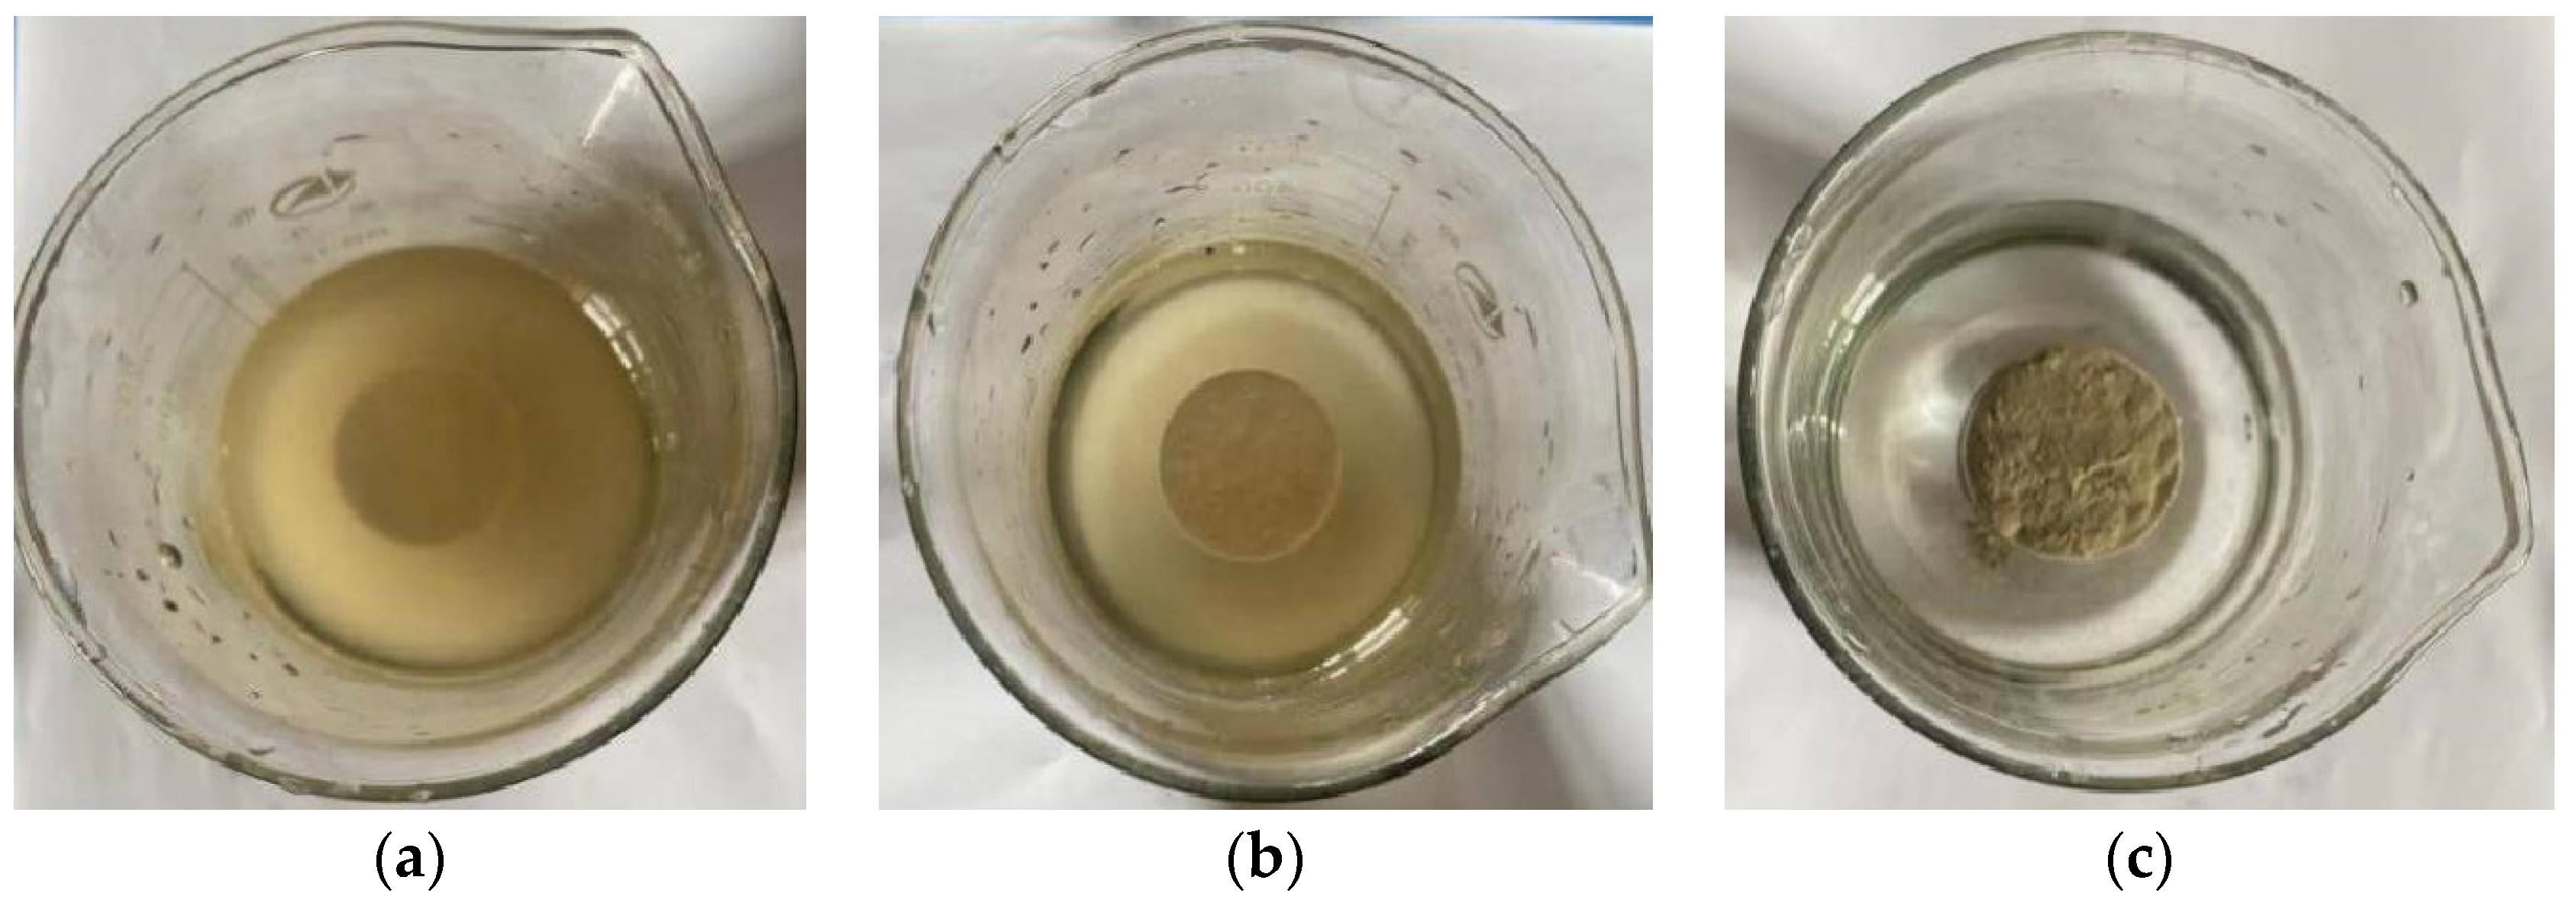
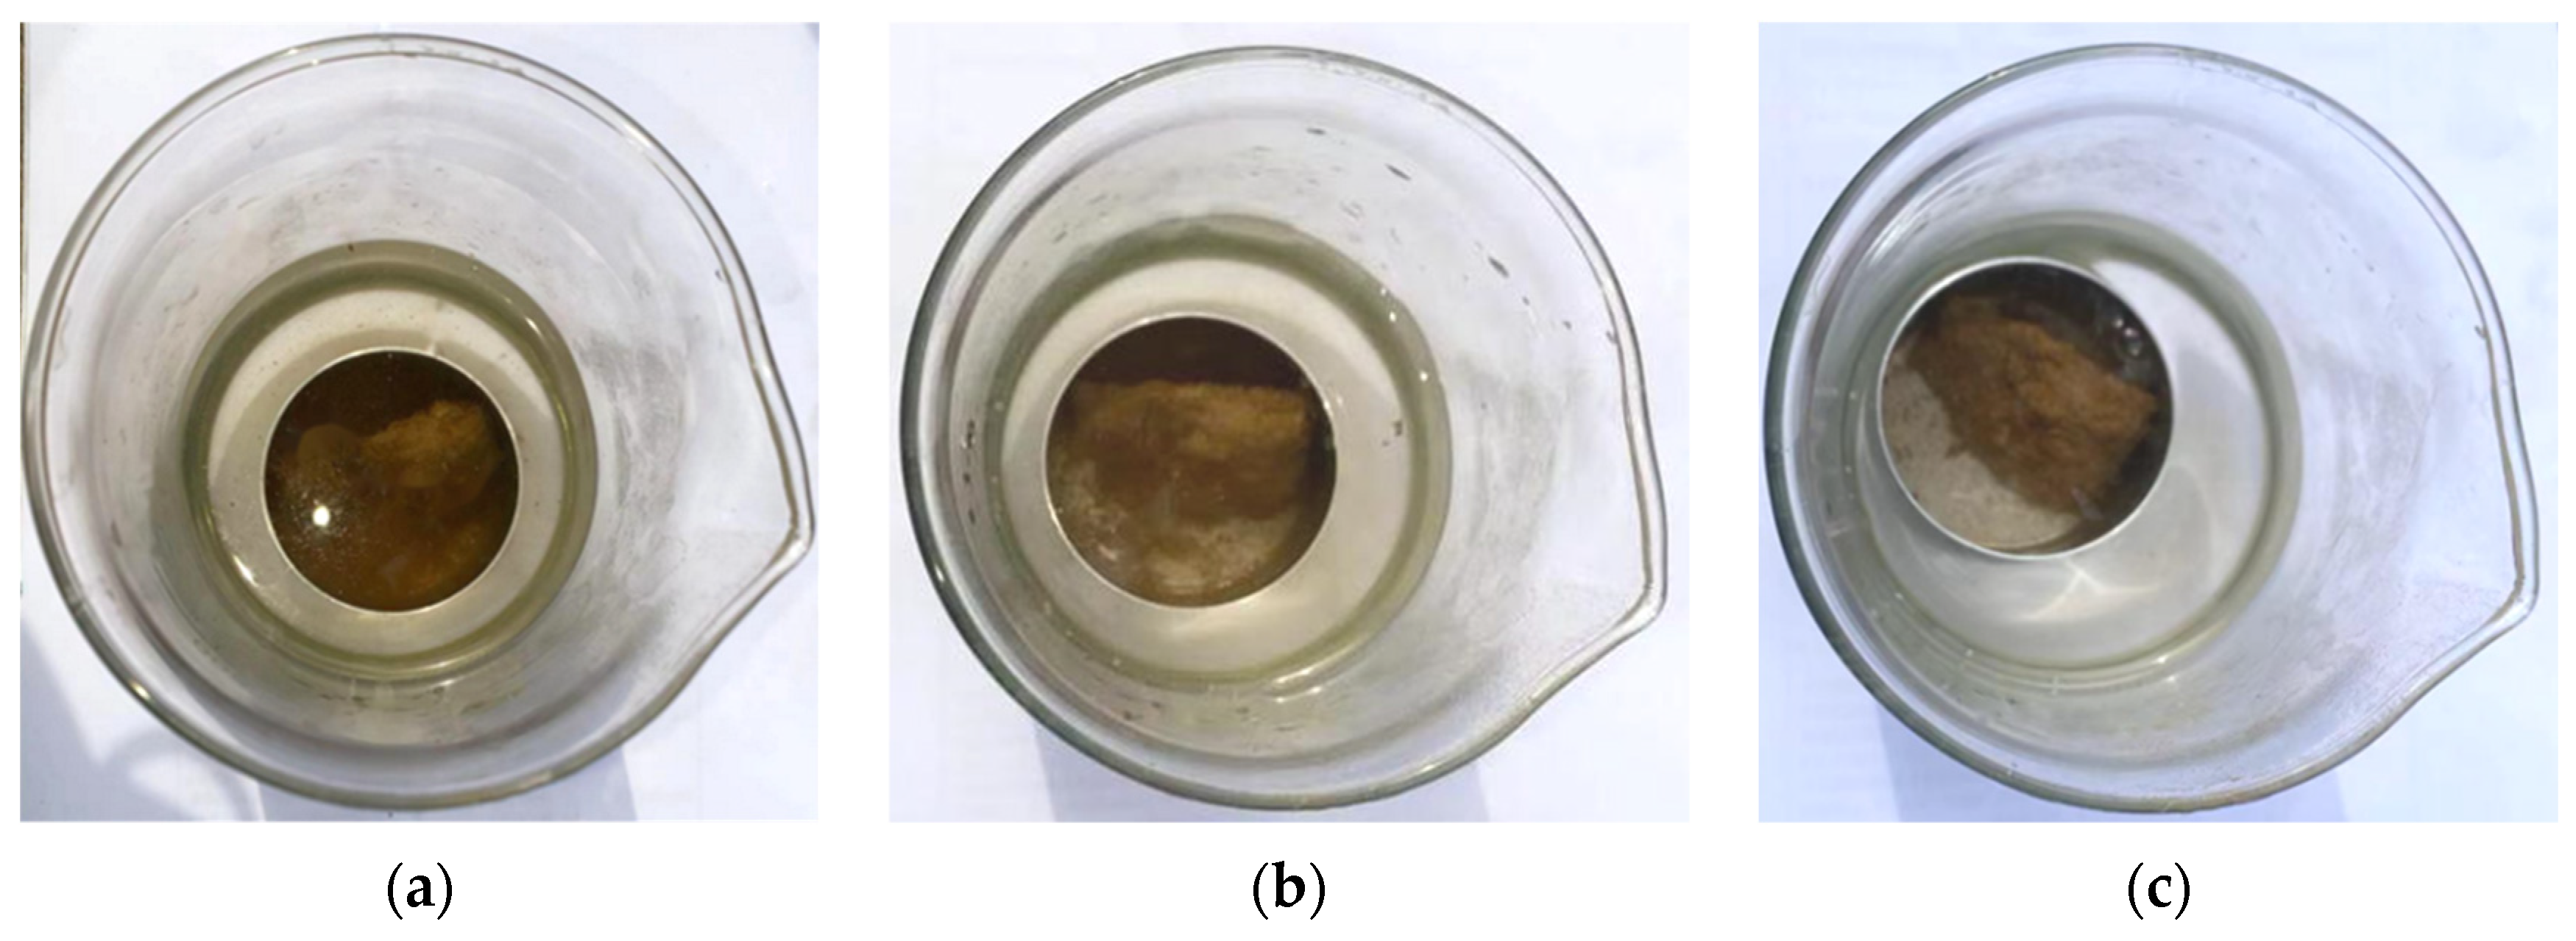
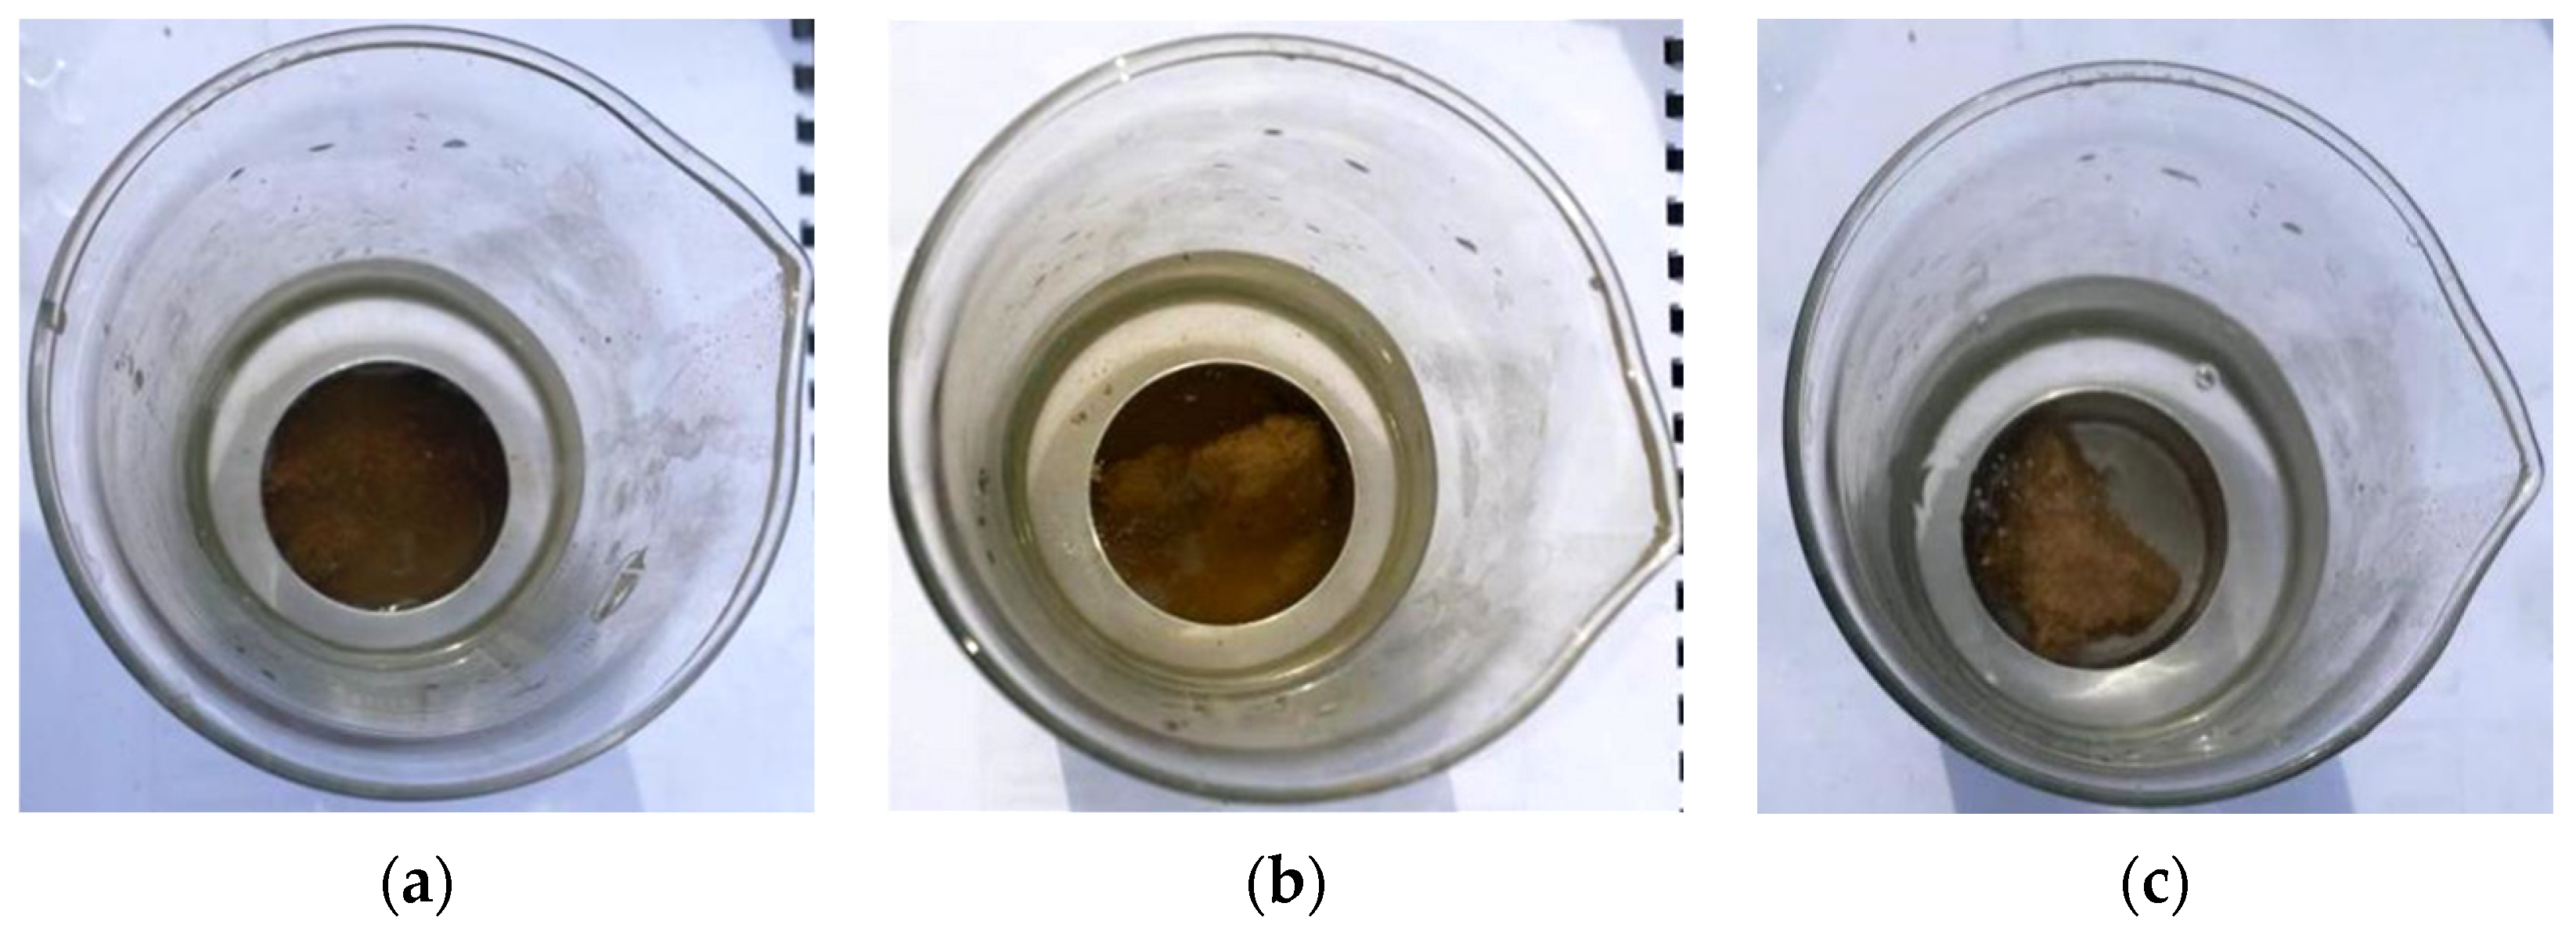
3.2.2. Disintegration Characteristics of ECIP-Solidified Soil

(1)
EICP-solidified soil (no curing age)
Figure 17 illustrates the disintegration ratio of EICP-solidified soil during the initial setting period under varying soybean powder mass concentrations and cementation solution concentrations. The results demonstrate that at a fixed soybean powder concentration, the disintegration ratio increases progressively with higher cementation solution concentrations. This phenomenon occurs because cementation solutions contain CaCl2, where unbound Ca2+ ions not participating in EICP reactions elevate cation concentration in the soil. Divalent calcium ions displace monovalent metal cations (e.g., Na+ and K+) adsorbed on clay mineral surfaces, thinning the double electric layers of soil particles and converting bound water into free water [30]. Consequently, interparticle cohesion diminishes, increasing the soil’s disintegration susceptibility. The nonlinear upward trend shows an accelerating increase rate with rising cementation solution concentration, indicating progressively stronger degradation of anti-dispersion capacity. This further confirms that at low Ca2+ concentrations, most ions participate in EICP reactions; only unbound Ca2+ significantly contributes to cation concentration elevation and free water generation.
(2)
EICP-solidified soil (curing 7 days)
Figure 18a displays the disintegration test result of EICP-solidified soil with 50 g/L soybean powder and 0.5 mol/L cementation solution. Similarly to the original soil, the specimen exhibited complete disintegration with granular accumulation at the aluminum container base and significant flocculent precipitates. Figure 18b (50 g/L soybean powder, 2.0 mol/L cementation solution) shows partial stabilization: the specimen experienced moderate disintegration with particle shedding and flocculent precipitates, though partial blocks remained intact. Compared to Figure 18a, it demonstrates that increased cementation solution concentration moderately enhances dispersion resistance under constant soybean powder concentration. Figure 18c (100 g/L soybean powder, 2 mol/L cementation solution) reveals effective stabilization: the specimen maintained structural integrity with minimal particle shedding, minor precipitates, and relatively clear water. Comparative analysis with Figure 18a,b confirms that simultaneously increasing both cementation solution and soybean powder concentrations substantially improves dispersion resistance in 7-day-cured EICP-solidified soil.
Figure 19 presents the disintegration ratio of 7-day-cured EICP-solidified soil under varying soybean powder mass concentrations and cementation solution concentrations. The results demonstrate that at a constant soybean powder concentration, the disintegration ratio decreases progressively with increasing cementation solution concentration. The steepest descent rate occurs at concentrations below 1.0 mol/L, indicating this range provides the most substantial enhancement in dispersion resistance. Beyond this threshold, the curve plateaus, showing minimal change near 2.0 mol/L. Comparing the 50 g/L and 100 g/L mass concentration of soybean powder curves reveals that a higher soybean powder concentration reduces the disintegration ratio (enhancing dispersion resistance). Notably, when above a 1.0 mol/L cementation solution, the slope k2 of the 100 g/L curve exceeds the slope k1 of the 50 g/L curve (k2 > k1), demonstrating that elevated soybean powder concentrations delay curve plateauing due to the higher urease activity enabling more efficient Ca2+ utilization in EICP reactions.
As in the previous analysis, uncured EICP-solidified soil exhibits an increasing disintegration ratio with rising cementation solution concentration under constant soybean powder mass concentration, whereas 7-day-cured EICP-solidified soil demonstrates the opposite trend: disintegration ratio decreases and dispersion resistance improves with higher cementation solution concentrations. This difference arises because uncured specimens experience elevated ionic concentrations from unbound Ca2+, converting bound water to free water, which reduces cohesion and increases disintegration; conversely, cured specimens develop aqueous-insensitive CaCO3 precipitates that cement soil particles, constraining disintegration and enhancing dispersion resistance.

3.3. Unconfined Compression Strength of Cement and ECIP-Solidified Soil

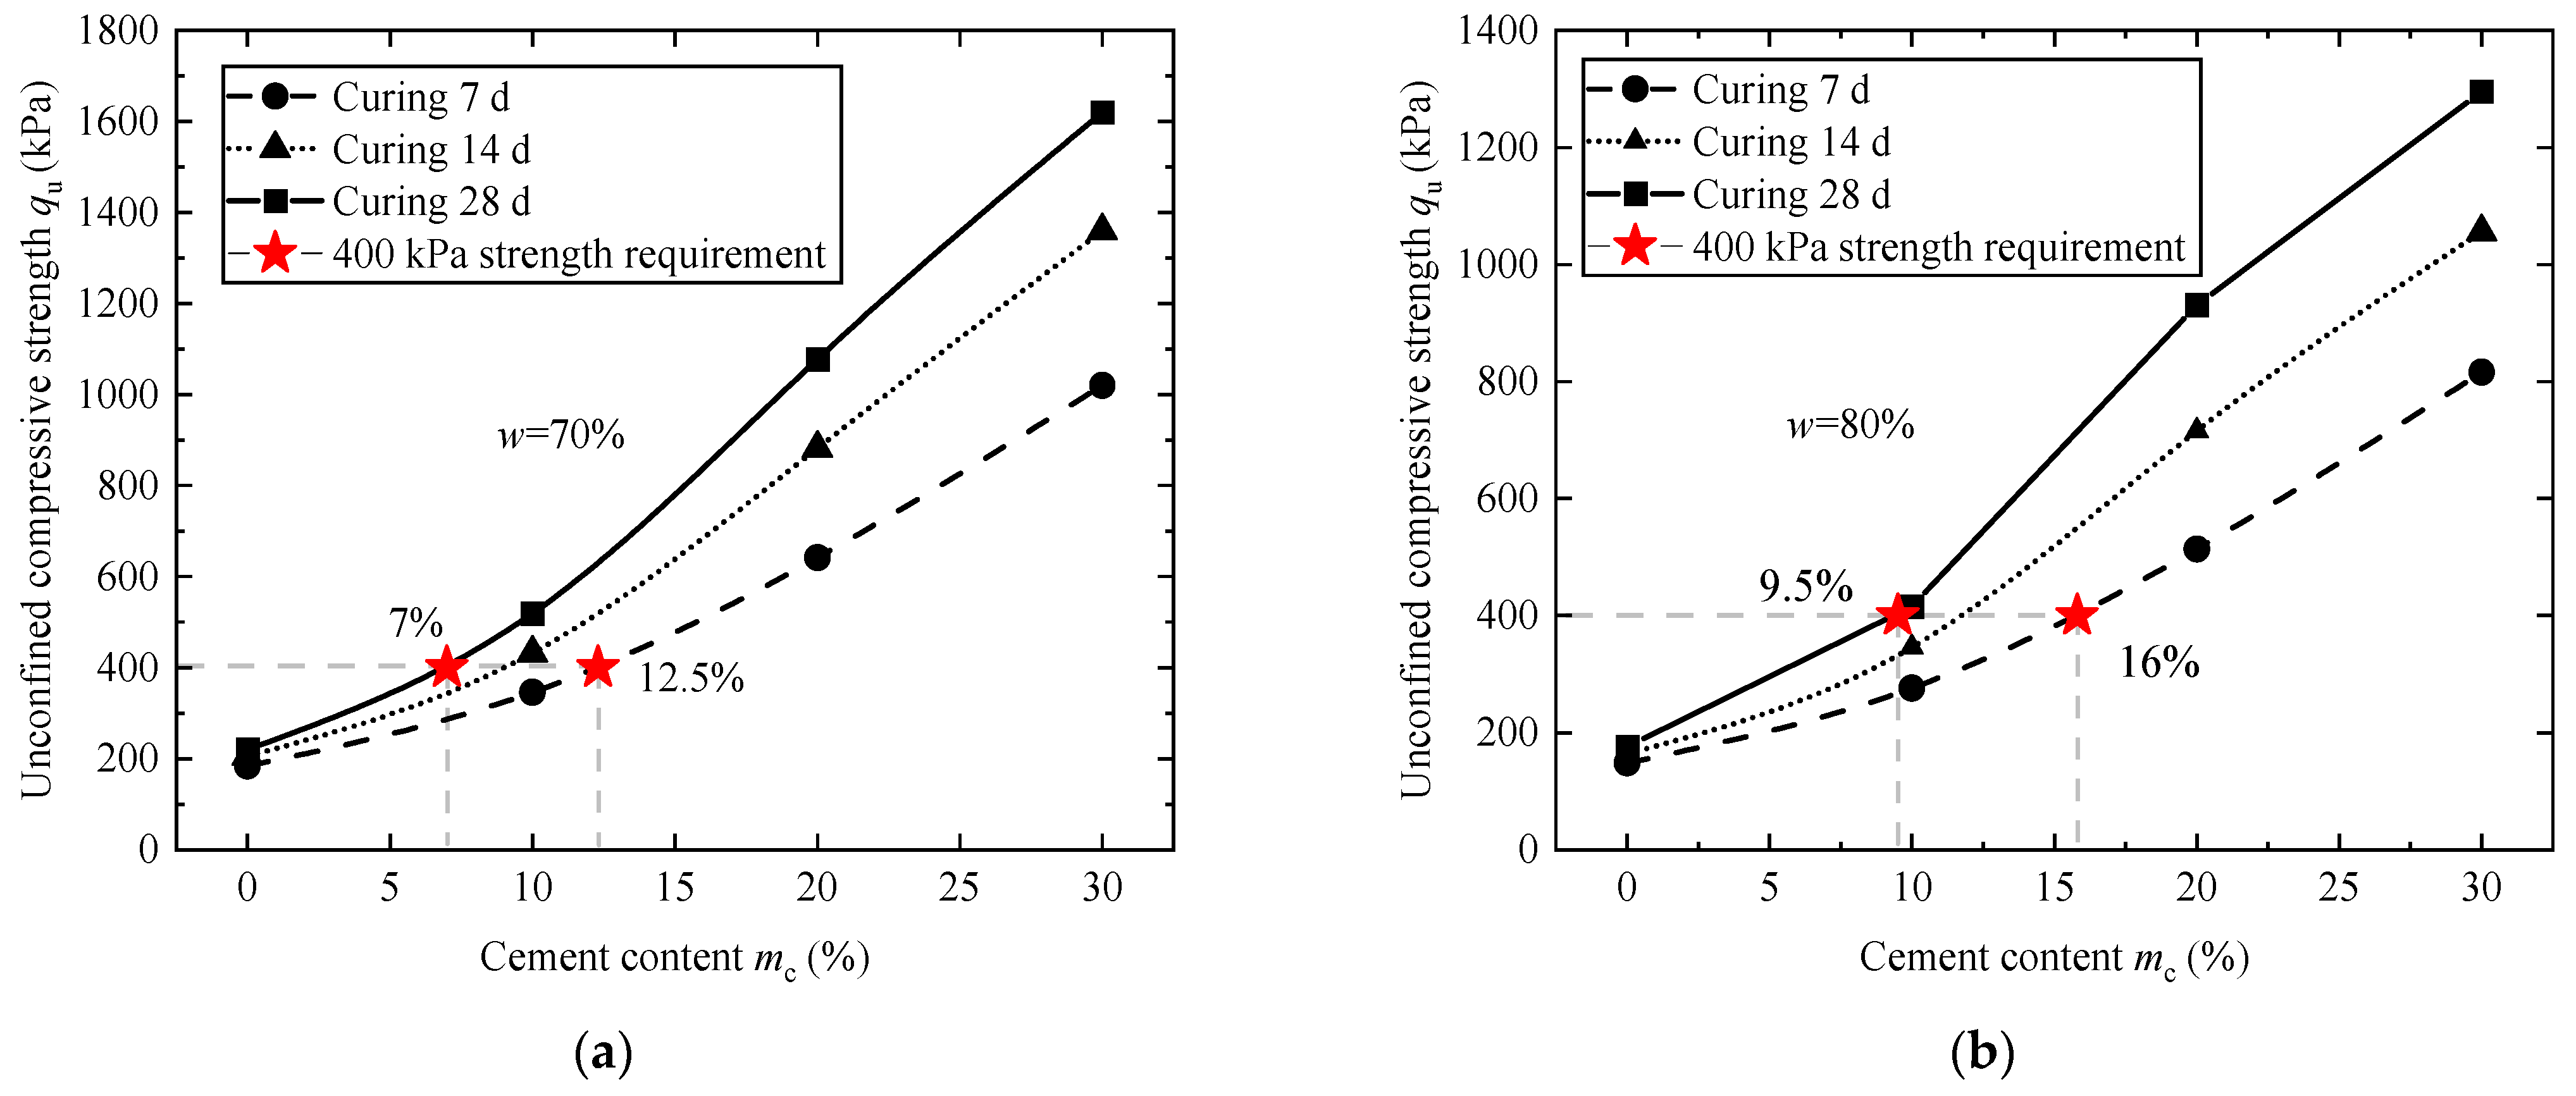
3.3.1. Unconfined Compression Strength of Cement-Solidified Soil

Figure 20 presents the unconfined compressive strength (UCS) of cement-solidified soil versus curing age under varying cement contents. The results demonstrate a nonlinear increase in UCS with prolonged curing age. Below 14 days of curing, the curve exhibits the steepest growth rate, indicating this period provides the most substantial strength enhancement. Beyond this threshold, the curve progressively plateaus, which is consistent with the study of Yao (2020) [31]. Comparative analysis of Figure 20a–c reveals that increased initial water content reduces unconfined compressive strength (UCS): under identical conditions of 28-day curing and 10% cement content, specimens with 70% initial water content achieve strength 520 kPa, while those with 80% water content yield only 416 kPa (about 20.1% reduction). This demonstrates that higher water content compromises strength development in cement-solidified soils.
Figure 21 illustrates the variation in unconfined compressive strength (UCS) of cement-solidified soil with cement content under different initial water contents, showing progressive UCS enhancement with increased cement content: below 10% cement content, the curve exhibits nonlinear growth, accelerating from gradual to rapid rates. Comparison across three curing ages confirms a positive correlation between curing duration and UCS. To achieve the required UCS > 400 kPa after 28-day curing, specimens with 70% initial water content and 12.5% cement content need 7-day curing, while those with 7.0% cement content need 28-day curing. Specimens with 80% initial water content and 16.0% cement content needs 7-day curing, while 9.5% cement content needs 28-day curing, indicating that cement-solidified soil with a higher initial water content requires more cement content addition to meet the strength requirements.

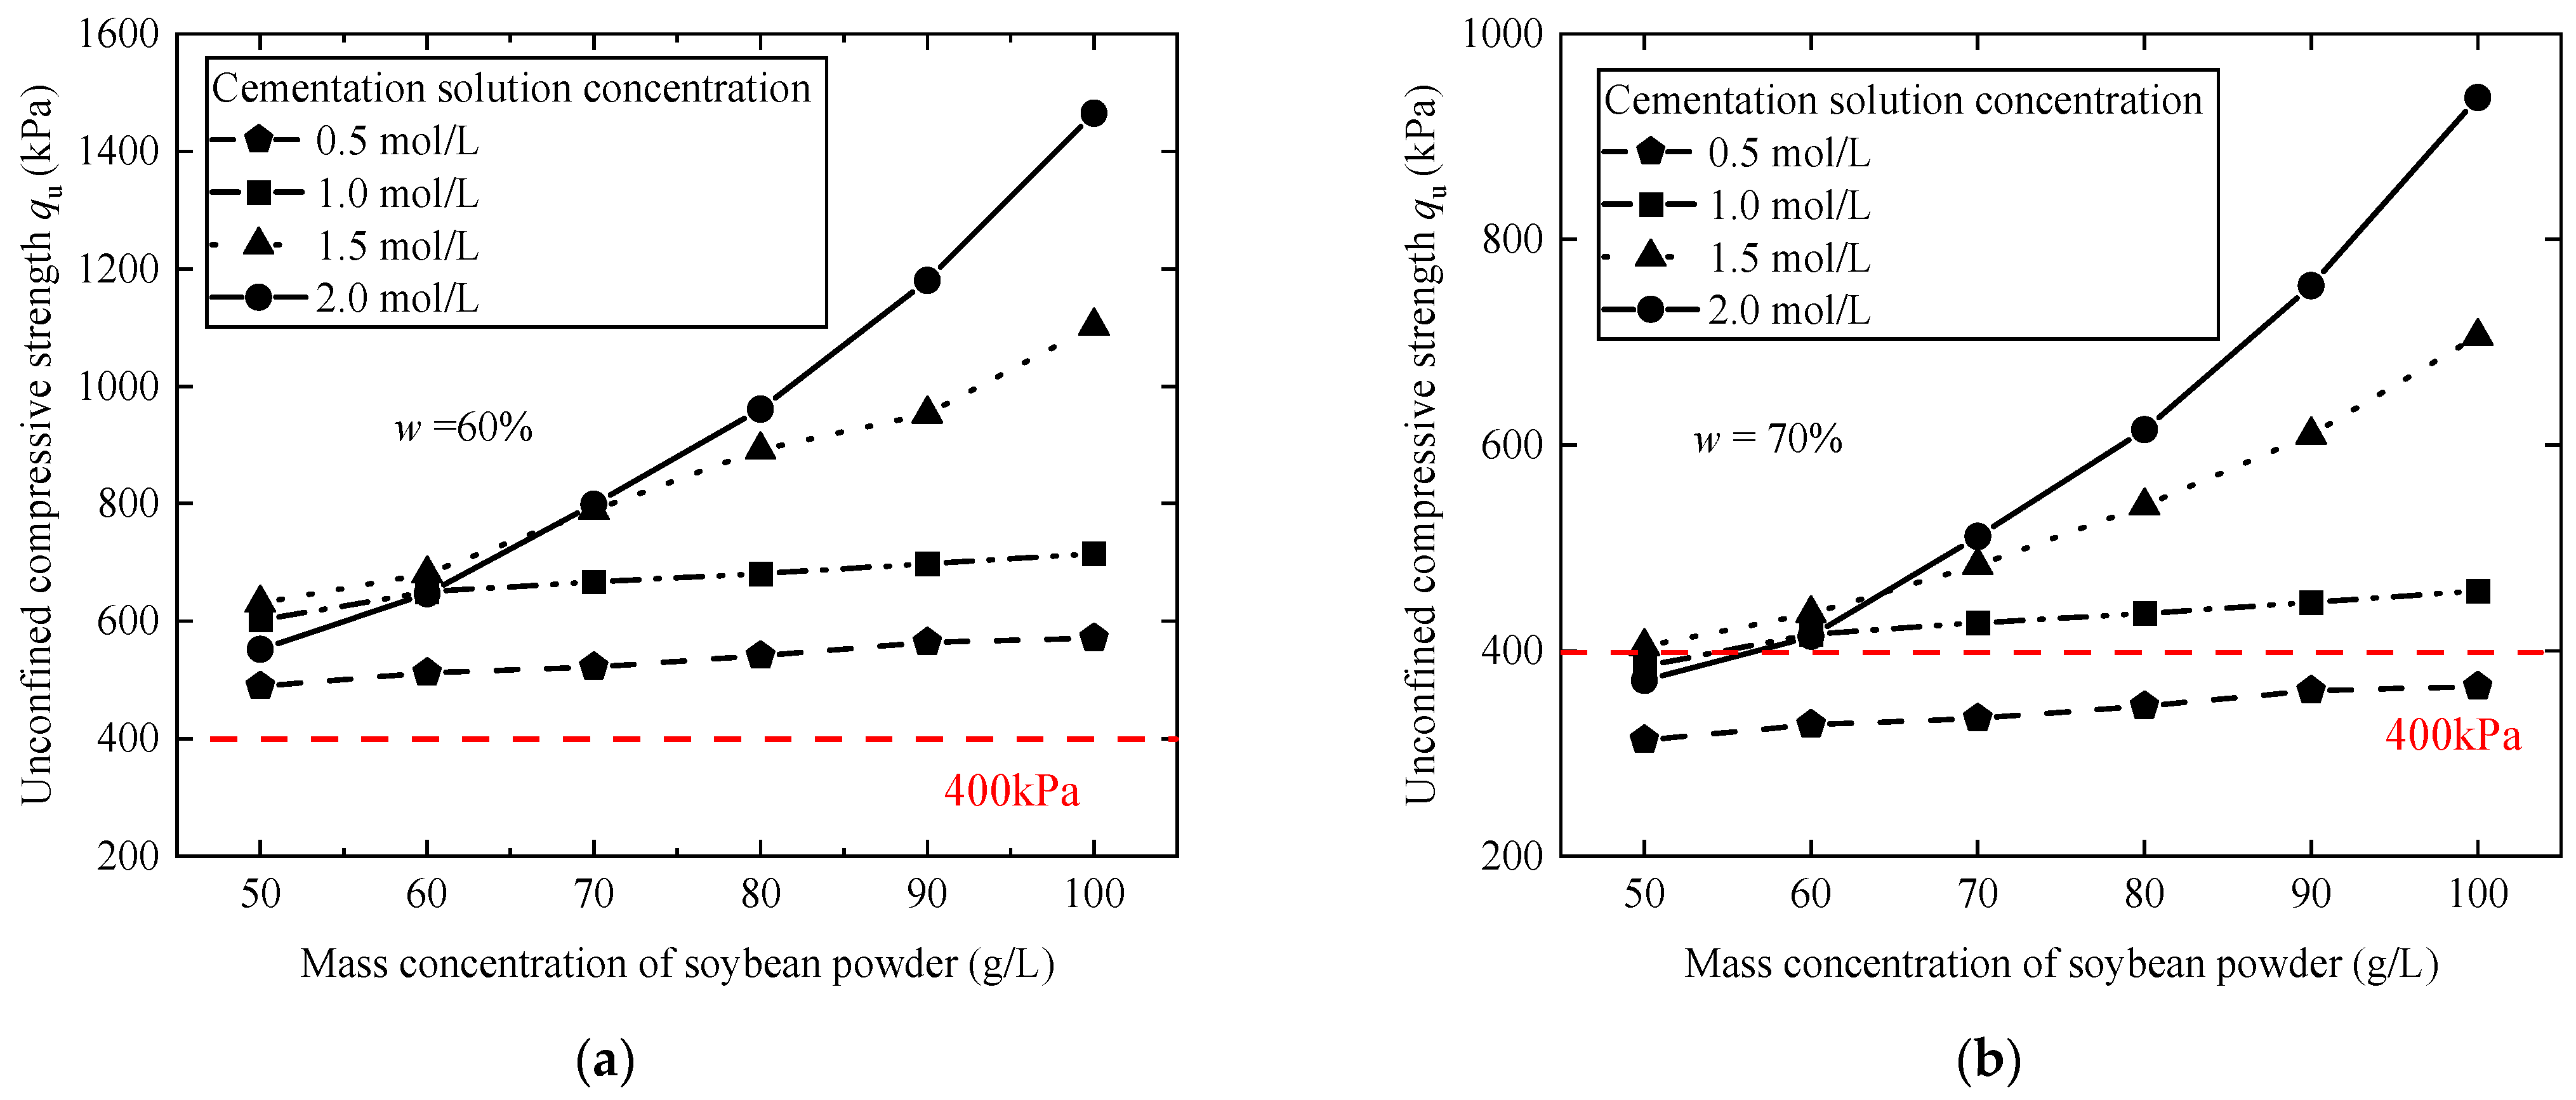
3.3.2. Unconfined Compression Strength of EICP-Solidified Soil

Figure 22 illustrates the variation in unconfined compressive strength of EICP-solidified soil with soybean powder mass concentration after 28-day curing under different initial water contents and cementation solution concentrations. It can be observed that the strength of EICP-solidified soil increased with the increase in soybean powder concentration. The trend of the curve corresponding to different concentrations of cementing solution is not the same. The curves corresponding to cementing solution concentrations of 0.5 mol/L and 1.0 mol/L show a slow linear increase trend, while the growth rate of the curves corresponding to cementing solution concentrations of 1.5 mol/L and 2.0 mol/L gradually increases. Comparing Figure 22a,b, it can be observed that increasing the initial water content will reduce the strength of EICP-solidified soil. In addition, the strength of EICP-solidified soil with a cementation solution concentration of 1.5 mol/L and a soybean powder mass concentration of 90 g/L is 953 kPa at an initial water content of 60%. Under the same conditions, when the initial water content increases to 70%, the strength of EICP-solidified soil decreases to 610 kPa, a decrease of 35.9%, indicating that higher water content will weaken the strength of ECIP-solidified soil.
Figure 23 shows the variation in unconfined compressive strength of EICP-solidified soil with the cementation solution concentration under different initial water content and soybean powder mass concentration conditions. It can be seen that as the cementation solution concentration increases, the trend of the strength of the EICP-solidified soil varies with different concentrations of soybean powder. When the cementation solution concentration is less than 1.0 mol/L, the strength of all six curves increases with increasing concentration, and the increase rate is approximately the same. When the cementation solution concentration is between 1.0 mol/L and 1.5 mol/L, the strength of all six curves increases with increasing concentration, but the rate of increase varies. The higher the mass concentration of soybean powder, the greater the slope of the curve and the faster the growth rate. When the cementation solution concentration is between 1.5 mol/L and 2.0 mol/L, the curves corresponding to the mass concentrations of 50 g/L and 60 g/L of soybean powder show a downward trend, while the curves corresponding to the mass concentrations of 70 g/L, 80 g/L, 90 g/L, and 100 g/L of soybean powder show an upward trend. It can be observed that for each concentration of soybean powder, there is an optimal range of cementation solution concentration, which results in the highest strength growth rate of EICP-solidified soil under this ratio. However, when the cementation solution concentration exceeds this range, the strength growth rate gradually decreases or even shows a negative growth trend. This is because when the concentration of the cementing solution is too high, a large amount of urea and calcium ions are not fully utilized, and the catalytic decomposition of urease in the soybean powder solution has reached its limit. In addition, the high concentration of calcium ions in the cementation solution concentration reduces urease activity [32].

4. Conclusions

This study conducted a series of fluidity tests, disintegration tests, and unconfined compressive strength (UCS) tests on cement-solidified soil and EICP-solidified soil with varying influencing parameters. The main conclusions obtained are as follows:
(1)
At the same initial water content, the fluidity of cement-solidified soil gradually decreases with the increase in cement content, and the rate of curve decline is first fast and then slow; for the same amount of cement added, the higher the initial water content of the solidified soil, the greater the fluidity of the solidified soil. The trend of the curve after normalization of water content is divided into three intervals.
(2)
At a constant cementation solution concentration, EICP-solidified soil’s fluidity decreases with higher soybean powder concentration. Higher initial water content significantly increases fluidity at the same cementation concentration. When the soybean powder concentration is constant, fluidity increases with a higher cementation solution concentration.
(3)
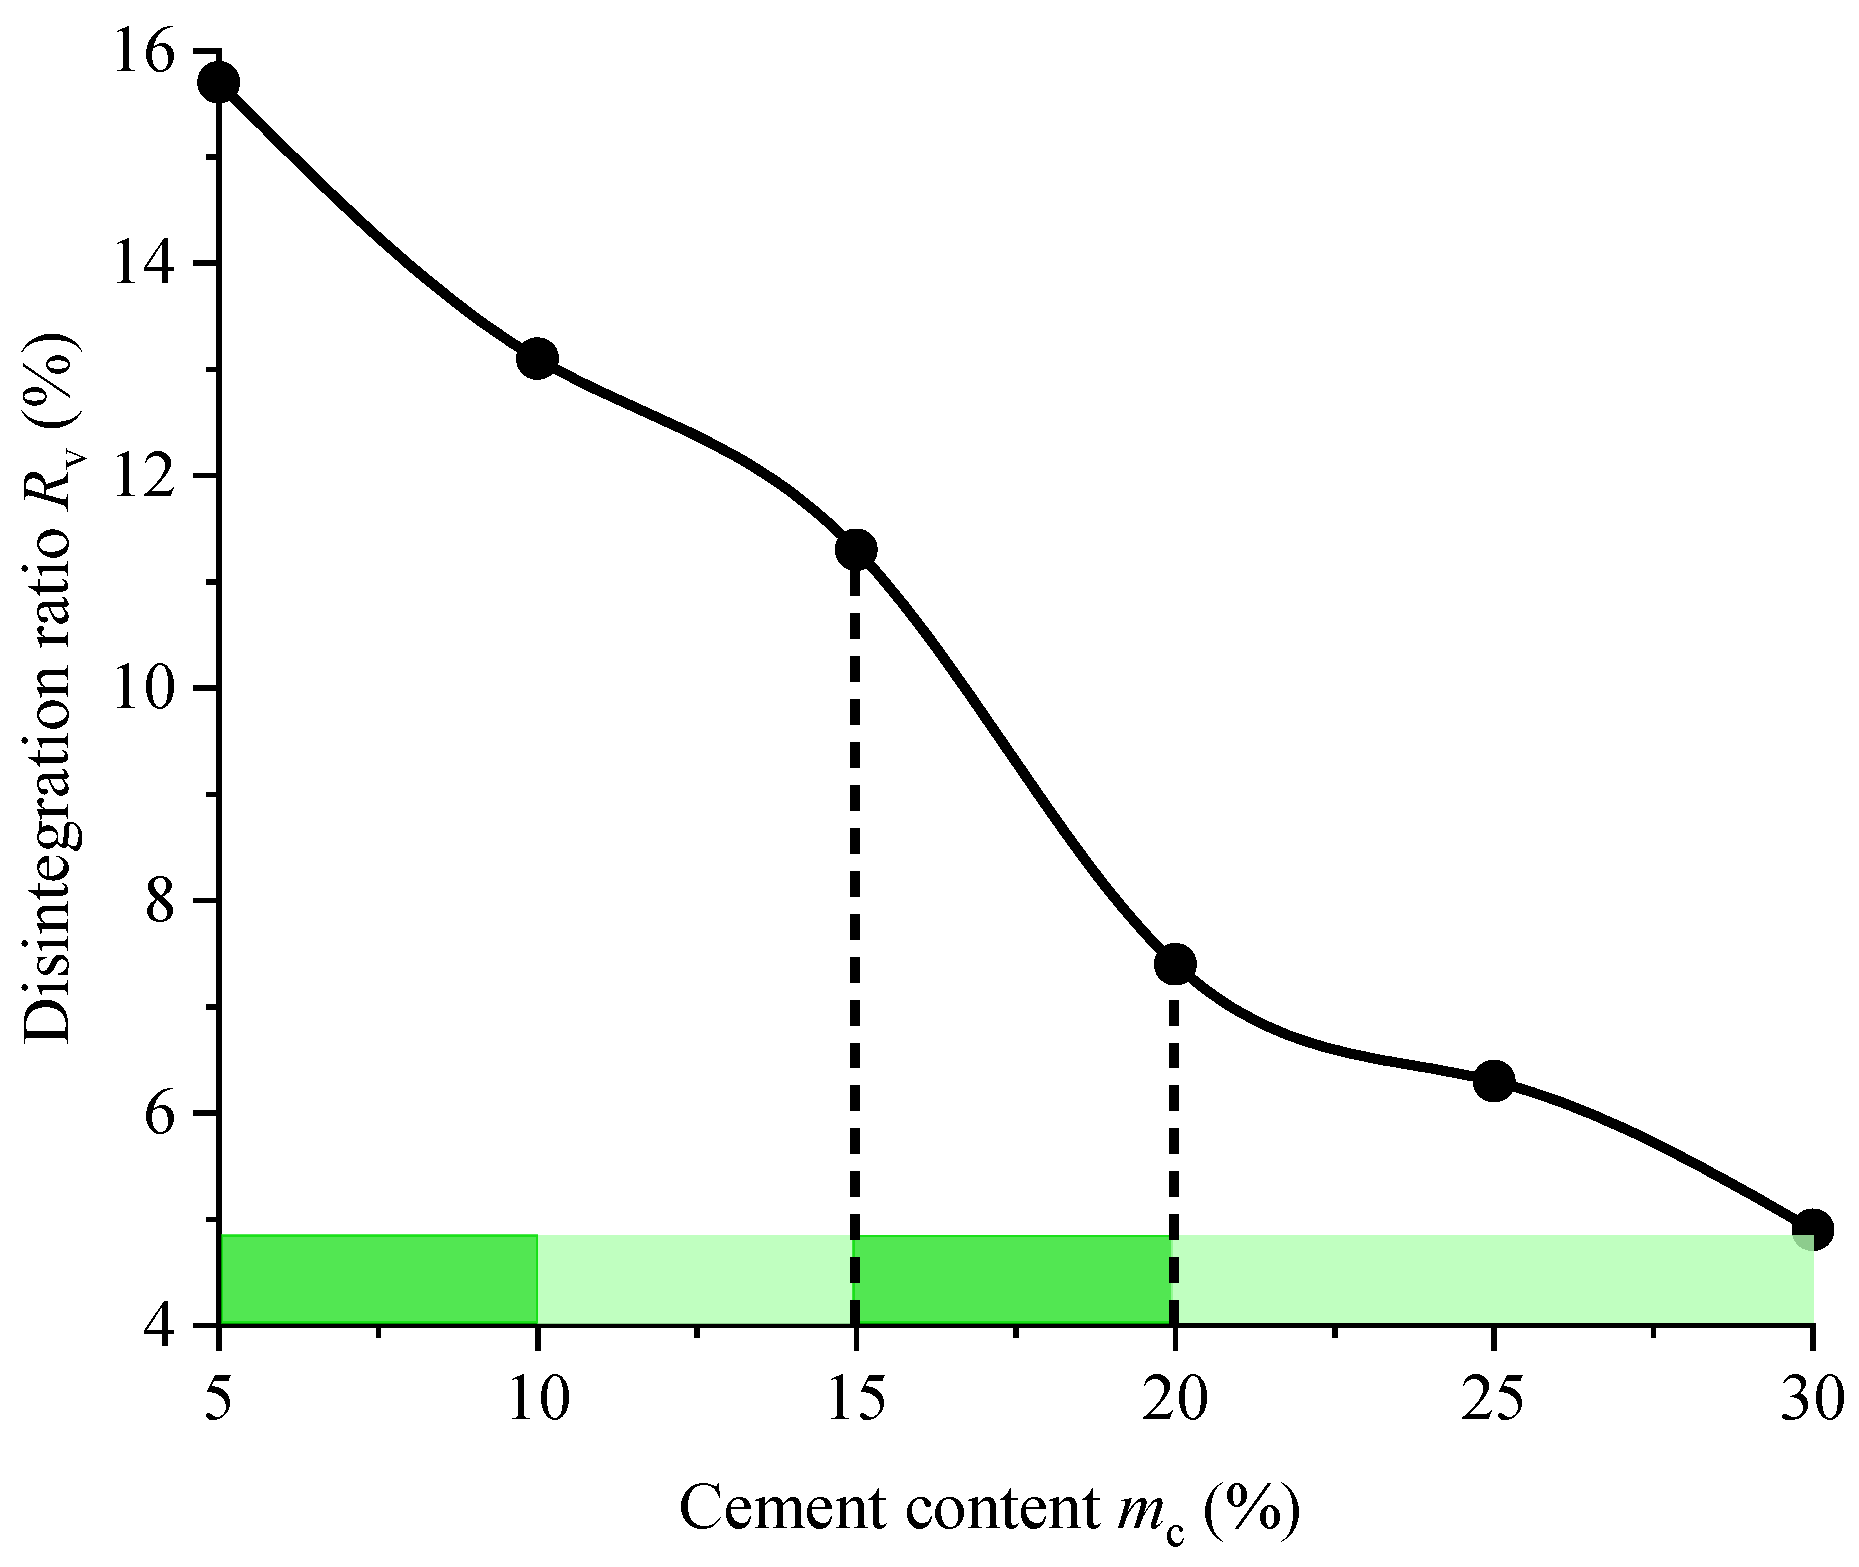
Increasing cement content during initial mixing reduces the disintegration rate of solidified soil. This decrease in disintegration rate accelerates at first and then slows down. After 7 days of curing, the disintegration rate also decreases with higher cement content, following the same trend as in the early mixing stage. The most significant improvement in anti-dispersion for 7-day-cured soil occurs at cement additions of 5–10% and 15–20%.
(4)
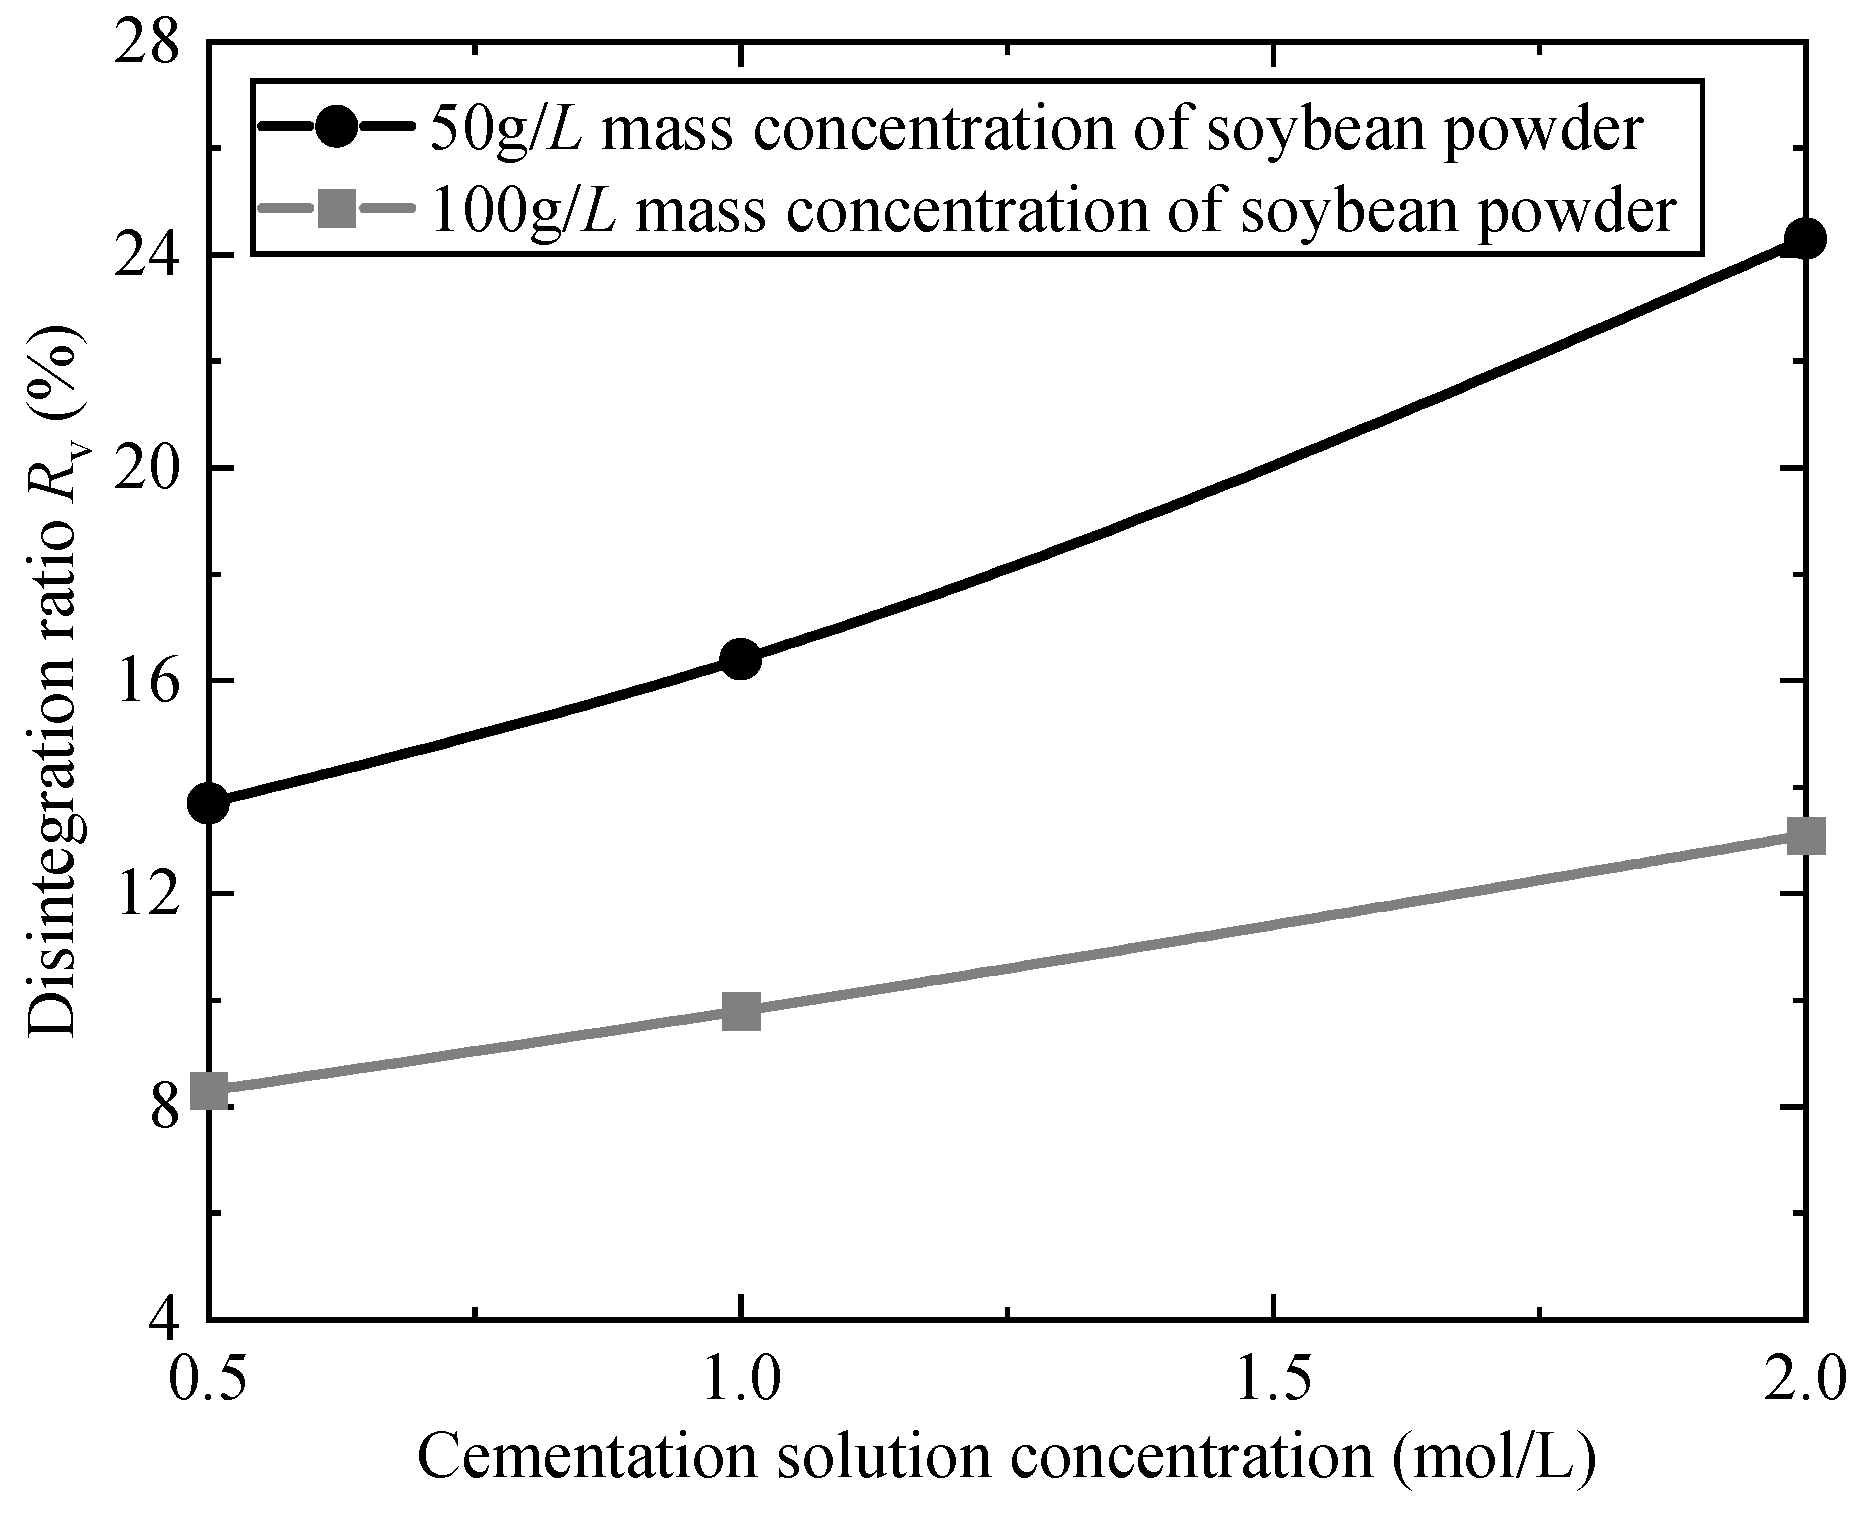
During initial mixing, EICP-solidified soil’s disintegration rate increases with a higher cementation solution concentration (at constant soybean powder concentration). As the cementation solution concentration increases, the rate of the curve increase gradually increases. After 7-day curing, disintegration decreases with higher cementation concentration. The highest reduction rate occurs below a 1.0 mol/L cementation concentration.
(5)
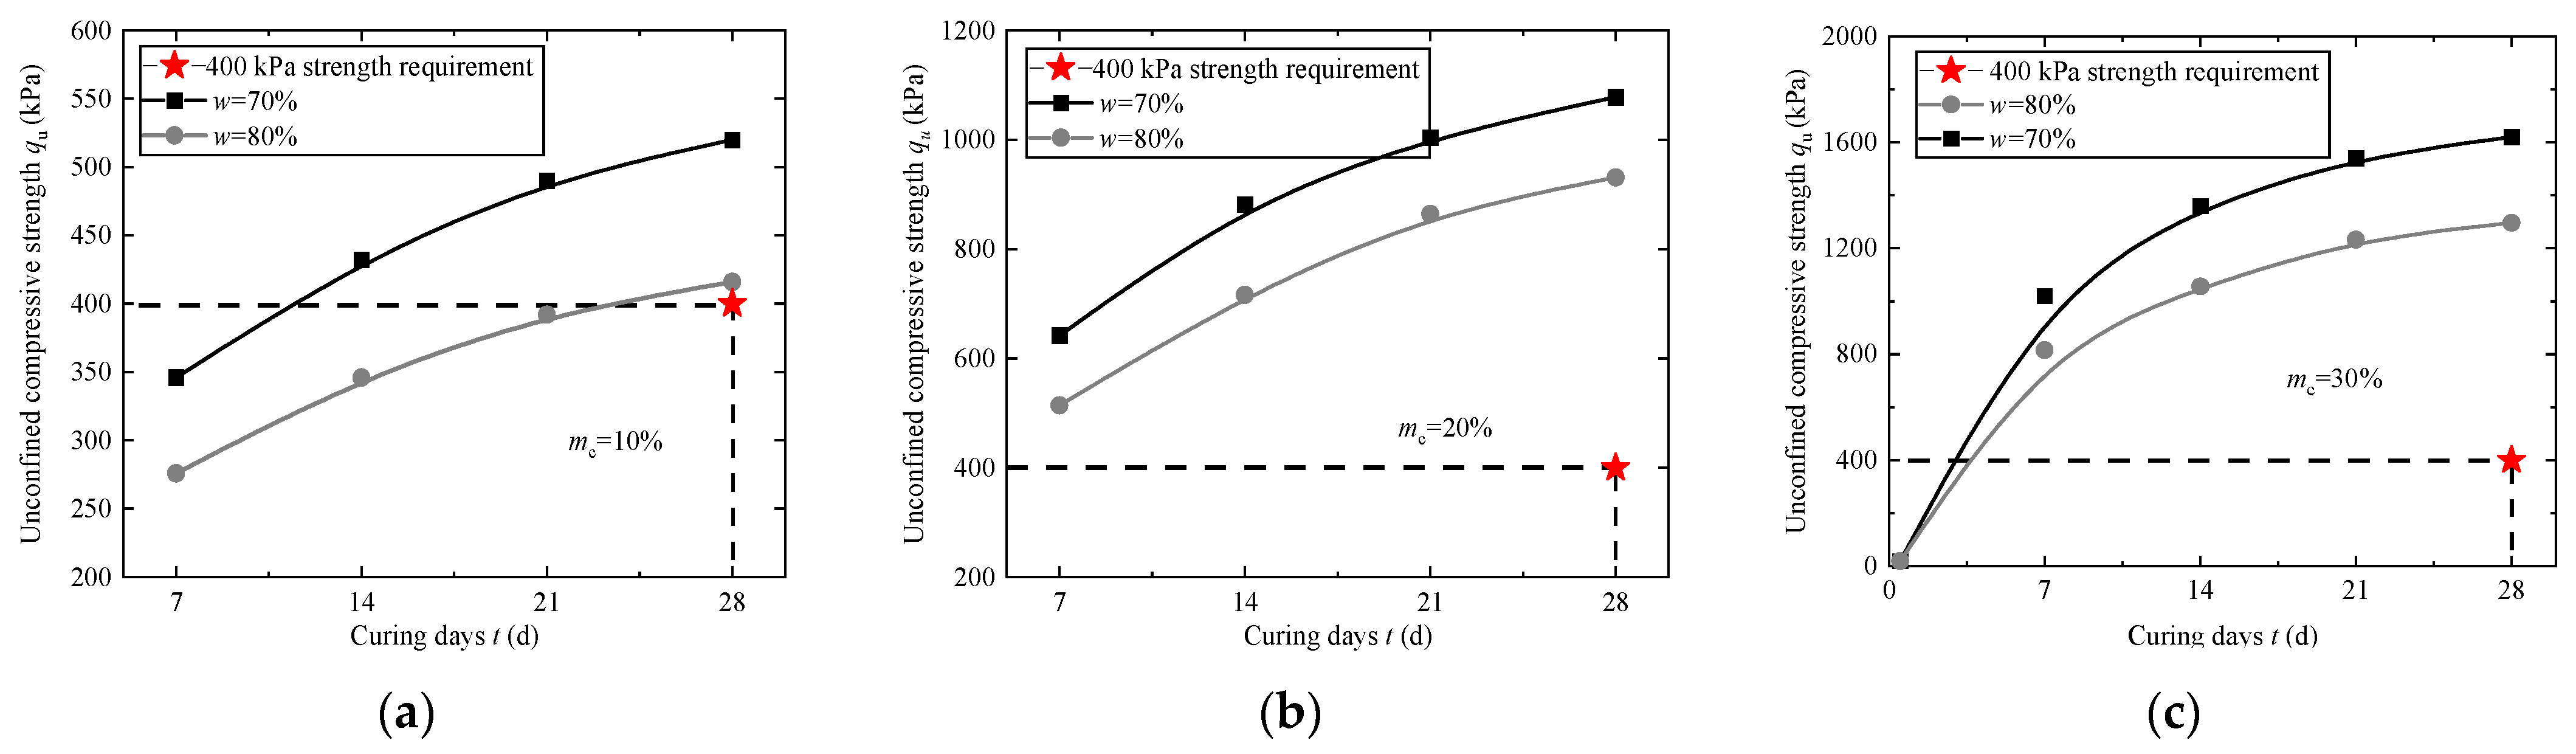
Cement-solidified soil’s strength increases with curing time, growing rapidly before 14 days then slowing. Higher initial water content reduces strength, while increased cement content boosts strength with accelerating growth. To achieve >400 kPa strength after 28-day curing, minimum cement requirements vary based on initial water content and curing duration.
(6)
Higher soybean powder concentration increases EICP-solidified soil strength, with faster growth at higher cementation concentrations. Increased initial water content reduces strength. As the cementation solution concentration increases, the trend in strength of EICP-solidified soil varies with different concentrations of soybean powder. Each soybean powder level has an optimal cementation concentration range that maximizes strength gain. Beyond this range, strength growth slows or decreases.

5. Limitations

This study was conducted under controlled laboratory conditions, which do not fully capture the complexities of field environments such as uneven reactant infiltration, temperature variability, and soil heterogeneity. In addition, parameters such as urease activity, injection rate, and multiple treatment cycles—known to influence CaCO3 distribution and strength uniformity—were not systematically investigated. The long-term durability of EICP-treated soils under environmental loads was also not assessed.

6. Future Work

Future research should focus on (1) field-scale validation of EICP techniques, including injection strategies and in situ monitoring; (2) the development of stabilized or slow-release urease formulations to enhance uniformity and efficiency; (3) the evaluation of long-term performance under special environmental conditions, especially wetting–drying and freeze–thaw cycles; and (4) predictive modeling to relate process parameters to strength gain and CaCO3 morphology.

Author Contributions

Conceptualization, W.Q.; Methodology, F.C. and Z.L.; Software, Q.Z.; Validation, Y.P.; Formal analysis, F.C. and Q.Z.; Writing—original draft, F.C. and H.O.; Writing—review & editing, W.Q., H.O., Z.L., Y.P. and G.D.; Visualization, H.O.; Supervision, W.Q. and G.D.; Project administration, G.D.; Funding acquisition, F.C., Q.Z. and G.D. All authors have read and agreed to the published version of the manuscript.

Funding

This work was supported by the Research Fund for Advanced Ocean Institute of Southeast University (Key Program KP202404), and National Natural Science Foundation of China (52378328).

Data Availability Statement

All data generated or analyzed during this study are included in this published article.

Acknowledgments

The authors wish to express their sincere thanks to the people concerned.

Conflicts of Interest

Authors Feng Cao and Qilin Zhang were employed by the company China Road & Bridge Corporation. The remaining authors declare that the research was conducted in the absence of any commercial or financial relationships that could be construed as a potential conflict of interest.

References

  1. OuYang, H.; Gong, Z.; Zhu, M.; Liu, H.; Liu, Z.; Dai, G.; Gong, W. Numerical analysis of lateral bearing capacity of monopiles in clay, part 1: Single uniform and isotropic soil layer with strength profile su = su1× z. Comput. Geotech. 2025, 184, 107294. [Google Scholar] [CrossRef]
  2. Sheng, D.; Eigenbrod, K.D.; Wriggers, P. Finite element analysis of pile installation using large-slip frictional contact. Comput. Geotech. 2005, 32, 17–26. [Google Scholar] [CrossRef]
  3. Peng, Y.; OuYang, H.; Qin, W.; Gong, W.; Dai, G. Lateral and vertical bearing characteristics of monopile and pile groups under scour condition: Model test and calculation method. Ocean Eng. 2025, 331, 121232. [Google Scholar] [CrossRef]
  4. Sarmiento, J.; Guanche, R.; Losada, I.; Rosendo, E.; Guindo, A.; de Guevara, J.L. Scour processes around pile clusters of jacket foundations under steady currents. Ocean Eng. 2024, 313, 119502. [Google Scholar] [CrossRef]
  5. Wang, S.-Y.; Qi, W.-G.; Gao, F.-P.; Li, B.; He, B. Time development of clear-water scour around a pile foundation: Phenomenological theory of turbulence-based approach. Coast. Eng. 2024, 190, 104511. [Google Scholar] [CrossRef]
  6. Horpibulsuk, S.; Katkan, W.; Sirilerdwattana, W.; Rachan, R. Strength development in cement stabilized low plasticity and coarse grained soils: Laboratory and field study. Soils Found. 2006, 46, 351–366. [Google Scholar] [CrossRef]
  7. Abu-Farsakh, M.; Dhakal, S.; Chen, Q. Laboratory characterization of cementitiously treated/stabilized very weak subgrade soil under cyclic loading. Soils Found. 2015, 55, 504–516. [Google Scholar] [CrossRef]
  8. Ifediniru, C.; Ekeocha, N.E. Performance of cement-stabilized weak subgrade for highway embankment construction in Southeast Nigeria. Int. J. Geo-Eng. 2022, 13, 1. [Google Scholar] [CrossRef]
  9. Ardah, A.; Chen, Q.; Abu-Farsakh, M. Evaluating the performance of very weak subgrade soils treated/stabilized with cementitious materials for sustainable pavements. Transp. Geotech. 2017, 11, 107–119. [Google Scholar] [CrossRef]
  10. Pongsivasathit, S.; Horpibulsuk, S.; Piyaphipat, S. Assessment of mechanical properties of cement stabilized soils. Case Stud. Constr. Mater. 2019, 11, e00301. [Google Scholar] [CrossRef]
  11. Wei, X.; Ku, T. New design chart for geotechnical ground improvement: Characterizing cement-stabilized sand. Acta Geotech. 2020, 15, 999–1011. [Google Scholar] [CrossRef]
  12. Wang, J.; Xie, J.; Wu, Y.; Wang, C.; Liang, F. An investigation of the effect of utilizing solidified soil as scour protection for offshore wind turbine foundations via a simplified scour resistance test. J. Mar. Sci. Eng. 2022, 10, 1317. [Google Scholar] [CrossRef]
  13. OuYang, H.; Dai, G.; Gao, L.; Zhu, W.; Du, S.; Gong, W. Local scour characteristics of monopile foundation and scour protection of cement-improved soil in marine environment-Laboratory and site investigation. Ocean Eng. 2022, 255, 111443. [Google Scholar] [CrossRef]
  14. OuYang, H.; Chen, X.; Gong, Z.; Zuo, C.; Dai, G.; Gong, W. Large-scale model test study on lateral bearing characteristics of semi-rigid pile with cement-soil reinforcement under multistage loading and unidirectional multi-cycle loading in clay. Soil Dyn. Earthq. Eng. 2025, 195, 109421. [Google Scholar] [CrossRef]
  15. Zahri, A.M.; Zainorabidin, A. An overview of traditional and non traditional stabilizer for soft soil. In IOP Conference Series: Materials Science and Engineering; IOP Publishing: Bristol, UK, 2019; p. 012015. [Google Scholar]
  16. Almajed, A.; Abbas, H.; Arab, M.; Alsabhan, A.; Hamid, W.; Al-Salloum, Y. Enzyme-Induced Carbonate Precipitation (EICP)-Based methods for ecofriendly stabilization of different types of natural sands. J. Clean. Prod. 2020, 274, 122627. [Google Scholar] [CrossRef]
  17. Lee, S.; Kim, J. An experimental study on enzymatic-induced carbonate precipitation using yellow soybeans for soil stabilization. KSCE J. Civ. Eng. 2020, 24, 2026–2037. [Google Scholar] [CrossRef]
  18. Almajed, A.; Lateef, M.A.; Moghal, A.A.B.; Lemboye, K. State-of-the-art review of the applicability and challenges of microbial-induced calcite precipitation (MICP) and enzyme-induced calcite precipitation (EICP) techniques for geotechnical and geoenvironmental applications. Crystals 2021, 11, 370. [Google Scholar] [CrossRef]
  19. Saif, A.; Cuccurullo, A.; Gallipoli, D.; Perlot, C.; Bruno, A.W. Advances in enzyme induced carbonate precipitation and application to soil improvement: A review. Materials 2022, 15, 950. [Google Scholar] [CrossRef]
  20. Li, R.; Wu, X.; Chen, J. Numerical study on residual rate of fluidized solidified slurry in pumping for scour repair around monopile. Ocean Eng. 2023, 276, 114072. [Google Scholar] [CrossRef]
  21. Wu, X.-N.; Li, R.-Y.; Shu, J.; Tang, C.; Chen, J.-J.; Wang, H.-L.; Jiang, H.-L.; Wang, X. Experimental Study on Engineering Behavior of Solidified Soil for Scour Repair and Protection. China Ocean. Eng. 2024, 38, 625–635. [Google Scholar] [CrossRef]
  22. GB/T 50123-2019; Standard for Geotechnical Testing Method. Beijing China Planning Publishing House: Beijing, China, 2019.
  23. Whiffin, V.S.; Van, P.L.A.; Harkes, M.P. Microbial Carbonate Precipitation as a Soil Improvement Technique. Geomicrobiology 2007, 24, 417–423. [Google Scholar] [CrossRef]
  24. GB/T 50080-2002; Standard for Test Method of Performance on Ordinary Fresh Concrete. China Architecture & Building Press: Beijing, China, 2016.
  25. GB/T 2419-2005; Test Method for Fluidity of Cement Mortar. Standards Press of China: Beijing, China, 2005.
  26. SL 251-2015; Code for Investigation of Natural Building Material for Water resources and Hydropower Project. China Water & Power Press: Beijing, China, 2015.
  27. Zhao, Q.; Li, L.; Li, C.; Li, M.D.; Amini, F.; Zhang, H.Z. Factors Affecting Improvement of Engineering Properties of MICP-Treated Soil Catalyzed by Bacteria and Urease. J. Mater. Civ. Eng. 2014, 26, 04014094. [Google Scholar] [CrossRef]
  28. Zhou, M.; Li, P.; Luo, X.; Shi, D.; Zhang, H. Application of solidified soil in scour protection of foundations in offshore windpower engineering. J. Waterw. Harb. 2023, 44, 264–269. [Google Scholar]
  29. Jiahui, C. Experimental Study on MICP Solidification of Muddy Soil. Master’s Thesis, Wuhan University of Science and Technology, Wuhan, China, 2021. [Google Scholar]
  30. Oste, L.A.; Temminghoff, E.J.; Riemsdijk, W.V. Solid-solution partitioning of organic matter in soils as influenced by an increase in pH or Ca concentration. Environ. Sci. Technol. 2002, 36, 208–214. [Google Scholar] [CrossRef]
  31. Yao, K.; Pan, Y.; Jia, L.; Yi, J.T.; Hu, J.; Wu, C. Strength evaluation of marine clay stabilized by cementitious binder. Mar. Georesour. Geotechnol. 2020, 38, 730–743. [Google Scholar] [CrossRef]
  32. Zhao, Q. Experimental Study on Soil Improvement Using Microbial Induced Calcite Precipitation (MICP). Ph.D. Thesis, China University of Geosciences, Beijing, China, 2014. [Google Scholar]
Figure 1. Grain size distribution of experimental soil.
Jmse 13 01323 g001
Figure 2. Fluidity test of solidified soil. (a) Test schematic; (b) Truncated conical mold.
Jmse 13 01323 g002
Figure 3. Schematic of disintegration test for fresh-state solidified soil.
Jmse 13 01323 g003
Figure 4. Fluidity test results of original soil specimens at varying water contents: (a) w = 30%, D = 60 mm; (b) w = 45%, D = 96 mm; (c) w = 60%, D = 105 mm; (d) w = 75%, D = 192 mm.
Jmse 13 01323 g004
Figure 5. Flow spread vs. water content relationship in original soil.
Jmse 13 01323 g005
Figure 6. Flow spread test results of cement-solidified soil with varying water contents and cement contents: (a) w = 60%, mc = 30%, D = 60 mm; (b) w = 60%, mc = 20%, D = 67 mm; (c) w = 60%, mc = 10%, D = 88 mm; (d) w = 70%, mc = 30%, D = 101 mm; (e) w = 70%, mc = 20%, D = 113 mm; (f) w = 70%, mc = 10%, D = 142 mm.
Jmse 13 01323 g006aJmse 13 01323 g006b
Figure 7. Flow spread of cement-solidified soil versus cement content at varying initial water contents.
Jmse 13 01323 g007
Figure 8. Flow spread of cement-solidified soil versus initial water content at different cement contents: (a) mc = 0%; (b) mc = 10%; (c) mc = 20%; (d) mc = 30%.
Jmse 13 01323 g008
Figure 9. Fitted relationship between absolute flow spread and normalized water content for cement-solidified soil with varying initial water contents: (a) w = 60%; (b) w = 70%; (c) w = 80%; (d) w = 90%.
Jmse 13 01323 g009
Figure 10. Flow spread test results of EICP-solidified soil. (a) Concentration of soybean powder 50 g/L, cementation solution concentration 0.5 mol/L, w = 60%, D = 91 mm; (b) concentration of soybean powder 80 g/L, cementation solution concentration 0.5 mol/L, w = 60%, D = 78 mm; (c) concentration of soybean powder 100 g/L, cementation solution concentration 0.5 mol/L, w = 60%, D = 70 mm; (d) concentration of soybean powder 100 g/L, cementation solution concentration 0.5 mol/L, w = 60%, D = 70 mm; (e) concentration of soybean powder 100 g/L, cementation solution concentration 1.0 mol/L, w = 60%, D = 74 mm; (f) concentration of soybean powder 100 g/L, cementation solution concentration 2.0 mol/L, w = 60%, D = 81 mm.
Jmse 13 01323 g010
Figure 11. Flow spread of EICP-solidified soil versus soybean powder mass concentration at varying cementation solution concentrations: (a) cementation solution concentration 0.5 mol/L; (b) cementation solution concentration 1.0 mol/L; (c) cementation solution concentration 1.5 mol/L; (d) cementation solution concentration 2.0 mol/L.
Jmse 13 01323 g011
Figure 12. Flow spread of EICP-solidified soil versus cementation solution concentration at varying soybean powder mass concentrations. (a) Mass concentration of soybean powder 50 g/L; (b) mass concentration of soybean powder 60 g/L; (c) mass concentration of soybean powder 70 g/L; (d) mass concentration of soybean powder 80 g/L.
Jmse 13 01323 g012
Figure 13. Disintegration test of cement-solidified soil with no curing age (fresh state). (a) mc = 10%; (b) mc = 20%; (c) mc = 30%.
Jmse 13 01323 g013
Figure 14. Variation in disintegration ratio with cement content for cement-solidified soil with no curing age.
Jmse 13 01323 g014
Figure 15. Disintegration tests of cement-solidified soil after 7-day curing. (a) mc = 10%; (b) mc = 20%; (c) mc = 30%.
Jmse 13 01323 g015
Figure 16. Variation in disintegration ratio with cement content for cement-solidified soil after 7-day curing.
Jmse 13 01323 g016
Figure 17. Variation in disintegration ratio with cementation solution concentration for EICP-solidified soil with no curing.
Jmse 13 01323 g017
Figure 18. Disintegration tests of EICP-solidified soil after 7 days of curing. (a) Mass concentration of soybean powder 50 g/L, cementation solution concentration 0.5 mol/L; (b) mass concentration of soybean powder 50 g/L, cementation solution concentration 2.0 mol/L; (c) mass concentration of soybean powder 100 g/L, cementation solution concentration 2.0 mol/L.
Jmse 13 01323 g018
Figure 19. Variation in disintegration ratio with cementation solution concentration for EICP-solidified soil after 7 days of curing.
Jmse 13 01323 g019
Figure 20. Variation in strength with curing age for cement-solidified soil under varying cement content and water content: (a) mc = 10%; (b) mc = 20%; (c) mc = 30%.
Jmse 13 01323 g020
Figure 21. Variation in strength with cement content for cement-solidified soil under varying curing ages and water content. (a) w = 70%; (b) w = 80%.
Jmse 13 01323 g021
Figure 22. Variation in strength with mass concentration of soybean powder for EICP-solidified soil under varying water contents and cementation solution concentrations. (a) w = 60%; (b) w = 70%.
Jmse 13 01323 g022
Figure 23. Variation in strength with cementation solution concentration for EICP-solidified soil under varying water contents and mass concentrations of soybean powder. (a) w = 60%; (b) w = 70%.
Jmse 13 01323 g023
Table 1. Parameters of experimental soil.
Soil Specific GravityUnit Weight (kN/m3)Water Content wLiquid Limit wlPlastic Limit wpPlasticity Index IpLiquid Index Il
silty clay2.7416.669.3%63.8%38.1%25.7%12.1%
Table 2. Fluidity test of cement and ECIP-solidified soil.
Types of Solidified SoilSoil Initial Water Content w (%)Cement Content mc (%)Mass Concentration of Soybean Powder (g/L)Cementation Solution Concentration (mol/L)
Cement-solidified soil60, 70, 80, 900, 5, 10, 15, 20, 25, 30//
ECIP-solidified soil50, 60, 70/50, 60, 70, 80, 90, 1000.5, 1.0, 1.5, 2.0
Table 3. Disintegration test of cement and ECIP-solidified soil.
Types of Solidified SoilInitial Water Content w (%)Cement Content
mc (%)
Mass Concentration of Soybean Powder (g/L)Cementation Solution Concentration (mol/L)
Cement-solidified soil (no curing age)705, 10, 15, 20, 25, 30//
Cement-solidified soil (curing 7 days)705, 10, 15, 20, 25, 30//
ECIP-solidified soil (no curing age)60/50, 1000.5, 1.0, 2.0
ECIP-solidified soil (curing 7 days)60/50, 1000.5, 1.0, 2.0
Table 4. Unconfined compression strength test of cement and ECIP-solidified soil.
Types of Solidified SoilInitial Water Content w (%)Cement Content mc (%)Curing Age (d)Mass Concentration of Soybean Powder (g/L)Cementation Solution Concentration (mol/L)
Cement-solidified soil70, 800, 5, 10, 15, 20, 25, 307, 14, 21, 28//
ECIP-solidified soil60, 70/2850, 60, 70, 80, 90, 1000.5, 1.0, 1.5, 2.0
Disclaimer/Publisher’s Note: The statements, opinions and data contained in all publications are solely those of the individual author(s) and contributor(s) and not of MDPI and/or the editor(s). MDPI and/or the editor(s) disclaim responsibility for any injury to people or property resulting from any ideas, methods, instructions or products referred to in the content.

