Article

Numerical Simulation of Seabed Response Around Monopile Under Wave–Vibration

1
School of Civil Engineering, Hunan University of Science and Technology, Xiangtan 411201, China
2
School of Hydraulic and Ocean Engineering, Changsha University of Science & Technology, Changsha 410114, China
*
Author to whom correspondence should be addressed.
J. Mar. Sci. Eng. 2025, 13(7), 1309; https://doi.org/10.3390/jmse13071309
Submission received: 7 June 2025 / Revised: 3 July 2025 / Accepted: 4 July 2025 / Published: 6 July 2025
(This article belongs to the Section Ocean Engineering)

Abstract

Monopile foundation is an important foundation form for offshore wind turbines, and the stability of the seabed around it is affected by the combined effects of wave and pile vibration. Based on the Biot consolidation theory and elastoplastic constitutive model, a multi-physical field coupling model of wave–vibration–seabed–monopile is constructed, and the dynamic characteristics of seabed pore pressure around the monopile under the joint action of wave–vibration are systematically investigated, and the influences of waves, vibrations, and seabed parameters on the distribution of pore pressure amplitude are analysed in depth. The results show that the increase in wave incident energy will increase the seabed wave pressure, and the suction and pressure generated by pile vibration will change the soil force state; the coupling of waves and vibrations results in pile displacement difference, causing the seabed pore pressure dissipation depth dissimilarity, and the peak relative amplitude of pore pressure and the peak of vibration displacement are in a linear relationship; the wave parameters and seabed characteristics have a significant effect on the change in pore pressure amplitude distribution.

1. Introduction

Faced with the twin challenges of traditional fossil energy scarcity and environmental pollution, China, as the world’s largest energy consumer, urgently needs to transform its energy structure. This is not only to cope with the depletion of domestic non-renewable resources, but also as a key initiative to achieve the strategic goal of “carbon peak by 2030 and carbon neutrality by 2060” [1]. In this context, offshore wind turbines have been widely used as a clean energy source worldwide [2,3,4]. The monopile foundation is the main support structure for offshore wind turbines [5,6,7,8], used for 79% of offshore wind turbines in Europe [9], and is also commonly used as the typical foundation structure for coastal wind farms in China [10]. Seabed liquefaction and instability are the key factors affecting the stability of offshore wind power monopile foundation [11,12,13]. Under the coupling effect of waves and vibrations, the dynamic pressure distribution around the seabed will change significantly, which will cause a sharp change in pore water pressure near the single pile foundation, and even seabed liquefaction, affecting the safety of the structure. Therefore, it is the key to ensuring the long-term stable operation of the structure to study the dynamic response law of the seabed around the single pile foundation under the combined action of waves and vibrations.
Seabed response around offshore monopile foundations is a key scientific problem that needs to be addressed urgently in offshore engineering design [14]. Since the 1970s, research on seabed response under wave loading has formed a systematic theoretical framework, which mainly focuses on the core mechanisms such as the dynamic evolution of pore water pressure, effective stress redistribution, and displacement field characteristics [15,16]. Biot [17,18] pioneered the establishment of the porous media deformation theory, which first reveals the nature of consolidation in soil settlement, and his development of the three-dimensional consolidation theory laid the theoretical foundation for seabed response studies. Yamamoto [19] derived the analytical solution of pore water pressure and displacement under wave action for the first time and verified the distribution of pore water pressure in coarse and fine sand layers by the wave flume test. Jeng [20] further proposed the three-dimensional analytical solution of seabed response under wave action, established a new three-dimensional liquefaction criterion, and systematically elucidated the key controlling factors affecting the seabed stability of the seabed. Sumer [21] revealed the physical mechanism of residual liquefaction of the seabed under wave loading by the wave flume test and confirmed that particle rearrangement caused by soil shear stress is the dominant factor of pore water pressure accumulation. Sui [22] simulated the pore pressure field, stress field, and displacement field around a monopile foundation based on porous elasticity theory by using a complete dynamic formulation system and found that the wave diffraction and reflection effects have significant influence on the pore pressure and soil displacement around the pile. Zhang [23] revealed the seabed response characteristics around a monopile under irregular wave action through wave flume tests, confirming that the increase in wave height and period significantly increases the pore water pressure around the pile, while the maximum pore water pressure shows a decreasing trend with increasing seabed depth.
However, the monopile foundation is further subjected to cyclic lateral loads caused by turbine rotor mass imbalance and turbine blade rotation, in addition to the conventional dynamic loads due to wave propagation [24]. Jeng [25] developed a comprehensive model to simulate the vibration of a monopile and its seabed response and investigated the effects of pile vibration period and amplitude on the development of pore water pressure. The results showed that the monopile vibration frequency and amplitude are important factors leading to the increase in the maximum pore water pressure. Yu [26] investigated the effect of vibration of monopile foundations on seabed response by physical modelling tests. The study shows that the vibration load force, vibration frequency, and vibration amplitude have a significant influence on the various characteristics of pore pressure response around the monopile foundation. Liao [27] used the numerical simulation method to innovatively study the characteristics of seabed pore pressure response caused by pile swaying effect and found that the swaying motion significantly changes the dynamic distribution pattern of pore water pressure in the soil around the pile and aggravates the nonlinear cumulative effect. Zhang [28] investigated the pile–soil interaction considering pile vibration using numerical simulation methods and similar conclusions were reached. It was also concluded that pile vibration leads to a local increase in pore pressure at the top of the seabed around the pile. The above studies show that vibration has a significant effect on the seabed response, but there is a lack of in-depth analysis on the mechanism of wave–vibration–seabed–monopile multi-physical field coupling, and the existing numerical simulation studies are mostly limited to a single loading condition, with less consideration of the characteristics of the seabed response under the joint action of wave–vibration, and the understanding of the temporal and spatial pore water pressure evolution around the piles under the influence of the key control parameter is still insufficient.
In this study, the dynamic response characteristics of the seabed around the monopile under the joint action of wave–vibration are investigated by considering the pile vibration effect. Based on the finite element software ABAQUS2021, a multi-physical field coupling numerical model of wave–vibration–seabed–monopile is constructed, focusing on the influence of wave parameters and vibration characteristics on the oscillatory response of the seabed pore pressure around the monopile, in-depth analysis of the seabed characteristics of the control mechanism of the spatial distribution of the amplitude of the pore pressure, and exploration and analysis of the quantitative comparison of the characteristics of the response of the pore pressure under the joint action of wave–vibration and under a single loading condition. The research results reveal the seabed pore water pressure response law around the monopile foundation when subjected to the combined effects of waves and vibrations. This provides a theoretical basis for the design of monopile foundations for offshore wind power.

2. Numerical Theory

2.1. Control Equations

Seabed soils are three-phase porous materials consisting of soil skeleton, seawater, and air rather than continuous materials [29,30]. In such soils, the change in the ratio of the three phases can lead to a change in the properties of the seabed soils, making them more complex. Therefore, this study is based on the seepage consolidation equation proposed by Biot [17,18] as the controlling equation of the soil dynamic response model to investigate the dynamic response of the seabed soil under the joint action of wave–vibration.
Equilibrium and conservation equations for seabed soils in the three-dimensional case:
σ x x + τ x y y + τ x z z = P s x
τ x y x + σ y y + τ y z z = P s y
τ x z x + σ y z y + σ z z + ρ g = P S z
k 2 P s γ w n β P s t + k ρ f 2 ε t 2 = γ w ε t
ε = u s x + v s y + w s z
where  u s v s , and  w s  are the displacements of the soil in the x, y, and z directions, respectively; n is the porosity;  σ x σ y , and  σ z  are the effective stresses in the three directions, respectively;  τ x y τ x z , and  τ y z  are the shear stresses in the three directions;  P s  is the pore water pressure;  ρ = n ρ f + ( 1 n ) ρ s  is the average pore fluid density;  ρ f  is the fluid density;  ρ s  is the solid density; k is the permeability coefficient; g is the acceleration of gravity;  γ w  is the weight of water;  ε  is the volumetric strain of the soil; β is the fluid compression coefficient.

2.2. Seabed Constitutive Model

Seabed soil is an elastoplastic material, so in this study the linear elastic model was chosen for the elastic model and the Mohr–Coulomb model was chosen for the plastic model.
Effective stresses in three directions in the poroelastic model are as follows:
σ x = 2 G u s x + v ε 1 2 v
σ y = 2 G v s y + v ε 1 2 v
σ z = 2 G w s z + v ε 1 2 v
τ x y = 2 G u s y + v s x = τ y x
τ z y = 2 G v s z + w s y = τ y z
τ x z = 2 G u s z + w s x = τ z x
Substituting Equations (6)–(11) into the equilibrium Equations (1) and (2) gives the following expressions:
G 2 u s + G 1 2 v ε x = P s x
G 2 v s + G 1 2 v ε y = P s y
G 2 w s + G 1 2 v ε z + ρ g = P s z
In the above equation, G is the shear modulus of elasticity, where the effective stress is determined by multiplying the corresponding strain by the corresponding ‘elasticity matrix’ D.
σ = D ε
where  σ  is the effective stress matrix and  ε  is the strain matrix, in three dimensions, the elasticity matrix D can be expressed as follows:
D = E 1 v 1 + v 1 2 v E v 1 + v 1 2 v E v 1 + v 1 2 v E v 1 + v 1 2 v E 1 v 1 + v 1 2 v E v 1 + v 1 2 v E v 1 + v 1 2 v E v 1 + v 1 2 v E 1 v 1 + v 1 2 v 0 0 0 0 0 0 0 0 0 0 0 0 0 0 0 0 0 0 E 2 1 + v 0 0 0 E 2 1 + v 0 0 0 E 2 1 + v
where E is the modulus of elasticity and  υ  is the Poisson’s ratio.

3. Model Setup

3.1. Model Building

Due to the limitations of computer power and computation time in numerical simulation, reasonable computational boundary conditions must be set. Currently, the commonly used boundary conditions mainly include periodic boundary [31] and fixed boundary conditions [32]. The study by Ye and Jeng [33] showed that when the distance between the measurement point and the fixed boundary is more than about 0.9 times the wavelength, the effect of the fixed boundary conditions on the wave power response is negligible. Therefore, the length of the seabed model in this study is assumed to be 2.2 times the wavelength to eliminate the effect of the fixed lateral boundary on the pore pressure response of the seabed. The calculation model of offshore monopile foundation established is a simplified model, as can be seen from Figure 1; the height of the monopile foundation is 50 m, the diameter is 5 m, followed by a monopile buried depth of 15 m and a density of 7800 kg/m3, the monopile is a steel pipe pile, the modulus of elasticity is 3 × 10¹² N/m2, and the Poisson’s ratio is 0.2. The seabed soils were modelled using the Mohr–Coulomb elastoplastic model, in which the length of the seabed model was set at 120 m, the thickness of the model was 40 m, the width of the model was 60 m, the pore water gravity was 9.8 kN/m3, the coefficient of lateral earth pressure was 0.42, Poisson’s ratio was 0.3, shear modulus was 1.5 × 10⁷ N/m2, porosity was 0.46, and density of the soils was 2000 kg/m3.
The seabed is modelled using 3D eight-node cells with pore pressure degrees of freedom (C3D8P), with a total of 48,064 cells and a global grid size of 0.5 m. The grid is locally encrypted within 10 m of the single pile foundation so that the minimum grid size is 1 m in the near pile area and the maximum grid size is 5 m in the far pile area. The monopile foundations are modelled using 3D eight-node cells (C3D8) with a total of 1600 cells and a global grid size of 1 m. As for the boundary conditions, the seabed bottom surface is fixed with displacement in x, y, and z directions, the left and right sides are constrained for displacement in x direction, and the front and back sides are constrained for displacement in y direction; the bottom is set as an impermeable boundary, while the surface is subjected to wave force and pore pressure by ABAQUS user subroutines DLOAD and DSIP. The contact surface of the monopile foundation with the seabed assumes bound contact, and the contact relationship is set between the bottom surface of the pile and the seabed surface, where the pile surface is the master surface, and the seabed surface is the slave surface. The vibration effect is realised by applying periodic horizontal displacements at the top of the pile, and the displacement amplitude is set by using ABAQUS displacement boundary conditions to complete the coupled calculation of the wave, vibration, and seabed module.

3.2. Model Validation

3.2.1. Seabed Model Validation

A comparative validation study was carried out based on the analytical solution of Hsu and Jeng [34], and the model parameters were set with reference to their model. In order to effectively reduce the boundary influence and diffraction effect, the length of the seabed model in the numerical simulation was set as 2.2 times of the wavelength. The length of the seabed model was set to 200 m, the wavelength was set to 88.8 m, the depth of the seabed was set to 30 m, the water depth was set to 20 m, the period was set to 10 s, and the wave height was set to 2.0 m. The data of the points on the seabed central axis were extracted and compared with the results of the analytical solution. Figure 2 shows the fitting effect of the numerical results of the pore pressure amplitude distribution along the seabed depth direction in fine sand compared with the results of the analytical solution, where P0 denotes the amplitude of the wave pressure acting on the surface of the seabed soil body, and the expression is  P 0 = γ w H / 2 cosh k d , where k is the wave number. Figure 3 shows the comparison between the numerical results of the pore water pressure over time curves at different seabed depths in fine sand and the analytical results. Comparing Figure 2 and Figure 3, it can be found that there is a certain error between the numerical results and the analytical results, which may be due to the errors generated by the boundary condition setting and grid division of the numerical model, but the numerical model results of the seabed and the analytical results are consistent with the trend of the change, and the fitting results of the two have a better agreement, indicating that the established seabed model has a high reliability. This demonstrates the high reliability of the established seabed model.
To further verify the reliability of the seabed model, a model validation study is carried out based on the one-dimensional cylinder experimental data by Liu [35], and the simulation parameters are set with reference to the physical experimental settings. Figure 4 shows the comparison results between the seabed model and the one-dimensional cylinder experiment, where the red dots indicate the physical experimental data, and the black solid line is the numerical simulation results. By comparing the time evolution curves of the pore water pressure at different depths, it can be seen that there is a certain deviation between the numerical simulation and the physical model results, which may be due to the influence of the seabed settlement caused by the wave loading on the distribution of the pore water pressure in the experiment. However, both show good consistency in the change trend and good fitting effect, which indicates that the seabed model established in this study has high reliability and can effectively reflect the response characteristics of the seabed under wave loading.

3.2.2. Vibration Model Validation

Current studies on the response of the seabed around piles under pile vibration are limited, so verifying the accuracy of the pile vibration model is crucial for further studies. In this study, the influence of pile vibration on the soil around the pile under lateral cyclic loading was studied by comparing the physical model test results of [36]. Hansen’s test used three sets of pore pressure sensors to measure the pore water pressure at 2 cm, 7 cm, and 12 cm from the water–soil interface. The test included coarse sand and fine sand. In this study, the coarse sand test data were selected for comparison, and the model parameters were consistent with the test settings. Figure 5 shows the vertical pore pressure distributions of the numerical simulation results (black dashed lines) and the test data (red squares) at R = 2 cm, 7 cm, and 12 cm from the seabed mudline, and the results show that the two changes have the same trend and the fit is good. Despite the differences in research methods and boundary conditions, this study’s model can accurately reflect the effect of pile vibration on soil response. This verifies the model’s applicability and reliability.

4. Results and Discussion

4.1. Test Condition Setting

In the test, wave loads were applied using DLOAD and DISP subroutines written in FORTRAN, and the vibration effect of the monopile was realised by applying periodic horizontal displacement to its top. Table 1 shows the test conditions under the combined effect of wave and vibration. In this study, the wave height (H = 2 m, 2.5 m, 3 m, 3.5 m), wave period (Tb = 4 s, 5 s, 6 s, 7 s), peak vibration displacement (Xp = 10 mm, 20 mm, 30 mm, 40 mm), vibration period (T = 4 s, 5 s, 6 s, 7 s), permeability coefficient (k = 1 × 10⁻³ m/s, 1 × 10⁻⁴ m/s, 1 × 10⁻⁵ m/s, 1 × 10⁻⁶ m/s), saturation (Sr = 0.97, 0.98, 0.99, 1.0), and the effects of different wave parameters, vibration characteristics, and changes in seabed characteristics on the dynamic response of the seabed around the monopile foundation under the combined effect of waves and vibrations were investigated.

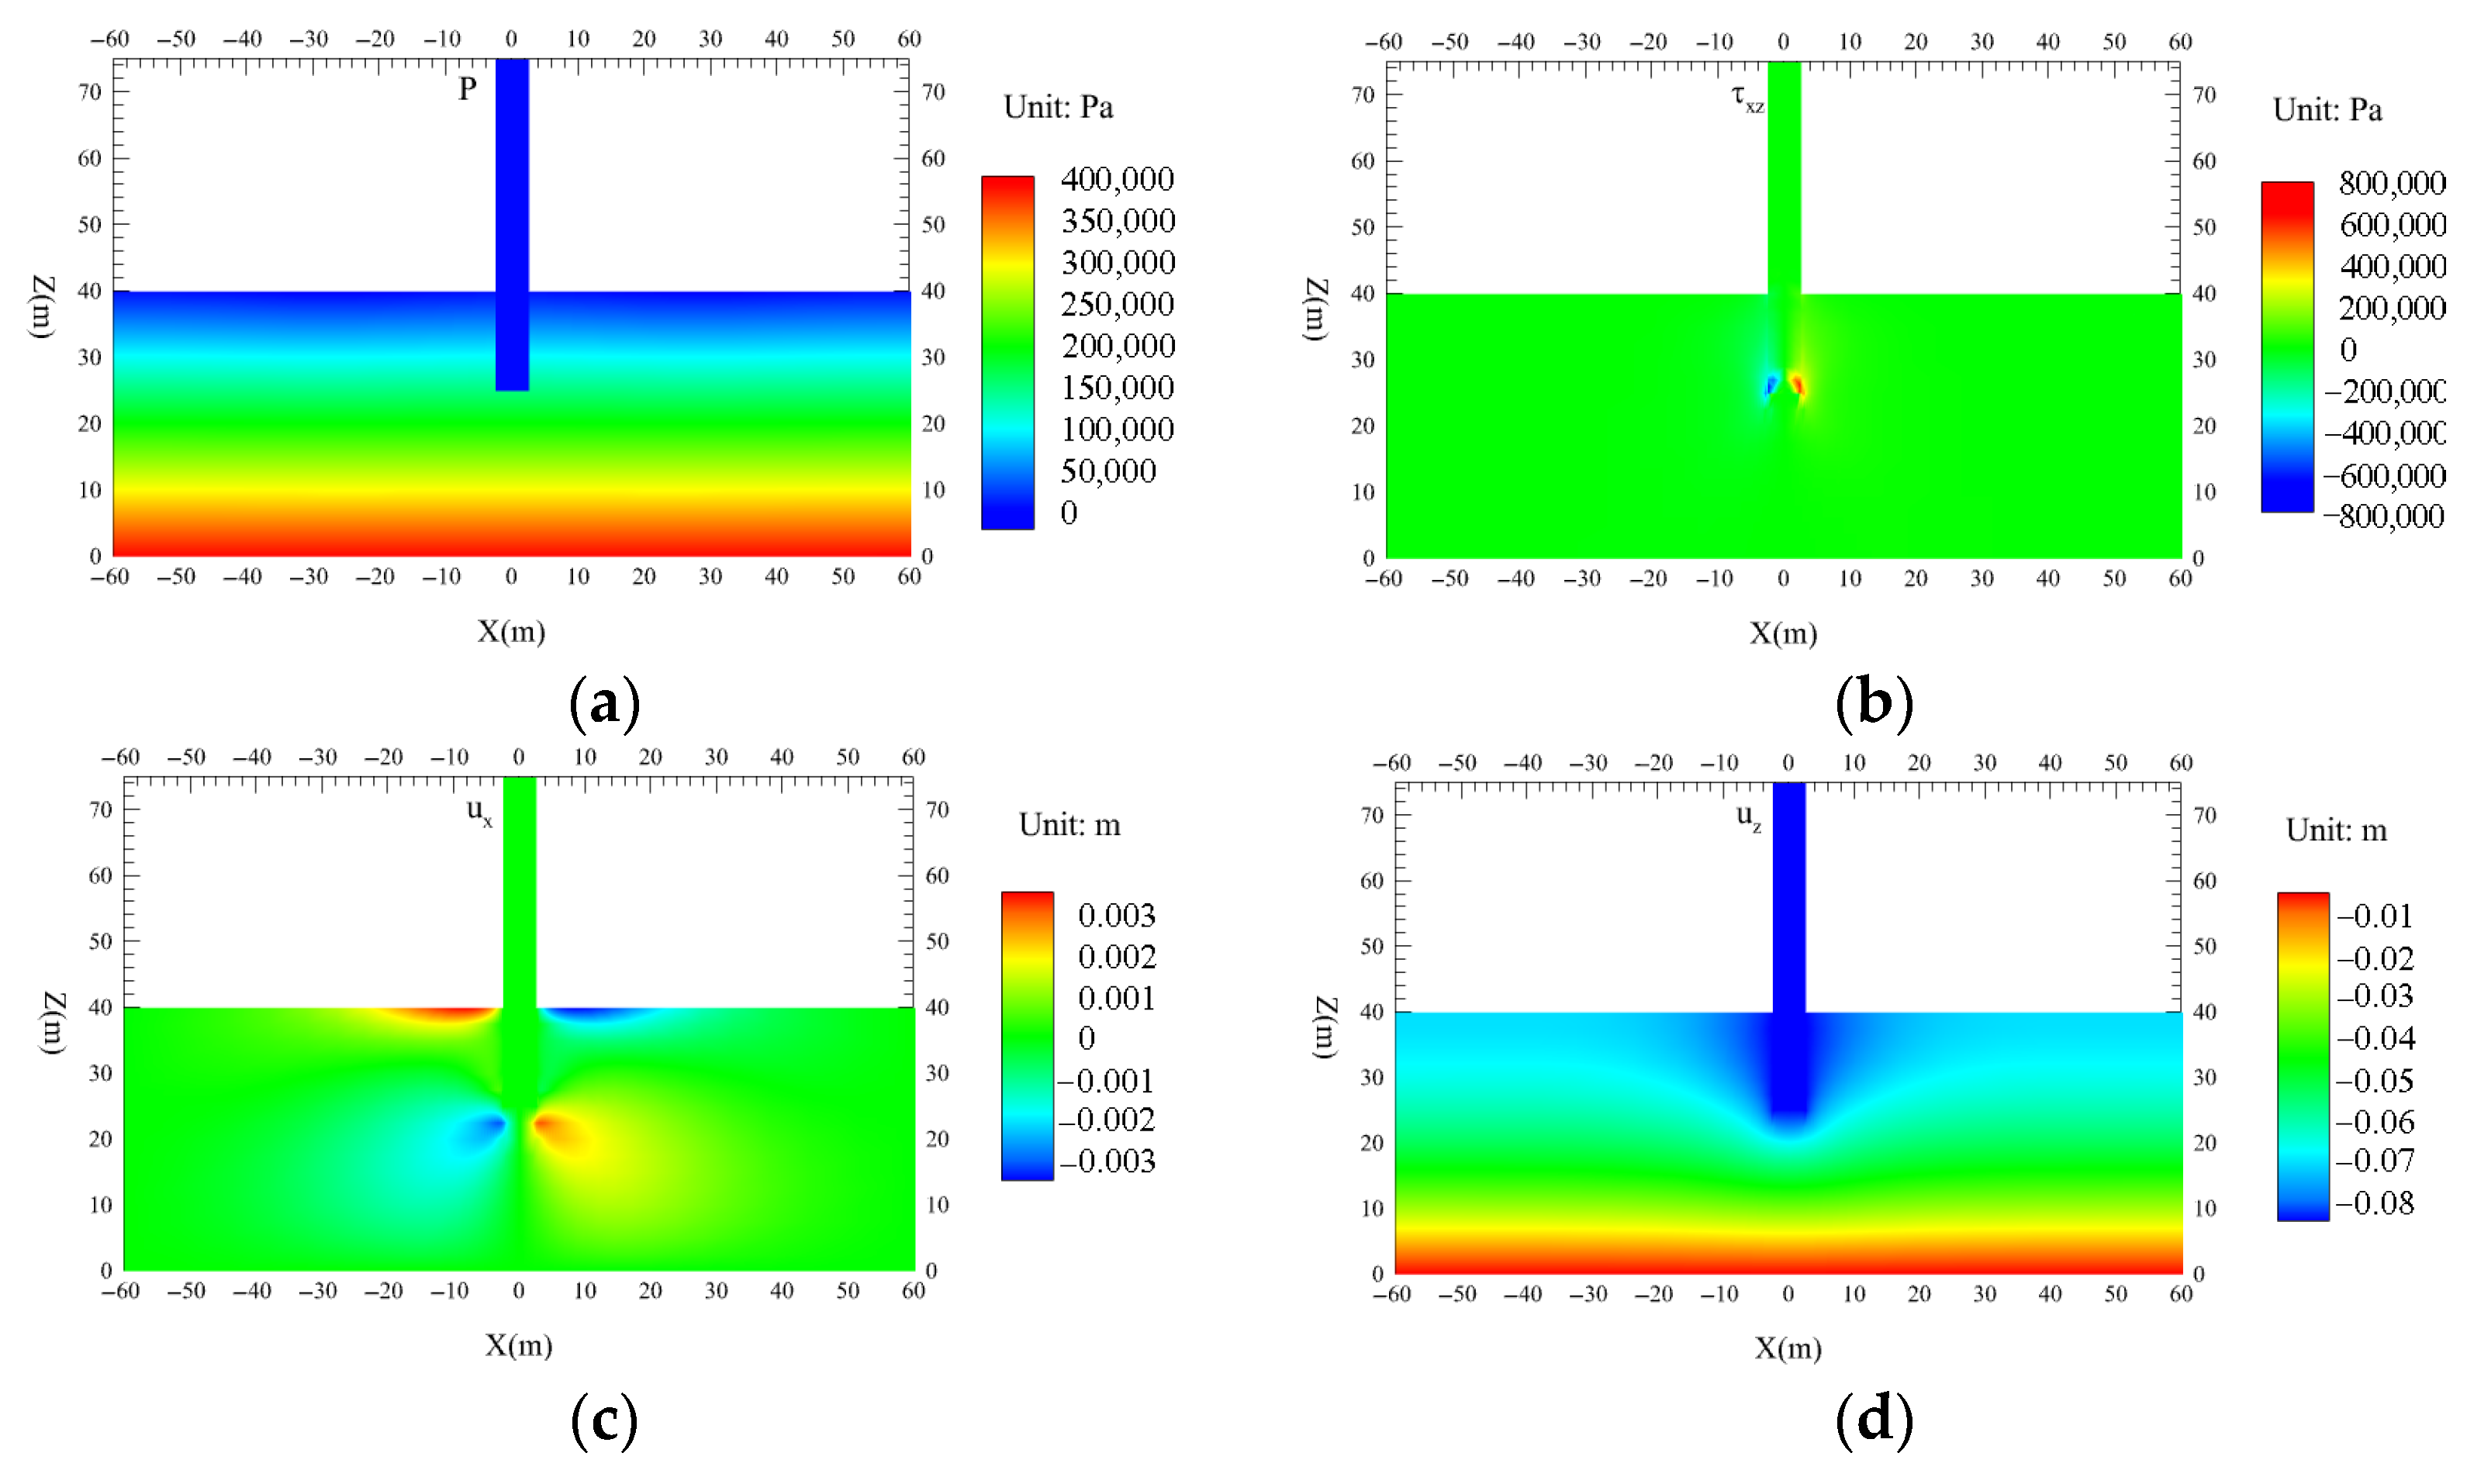
4.2. Seabed Pore Pressure and Stress Displacement Distribution

Figure 6 shows the offshore wind turbine monopile foundation and its seabed soil including internal pore pressure, shear stress, and displacement distributions, as consolidation is completed under self-weight and hydrostatic pressure. The results are shown as slices in the XZ plane, demonstrating the situation at Y = 0 m. As can be seen from Figure 6a, the pore water pressure P is distributed in layers in the seabed soil of the wind turbine, indicating that the superstatic pore water pressure has been completely dissipated at this time and the consolidation process has been completed. And since the monopile foundation consists of impermeable steel pipe piles, the pore pressure of the monopile foundation is zero. By observing Figure 6b, it can be found that symmetrical shear stress zones are formed in the seabed soil on both sides of the wind turbine monopile foundation, in which the maximum shear stress  τ x z  can reach 800 kPa, and the existence of the shear stress zones may lead to shear damage of the seabed. In addition, from Figure 6c,d, it can be seen that the horizontal displacement of the offshore wind turbine foundation under self-weight and hydrostatic pressure is about 3 mm, and it can be concluded that there is basically no horizontal displacement ux in the model, whereas the vertical displacement uz the model produces is about 8 cm.

4.3. Seabed Response Around Monopile and Comparative Analysis

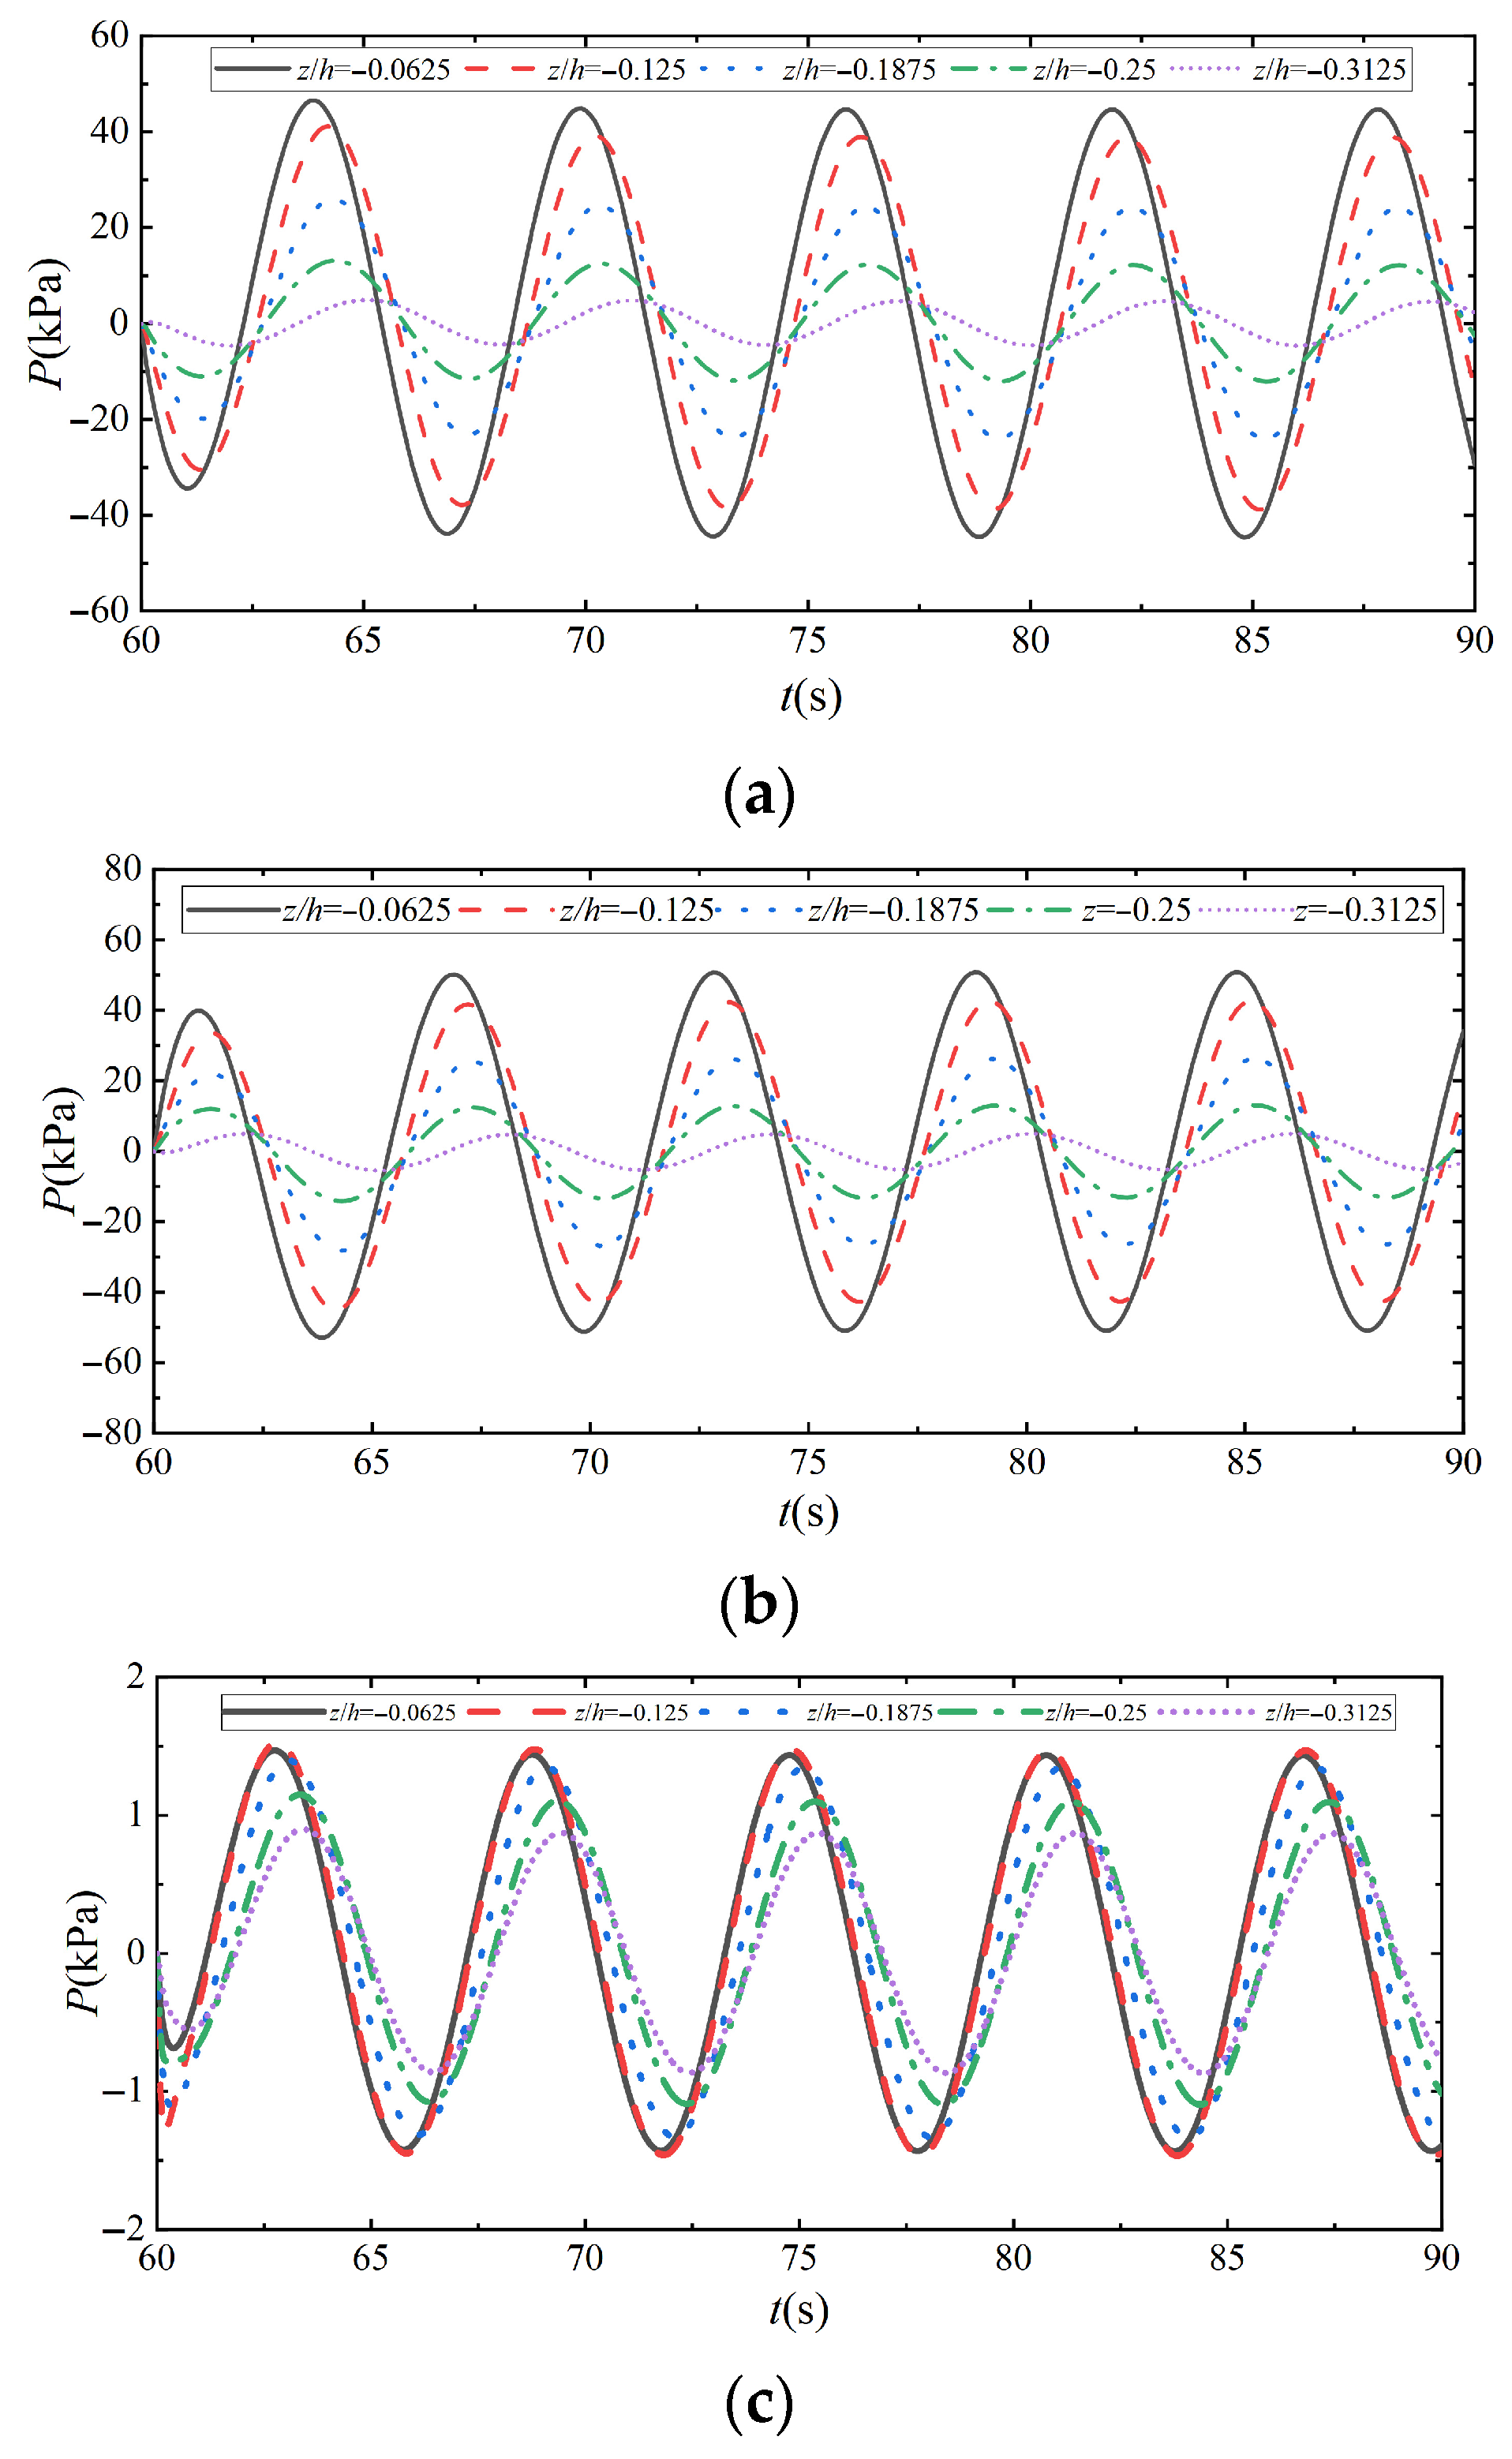
4.3.1. Seabed Pore Pressure Time Curve and Comparative Analysis

Figure 7 shows the time curves of the pore pressure oscillation response at different depths of the seabed under different parameters (z/h = −0.0625~−0.3125). Figure 7a shows the time domain curves of the pore pressure oscillation response at different depths of the seabed under the joint action of wave–vibration, from which it can be seen that there are significant differences in the peak value of the pore pressure and the phase of the waveforms at different depths. This indicates that the differences in pile displacements caused by wave and vibration action will result in significantly different pore pressure dissipation characteristics at different points of the seabed soil at vertical locations. Figure 7b,c show the pore pressure vibration response curves at different depths of the seabed under vibration and wave action, respectively. Comparison with and analysis of Figure 7a show that the pore pressure peaks and wave phases at different depths along the seabed show significant differences, whether due to wave action, vibration, or the combined action of both. Within a complete loading cycle, the differences in wave pressure or pile displacement result in significant differences in pore pressure dissipation characteristics at different vertical locations along the seabed soil body. Specifically, under wave action, the pore pressure dissipation characteristics vary significantly with depth; under vibration action, the differences in pile displacement lead to different dissipation patterns in the pore pressure response; and under joint wave–vibration action, the pore pressure dissipation characteristics are similar to those under wave or vibration action alone, further verifying the mechanism of the joint influence of wave–vibration on the pore pressure response of seabed soils.

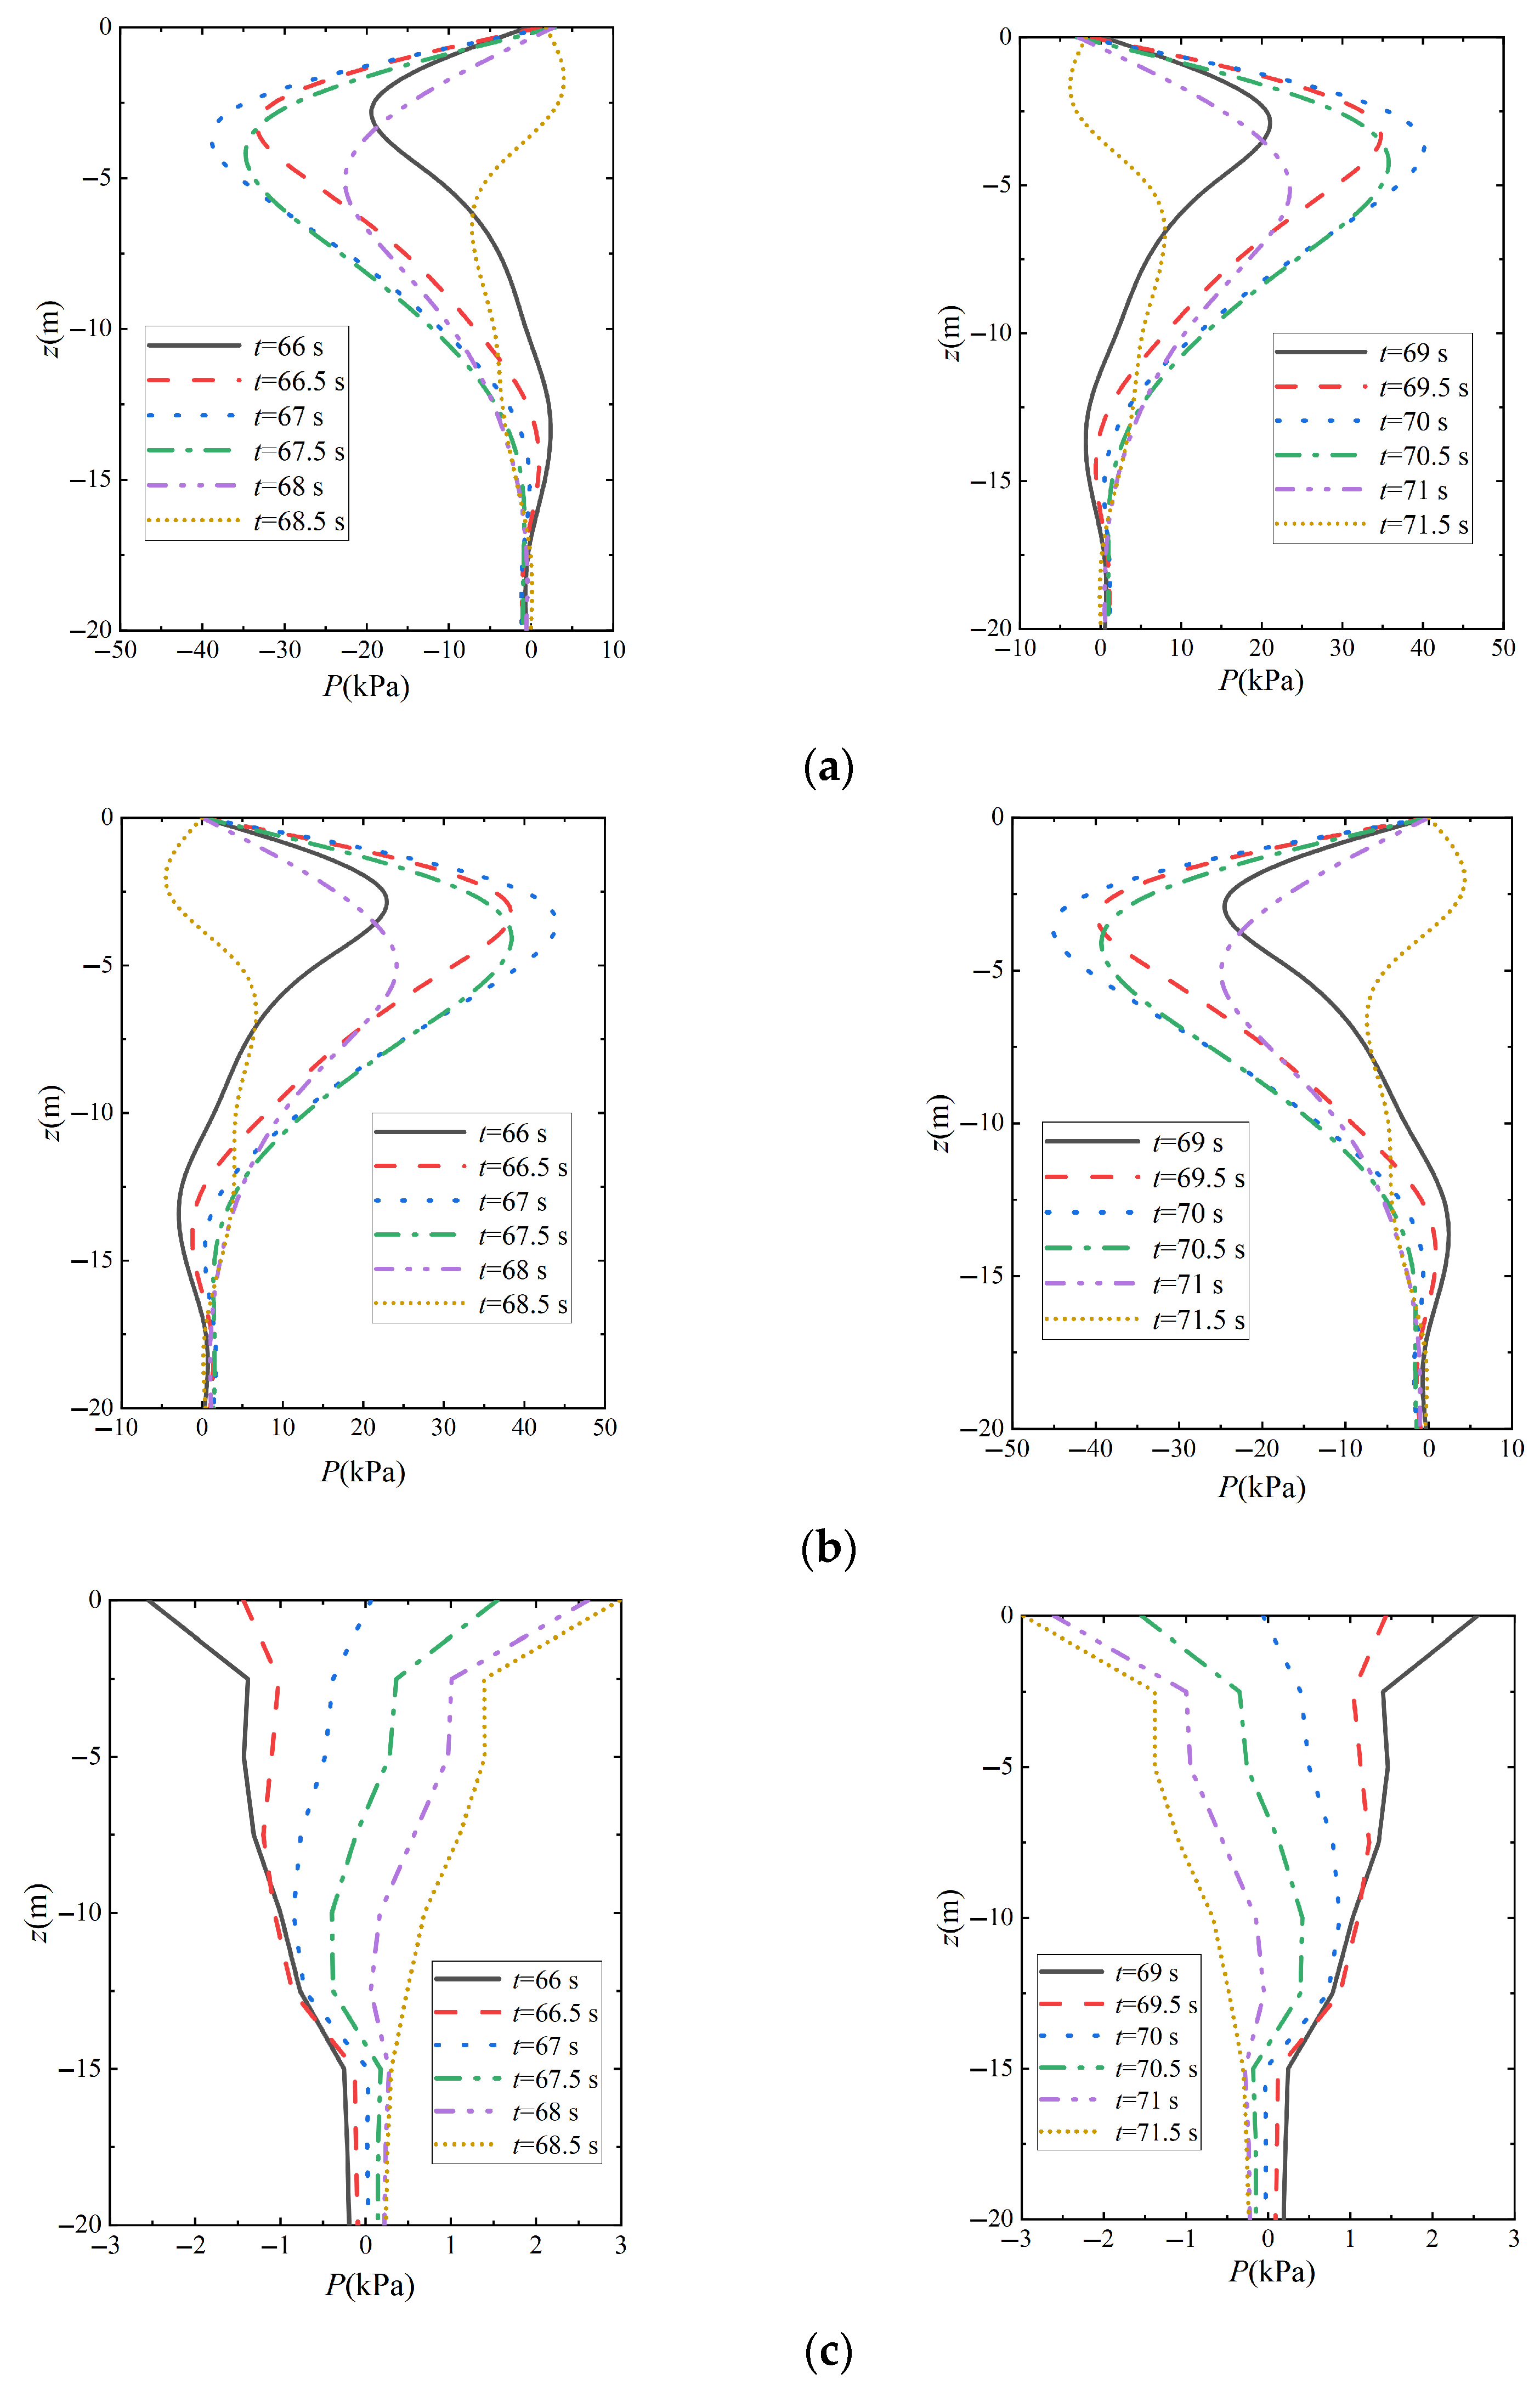
4.3.2. Vertical Characteristics and Comparative Analysis of Seabed Pore Pressure

Figure 8 shows the distribution characteristics of the vertical pore pressure in front of the pile at different moments in one cycle under the action of different parameters (t = 66 s~71.5 s). Among them, Figure 8a–c represent the distribution characteristics of the vertical pore pressure in front of the pile at different moments in one cycle under the action of wave–vibration, vibration, and wave, respectively. It can be seen from Figure 8a that the pore pressure response along the depth direction of the seabed exhibits a basically symmetrical distribution pattern during a complete cycle under the joint action of wave and vibration, and this pattern is consistent with the situation under the action of wave alone and vibration alone, as can be seen from the combination of Figure 8b,c. In addition, similar to the distribution of vertical pore pressure in front of the pile at different moments under vibration, the pore pressure along the depth direction of the seabed soil body shows a tendency to increase and then decrease, and the pore pressure amplitude point along the depth direction of the seabed gradually moves to a deeper depth of the seabed at each moment with the passage of time. However, unlike vibration alone, the pore pressure at the seabed surface is equal to the wave pressure under the combined action of waves and vibrations, while the pore pressure at the seabed surface is zero under vibrations alone.

4.4. Effects of Wave Parameters on Seabed Pore Pressure and Comparative Analyses

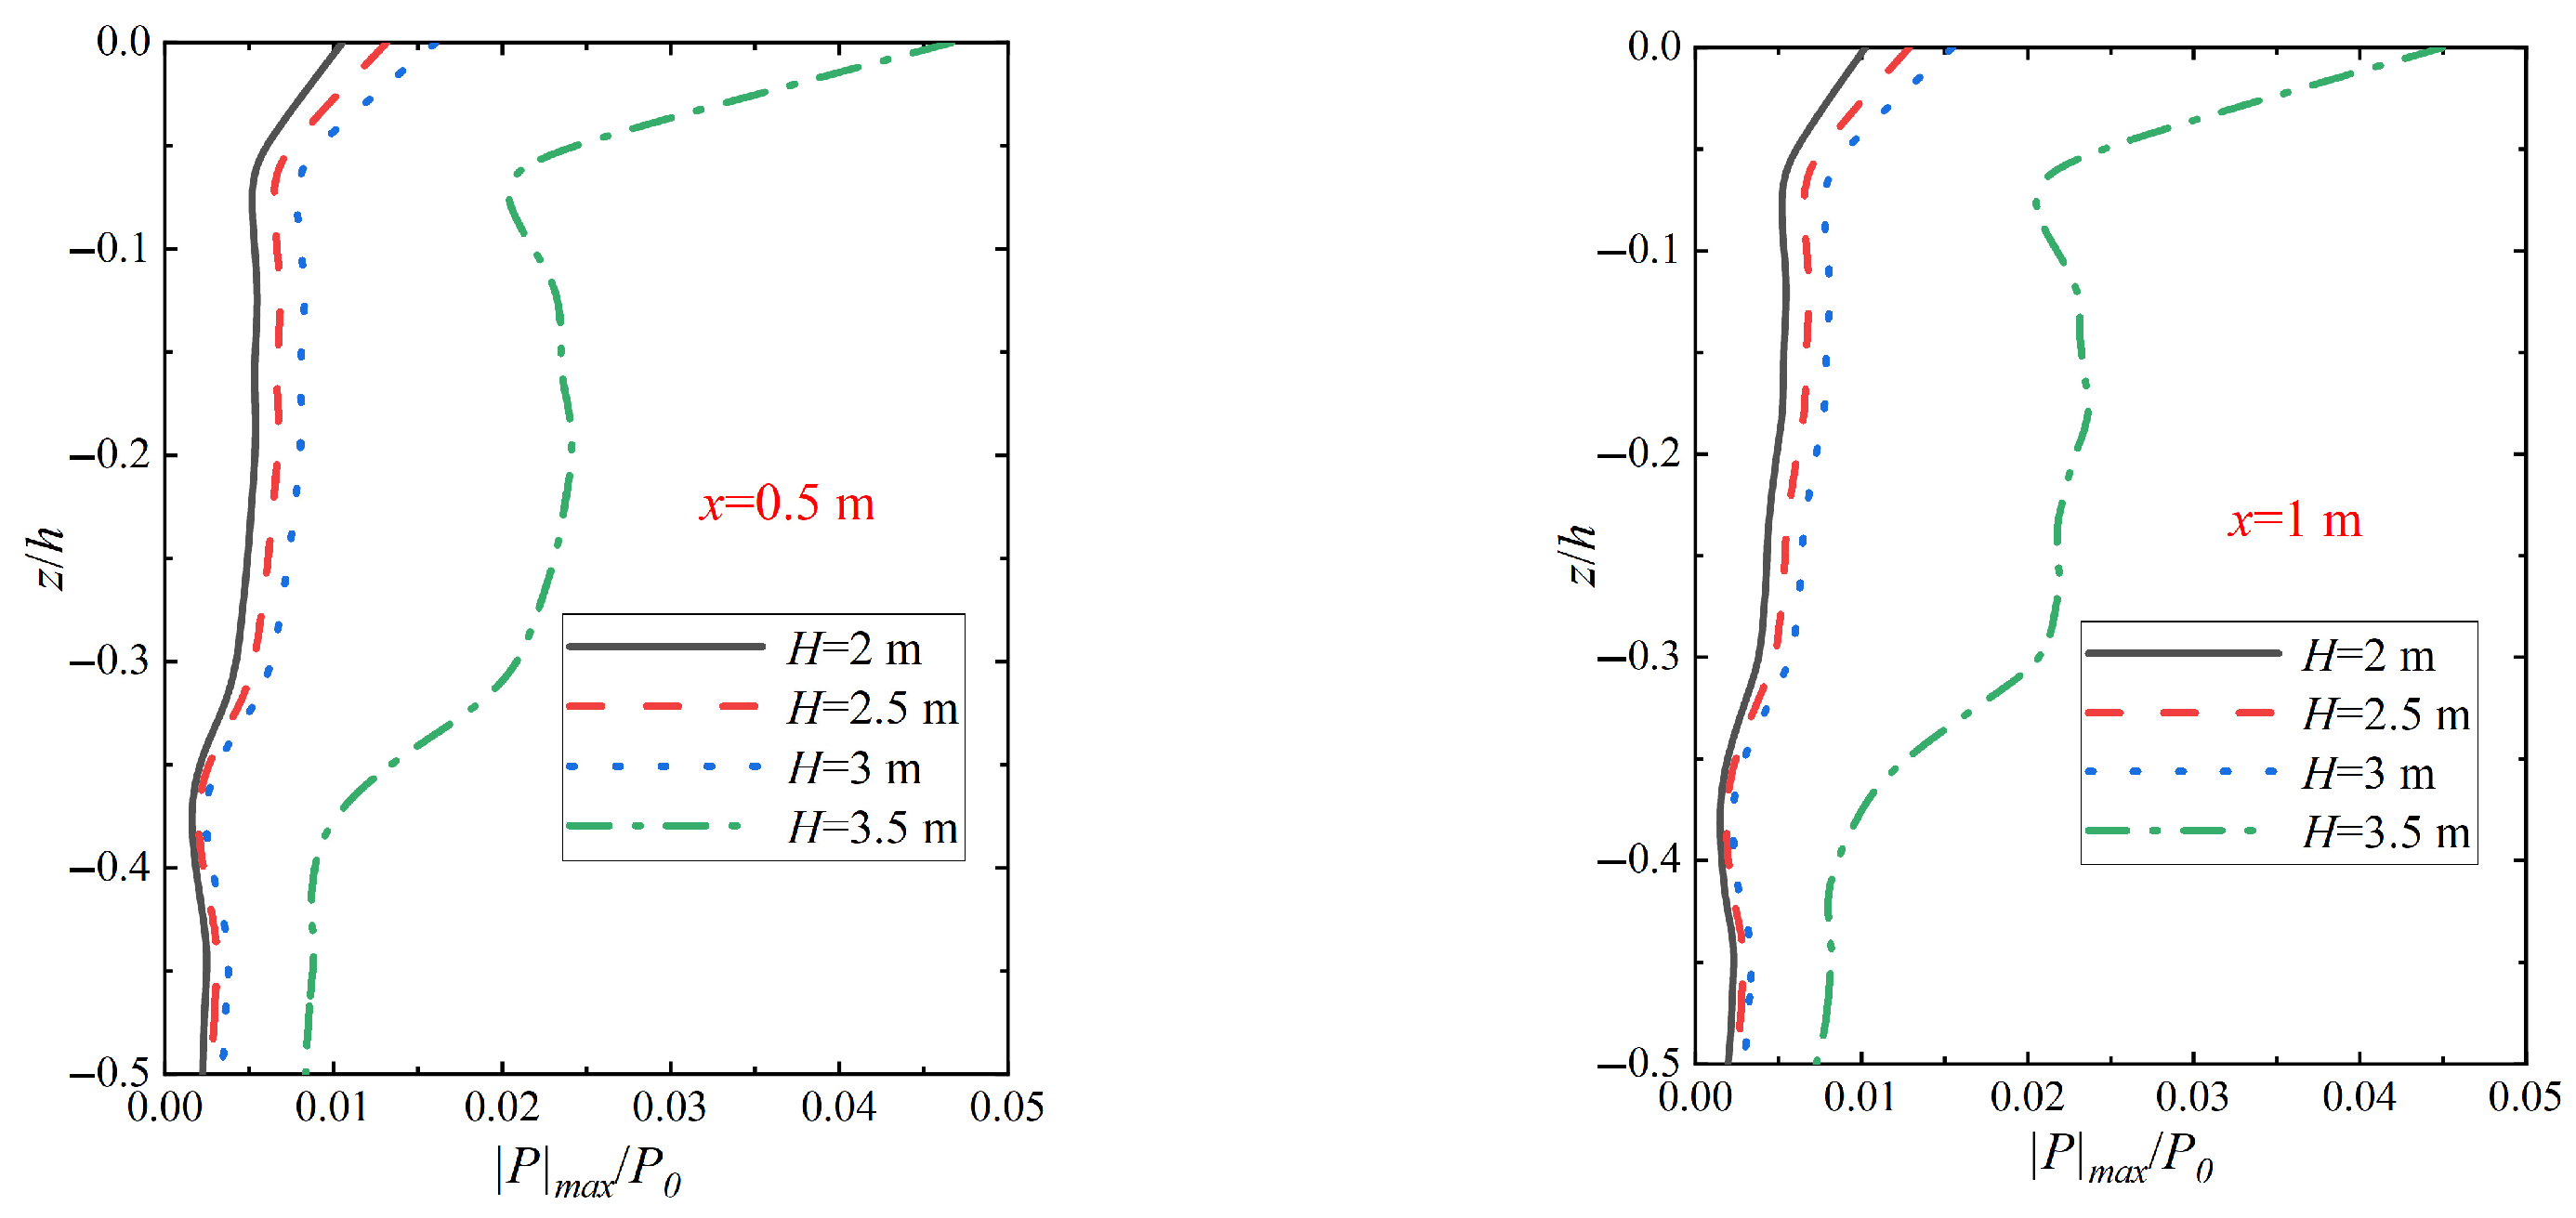
4.4.1. Influence of Wave Height Change and Comparative Analysis

Figure 9 shows the variation in the vertical pore pressure amplitude distribution on the seabed at different locations in relation to the pile wall for different wave heights of H action under the wave–vibration joint action. Compared with the pure vibration action, the wave incidence brings more energy, resulting in a larger wave pressure on the seabed surface, and the pore pressure amplitude increases with the increase in wave height. The pore pressure amplitude decays rapidly near the surface, but the decay rate slows down and tends to equilibrate with increasing depth. Comparison with Figure 10 shows that under wave action, the pore pressure amplitude in the middle and upper regions of the seabed (z/h > −0.30) is basically the same as that of wave action alone, and the relative amplitude of pore pressure at various depths increases with the increase in wave action, and the pore pressure gradient also increases accordingly. Comparing the relative amplitude of pore pressure |p|max/p0 at different wave heights (H = 2 m, 2.5 m, 3 m, 3.5 m), it is found that the relative amplitude of pore pressure|p|max/p0 under wave–vibration at the relative depth of z/h = −0.06 is increased by tens of times as compared with that under wave action, respectively. This indicates that the effect of vibration on the pore pressure amplitude distribution decreases with increasing wave height, especially in the shallow region. However, in the deeper region (z/h < −0.40), the periodic horizontal displacement of the pile body enhances the penetration of the water wave pressure to the bottom, which further enlarges the significant region of the pore water pressure gradient change, leading to a significant change in the pore pressure amplitude decay characteristics compared to the wave action alone. The x in the figure indicates the distance from the pile wall, and this representation remains consistent in subsequent images.

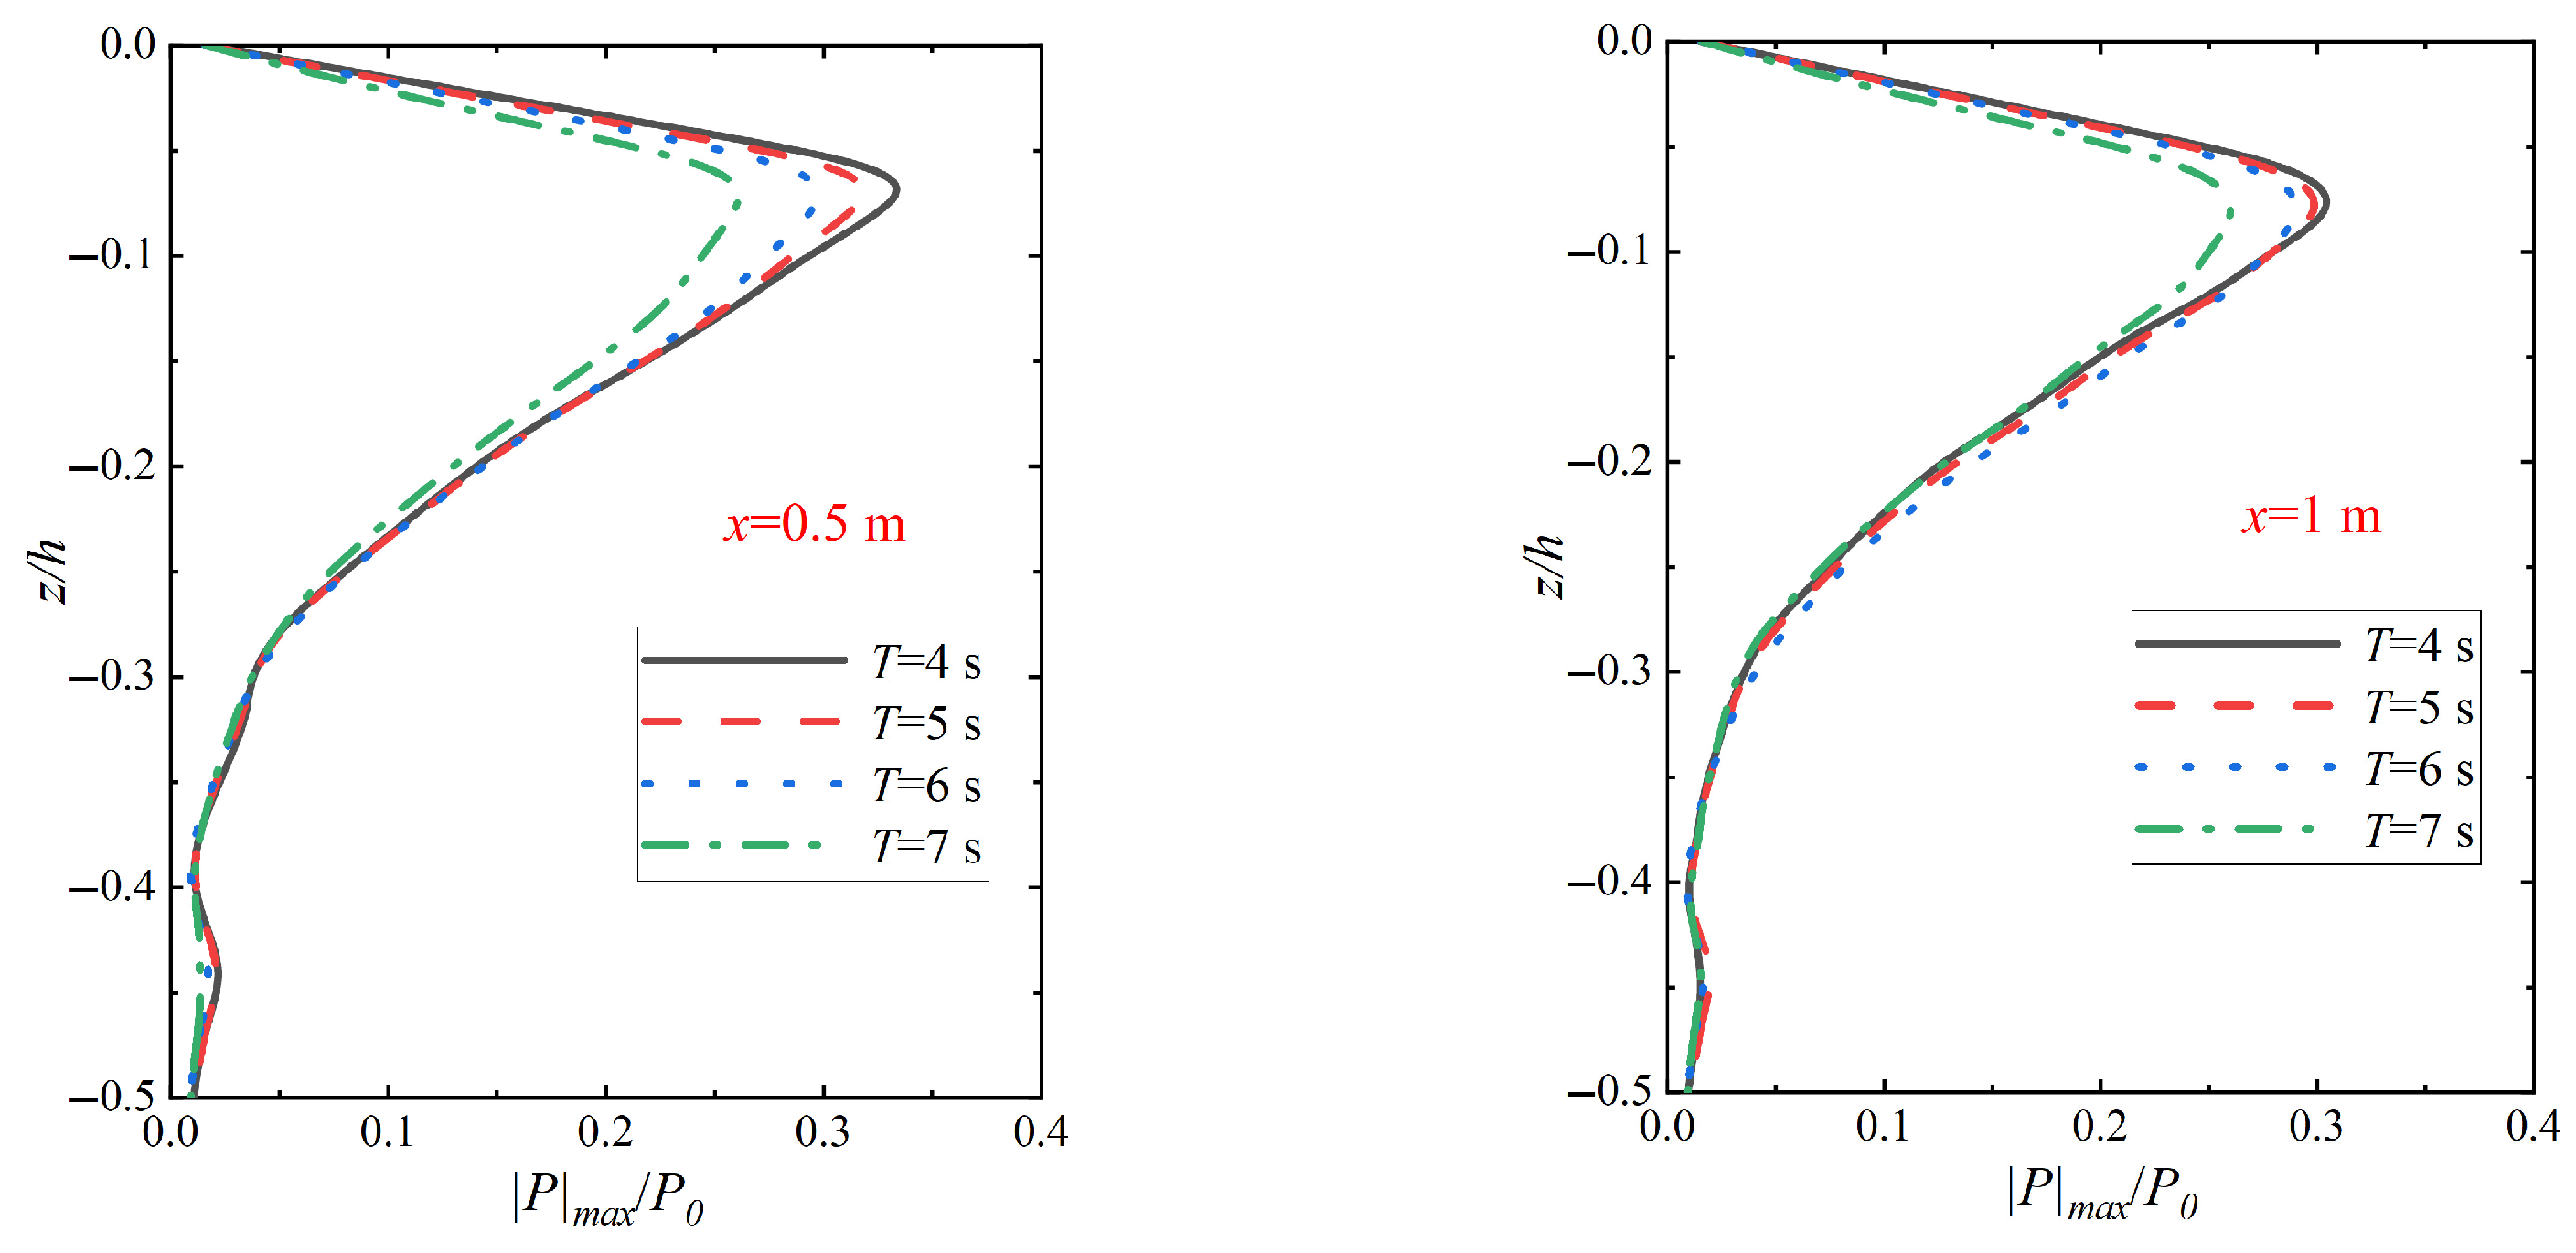
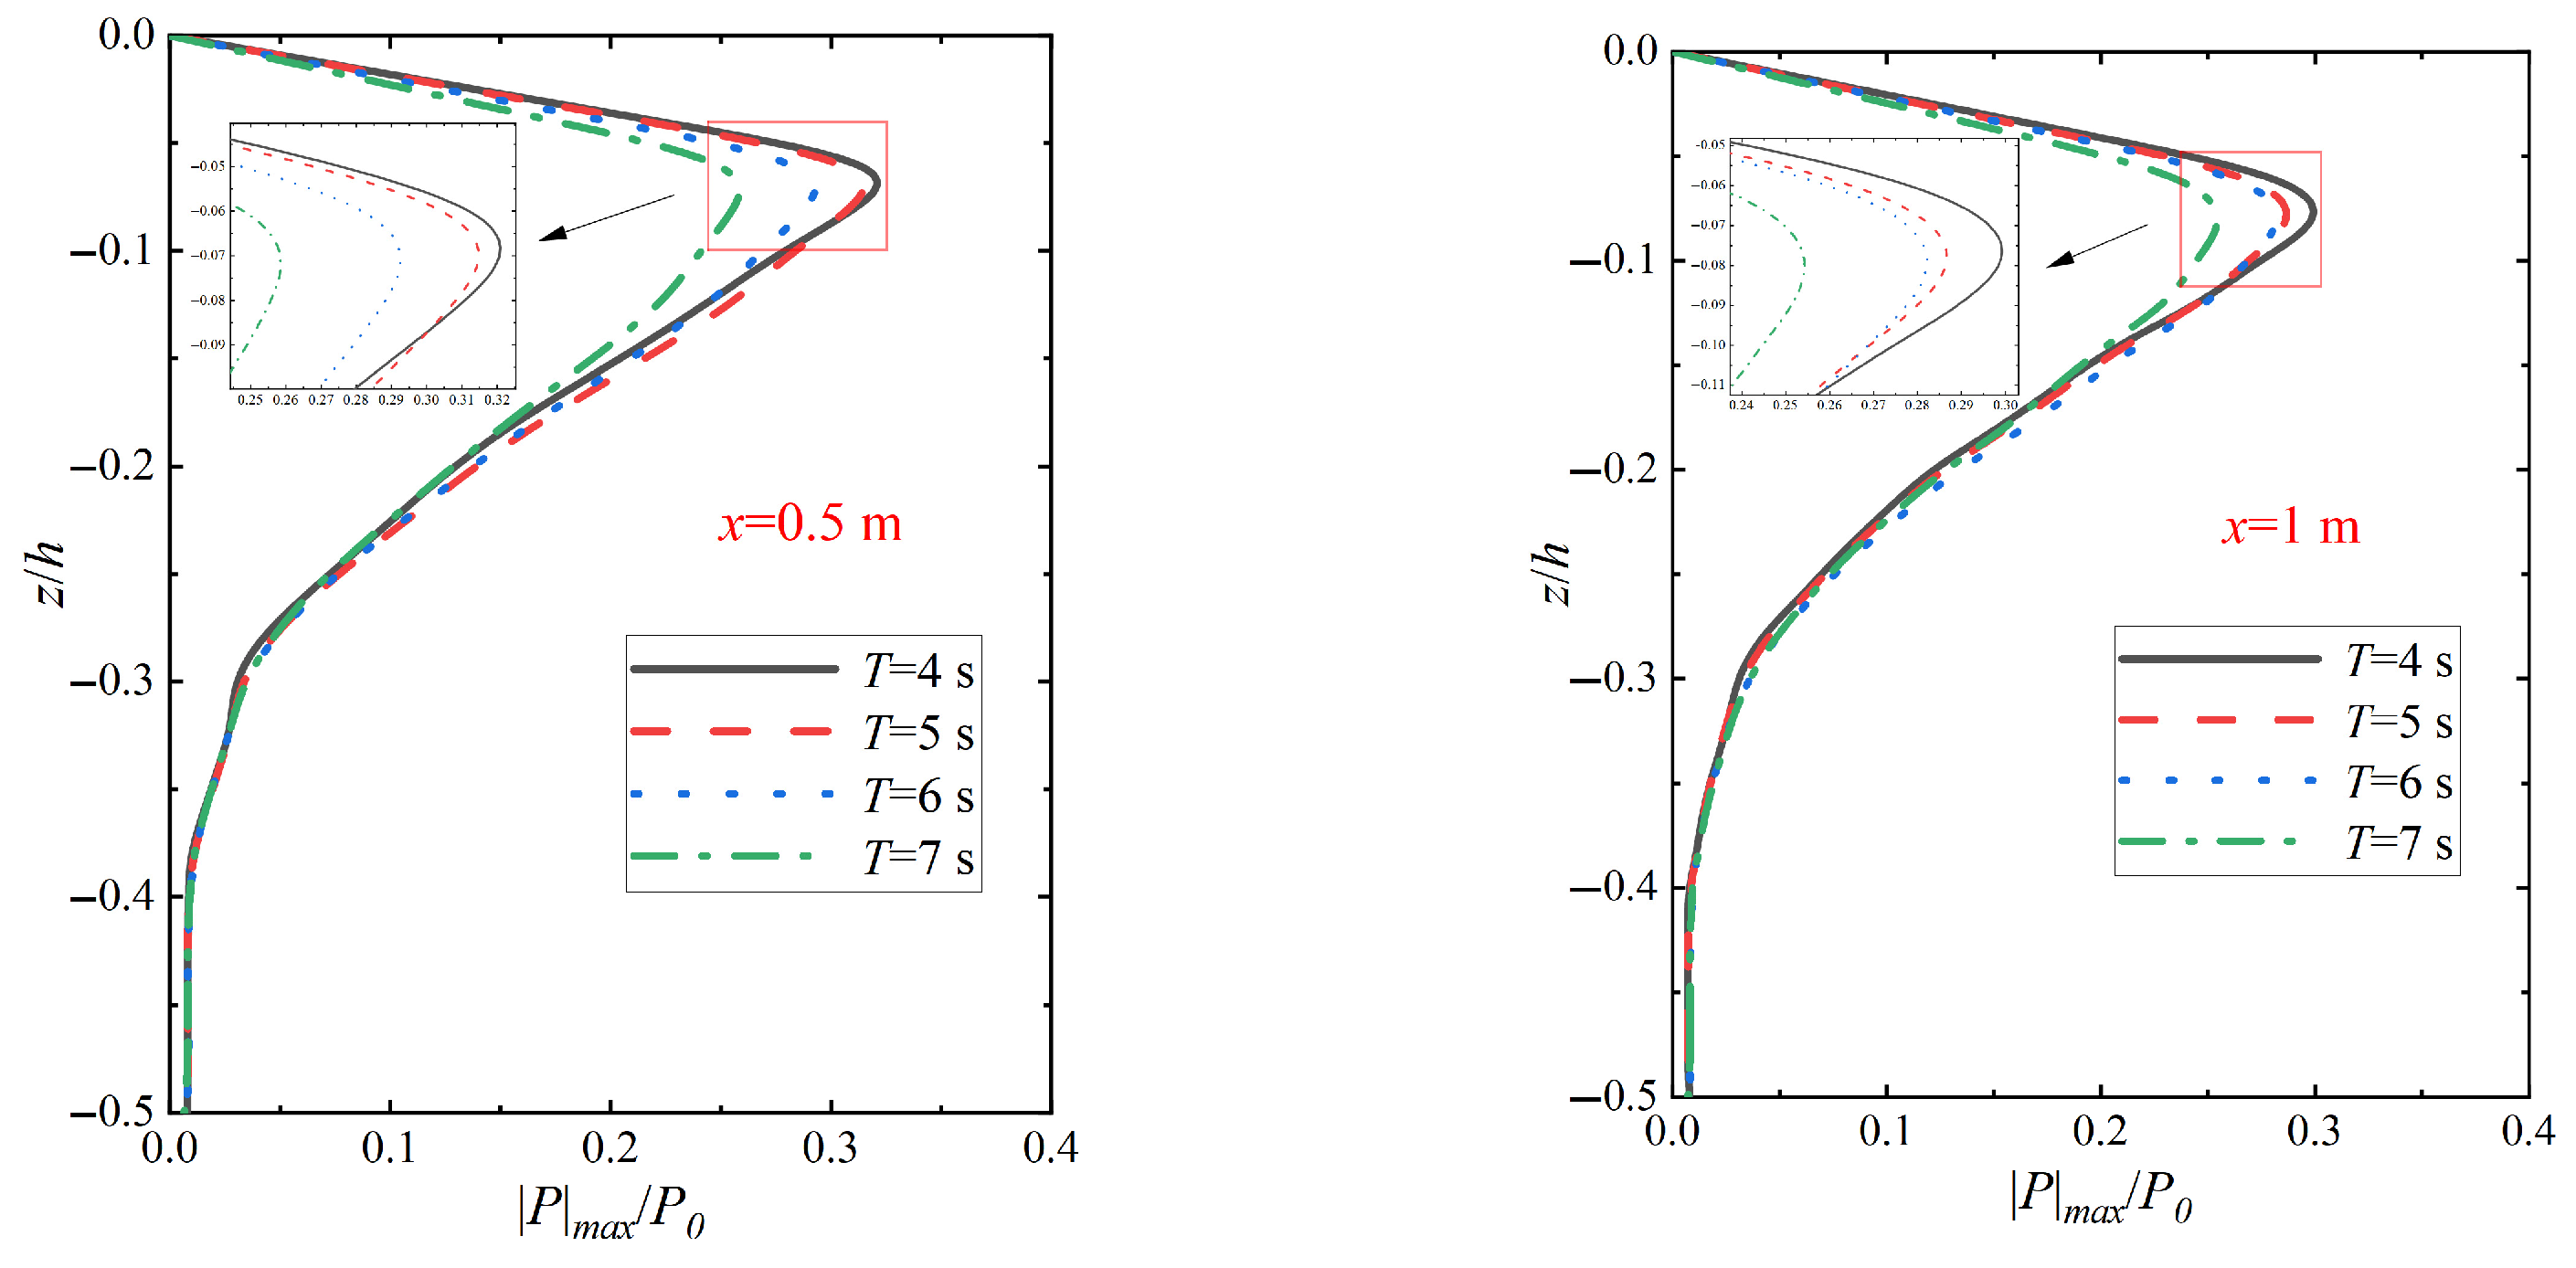
4.4.2. Influence of Wave Cycle Change and Comparative Analysis

Figure 11 shows the variation in the amplitude distribution of vertical pore pressure on the seabed at different locations from the pile wall under wave–vibration action with different wave period Tb actions. From the figure, it can be seen that the amplitude of pore pressure at all depths of the seabed shows an increasing trend with the increase in wave period. Comparison with the relative amplitude of pore pressure |p|max/p0 at different wave periods (Tb = 4 s, 5 s, 6 s, 7 s) in Figure 12 reveals that the relative amplitude of pore pressure |p|max/p0 under the joint wave–vibration action at the relative depth z/h = −0.06 is increased by tens of times compared with that under the wave action alone. This indicates that the effect of vibration on the pore pressure amplitude distribution decreases with increasing wave period in the shallow seabed region. In addition, although the increase in wave period leads to an increase in pore pressure amplitude at all depths of the seabed, the increase is not significant. This phenomenon may be related to the nonlinear response characteristics of the seabed soil, which may increase significantly with increasing wave periods, but saturates after reaching a certain threshold. Therefore, although the increase in wave period may exacerbate the nonlinear response of the soil to a certain extent, the enhancement effect of this response slows down after a certain period, resulting in a levelling off of the increase in pore pressure amplitude. This pattern further reveals the complex relationship between wave period and the dynamic response of the seabed soil.

4.5. Effect of Vibration Characteristics on Seabed Pore Pressure and Comparative Analysis

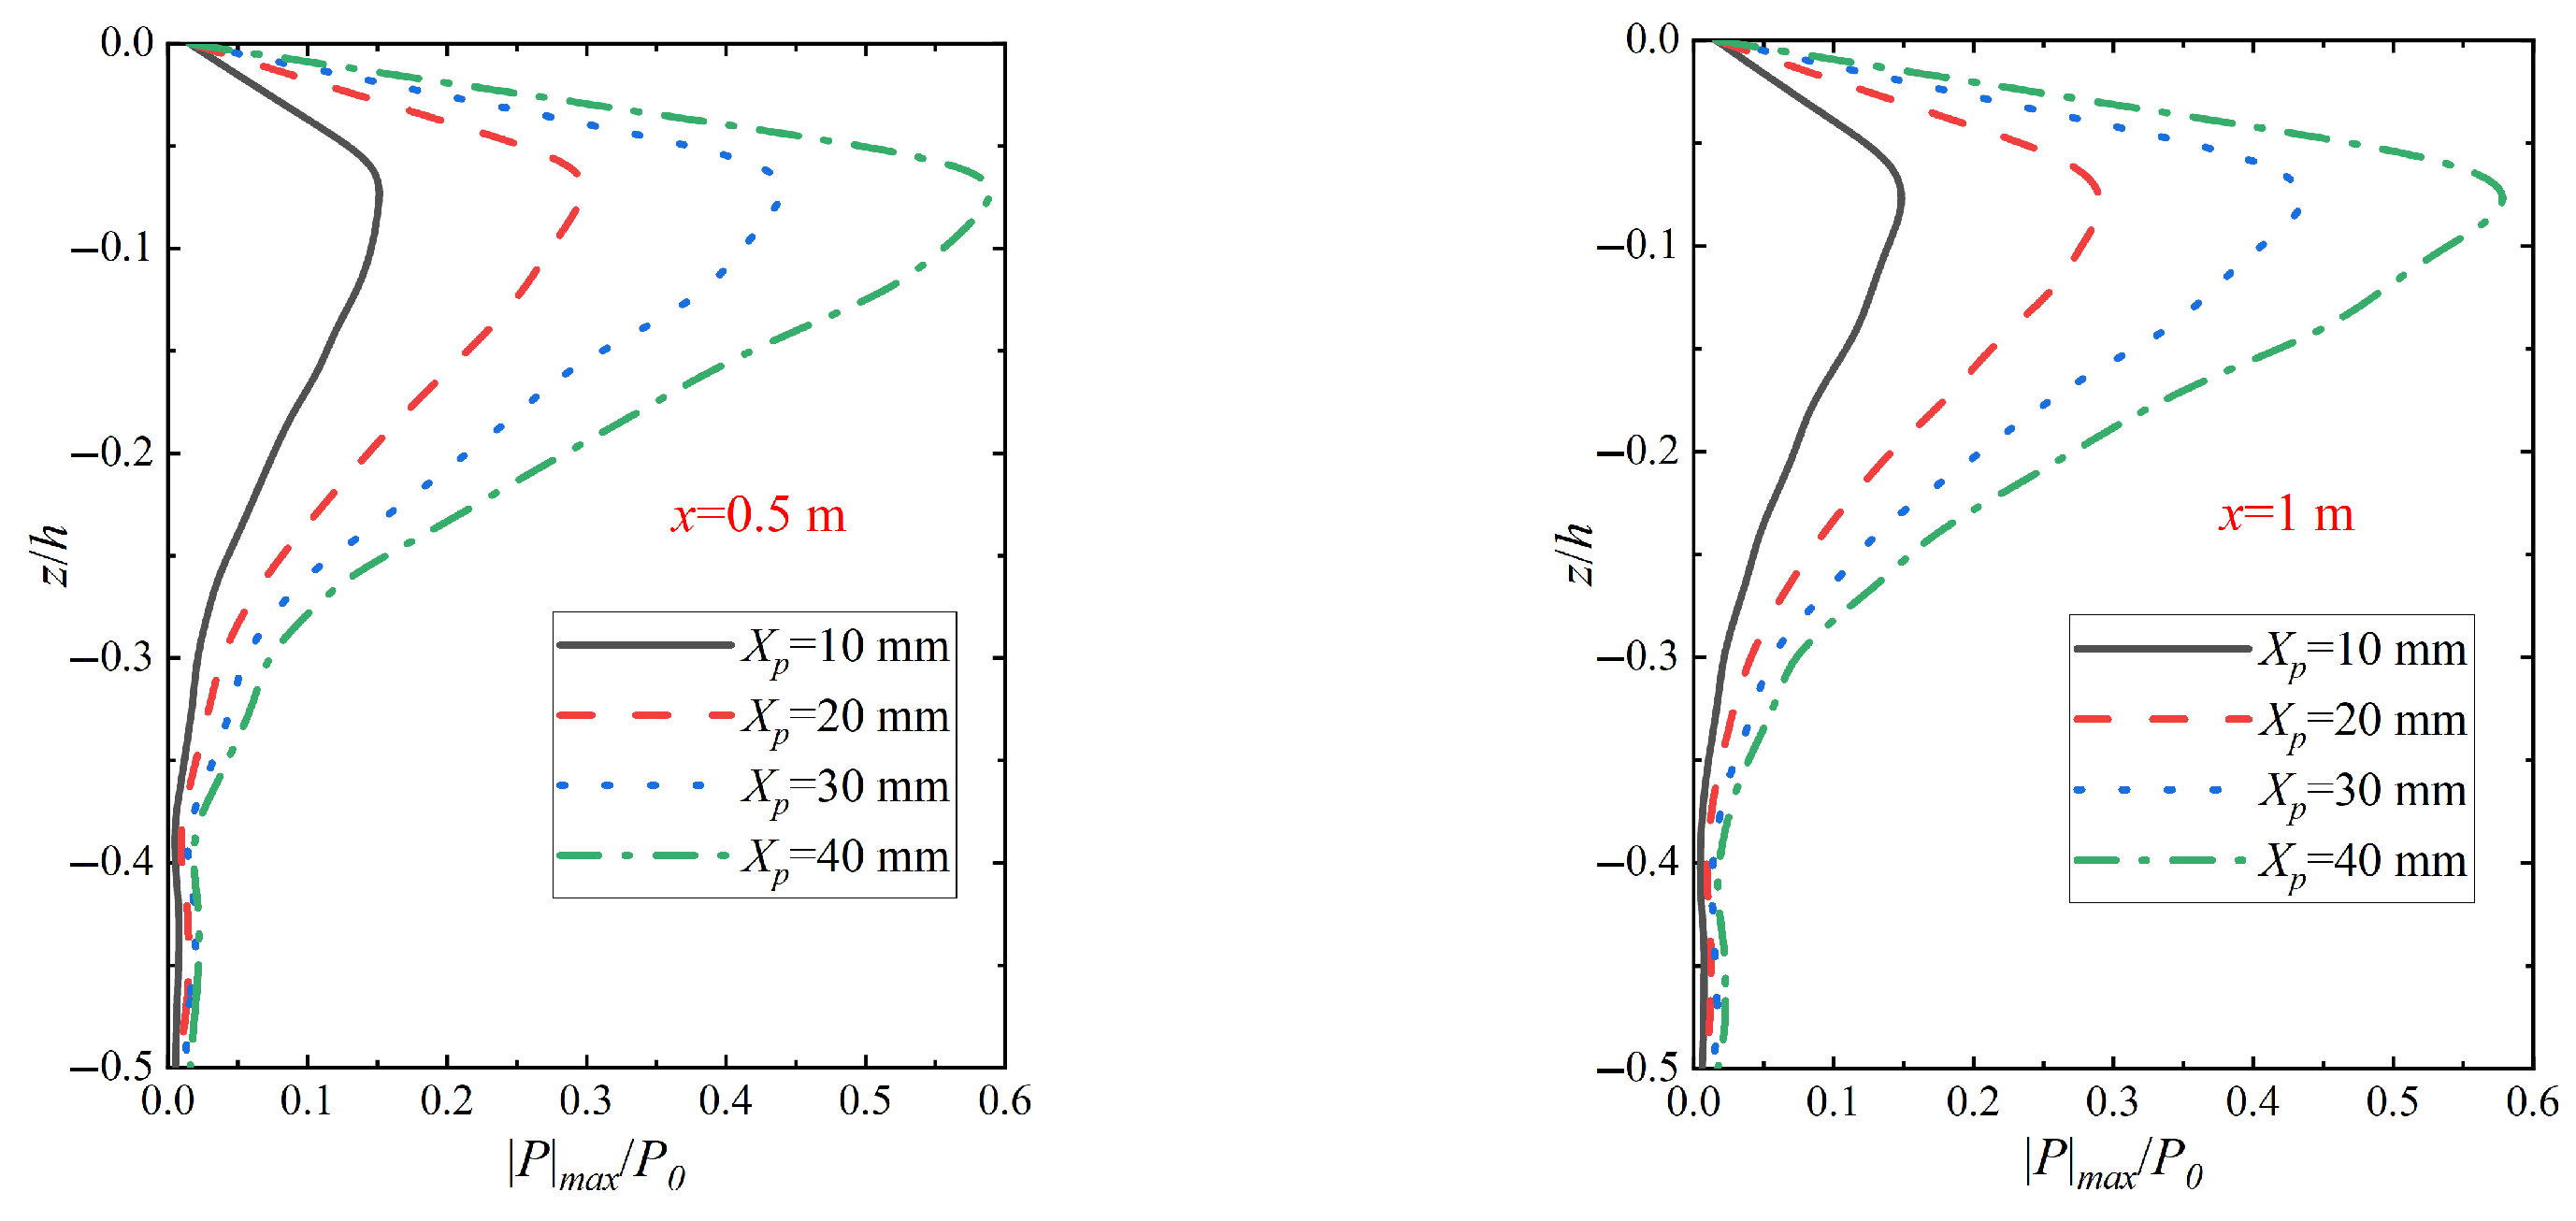
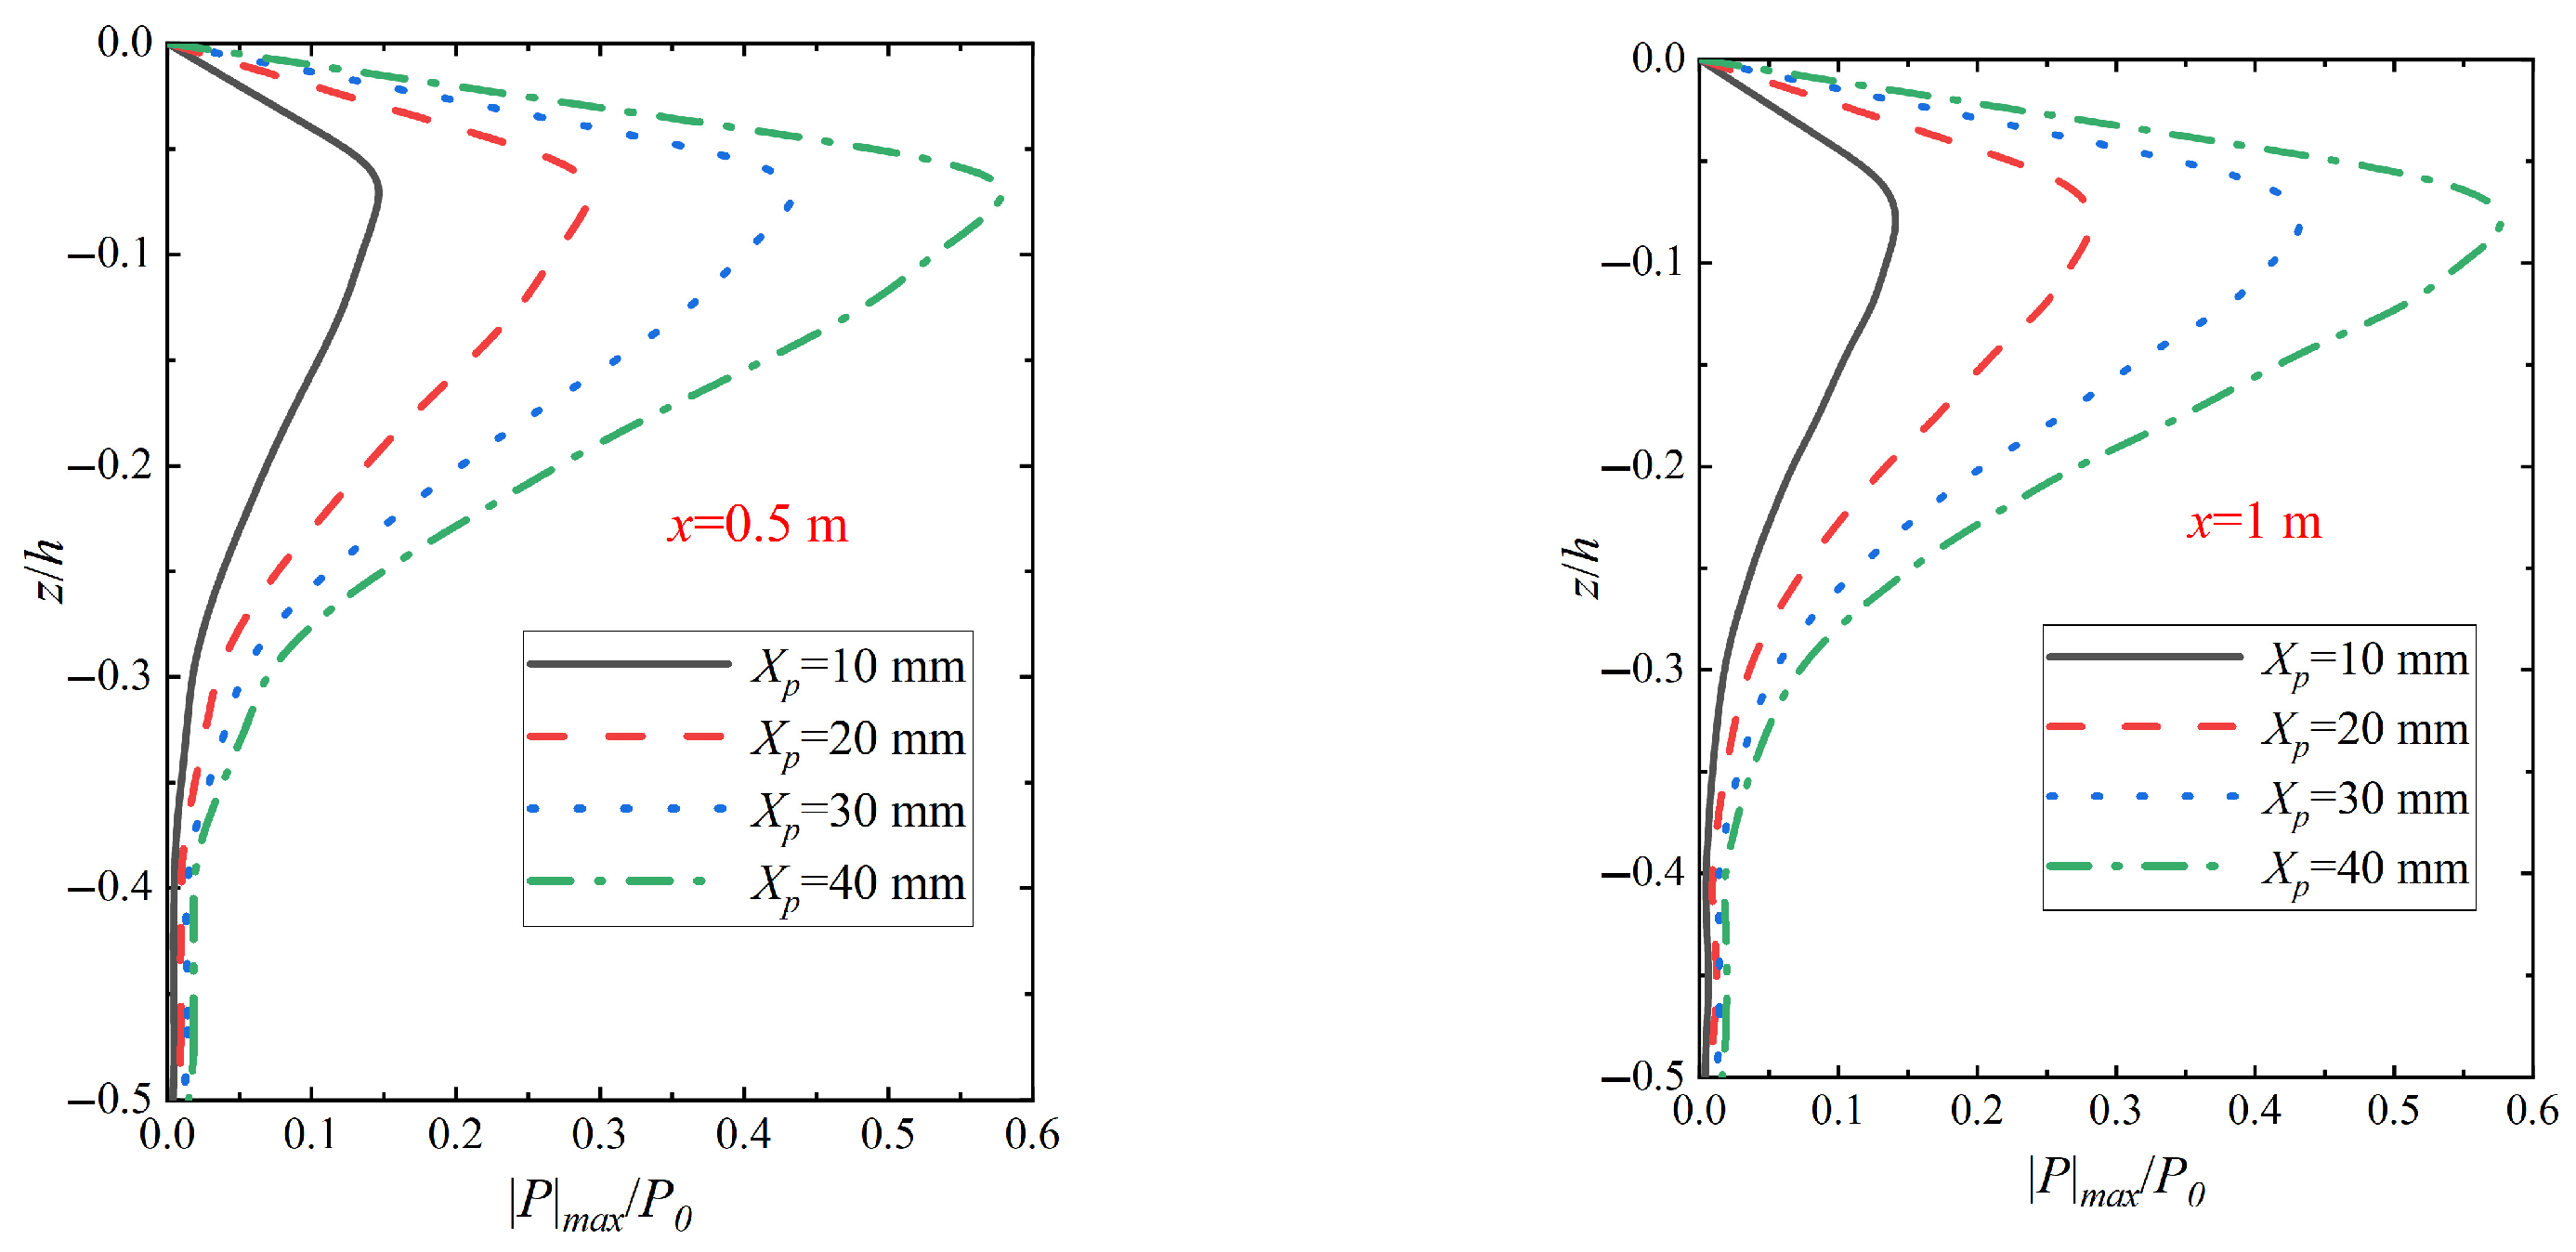
4.5.1. Influence of Vibration Displacement Peak Change and Comparative Analysis

Figure 13 shows the variation in the seabed vertical pore pressure amplitude distribution at different locations in relation to the pile wall when different peak vibration displacements Xp are applied under wave–vibration. From Figure 13, it can be seen that the variation in the peak pile vibration displacement significantly affects the pore pressure response of the shallow soil around the monopile, and the seabed vertical pore pressure magnitude increases with the increase in the peak pile vibration displacement Xp. In addition, at 0.5 m from the pile wall, the maximum points of pore pressure amplitude at Xp = 10 mm, 20 mm, 30 mm, and 40 mm are 0.153, 0.305, 0.450, and 0.599, respectively, which indicate that the peak value of the relative amplitude of the pore pressure and the magnitude of the peak vibratory displacement are basically linearly related. This law is basically consistent with the results under the action of vibration alone and was confirmed in the numerical simulation tests by Zhang [28]. By comparing with Figure 14 the changes in the distribution of the seabed vertical pore pressure amplitude when different vibration displacement peaks Xp act under vibration, it can be seen that the relative amplitude of pore pressure |p|max/p0 under wave–vibration action has a relatively small enhancement compared with that when vibration acts alone at the relative depth z/h = −0.06. This suggests that the effect of wave action on the seabed vertical pore pressure amplitude distribution diminishes as the peak vibration displacement increases, especially in the shallow region. In addition, the change in growth rate further indicates that wave action has a small effect on the seabed vertical pore pressure at different peak vibration displacements.

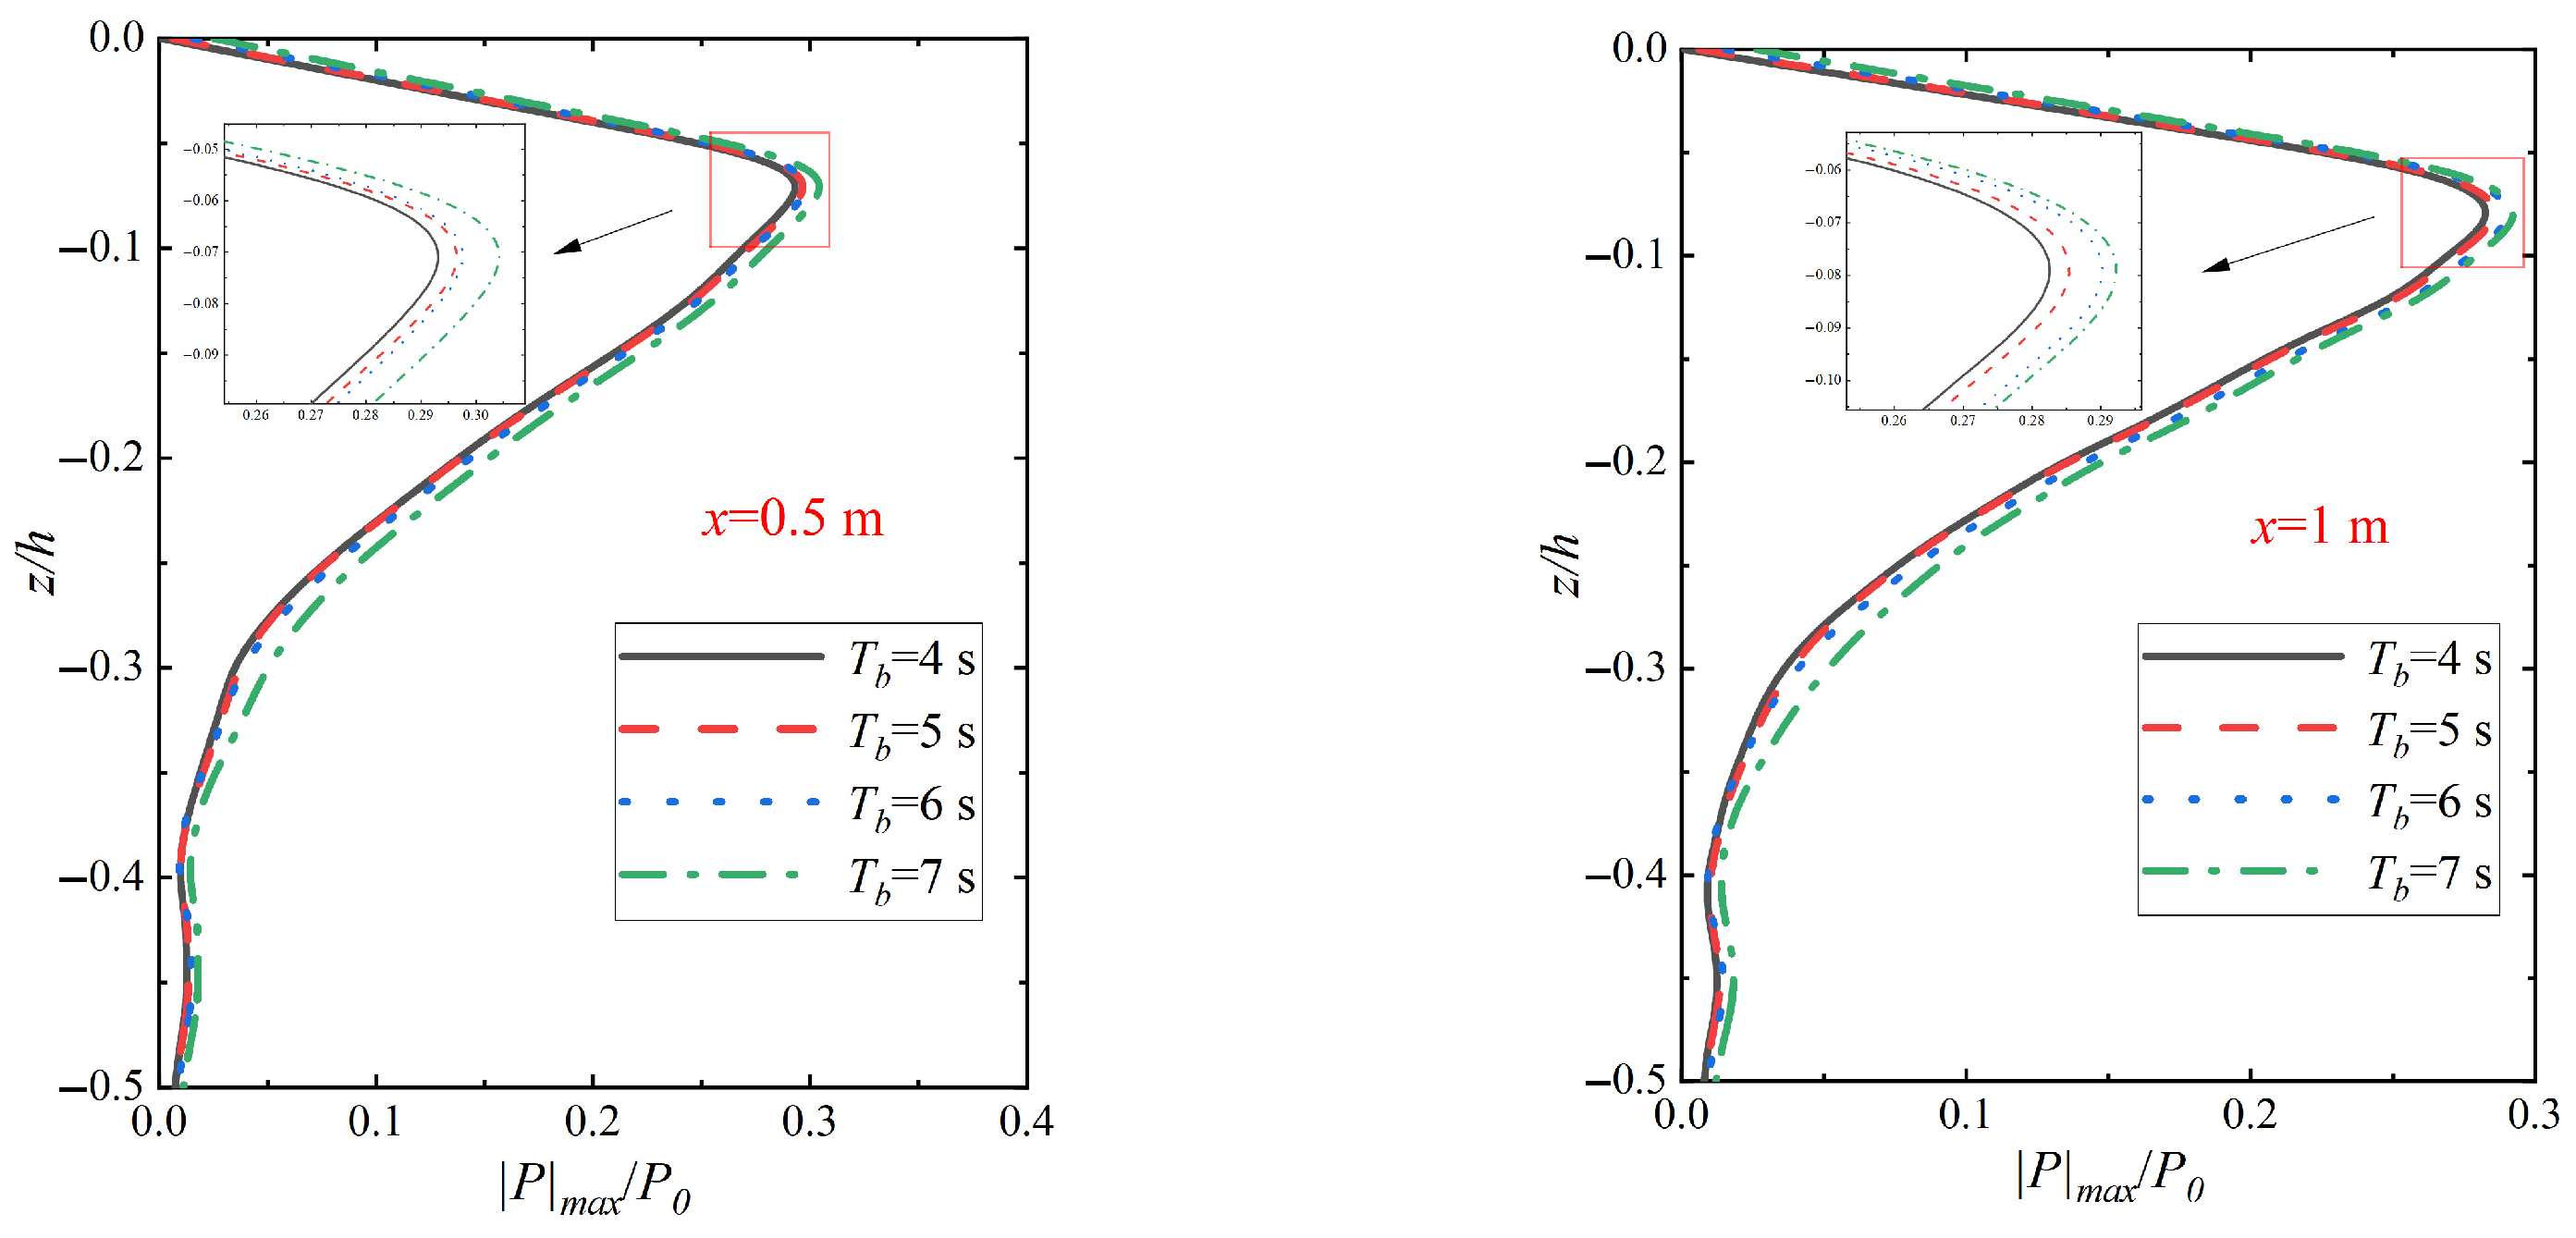
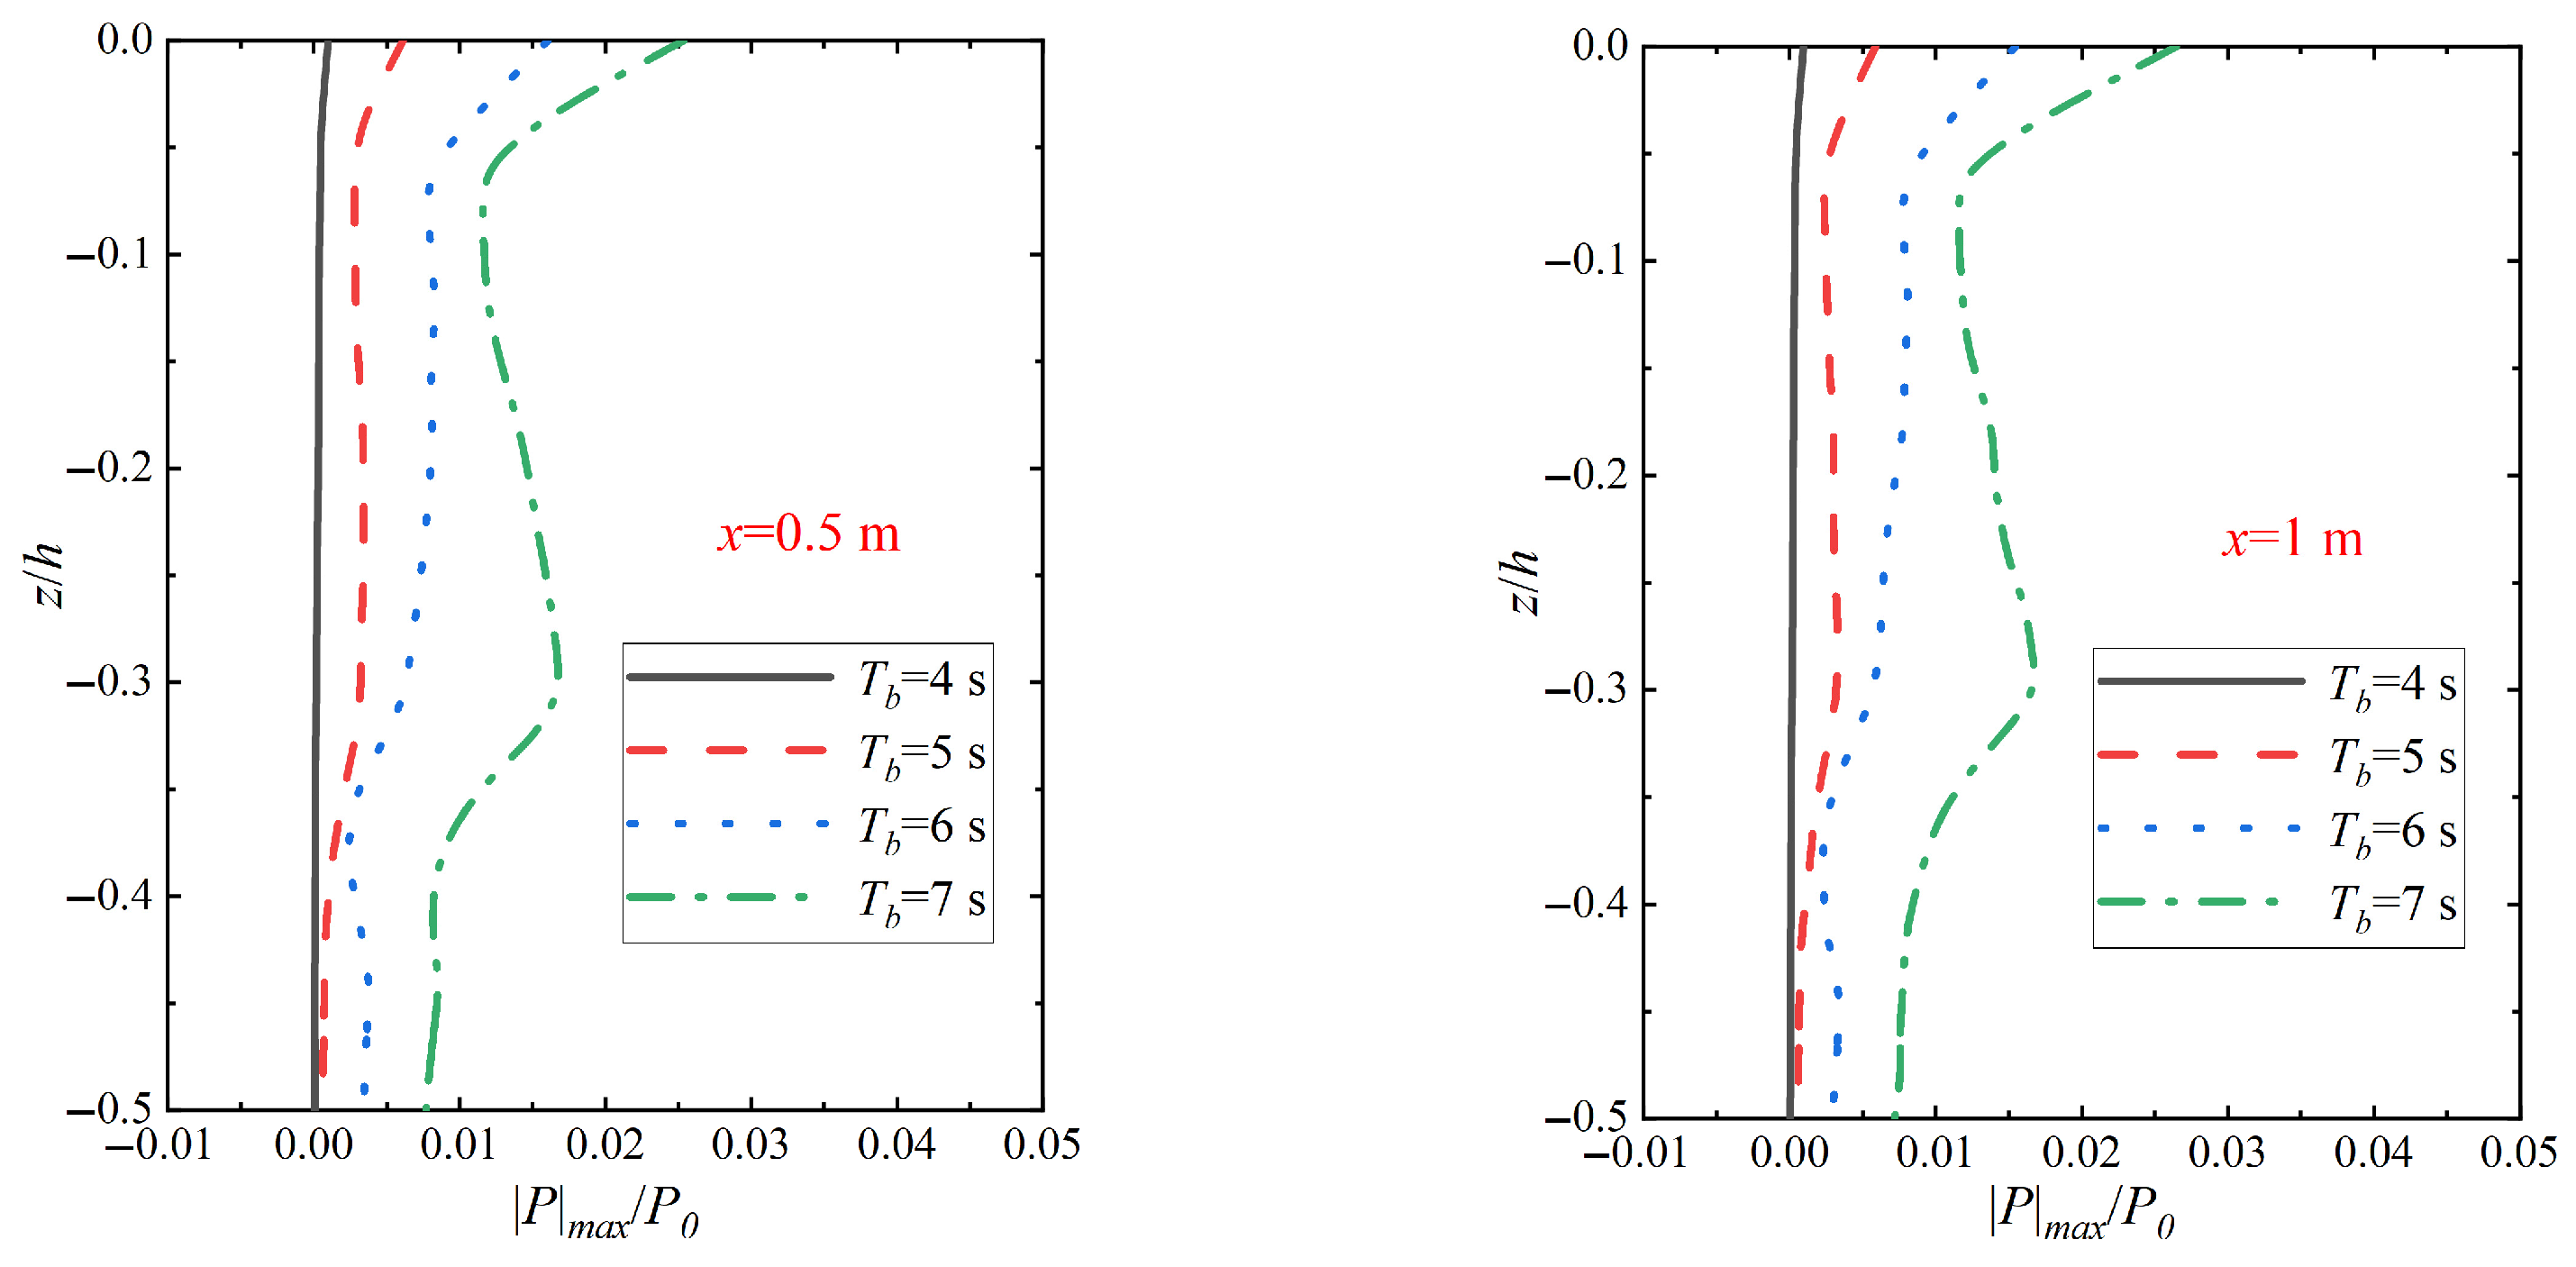
4.5.2. Influence of Vibration Cycle Change and Comparative Analysis

Figure 15 shows the variation in the amplitude distribution of seabed vertical pore pressure at different locations in relation to the pile wall under wave–vibration action with different vibration cycle T actions. From Figure 15, it can be seen that the maximum magnitude points of vertical pore pressure in the range of vibration cycles are all located near the relative depth z/h = −0.06, and extend to the deeper region with the increase in the relative depth of the seabed soil (z/h < −0.3), i.e., accompanied by the overlying three-dimensional seabed soil region, the pore pressure magnitude of the seabed soil along the direction of the relative depth of the pore pressure attenuation rate increases significantly and slows down when the z/h reaches −0.3 when the decay rate becomes slower. This is because the increase in the vibration period implies the decrease in the vibration frequency, which leads to the reciprocating motion of the monopile foundation under the joint action of waves and vibration, thus reducing the pore pressure dissipation in the seabed soil and preventing the pore water pressure from being transmitted to the deep seabed in time. Comparison with Figure 16 shows that the relative amplitude of pore pressure |p|max/p0 under different vibration periods (T = 4 s, 5 s, 6 s, 7 s) has a relatively small increase compared with that under vibration alone. It can be seen that in the shallow region of the seabed soil, the influence of wave action on the distribution of the relative amplitude of the vertical pore pressure on the seabed will continue to diminish with the increase in the vibration period.

4.6. Influence of Seabed Characteristics on Seabed Pore Pressure and Comparative Analysis

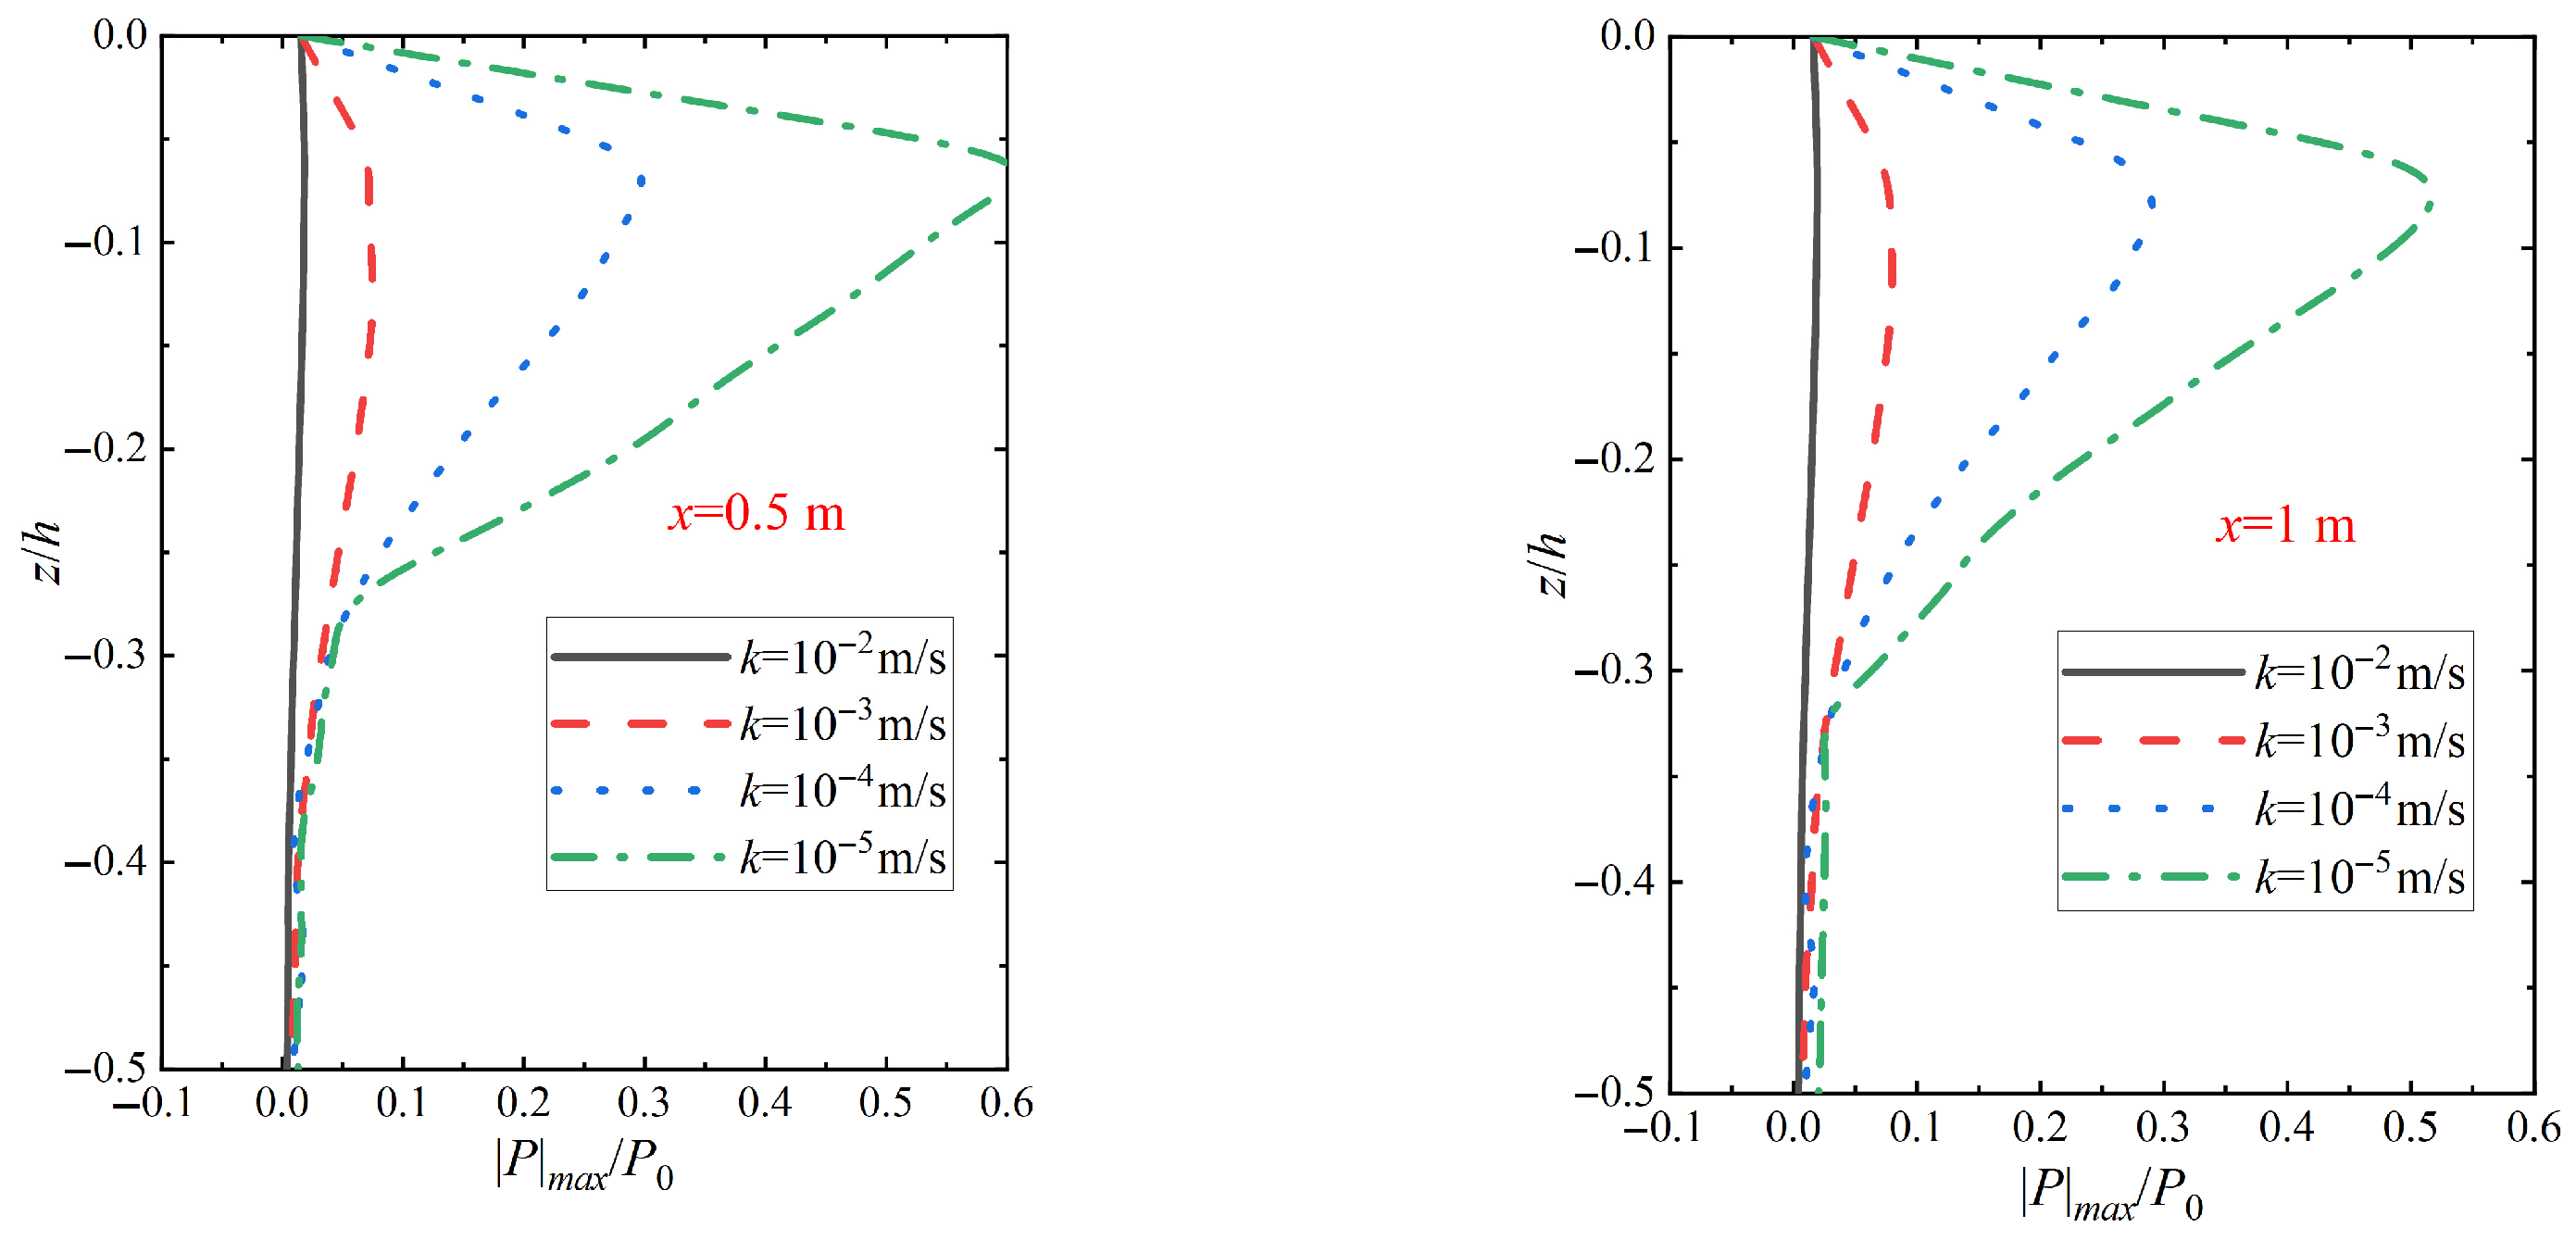
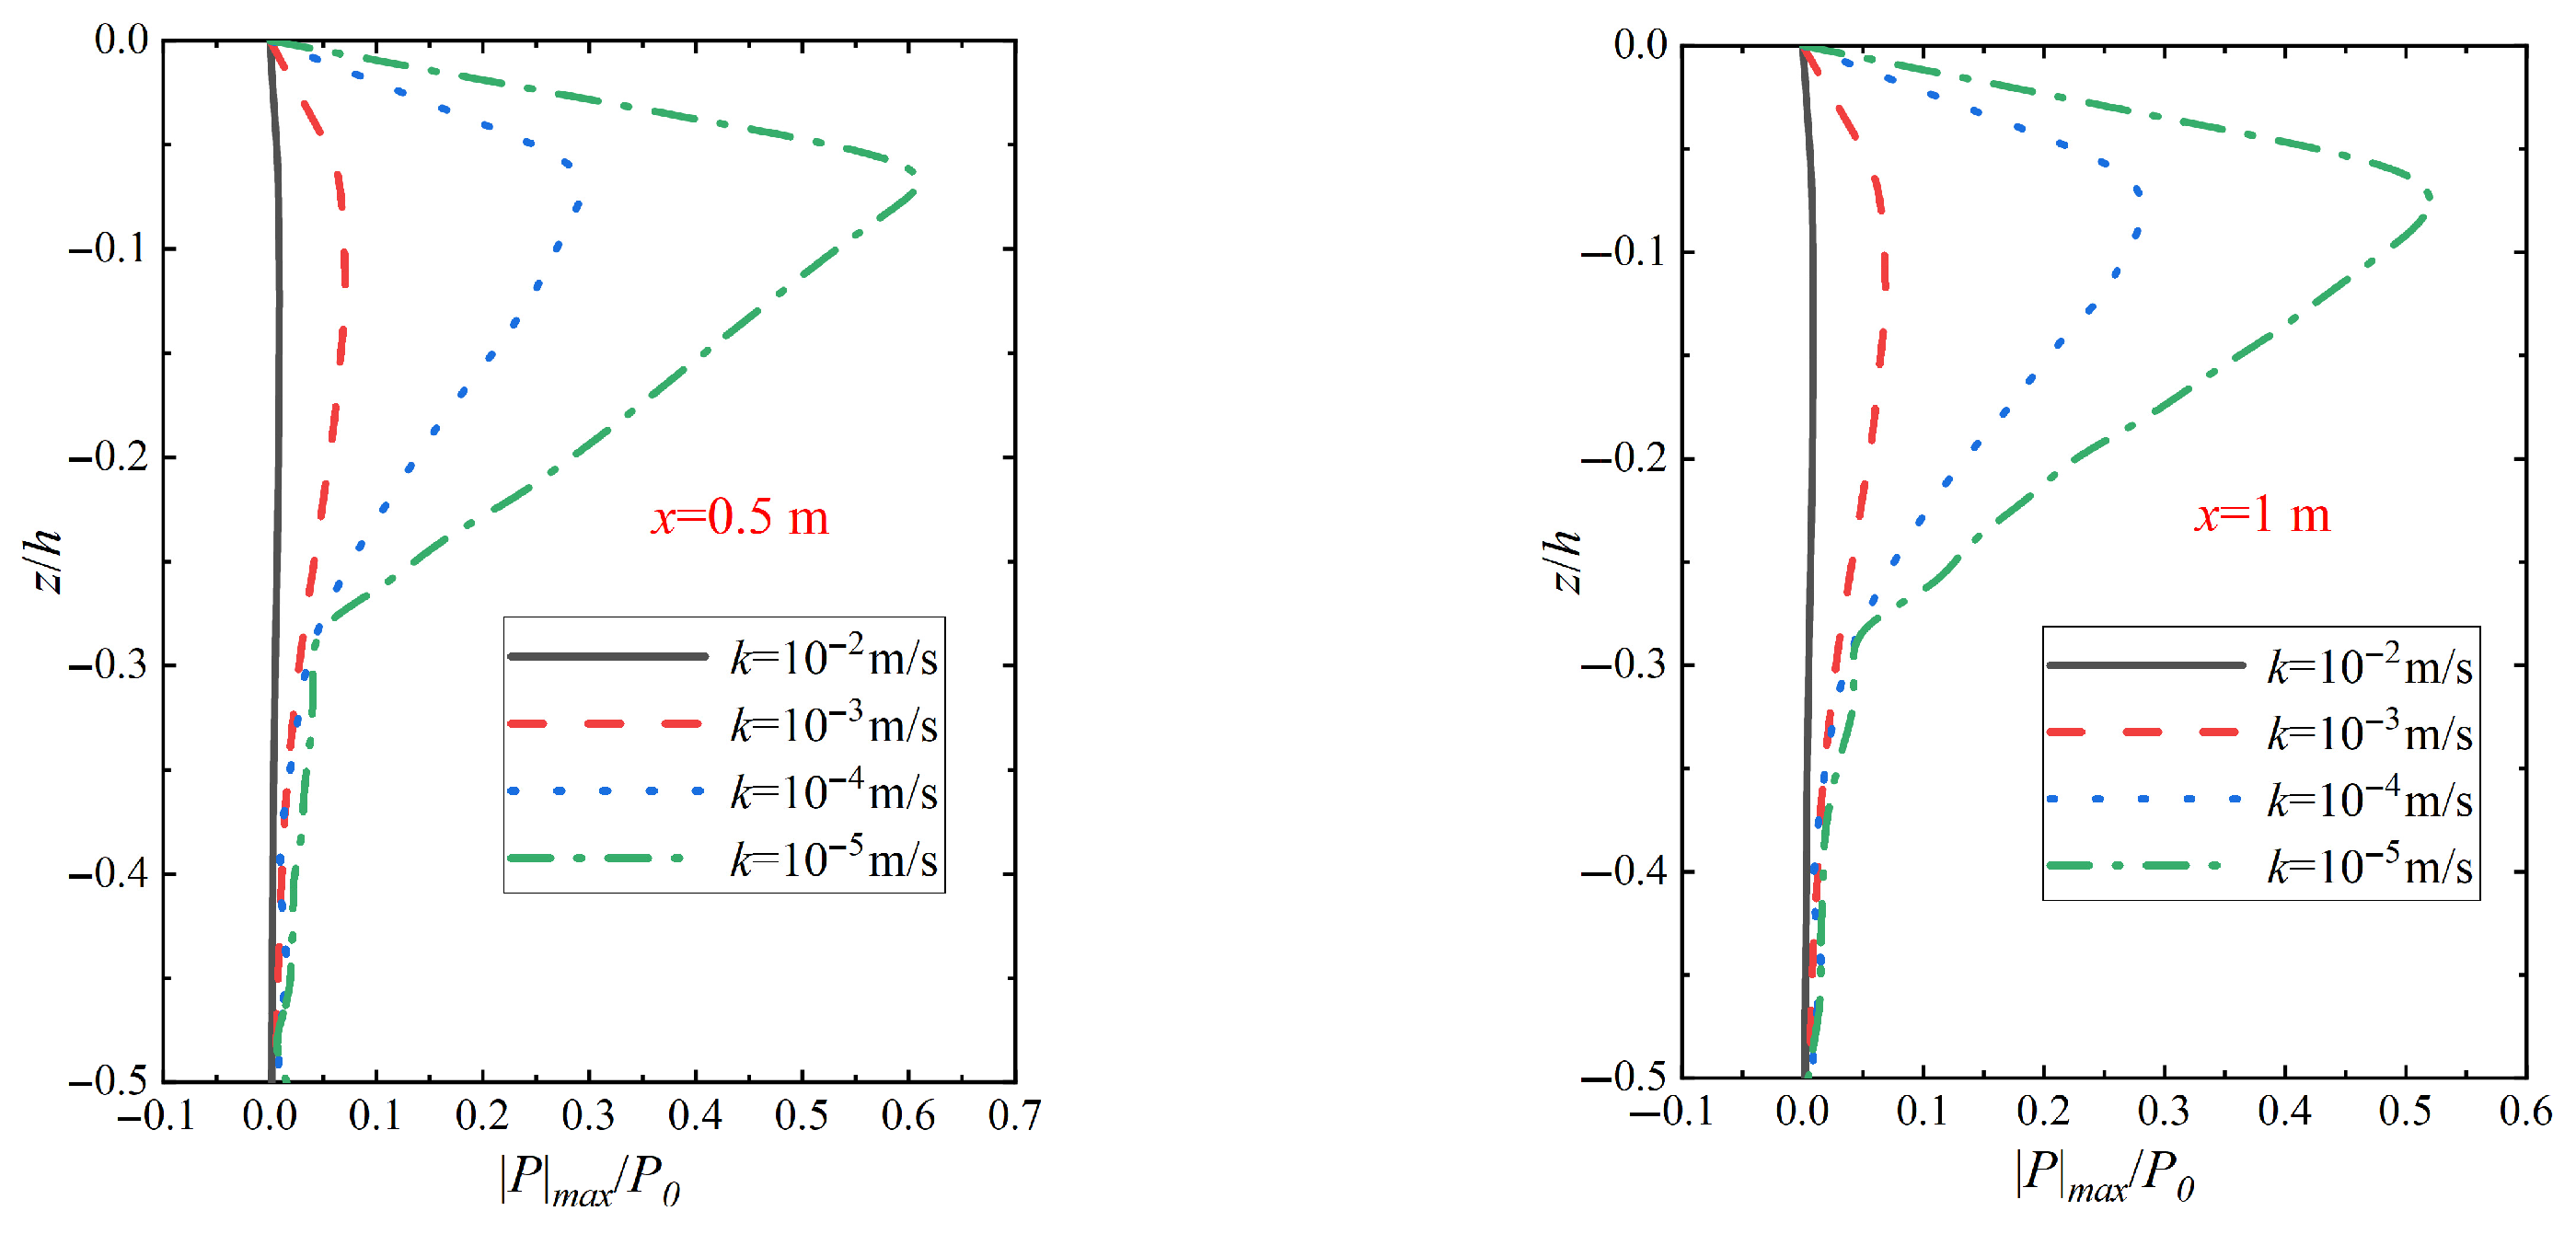
4.6.1. Influence and Comparative Analysis of Changes in Seabed Permeability Coefficient

Figure 17 shows the changes in the distribution of pore pressure amplitude in the vertical direction of the seabed at different positions in relation to the pile wall under wave–vibration action with different seabed permeability coefficients k. From the figure, it can be seen that the relative amplitude of pore pressure along the seabed in the direction of relative depth gradually decreases with the increase in the seabed permeability coefficient. This is because the high permeability coefficient of the seabed can cause the infiltration effect within the soil, i.e., the infiltration of the water flow through the soil particles, and this infiltration effect helps to disperse the wave energy and vibration effects and reduce the interaction between the wave and vibration effects and the soil, which leads to a decrease in the amplitude of pore pressure along the depth direction of the seabed with the increase in the permeability coefficient. Comparison with Figure 18 shows that the relative amplitude of pore pressure at different seabed permeability coefficients (k = 10−2 m/s, 10−3 m/s, 10−4 m/s, 10−5 m/s) is found to vary with the relative depth of wave–vibration at z/h = −0.06, as shown in Figure 18, which shows that the relative amplitude of pore pressure at different depths (k = 10−2 m/s, 10−3 m/s, 10−4 m/s, 10−5 m/s) is found to decrease with increasing depth. The relative amplitude |p|max/p0 is found to be significantly lower for wave–vibration action at relative depth z/h = −0.06 compared to vibration alone. From the attenuation rate it can be concluded that the wave action prevents the interaction between the vibration action and the soil, which reduces the maximum value of the relative magnitude of the pore pressure |p|max/p0 under wave–vibration action.

4.6.2. Influence of Changes in Saturation and Comparative Analysis

Figure 19 shows the changes in the distribution of the vertical pore pressure amplitude on the seabed at different locations in relation to the pile wall under wave–vibration action with different saturation levels of Sr. From Figure 19, it can be seen that the relative amplitude of pore pressure at each depth of the seabed increases with increasing seabed saturation. In addition, when the degree of seabed saturation is 1 (i.e., fully saturated seabed), the relative amplitude of pore pressure at all depths is more significant relative to the unsaturated soil seabed, i.e., the amplitude of change at the degree of seabed saturation is 0.97, 0.98, and 0.99, which is attributed to the fact that as the degree of seabed saturation increases, the content of pore water in the soil increases. At a saturation degree of 1, the soil is fully saturated and the increase in pore water pressure can lead to a gradual increase in the amplitude of the pore pressure along the depth direction of the seabed. By comparing with Figure 20 the changes in pore pressure amplitude distribution along the vertical direction of the seabed when vibration is applied with different seabed saturations Sr, it can be seen that the relative amplitude of pore pressure |p|max/p0 with different seabed saturations (Sr = 1, 0.99, 0.98, 0.97) is found to increase with the relative amplitude of pore pressure |p|max/p0 at a relative depth of z/h = −0.06 for the wave–vibration effect and the relative amplitude of pore pressure under wave–vibration at a relative depth of z/h = −0.06 is found to be relatively small compared to that of pore pressure under vibration alone. From these data it can be seen that wave action has little effect on the relative amplitude of the vertical seabed pore pressure at different levels of seabed saturation.

5. Conclusions

In this study, a multi-field coupled wave–vibration–seabed–single pile model was established based on ABAQUS, wave loads were applied using DLOAD and DISP subroutines, the seabed response was simulated based on the Biot equation, and the vibration effect was simulated by the amplitude of the pile tip displacement. The model validation results show that the numerical simulation is in good agreement with the experimental data. The main conclusions of the research are as follows:
(1) The peak pore pressure and the phase of the pore pressure waveform at different depths along the seabed under the combined wave–vibration action show significant differences. This indicates that the difference in pile displacements caused by waves and vibration at different depths leads to significant differences in the pore pressure dissipation characteristics of the seabed soil at different depths in the vertical direction, a phenomenon similar to the pore pressure dissipation characteristics of waves alone or vibrations alone.
(2) The response of the seabed around a monopile under combined wave–vibration action is significantly different from that under either wave or vibration action alone. Compared to pure vibration, the wave incidence carries more energy and generates a greater wave pressure at the seabed surface, resulting in a non-zero pore pressure at the seabed surface under wave–vibration action. Compared to pure wave action, the movement of the monopile and the seabed creates suction and pressure on the ground, changing the ground forces and thus affecting the seabed pore pressure distribution.
(3) Waves, vibrations, and changes in seabed parameters all have a more pronounced effect on the seabed pore pressure response around monopile foundations. In the shallow areas of the seabed, the effect of vibrations on pore pressure decreases with increasing wave heights and wave periods. The peak value of pore pressure relative amplitude change is linearly related to the peak value of pile vibration displacement, and vibration has less effect on pore pressure at different peak values of vibration displacement. The wave action hinders the interaction between the vibration action and the soil, which reduces the maximum value of the relative amplitude of pore pressure for different seabed permeability coefficients under wave and vibration action.
In this study, only the response characteristics of the seabed around the monopile foundation are comparatively analysed. However, since the numerical software model is mainly based on the simplified generalised model, which has some deviation from the actual engineering design, there are still some problems that need to be further explored in depth.
(1) In this study, only the pore pressure response around the monopile foundation under each load is analysed, ignoring whether the wave effect leads to an overestimation or underestimation of the pore pressure, and more advanced methods will be used subsequently to explore the influence of the wave effect on the pore water pressure at the seabed.
(2) This study is based on a simplified generalised model, focusing on revealing the effects of waves, vibrations, and changes in seabed parameters on pore water pressure, without considering long-term sediment changes or cumulative effects, which will be explored in depth in the future by combining with more advanced modules of ABAQUS.

Author Contributions

Conceptualisation, Z.Y.; methodology, H.D. and Z.Y.; software, Z.Y.; validation, H.D., Z.L. and D.W.; formal analysis, H.D., D.W. and J.H.; investigation, D.W.; resources, Y.C.; data curation, D.W., J.H. and Z.Y.; writing—original draft preparation, H.D. and J.H.; writing—review and editing, Z.L. and Y.C.; visualisation, H.D. and Z.Y.; supervision, Z.L. and Y.C.; project administration, Y.C.; funding acquisition, Y.C. All authors have read and agreed to the published version of the manuscript.

Funding

This study was financially supported by the National Natural Science Foundation of China (Grant No. 52371258).

Institutional Review Board Statement

Not applicable.

Informed Consent Statement

Not applicable.

Data Availability Statement

Data is contained within the article.

Conflicts of Interest

The authors declare that they have no known competing financial interests or personal relationships that could have appeared to influence the work reported in this paper.

References

  1. Han, X.; Cao, T.; Sun, T. Analysis on the variation rule and influencing factors of energy consumption carbon emission intensity in China’s urbanization construction. J. Clean. Prod. 2019, 238, 117958. [Google Scholar] [CrossRef]
  2. Keivanpour, S.; Ramudhin, A.; Ait Kadi, D. The sustainable worldwide offshore wind energy potential: A systematic review. J. Renew. Sustain. Energy 2017, 9, 065902. [Google Scholar] [CrossRef]
  3. Tao, W.; Liu, M.; Zhou, G.; Qiu, X. Influence of scour on subsea cables and bend restrictors of offshore wind farm. Acta Energiae Solaris Sin. 2022, 43, 186–193. [Google Scholar]
  4. Chambel, J.; Fazeres-Ferradosa, T.; Miranda, F.; Bento, A.M.; Taveira-Pinto, F.; Lomonaco, P. A comprehensive review on scour and scour protections for complex bottom-fixed offshore and marine renewable energy foundations. Ocean Eng. 2024, 304, 117829. [Google Scholar] [CrossRef]
  5. Saathoff, J.E.; Goldau, N.; Achmus, M.; Schendel, A.; Welzel, M.; Schlurmann, T. Influence of scour and scour protection on the stiffness of monopile foundations in sand. Appl. Ocean Res. 2024, 144, 103920. [Google Scholar] [CrossRef]
  6. Zhou, W.; Cheng, Y.; Zhang, J. Preventing scour of monopile foundations using a vertical rotation device. Ocean Eng. 2024, 311, 118879. [Google Scholar] [CrossRef]
  7. Yao, Z.; Melville, B.; Shamseldin, A.Y.; Wang, R.; Guan, D. New insights into local scour characteristics around vibrating monopiles under combined wave-current conditions. Ocean Eng. 2025, 315, 119812. [Google Scholar] [CrossRef]
  8. Tao, G.; Zhao, X.; Hou, Y.; Huang, Z.; Zhang, S.; Lu, J. Experimental investigation on scour characteristics and predictive model of monopile foundations under breaking waves. Coast Eng. 2025, 200, 104764. [Google Scholar] [CrossRef]
  9. Dolores Esteban, M.; López-Gutiérrez, J.S.; Negro, V.; Matutano, C.; García-Flores, F.M.; Millán, M.Á. Offshore wind foundation design: Some key issues. J. Energy Resour. Technol. 2015, 137, 051211. [Google Scholar] [CrossRef]
  10. Zhang, J.; Wang, H. Development of offshore wind power and foundation technology for offshore wind turbines in China. Ocean Eng. 2022, 266, 113256. [Google Scholar] [CrossRef]
  11. Sui, T.; Liu, C.; Zhang, J.; Zhang, C.; Zheng, J. 3D numerical modeling of wave–monopile–seabed interaction in the presence of a scour hole. Ocean Eng. 2024, 298, 117254. [Google Scholar] [CrossRef]
  12. Yu, P.; Hu, R.; Zhu, C.; Zhang, X.; Zhao, J.; Yang, Q. Experimental study on dynamic response of seabed around offshore monopile under wave action. J. Phys. 2024, 2771, 012007. [Google Scholar] [CrossRef]
  13. Menéndez-Vicente, C.; López-Querol, S.; Harris, J.M.; Tavouktsoglou, N.S. Numerical study on the stiffening properties of scour protection around monopiles for Offshore Wind Turbines. Eng. Geol. 2025, 345, 107835. [Google Scholar] [CrossRef]
  14. Zhao, H.-Y.; Jeng, D.-S.; Liao, C.-C.; Zhu, J.-F. Three-dimensional modeling of wave-induced residual seabed response around a mono-pile foundation. Coast. Eng. 2017, 128, 1–21. [Google Scholar] [CrossRef]
  15. Seed, H.-B.; Rahman, M.-S. Wave-induced pore pressure in relation to ocean floor stability of cohesionless soils. Mar. Georesour. Geotechnol. 1978, 3, 123–150. [Google Scholar] [CrossRef]
  16. Jeng, D.-S.; Ye, J.-H.; Zhang, J.-S.; Liu, P.-F. An integrated model for the wave-induced seabed response around marine structures: Model verifications and applications. Coast. Eng. 2013, 72, 1–19. [Google Scholar] [CrossRef]
  17. Biot, M.A. General theory of three-dimensional consolidation. J. Appl. Phys. 1941, 12, 155–164. [Google Scholar] [CrossRef]
  18. Biot, M.A. Mechanics of deformation and acoustic propagation in porous media. J. Appl. Phys. 1962, 33, 1482–1498. [Google Scholar] [CrossRef]
  19. Yamamoto, T.; Koning, H.L.; Sellmeijer, H.; Van Hijum, E.P. On the response of a poro-elastic bed to water waves. J. Fluid Mech. 1978, 87, 193–206. [Google Scholar] [CrossRef]
  20. Jeng, D.S. Wave-induced seabed instability in front of a breakwater. Ocean Eng. 1977, 24, 887–917. [Google Scholar] [CrossRef]
  21. Sumer, B.M.; Ozgur Kirca, V.S.; Fredsøe, J. Experimental validation of a mathematical model for seabed liquefaction under waves. Int. J. Offshore Polar Eng. 2012, 22, 133–141. [Google Scholar]
  22. Sui, T.; Zhang, C.; Guo, Y.; Zheng, J.; Jeng, D.; Zhang, J.; Zhang, W. Three-dimensional numerical model for wave-induced seabed response around mono-pile. Ships Offshore Struct. 2016, 11, 667–678. [Google Scholar] [CrossRef]
  23. Zhang, Q.; Zhai, H.; Wang, P.; Wang, S.; Duan, L.; Chen, L.; Liu, Y.; Jeng, D.S. Experimental study on irregular wave-induced pore-water pressures in a porous seabed around a mono-pile. Appl. Ocean Res. 2020, 95, 102041. [Google Scholar] [CrossRef]
  24. Arany, L.; Bhattacharya, S.; Macdonald, J.; Hogan, S.J. Simplified critical mudline bending moment spectra of offshore wind turbine support structures. Wind. Energy 2015, 18, 2171–2197. [Google Scholar] [CrossRef]
  25. Jeng, D.-S.; Luo, X.-D.; Zhang, J.-S. Numerical model for rocking of mono-pile in a porous seabed. In Proceedings of the COMSOL Conference 2010 Paris, Paris, France, 17–19 November 2010. [Google Scholar]
  26. Yu, Z.; Cheng, Y.; Cheng, H. Experimental investigation on seabed response characteristics considering vibration effect of offshore monopile foundation. Ocean Eng. 2023, 288, 116000. [Google Scholar] [CrossRef]
  27. Liao, C.; Chen, J.; Zhang, Y. Accumulation of pore water pressure in a homogeneous sandy seabed around a rocking mono-pile subjected to wave loads. Ocean Eng. 2019, 173, 810–822. [Google Scholar] [CrossRef]
  28. Zhang, Y. Pile-Seabed Interaction Behavior and Long-Term Response Under Wave Loads Considering the Rocking Effect of Mono-Pile. Master’s Thesis, Shanghai Jiao Tong University, Shanghai, China, 2018. [Google Scholar]
  29. Ye, J.; Jeng, D.S.; Chan, A.H.C.; Wang, R.; Zhu, Q.C. 3D Integrated numerical model for fluid–structures–seabed interaction (FSSI): Elastic dense seabed foundation. Ocean Eng. 2016, 115, 107–122. [Google Scholar] [CrossRef]
  30. Yu, D. Study and Application of Integrated Numerical Model for Wave-Seabed-Structure Interaction. Ph.D. Thesis, China University of Geosciences, Beijing, China, 2022. [Google Scholar]
  31. Zienkiewicz, O.C.; Scott, F.C. On the principle of repeatability and its application in analysis of turbine and pump impellers. Int. J. Numer. Methods Eng. 1972, 4, 445–448. [Google Scholar] [CrossRef]
  32. Tanwar, S.; Famhawite, L.; Verma, P.R. Numerical Simulation of bio-heat transfer for cryoablation of regularly shaped tumours in liver tissue using multiprobes. J. Therm. Biol. 2023, 113, 103531. [Google Scholar] [CrossRef]
  33. Ye, J.-H.; Jeng, D.-S. Response of porous seabed to nature loadings: Waves and currents. J. Eng. Mech. 2012, 138, 601–613. [Google Scholar] [CrossRef]
  34. Hsu, J.-R.-C.; Jeng, D.-S. Wave-induced soil response in an unsaturated anisotropic seabed of finite thickness. Int. J. Numer. Anal. Methods Geomech. 1994, 18, 785–807. [Google Scholar] [CrossRef]
  35. Liu, B. Experimental Study for Seabed Response Under Wave Loading. Ph.D. Thesis, Shanghai Jiao Tong University, Shanghai, China, 2016. [Google Scholar]
  36. Hansen, N. Interaction Between Seabed Soil and Offshore Wind Turbine Foundations. Ph.D. Thesis, Technical University of Denmark, Mechanical Engineering, Kongens Lyngby, Denmark, 2012. [Google Scholar]
Figure 1. Schematic diagram of monopile foundation and geometric model of seabed foundation (unit: m): (a) front view; (b) vertical view.
Jmse 13 01309 g001
Figure 2. Comparison of the numerical results of the pore pressure amplitude in the depth direction of the coastal bed of fine sand with the results of the analytical solution: (a) Sr = 0.98; (b) Sr = 1.
Jmse 13 01309 g002
Figure 3. Numerical results of pore pressure ephemeral curves for different seabed depths in fine sand compared with analytical solution: (a) z/h = −0.2; (b) z/h = −0.6.
Jmse 13 01309 g003
Figure 4. Comparison of experimental results and numerical simulation results of pore water pressure duration curves at different seabed depths: (a) depth corresponding to pore water manometer P1; (b) depth corresponding to pore water manometer P3.
Jmse 13 01309 g004
Figure 5. Comparison of pore pressure between numerical simulation and test results at different locations of pile vibration [36]: (a) R1 = 2 cm; (b) R2 = 7 cm; (c) R3 = 12 cm.
Jmse 13 01309 g005
Figure 6. Pore pressure, shear stress, and displacement distribution in monopile foundations for offshore wind turbines and their seabed soils: (a) pore pressure; (b) shear stress; (c) x-direction displacement; (d) z-direction displacement.
Jmse 13 01309 g006
Figure 7. Time curves of pore pressure oscillation response at different depths on the seabed with different parameters: (a) H = 3 m, Tb = 6 s, Xp = 20 mm, T = 6 s, k = 1 × 10⁻⁴ m/s, Sr = 1.0; (b) Xp = 20 mm, T = 6 s, k = 1 × 10⁻⁴ m/s, Sr = 1.0; (c) Tb = 6 s, k = 1 × 10⁻⁴ m/s, Sr = 1.0.
Jmse 13 01309 g007
Figure 8. Distribution of vertical pore pressure in front of the pile at different moments of a cycle with different parameters (a) H = 3 m, Tb = 6 s, Xp = 20 mm, T = 6 s, k = 1 × 10⁻⁴ m/s, Sr = 1.0; (b) Xp = 20 mm, T = 6 s, k = 1 × 10⁻⁴ m/s, Sr = 1.0; (c) H = 3 m, Tb = 6 s, k = 1 × 10⁻⁴ m/s, Sr = 1.0.
Jmse 13 01309 g008
Figure 9. Variation in seabed vertical pore pressure amplitude distribution under wave–vibration action with different wave height H actions (Tb = 6 s, Xp = 20 mm, T = 6 s, k = 1 × 10⁻⁴ m/s, Sr = 1.0).
Jmse 13 01309 g009
Figure 10. Variation in seabed vertical pore pressure amplitude distribution under wave action with different wave height H actions (Tb = 6 s, k = 1 × 10⁻⁴ m/s, Sr = 1.0).
Jmse 13 01309 g010
Figure 11. Variation in vertical pore pressure amplitude distribution on seabed with different cycles of Tb action under wave–vibration action (H = 3 m, Xp = 20 mm, T = 6 s, k = 1 × 10⁻⁴ m/s, Sr = 1.0).
Jmse 13 01309 g011
Figure 12. Variation in seabed vertical pore pressure amplitude distribution during wave action with different cycles of Tb action (H = 3 m, k = 1 × 10⁻⁴ m/s, Sr = 1.0).
Jmse 13 01309 g012
Figure 13. Variation in seabed vertical pore pressure amplitude distribution under wave–vibration action with different peak vibration displacement Xp actions (H = 3 m, Tb = 6 s, T = 6 s, k = 1 × 10⁻⁴ m/s, Sr = 1.0).
Jmse 13 01309 g013
Figure 14. Variation in seabed vertical pore pressure amplitude distribution under vibration with different peak vibration displacement Xp actions (T = 6 s, k = 1 × 10⁻⁴ m/s, Sr = 1.0).
Jmse 13 01309 g014
Figure 15. Variation in seabed vertical pore pressure amplitude distribution under wave–vibration action with different vibration period T actions (H = 3 m, Tb = 6 s, Xp = 20 mm, k = 1 × 10⁻⁴ m/s, Sr = 1.0).
Jmse 13 01309 g015
Figure 16. Variation in seabed vertical pore pressure amplitude distribution under vibration action with different vibration period T actions (Xp = 20 mm, k = 1 × 10⁻⁴ m/s, Sr = 1.0).
Jmse 13 01309 g016
Figure 17. Variation in vertical pore pressure amplitude distribution under wave–vibration action with different seabed permeability coefficient k actions (H = 3 m, Tb = 6 s, Xp = 20 mm, T = 6 s, Sr = 1.0).
Jmse 13 01309 g017
Figure 18. Variation in vertical pore pressure amplitude distribution under vibration with different seabed permeability coefficient k actions (Xp = 20 mm, T = 6 s, Sr = 1.0).
Jmse 13 01309 g018
Figure 19. Variation in seabed vertical pore pressure amplitude distribution under wave–vibration with different saturation Sr actions (H = 3 m, Tb = 6 s, Xp = 20 mm, T = 6 s, k = 1 × 10⁻⁴ m/s).
Jmse 13 01309 g019
Figure 20. Variation in seabed vertical pore pressure amplitude distribution under vibration with different seabed saturation Sr actions (Xp = 20 mm, T = 6 s, k = 1 × 10⁻⁴ m/s).
Jmse 13 01309 g020
Table 1. Table of wave–vibration test conditions.
Working
Condition
H/(m)Tb/(s)Xp/(mm)T/(s)k/(m/s)Sr
1262061 × 10−41.0
22.562061 × 10−41.0
3362061 × 10−41.0
43.562061 × 10−41.0
5342061 × 10−41.0
6352061 × 10−41.0
7372061 × 10−41.0
8361061 × 10−41.0
9363061 × 10−41.0
10364061 × 10−41.0
11362041 × 10−41.0
12362051 × 10−41.0
13362071 × 10−41.0
14362061 × 10−31.0
15362061 × 10−51.0
16362061 × 10−61.0
17362061 × 10−40.99
18362061 × 10−40.98
19362061 × 10−40.97
Disclaimer/Publisher’s Note: The statements, opinions and data contained in all publications are solely those of the individual author(s) and contributor(s) and not of MDPI and/or the editor(s). MDPI and/or the editor(s) disclaim responsibility for any injury to people or property resulting from any ideas, methods, instructions or products referred to in the content.

