Abstract
Porous artificial reef materials made of cement used in the offshore area can repair and improve the ecological environment and enrich fishery resources. In this study, quartz sand was used as the aggregate, high-alumina cement as the cementing agent, and crushed particles of waste tires as the modifier to prepare porous cement–polymer composites. Through orthogonal tests, the effects of the aggregate particle size, the ratio of aggregate to cement, the rubber particle size, and the rubber ratio on the strength and permeability of the porous cement–polymer composites were studied. The significant degrees of different influencing factors were analyzed, and an appropriate configuration scheme for the porous cement–polymer composites was proposed. The experimental results show that the quantity of rubber particles added and the particle size of the rubber particles have a relatively large impact on the properties of the porous cement–polymer composites. Through response surface tests, the interactive effects of various factors in the porous cement–polymer composites on the compressive strength and permeability of the material were verified. The microstructure of the porous cement–polymer composites was observed by SEM. The differences in the microstructure and internal structure between the specimens with a low rubber content and large rubber particle size and those with a high rubber content and small rubber particle size were analyzed, and the influence mechanism of the differences in the microstructure and internal structure on the strength and permeability was proposed.
1. Introduction
Permeable porous concrete materials can be used to manufacture artificial reefs and surface protection blocks for breakwaters and harbors. The ecological environment can be improved and fishery resources can be enriched [1,2] by setting artificial reefs, which need a certain strength and good water permeability [3,4,5], in offshore areas, which can promote the attachment of organisms to them. Based on numerical model investigations [6,7], it has been demonstrated that the erection of artificial offshore structures has led to significant alterations in tidal fluxes and suspended sediment fluxes across various regions. These modifications not only disrupt the delicate balance of the marine environment but also exert detrimental effects on photosynthetic organisms. Nevertheless, the utilization of permeable materials in construction can mitigate such impacts. Research [8] on the hydrodynamic properties of permeable breakwaters has revealed that such structures allow water to freely permeate, effectively minimizing disturbances to ocean currents.
Consequently, when selecting materials for nearshore construction, it is imperative to prioritize those with both adequate strength and permeability [9,10]. These materials can withstand the dynamic forces of ocean waves, ensuring structural integrity while reducing the ecological adverse effects.
The study of permeable porous concrete materials has a long history [11,12] and has achieved extensive applications. Using quartz sand separated from kaolin industry tailings as aggregate in permeable porous concrete materials can conserve natural resources such as sand and gravel [13,14]. Studies have shown that both the porosity and permeability coefficient of porous concrete slightly increase with the increase in the content of quartz sands. The void ratio and permeability coefficient increase with an increase in the polymer mixing ratio. The compressive strength and flexural strength of quartz sands first decrease and then increase with an increase in the mixing ratio, but they significantly improve as the mixing ratio increases [15,16]. When quartz sands are used in permeable porous concrete materials, their strength can reach the level of porous concrete materials using natural aggregates [17,18,19,20,21]. Using waste rubber particles [22,23,24] in permeable porous concrete materials can increase ductility, reduce density, improve energy absorption capacity and impact resistance, and achieve the effect of recycling waste rubber.
Orthogonal experimental design is an efficient experimental design method for scientifically arranging and analyzing multifactor and multilevel experiments based on orthogonal arrays. Its core lies in leveraging the orthogonality of orthogonal arrays (i.e., the characteristics of “balanced dispersion and comprehensive comparability”) to select a representative subset of experimental points from numerous possible combinations for testing. Orthogonal experimental design can obtain comprehensive information on the effects of various factors with fewer test runs, thereby optimizing experimental schemes or analyzing the influence of each factor on the results. It has wide applications in the formulation and proportioning of cement-based materials [25,26,27].
This study uses three materials—quartz sand, CA72.5 cement, and rubber particles—to prepare porous cement–polymer composites. Taking compressive strength and permeability as dependent variables and considering four influencing factors—the mass ratio of rubber particles to cement, the mass ratio of quartz sand to cement, aggregate particle size, and rubber particle size—the effects of these four factors on the compressive strength and permeability of porous cement-based composites were investigated through orthogonal experiments. Based on the research results, the mix proportion of the porous cement–polymer composites was optimized. The optimized porous cement-based polymer composites demonstrate outstanding compressive strength and permeability properties, offering a scientific basis for material selection in offshore engineering structures such as artificial reefs. Additionally, scanning electron microscopy (SEM) was employed to characterize the microstructural features of the prepared composites, thereby microscopically elucidating the mechanical strength development mechanism and permeation mechanism of the porous cement-based polymer composites.
2. Materials and Methods
2.1. Materials
There are three raw materials used to fabricate the porous cement-based materials in this paper: the aggregate is quartz sand separated from kaolin industry tailings; the cementitious material is cement; and the modifier for improving the material’s water permeability is rubber particles recycled from waste tires. The quartz sands selected for this study had three particle size ranges: 0.05–1 mm, 1–4 mm, and 4–9 mm, and the particles of quartz sands in the three size ranges are shown in Figure 1.
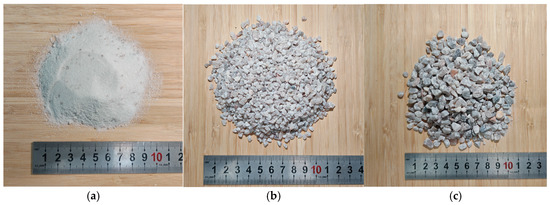
Figure 1.
Quartz sands: (a) 0.05–1 mm, (b) 1–4 mm, (c) 4–9 mm.
The cementitious material used in the preparation of porous cement–polymer composites in this study is high-alumina cement (CA72.5 cement), as shown in Figure 2. Its main mineral composition is calcium monoaluminate (CaO·Al2O3), along with small amounts of dicalcium silicate and other aluminates. High-alumina cement exhibits rapid early-stage strength development, though its late-stage strength gain is less significant [28]. It is characterized by rapid hardening, high strength, heat resistance, and corrosion resistance.
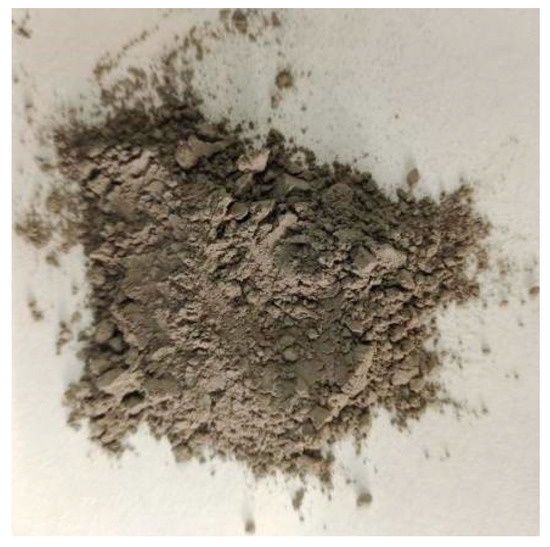
Figure 2.
CA72.5 cement.
In this study, waste rubber particles were used to enhance the permeability of porous cement–polymer composites during preparation. Three particle size ranges were also selected for the rubber particles: 0.05–1 mm, 1–4 mm, and 4–9 mm. The waste rubber particles in the three size ranges are shown in Figure 3.
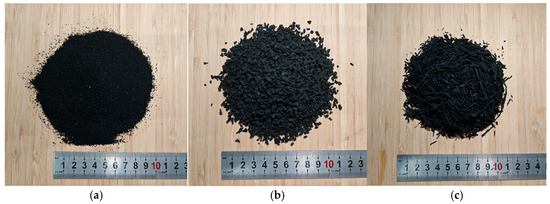
Figure 3.
Waste rubber particles: (a) 0.05–1 mm, (b) 1–4 mm, (c) 4–9 mm.
2.2. Specimen Production and Compressive Strength, Permeability Test Methods
In the process of developing porous cement-based materials, the mass ratio of rubber particles to cement, the mass ratio of quartz sand to cement, aggregate particle size, and rubber particle size were selected as the four influencing factors affecting the properties of the porous cement-based materials. In the following text, the four influencing factors are denoted as A, B, C, and D, respectively. An orthogonal experiment factor-level table was designed for the preparation of the porous cement-based materials, and the specific factor levels are shown in Table 1.

Table 1.
Orthogonal experiment factor level.
According to the set factor levels, the mixed scheme of the orthogonal experimental is shown in Table 2.
Table 2.
L9(34) Table of experimental mixed scheme.
Specimens for the compressive strength tests and permeability tests were prepared according to the material mix ratios given in Table 2.
The specimen preparation followed these steps:
- (1)
- All the components except water were weighed using an electronic balance according to the designed mix ratios for orthogonal and response surface tests.
- (2)
- The materials were transferred into a single-shaft horizontal concrete mixer (HJW-60 Single Horizontal Shaft Concrete Mixer, Jinan YM Co., Ltd., Jinan, China) and mixed at a rotating speed of 1 revolution per second for 20 min to ensure uniform dry mixing.
- (3)
- Water was weighed based on a water–cement ratio of 0.3 using an electronic balance, and it was sprinkled evenly into the continuously stirred dry mixture in two stages: 50% of the water was added first, stirring continued until the mixture was fully wetted; then the remaining 50% water was added and stirred for an additional 10 min.
- (4)
- The mixed aggregate paste was uniformly filled into molds to prepare specimens for uniaxial compressive strength testing and permeability testing (Figure 4). The specimens for uniaxial compressive strength testing were cubic blocks with a side length of 5 cm. The specimens used for the permeability test were disk-shaped, with a circular cross-section 10 cm in diameter and a height of 5 cm. When filling the molds, the material was overfilled by approximately 5 mm above the mold surface and preliminarily compacted. A universal testing machine was used to apply pressure: based on the mold surface area, precise pressure up to 3 MPa was applied at a loading rate of 0.1 kN/s, and the pressure was maintained for 30 s after reaching 3 MPa.
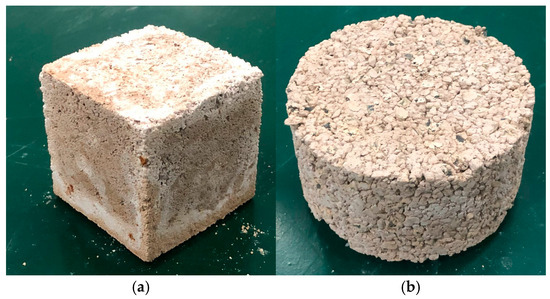 Figure 4. Specimens for (a) uniaxial compression test; (b) permeability test.
 - (5)
- After pressure application, the specimens were transferred to a low-temperature saltwater curing chamber for solidification. They were cured by immersion in 3% saltwater, and compressive strength and permeability tests were conducted after curing for 3 days, 7 days, 14 days, and 28 days under saltwater immersion conditions.
The compressive strength test (Figure 5) was performed on a universal testing machine under displacement-controlled uniaxial compression. The 5 cm cubic specimen was placed on the specimen stage, with strict geometric alignment of the specimen center, compressive splint center, and press platen center. Since the strength of porous concrete is significantly lower than that of ordinary concrete, the loading rate must be strictly controlled during compressive strength testing—an excessive loading speed will affect the accuracy of the measured strength. The specimen was uniformly loaded at a rate of 0.5 mm/min until failure, and the failure load Fc was recorded. Before placing the specimen, the surfaces of the upper and lower loading plates must be thoroughly cleaned to prevent the stress concentration from affecting the strength measurement.
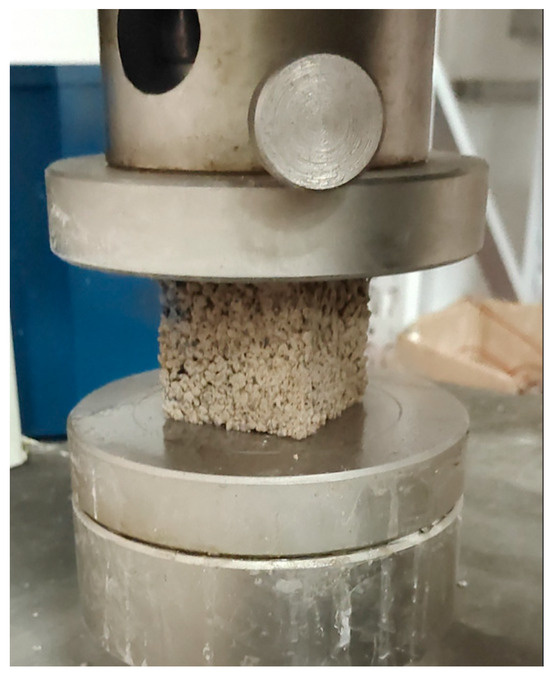
Figure 5.
Uniaxial compressive strength test.
The compressive strength Rc (MPa) is calculated using Equation (1):
- Fc—maximum load at the time of destruction of the specimen (N);
- A—specimen pressure area (mm2).
For each mix protocol, three specimens were prepared and tested in parallel, and their average compressive strength was recorded as the final result. The permeability of the specimens was tested using a permeability tester with the constant head method, where the water flow rate Q within a certain time is proportional to the constant cross-sectional area A of the specimen and the head difference H, and inversely proportional to the specimen height L. The structure of the permeability tester is shown in Figure 6.
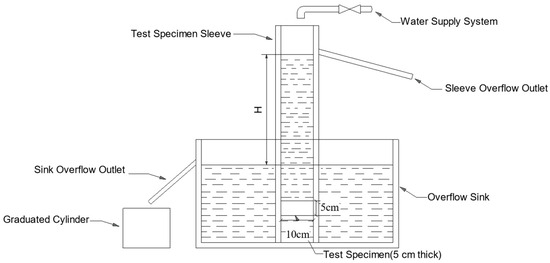
Figure 6.
Schematic diagram of permeability meter.
During the test, the specimen was wrapped with waterproof sealing tape and placed into a metal sleeve, and vacuum silicone grease (a sealing material) was applied to the joints. The specimen was then sealed and connected to a permeable cylinder. Water was added to the permeable cylinder, and any seepage from the joints was checked—if liquid exuded from the specimen surface but no obvious seepage occurred at the joints, the next step could proceed; otherwise, resealing was required. The specimen was placed in an overflow water tank, and the water supply valve was opened to allow liquid to enter the permeable cylinder. Once water flowed out from the overflow hole of the tank, the water inflow was adjusted to maintain a constant head in the permeable cylinder. After the flow rates at the overflow outlets of both the tank and the permeable cylinder stabilized, a graduated cylinder was used to collect water from the outlet, recording the water volume Q collected over 300 s. This measurement was repeated three times, and the average value was recorded. The permeability K of the specimen was calculated using Equation (2):
- K—permeability (cm2), which was converted to mD after the calculation (1 cm2 = 1.013 × 10¹¹ mD);
- Q—water flow in 300 s (cm3);
- L—thickness of the specimen (cm);
- μ—viscosity of the liquid (10−7 N/cm2·s);
- ρ—density of the liquid (g/cm3);
- g—gravitational acceleration (9.8 m/s2);
- H—head difference (cm);
- A—water permeable area of the specimen (cm3);
- t—test time.
The micromorphology of permeable porous cement-based materials was observed using a scanning electron microscope (SEM), and their internal structures were obtained through CT scanning. Based on the analysis of the micromorphology and internal structure, the strength generation mechanism and sources of permeability changes in the permeable porous cement-based materials were explored.
3. Results and Discussion
3.1. Range Analysis and Analysis of Variance
Following testing, the uniaxial compressive strengths of the porous cement-based materials at different curing ages (3d, 7d, 14d, and 28d) and the permeability of the materials cured for 3d are presented in Table 3.
Table 3.
Orthogonal experiment results.
Taking the porous cement-based materials cured for 3 days as a reference, the effects of various factors on the compressive strength of the material were analyzed, and the results of the range analysis are shown in Table 4.
Table 4.
Extreme variance analysis of compressive strength.
From Table 4, the range R for factors A, B, C, and D is 12.38, 5.7, 5.11, and 0.78, respectively. The larger the range value, the greater the influence on compressive strength. Therefore, the order of influence degree of each factor on the material’s compressive strength is: A > B > C > D. The effect plot of the range analysis for each influencing factor on the material’s compressive strength is shown in Figure 7.
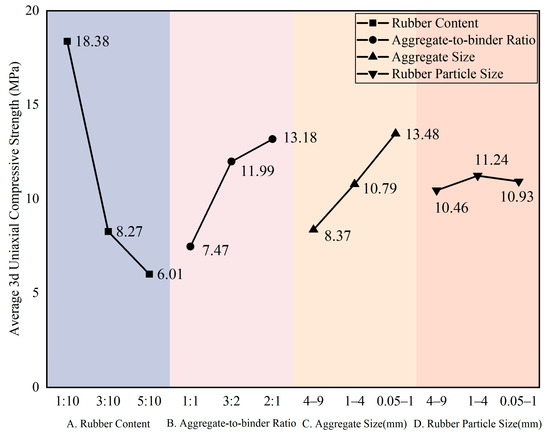
Figure 7.
Influence of factors (A–D) on compressive strength.
From the analysis, factor A has the most significant influence on the compressive strength of the material, with compressive strength decreasing as the rubber ratio increases. It is speculated that this is because rubber itself is hydrophobic, leading to weaker hydration reactions in the cement around rubber particles and forming low-strength bonding interfaces, which create weak bonding surfaces and micro-cracks within the material. An increase in rubber content leads to more weak bonding interfaces and micro-cracks in the skeleton, thus reducing the material’s compressive strength. Factor B also has a notable effect: within the range of sand–cement ratios from 1:1 to 2:1, compressive strength increases with the increase in the sand–cement ratio. The mechanical strength of the material mainly originates from the skeleton strength formed by the bonding between cement and quartz sand aggregates, as well as the interlocking force between adjacent aggregates after bonding. In the range of 1:1 to 2:1, a higher proportion of quartz sand aggregates results in higher overall mechanical strength of the material. Factor C has a certain influence on compressive strength: within the aggregate particle size range of 0.05–9 mm, compressive strength increases as the particle size decreases. It is speculated that reducing the particle size of quartz sand aggregates increases the bonding area with cement, thereby enhancing the overall bonding strength. Smaller particle sizes of quartz sand aggregates per unit mass mean a larger number of individual particles, leading to more interlocking between aggregates and an increase in interlocking force, which also improves the material’s mechanical strength. Factor D has the least influence on compressive strength, with no obvious fluctuations in compressive strength within the rubber particle size range of 0.05–9 mm.
An analysis of variance (ANOVA) was performed for different factors, and the results are shown in Table 5.
Table 5.
ANOVA of factors A, B, C, and D on compressive strength.
It can be concluded that, for the influence on the compressive strength of the material, the F-value of factor A reaches 281.188, which is much larger than the critical F-value of 19, indicating that the rubber ratio has a significant effect on the compressive strength of the material. The F-values of factor B and aggregate particle size are both greater than the critical value, meaning both factors reach a significant level. However, based on the calculated F-values, the significance of the sand–cement ratio and aggregate particle size is lower than that of the rubber ratio, while the influence of rubber particle size is minor and does not reach significance. This is consistent with the results of the range analysis. Considering both the range analysis and the ANOVA results comprehensively, the optimal combination of factor levels for the material’s compressive strength index is a rubber ratio of 1:10, a sand–cement ratio of 2:1, an aggregate particle size of 0.05–1 mm, and a rubber particle size of 1–4 mm.
The range analysis of the effects of each factor on permeability is presented in Table 6.
Table 6.
Extreme variance analysis of permeability.
From the table above, it can be seen that the range values R for factors A, B, C, and D are 17.86, 3.23, 1.02, and 4.82, respectively. The larger the range value, the greater the influence on permeability. Therefore, the order of influence degree of each factor on the material’s permeability is A > D > B > C.
The range analysis of the influencing factors on material permeability is shown in Figure 8.
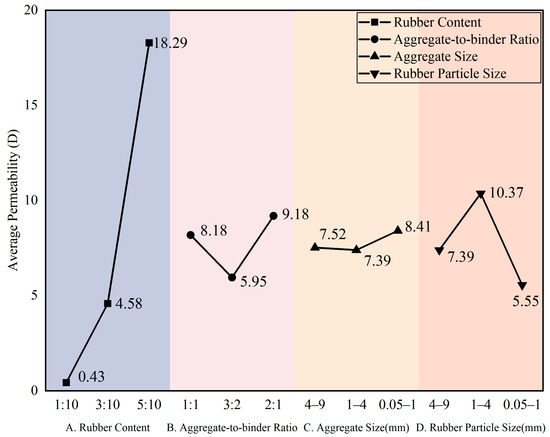
Figure 8.
Influence of factors (A–D) on permeability.
It can be seen that factor A (mass ratio of rubber particles to cement) has the most significant influence on the material’s permeability, with permeability increasing as the rubber ratio increases. This result is consistent with the previous analysis: the weak bonding interfaces and micro-cracks around the rubber particles provide favorable seepage channels for fluids. As the rubber content increases, the distribution of micro-cracks within the specimen becomes more extensive and interconnected, thereby increasing the material’s permeability. Factor D (rubber particle size) also has a notable effect on permeability: within the rubber particle size range of 0.05–9 mm, permeability first increases and then decreases as the particle size decreases. When the rubber particles are larger, the number of particles per unit mass decreases, reducing the contact area with the cement matrix and the formation of micro-cracks and weak bonding interfaces around rubber particles, which in turn reduces seepage channels. As the particle size gradually decreases, the contact area between the rubber particles and cement increases, leading to more pore formation and higher permeability. However, a further reduction in particle size improves the dispersion of rubber particles in the material; pores typically develop around the particles, and smaller particles may result in smaller pores that are concentrated near the particles with short extensions, making it difficult to connect with the micro-cracks around other particles to form continuous seepage channels. Additionally, smaller pores may hinder fluid seepage due to the Jamin effect, causing permeability to decline. Factor B (the mass ratio of quartz sand to cement) has a relatively minor influence on permeability: within the range of 1:1 to 2:1, the permeability first decreases and then increases with the increase in sand–cement ratio, with minimal variation between different levels. Factor C (aggregate particle size) has the least influence on permeability, with no significant differences observed between its levels.
A variance analysis of the influencing factors on permeability was conducted, and the results are shown in Table 7.
Table 7.
ANOVA of factors A, B, C, and D on permeability.
It can be concluded that, for the influence on the material’s permeability, the F-value of factor A (mass ratio of rubber particles to cement) reaches 283.926, which is much larger than the critical F-value of 19, indicating that the rubber ratio has a significant effect on the material’s permeability. The F-value of factor D (rubber particle size) just exceeds the critical value of 19, also showing significance, but its contribution rate is much lower than that of the rubber ratio. The F-values of factors B (the mass ratio of quartz sand to cement) and C (aggregate particle size) are both lower than the critical value, neither reaching a significant level, with the lowest contribution rates. This is consistent with the results of the range analysis. Considering both the range analysis and ANOVA results comprehensively, the optimal combination of factor levels to achieve the best permeability of the cement-based material is factor A is 1:2, factor B is 2:1, factor C is 0.05–1 mm, and factor D is 1–4 mm.
Previous studies have shown that adding rubber particles to cement-based materials at a dosage of less than 2% can enhance the toughness of cement-based materials by forming flexible interfaces. However, excessively high dosages tend to disrupt the continuity of the cement matrix, thereby reducing the material strength [29]. Conversely, increasing the rubber particle dosage to over 10% is necessary to promote pore connectivity and improve permeability in cement-based materials [30]. These findings are consistent with the optimal rubber particle dosages for strength and permeability obtained in this study. Additionally, numerical simulations support the conclusion that rubber particles with a particle size of 1–4 mm are more conducive to enhancing the permeability of cement-based materials [31]. The permeability of cement-based materials relies more on the rubber particle dosage and particle size, while the strength is more significantly influenced by the mass ratio of aggregate to cement and the aggregate particle size. A higher aggregate-to-cement ratio and a smaller aggregate particle size are both beneficial for the development of overall strength in cement-based materials [32]. Notably, the optimal aggregate particle size obtained in this study is smaller than that reported in previous studies. This discrepancy is primarily attributed to the fact that the addition of rubber particles disrupts the integrity of the cement-based material to some extent, necessitating finer aggregates to increase the effective contact area at the cement–aggregate interface and thus improve the material strength.
3.2. Microstructure of Porous Cementitious Materials
Scanning electron microscopy (SEM) and computed tomography (CT) were employed to characterize the specimens with distinct rubber configurations: low rubber content with large particle size (factor A: 1:10, factor B: 1:1, factor C: 4–9 mm, factor D: 4–9 mm), and high rubber content with small particle size (factor A: 1:2, factor B: 2:1, factor C: 4–9 mm, factor D: 0.05–1 mm).
The resulting images are shown in Figure 9.
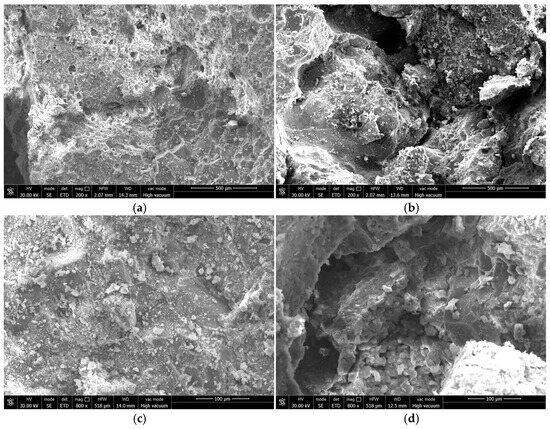
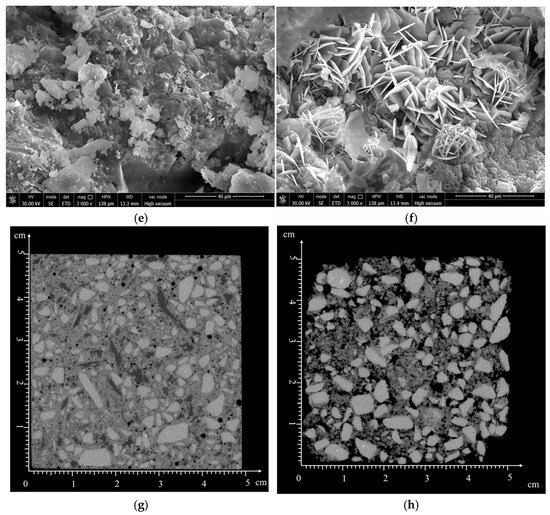
Figure 9.
Microstructural characterization of specimens with varied rubber content and particle size. SEM images of specimens with (a) low rubber content, large particle size (200× magnification); (b) high rubber content, small particle size (200× magnification); (c) low rubber content, large particle size (800× magnification); (d) high rubber content, small particle size (800× magnification); (e) low rubber content, large particle size (3000× magnification); (f) high rubber content, small particle size (3000× magnification). CT scan images of specimens with (g) low rubber content, large particle size; (h) high rubber content, small particle size.
In Figure 9a, cement hydrates bind the quartz sands and rubber particles into a dense matrix, whereas Figure 9b reveals pronounced inter-particle cracks with compromised interfacial bonding integrity. Micro-crack initiation is negligible in Figure 9c, but extensive crack propagation is evident in Figure 9d, highlighting the critical role of rubber particle characteristics. Figure 9e,f illustrate two distinct regimes of cement–rubber bonding: the hydrophobic nature of rubber suppresses cement hydration, forming weak, scaly, separated interfaces that exhibit low tensile strength and facilitate micro-crack nucleation. This behavior correlates with factor A values: 1:10 for low-rubber-content/large-particle specimens versus 1:2 for high-rubber-content/small-particle counterparts. The higher rubber content promotes the formation of defective interfacial transition zones, accelerating crack propagation during loading. Mechanistically, during dry mixing, the cement particles adsorb onto the quartz sand and rubber surfaces; upon hydration, these surfaces serve as nucleation sites for calcium silicate hydrates (C-S-Hs), forming an interlocking skeletal structure. Quartz sand surfaces enable normal hydration, yielding robust interfacial transition zones that integrate aggregates into a cohesive framework. In contrast, rubber’s hydrophobicity inhibits C-S-H growth, creating porous, mechanically deficient interfaces. Weak rubber interfacial transition zones act as stress concentrators, initiating cracks that propagate through the matrix and reducing the load-bearing capacity. Conversely, a higher rubber content and smaller particle sizes increase the surface area of weak interfacial transition zones, forming interconnected void networks that facilitate fluid transport.
CT scan grayscale values reflect density, where a higher density corresponds to a brighter grayscale. In CT images, specimen components from white to black denote quartz sands, cement binder, rubber particles, and pores. The cement binder between particles in the low-rubber-content/large-particle-size specimen (Figure 9g) exhibits higher grayscale values than that in the high-rubber-content/small-particle-size specimen (Figure 9h), indicating superior cement bonding, fewer weak interfaces, denser microstructure, reduced porosity, and tighter inter-aggregate interlocking. Consequently, the high-rubber-content/small-particle-size specimen displays only ~30% of the mechanical strength of its low-rubber/large-particle counterpart. As prior studies highlight [33,34], both excessively coarse and fine aggregates compromise interfacial bonding: coarse aggregates induce microstructural degradation, while optimized gradation enhances composite strength by promoting uniform bonding and crack control. Smaller aggregates, with a higher specific surface area, foster stronger interfacial transition zones (ITZs), improving tensile/flexural capacities; however, excessive fineness increases internal stress from elevated cement paste demand, potentially reducing strength [35]. The use of insufficient cement paste to coat all particles uniformly exacerbates workability issues like segregation and reduced plasticity [36]. Thus, higher rubber content introduces more pores, facilitating fluid seepage and elevating permeability relative to lower rubber content.
4. Conclusions
Based on the test results, the following conclusions are drawn in this paper:
- (1)
- The rubber–cement ratio has the most significant influence on the compressive strength of porous cementitious materials, with compressive strength decreasing as the rubber–cement ratio increases. The aggregate–cement ratio also has a notable effect: within the range of 1:1 to 2:1, compressive strength increases with the increase in the aggregate–cement ratio.
- (2)
- The particle size of quartz sands has a certain influence on the compressive strength of porous cementitious materials: within the aggregate particle size range of 0.05–9 mm, compressive strength increases as the particle size decreases. The particle size of rubber particles has the least influence on compressive strength, with no obvious fluctuations in compressive strength observed within the rubber particle size range of 0.05–5 mm.
- (3)
- The rubber–cement ratio has the most significant effect on the permeability of porous cementitious materials, with permeability increasing as the rubber–cement ratio increases. The particle size of rubber particles also has a substantial influence on permeability, while the effects of the aggregate–cement ratio and aggregate particle size on permeability are relatively minor.
- (4)
- The cement bonding degree of specimens with a low rubber content and a large rubber particle size is better than that of specimens with a high rubber content and a small rubber particle size, featuring fewer weak bonding interfaces, a denser overall structure, and fewer pores.
Author Contributions
Conceptualization, W.Q. and Z.L.; methodology, W.Q. and Y.Q.; validation, W.Q., W.L., and M.W.; formal analysis, Y.Q.; investigation, L.L.; resources, Z.L. and K.Y.; data curation, W.L. and M.W.; writing—original draft preparation, W.Q. and Y.Q.; writing—review and editing, Z.L. and K.Y.; visualization, L.L.; supervision, Z.L. and K.Y.; project administration, Z.L.; funding acquisition, Z.L. All authors have read and agreed to the published version of the manuscript.
Funding
This research was funded by the Geological Joint Fund Project (Project No.: U2444216) and the Nansha District Key Science and Technology Project “Key Technologies and Equipment Development for Stable Gas Production from Muddy Clay Hydrate Reservoirs” (2023ZD017). It was also supported by the Production Test of Natural Gas Hydrates in the Northern South China Sea (Project No.: DD20230063).
Data Availability Statement
The raw data supporting the conclusions of this article will be made available by the authors on request.
Conflicts of Interest
The authors declare no conflicts of interest.
References
- Zheng, W.; Song, M.; Wang, L.; Zhang, W.; Li, Z.; Zhu, L.; Xie, W.; Liang, Z.; Jiang, Z. Improving costal marine habitats in the northern yellow sea: The role of artificial reefs on macrobenthic communities and eco-exergy. Sci. Total Environ. 2025, 971, 179027. [Google Scholar] [CrossRef] [PubMed]
- Marshall, B.T.; Russell, S.R.; Florisson, J.H.; Saunders, B.J.; Newman, S.J.; Harvey, E.S. The influence of artificial reef structural complexity on fish assemblage composition. Mar. Environ. Res. 2025, 208, 107103. [Google Scholar] [CrossRef]
- Ly, O.; Yoris-Nobile, A.I.; Sebaibi, N.; Blanco-Fernandez, E.; Boutouil, M.; Castro-Fresno, D.; Hall, A.E.; Herbert, R.J.; Deboucha, W.; Reis, B.; et al. Optimisation of 3D printed concrete for artificial reefs: Biofouling and mechanical analysis. Constr. Build. Mater. 2021, 272, 121649. [Google Scholar] [CrossRef]
- Wang, Z.J.; Ni, J.; Fu, C.H.; Gao, S.J.; Li, Y. Preparation of Green Artificial Reefs Concrete Used Steel Slag and Blast Furnace Slag. Multipurp. Util. Miner. Resour. 2012, 5, 12. [Google Scholar]
- Xu, Q.; Ji, T.; Yang, Z.; Ye, Y. Steel rebar corrosion in artificial reef concrete with sulphoaluminate cement, sea water and marine sand. Constr. Build. Mater. 2019, 227, 116685. [Google Scholar] [CrossRef]
- Zhong, Y.; Du, J.; Wang, Y.; Li, P.; Xu, G.; Miu, H.; Zhang, P.; Jiang, S.; Gao, W. Modeling the impacts of land reclamation on sediment dynamics in a semi-enclosed bay. J. Mar. Sci. Eng. 2024, 12, 1633. [Google Scholar] [CrossRef]
- Liu, S.; Li, G.; Liu, S.; Xing, L.; Pan, Y.; Yu, D. Impacts of reclamation on hydrodynamic and suspended sediment transport in the Bohai Sea. J. Geophys. Res. Ocean. 2024, 129, e2023JC020570. [Google Scholar] [CrossRef]
- Vyaly, E.A.; Makarov, K.N.; Tlyavlina, G.V. Permeable constructions of artificial islands. Power Technol. Eng. 2022, 56, 52–58. [Google Scholar] [CrossRef]
- Huang, J.; Lowe, R.J.; Ghisalberti, M.; Hansen, J.E. Wave dissipation induced by flow interactions with porous artificial reefs. Coast. Eng. 2025, 197, 104688. [Google Scholar] [CrossRef]
- Liu, L.; Yu, H.; Qi, X.; Yang, Y.; Lin, Z.; Wang, C.; Ma, X. Towards ecosystem-based management in Chinese coastal areas: Judgement criteria for water-passable structure based on permeability. Ocean Coast. Manag. 2024, 249, 106990. [Google Scholar] [CrossRef]
- Petkova, R.; Tcholakova, S.; Denkov, N.D. Foaming and foam stability for mixed polymer-surfactant solutions: Effects of surfactant type and polymer charge. Langmuir ACS J. Surf. Colloids 2012, 28, 4996–5009. [Google Scholar] [CrossRef] [PubMed]
- Lee, J.-W.; Jang, Y.-I.; Park, W.-S.; Kim, S.-W. A Study on Mechanical Properties of Porous Concrete Using Cementless Binder. Int. J. Concr. Struct. Mater. 2016, 10, 527–537. [Google Scholar] [CrossRef]
- Pizoń, J.; Matýsková, K.; Horňáková, M.; Gołaszewska, M.; Kratošová, G. Recycled concrete paving block waste as a selected sustainable substitute for natural aggregate in cement composites. Constr. Build. Mater. 2025, 478, 141356. [Google Scholar] [CrossRef]
- Dosho, Y. Sustainable Concrete Waste Recycling System: Improving the Performance of Concrete Using Low-Quality Recycled Aggregate. Transp. Res. Procedia 2025, 85, 308–319. [Google Scholar] [CrossRef]
- Seung-Bum, P.; Eui-Sik, Y.; Dae-Seuk, S.; Jun, L. Mechanical Properties of Porous Concrete For Pavement Using Recycled Aggregate and Polymer. J. Korea Concr. Inst. 2005, 17, 595–602. [Google Scholar]
- Bhutta, M.A.R.; Hasanah, N.; Farhayu, N.; Hussin, M.W.; Tahir, M.b.M.; Mirza, J. Properties of porous concrete from waste crushed concrete (recycled aggregate). Constr. Build. Mater. 2013, 47, 1243–1248. [Google Scholar] [CrossRef]
- Buck, A.D. Recycled concrete as a source of aggregate. Recycl. Concr. A Source Aggreg. 1976, 74, 212–219. [Google Scholar]
- Sagoe-Crentsil, K.; Brown, T.; Taylor, A. Performance of concrete made with commercially produced coarse recycled concrete aggregate. Cem. Concr. Res. 2001, 31, 707–712. [Google Scholar] [CrossRef]
- Gómez-Soberón, J.M.V. Porosity of recycled concrete with substitution of recycled concrete aggregate: An experimental study. Cem. Concr. Res. 2002, 32, 1301–1311. [Google Scholar] [CrossRef]
- Evangelista, L.; Brito, J. Mechanical behaviour of concrete made with fine recycled concrete aggregates. Cem. Concr. Compos. 2007, 29, 397–401. [Google Scholar] [CrossRef]
- Nixon, P.J. Recycled concrete as an aggregate for concrete-a review. Matériaux Et Constr. 1978, 11, 371. [Google Scholar] [CrossRef]
- Zhu, Z.; Tai, C.; Zhang, Y.; Lu, Y. Effects and mechanisms of green-modified waste rubber particles on the mechanical properties and durability of cement-based materials. J. Build. Eng. 2025, 104, 112237. [Google Scholar] [CrossRef]
- Murray, C.A.; Snyder, K.S.; Marion, B.A. Characterization of permeable pavement materials based on recycled rubber and chitosan. Constr. Build. Mater. 2014, 69, 221–231. [Google Scholar] [CrossRef]
- Zhu, Z.; Zhou, M.; Wang, B.; Xu, X. Enhancing permeability and mechanical properties of rubber cement-based materials through surface modification of waste tire rubber powder. Constr. Build. Mater. 2024, 425, 136098. [Google Scholar] [CrossRef]
- Li, Y.; Zhang, H.; Fang, Q.; Yu, T.; Yang, J.; Li, W. Optimization of mechanical properties and water resistance of sawdust-magnesium oxychloride cement composites based on orthogonal tests. Constr. Build. Mater. 2024, 439, 137300. [Google Scholar] [CrossRef]
- Wang, K.; Guo, S.; Yuan, H.; Ren, J.; Chen, P.; Zhang, Q. Influence of cement particle size, ultra-fine fly ash, and ultra-fine silica fume on the physical and microscopic properties of slurry. Case Stud. Constr. Mater. 2025, 22, e04337. [Google Scholar] [CrossRef]
- Pan, X.; Wang, Y.; Kong, D.; Li, Y.; Cheng, Z.; Song, G.; Zuo, Y. Development, optimisation and performance prediction of a novel cement-based materials for borehole sealing. Constr. Build. Mater. 2025, 478, 141404. [Google Scholar] [CrossRef]
- Gillott, J.; Quinn, T. Strength and Sulfate Resistance of Concrete Made With High Alumina Cement, Type 10 Portland Cement, Type 10 Portland Cement Plus Fly Ash and Type 50 Portland Cement. Cem. Concr. Aggreg. 2003, 25, CCA10517J. [Google Scholar] [CrossRef]
- Song, J.; Xu, M.; Liu, W.; Wang, X.; Wu, Y.; Kou, H. Synergistic Effect of Latex Powder and Rubber on the Properties of Oil Well Cement-Based Composites. Adv. Mater. Sci. Eng. 2018, 2018, 4843816. [Google Scholar] [CrossRef]
- Chen, J.; Mei, S.; Rempel, A.W. Estimating Permeability of Partially Frozen Soil Using Floating Random Walks. Water Resour. Res. 2021, 57, e2021WR030598. [Google Scholar] [CrossRef]
- Huang, X.; Wang, S.; Lu, T.; Li, H.; Wu, K.; Deng, W. Chloride Permeability Coefficient Prediction of Rubber Concrete Based on the Improved Machine Learning Technical: Modelling and Performance Evaluation. Polymers 2023, 15, 308. [Google Scholar] [CrossRef] [PubMed]
- Shan, J.; He, J.; Li, F. Numerical Simulation of Pervious Concrete Based on Random Pore Model. Adv. Civ. Eng. 2020, 2020, 8831506. [Google Scholar] [CrossRef]
- Nakayenga, J.; Cikmit, A.A.; Tsuchida, T.; Hata, T. Influence of stone powder content and particle size on the strength of cement-treated clay. Constr. Build. Mater. 2021, 305, 124710. [Google Scholar] [CrossRef]
- Wu, J.; Feng, M.; Mao, X.; Xu, J.; Zhang, W.; Ni, X.; Han, G. Particle size distribution of aggregate effects on mechanical and structural properties of cemented rockfill: Experiments and modeling. Constr. Build. Mater. 2018, 193, 295–311. [Google Scholar] [CrossRef]
- Sim, J.-I.; Yang, K.-H.; Jeon, J.-K. Influence of aggregate size on the compressive size effect according to different concrete types. Constr. Build. Mater. 2013, 44, 716–725. [Google Scholar] [CrossRef]
- Kalra, M.; Mehmood, G. A review paper on the effect of different types of coarse aggregate on concrete. IOP Conf. Ser. Mater. Sci. Eng. 2018, 431, 082001. [Google Scholar] [CrossRef]
Disclaimer/Publisher’s Note: The statements, opinions and data contained in all publications are solely those of the individual author(s) and contributor(s) and not of MDPI and/or the editor(s). MDPI and/or the editor(s) disclaim responsibility for any injury to people or property resulting from any ideas, methods, instructions or products referred to in the content. |
© 2025 by the authors. Licensee MDPI, Basel, Switzerland. This article is an open access article distributed under the terms and conditions of the Creative Commons Attribution (CC BY) license (https://creativecommons.org/licenses/by/4.0/).