3.1. Range Analysis and Analysis of Variance
Following testing, the uniaxial compressive strengths of the porous cement-based materials at different curing ages (3d, 7d, 14d, and 28d) and the permeability of the materials cured for 3d are presented in
Table 3.
Taking the porous cement-based materials cured for 3 days as a reference, the effects of various factors on the compressive strength of the material were analyzed, and the results of the range analysis are shown in
Table 4.
From
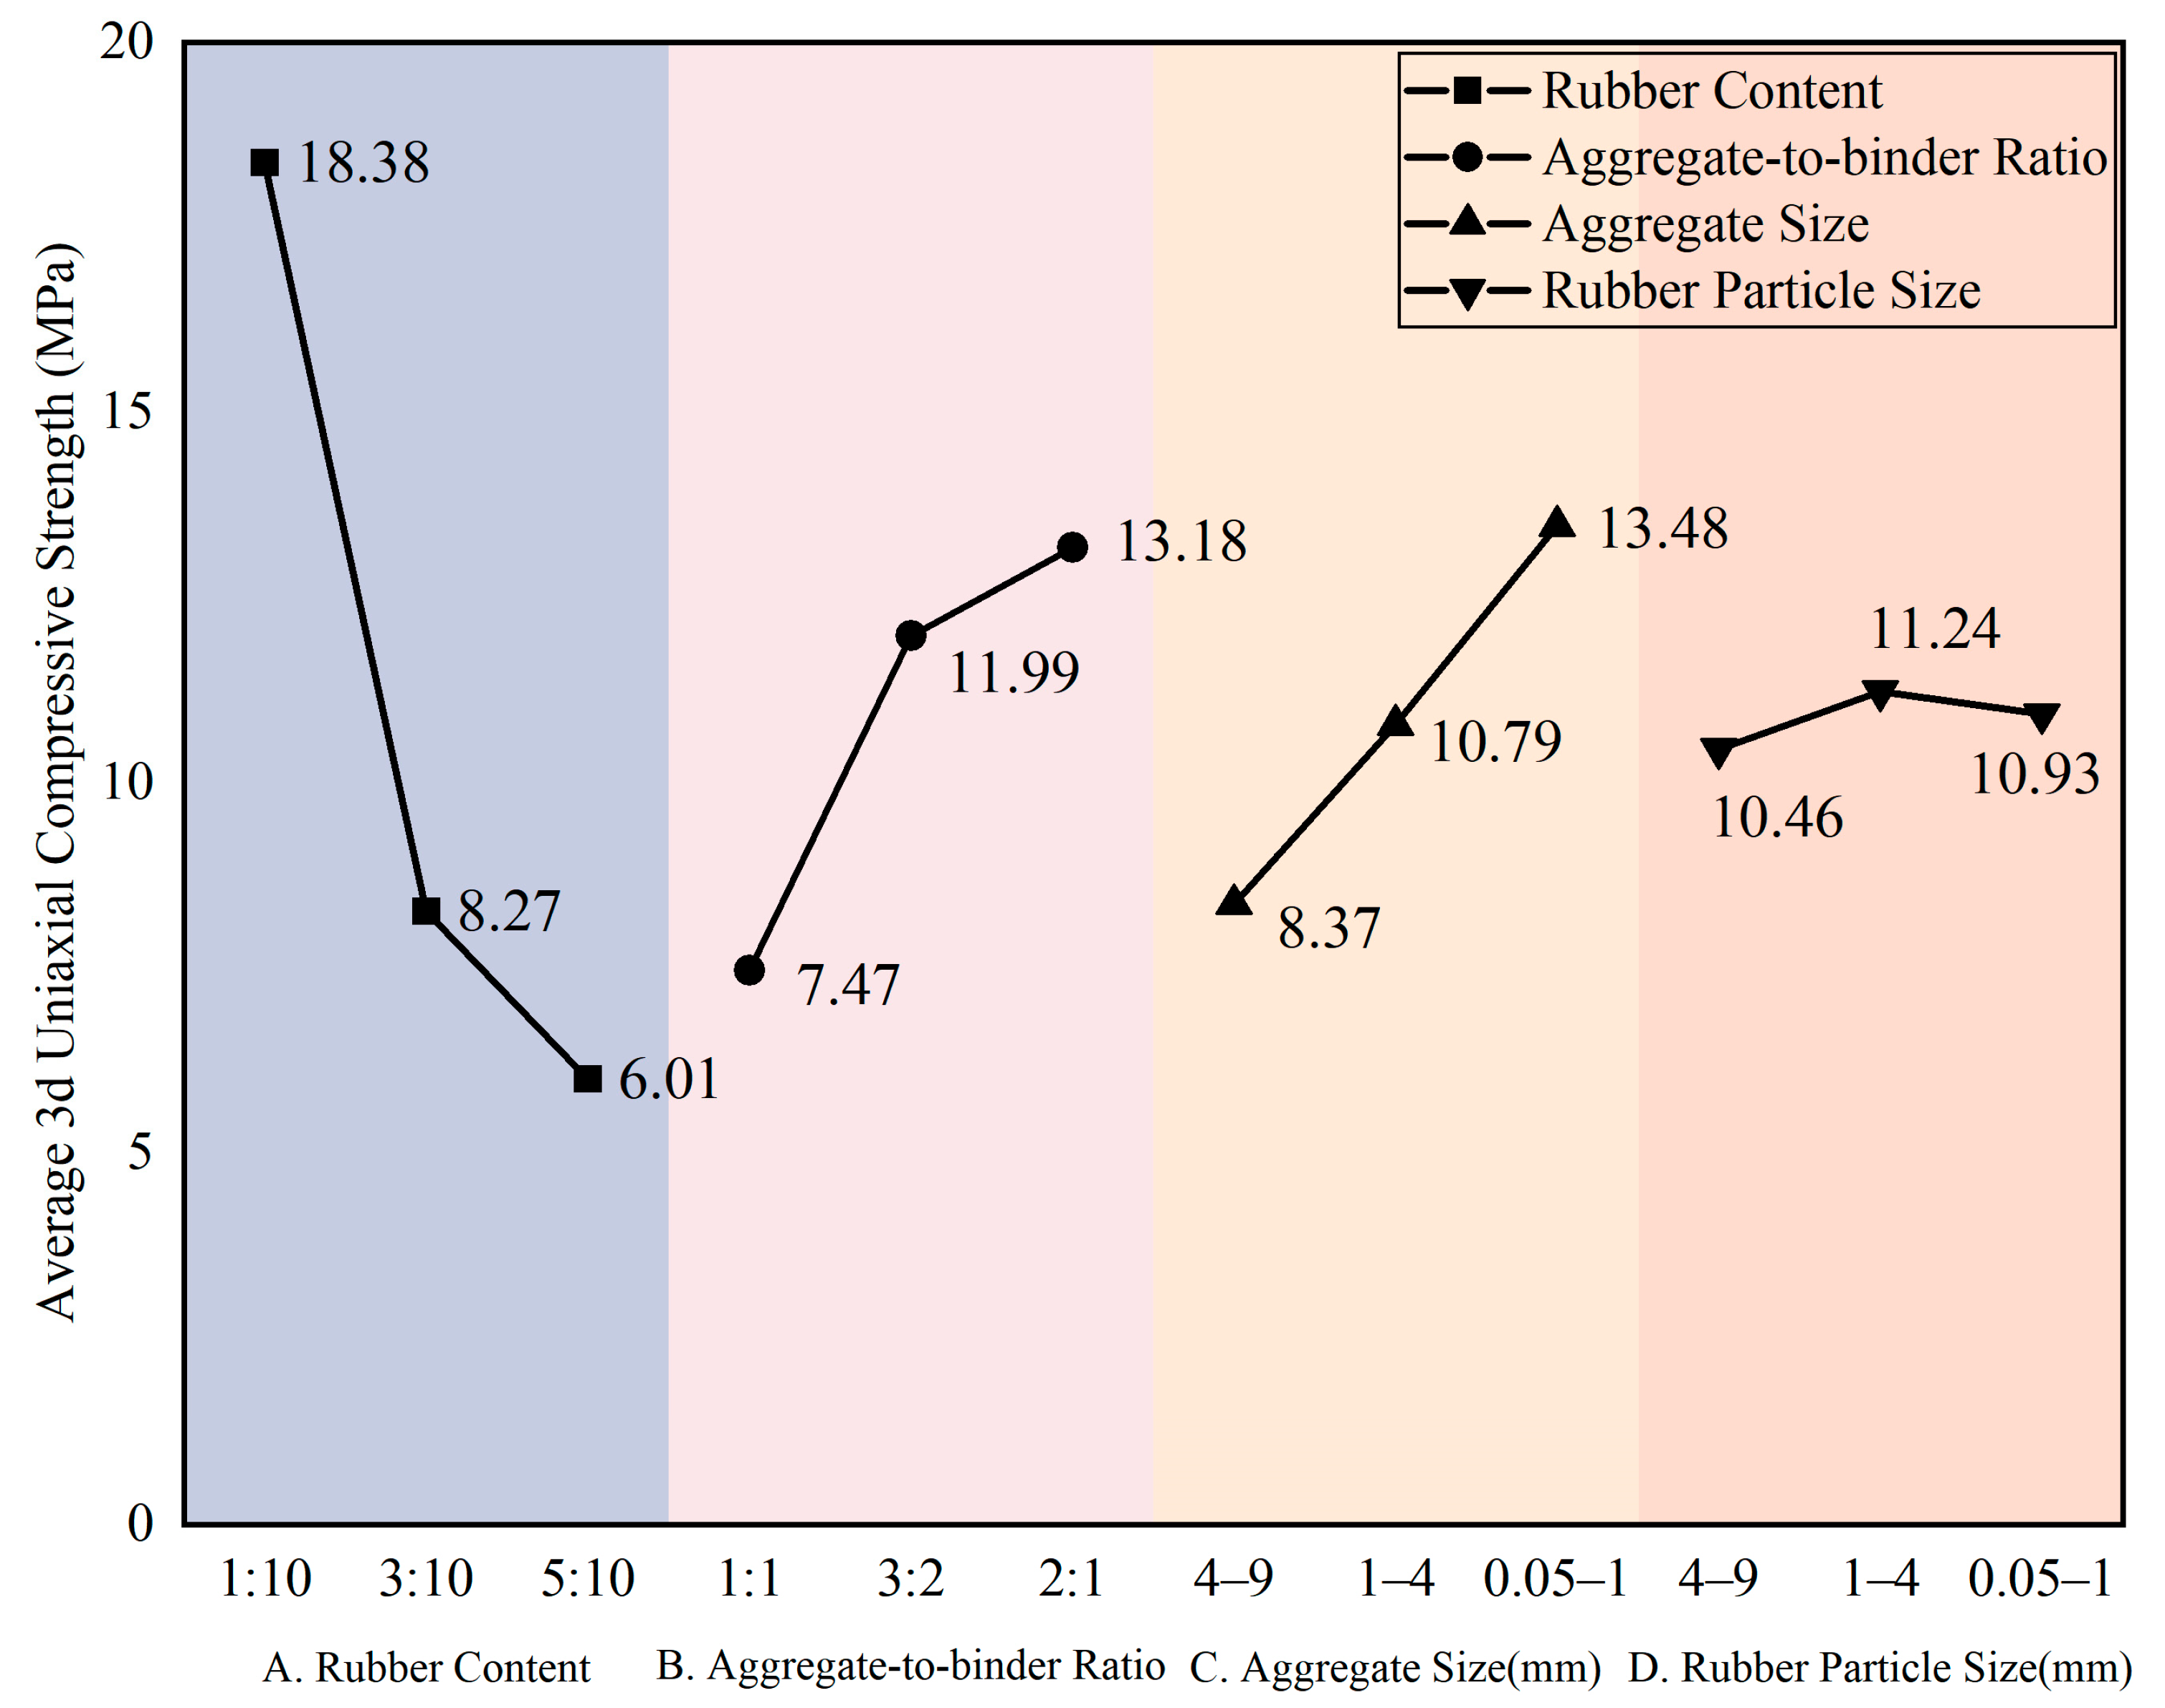
Table 4, the range R for factors A, B, C, and D is 12.38, 5.7, 5.11, and 0.78, respectively. The larger the range value, the greater the influence on compressive strength. Therefore, the order of influence degree of each factor on the material’s compressive strength is: A > B > C > D. The effect plot of the range analysis for each influencing factor on the material’s compressive strength is shown in
Figure 7.
From the analysis, factor A has the most significant influence on the compressive strength of the material, with compressive strength decreasing as the rubber ratio increases. It is speculated that this is because rubber itself is hydrophobic, leading to weaker hydration reactions in the cement around rubber particles and forming low-strength bonding interfaces, which create weak bonding surfaces and micro-cracks within the material. An increase in rubber content leads to more weak bonding interfaces and micro-cracks in the skeleton, thus reducing the material’s compressive strength. Factor B also has a notable effect: within the range of sand–cement ratios from 1:1 to 2:1, compressive strength increases with the increase in the sand–cement ratio. The mechanical strength of the material mainly originates from the skeleton strength formed by the bonding between cement and quartz sand aggregates, as well as the interlocking force between adjacent aggregates after bonding. In the range of 1:1 to 2:1, a higher proportion of quartz sand aggregates results in higher overall mechanical strength of the material. Factor C has a certain influence on compressive strength: within the aggregate particle size range of 0.05–9 mm, compressive strength increases as the particle size decreases. It is speculated that reducing the particle size of quartz sand aggregates increases the bonding area with cement, thereby enhancing the overall bonding strength. Smaller particle sizes of quartz sand aggregates per unit mass mean a larger number of individual particles, leading to more interlocking between aggregates and an increase in interlocking force, which also improves the material’s mechanical strength. Factor D has the least influence on compressive strength, with no obvious fluctuations in compressive strength within the rubber particle size range of 0.05–9 mm.
An analysis of variance (ANOVA) was performed for different factors, and the results are shown in
Table 5.
It can be concluded that, for the influence on the compressive strength of the material, the F-value of factor A reaches 281.188, which is much larger than the critical F-value of 19, indicating that the rubber ratio has a significant effect on the compressive strength of the material. The F-values of factor B and aggregate particle size are both greater than the critical value, meaning both factors reach a significant level. However, based on the calculated F-values, the significance of the sand–cement ratio and aggregate particle size is lower than that of the rubber ratio, while the influence of rubber particle size is minor and does not reach significance. This is consistent with the results of the range analysis. Considering both the range analysis and the ANOVA results comprehensively, the optimal combination of factor levels for the material’s compressive strength index is a rubber ratio of 1:10, a sand–cement ratio of 2:1, an aggregate particle size of 0.05–1 mm, and a rubber particle size of 1–4 mm.
The range analysis of the effects of each factor on permeability is presented in
Table 6.
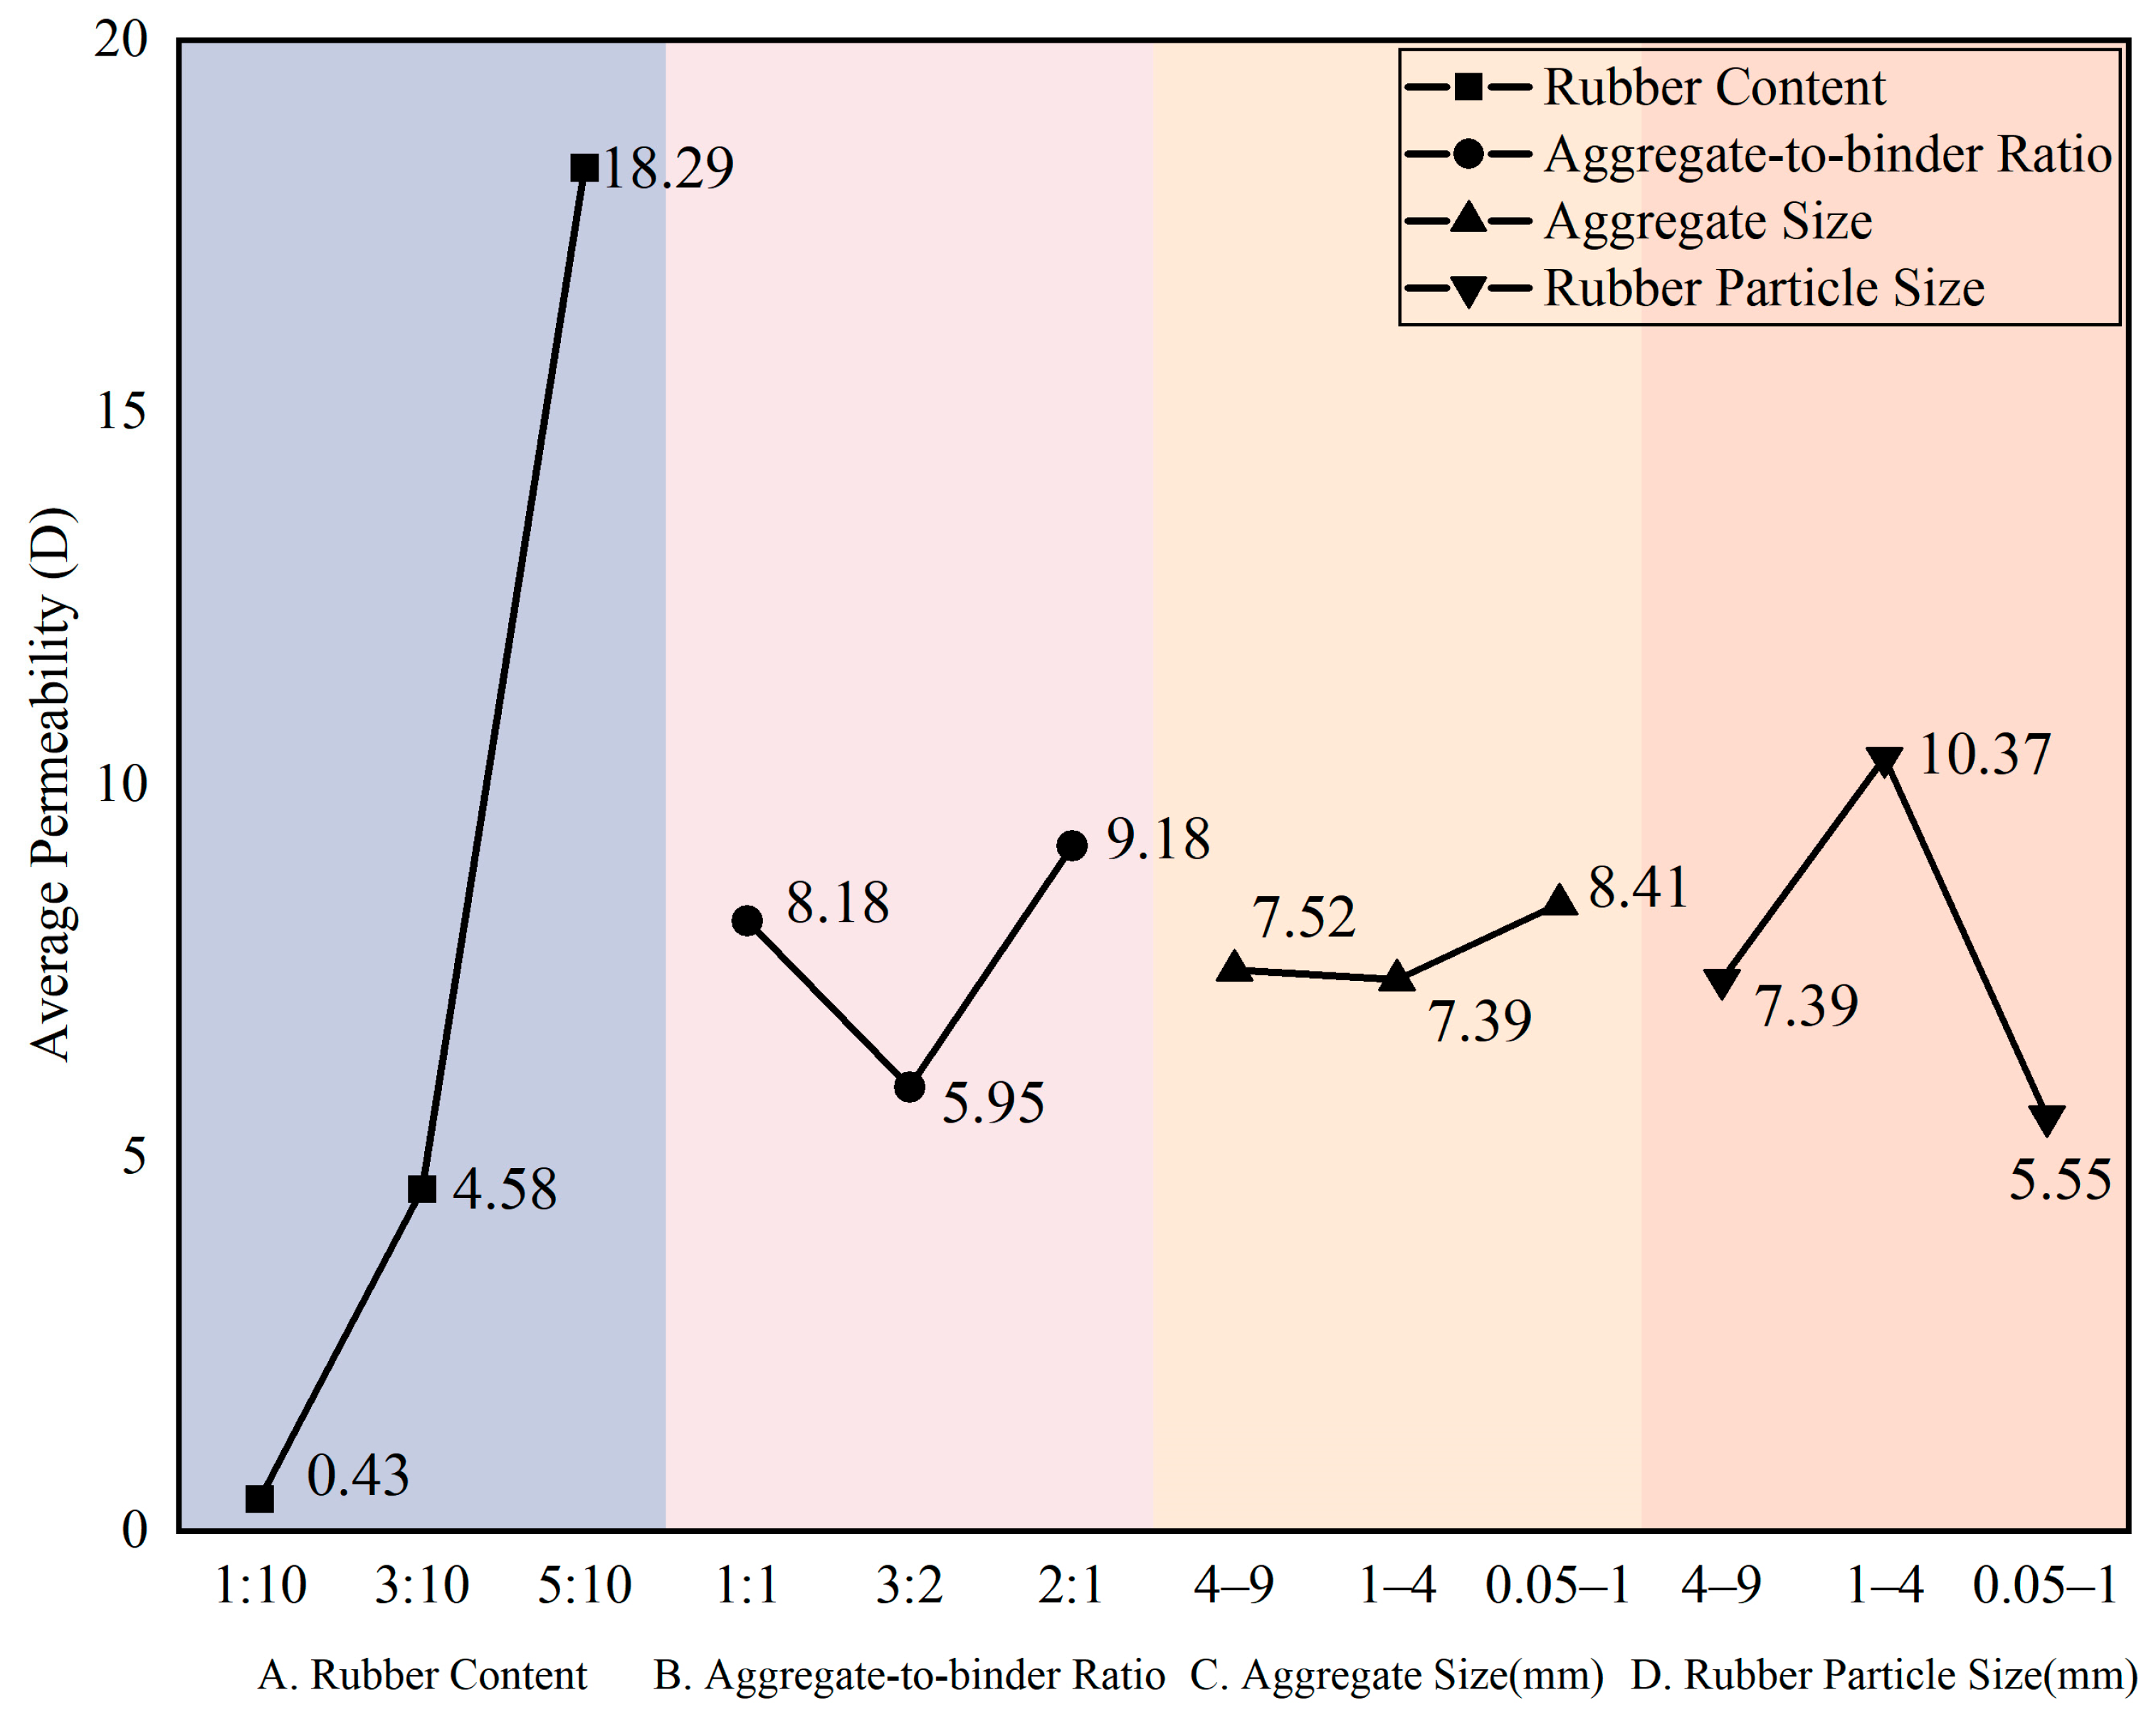
From the table above, it can be seen that the range values R for factors A, B, C, and D are 17.86, 3.23, 1.02, and 4.82, respectively. The larger the range value, the greater the influence on permeability. Therefore, the order of influence degree of each factor on the material’s permeability is A > D > B > C.
The range analysis of the influencing factors on material permeability is shown in
Figure 8.
It can be seen that factor A (mass ratio of rubber particles to cement) has the most significant influence on the material’s permeability, with permeability increasing as the rubber ratio increases. This result is consistent with the previous analysis: the weak bonding interfaces and micro-cracks around the rubber particles provide favorable seepage channels for fluids. As the rubber content increases, the distribution of micro-cracks within the specimen becomes more extensive and interconnected, thereby increasing the material’s permeability. Factor D (rubber particle size) also has a notable effect on permeability: within the rubber particle size range of 0.05–9 mm, permeability first increases and then decreases as the particle size decreases. When the rubber particles are larger, the number of particles per unit mass decreases, reducing the contact area with the cement matrix and the formation of micro-cracks and weak bonding interfaces around rubber particles, which in turn reduces seepage channels. As the particle size gradually decreases, the contact area between the rubber particles and cement increases, leading to more pore formation and higher permeability. However, a further reduction in particle size improves the dispersion of rubber particles in the material; pores typically develop around the particles, and smaller particles may result in smaller pores that are concentrated near the particles with short extensions, making it difficult to connect with the micro-cracks around other particles to form continuous seepage channels. Additionally, smaller pores may hinder fluid seepage due to the Jamin effect, causing permeability to decline. Factor B (the mass ratio of quartz sand to cement) has a relatively minor influence on permeability: within the range of 1:1 to 2:1, the permeability first decreases and then increases with the increase in sand–cement ratio, with minimal variation between different levels. Factor C (aggregate particle size) has the least influence on permeability, with no significant differences observed between its levels.
A variance analysis of the influencing factors on permeability was conducted, and the results are shown in
Table 7.
It can be concluded that, for the influence on the material’s permeability, the F-value of factor A (mass ratio of rubber particles to cement) reaches 283.926, which is much larger than the critical F-value of 19, indicating that the rubber ratio has a significant effect on the material’s permeability. The F-value of factor D (rubber particle size) just exceeds the critical value of 19, also showing significance, but its contribution rate is much lower than that of the rubber ratio. The F-values of factors B (the mass ratio of quartz sand to cement) and C (aggregate particle size) are both lower than the critical value, neither reaching a significant level, with the lowest contribution rates. This is consistent with the results of the range analysis. Considering both the range analysis and ANOVA results comprehensively, the optimal combination of factor levels to achieve the best permeability of the cement-based material is factor A is 1:2, factor B is 2:1, factor C is 0.05–1 mm, and factor D is 1–4 mm.
Previous studies have shown that adding rubber particles to cement-based materials at a dosage of less than 2% can enhance the toughness of cement-based materials by forming flexible interfaces. However, excessively high dosages tend to disrupt the continuity of the cement matrix, thereby reducing the material strength [
29]. Conversely, increasing the rubber particle dosage to over 10% is necessary to promote pore connectivity and improve permeability in cement-based materials [
30]. These findings are consistent with the optimal rubber particle dosages for strength and permeability obtained in this study. Additionally, numerical simulations support the conclusion that rubber particles with a particle size of 1–4 mm are more conducive to enhancing the permeability of cement-based materials [
31]. The permeability of cement-based materials relies more on the rubber particle dosage and particle size, while the strength is more significantly influenced by the mass ratio of aggregate to cement and the aggregate particle size. A higher aggregate-to-cement ratio and a smaller aggregate particle size are both beneficial for the development of overall strength in cement-based materials [
32]. Notably, the optimal aggregate particle size obtained in this study is smaller than that reported in previous studies. This discrepancy is primarily attributed to the fact that the addition of rubber particles disrupts the integrity of the cement-based material to some extent, necessitating finer aggregates to increase the effective contact area at the cement–aggregate interface and thus improve the material strength.
3.2. Microstructure of Porous Cementitious Materials
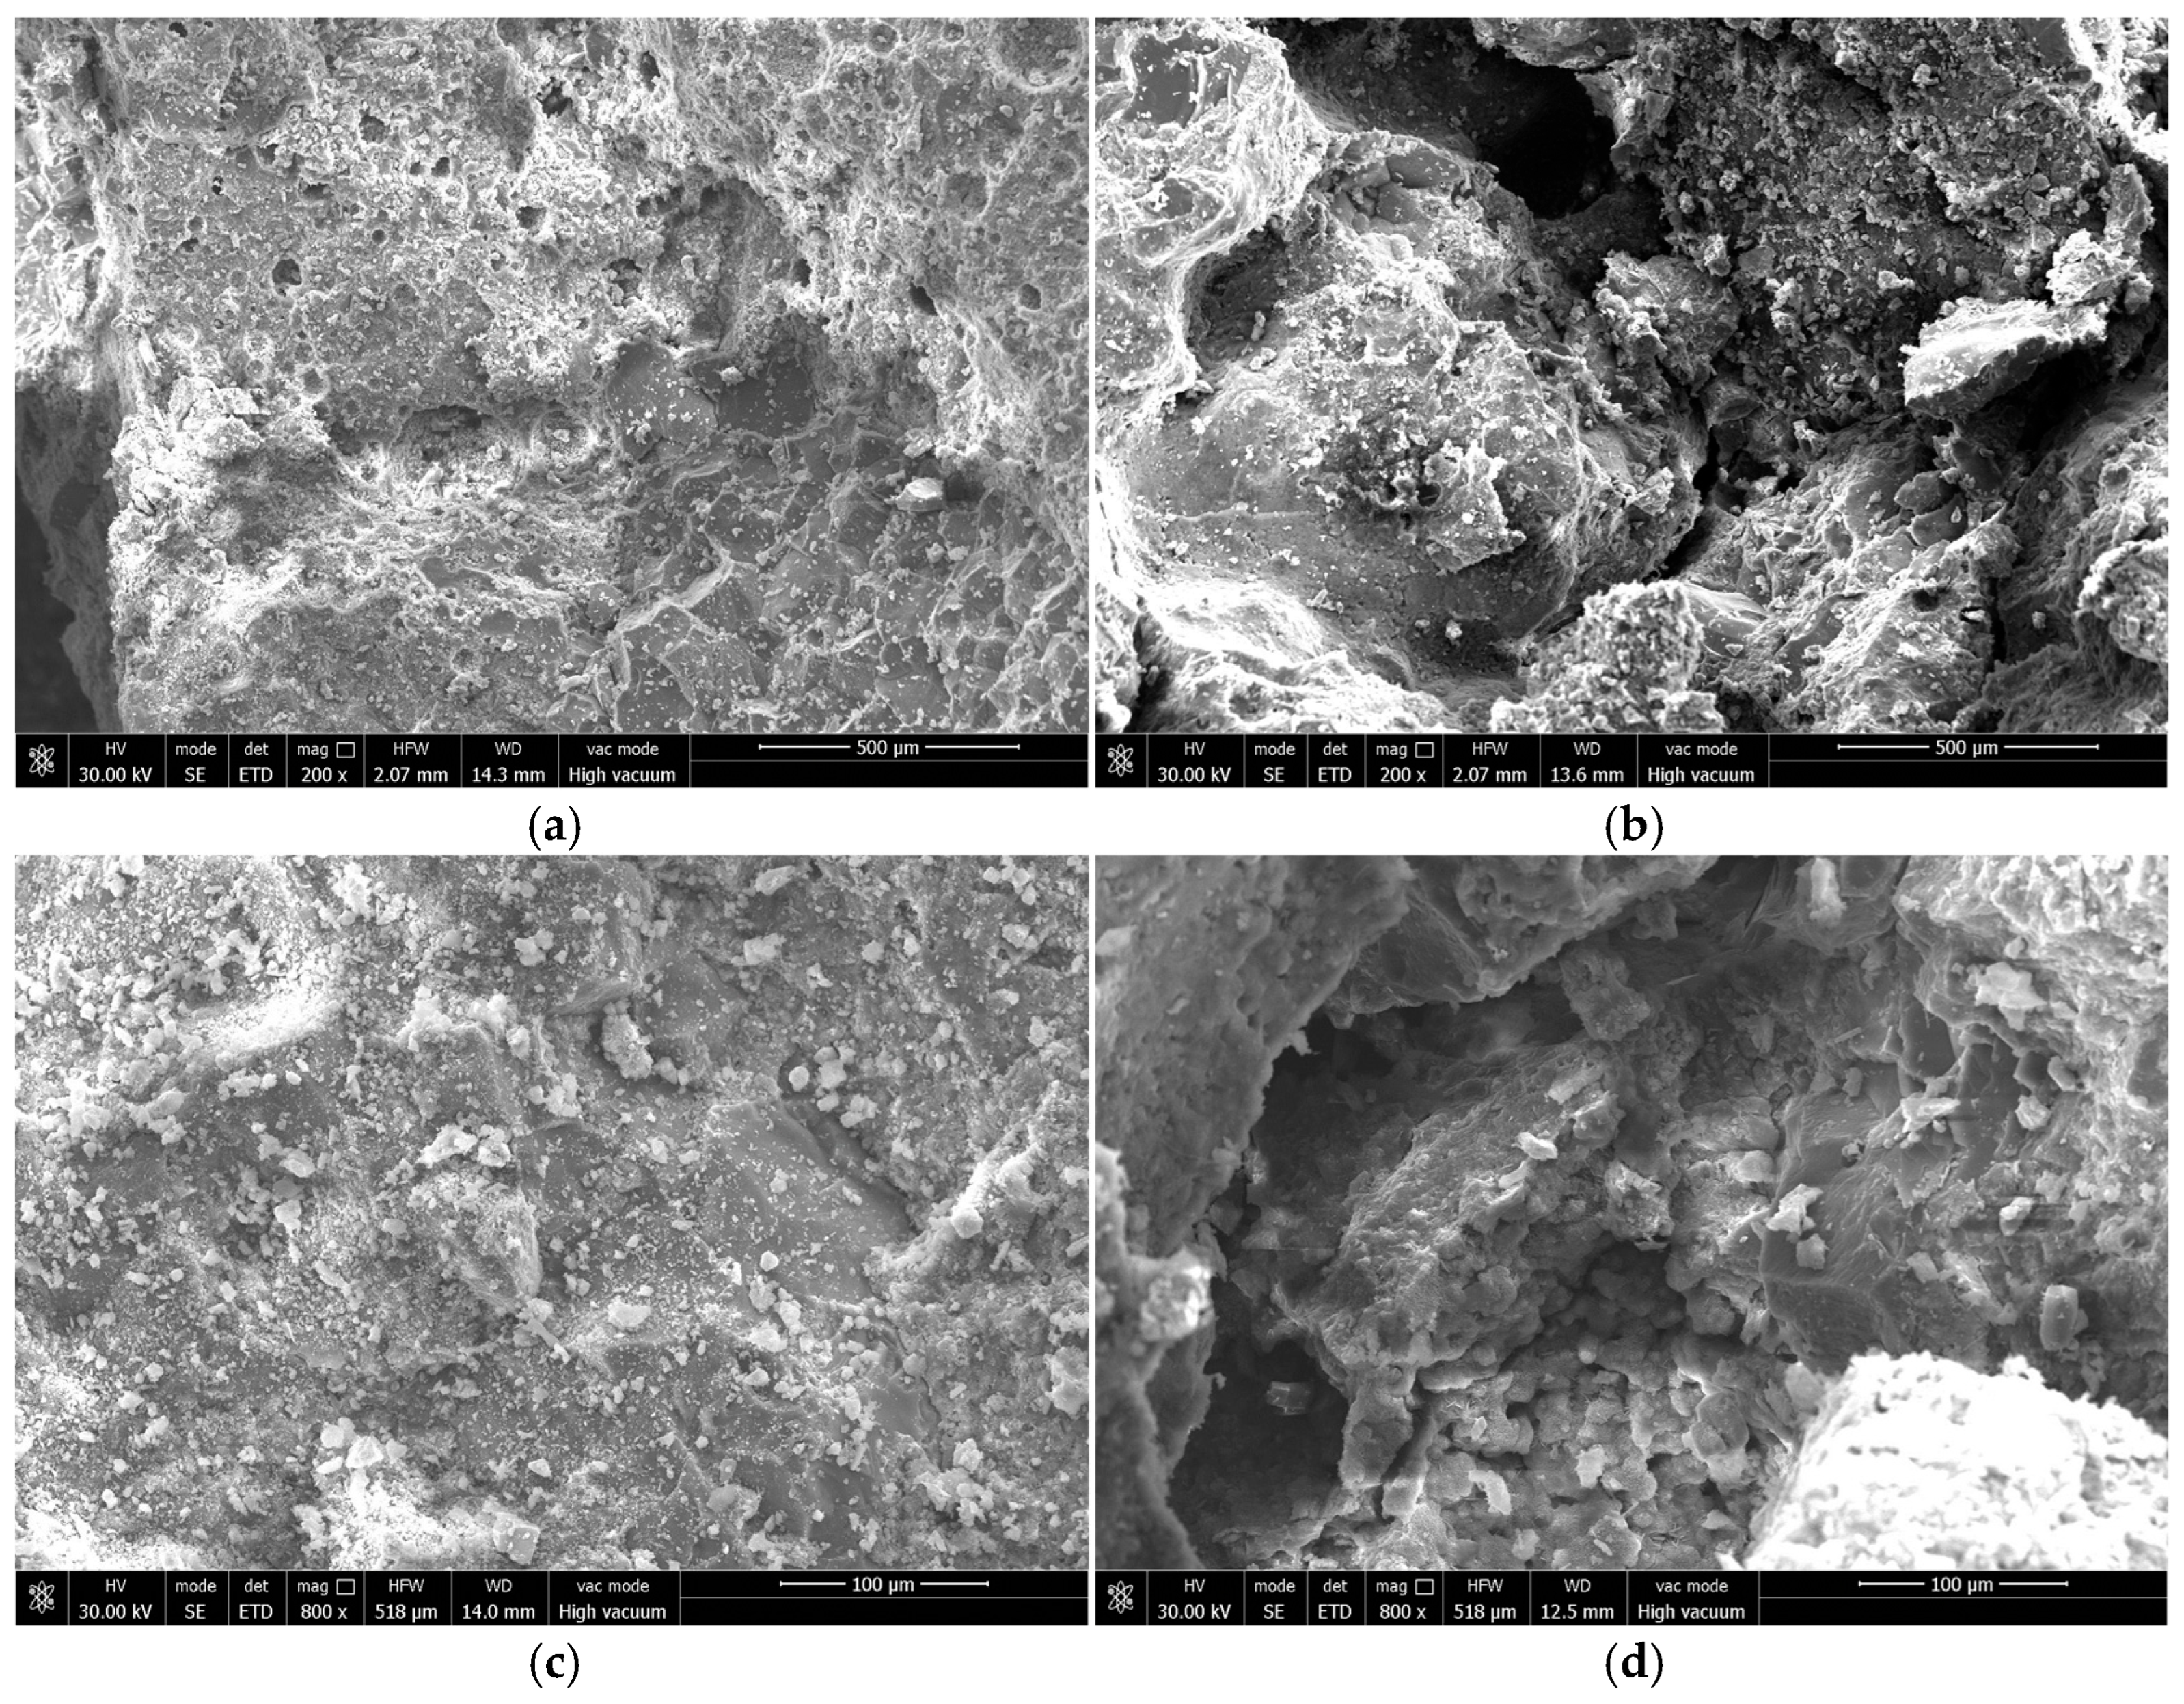
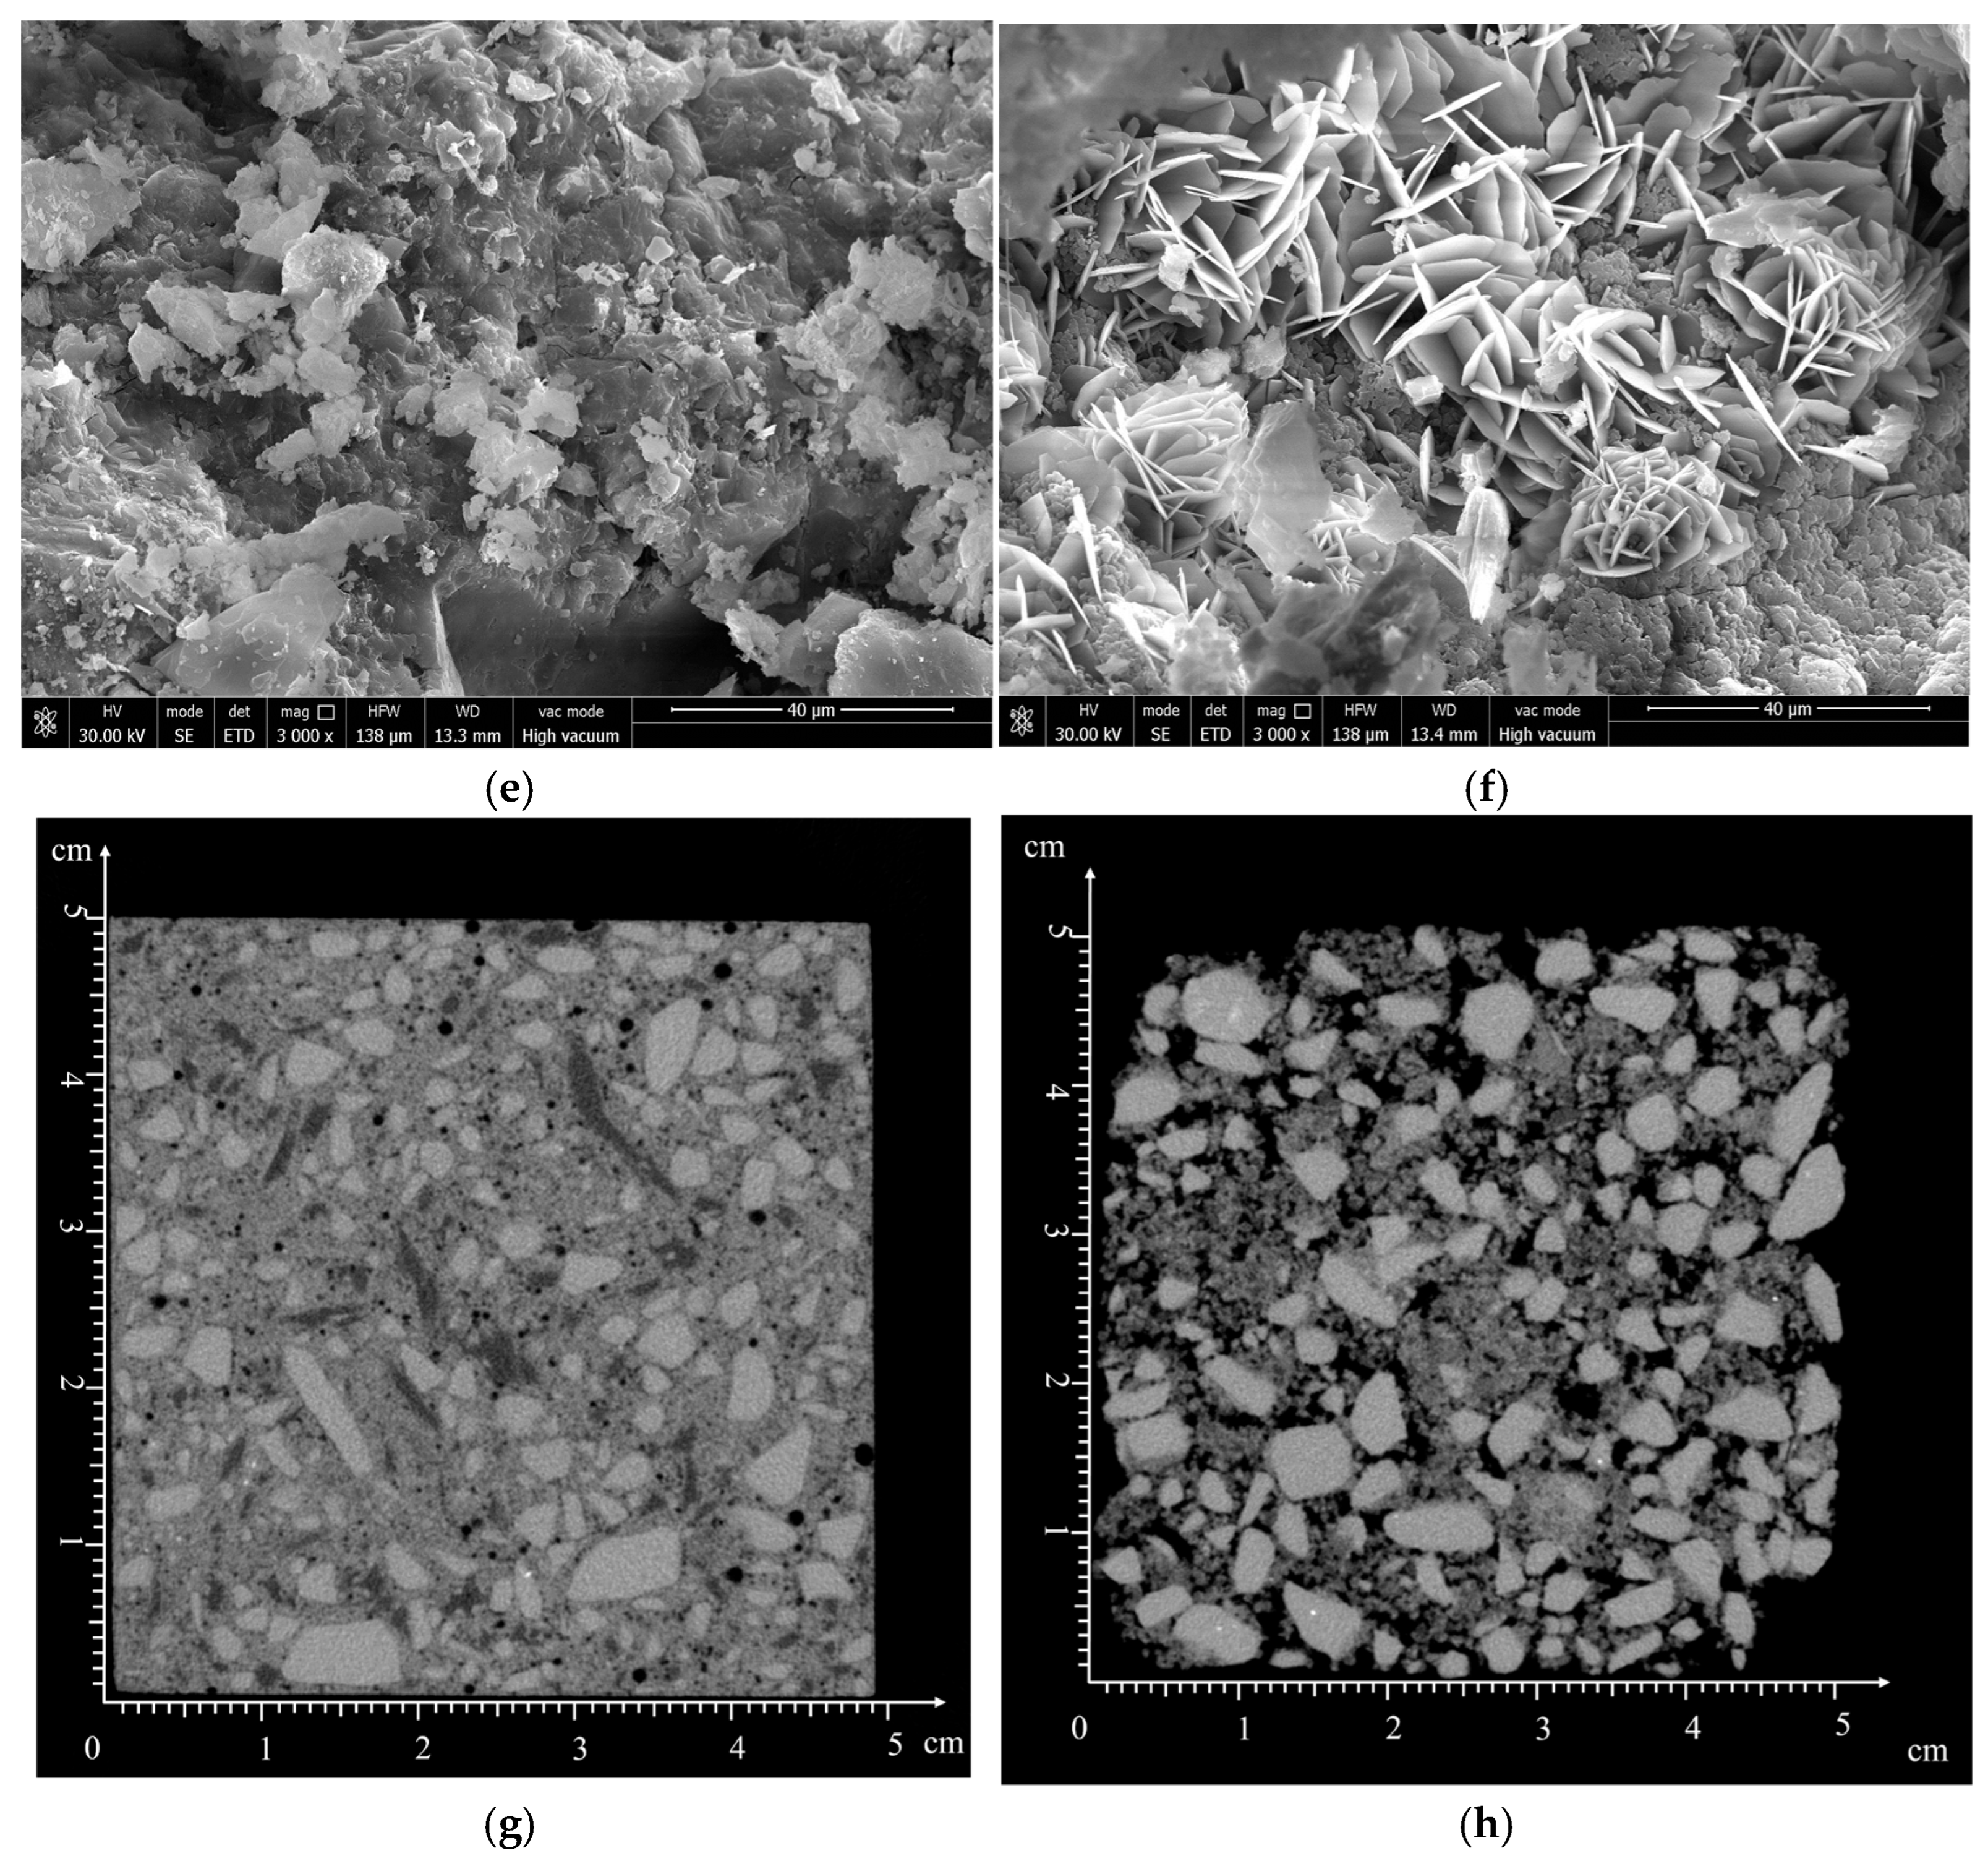
Scanning electron microscopy (SEM) and computed tomography (CT) were employed to characterize the specimens with distinct rubber configurations: low rubber content with large particle size (factor A: 1:10, factor B: 1:1, factor C: 4–9 mm, factor D: 4–9 mm), and high rubber content with small particle size (factor A: 1:2, factor B: 2:1, factor C: 4–9 mm, factor D: 0.05–1 mm).
The resulting images are shown in
Figure 9.
In
Figure 9a, cement hydrates bind the quartz sands and rubber particles into a dense matrix, whereas
Figure 9b reveals pronounced inter-particle cracks with compromised interfacial bonding integrity. Micro-crack initiation is negligible in
Figure 9c, but extensive crack propagation is evident in
Figure 9d, highlighting the critical role of rubber particle characteristics.
Figure 9e,f illustrate two distinct regimes of cement–rubber bonding: the hydrophobic nature of rubber suppresses cement hydration, forming weak, scaly, separated interfaces that exhibit low tensile strength and facilitate micro-crack nucleation. This behavior correlates with factor A values: 1:10 for low-rubber-content/large-particle specimens versus 1:2 for high-rubber-content/small-particle counterparts. The higher rubber content promotes the formation of defective interfacial transition zones, accelerating crack propagation during loading. Mechanistically, during dry mixing, the cement particles adsorb onto the quartz sand and rubber surfaces; upon hydration, these surfaces serve as nucleation sites for calcium silicate hydrates (C-S-Hs), forming an interlocking skeletal structure. Quartz sand surfaces enable normal hydration, yielding robust interfacial transition zones that integrate aggregates into a cohesive framework. In contrast, rubber’s hydrophobicity inhibits C-S-H growth, creating porous, mechanically deficient interfaces. Weak rubber interfacial transition zones act as stress concentrators, initiating cracks that propagate through the matrix and reducing the load-bearing capacity. Conversely, a higher rubber content and smaller particle sizes increase the surface area of weak interfacial transition zones, forming interconnected void networks that facilitate fluid transport.
CT scan grayscale values reflect density, where a higher density corresponds to a brighter grayscale. In CT images, specimen components from white to black denote quartz sands, cement binder, rubber particles, and pores. The cement binder between particles in the low-rubber-content/large-particle-size specimen (
Figure 9g) exhibits higher grayscale values than that in the high-rubber-content/small-particle-size specimen (
Figure 9h), indicating superior cement bonding, fewer weak interfaces, denser microstructure, reduced porosity, and tighter inter-aggregate interlocking. Consequently, the high-rubber-content/small-particle-size specimen displays only ~30% of the mechanical strength of its low-rubber/large-particle counterpart. As prior studies highlight [
33,
34], both excessively coarse and fine aggregates compromise interfacial bonding: coarse aggregates induce microstructural degradation, while optimized gradation enhances composite strength by promoting uniform bonding and crack control. Smaller aggregates, with a higher specific surface area, foster stronger interfacial transition zones (ITZs), improving tensile/flexural capacities; however, excessive fineness increases internal stress from elevated cement paste demand, potentially reducing strength [
35]. The use of insufficient cement paste to coat all particles uniformly exacerbates workability issues like segregation and reduced plasticity [
36]. Thus, higher rubber content introduces more pores, facilitating fluid seepage and elevating permeability relative to lower rubber content.


