Numerical Study on Ammonia Dispersion and Explosion Characteristics in Confined Space of Marine Fuel Preparation Room


Abstract
1. Introduction
2. Characteristics of Ammonia
2.1. Overview and Physicochemical Characteristics of Ammonia
2.2. Hazards Associated with Ammonia in Fuel Gas Supply Systems (FGSS)
2.2.1. Toxicological Effects of Ammonia on Humans
2.2.2. Environmental Impact of Ammonia Toxicity
2.2.3. Combustion and Flammability Characteristics of Ammonia
2.2.4. Corrosive Characteristics of Ammonia
2.2.5. Other Hazards Related to the Use of Ammonia
3. Numerical Study of Ammonia Dispersion
3.1. Simulation Domain and Turbulence Model
3.2. Grid Dependence
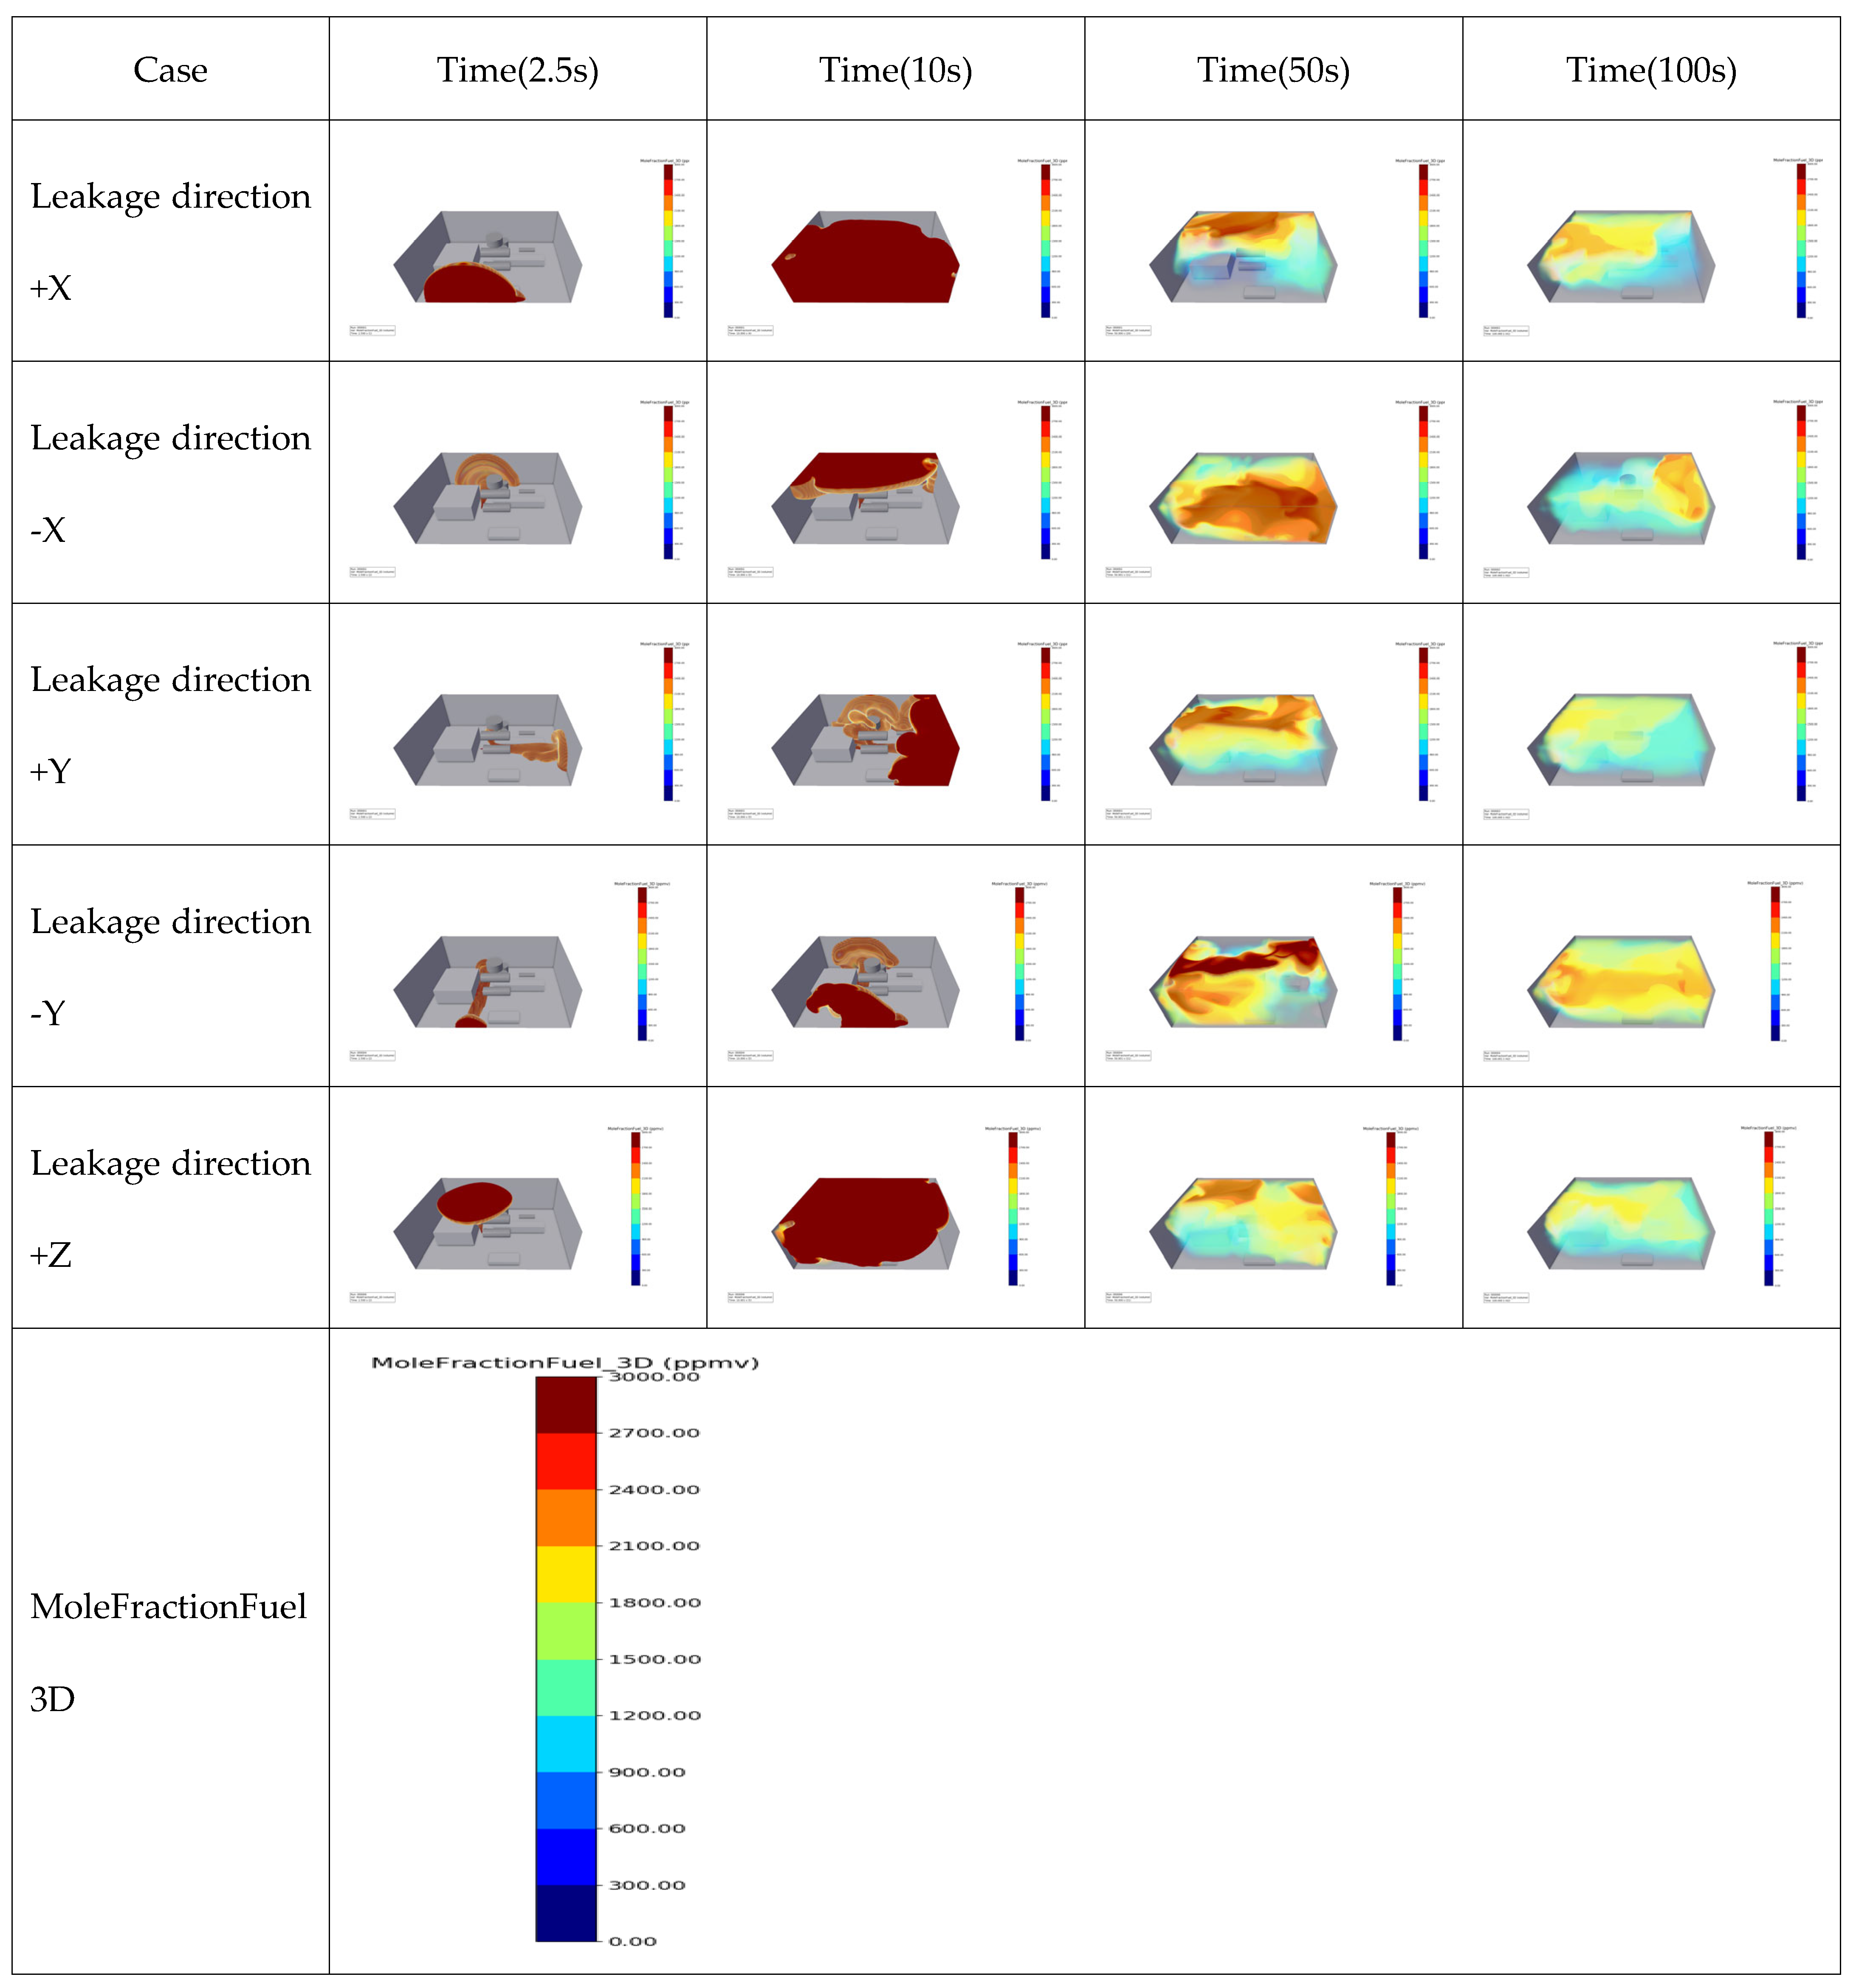
3.3. Dispersion of Ammonia
3.4. Ammonia Dispersion with Different Release Rate
4. Ammonia Explosion
4.1. Explosion Modeling
4.2. TNO Multi-Energy Method
- -
- Estimation of Vapor Cloud Volume
- -
- Explosion intensity classification
- °
- Considered “strong” if it exceeds 100 MJ; otherwise, it is “weak”.
- °
- Classified as “strong” if obstacles in the area are spaced less than 3 m apart and occupy more than 30% of the total volume; otherwise, the obstruction is considered “weak”.
- °
- Assumed to exist if the vapor cloud is restricted by two or more solid surfaces; otherwise, it is considered “unconfined”.
4.3. Safety Measure
5. Conclusions
Author Contributions
Funding
Institutional Review Board Statement
Informed Consent Statement
Data Availability Statement
Conflicts of Interest
Abbreviations
| GHG | Greenhouse gas |
| IMO | The International Maritime Organization |
| SEEMP | The Ship Energy Efficiency Management Plan |
| EEDI | The Energy Efficiency Design Index |
| EEOI | The Energy Efficiency Operational Indicator |
| ICEs | Internal combustion engines |
| PFP | Power-to-fuel-to-power |
| FGSS | Fuel gas supply system |
| ER | Equivalence ratios |
| AF | Ammonia fractions |
| AFPV | Average flame propagation velocity |
| MEP | Maximum explosion pressure |
| LBV | Laminar burning velocity |
| VCE | Vapor cloud explosion |
| ME | TNO Multi-Energy |
| CFD | Computational Fluid Dynamics |
| STP | Standard temperature and pressure |
| PPE | Personal protective equipment |
| SCBA | Self-contained breathing apparatus |
| BLEVE | Boiling Liquid Expanding Vapor Explosion |
| FPR | Fuel preparation room |
| LNG | Liquefied natural gas |
| ME | Multi-Energy method |
| MP | Monitoring points |
| LEL | Lower explosive limit |
References
- Ni, P.; Wang, X.; Li, H. A review on regulations, current status, effects and reduction strategies of emissions for marine diesel engines. Fuel 2020, 279, 118477. [Google Scholar] [CrossRef]
- Sèbe, M.; Scemama, P.; Choquet, A.; Jung, J.-L.; Chircop, A.; Razouk, P.M.-A.; Michel, S.; Stiger-Pouvreau, V.; Recuero-Virto, L. Maritime transportation: Let’s slow down a bit. Sci. Total. Environ. 2022, 811, 152262. [Google Scholar] [CrossRef] [PubMed]
- Li, R.; Liu, Y.; Wang, Q. Emissions in maritime transport: A decomposition analysis from the perspective of production-based and consumption-based emissions. Mar. Policy 2022, 143, 105125. [Google Scholar] [CrossRef]
- Lee, H.; Ryu, B.; Anh, D.P.; Roh, G.; Lee, S.; Kang, H. Thermodynamic analysis and assessment of novel ORC- DEC integrated PEMFC system for liquid hydrogen fueled ship application. Int. J. Hydrogen Energy 2023, 48, 3135–3153. [Google Scholar] [CrossRef]
- Duong, P.A.; Ryu, B.; Jung, J.; Kang, H. Thermal Evaluation of a Novel Integrated System Based on Solid Oxide Fuel Cells and Combined Heat and Power Production Using Ammonia as Fuel. Appl. Sci. 2022, 12, 6287. [Google Scholar] [CrossRef]
- Duong, P.A.; Ryu, B.; Kim, C.; Lee, J.; Kang, H. Energy and Exergy Analysis of an Ammonia Fuel Cell Integrated System for Marine Vessels. Energies 2022, 15, 3331. [Google Scholar] [CrossRef]
- The International Maritime Organization. Resolution MEPC.305(73), Amendments to MARPOL Annex VI; IMO: London, UK, 2018; Volume 1, pp. 1–15. [Google Scholar]
- Zincir, B. Environmental and economic evaluation of ammonia as a fuel for short-sea shipping: A case study. Int. J. Hydrogen Energy 2022, 47, 18148–18168. [Google Scholar] [CrossRef]
- Moon, K.; Wright, L.; Choi, S. DeRisk beta: Comparative Quantitative Risk Assessment (QRA) of fuel oil, LNG, methanol, and ammonia on a 15,000 TEU containership 2. Safety Risk of Conventional Containerships. J. Adv. Mar. Eng. Technol. 2025, 49, 42–46. [Google Scholar] [CrossRef]
- Duong, P.A.; Ryu, B.R.; Jung, J.; Kang, H. A Comprehensive Review of the Establishment of Safety Zones and Quantitative Risk Analysis during Ship-to-Ship LNG Bunkering. Energies 2024, 17, 512. [Google Scholar] [CrossRef]
- Duong, P.A.; Ryu, B.R.; Kyu, S.S.; Jeon, H.; Kang, H. Performance analysis of a fuel cells integrated system utilizing Liquified Natural Gas as fuel for a green shipping target. Int. J. Nav. Arch. Ocean Eng. 2023, 15, 100543. [Google Scholar] [CrossRef]
- Duong, P.A.; Ryu, B.R.; Song, M.K.; Nam, D.; Kang, H. Thermodynamics analysis of a novel designation of LNG solid oxide fuel cells combined system with CO2 capture using LNG cold energy. J. Eng. Res. 2023, 12, 226–238. [Google Scholar] [CrossRef]
- Ye, M.; Sharp, P.; Brandon, N.; Kucernak, A. System-level comparison of ammonia, compressed and liquid hydrogen as fuels for polymer electrolyte fuel cell powered shipping. Int. J. Hydrogen Energy 2022, 47, 8565–8584. [Google Scholar] [CrossRef]
- Ryu, B.; Duong, P.A.; Kang, H. Comparative analysis of the thermodynamic performances of solid oxide fuel cell–gas turbine integrated systems for marine vessels using ammonia and hydrogen as fuels. Int. J. Nav. Arch. Ocean Eng. 2023, 15, 100524. [Google Scholar] [CrossRef]
- Jeong, S.; Kim, Y.; Kim, J.-S. Simulation and analysis of a fuel supply system with vent control system for ammonia fueled ships. J. Adv. Mar. Eng. Technol. 2024, 48, 260–267. [Google Scholar] [CrossRef]
- Zhang, Y.H.P.; Mielenz, J.R. Renewable hydrogen carrier—Carbohydrate: Constructing the carbon-neutral carbohydrate economy. Energies 2011, 4, 254–275. [Google Scholar] [CrossRef]
- Lamb, K.E.; Dolan, M.D.; Kennedy, D.F. Ammonia for hydrogen storage; A review of catalytic ammonia decomposition and hydrogen separation and purification. Int. J. Hydrogen Energy 2019, 44, 3580–3593. [Google Scholar] [CrossRef]
- Herbinet, O.; Bartocci, P.; Dana, A.G. On the use of ammonia as a fuel—A perspective. Fuel Commun. 2022, 11, 100064. [Google Scholar] [CrossRef]
- Yüzbaşıoğlu, A.E.; Avşar, C.; Gezerman, A.O. The current situation in the use of ammonia as a sustainable energy source and its industrial potential. Curr. Res. Green Sustain. Chem. 2022, 5, 100307. [Google Scholar] [CrossRef]
- Yang, M.; Lam, J.S.L. Operational and economic evaluation of ammonia bunkering—Bunkering supply chain perspective. Transp. Res. Part D Transp. Environ. 2023, 117, 103666. [Google Scholar] [CrossRef]
- Roy, A.; Srivastava, P.; Sinha, S. Dynamic failure assessment of an ammonia storage unit: A case study. Process. Saf. Environ. Prot. 2015, 94, 385–401. [Google Scholar] [CrossRef]
- Kukkonen, J.; Savolainen, A.L.; Valkama, I.; Juntto, S.; Vesala, T. Long-range transport of ammonia released in a major chemical accident at Ionava, Lithuania. J. Hazard. Mater. 1993, 35, 1–16. [Google Scholar] [CrossRef]
- Gaskin, S.; Pisaniello, D.; Edwards, J.W.; Bromwich, D.; Reed, S.; Logan, M.; Baxter, C. Application of skin contamination studies of ammonia gas for management of hazardous material incidents. J. Hazard. Mater. 2013, 252–253, 338–346. [Google Scholar] [CrossRef] [PubMed]
- Anjana, N.; Amarnath, A.; Nair, M.H. Toxic hazards of ammonia release and population vulnerability assessment using geographical information system. J. Environ. Manag. 2018, 210, 201–209. [Google Scholar] [CrossRef] [PubMed]
- Moura, R.; Beer, M.; Patelli, E.; Lewis, J.; Knoll, F. Learning from major accidents to improve system design. Saf. Sci. 2016, 84, 37–45. [Google Scholar] [CrossRef]
- Michaels, R.A. Emergency Planning and the Acute Toxic Potency of Inhaled Ammonia. Environ. Health Perspect. 1999, 107, 617. [Google Scholar] [CrossRef]
- Eliopoulou, E.; Papanikolaou, A.; Voulgarellis, M. Statistical analysis of ship accidents and review of safety level. Saf. Sci. 2016, 85, 282–292. [Google Scholar] [CrossRef]
- Duong, P.A.; Ryu, B.R.; Jung, J.; Kang, H. Comparative analysis on vapor cloud dispersion between LNG/liquid NH3 leakage on the ship to ship bunkering for establishing safety zones. J. Loss Prev. Process Ind. 2022, 85, 105167. [Google Scholar] [CrossRef]
- Zhang, Z.; Zhang, Z.; Zhou, Y.; Ouyang, Y.; Sun, J.; Zhang, J.; Li, B.; Zhang, D.; Wang, Y.; Yao, J.; et al. Review of the Diffusion Process, Explosion Mechanism, and Detection Technology of Hydrogen and Ammonia. Energies 2025, 18, 2526. [Google Scholar] [CrossRef]
- Li, Y.; Bi, M.; Zhou, Y.; Zhang, Z.; Zhang, K.; Zhang, C.; Gao, W. Characteristics of hydrogen-ammonia-air cloud explosion. Process Saf. Environ. Prot. 2021, 148, 1207–1216. [Google Scholar] [CrossRef]
- Li, S.; Chen, R.; Zhang, Y.; Cheng, S.; Li, X.; Zhang, T.; Zhang, X.; Zhou, W.; Shi, X.; Cao, W. The effect of NH3 concentration on explosion venting characteristics and combustion mechanism. Int. J. Hydrogen Energy 2024, 101, 1172–1182. [Google Scholar] [CrossRef]
- Bae, J.; Noh, B.-S.; Lee, J.-W.; Choe, S.-J.; Park, K.-H.; Kim, J.-D.; Choi, J.-H. Quantitative Analysis of Explosion Characteristics Based on Ignition Location in an Ammonia Fuel Preparation Room Using CFD Simulation. Appl. Sci. 2025, 15, 6554. [Google Scholar] [CrossRef]
- Tan, W.; Du, H.; Liu, L.; Su, T.; Liu, X. Experimental and numerical study of ammonia leakage and dispersion in a food factory. J. Loss Prev. Process Ind. 2017, 47, 129–139. [Google Scholar] [CrossRef]
- Tan, W.; Lv, D.; Guo, X.; Du, H.; Liu, L.; Wang, Y. Accident consequence calculation of ammonia dispersion in factory area. J. Loss Prev. Process Ind. 2020, 67, 104271. [Google Scholar] [CrossRef]
- Bouet, R.; Duplantier, S.; Salvi, O. Ammonia large scale atmospheric dispersion experiments in industrial configurations. J. Loss Prev. Process Ind. 2005, 18, 512–519. [Google Scholar] [CrossRef]
- Murakami, T.; Kitabatake, N.; Tani, F. Dispersion in the Presence of Acetic Acid or Ammonia Confers Gliadin-Like Characteristics to the Glutenin in Wheat Gluten. J. Food Sci. 2015, 80, C269–C278. [Google Scholar] [CrossRef]
- Al-Enazi, A.; Okonkwo, E.C.; Bicer, Y.; Al-Ansari, T. A review of cleaner alternative fuels for maritime transportation. Energy Rep. 2021, 7, 1962–1985. [Google Scholar] [CrossRef]
- Ayvali, T.; Tsang, S.C.E.; Van Vrijaldenhoven, T. The position of ammonia in decarbonising maritime industry: An overview and perspectives: Part I. Johns. Matthey Technol. Rev. 2021, 65, 275–290. [Google Scholar] [CrossRef]
- Yapicioglu, A.; Dincer, I. A review on clean ammonia as a potential fuel for power generators. Renew. Sustain. Energy Rev. 2019, 103, 96–108. [Google Scholar] [CrossRef]
- Klerke, A.; Christensen, C.H.; Nørskov, J.K.; Vegge, T. Ammonia for hydrogen storage: Challenges and opportunities. J. Mater. Chem. 2008, 18, 2304–2310. [Google Scholar] [CrossRef]
- Bicer, Y.; Dincer, I.; Zamfirescu, C.; Vezina, G.; Raso, F. Comparative life cycle assessment of various ammonia production methods. J. Clean. Prod. 2016, 135, 1379–1395. [Google Scholar] [CrossRef]
- Le Fevre, C. A Review of Demand Prospects for LNG as a Marine Transport Fuel; Oxford Institute for Energy Studies: Oxford, UK, 2018. [Google Scholar]
- Inal, O.B.; Dere, C.; Deniz, C. Onboard Hydrogen Storage for Ships: An Overview. In Proceedings of the 5th International Hydrogen Technologies Congress (IHTEC-2021), Online, 26–28 May 2021. [Google Scholar]
- NCBI. Available online: https://pubchem.ncbi.nlm.nih.gov/compound/Ammonia (accessed on 1 June 2025).
- McKinlay, C.J.; Turnock, S.; Hudson, D. A Comparison of hydrogen and ammonia for future long distance shipping fuels. In LNG/LPG and Alternative Fuel Ships; Royal Institute of Naval Architects: London, UK, 2020; pp. 53–65. [Google Scholar]
- Stephens, H.W. The Texas City Disaster: A re-examination. Ind. Environ. Crisis Q. 1993, 7, 189–204. [Google Scholar] [CrossRef]
- Babrauskas, V. Explosions of ammonium nitrate fertilizer in storage or transportation are preventable accidents. J. Hazard. Mater. 2016, 304, 134–149. [Google Scholar] [CrossRef] [PubMed]
- Stewart, E. Revisiting the Jonava Ammonia Tank Rupture—35 Years on; Institution of Chemical Engineers: Rugby, UK, 2024; pp. 2–6. [Google Scholar]
- Wasewar, K.L.; Kumar, M.S. Quantitative Risk Assessment. i-Manag. J. Future Eng. Technol. 2010, 6, 33–39. [Google Scholar] [CrossRef]
- Zhang, T.X.; Li, M.R.; Liu, C.; Wang, S.P.; Yan, Z.-G. A review of the toxic effects of ammonia on invertebrates in aquatic environments. Environ. Pollut. 2023, 336, 122374. [Google Scholar] [CrossRef]
- Fritt-Rasmussen, J.; Gustavson, K.; Aastrup, G.; Agersted, M.D.; Boertmann, D.; Clausen, D.S.; Jørgensen, C.J.; Lanso, A.S.; Mosbech, A. Assessment of the Potential Environmental Impacts of a Major Ammonia Spill from a Power-to-X Plant and from Shipping of Ammonia in Greenland; Aarhus University: Aarhus, Denmark, 2022. [Google Scholar]
- Lin, W.; Luo, H.; Wu, J.; Hung, T.-C.; Cao, B.; Liu, X.; Yang, J.; Yang, P. A Review of the Emerging Risks of Acute Ammonia Nitrogen Toxicity to Aquatic Decapod Crustaceans. Water 2023, 15, 27. [Google Scholar] [CrossRef]
- Zhu, G.; Guo, X.; Yi, Y.; Tan, W.; Ji, C. Experiment and simulation research of evolution process for LNG leakage and diffusion. J. Loss Prev. Process Ind. 2020, 64, 104041. [Google Scholar] [CrossRef]
- Zhu, D.Z. Example of simulating analysis on LNG leakage and dispersion. Procedia Eng. 2014, 71, 220–229. [Google Scholar] [CrossRef]
- Tofalos, C.; Jeong, B.; Jang, H. Safety comparison analysis between LNG/LH2 for bunkering operation. J. Int. Marit. Saf. Environ. Aff. Shipp. 2020, 4, 135–150. [Google Scholar] [CrossRef]
- Liu, Y.; Harikrishnan, B.; Kolluru, R.; Mastorakos, E. Computational fluid dynamics simulation of ammonia leakage scenarios during ship-to-ship bunkering. Ocean Eng. 2024, 312, 119136. [Google Scholar] [CrossRef]


| Properties | Unit | Value |
|---|---|---|
| Energy content per unit mass | MJ/L | 12.7 |
| Latent heat required for phase change (Vaporization) | MJ/kg | 188 |
| Auto-Ignition temperature | 651 | |
| Standard density (at 0 °C and 1 atm) | kg/m3 | 0.769 |
| Specific heat capacity at constant pressure (Cp) | kJ/mol | 0.037 |
| Equilibrium vapor pressure at 20 °C | kPa | 858 |
| Specific heat capacity at constant volume (Cv) | kJ/mol | 0.028 |
| Enthalpy of vaporization | kJ/kg | 1371 |
| Adiabatic flame temperature at 1 atm | 1800 | |
| Vapor pressure required for condensation at 25 °C | MPa | 0.99 |
| Minimum energy required for ignition | mJ | 680 |
| Flammability limits in dry air | % | 15.15 to 27.35 |
| Liquid phase density | kg/m3 | 600 |
| Cetane rating | 0 | |
| Molecular weight | g/mol | 17.031 |
| Maximum adiabatic flame temperature | 1800 | |
| Freezing point | −77.7 | |
| Octane rating | ~130 | |
| Boiling temperature at atmospheric pressure (1 atm) | −33.6 | |
| Critical temperature | 132.25 | |
| Maximum laminar flame speed | m/s | 0.07 |
| Critical pressure | bar | 113 |
| Boundary Condition | |
|---|---|
| XLO | Euler |
| XLO | Euler |
| YLO | Euler |
| YHI | Euler |
| ZLO | Euler |
| ZHI | Euler |
| Initial Condition | |
|---|---|
| Ambient pressure [Pa] | 101,325 |
| Environment temperature [K] | 288.15 |
| Gas composition ratio Gas cloud volume Shape of cloud volume | Ammonia 100% Equivalent volume (ER = 1) 10 × 15 × 5 cube |
| Monitor Point | Monitor Point | ||
|---|---|---|---|
| X | Y | Z | |
| MP1 | 0.1 | 0.1 | 4.9 |
| MP2 | 0.1 | 14.9 | 4.9 |
| MP3 | 9.9 | 0.1 | 4.9 |
| MP4 | 9.9 | 14.9 | 4.9 |
| MP5 | 0.1 | 0.1 | 0.1 |
| MP6 | 0.1 | 14.9 | 0.1 |
| MP7 | 9.9 | 0.1 | 0.1 |
| MP8 | 9.9 | 14.9 | 0.1 |
| MP9 | 5 | 7.5 | 4.9 |
| MP10 | 5 | 7.5 | 2.5 |
| MP11 | 5.2 | 7.5 | 0.1 |
| Case | Mole Fraction of Fuel at Monitoring Points According to Leak Rate | Order of Detection and Time | |||
|---|---|---|---|---|---|
| Order of Detection (25 ppm) | Time (s) | Order of Detection (300 ppm) | Time (s) | ||
| Leakage direction +X |  | 337 | 3.59 | 337 | 3.93 |
| 1041 | 5.03 | 1041 | 5.13 | ||
| 352 | 6.11 | 352 | 6.15 | ||
| 969 | 6.32 | 969 | 6.41 | ||
| 1056 | 8.57 | 1056 | 8.68 | ||
| 881 | 14.14 | 881 | 14.30 | ||
| 177 | 18.20 | 177 | 18.27 | ||
| 896 | 20.08 | 896 | 20.97 | ||
| 192 | 33.80 | 192 | 34.10 | ||
| 265 | 34.16 | 265 | 37.84 | ||
| Leakage direction −X |  | 177 | 2.95 | 177 | 2.99 |
| 881 | 4.79 | 881 | 4.87 | ||
| 969 | 6.42 | 969 | 6.51 | ||
| 192 | 7.78 | 192 | 7.88 | ||
| 896 | 8.21 | 896 | 8.35 | ||
| 1041 | 12.98 | 1041 | 13.20 | ||
| 337 | 13.03 | 337 | 13.60 | ||
| 265 | 17.67 | 1056 | 20.69 | ||
| 1056 | 20.23 | 265 | 28.95 | ||
| 352 | 29.26 | 352 | 30.18 | ||
| Leakage direction +Y |  | 265 | 0.16 | 265 | 0.18 |
| 352 | 3.70 | 352 | 3.77 | ||
| 192 | 3.89 | 192 | 3.94 | ||
| 1056 | 6.04 | 1056 | 6.13 | ||
| 896 | 6.90 | 896 | 7.00 | ||
| 177 | 15.09 | 177 | 15.22 | ||
| 969 | 18.82 | 969 | 18.89 | ||
| 881 | 24.02 | 881 | 31.39 | ||
| 337 | 30.55 | 337 | 40.22 | ||
| 1041 | 33.05 | 1041 | 40.94 | ||
| Leakage rate of −Y | 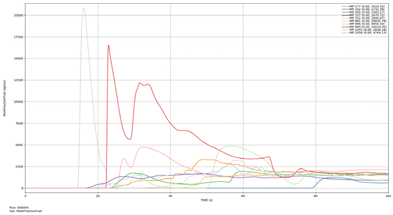 | 881 | 14.44 | 881 | 14.55 |
| 337 | 16.83 | 337 | 19.03 | ||
| 1041 | 19.08 | 1041 | 21.61 | ||
| 969 | 22.21 | 969 | 22.29 | ||
| 177 | 23.43 | 265 | 24.55 | ||
| 265 | 23.90 | 1056 | 25.38 | ||
| 896 | 23.93 | 896 | 26.00 | ||
| 1056 | 25.01 | 177 | 26.83 | ||
| 352 | 43.51 | 352 | 46.02 | ||
| 192 | 79.08 | 192 | 79.87 | ||
| Leakage direction +Z | 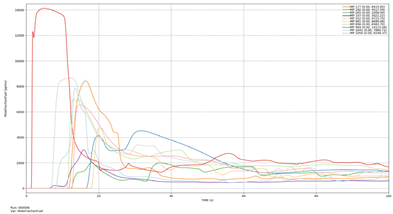 | 969 | 1.42 | 969 | 1.45 |
| 337 | 6.56 | 881 | 7.06 | ||
| 881 | 6.88 | 1041 | 8.38 | ||
| 1041 | 8.10 | 337 | 11.09 | ||
| 896 | 11.23 | 896 | 11.42 | ||
| 177 | 11.76 | 177 | 12.00 | ||
| 265 | 12.50 | 1056 | 12.79 | ||
| 1056 | 12.60 | 265 | 12.80 | ||
| 192 | 16.64 | 192 | 16.97 | ||
| 352 | 17.94 | 352 | 18.21 | ||
| Case | Maximum Ammonia Concentration (ppm) | Average Ammonia Concentration After 200 s (ppm) |
|---|---|---|
| Leakage rate of 0.1 kg/s | 24,244.19 | 1135.78 |
| Leakage rate of 0.5 kg/s | 74,640.68 | 5841.35 |
| Leakage rate of 1.0 kg/s | 106,080.41 | 11,554.08 |
| Leakage rate of 5.0 kg/s | 266,155.41 | 53,416.11 |
| Leakage rate of 10.0 kg/s | 373,971.56 | 87,136.67 |
Disclaimer/Publisher’s Note: The statements, opinions and data contained in all publications are solely those of the individual author(s) and contributor(s) and not of MDPI and/or the editor(s). MDPI and/or the editor(s) disclaim responsibility for any injury to people or property resulting from any ideas, methods, instructions or products referred to in the content. |
© 2025 by the authors. Licensee MDPI, Basel, Switzerland. This article is an open access article distributed under the terms and conditions of the Creative Commons Attribution (CC BY) license (https://creativecommons.org/licenses/by/4.0/).
Share and Cite
Duong, P.A.; Bae, J.-W.; Lee, C.; Yang, D.H.; Kang, H. Numerical Study on Ammonia Dispersion and Explosion Characteristics in Confined Space of Marine Fuel Preparation Room. J. Mar. Sci. Eng. 2025, 13, 1235. https://doi.org/10.3390/jmse13071235
Duong PA, Bae J-W, Lee C, Yang DH, Kang H. Numerical Study on Ammonia Dispersion and Explosion Characteristics in Confined Space of Marine Fuel Preparation Room. Journal of Marine Science and Engineering. 2025; 13(7):1235. https://doi.org/10.3390/jmse13071235
Chicago/Turabian StyleDuong, Phan Anh, Jin-Woo Bae, Changmin Lee, Dong Hak Yang, and Hokeun Kang. 2025. "Numerical Study on Ammonia Dispersion and Explosion Characteristics in Confined Space of Marine Fuel Preparation Room" Journal of Marine Science and Engineering 13, no. 7: 1235. https://doi.org/10.3390/jmse13071235
APA StyleDuong, P. A., Bae, J.-W., Lee, C., Yang, D. H., & Kang, H. (2025). Numerical Study on Ammonia Dispersion and Explosion Characteristics in Confined Space of Marine Fuel Preparation Room. Journal of Marine Science and Engineering, 13(7), 1235. https://doi.org/10.3390/jmse13071235