1. Introduction
Benthic diatoms refer to diatoms that have a relatively fixed growth location and inhabit diverse environments. They occur on stones, sediments, aquatic plants, and other substrates in almost all water bodies [
1]. Diatoms are microscopic, unicellular or multicellular eukaryotic algae that engage in photosynthesis, serving as one of the most important primary producers in aquatic ecosystems [
2]. When habitat destruction, eutrophication, and heavy metal pollution occur, the community composition and relative abundance of benthic diatoms can respond quickly to water quality or environmental changes [
3,
4]. Therefore, benthic diatoms are often used as bio-indicators to evaluate water quality and monitor the health of aquatic ecosystems [
5,
6,
7].
The morphology and ornamentation of the diatom frustule are important bases for classification. With advancements in microscopy, researchers have been able to observe diatoms with increasing precision. Features such as raphe morphology, central and axial area characteristics, striae shape, and girdle band structure have become increasingly important in diatom species identification [
8,
9]. Consequently, capturing high-resolution electron microscopy images has become an essential task in diatom research. In practice, due to the vast diversity and morphological variability of benthic diatoms, traditional manual identification methods are time-consuming, labor-intensive, and prone to human error [
10]. Additionally, when collecting diatoms by scraping samples from various substrates, impurities such as mud and sand will be mixed. This can significantly increase the difficulty of manual identification. As a result, the application of artificial intelligence technology for diatom identification has gained increasing attention [
10,
11,
12,
13,
14].
The rise of deep learning has provided an important impetus for the development of fine-grained visual recognition algorithms [
15]. Among these algorithms, the convolutional neural network (CNN) [
16] architecture enables significantly improved recognition accuracy and discrimination ability. At present, CNN-based fine-grained visual classification algorithms are primarily categorized into two paradigms: strongly supervised and weakly supervised learning approaches. In strongly supervised learning frameworks, fine-grained image classification approaches [
17,
18,
19,
20] typically require manual bounding box annotations or other forms of explicit supervisory information. These supervisory constraints enable the precise localization of discriminative regions, as exemplified by the R-CNN framework proposed by Girshick et al. [
20], which incorporates a region proposal mechanism to select optimal detection results through classification scoring. However, the heavy reliance on large-scale manual annotations in such approaches has resulted in substantial labeling costs, consequently limiting their scalability on extensive datasets.
In light of these limitations, researchers have progressively shifted their focus toward weakly supervised learning methods [
21,
22,
23]. These methods automatically localize discriminative features without requiring additional manual annotations, thereby enhancing the practicality and scalability of such algorithms. Within this context, ResNet [
24], a classical deep convolutional neural network, has been extensively employed in fine-grained visual classification tasks. Its deep residual architecture effectively mitigates the vanishing gradient problem and has demonstrated remarkable performance across various computer vision tasks. However, certain limitations persist when ResNet is applied to tasks involving complex background interference and subtle inter-class variations. Specifically, ResNet primarily relies on global features for classification, lacking precise attention to discriminative local regions, which makes it susceptible to background noise interference. Furthermore, the fixed-scale feature extraction approach adopted in ResNet utilizes only the final layer’s features for classification. It is, therefore, difficult to fully capture the target information at different scales, limiting its performance in the fine-grained diatom recognition task.
Researchers have made significant efforts in recent years to address the limitations of deep learning methods in diatom image classification tasks. Pu et al. [
25] proposed a novel diatom microscopy image recognition approach that combines static data augmentation, transfer learning, and prediction methods incorporating cosine similarity to enhance the classification performance of networks. Li et al. [
13] improved upon the YOLOv5 model by introducing attention mechanisms and spatial pyramid pooling (SPP) to strengthen feature extraction capabilities, along with the K-means++ algorithm to obtain more accurate bounding boxes, thereby enhancing the model’s detection performance.
In this study, a novel fine-grained diatom recognition network is proposed. The network incorporates a knowledge extraction module (KEM) and a dual knowledge guidance module (DKGM) specifically designed to mitigate the interference of background noise on classification accuracy in diatom images. Furthermore, a multi-granularity learning strategy is implemented to capture hierarchical feature representations, complemented by knowledge distillation techniques to ensure the accuracy and robustness of multi-granularity features. To further enhance the effectiveness of feature extraction, the network introduces a multi-scale training strategy. Using a foreground cropping method based on the attention mechanism, a purer target diatom region can be obtained, enhancing the model’s ability to focus on key features. The entire network is trained in an end-to-end manner, ensuring the coordinated optimization of all modules. The experimental results on a self-built diatom dataset demonstrate significant improvements in classification accuracy. Additionally, ablation studies and visual analysis further validate the effectiveness of each module and their respective contributions to classification performance.
In summary, this study makes the following key contributions:
- (1)
We propose a novel fine-grained diatom recognition network that integrates a KEM and a DKGM to enhance target diatom features and suppress background noise. The network combines knowledge distillation, multi-granularity learning, and multi-scale feature extraction, optimizing feature representation for more accurate diatom classification.
- (2)
We design a new KEM that generates foreground attention maps to strengthen diatom feature representation and reduce background noise interference. These attention maps also serve as prior knowledge to guide model training.
- (3)
We designed a novel DKGM that employs a grouped channel attention mechanism to reinforce multi-region foreground features while extracting and refining background information as auxiliary cues.
2. Materials
2.1. Benthic Diatom Dataset
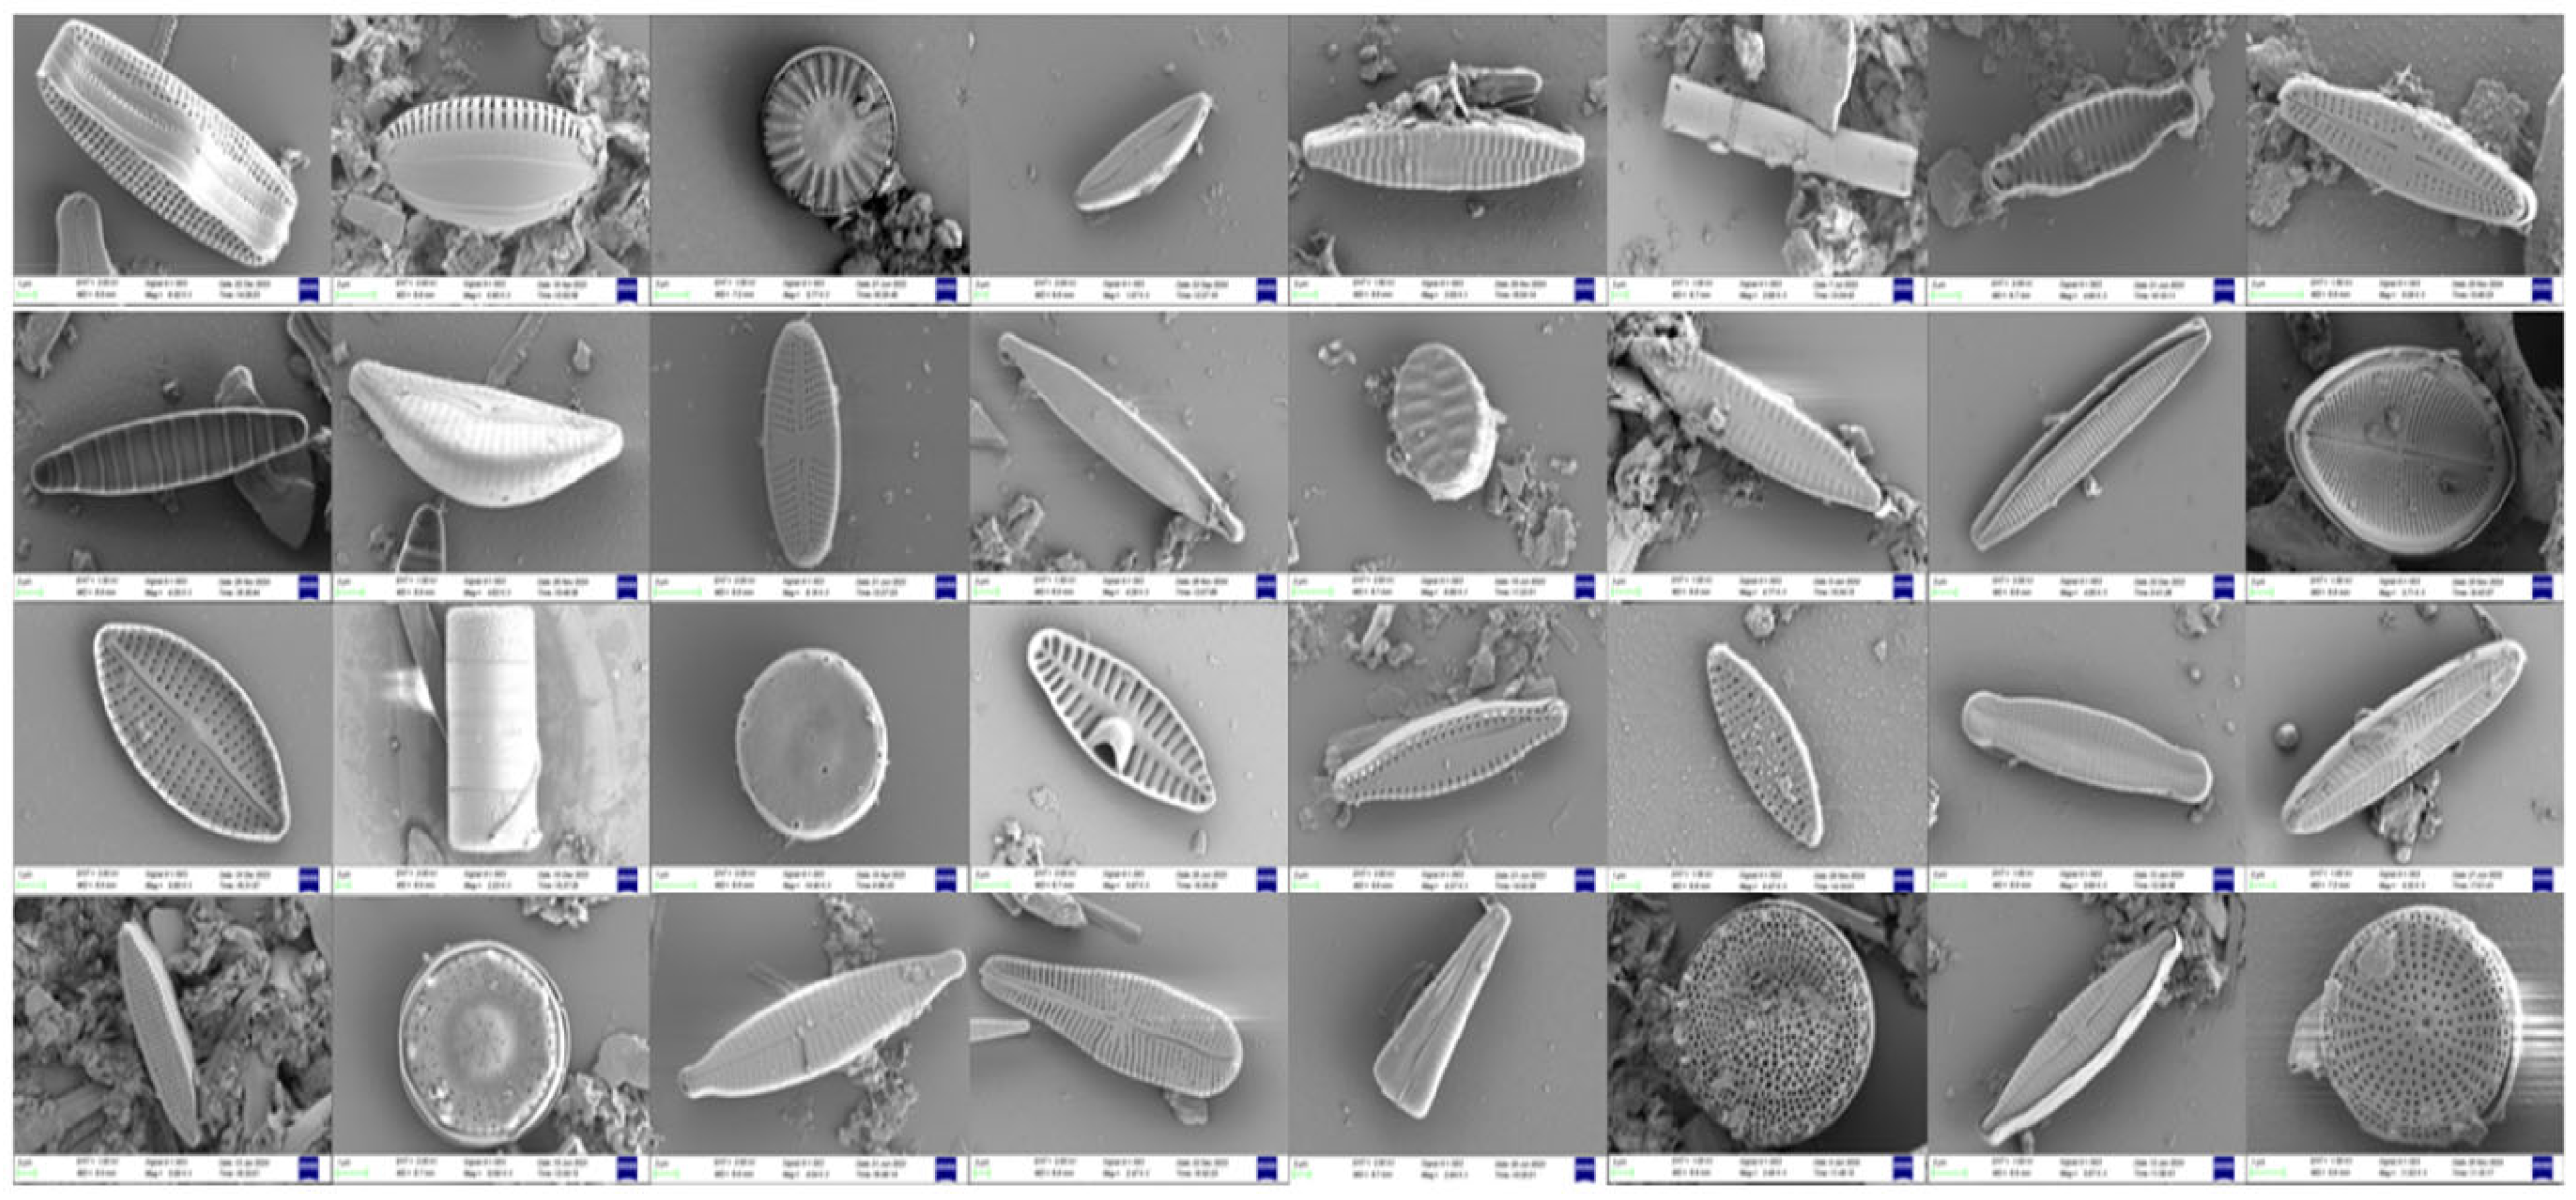
Benthic diatom samples were collected from the main stem of the Yellow River and its primary tributaries within Shandong Province, China, including the Dawen River, Beidasha River, and Yufu River. Sampling was conducted during the summer and autumn of 2022, as well as the spring of 2023. In the laboratory, the samples were treated with nitric acid (Tianjin Damao Chemical Reagent Factory, Tianjin, China), and only the siliceous cell walls of the diatoms were retained. Diatom imaging and identification were performed using a field emission scanning electron microscope (FESEM, Zeiss Sigma 500, Carl Zeiss, Oberkochen, Germany). In total, 3157 scanning electron microscope images were collected and classified into 32 diatom taxa (genera or species) (see
Table 1 and
Figure 1). Notably, considering that environmental monitoring samples often contain various impurities, no measures were taken to reduce or eliminate the interference from sediment when establishing the image dataset.
2.2. Data Preprocessing
In the training and testing phases of the model, we performed uniform preprocessing operations on the input images. This ensures that the data format meets the model input requirements and improves the training effect and generalization ability of the model. Initially, the shorter side of the image was resized to a preset size of 512 while keeping the aspect ratio constant. This avoids deformation that may result from scaling directly to the target size and maximizes the retention of key information in the image. Subsequently, a square region with a fixed size of 448 × 448 was cropped from the center of the adjusted image to ensure consistent input size. This allows the model to focus more on the features of the subject area, thus reducing background interference. The processed images were then converted into a tensor format ([C, H, W] − channels × height × width). The pixel values were normalized to the range [0, 1] to accommodate the numerical computation requirements of the deep learning model. Finally, channel-wise normalization was performed using the mean ([0.485, 0.456, 0.406]) and standard deviation ([0.229, 0.224, 0.225]) values commonly employed in ImageNet pretrained models. We aimed to make the distribution of the input data consistent with the training data of the pretrained models, thus improving the stability of feature extraction and the effectiveness of migration learning. This comprehensive preprocessing strategy ensures consistency of the data, optimizes training convergence speed, and enhances model robustness and generalization capability in fine-grained diatom recognition tasks.
2.3. Residual Network
The rapid advancement of convolutional neural networks (CNNs) can be largely attributed to the introduction of AlexNet [
26] in 2012. Subsequent architectures, including VGG [
27] and GoogLeNet [
28], have achieved significant improvements in image classification performance through increased network depth and enhanced structural designs. However, as network depth continues to grow, challenges such as vanishing gradients and network degradation have become increasingly prominent. This ultimately limits further performance enhancements.
Proposed by He et al. in 2015, ResNet represents a significant advancement in deep convolutional neural networks through its innovative residual learning mechanism. The core innovation lies in the introduction of skip connections that directly add input features to the output of convolutional layers. It makes the gradient propagate directly in the backpropagation process, effectively alleviating the problem of gradient vanishing in deep networks. When the depth exceeds 20 layers, the traditional convolutional neural network will be saturated, and even the performance will be degraded. In contrast, ResNet can successfully train a 152-layer deep network through its residual learning mechanism. It can also reduce the Top-5 error rate on the ImageNet dataset to 3.57%, which won the ImageNet competition in 2015. The design of the residual block allows the network to learn the residual mapping of the input features instead of directly fitting the full nonlinear mapping. This design reduces the optimization difficulty and significantly improves the feature representation of the network. These architectural innovations mitigate gradient vanishing and network degradation in deep neural networks, enabling deeper network training while providing foundational advances for deep learning development.
ResNet has achieved groundbreaking results on multiple benchmark datasets, including ImageNet [
29] and COCO [
30], setting new performance records and establishing itself as a classical baseline model for image classification tasks. The core principles of ResNet have not only propelled the development of extremely deep neural networks but also provided significant theoretical insights and practical guidance for subsequent model designs. Within both industrial and academic communities, ResNet’s impact has been profound, with widespread applications across various computer vision tasks, such as object detection [
31,
32], semantic segmentation [
33,
34], and image classification [
35,
36,
37,
38]. This architectural innovation stands as a pivotal milestone in the evolution of deep learning.
3. Methods
This study proposes a novel fine-grained diatom recognition model (
Figure 2) comprising two key components: (1) a KEM and a DKGM that collaboratively enhance foreground feature representation while suppressing background noise, with extracted prior knowledge guiding multi-scale training strategies (MS), and (2) a knowledge distillation mechanism (KD) that provides supervisory signals for multi-granularity feature learning to improve model robustness and generalization. The following sections detail these components’ design and implementation.
3.1. Knowledge Extraction Module
Under electron microscopy imaging conditions, diatom images typically contain complex background information, including diatom debris, sediment, and other non-target particulate matter. The noise information is highly similar to the diatom target in terms of texture, shape, and grayscale features. This leads to the difficulty for traditional networks in effectively distinguishing foreground targets from background noise in the feature extraction process. This confusion leads the model to learn numerous features that are irrelevant to the classification task, significantly compromising classification performance. To address this issue, we propose a KEM. It extracts discriminative foreground features from complex backgrounds while suppressing background noise interference, thereby enhancing the model’s feature extraction capabilities and classification accuracy. The implementation description follows.
For a given feature map, , the process begins with its sequential processing through two convolutional, Batch Normalization, ReLU, and Softmax layers to generate mutually exclusive foreground and background attention maps. The input feature map, , is then multiplied with the generated foreground attention map, , to produce an enhanced feature representation. Notably, the final convolutional layer in this module is configured with an output dimension of 2, followed by channel-wise Softmax processing to generate mutually exclusive attention maps. The enhanced feature map, refined through foreground attention, is subsequently fed into pooling layers and classifiers, with optimization performed through cross-entropy loss computation. Meanwhile, the background attention map is discarded, effectively achieving foreground extraction and background noise suppression.
The introduction of the KEM module has significantly increased the computational overhead of the model. Specifically, this module expands the model parameters from 23.57 M to 77.56 M (a 229% increase), raises FLOPs from 16.53 G to 33.39 G (a 102% increase), extends single-sample processing time during inference from 5.90 ms to 12.47 ms (a 111% increase), and increases GPU memory usage by 82% (from 250.44 MB to 455.95 MB). These elevated computational costs primarily stem from the design of the attention mechanism.
3.2. Dual Knowledge Guidance Module
The classification of benthic diatoms presents significant challenges due to high inter-class similarity among subspecies and substantial background noise interference. To address these issues, it is critical to enhance discriminative local features while suppressing irrelevant background noise. Existing attention-based methods predominantly focus on global salient regions. They often neglect both the extraction of discriminative multi-region features and the potential value inherent in background information. To overcome these limitations, a DKGM is proposed. DKGM uses grouped channel attention to decouple foreground and background features. Then, the convolution improvement is carried out on the background features obtained from decoupling. Through low-weight feature fusion, an optimal balance between feature discriminability and diversity is achieved.
Specifically, this module takes the output of the last two layers of the backbone network as input. Firstly, group along the channel dimension, and generate
regional attention matrices through the parallel pixel attention mechanism. These matrices are fused by a summation operation to obtain the global foreground attention matrix,
(as shown in Equation (1)). Subsequently,
is combined with the input features through element-by-element multiplication. The residual concatenation is used to obtain the foreground enhancement features. To extract the background information,
is thresholded. All elements except the first m maximum values (replace with the minimum values
) are then sigmoid normalized to obtain the background attention matrix,
(as shown in Equation (2)). This matrix is multiplied with the original input features. The spatial correlation is further modeled by a 1 × 1 convolutional layer to ultimately generate the background complementary features. The module output,
, is obtained through the weighted summation of foreground augmented features and background complementary features, as shown in Equation (3).
The DKGM module demonstrates high computational efficiency. When combined with the MS + KD modules (excluding KEM), the model maintains 30.37 M parameters (a 29% increase over baseline), 37.18 G FLOPs (125% increase), and a 17.54 ms inference time (197% increase). Through efficient global feature modeling, this module achieves an optimal balance between performance and computational cost.
3.3. Multiresolution Learning, Multi-Scale Training, and Knowledge Distillation
During feature extraction in the backbone network, shallow-layer features typically capture low-level visual information such as edges or textures. The deep-layer features contain high-level abstract representations, including semantic information and global structures. Traditional networks exclusively utilize the final layer’s high-level features for classification. They overlooked the rich information embedded in shallow features. To address this limitation, we implement multi-granularity learning by feature enhancement and fusion on the outputs from the last two layers of the feature extraction network. This approach enables the comprehensive utilization of multi-level feature information, resulting in more robust feature representations for diatom images.
However, features extracted from intermediate network layers demonstrate high sensitivity to input variations. This issue is particularly pronounced in fine-grained diatom recognition tasks. Due to the substantial intra-class variations caused by diverse diatom orientations, complex backgrounds, and varying imaging conditions. Directly incorporating low-level features as supplementary information may compromise model robustness and generalization capability, as these features are inherently sensitive to noise and variations. To address this challenge, we employ a self-distillation learning approach, where high-confidence semantic information extracted from deep layers guides the refinement of shallow features. This strategy effectively suppresses noise-induced interference in shallow features, thereby enhancing the robustness of feature representation.
The feature map derived from the network’s final layer is first processed through global average pooling. This operation compresses spatial information to generate a compact feature vector. The vector is then propagated into the classifier module, where non-linear transformations produce probabilistic outputs. Finally, the resulting predicted probability distribution serves as the teacher signal for subsequent knowledge distillation processes. Simultaneously, the preceding layer’s feature map undergoes identical operations to generate its predicted probability distribution as the student signal. By minimizing the distribution discrepancy between the teacher and student signals, high-level semantic information effectively supervises and guides the refinement of shallow features. So as to achieve the purpose of enhancing the generalization ability of the model.
To address the challenge of complex background interference in electron microscopy diatom images, we adopt a multi-scale training strategy. This can further mitigate the negative impact of background noise on the model performance. To further reduce the negative impact of background noise on model performance, inspired by [
25], our method implements the multiscale training strategy as follows: Based on the KEM design, during network training, we sum the foreground attention maps generated at each stage along the channel dimension. The aim is to obtain an aggregated foreground attention matrix,
, and then compute its mean,
. Subsequently, binarization is performed using a randomly selected threshold,
, within the predefined range (Equation (5)). Then, the maximum connected region is extracted from the obtained binary matrix by using the 4-neighborhood connectivity. This region is adjusted to form a rectangular bounding box serving as the foreground mask M. It is used to crop the original input image, thereby obtaining background-suppressed purified images. Notably, bounding boxes are dynamically regenerated each epoch. The cropped images are then fed as input into the next stage network. This approach effectively reduces background noise interference, thereby enhancing feature extraction robustness and classification performance.
The MS module and KEM-guided foreground extraction increase FLOPs by 33.38 G (+100%) and prolong inference time by 13.53 ms (+108%). This is mainly due to the secondary computation of multi-scale features. The KD module enhances robustness through deep-to-shallow distribution alignment. During the training period, only 20% of the computational overhead is increased while maintaining the same inference parameters (77.56 M → 77.56 M) and FLOPs. This computational cost distribution demonstrates a decoupling pattern: MS-dominated inference costs versus KD-constrained training costs.
3.4. Model Evaluation
To evaluate model performance during training and facilitate objective comparison with existing methods, we design a composite loss function consisting of classification loss and distillation loss. Both components employ cross-entropy loss functions, calculated across three factors: (1) classification probabilities obtained from global pooling and the classification of feature maps from the last two layers of the backbone network; (2) classification probabilities derived from the concatenated features of these two layers; and (3) classification probabilities corresponding to feature maps enhanced by the KEM. The distillation loss specifically utilizes the classification probability from the final layer as the teacher signal to supervise the classification probability from the preceding layer, thereby achieving knowledge distillation objectives. Through joint optimization of these loss functions, the model simultaneously enhances classification performance and feature representation robustness. The detailed definitions are as follows:
where
is the total loss,
is the classification loss,
is the distillation loss, and
is the cross-entropy loss.
denotes the prediction vector at stage
,
denotes the vector from the stages after concatenation of the prediction vectors, and
denotes the prediction vector from the KEM.
Furthermore, we introduce several evaluation metrics to comprehensively assess model performance, including Top-1 Accuracy, Top-5 Accuracy, Recall, and F1 score. The detailed computational formulas are presented as follows:
4. Results
4.1. Model Training
This experimental study was conducted using the PyTorch 3.9 deep learning framework, with all training and testing performed on NVIDIA RTX 4090 GPU (GAINWARD, Taiwan, China) hardware. ResNet50, pretrained on ImageNet [
28], was employed as the backbone network, accompanied by standard image preprocessing operations, including resizing and center cropping. Specifically, input images were initially resized to 512 × 512 resolution, followed by center cropping to dimensions of 448 × 448, with this preprocessing pipeline consistently applied during both training and testing phases. The model was trained for 200 epochs with a batch size of 16. The optimization process utilized Stochastic Gradient Descent with a momentum parameter of 0.9 and weight decay of 5 × 10
−4. For the hyperparameters,
was set to 0.1,
was set to 2, and
. Notably, throughout the experiments, only image-level labels were used for supervision. The project code is openly accessible at
https://github.com/ShuoWang00/KEGC-main (accessed on 27 May 2025).
In deep learning model training, differential learning rates are typically employed for distinct network components to optimize training efficiency. Considering that backbone networks have been pretrained on large-scale datasets and have acquired effective features with strong generalization capabilities across various tasks, we set a relatively low learning rate of 2 × 10⁻⁴ for the backbone network. Conversely, for newly added network layers such as classifiers, attention modules, or custom modules, which require learning novel features without pretraining, a higher learning rate of 9 × 10⁻³ was implemented to facilitate rapid learning and accelerate convergence. This strategy not only expedites the training of new layers but also preserves the valuable features already learned in the backbone network. By implementing differential learning rates across network components, the model can efficiently acquire new features while preventing excessive modifications of existing features, ultimately enhancing both task-specific performance and generalization capability.
In terms of computational efficiency, as presented in
Table 2, the KEGC model exhibits 82.81 million parameters, 70.07 GFLOPs, an average inference time of 26.54 ms, and GPU memory usage of approximately 500.08 MB. The results demonstrate that although KEGC shows slightly higher parameter counts and computational requirements than models like ResNet50 and ACC, it maintains efficient operational performance with a controlled inference time of around 26 ms and memory consumption of about 500 MB, enabling effective execution on mid-range GPUs (such as RTX 4090 and above). Compared with baseline models, KEGC achieves significant improvements in classification performance and feature representation capability with only a marginal increase in inference time, demonstrating an optimal balance between performance and efficiency.
4.2. Model Comparison
To validate the effectiveness of the proposed method, comprehensive evaluations were conducted on the diatom dataset using the trained model. The experiment compared several representative methods that do not rely on additional annotations, such as bounding boxes, all of which utilize only image-level labels for training. Specifically, we selected the classical convolutional network VGG16 [
27], the deep residual network ResNet50 [
24], and the recently proposed Microscopic image recognition for diatoms method (CST) [
25]. Furthermore, we used an alleviating category confusion (ACC) network [
38] for comparative analysis.
Table 3 presents the quantitative results for these models across four key metrics: F1 Score, Recall, Top-1 Accuracy, and Top-5 Accuracy.
Table 3 demonstrates that the proposed network achieves superior performance across all metrics on the custom algae dataset compared with existing methods. Specifically, our approach improves Top-1 Accuracy by 36.29%, 3.30%, 6.44%, and 2.20% over VGG16, ResNet50, CST, and ACC, respectively. Significant gains can also be observed for Recall (45.03%, 5.03%, 5.03%, and 4.37% improvements) and F1 Score (0.8950), indicating better precision–recall balance. Notably, the model achieves 98.82% Top-5 Accuracy, demonstrating exceptional generalization capability and robustness for fine-grained diatom recognition tasks.
The performance improvement can be primarily attributed to the synergistic optimization between the KEM and DKGM, which collectively enhance foreground feature representation while effectively suppressing background interference. Furthermore, the KD provides stronger supervisory signals for multi-granularity feature learning, enabling the model to extract more stable and discriminative features across different scales. These innovations work in concert to significantly boost classification performance, granting the model distinct advantages in fine-grained diatom recognition tasks.
To further validate the generalization capabilities of our method, extensive experiments were conducted on a public algae dataset comprising 160 categories with 7845 images (5882 for training and 1963 for testing). This more comprehensive dataset, encompassing broader species diversity, was specifically selected to rigorously evaluate the model’s scalability and robustness in large-scale scenarios. The experimental results are presented in
Table 4.
The experimental results in
Table 3 demonstrate that our proposed network consistently outperforms existing methods (VGG16, ResNet50, CST, and ACC) across all metrics on the public diatom dataset, achieving significant improvements of 15.08%, 5.40%, 1.53%, and 3.78% in Top-1 Accuracy; 5.91%, 1.22%, 0.08%, and 0.82% in Top-5 Accuracy; and an F1 Score of 0.8082, indicating superior precision recall balance. However, CST achieved optimal values in both the F1 Score and Recall metrics. We speculate that this may be due to our model’s current limitations in processing low-resolution images. The model’s exceptional performance is further evidenced by its 82.44 Recall, which substantially surpasses all baselines and confirms its strong generalization capabilities and robustness for fine-grained algae recognition tasks. These comprehensive improvements validate the effectiveness of our proposed architecture in handling complex diatom classification challenges.
To substantiate the proposed method’s efficacy from a gradient optimization perspective, comparative training loss curves are presented in
Figure 3 across both datasets. The gradient-based analysis of training dynamics reveals distinct optimization patterns: (1) The conventional models (ResNet50/VGG16) with single cross-entropy loss show rapid initial convergence but quickly reach a stable phase, indicating limited optimization capacity for fine-grained tasks. (2) The ACC network’s quadruple-loss design demonstrates enhanced feature learning capabilities, yet exhibits noticeable mid-training fluctuations due to multi-objective optimization. (3) Our six-component loss achieves superior optimization dynamics: rapid initial descent followed by stable refinement. These results demonstrate our method’s advantage in balancing optimization efficiency with model robustness.
4.3. Ablation Studies
To quantitatively evaluate the contribution of each innovative module to overall performance, we designed systematic ablation studies. Experiments were conducted to decouple and analyze the proposed KEM, DKGM, MS, and KD on a layer-by-layer basis. The independent and synergistic effects of each module on model discrimination ability were explored through the control variable method.
As evidenced by the experimental results in
Table 5, the baseline model (without KEM, DKGM, MS, or KD) achieves relatively low performance, with an F1 Score of 0.8515 and a Top-1 Accuracy of 87.59%, indicating that conventional backbone networks struggle to focus on discriminative foreground features without specialized enhancement mechanisms. The introduction of KEM significantly improves all metrics (F1: 0.8735; Top-1: 89.08%), demonstrating its effectiveness in enhancing foreground feature representation while suppressing background interference. Further incorporating MS yields marginal gains (F1: 0.8740; Top-1: 89.47%), suggesting its secondary role in background suppression, though with slight information loss during cropping. Notably, using only KEM + MS causes a minor Top-5 Accuracy drop (97.17%), revealing occasional feature instability from MS. The combination of KEM + KD + MS produces substantial improvements (F1: 0.8842, Recall: 88.26%, Top-1: 90.18%, and Top-5: 98.66%). Finally, the full model (KEM + DKGM + MS + KD) achieves optimal performance (F1: 0.8950, Recall: 89.48%, Top-1: 90.89%, and Top-5: 98.82%), demonstrating synergistic effects among all components. Specifically, KD enhances robustness by guiding shallow features with deep semantic information, while DKGM further refines feature discrimination.
To statistically validate the impact of each module, we performed paired
t-tests. As shown in
Table 6, removing any module resulted in a significant performance decline (all
p-values < 0.05), demonstrating that each component contributes meaningfully to the model’s effectiveness. This analysis further corroborates the necessity of our architectural choices.
To further evaluate the model’s performance in fine-grained algae recognition tasks, we present the classification accuracy for each category in the ALGAE dataset (
Table 7). The results demonstrate that the model achieves satisfactory classification performance for most categories, with a mean class accuracy of 89.41%. It also shows good generalization capability on the public dataset, attaining 81.97% mean class accuracy.
Notably, both datasets exhibit certain degrees of class imbalance. For instance, in the ALGAE dataset, while the model achieves 100% accuracy for rare classes like Discostella (representing only 0.79% of samples), it struggles with other minority classes such as Staurosira (44.44% accuracy). As illustrated in
Figure 4, Staurosira exhibits significant intra-class morphological variations, which substantially increases the discrimination difficulty. The public dataset contains even more extreme cases, with some classes comprising only 2–3 images, contributing to the observed gap between mean class accuracy (81.97%) and Top-1 Accuracy.
Despite these challenges, the model demonstrates robust overall classification performance. Future work will incorporate strategies like class re-weighting, data augmentation, and few-shot learning to enhance performance on long-tailed categories.
Table 8 presents the computational resource consumption of different module combinations on the ALGAE dataset, including parameter count, FLOPs, inference time, and GPU memory usage. The data reveal that the baseline model has the smallest parameter count (23.57 M) and lowest computational complexity (16.53 G FLOPs), with relatively low inference time and memory consumption, making it suitable for resource-constrained environments. The introduction of the KEM module increases the parameters to 77.56 M and FLOPs to 33.39 G, nearly doubling the inference time to 12.47 ms while raising memory usage to approximately 456 MB. This demonstrates the significant computational overhead introduced by the KEM module, though its substantial performance improvements indicate a favorable computation performance trade-off. When incorporating the MS module, while the parameter count remains unchanged, FLOPs nearly double to 66.77 G, and inference time increases to 26.00 ms, with a moderate rise in memory usage. These results confirm that the multi-scale feature processing of the MS module substantially increases computational demands. Subsequent integration of the KD module shows a negligible impact on computational resource consumption, with stable inference time and memory usage, indicating its minimal computational overhead. The complete model, with the additional DKGM module, exhibits a slightly higher parameter count (82.81 M) and computational complexity (70.07 G FLOPs), along with corresponding increases in inference time and memory usage. While representing the highest overall computational cost, this configuration delivers optimal model performance, making it most suitable for applications requiring high classification accuracy.
In summary, while the MS module does introduce a considerable computational burden, it provides auxiliary benefits for fine-grained feature extraction. The KEM module remains the primary source of increased computational costs but delivers significant performance gains. In future work, we plan to explore lightweight designs for the MS module to optimize computational efficiency while preserving its performance advantages.
4.4. Visualization
In deep learning model research, interpretability is crucial for revealing decision-making mechanisms, facilitating our understanding of how models process input information and generate predictions. Visualization techniques enable the revelation of network attention distribution across different features, verifying whether decisions are based on semantically relevant information. As a widely adopted visualization method, Grad-CAM [
40] generates heatmaps by backpropagating the gradient information of target categories, quantifying the network’s attention intensity on critical regions during classification decisions. This approach provides an intuitive visualization of high-level semantic feature focus locations, such as discriminative object parts or contextually relevant regions. Notably, in the heatmaps, warmer colors (red indicating a high response; blue indicating a low response) correspond to stronger feature responses, reflecting higher network attention to those regions [
41]. For this reason, this study uses heatmaps generated based on Grad-CAM to visualize and analyze the designed network.
As illustrated in
Figure 5, we visualized feature maps from stage 4 (shallow) and stage 5 (deep) of the network. The first column displays the original images, while the second and third columns present grayscale maps and heatmaps of stage 4 features, respectively. Similarly, the fourth and fifth columns show grayscale maps and heatmaps of stage 5 features. The visualization reveals that shallow feature maps primarily focus on local details while lacking global semantic information. By contrast, deep features demonstrate the ability to capture high-level abstract information by emphasizing both global semantics and semantically critical regions of targets. However, deep features tend to overlook fine details, making them sensitive to target pose and occlusion. Consequently, the fusion of shallow-level details with deep semantic features enables the network to simultaneously preserve both global structure and local discriminative information of targets, validating the necessity of multi-granularity learning.
Figure 6 presents a comparative visualization of final-stage feature maps across different networks on both datasets, validating the effectiveness of our proposed modules. The activation patterns exhibit the following distinct characteristics: (1) VGG16 (second row) demonstrates mixed background-target activations due to ineffective feature selection, corresponding to its low recall (44.5); (2) ResNet50 (third row) concentrates excessively on single local regions while neglecting discriminative edge features, explaining its limited fine-grained performance; (3) the ACC network (fourth row) achieves multi-local activation through cross-fusion modules but remains susceptible to background interference. In contrast, our method (fifth row) exhibits globally coordinated activation, with high-response regions uniformly covering key diatom structures (e.g., striae and marginal contours) while effectively suppressing background noise. These visual results directly correlate with KEM’s noise-filtering capabilities and DKGM’s multi-region feature balancing mechanism, conclusively demonstrating our approach’s comprehensive advantages for fine-grained diatom recognition.
To intuitively demonstrate each module’s efficacy, we created Grad-CAM heatmap visualizations to analyze attention mechanisms across different model configurations (
Figure 7). The qualitative results reveal the following: (1) Compared with baseline models, incorporating the KEM substantially enhances focus on discriminative regions. (2) The complete model achieves optimal attention distribution, with significantly superior coverage precision over single-module configurations. These findings confirm that removing either KEM or DKGM degrades fine-grained feature perception, while their synergistic interaction produces marked complementary effects.


