Article

Eocene Stratigraphic Sequences in the Prebetic of Alicante (SE Spain) and Their Correlation with Global Sea-Level and Climatic Curves

by
Crina Miclăuș
1,
José Enrique Tent-Manclús
2,
Josep Tosquella
3,
Manuel Martín-Martín
2,* and
Francisco Serrano
4
1
Departamentul de Geologie, Universitatea “Alexandru Ioan Cuza” din Iași, 20A, Carol I, 700505 Iași, Romania
2
Departamento de Ciencias de la Tierra y Medio Ambiente, University of Alicante, AP 99, 03080 Alicante, Spain
3
Departamento de Ciencias de la Tierra, University of Huelva, Campus Universitario del Carmen, 21071 Huelva, Spain
4
Departamento de Ecología y Geología, University of Málaga, 28071 Málaga, Spain
*
Author to whom correspondence should be addressed.
J. Mar. Sci. Eng. 2025, 13(6), 1031; https://doi.org/10.3390/jmse13061031 (registering DOI)
Submission received: 28 April 2025 / Revised: 20 May 2025 / Accepted: 21 May 2025 / Published: 24 May 2025
(This article belongs to the Section Geological Oceanography)

Abstract

:
The Onil and Ibi sections (Prebetic Zone, Betic Cordillera: Alicante, SE Spain) record a late Ypresian (Cuisian) to early Lutetian (~51 to ~43 Myr) carbonate platform succession, dated using larger benthic foraminifera (LBF) and planktonic foraminifera. Seven field lithofacies (L1 to L7) and five thin-section microfacies (Mf1–Mf5) were identified, indicating inner- to mid-ramp environments (from seagrass meadows to Maërl-LBF-dominated) in warm-water and low-latitude conditions. A distinctive feature of these platforms is their dominance by LBF in association with rhodophyceae, contrasting with typical coral reef factories. We propose a novel carbonate production model, “TC-factory”, to describe these warm-temperate systems. Integrated field logging, drone imagery, and microfacies data allowed us to define a sequence stratigraphic framework comprising five lower-frequency sequences (LFS: ~2 Myr average duration), each of them nesting various numbers of high-frequency sequences (HFS: ~0.25 to ~1 Myr). The LFSs belong to a higher-rank sequence bounded by regional unconformities. The five LFSs only broadly match the upper Ypresian and lower Lutetian cycles in global eustatic curves (~51 to ~43 Myr), indicating that other regional or local controls were important. The number of HFSs being fewer than expected also suggests additional controls, such as local tectonics, erosion during lowstands, or carbonate production feedback.

1. Introduction

The sequence stratigraphy concepts introduced in the 1970s–1990s, e.g., [1,2,3,4,5,6], were revisited in recent years [7,8,9,10,11] and transposed into a model- and scale-independent approach, with stratigraphic sequences defined on the basis of objective stratal stacking patterns and their stratigraphic relations. All standard units of sequence stratigraphy (depositional systems, systems tracts, and sequences) can be defined using stratal stacking patterns. These patterns are controlled by changes in accommodation (space available for sedimentation) and sediment supply, which result from the interplay of local, regional, and global controls (tectonic, climatic, and sedimentary processes).
Schlager [12] emphasized that sediment supply is as equally critical as accommodation in shaping stacking patterns. Key criteria for defining stratal stacking include facies relationships and geometries reflecting the syn-depositional balance between accommodation and sediment supply. Similar concepts were applied to carbonate depositional systems [13,14,15,16,17], with further refinements [7,8,9,10,11]. Carbonate and siliciclastic systems share controls such as eustasy, tectonics, sedimentation rate, and climate, but differ in sediment provenance and production mechanisms [13,14]. Catuneanu [10] argues that his methodology is universally applicable, including to carbonates, provided that intrabasinal sediment production processes are accounted for. However, Reijmer [18] cautions that carbonate systems require factory-specific adaptations due to their diverse production modes: T-factory (tropical/top water), CWC-factory (cold water coral), C-factory (cool water/controlled precipitation), M-factory (microbial/micrite/mud-mound), and P-factory (pelagic). Each factory exhibits unique precipitation styles (abiotic/biotic), sedimentation patterns (spread, frame, move, stick, and production, respectively), and responses to accommodation changes [18,19,20,21,22,23], which work on building a specific depositional topography and morphology (rimmed shelves, ramps, isolated platforms, etc.) and controls (main and site-specific environmental controls).
Sedimentary deposits use to be categorized into six hierarchical orders based on temporal/spatial distribution [9,24,25,26]: first-order (50–100 Myr), related to Wilson cycles (plate tectonics); second-order (10–50 Myr), driven by regional tectonics/eustasy; third-order (1–10 Myr), caused by global sea-level changes and regional tectonics; fourth-order (0.1–0.5 Myr), related to orbital climate (Milankovitch) cycles; fifth-order (10–100 kyr), derived from high-frequency climate shifts; and sixth-order (<10 kyr), caused by local events (storms and floods). This paper analyzes two Eocene carbonate successions from the Prebetic (External Betic Zone, Alicante), featuring cyclic sedimentation bounded by unconformities, carbonate factory identification and accommodation controls, and correlation with global eustatic/climatic curves to disentangle global vs. local/regional controls. This study constrains basin evolution (accommodation dynamics and stacking patterns) and provides important insights applicable to other similar sediments in other parts of the planet.

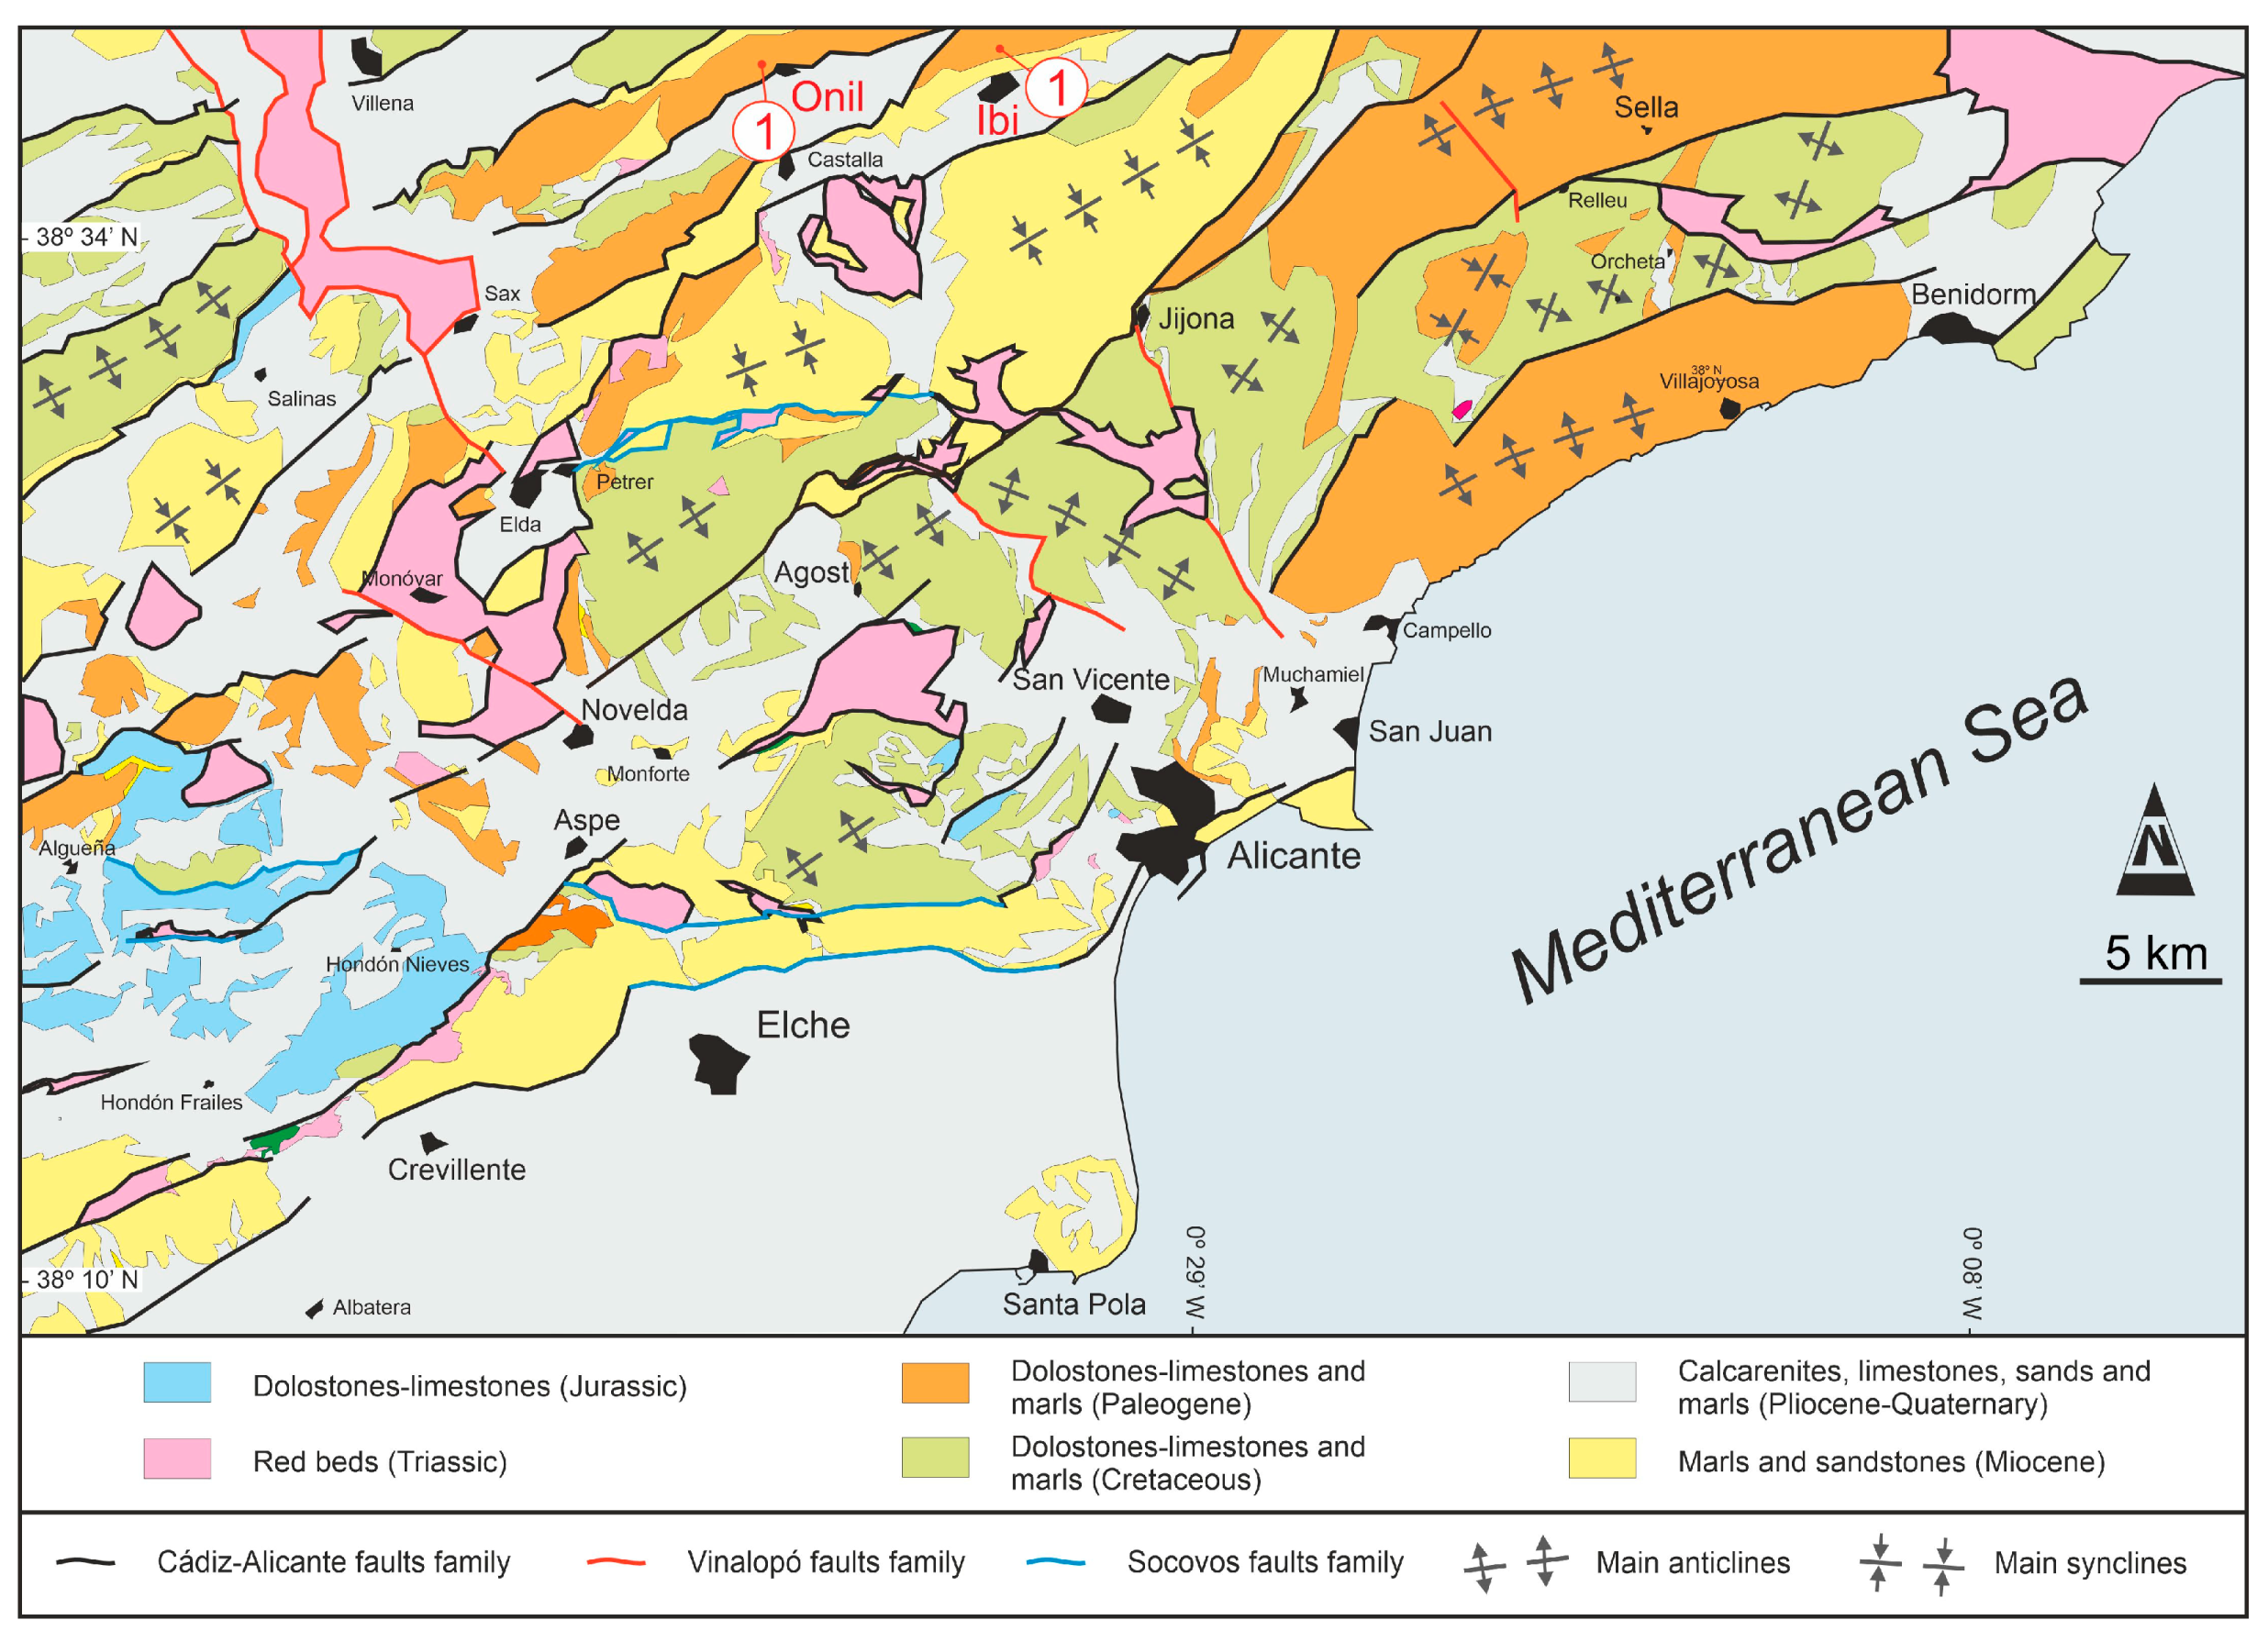
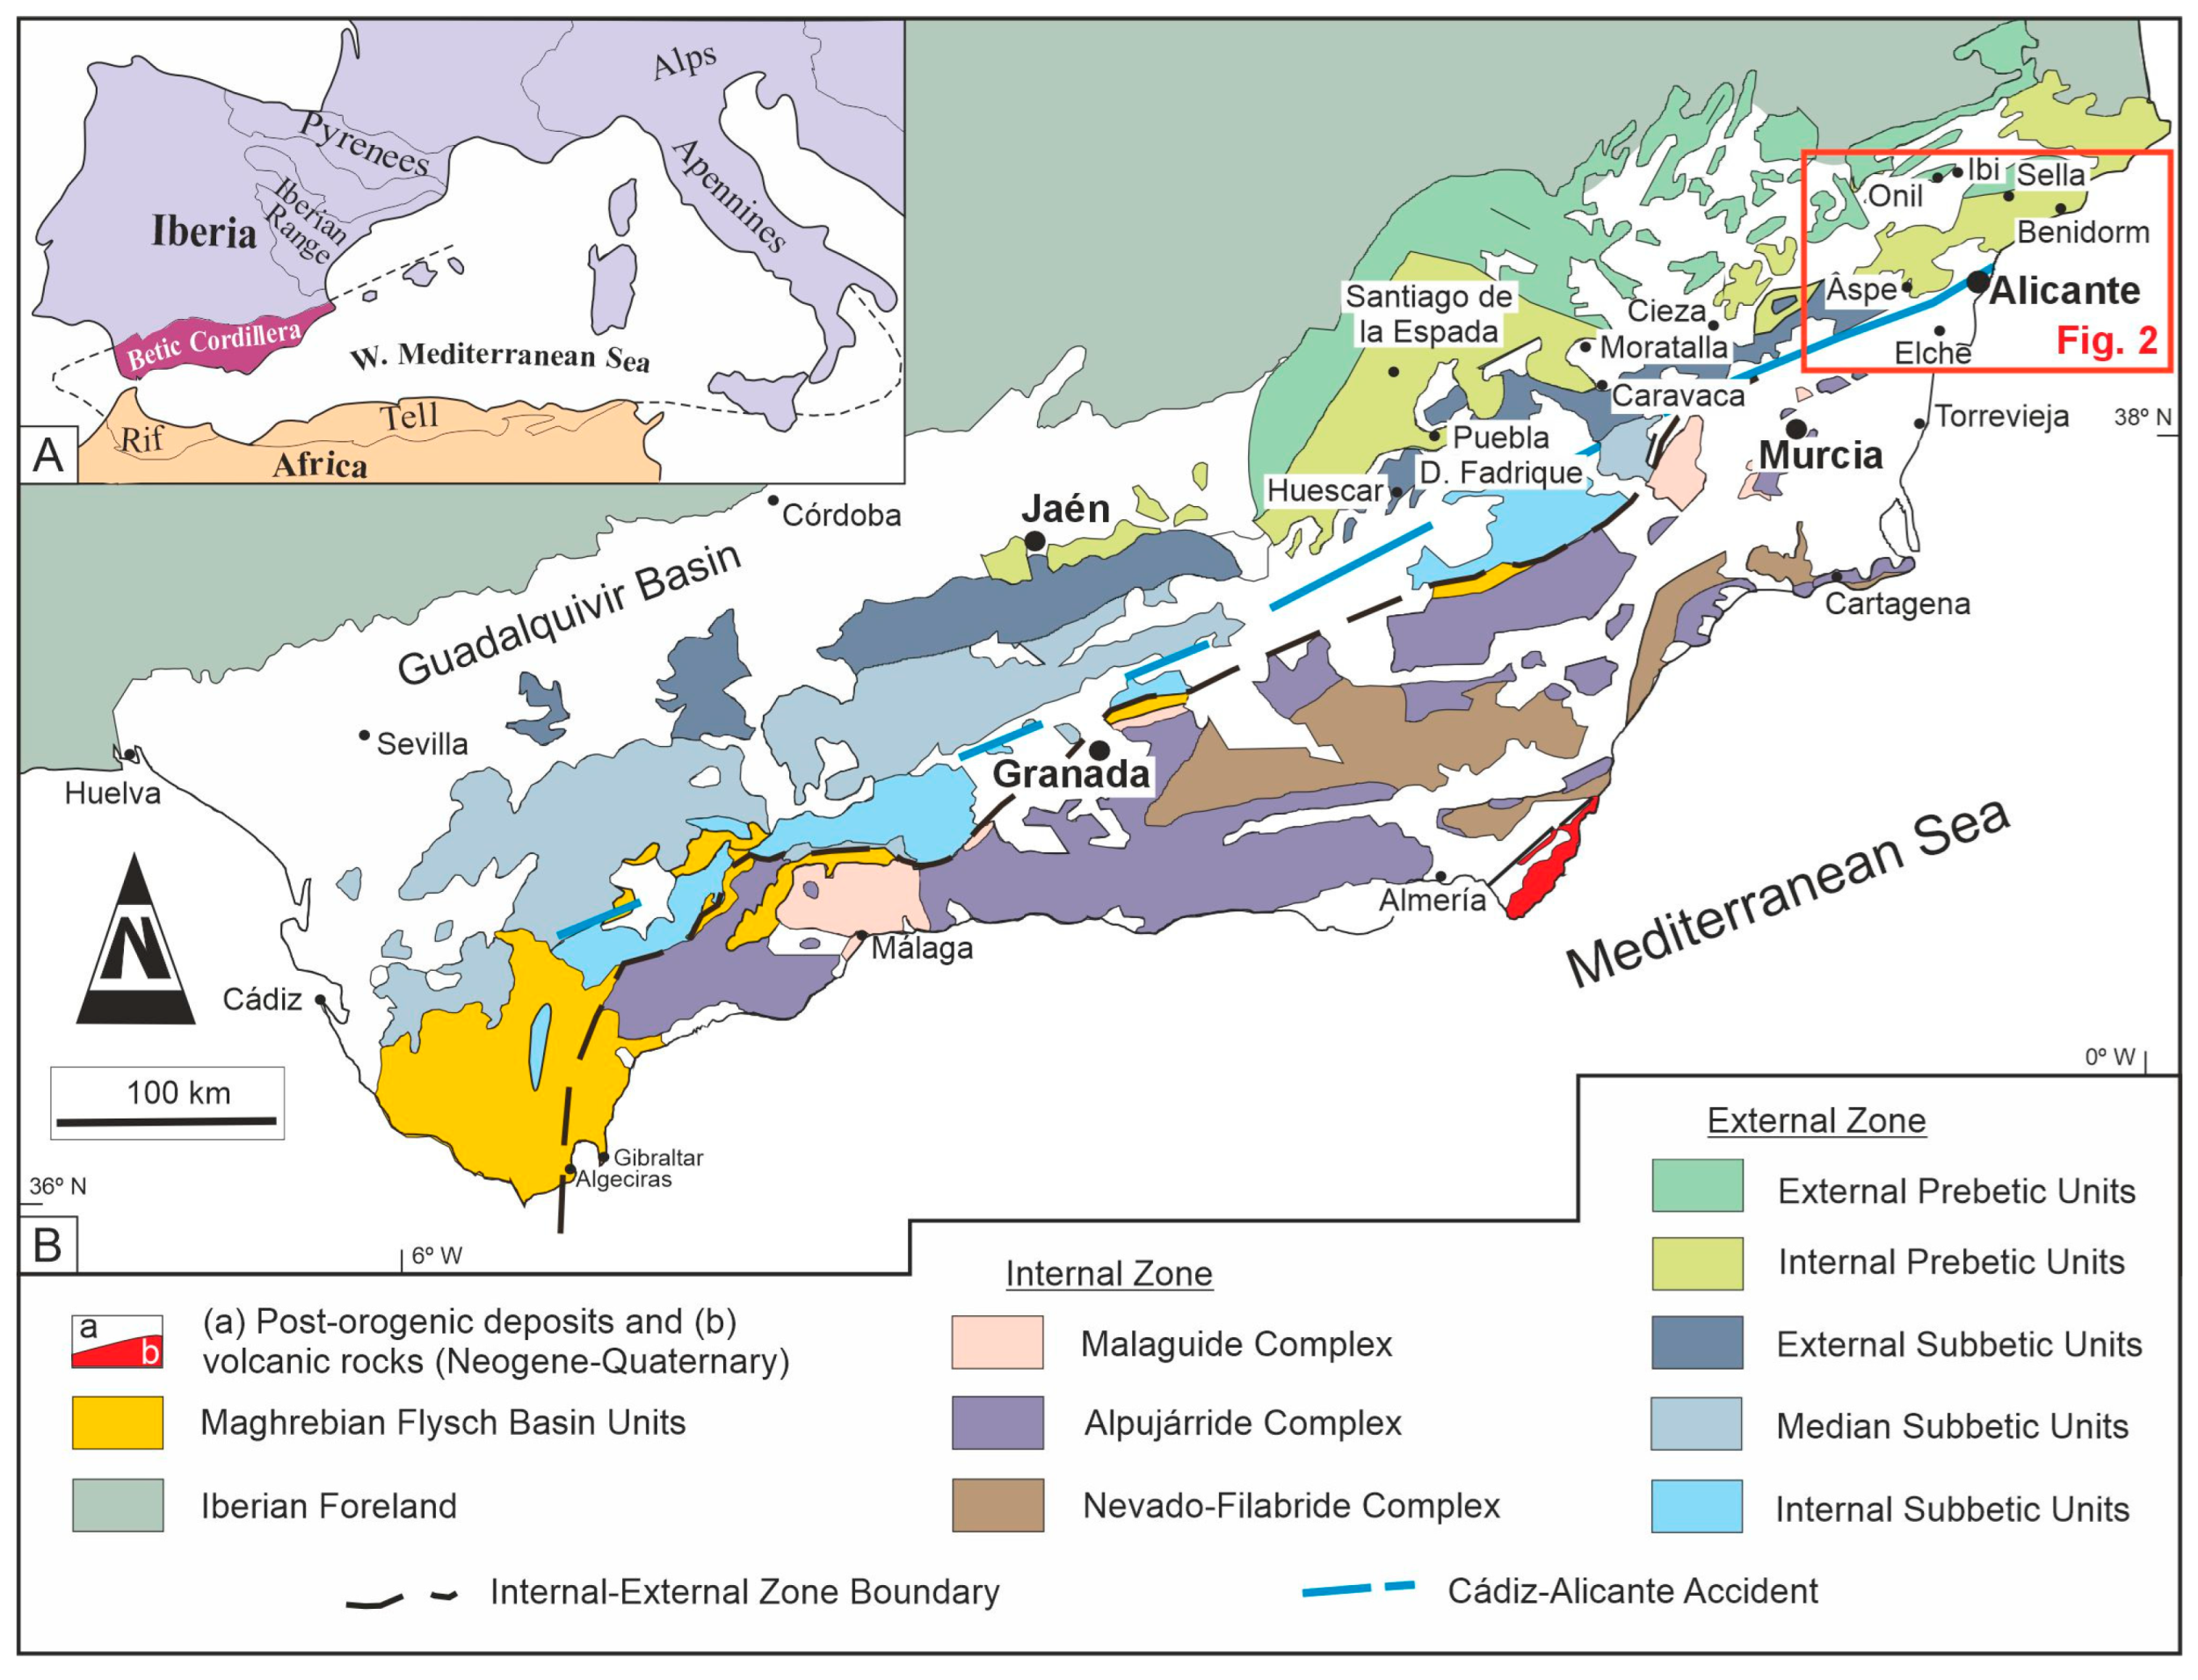
2. Geological Setting

The study area (Figure 1) is located in Alicante (SE Spain), within the western Mediterranean Alpine orogenic system [27,28]. The Betic Cordillera (Figure 1A) comprises three major preorogenic units: (1) the Internal Zone, (2) the External Zone (the focus of this study), and (3) minor associated units (Figure 1B). The External Zone, derived from the South Iberian Margin, consists of two principal paleogeographic domains: (i) the Prebetic Domain, consisting of shallow marine autochthonous to para-autochthonous successions unconformably overlying the Iberian Meseta foreland (subdivided into the shallower External Prebetic and the relatively deeper Internal Prebetic), and (ii) the Subbetic Domain, consisting of allochthonous pelagic sequences thrust over the Prebetic (subdivided into the shallow External Subbetic, the deep Medium Subbetic, and the shallow Internal Subbetic).
The Triassic–Cenozoic sedimentary successions in these domains were progressively structured into north-verging nappes during the Middle–Late Miocene [29,30]. The Prebetic domain is additionally affected by three major strike-slip fault families (Figure 2): Cadiz-Alicante Fault (N70E), Vinalopó Fault (N155E), and Socovos Fault (N90–120E). The Cadiz-Alicante Accident is a main alignment of N70E-oriented faults from the Cádiz to Alicante towns. This accident functioned from the Middle Miocene onwards, with a dextral regimen allowing the westward kinematic of the Internal Zone with respect to the External Zone. The Vinalopó and Socovos faults were defined in these localities. These fault families bound blocks of folded Cretaceous–Miocene strata and are associated with Cenozoic pull-apart basins, indicating Neogene activity [31,32,33]. Two dominant fold orientations occur within the fault-bounded blocks: N20E-trending folds (Middle Miocene, σ1 E–W) and N70E-trending folds (Late Miocene, σ1 NW–SE). The current structural configuration results from transpressive deformation under a regional compressive regime, with the Eocene successions now preserved in variously rotated fault blocks. This structural framework postdates the deposition of the studied Eocene carbonate sequences.
The Paleogene deposits of the Alicante Prebetic have been extensively studied by multiple authors [32,33,34,35,36,37,38], revealing two distinct depositional environments: an outer shallow platform domain dominated by larger benthic foraminifera (LBF)-rich carbonates, and a more internal deeper domain characterized by mass flow deposits containing LBF components interbedded with hemipelagic sediments.
Figure 2. Geological map of the study area in the Alicante province (location shown in Figure 1B), showing the positions of the two analyzed sections with red circles and arrows: (1) Onil, (2) Ibi. Map modified from [32,33,36].
Jmse 13 01031 g002
Recent work [38] has established a regional lithostratigraphic framework for the Paleocene–Eocene succession, identifying three informal units that extend over 200 km from Alicante through Murcia to Granada.
This tripartite division consists of (1) a lower clayey–marly unit representing the outer platform to upper slope environments, (2) an intermediate limestone–calcarenite unit deposited in shallow platform conditions, and (3) an upper clayey–marly unit returning to deeper outer platform/upper slope settings. These units show lateral facies transitions across the region and are biostratigraphically constrained to the upper Paleocene through to the upper Eocene, with their bounding surfaces displaying significant diachrony. The vertical succession from deeper marine deposits to carbonate platform facies and back again reflects major regressive–transgressive evolution during the Paleogene, while the lateral variation between shallow LBF-rich platforms and deeper mass flow/hemipelagic deposits records the original paleogeographic gradient across the Prebetic domain. In the Alicante area, the Onil and Ibi sections (Figure 3B) predominantly expose the intermediate limestone–calcarenite formation, which displays well-developed cyclic sedimentation patterns [38,39].
The age of this carbonate unit has been constrained through biostratigraphic analysis of larger benthic foraminifera (LBF), with additional control provided by the bounding clayey formations dated by planktonic foraminifera. It should be noted that these age ranges differ from those observed in other sectors of the Prebetic, where the formation shows variable stratigraphic boundaries [38,39].

3. Materials and Methods

Fieldwork was conducted in two well-exposed sections of the External Prebetic in Alicante (Figure 3), where we measured and collected 51 representative samples. The carbonate facies classification was based on: (1) the dominant skeletal components (nummulitids, alveolines, rhodoliths, echinoids, miliolids, gastropods, and bivalves), (2) the presence of terrigenous material, and (3) diagenetic overprints (dolomitization and karstification). Terrigenous facies were also documented where present. Special attention was given to bounding surfaces and unit thickness measurements to establish stratigraphic relationships. The excellent exposure conditions, with minimal vegetation cover, enabled detailed stratigraphic mapping using high-resolution aerial imagery acquired through UAV surveys (DJI Mavic 3 Enterprise and DJI Air 2S manufactured by SZ DJI Technology Co., Ltd, Shenzhen, China; see Table 1 for flight parameters). These photogrammetric data were processed to generate accurate 3D models of both study areas, significantly enhancing our ability to analyze lateral and vertical facies variations at multiple scales.
The age determination of the studied sections was primarily conducted through biostratigraphic analysis of larger benthic foraminifera (LBF), focusing on both loose samples containing nummulitids and consolidated samples with alveolines (Figure 3). The taxonomic study followed established systematic frameworks in the relevant literature for nummulitids [40,41] and for alveolinids and rotaliids (analyzed in thin sections) [42,43,44,45]. In limited cases, where marly intervals were present and could be sampled, additional age constraints were obtained through planktonic foraminifera analysis [46,47,48]. This multi-proxy approach, combining both benthic and planktonic foraminiferal biostratigraphy, provides more robust age control for the studied successions.
Microfacies analysis was performed on 41 representative samples covering the majority of identified field facies. Standard petrographic thin sections (2.0 × 3.0 cm) were prepared and analyzed using a Nikon Eclipse E202 polarizing microscope equipped with a Nikon DS-Fi2 digital camera system. The imaging workflow included digital capture using Nikon’s Digital Sight DS-U3 controller, image processing with Nikon NIS Elements F4 software, and systematic description following the usual methodological framework [49,50]. The integrated analysis of LBF taxonomy and microfacies characteristics provided critical data for precise biostratigraphic age determination, the reconstruction of paleoenvironmental conditions, and the interpretation of depositional settings. This approach allowed for comprehensive palaeoecological interpretation while maintaining consistency with established carbonate petrology standards.
The main fieldwork for determining lithofacies, sequence boundaries, and macroscopically visible fossils was conducted during the logging of the two stratigraphic series. However, drone flights were carried out to obtain images for observing inaccessible areas and expanding lateral visibility. Digital outcrop modeling (DOM) was performed using drone-acquired photos processed with Agisoft Metashape software [51] through structure-from-motion (SfM) photogrammetry. This method generates high-resolution 3D representations of outcrops as triangulated surfaces or point clouds [52,53]. Although these images enhance the lateral perspective, in some cases, certain areas remain obscured due to vegetation or extremely steep cliff faces. The workflow included (1) photo-alignment and dense cloud reconstruction at full resolution using scale invariant feature transform and multi-view stereo algorithms [54] and (2) georeferencing with onboard GNSS data for high relative accuracy [55,56,57]. The resulting 3D models provided virtual access to inaccessible outcrop features and bed geometries, with selected captures processed for detailed analysis [53,58].
Sequence stratigraphic analysis combined field logs with drone-derived stratal geometry. Vertical facies changes and thickness variations were analyzed in outcrops, while drone imagery assessed lateral continuity. We identified high-frequency sequences (HFSs) as m-thick cycles bounded by unconformities [7,8,9]. Here, unconformities represent sedimentological relevant hiatuses, regardless of biostratigraphic detectability [8,9]. HFSs stack into lower-frequency sequences (LFS) demarcated by more significant unconformities, as evidenced by (1) karstification/dolomitization, (2) angular discordances, or (3) sharp bed contacts. Where vertical logging was limited, 3D models and microfacies data clarified LFS architectures. Cycle stacking patterns were interpreted through microfacies-derived sediment supply analysis and are crucial for understanding carbonate system responses to accommodation changes. The results were correlated with global eustatic and climatic curves [24,25,26,59] and regional tectonic frameworks [36,38,39,60].

4. Results

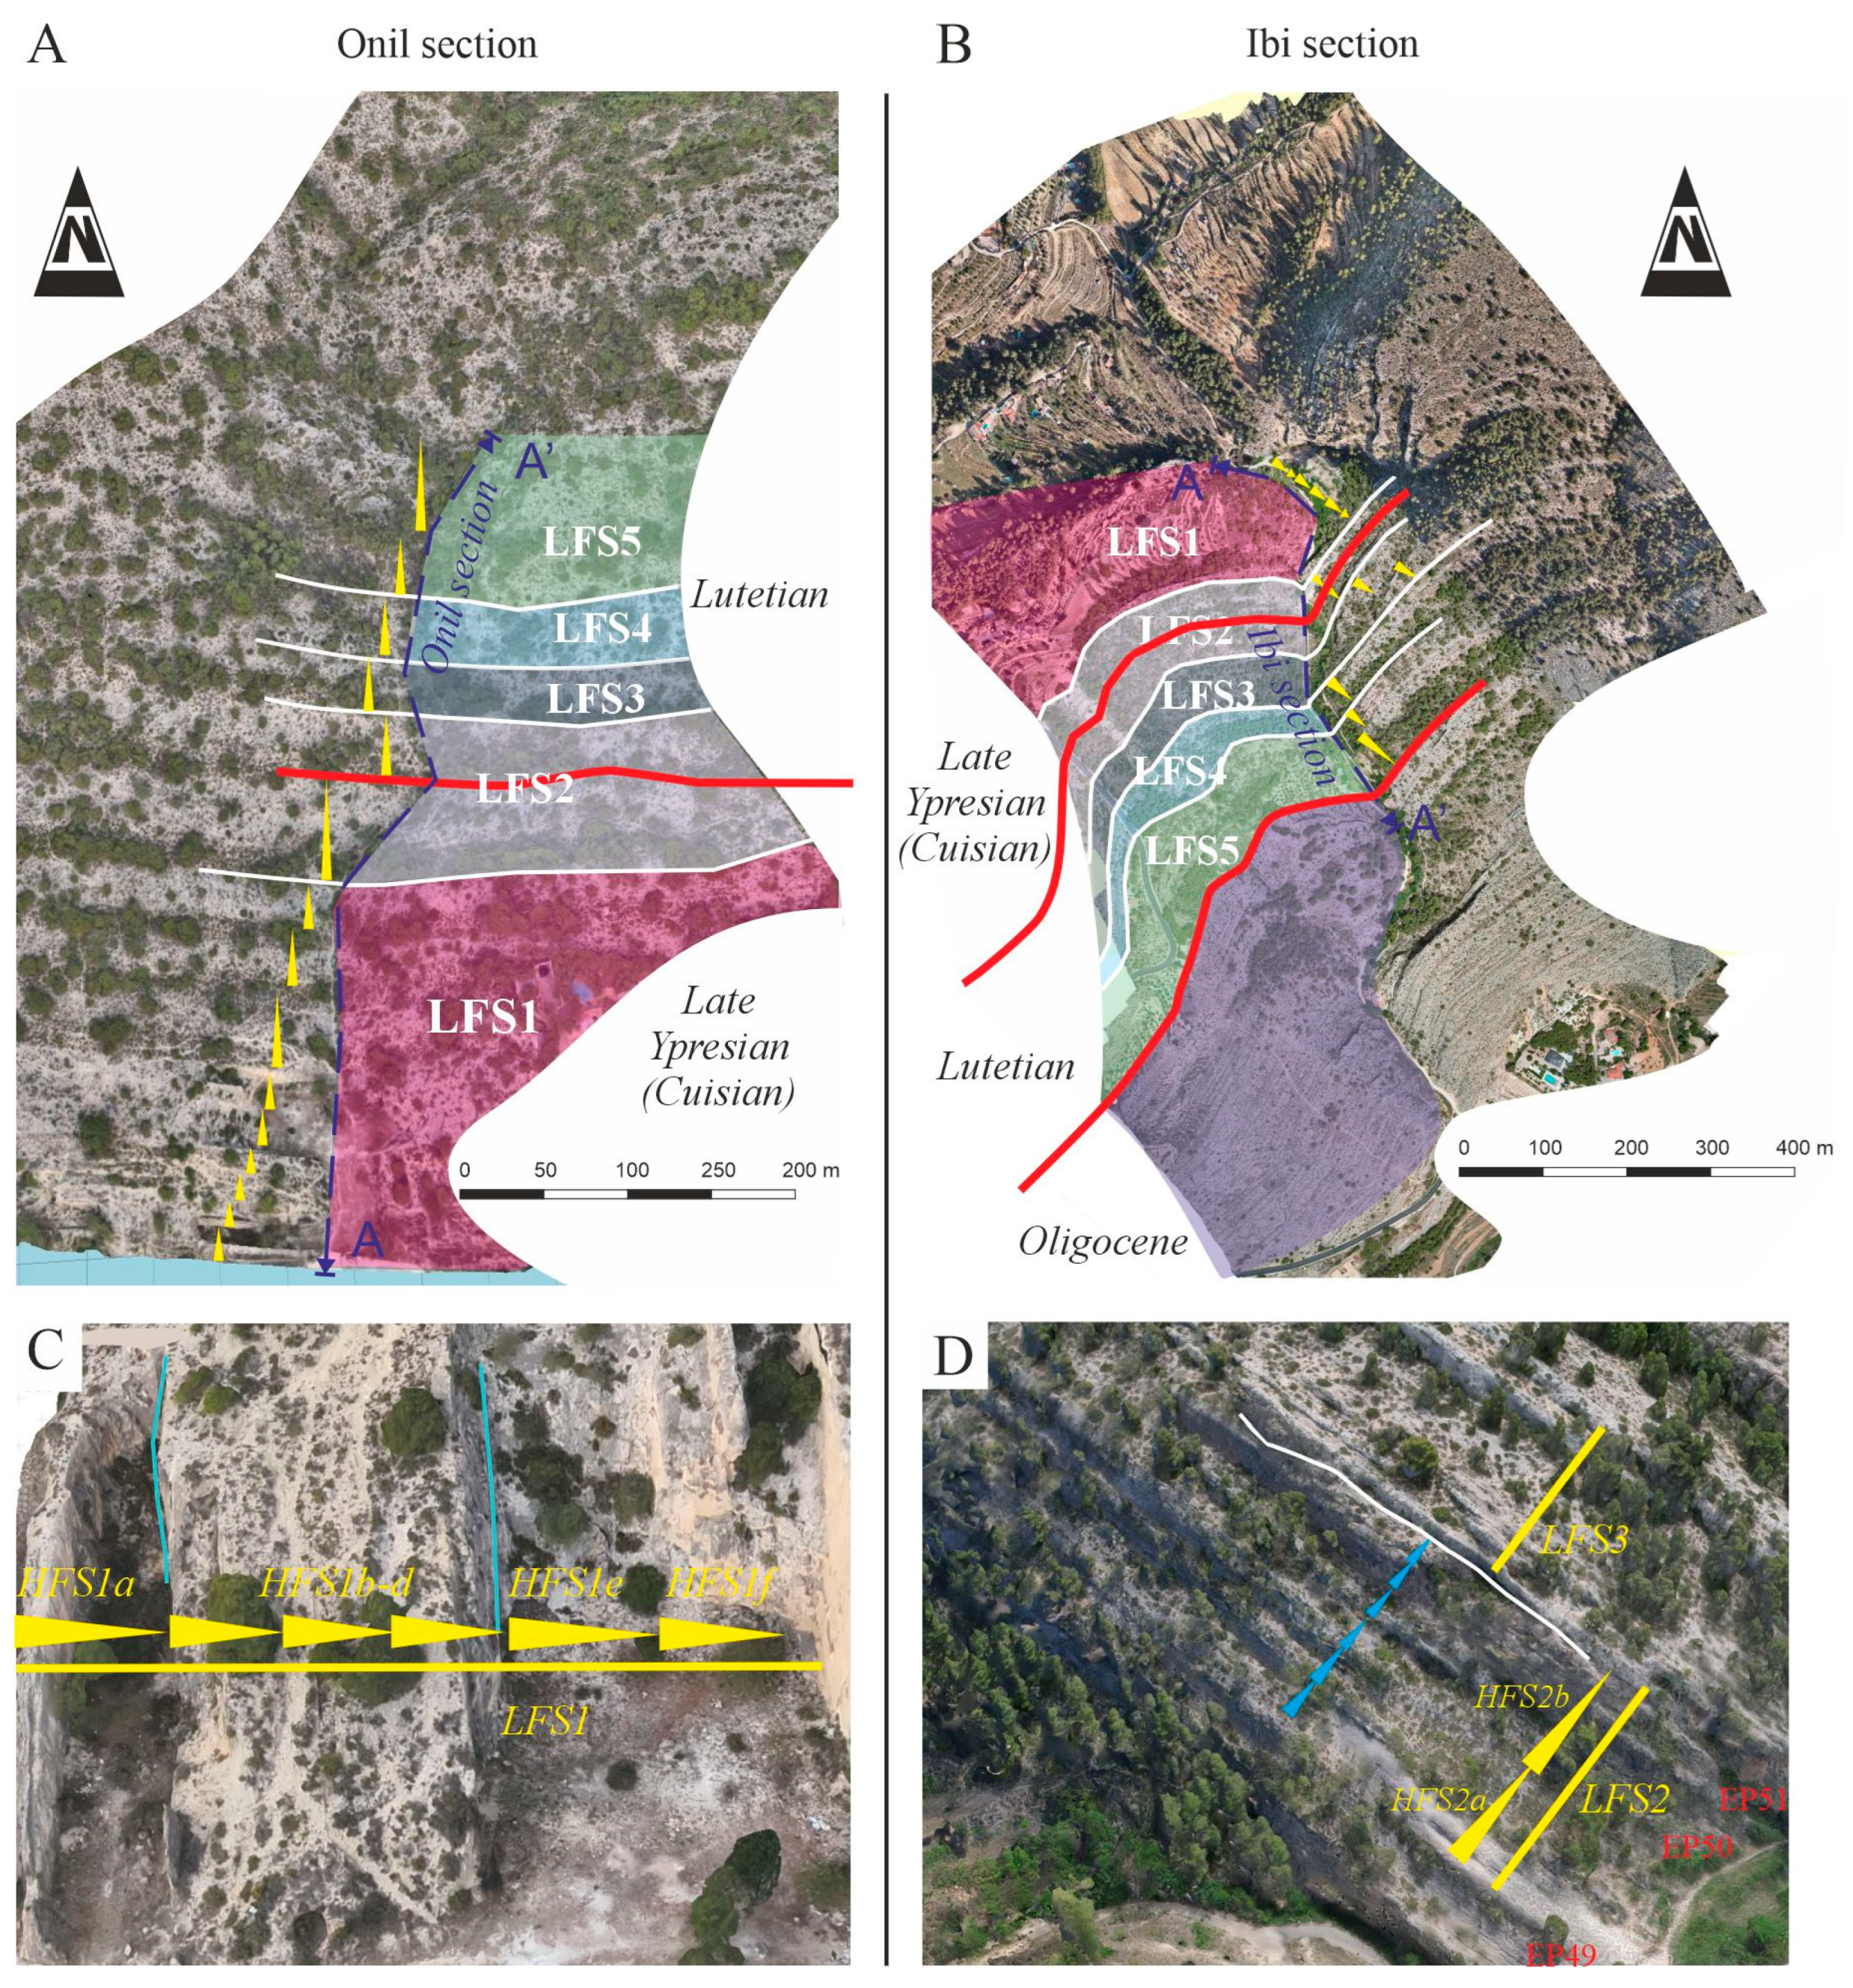
4.1. Lithofacies Analysis

Two Eocene carbonate sections (Onil and Ibi; Figure 3) were measured and sampled in the External Prebetic (Alicante), primarily within the intermediate limestone–calcarenite formation [38]. Seven sedimentary lithofacies were defined during the fieldwork (Table 2, Figure 3).

4.2. Biostratigraphic Data and Biochronologic Correlation

The nummulitid assemblages (Figure 4) identified in the uncemented intervals of both sections enabled the recognition of several Shallow Benthic Zones (SBZs).
In the Onil section, the interval EP111–124 was assigned to SBZ11–12 from the late Early Eocene (late Ypresian: middle–late Cuisian) based on the presence of Alveolina cremae, Nummulites cantabricus, Assilina placentula, As. marinellii, and Cuvillerina vallensis in the lower part, transitioning to the next interval containing Al. cf. violae, N. cf. campesinus, and As. aff. maior in the upper part. Sample EP115 yielded few planktonic foraminifera, including Acarinina bullbrooki, suggesting at least the E7 zone of the uppermost Ypresian. The overlying interval (EP125–130) corresponds to SBZ13 (early Lutetian), characterized by Al. elliptica nuttallii, N. aff. maior, and As. praespira.
In the Ibi section, EP40, sampled from a marly interval at the bottom, contains a planktonic foraminifera assemblage with Acarinina soldadoensis, A. angulosa, A. pseudotopilensis, Morozovella lensiformis, Igorina broedermanni, Subbotina linaperta, and Parasubbotina inaequispira of Ypresian age (probably the E5 zone). The EP41–49 interval was attributed to SBZ11–12 from the late Early Eocene (late Ypresian: middle–late Cuisian) due to the occurrence of Nummulites cantabricus-campesinus, N. distans, N. praediscorbinus, As. aff. cuvillieri, As. marinellii, Cuvillerina vallensis, and Gyroidinella levis. The upper Eocene interval (EP50–60) was assigned to SBZ13 (early Lutetian) based on the presence of Alveolina stipes, Al. elliptica nuttalli, Al. kieli, N. lehneri, N. praelorioli, N. migiurtinus, Assilina suteri, As. praespira, Fabiania cassis, Rotalia trochidiformis, Neorotalia litothamnica, and Gyroidinella magna. The possibility remains that SBZ14 could be reached in the uppermost part (EP55–60) by the presence of Sphaerogypsina globulus and Korobkovella grosserugosa. The abrupt transition to Rupelian deposits (EP61 upward; Figure 3) reveals a main unconformity, representing a major stratigraphic gap spanning the early Lutetian to Rupelian. Additional biozones were established using planktonic foraminifera, enabling a correlation between the two sections (Figure 3). The oldest deposits of the intermediate formation are exposed in the Ibi section, where the late Early Eocene (late Ypresian: SBZ11–12 from the middle–late Cuisian) succession is less than half as thick (~45 m) of its equivalent in the Onil section (104 m). In contrast, the Lutetian (SBZ13) deposits show comparable thicknesses in both sections (Ibi: 138 m; Onil: 145 m). The Ibi section preserves Rupelian deposits unconformably overlying the Eocene succession, while the uppermost interval in the Onil section is either heavily weathered or poorly exposed and could not be dated (Figure 3).

4.3. Microfacies Analysis and the Depositional Environment

Five microfacies (Mf1–Mf5) were identified in the studied Eocene sections based on fossil content, texture, and fabric (Table 2, Figure 4). The predominance of larger benthic foraminifera (LBF), along with dasycladale algae and coralline genera (Sporolithon and Lithoporella), indicates deposition in warm, low-latitude waters [61,62,63,64]. Paleoenvironments were interpreted using a ramp model [17] with terminology from Burchette and Wright [65], Pomar [66], and Pomar et al. [67]: Mf1–Mf2 represent inner ramp settings, Mf3 characterizes the inner–mid-ramp transition, and Mf4–Mf5 reflect mid-ramp environments.

5. Discussion

5.1. Carbonate Factory and Accommodation Controls

Carbonate factories, as defined by Schlager [19,20,21] and Reijmer [18,22,23], include T-factory (T for tropical or top water), CWC-factory (CWC for cold water coral), C-factory (C for cool water or controlled precipitation), M-factory (M for microbial, micrite, or mud-mound), and P-factory (P for pelagic, including all that is settled through the water column). According to these authors, each factory is characterized by distinct depositional geometries, carbonate precipitation styles (abiotic or biotically induced/controlled), and sedimentation patterns (spread, frame, move, stick, and production, respectively). The Eocene platforms approached in this work do not align precisely with any established factory model, except partially with the photo-C factory [68]. The deposits formed in warm-water and oligo-meso-eutrophic conditions, being dominated by larger benthic foraminifera (LBF), rhodophyceae (warm-temperate affinity), and seagrass-derived biota, as shown in [69,70].
There are some key distinctions from existing carbonate factories. For instance, the T-factory is excluded since Zooxanthellate corals are rare/non-reef-building. There is also a disparity with the C-factory since, although reworked elements suggest a “move” sedimentation pattern (C-factory-like), the warm-water setting inferred for the studied case contradicts the model. Reijmer [18] noted a T-to-C transition near 30° latitude for warm-temperate red algal platforms but did not define it as a standalone factory. At the same time, the C-factory thrives in settings with sufficient nutrients and cool water, which was not the case here. Given the unique LBF-rhodophyceae dominance in warm-temperate systems, we cautiously propose a TC-factory (temperate carbonate factory) as a distinct category, which will be confirmed or disproved by further studies. The studied sections exhibit monotonous sedimentation with rhythmic repetitions of mainly two–three-field facies over approximately 8 Myr. This observation, along with the inferred siliciclastic-like (“move”) behavior of the carbonate factory [18], suggests that accommodation space (the available room for sediment accumulation) was the primary control on the platform architecture in the studied case. In turn, accommodation is mostly the result of tectonic and eustatic sea level changes. To evaluate the dominant controls in the study area, we analyze the cyclicality of the Onil and Ibi sections in detail in the following section.

5.2. Low- and High-Frequency Sequences: LFSs and HFSs

Detailed logging revealed cyclic alternations between L2 and L1 and L1 and L6 lithofacies organized in meter-scale packages (Figure 5 and Figure 6), although cycle recognition was occasionally limited by outcrop quality, accessibility, or covered intervals (vegetation, scree deposits, or anthropogenic features). Facies–microfacies relationships (Table 2) demonstrate that L2 lithofacies (limestone with nummulitids) predominantly correlates with Mf5 (mid-ramp), with minor Mf4 occurrences, while L1 lithofacies (Alveolina limestones) corresponds to inner-ramp to mid-ramp transitional settings (Mf3). These vertical lithofacies alternations reflect transgressive–regressive (TR) cycles or deepening–shallowing trends (e.g., EP46–EP47 showing Mf4–Mf3 transitions). Notably, lithofacies changes typically occur as gradual transitions rather than abrupt contacts. For instance, in the EP42–EP43 interval (<1 m thick), no distinct maximum regressive or flooding surfaces were observed despite microfacies shifting from Mf3 to Mf5. Two exceptional cases in the Onil section (at 75 m and 107 m) show abrupt L2–L7 transitions, marking significant deepening. Dolomitized limestones (L6) replacing primary facies (L1/L2/L4) in both sections often obscure the original textures, requiring microfacies analysis for proper interpretation (e.g., field-described L6 at EP130 was microscopically identified as an Mf1 inner-ramp facies). In the field, five decametric-scale sequences of lower-order cyclicity bounded by unconformities were recognized (Figure 5A,B).
Higher-order cyclicity was established through the integration of field observations of weathering patterns (L1 forming resistant ridges vs. L2 forming vegetated saddles) and drone-derived stratigraphic geometries (Figure 5C,D). The frequent L1/L6 transitions and occasional complete lithofacies removal in shallowing intervals suggest periodic subaerial exposure and erosion, potentially creating hiatuses in the stratigraphic record. This weathering overprint, while challenging for facies identification in the field, provides valuable evidence for intermittent emergence events within the overall ramp system evolution. In the Ibi section, the uppermost sequence (Figure 5B) is capped by a prominent unconformity that, in addition to its strong morphologic expression in field, was biostratigraphically evidenced. It represents a significant hiatus spanning from the early Lutetian (SBZ13) to the Rupelian (SBZ21).
While other unconformities in the succession lack biostratigraphically resolvable gaps, they were identified through diagnostic features, including sharp facies transitions, angular discordances between beds (e.g., between LFS3 and LFS4), and contacts between vuggy/dolomitized and fresh limestones. Our analysis reveals a nested hierarchy of sequences, with higher-order ones comprising multiple smaller-scale transgressive–regressive cycles.
We use the informal terms high-frequency sequences (HFSs) for meter-scale cycles and lower-frequency sequences (LFSs) for decameter-scale packages to describe this cyclicity. A representative example, LFS2 in the Ibi Section (approximately 40 m thick), demonstrates this framework well. It begins with a sharp contact between Alveolina limestone (L1) and limestone with nummulitids (L2) at its base, followed by a 5 m transgressive interval that grades upward into a 35 m regressive package, where L1 facies become dominant (Figure 5D). Microfacies analysis documents a corresponding environmental shift from mid-ramp (Mf4–5) to inner-ramp (Mf2) settings. The value of multi-scale observation is particularly evident in LFS2. While field logging initially identified two HFSs (each ~20 m thick), subsequent drone imagery revealed six finer-scale cycles (several meters thick) through enhanced lateral resolution (Figure 5D). All sequences, regardless of scale, exhibit consistent transgressive–regressive (TR) arrangements. Our analysis identified five transgressive–regressive (TR) lower-frequency sequences (LFSs) in both study sections, each composed of nested TR high-frequency sequences (HFSs). In the basal sequence (LFS1), nine HFSs are exposed (Figure 5A) in the Onil section, and six HFSs are exposed in the Ibi section (Figure 5B).
Some LFSs (e.g., LFS3 in Onil or LFS4 in Onil and Ibi) appear incomplete, likely due to erosional truncation, exposure that obliterated the primary features of limestones, or limited exposure. The five LFSs belong to a higher-order sequence bounded by major unconformities. The lower one, although not exposed in the studied sections, is known throughout the Betic–Rif chain [28], where only platform deposits younger than late Early Eocene (Cuisian from the late Ypresian) are preserved. Recently, Tosquella et al. [39] have described vestiges of an older (Ilerdian) platform resedimented in slope deposits in the Aspe area (38 km southwest from Ibi and 34 km from Onil, respectively), which indicates that they existed, but were eroded during the development of the mentioned unconformity. The younger one, exposed only in the Ibi Section, was biostratigraphically proven in this paper, ranging from the middle Lutetian to the Rupelian (SBZ13–SBZ21). At the same time, during its development, tectonics must have been important, considering the big olistoliths of late Early Eocene (Cuisian from the late Ypresian) limestone (SBZ11) incorporated in the lower–middle Lutetian (E8–E10) mudstone of deeper water [39]. This unconformity was also recognized in the Murcia area [60].
The integrated interpretation incorporating field observations, drone-derived photogrammetry, and microfacies data has enabled us to develop a robust, correlated sequence stratigraphic framework for both study sections, as presented in Figure 6.

5.3. Correlation with Global Eocene Curves

As mentioned in the Introduction, in sequence stratigraphy, e.g., [9], sedimentary deposits used to be ranked in six hierarchical orders of cyclicity based on their temporal and spatial distributions. In the studied Eocene sedimentary successions, two orders of cyclicity have been identified: lower-frequency sequences (LFSs: longer cycles) and high-frequency sequences (HFSs: internal subdivisions of LFSs). Five LFSs (~8 Myr duration; Figure 6) were detected for the late Early Eocene (middle Cuisian from the late Ypresian) to early Middle Eocene (early Lutetian) period, with an average duration of ~2 Myr per LFS, corresponding with global third-order sequences. They belong to a higher-rank sequence bounded by biostratigraphically resolved unconformities.
The HFSs range from ~0.25 to ~1 Myr, consistent with global fourth-order sequences. In the literature, third-order sequences are typically linked to tectonic/climatic shifts, while fourth-order sequences may correlate with Milankovitch cycles (eccentricity and obliquity) [9,24,25,26]. However, overlaps between differently ranked sequences are common [9]. A comparison with global curves (sequential and sea-level curves) [26] is presented in Figure 7. This correlation reveals that the five LFSs approximately correspond to the upper two cycles of the Ypresian and the lower two cycles of the Lutetian (Figure 7). These cycles likely represent the late Early Eocene (middle Cuisian from the late Ypresian) to early Middle Eocene (early Lutetian) (~51–43 Myr). The correlation is more evident with the sequential curve than with the sea-level curve. In any case, some divergences from these cycles are noticeable. For instance, the LFS2–LFS3 boundary does not precisely coincide with the Ypresian (Cuisian)–Lutetian boundary but was developed latter (younger) during the lowermost Lutetian. The LFS4–LFS5 unconformity appears to have formed during the rise of sea levels.
In the case of the high-frequency sequences (HFSs), the recorded cycles are far fewer than those predicted by global Milankovitch cycles. Only LFS1 exhibits a higher number of HFSs, although these are still fewer than expected from those of Milankovitch. This discrepancy raises questions about the origin of accommodation for these high-frequency cycles and whether they truly correspond to orbital cycles. Given the shallow to very shallow depositional environment, the local, pulsatory tectonic activity may have been recorded on these platforms; however, further studies are necessary. Indeed, several studies on similar deposits in the area (or in laterally equivalent deeper sediments) have documented gravity flow deposits, including olistostromes and olistoliths, during the Early-Middle Eocene [34,36,39,60]. Alternatively, in shallow settings, accommodation space may be limited and condensed, as sea level lowstands lead to emersion, followed by dissolution, dolomitization, and erosion. In such cases, orbital-scale cycles (typically preserved in deeper, more continuous environments) might be missing from the record [39]. Finally, the interplay of all or part of the above-mentioned controls might account for the observed high- and low-frequency cyclicality. At present, all hypotheses remain viable, and further studies are needed to clarify these mechanisms.

6. Conclusions

The Eocene Onil and Ibi sections (Prebetic Zone, Betic Cordillera, Alicante province, SE Spain) were analyzed through detailed logging.
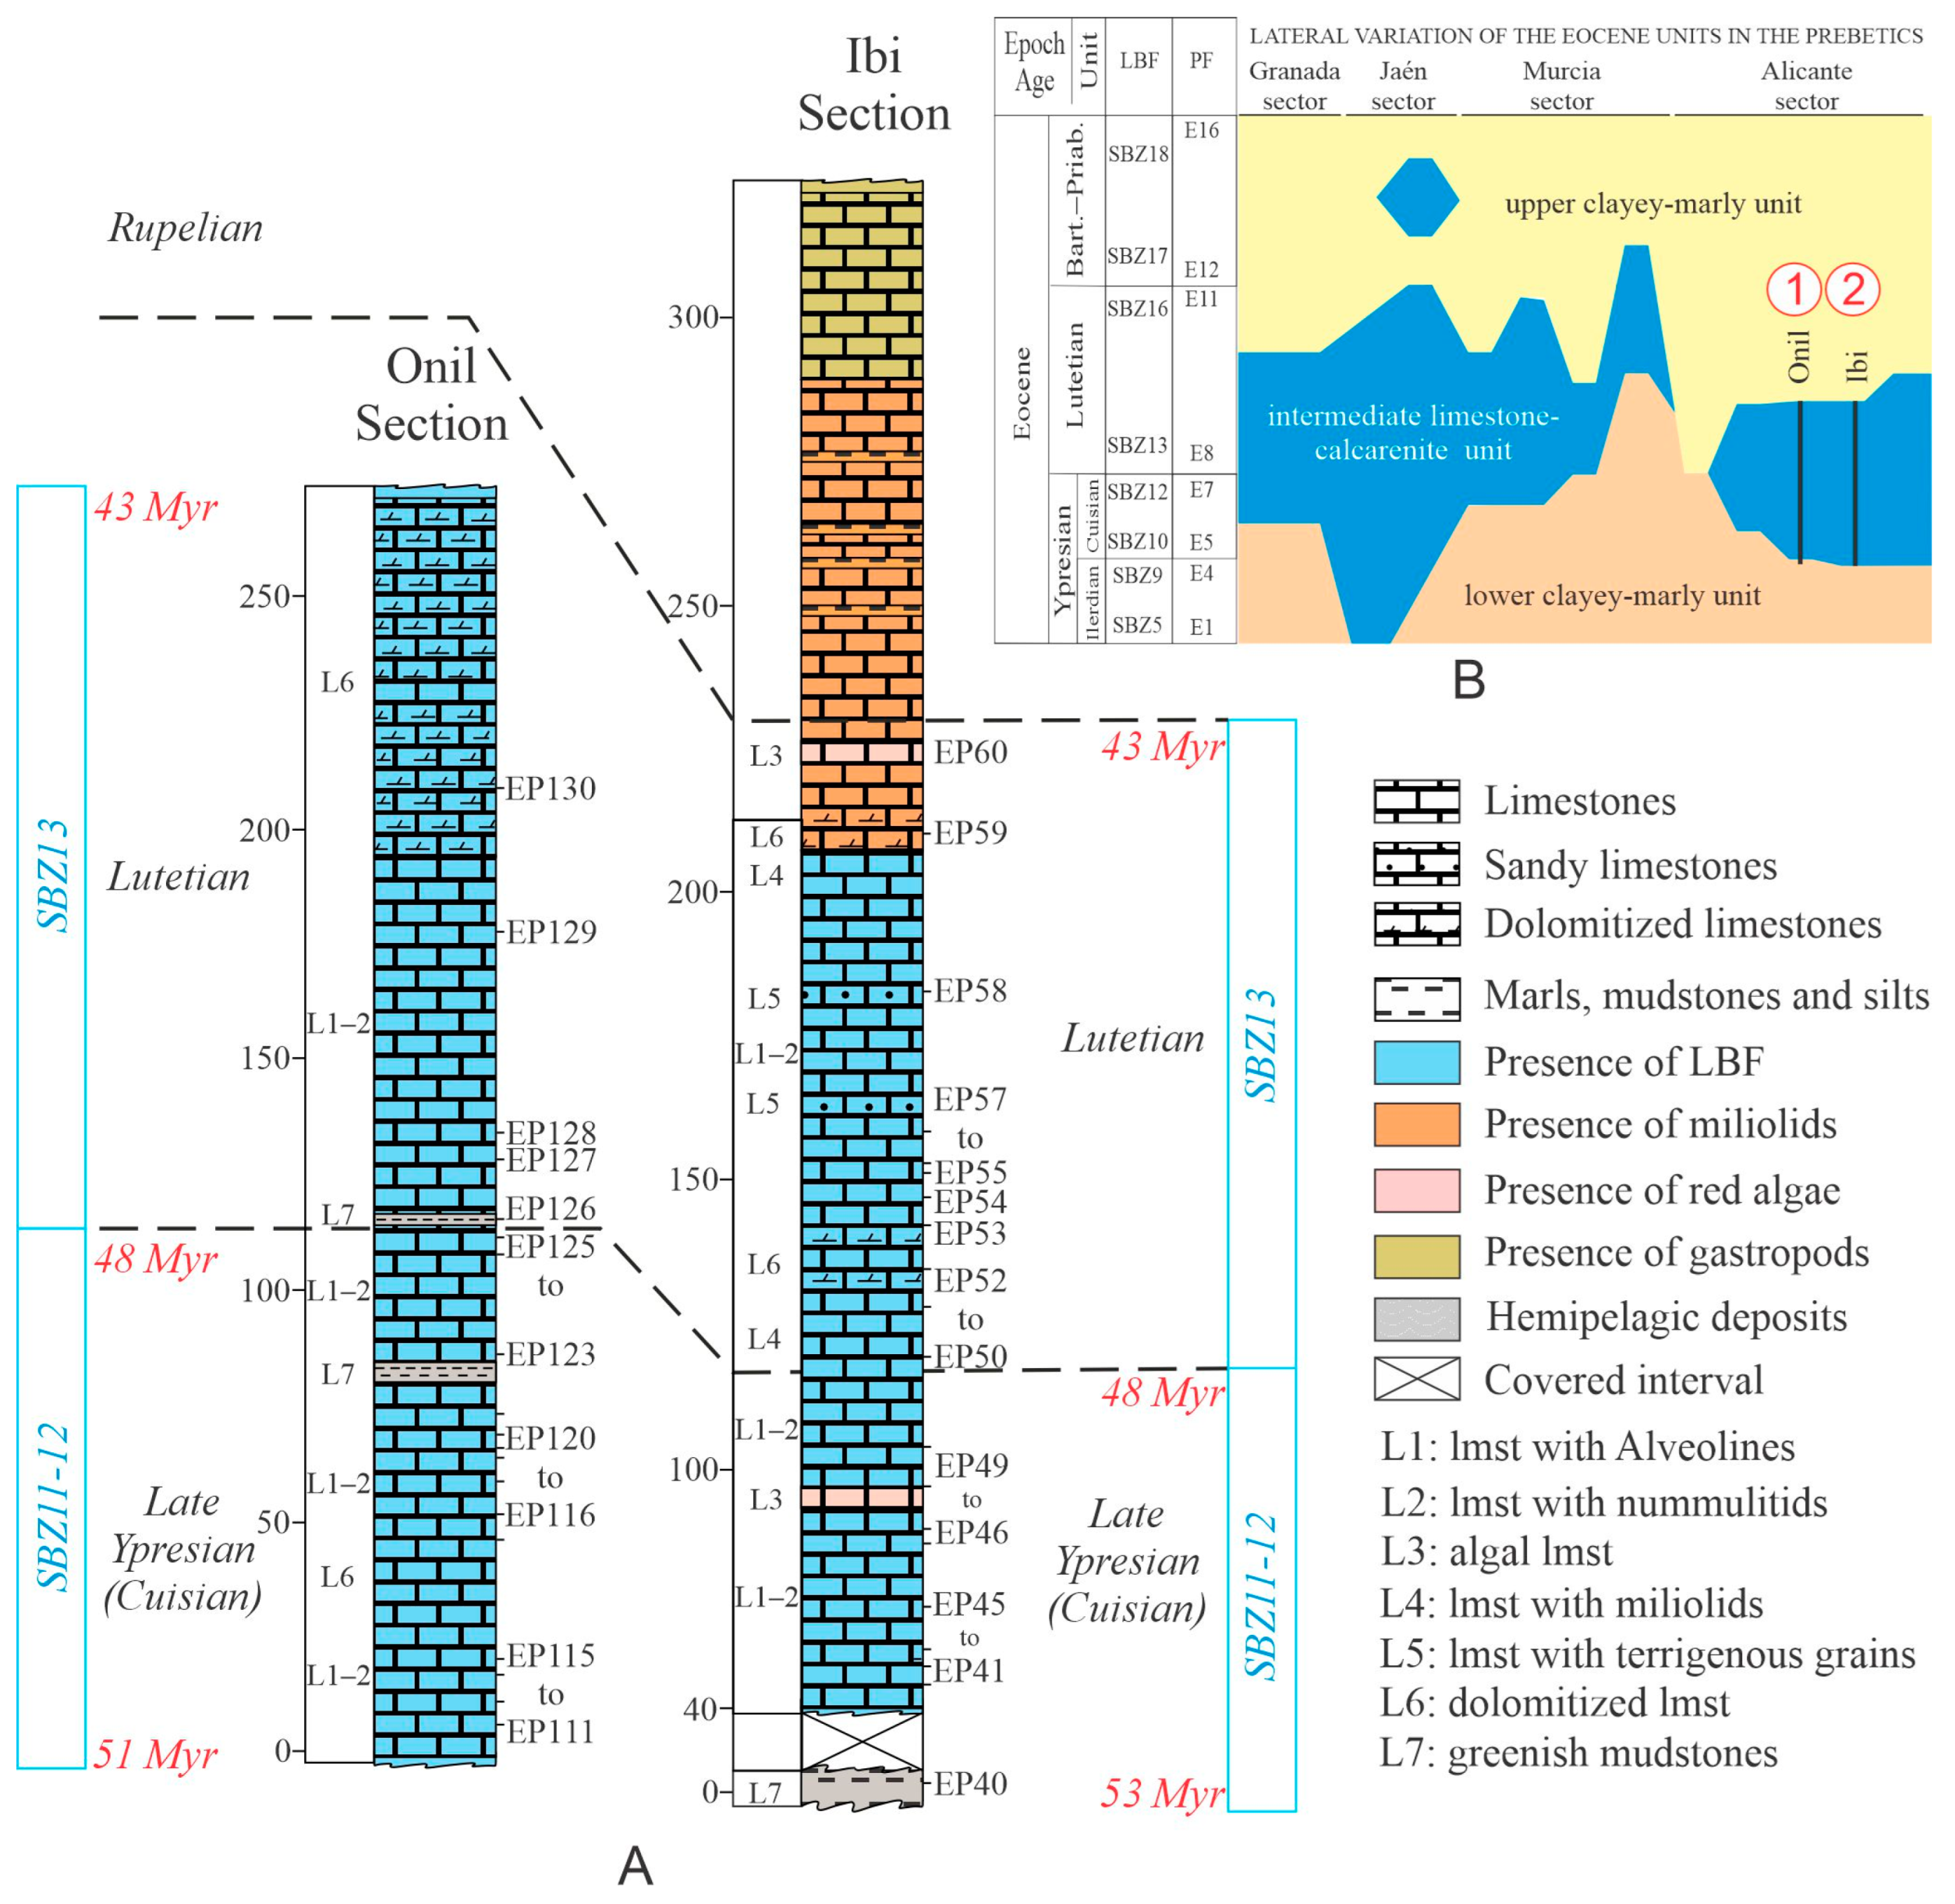
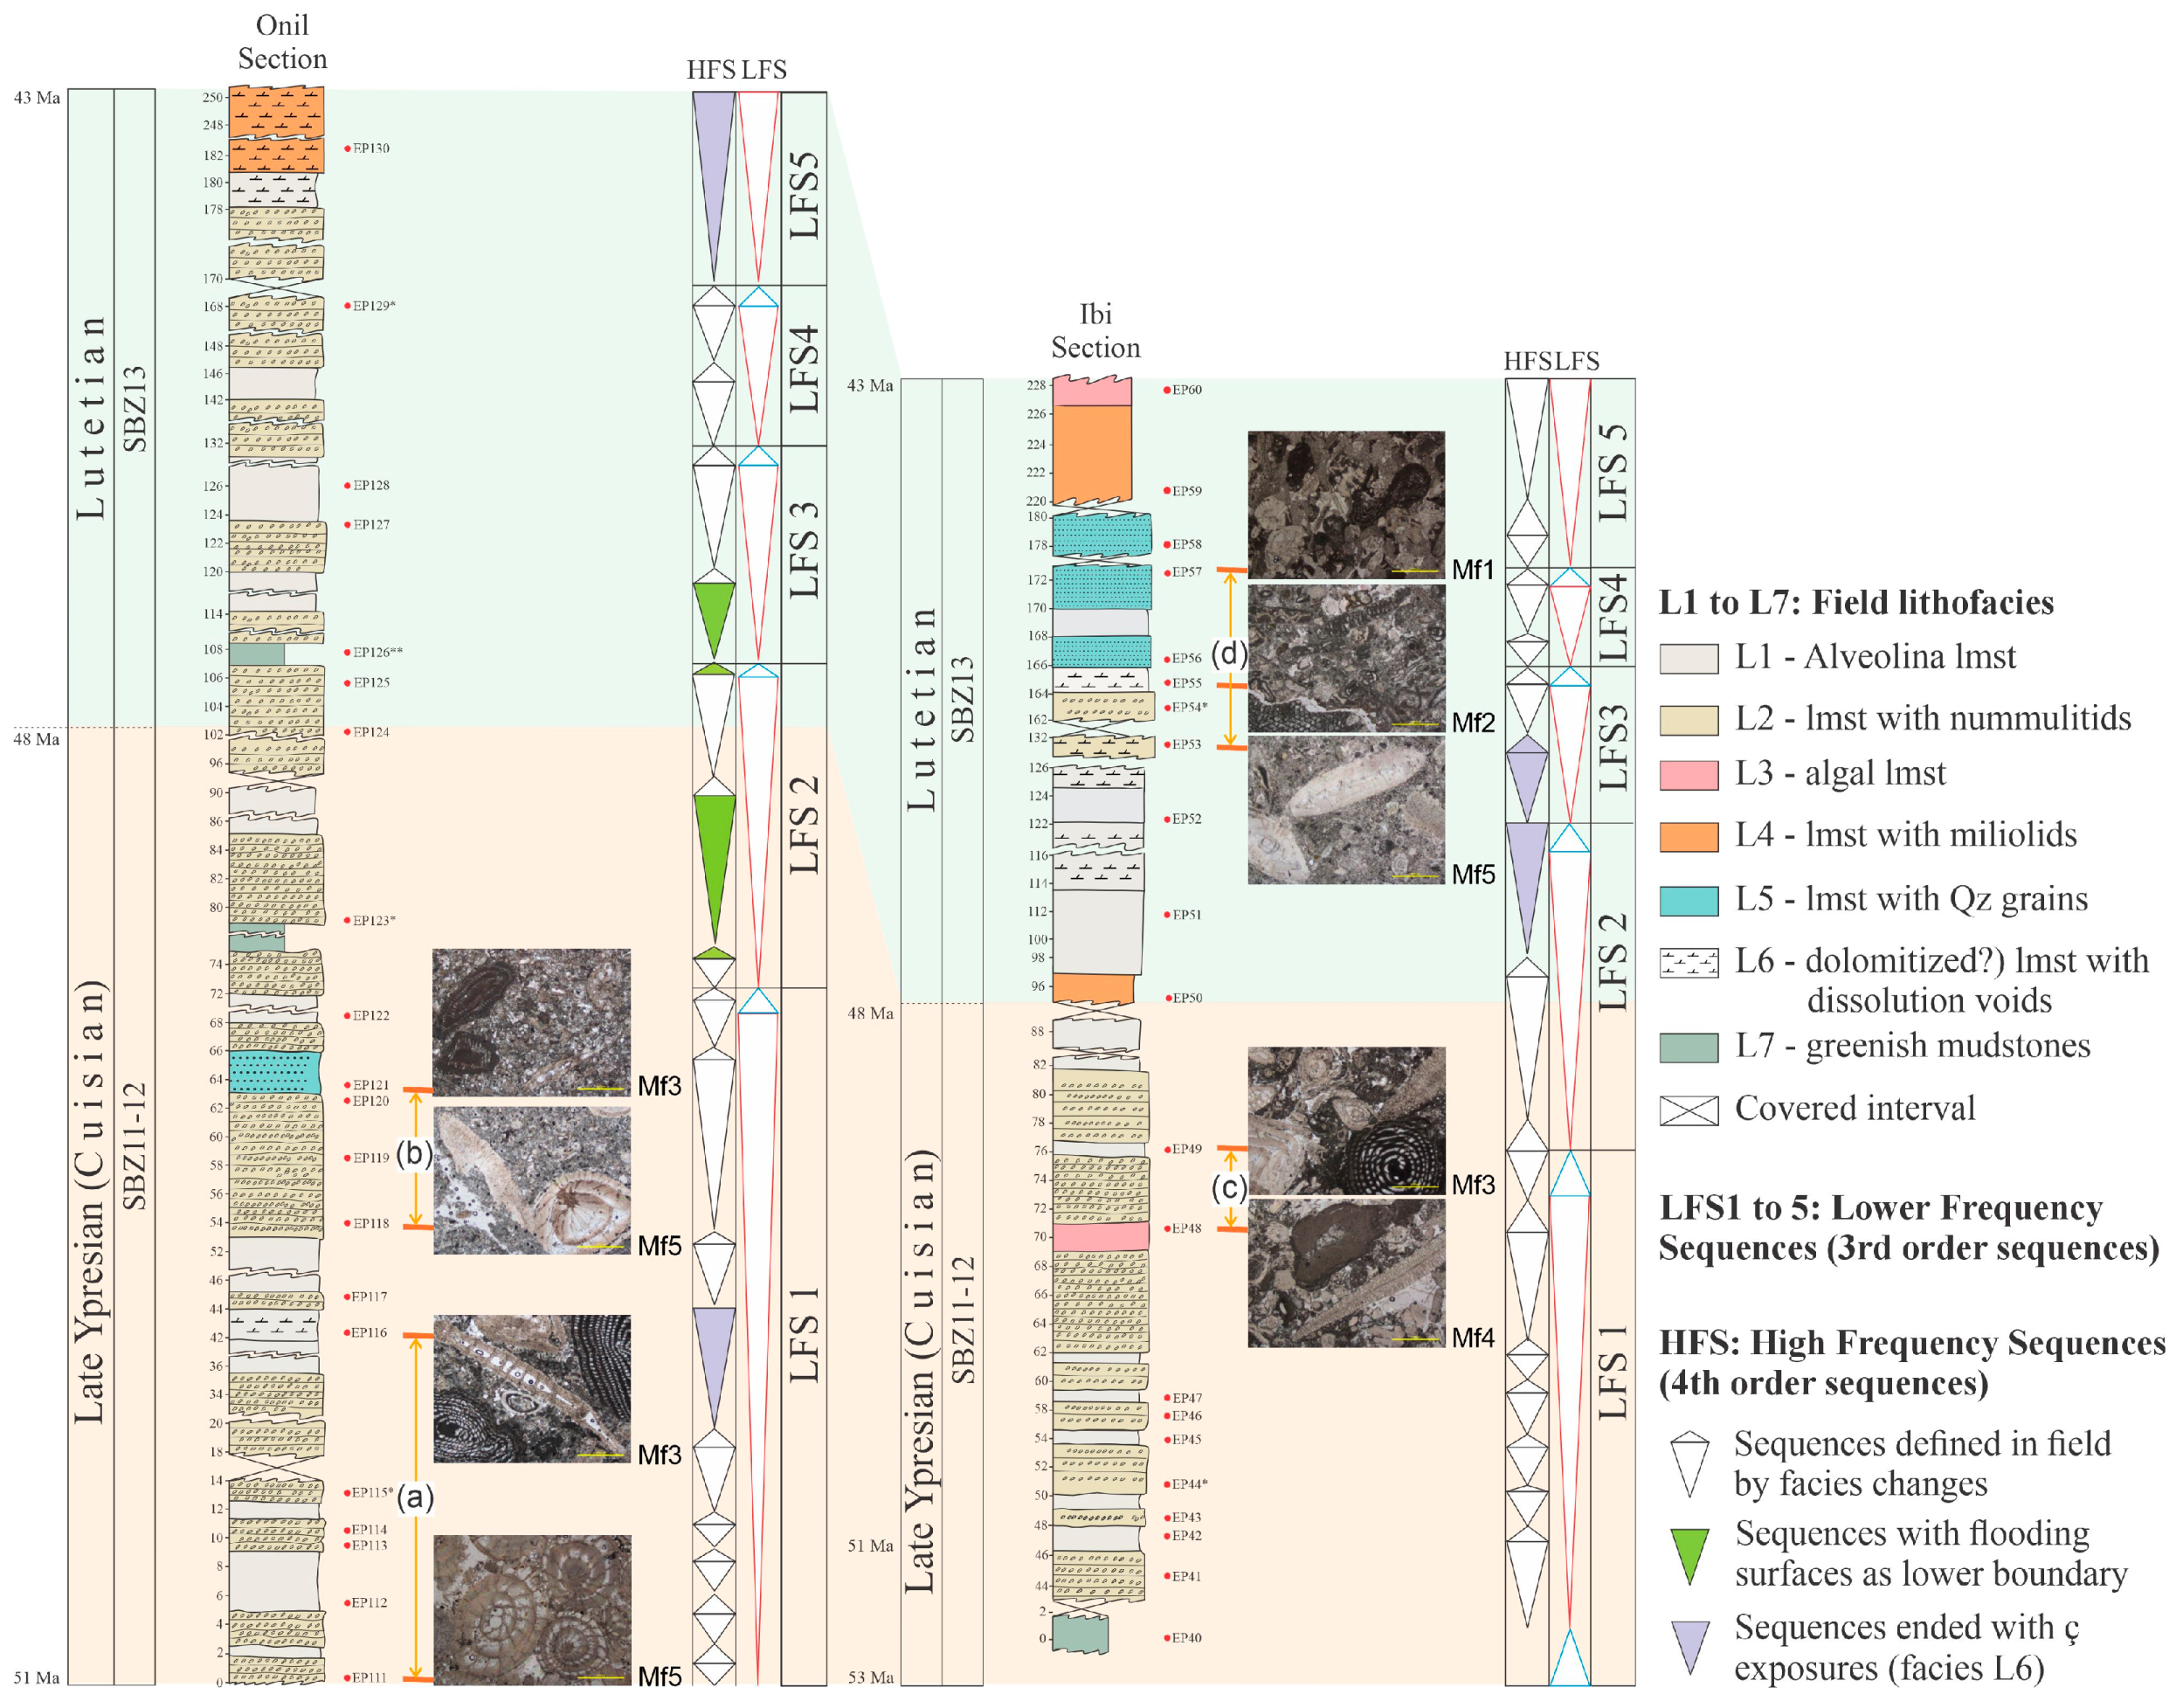
Seven lithofacies were identified: Alveolina limestone (L1), limestone with nummulitids (L2), algal limestone (L3), limestone with miliolids (L4), terrigenous limestone (L5), dolomitized limestone (L6), and greenish mudstone (L7).
Based on larger benthic foraminifera (LBF) and planktonic foraminifera, the sections were biostratigraphically dated as late Early Eocene (middle Cuisian from the late Ypresian) to early Middle Eocene (early Lutetian) (~51–43 Myr).
Five microfacies (Mf1–Mf5) were defined, indicating inner- to mid-ramp environments: shoal inner-ramp (Mf1), seagrass inner-ramp (Mf2), LBF accumulations in the inner- to mid-ramp transition (Mf3), Maërl mid-ramp (Mf4), and LBF accumulations in mid-ramp (Mf5).
The dominance of LBF, dasycladale algae, and crustose coralline algae suggests warm-water, low-latitude conditions.
The particular composition of these platforms (dominated by LBF in association with rhodophyceae but lacking coral reefs) leaded us to cautiously propose the recognition of a distinct warm-temperate carbonate factory, termed here as a TC-factory (temperate carbonate factory).
The integration of field data, drone imagery, and microfacies analysis revealed a framework of lower-frequency sequences (LFSs) composed of high-frequency sequences (HFSs), both representing transgressive–regressive (TR) cycles. Five LFSs were identified in both sections, each containing different numbers of HFSs. In turn, the LBSs belong to a higher-rank sequence bounded by regional unconformities.
LFSs (~2 Myr average duration) may correspond to third-order sequences (linked to tectonic/climatic shifts), while HFSs (~0.25 to ~1 Myr) correspond to fourth-order sequences (typically tied to Milankovitch cycles). However, both LFSs and HFSs reflect the various interplays of local and global controls that prevent the development of any supposed orderly cyclicity in real sedimentary basins, which led several authors to try to untie sequence stratigraphic analysis from spatial and temporal scales. Consequently, the five LFSs only broadly match the upper Ypresian and lower Lutetian cycles in global eustatic curves (~51–43 Myr), indicating that other controls (e.g., tectonics) were also important.
The number of HFSs is consistently lower than expected for orbital curves, raising some questions about their origin. Potential other controls include accommodation changes related to local pulsed tectonics, erosional truncation of cycles of orbital origin during sea level lowstands, accommodation generation by carbonate factories, or the interplay of all or part of the above processes.
Further studies are needed to be more specific on the origin of the deviation of studied cycles from global models and to document, in a formal way, the newly proposed factory for temperate carbonate platforms.

Author Contributions

Conceptualization, C.M., J.E.T.-M., J.T., and M.M.-M.; methodology, all authors; investigation, all authors; data curation, C.M., J.T., and M.M.-M.; writing—original draft preparation all authors; writing—review and editing, all authors; funding acquisition, M.M.-M. All authors have read and agreed to the published version of the manuscript.

Funding

This research was funded by the Spanish Ministry of Science and Innovation, research project number PID2020-114381GB-I00, and the Research Projects of the Generalitat Valenciana number GVA-THINKINAZUL/2021/039.

Data Availability Statement

Data will be available upon request.

Acknowledgments

The revision performed by three anonymous reviewers is greatly acknowledged.

Conflicts of Interest

The authors declare no conflicts of interest.

References

  1. Vail, P.R.; Mitchum, R.M., Jr.; Thompson, S. Seismic stratigraphy and global changes of sea level, Part 3: Relative changes of sea level from coastal onlap. In Seismic Stratigraphy—Applications to Hydrocarbon Exploration; Payton, C.E., Ed.; AAPG Memoir 26; AAPG: Tulsa, OK, USA, 1977; pp. 63–81. [Google Scholar]
  2. Vail, P.R.; Todd, R.G.; Sangree, J.B. Seismic stratigraphy and global changes of sea level, Part 5. Chronostratigraphic significance of Seismic Reflections: Section 2. Application of Seismic reflection configuration to stratigraphic interpretation. In Seismic Stratigraphy—Applications to Hydrocarbon Exploration; Payton, C.E., Ed.; AAPG Memoir 26; AAPG: Tulsa, OK, USA, 1977; pp. 99–116. [Google Scholar]
  3. Mitchum, R.M.; Vail, P.R.; Thompson, S.I.I.I. Seismic stratigraphy and global changes of sea level, Part 2: The depositional sequence as a basic unit for stratigraphic analysis. In Seismic Stratigraphy—Application to Hydrocarbon Exploration; Payton, C.E., Ed.; AAPG Memoir 26; AAPG: Tulsa, OK, USA, 1977; pp. 53–62. [Google Scholar]
  4. Van Wagoner, J.C.; Posamentier, H.W.; Mitchum, R.M.; Vail, P.R.; Sarg, T.S.; Loutit, T.S.; Hardenbol, J. On overview of the fundamentals of sequence stratigraphy and key definitions. In Sea-Level Changes: An Integrated Approach; Wilgus, C.K., Hartings, B.S., Posamentier, H., Van Wagoner, J., Ross, C.A., Kendall, C.G.S.C., Eds.; SEPM Special Publication: Claremore, OK, USA, 1988; Volume 42, pp. 40–45. [Google Scholar]
  5. Jervey, M.T. Quantitative geological modeling of siliciclastic rock sequences and their seismic expression. In Sea-Level Changes: An Integrated Approach; Wilgus, C.K., Hastings, B.S., Kendall, C.G.S.C., Posamentier, H.W., Ross, C.A., Van Wagoner, J.C., Eds.; SEPM Special Publication: Claremore, OK, USA, 1988; Volume 42, pp. 47–69. [Google Scholar]
  6. Posamentier, H.; Vail, P.R. Eustatic controls on clastic deposition II—Sequences and systems tract models. In Sea Level Changes—An Integrated Approach; Wilgus, C.K., Hastings, B.S., Posamentier, H., Van Wagoner, J., Ross, C.A., Kendall, C.G.S.C., Eds.; SEPM Special Publication: Claremore, OK, USA, 1988; Volume 42, pp. 125–154. [Google Scholar]
  7. Catuneanu, O.; Galloway, W.E.; Kendall, C.G.S.C.; Miall, A.D.; Posamentier, H.W.; Strasser, A.; Tucker, M.E. Sequence stratigraphy: Methodology and nomenclature. Newsl. Stratigr. 2011, 44, 173–245. [Google Scholar] [CrossRef]
  8. Catuneanu, O. Model-independent sequence stratigraphy. Earth-Sci. Rev. 2019, 188, 312–388. [Google Scholar] [CrossRef]
  9. Catuneanu, O. Scale in sequence stratigraphy. Mar. Pet. Geol. 2019, 106, 128–159. [Google Scholar] [CrossRef]
  10. Catuneanu, O. Principles of Sequence Stratigraphy, 2nd ed.; Elsevier: Amsterdam, The Netherlands, 2022; p. 486. [Google Scholar]
  11. Mial, A.D. Stratigraphy: A Modern Synthesis; Springer: Cham, Switzerland, 2022; p. 511. [Google Scholar]
  12. Schlager, W. Accommodation and sediment supply—A dual control on stratigraphic sequences. Sediment. Geol. 1993, 86, 111–136. [Google Scholar] [CrossRef]
  13. Vail, P.R. Seismic stratigraphy interpretation using sequence stratigraphy, Part 1: Seismic stratigraphy interpretation procedure. In Atlas of Seismic Stratigraphy; Bally, A.W., Ed.; AAPG Studies in Geology: Tulsa, OK, USA, 1987; Volume 27, pp. 1–10. [Google Scholar]
  14. Sarg, J.F. Carbonate sequence stratigraphy. In Sea-Level Changes: An Integrated Approach; Wilgus, C.K., Hastings, B.S., Kendall, C.G.S.C., Posamentier, H.W., Ross, C.A., Van Wagoner, J.C., Eds.; SEPM Special Publication: Claremore, OK, USA, 1988; Volume 42, pp. 155–182. [Google Scholar]
  15. Schlager, W. Drowning unconformities on carbonate platforms. In Controls on Carbonate Platform and Basin Development; Crevello, P.D., Sarg, J.F., Wilson, J.L., Read, J.F., Eds.; SEPM Special Publication: Claremore, OK, USA, 1989; Volume 44, pp. 15–25. [Google Scholar]
  16. Schlager, W. Sedimentology and Sequence Stratigraphy of Reefs and Carbonate Platforms. In Continuing Education Course Note Series; AAPG: Tulsa, OK, USA, 1992; Volume 34, p. 71. [Google Scholar]
  17. Handford, C.R.; Loucks, R.G. Carbonate depositional sequences and systems tracts—Responses of carbonate platforms to relative sea-level changes. In Carbonate Sequence Stratigraphy: Recent Developments and Applications; Loucks, B., Sarg, R.J., Eds.; AAPG Bulletin: Tulsa, OK, USA, 1993; Volume 57, pp. 3–41. [Google Scholar]
  18. Reijmer, J.J.G. Marine carbonate factories: Review and update. Sedimentology 2021, 68, 1729–1796. [Google Scholar] [CrossRef]
  19. Schlager, W. Sedimentation rates and growth potential of tropical, cool-water and mud-mound carbonate factories. In Carbonate Platform Systems: Components and Interactions; Insalaco, E., Skelton, P., Palmer, T.J., Eds.; Geological Society, London, Special Publications: Bath, UK, 2000; Volume 178, pp. 217–227. [Google Scholar]
  20. Schlager, W. Benthic carbonate factories of the Phanerozoic. Int. J. Earth Sci. 2003, 92, 445–464. [Google Scholar] [CrossRef]
  21. Schlager, W. Carbonate sedimentology and sequence stratigraphy. In SEPM Concepts in Sedimentology and Paleontology; SEPM Society for Sedimentary Geology: Tulsa, OK, USA, 2005; Volume 8, p. 200. [Google Scholar]
  22. Reijmer, J.J.G. Carnonate Factories. In Encyclopedia of Marine Geosciences; Harff, J., Meschede, M., Petersen, S., Thiede, J., Eds.; Springer: Dordrecht, Germany, 2014; pp. 1–8. [Google Scholar] [CrossRef]
  23. Pomar, L.; Hallock, P. Carbonate factories: A conundrum in sedimentary geology. Earth-Sci. Rev. 2008, 87, 134–169. [Google Scholar] [CrossRef]
  24. Zachos, J.; Pagani, M.; Sloan, L.; Thomas, E.; Billups, K. Trends, rhythms, and aberrations in global climate 65 Ma to present. Science 2001, 292, 686–693. [Google Scholar] [CrossRef] [PubMed]
  25. Westerhold, T.; Röhl, U.; Laskar, J. Time scale controversy: Accurate orbital calibration of the early Paleogene. Geochem. Geophys. Geosyst. 2012, 13, Q06015. [Google Scholar] [CrossRef]
  26. Haq, B.U.; Ogg, J. Retraversing the Highs and Lows of Cenozoic Sea Levels. GSA Today 2024, 34, 4–11. [Google Scholar] [CrossRef]
  27. Vera, J.A. Geología de España. Sociedad Geológica de España; Instituto Geológico y Minero de España: Madrid, Spain, 2004; p. 884. [Google Scholar]
  28. Martín-Martín, M.; Guerrera, F.; Tosquella, J.; Tramontana, M. Paleocene-Lower Eocene carbonate platforms of westernmost Tethys. Sediment. Geol. 2020, 404, 105674. [Google Scholar] [CrossRef]
  29. Vera, J.A. El Terciario de la Cordillera Bética: Estado actual de conoscimientos. Rev. Soc. Geol. Esp. 2000, 13, 345–373. [Google Scholar]
  30. Arias, C.; Castro, J.M.; Chacón, B.; Company, M.; Crespo-Blanc, A.; Diaz de Federico, A.; Estévez, A.; Fernández, J.; García Hernández, M.; López-Garrido, A.C.; et al. Zonas externas béticas. In Geología de España; Vera, J.A., Ed.; Sociedad Geológica de España, Instituto Geològico y Minero de España (IGME): Madrid, Spain, 2004; pp. 354–395. [Google Scholar]
  31. De Ruig, M.J. Tectono-Sedimentary Evolution of the Prebetic Fold Belt of Alicante (SE Spain)—A Study of Stress Fluctuations and Foreland Basin Deformation. Ph.D. Thesis, Vrije Universiteit, Amsterdam, The Netherlands, 1992. [Google Scholar]
  32. Martín-Martín, M.; Estévez, A.; Martín-Rojas, I.; Guerrera, F.; Alcalá, F.J.; Serrano, F.; Tramontana, M. The Agost Basin (Betic Cordillera, Alicante province, Spain) a pull-apart basin involving salt tectonics. Int. J. Earth Sci. 2018, 107, 665–671. [Google Scholar] [CrossRef]
  33. Martín-Martín, M.; Guerrera, F.; Alcalá, F.J.; Serrano, F.; Tramontana, M. Source areas evolution in the Neogene Agost Basin (Betic Cordillera): Implications for regional reconstructions. Ital. J. Geosci. 2018, 137, 433–451. [Google Scholar] [CrossRef]
  34. Geel, T.; Roep, T.B.; Vail, P.R.; Van Hinte, J.E. Eocene tectono-sedimentary patterns in the Alicante region (Southeastern Spain). In Mesozoic and Cenozoic Sequence Chronostratigraphic Framework of European Basins; Hardenbol, J., Thierry, J., Farley, M.B., Jacquin, T., De Graciansky, P.R., Vail, P.R., Eds.; SEPM Special Publication: Claremore, OK, USA, 1998; Volume 60, pp. 289–302. [Google Scholar]
  35. Geel, T. Recognition of stratigraphic sequences in carbonate platform and slope deposits: Empirical models based on microfacies analysis of Paleogene deposits in southeastern Spain. Palaeogeogr. Palaeoclimatol. Palaeoecol. 2000, 155, 211–238. [Google Scholar] [CrossRef]
  36. Guerrera, F.; Estévez, A.; López-Arcos, M.; Martín-Martín, M.; Martin-Pérez, J.A.; Serrano, F. Paleogene tectonosedimentary evolution of the Alicante through (External Betic Zone, SE Spain) and its bearings on the timing of the deformation of the South-Iberian Margin. Geodin. Acta 2006, 19, 87–101. [Google Scholar] [CrossRef]
  37. Martín-Chivelet, J.; Chacón, B. Event stratigraphy of the upper Cretaceous to lower Eocene hemipelagic sequences of the Prebetic Zone (SE Spain): Record of the onset of tectonic convergence in a passive continental margin. Sediment. Geol. 2007, 197, 141–163. [Google Scholar] [CrossRef]
  38. Martín-Martín, M.; Miclăuș, C.; Tent, J.E.; Tosquella, J.; Serrano, F.; Samsó, J.M.; Martín-Pérez, J.A. Paleocene-Eocene evolution of the Prebetics (South Iberian Margin, South Spain) and comparison with other western Tethyan margins. Mar. Pet. Geol. 2025, 176, 107300. [Google Scholar] [CrossRef]
  39. Tosquella, J.; Martín-Martín, M.; Miclăuș, C.; Tent-Manclús, J.E.; Serrano, F.; Martín-Pérez, J.A. Eocene Gravity Flows in the Internal Prebetic (Betic Cordillera, SE Spain): A Vestige of an Ilerdian Lost Carbonate Platform in the South Iberian Margin. Geosciences 2025, 15, 81. [Google Scholar] [CrossRef]
  40. Hottinger, L. Foraminifères operculiniformes. In Serie C, Sciences de la Terre; Mémoires du Museum National d’Histoire Naturelle: Paris, France, 1977; Volume 40, p. 159. [Google Scholar]
  41. Schaub, H. Nummulites et Assilines de la Tethys Paléogène: Taxinomie, phylogénèse et biostratigraphie. In Mémoires Suisses de Paléontologie; Birkhäuser: Basel, Switzerland, 1981; p. 236. [Google Scholar]
  42. Hottinger, L. Recherches sur les Alvéolines du Paléocène et de l’Éocène. In Mémoires Suisses de Paléontologie; Birkhäuser: Basel, Switzerland, 1960; p. 243. [Google Scholar]
  43. Hottinger, L.; Drobne, K. Tertiary Alveolinids: Problems linked to the conception of species. Rev. Paléobiol. Benthos ‘86. Spec. 1988, 2, 665–681. [Google Scholar]
  44. Hottinger, L. Rotaliid shell architecture and the palaeodiversity of the Lockhartia Sea. In Paleogene Larger Rotaliid Foraminifera from the Western and Central Neotethys; Bassi, D., Ed.; Springer: Cham, Switzerland, 2014; pp. 3–12. [Google Scholar]
  45. Silva-Casal, R.; Serra-Kiel, J.; Rodríguez-Pintó, A.; Pueyo, L.E.; Aurell, M.; Payros, A. Systematics of Lutetian larger foraminifera and magnetobiostratigraphy from South Pyrenean Basin (Sierras Exteriores, Spain). Geol. Acta 2021, 19, 1–64. [Google Scholar] [CrossRef]
  46. Olsson, R.K.; Berggren, W.A.; Hemleben, C.; Huber, B.T. Atlas Paleocene Planktonic Foraminifera. In Smithsonian Contributions to Paleobiology; Smithsonian Institution Press: Washington, DC, USA, 1999; Volume 85, p. 252. [Google Scholar]
  47. Pearson, P.N.; Olsson, R.K.; Huber, B.T.; Hemleben, C.; Berggren, W.A. Atlas of Eocene Planktonic Foraminifera; Cushman Foundation for Foraminiferal Research, Special Publication: Glen Allen, VA, USA, 2006; Volume 41, p. 514. [Google Scholar]
  48. Wade, B.S.; Pearson, P.N.; Berggren, W.A.; Pälike, H. Review and revision of Cenozoic tropical planktonic foraminiferal biostratigraphy and calibration to the geomagnetic polarity and astronomical time scale. Earth-Sci. Rev. 2011, 104, 11–142. [Google Scholar] [CrossRef]
  49. Flügel, E. Microfacies of carbonate rocks. In Analysis, Interpretation and Application; Springer: Berlin/Heidelberg, Germany, 2010; p. 976. [Google Scholar]
  50. Embry, A.F.; Klovan, J.E. A Late Devonian reef tract on Northeastern Banks Island, NWT. Can. Petr. Geol. Bull. 1971, 19, 730–781. [Google Scholar]
  51. AgiSoft Metashape; Version 1.8.2; Agisoft LLC.: St. Petersburg, Russia, 2019; Available online: http://www.agisoft.com/downloads/installer/ (accessed on 30 November 2020).
  52. Bellian, J.A.; Kerans, C.; Jennette, D.C. Digital outcrop models: Applications of terrestrial scanning LiDAR technology in stratigraphic modeling. J. Sediment. Res. 2005, 75, 166–176. [Google Scholar] [CrossRef]
  53. Bistacchi, A.; Massironi, M.; Viseu, S. 3D Digital Geological Models: From Terrestrial Outcrops to Planetary Surfaces. In 3D Digital Geological Models: From Terrestrial Outcrops to Planetary Surfaces; Bistacchi, A., Massironi, M.S., Viseur, S., Eds.; Wiley & Sons: Hoboken, NJ, USA, 2022; pp. 1–10. [Google Scholar]
  54. Carrivick, J.L.; Smith, M.W.; Quincey, D.J. Background to structure from motion. In Structure from Motion in the Geosciences; Carrivick, J.L., Smith, M.W., Quincey, D.J., Eds.; Wiley & Sons: Hoboken, NJ, USA, 2016; pp. 37–59. [Google Scholar] [CrossRef]
  55. Menegoni, N.; Giordan, D.; Perotti, C.; Tannant, D.D. Detection and geometric characterization of rock mass discontinuities using a 3D high-resolution digital outcrop model generated from RPAS imagery–Ormea rock slope, Italy. Eng. Geol. 2019, 252, 145–163. [Google Scholar] [CrossRef]
  56. Menegoni, N.; Giordan, D.; Perotti, C. Reliability and uncertainties of the analysis of an unstable rock slope performed on RPAS digital outcrop models: The case of the gallivaggio landslide (Western Alps, Italy). Remote Sens. 2020, 12, 1635. [Google Scholar] [CrossRef]
  57. Perozzo, M.; Menegoni, N.; Foletti, M.; Poggi, E.; Benedetti, G.; Carretta, N.; Ferro, S.; Rivola, W.; Seno, S.; Giordan, D.; et al. Evaluation of an innovative, open-source and quantitative approach for the kinematic analysis of rock slopes based on UAV based Digital Outcrop Model: A case study from a railway tunnel portal (Finale Ligure, Italy). Eng. Geol. 2024, 340, 107670. [Google Scholar] [CrossRef]
  58. Jones, R.R.; Wawrzyniec, T.F.; Holliman, N.S.; McCaffrey, K.J.W.; Imber, J.; Holdsworth, R.E. Describing the dimensionality of geospatial data in the earth sciences—Recommendations for nomenclature. Geosphere 2008, 4, 354–359. [Google Scholar] [CrossRef]
  59. Miller, K.G.; Browning, J.V.; Schmelz, W.J.; Kopp, R.E.; Mountain, G.S.; Wright, J.D. Cenozoic sea-level and cryospheric evolution from deep-sea geochemical and continental margin records. Sci. Adv. 2020, 6, eaaz1346. [Google Scholar] [CrossRef]
  60. Guerrera, F.; Mancheño, M.A.; Martín-Martín, M.; Raffaelli, G.; Rodríguez-Estrella, T.; Serrano, F. Paleogene evolution of the external betic zone and geodynamic implications. Geol. Acta 2014, 12, 171–192. [Google Scholar]
  61. Wray, J.L. Calcareous Algae; Elsevier Publishers: Amsterdam, The Netherlands, 1977; p. 190. [Google Scholar]
  62. Braga, J.C.; Bassi, D. Neogene history of Sporolithon Heidrich (Corallinales, Rhodophyta) in the Mediterranean region. Palaeogeogr. Palaeoclimatol. Palaeoecol. 2007, 243, 189–203. [Google Scholar] [CrossRef]
  63. Aguirre, J.; Braga, J.C.; Bassi, D. Rhodoliths and Rhodolith Beds in the Rock Record. In Rhodolith/Maërl Beds: A Global Perspective; Riosmena-Rodríguez, R., Nelson, W., Aguirre, J., Eds.; Springer: Berlin/Heidelberg, Germany, 2017; pp. 105–138. [Google Scholar]
  64. Renema, W. Larger Foraminifera as Marine Environmental Indicators. Scr. Geol. 2002, 124, 1–230. [Google Scholar]
  65. Burchette, T.P.; Wright, V.P. Carbonate ramp depositional systems. Sediment. Geol. 1992, 79, 3–57. [Google Scholar] [CrossRef]
  66. Pomar, L. Types of carbonate platforms: A genetic approach. Basin Res. 2001, 13, 313–334. [Google Scholar] [CrossRef]
  67. Pomar, L.; Baceta, J.I.; Hallock, P.; Mateu-Vicens, G.; Basso, D. Reef building and carbonate production modes in the west-central Tethys during the Cenozoic. Mar. Pet. Geol. 2017, 83, 261–304. [Google Scholar] [CrossRef]
  68. Michel, J.; Laugié, M.; Pohl, A.; Lanteaume, C.; Masse, J.P.; Donnadieu, Y.; Borgomano, J. Marine carbonate factories: A global model of carbonate platform distribution. Int. J. Earth Sci. 2019, 108, 1773–1792. [Google Scholar] [CrossRef]
  69. Betzler, C.; Brachert, T.C.; Nebelsick, J. The warm temperate carbonate province. A review of the facies, zonations, and delimitations. Cour. Forsch.-Inst. Senckenberg 1997, 201, 83–99. [Google Scholar]
  70. Halfar, J.; Godinez-Orta, L.; Mutti, M.; Valdez-Holguín, J.E.; Borges, J.M. Nutrient and temperature controls on modern carbonate production: An example from the Gulf of California, Mexico. Geology 2004, 32, 213–216. [Google Scholar] [CrossRef]
  71. Serra-Kiel, J.; Hottinger, L.; Caus, E.; Drobne, K.; Ferràndez, C.; Jauhri, A.K.; Less, G.; Pavlovec, R.; Pignatti, J.; Samsó, J.M.; et al. Larger foraminiferal biostratigraphy of the Tethyan Paleocene and Eocene. Bull. Soc. Géol. Fr. 1998, 169, 281–299. [Google Scholar]
Figure 1. Geological setting of the study area. (A) Location map of the Betic Cordillera within the western–central Mediterranean Alpine Chain. (B) Detailed geological map of the Betic Cordillera (modified after [29]), showing the regional context and study area location (see Figure 2 for detailed mapping).
Jmse 13 01031 g001
Figure 3. (A) Composite stratigraphic columns of the Onil and Ibi sections (locations shown in Figure 2), illustrating the vertical distribution of lithofacies, dominant lithologies, and characteristic fossil assemblages. Ages, Myr, biozones, and samples (EPxx) are indicated. (B) Scheme with the lateral variation of the Eocene stratigraphic units in the Prebetics and with the positions of the two analyzed sections with red circles and arrows: ① Onil, ② Ibi.
Jmse 13 01031 g003
Figure 4. Representative photomicrographs of key microfacies from the Eocene Prebetic domain in the Alicante region (scale bar: 2 mm for 1-4; 1 mm for 5–8): (A) Mf1 (inner ramp shoal environment), EP56 (Ibi Section); (B) Mf2 (inner ramp seagrass meadow), EP52 (Ibi Section); (C) Mf4 (mid ramp maërl), EP46 (Ibi Section); (D) Mf5 (mid ramp hyaline LBF accumulation), EP111 (Onil Section).; (E) Mf1 (inner ramp shoal environment), EP130 (Onil Section); (F) Mf2 (inner ramp seagrass meadow): EP55 (Ibi Section); (G) Mf4 (mid-ramp maërl), EP48 (Ibi Section); (H) Mf5 (mid-ramp hyaline LBF accumulation), EP111 (log 3, Onil section). Key: ac, acervulinid; at, asterigerinid; br, bryozoan; d, discocycline; da, dasycladacean algae; di, discorbid; ep, echinoid plate; gc, geniculate coralline algae; ha, hooked acervuline; in, intraclast; le, lenticuline; m, miliolid; n, nummulites; or, orbitolites; pa, peyssonneliacean algae; rh, rhodolith; ro, rotaliid.
Jmse 13 01031 g004
Figure 5. Stratigraphic architecture of the studied sections with ages and divisions between LFSs and HFSs. (A) Drone-derived photogrammetric model of the Onil section; (B) drone-derived photogrammetric model of the Ibi section; (C) drone photograph showing LFS1 and its constituent HFSs in the Onil section; (D) field photograph showing LFS2 (ca. 40 m thick) and its HFSs in the Ibi section. All panels display the hierarchical organization of low-frequency sequences (LFSs) and high-frequency sequences (HFSs) with age constraints. Yellow triangles indicate HFSs detected during logging on the basis of field facies changes, which are also recognized on ONI and IBI-A models. Blue triangles in C indicate HFSs inferred from the IBI-C model. Red lines are age divisions Cuisian-Lutetian and Lutetian-Rupelian boundaries (boxes AD). White lines are unconformities separating LFSs (boxes AD). Blue lines are other minor unconformities (box C). Purple dashed line indicates a ravine where the section has been measured along (boxes AD).
Jmse 13 01031 g005
Figure 6. Stratigraphic logs of the Onil and Ibi sections, showing the hierarchical organization of low-frequency sequences (LFSs) and high-frequency sequences (HFSs) identified through field logging and drone imagery. Examples of transgressive–regressive (TR) cycles at both scales are illustrated, with the overall shallowing trend supported by microfacies analysis (ad). Representative photomicrographs highlight key microfacies: Mf1, inner ramp shoal, euphotic environment; Mf2, inner ramp seagrass meadow, euphotic upper subtidal environment; Mf3, LBF accumulations in the transitional inner-to-mid ramp environment; Mf4, mid ramp hyaline LBF accumulations, mesophotic environment; Mf5, mid ramp maërl, mesophotic environment. Samples used for biotratigraphic datation on LBF (*) and planktonic foraminifera (**) basis.
Jmse 13 01031 g006
Figure 7. Stratigraphic correlation of the identified lower-frequency sequences (LFSs) and high-frequency sequences (HFSs) from the studied sections with the sequence and global eustatic curves (after [26]) and orbital eccentricity Milankovitch cycles (after [25]). The orange triangle is the highest-ranked sequence bounded by biostratigraphically resolved unconformities. Red triangles are related to LFS and HFS sequences. Yellow triangles indicate the HFSs recognized in the IBI-C 3D model. Shallow Bethic Zones [71].
Jmse 13 01031 g007
Table 1. UAV (drone) survey parameters and coverage for the study sections. Data acquired using DJI Mavic 3 Enterprise and DJI Air 2S platforms (manufactured by SZ DJI Technology Co., Ltd, Shenzhen, China).
Tool/
Flying Software
FlightDatePhotosCovered Area
(km2)
Models
Mavic DJIair2s
Dronelink
Ibi13 July20222420.223IBI-AIBI-C
Ibi22060.172
DJI Mavic3T
Mavic Pilot
Ibi324 June 202411660.720
Ibi48200.490
Ibi53840.370IBI-A
Ibi618 Nov 20246410.290
Ibi71 Feb 20259310.400IBI-C
Ibi820 Feb 20255840.610IBI-UC
Onil2 Jan 20246590.310ONI
Note: IBI-A—model for the area where Los Molinos Creek is located, IBI-C—model of the Los Molinos Creek, IBI-UC—details of the Los Molinos upstream creek. In the case of IBI, the modeled area does not equal the sum of individual flight areas due to overlapping coverage among flights.
Table 2. Diagnostic characteristics of the identified microfacies. Colors in the "Samples” column indicate the stratigraphic distribution: light gray = Early Eocene samples; dark gray = Middle Eocene samples.
Micro-
Facies
(Mf) and Litho-
Facies (L)
Samples
EP00
DescriptionFossils and Other Components that were Common and/or Abundant (*)Fossils and Other Components that were Present and/or RareDepositional Environment
Mf1
L1–2, L4–6
56–59
129, 130
Limestones with alveolines, nummulites, and miliolids. Terrigenous and dolomitized lmst.
Grainstone of cortoids, miliolids, rotaliids, hooked acervulinids, and geniculate coralline algae
Miliolids *, hook-like acervulinids *, geniculate coralline algae *, Orbitolites, echinoid plates, dasyclade algae, Cuvillerina and other rotaliids *, discorbids, textulariids, cortoids *, pellets *Unidentified small benthic foraminifera, fragmentary remains of Nummulites and coralsShoal deposits near a seagrass environment
Inner ramp
Mf2
L4–6
50–52, 55Limestones with miliolids. Terrigenous and dolomitized lmst.
Grainstone–
rudstone of porcelaneous LBF and acervulinids
Orbitolites *, Alveolina *, hook-like and annular acervulinids *, dasyclade algae *, rotaliids *, miliolids, discorbids, textulariids, gastropods, balanids, vinculariform and lunulitiform bryozoans, echinoid plates, reworked grains of Alveolina and rotaliids, compound grains, pellets, cortoids *Nummulites, Assilina, operculiniform Assilina, Amphistegina, asterigerinids, peyssoneliacean red algaePerennial seagrass environment
Inner ramp
Mf3
L1–3, L7
125, 128Limestones with alveolines, nummulites, and algae. Mudstones. Mixed hyaline–porcelaneous LBF packstoneNummulites *, Discocyclina *, rotaliids *, Alveolina, rhodoliths, echinoid plates and spines, Solenomeris macroids, bryozoans, annelids, discorbids, miliolidsOrbitolites, Assilina, textulariids, unidentified small benthic foraminifera, encrusting acervuline remainsLBF accumulations Inner-to-mid ramp transition
42, 45, 47, 49,
112, 113, 116, 121–124
Mf4
L1–2
46, 48Limestones with alveolines and nummulites. Bindstone-to-rudstone of rhodoliths, acervilinids, and hyaline LBFRhodolith branches * of Sporolithon-Lithoporella, solenomerid macroids *, peyssoneliacean red algae, rotaliids *, Nummulites *, Discocyclina *, Assilina, operculiniform Assilina, haddonids, cibicidids, miliolids, ostracods, annelids, bivalves, gastropods, bryozoans, echinoid debris, quartz grains *Amphistegina, Alveolina, coral grains, dasyclades, geniculate coralline algae, textulariids, unidentified small benthic and planktic foraminiferaMaërl deposits
Mid ramp
Mf5
L1–2, L6
53, 54Limestones with alveolines and nummulites. Dolomitized lmst.
Hyaline LBF packstone–rudstone
Nummulites *, Assilina *, Discocyclina, rotaliids *, echinoid plates and spines, bryozoans, annelids, textulariids, quartz grainsRhodolith and solenomerid macroid fragmentary remainsLBF accumulations Mid ramp
41, 43, 44
111, 114, 117, 118, 120
Both sections display discontinuous exposure with covered intervals ranging from meters to tens of meters. In the Onil section (Figure 3), two distinct intervals occur within the limestone–calcarenite formation. A lower 190 m interval is dominated by L2–L1 alternations (nummulite limestones and alveolina limestones), subdivided by two L7 mudstones units (4 m and 3 m thick) into three subintervals, and shows increasing L6 dolomitized limestones development (L2–L1–L6/L2–L6 cycles). This is followed by an upper >75 m interval of predominantly L6 with occasional preserved primary textures. The Ibi section (Figure 3) also comprises two intervals, a basal ~60 m of poorly exposed L7 mudstones, overlain by LBF-rich limestones and showing a lower interval of alternating L2–L1 facies (nummulite limestones and alveolina limestones) with minor L3–L4 interlayers (algal limestones and limestones with miliolids), and an upper interval with predominant L1 with dissolution/dolomitization features (L6) and rare L5 terrigenous limestones interlayers at ~70 m and 226 m levels. * = abundant.
Disclaimer/Publisher’s Note: The statements, opinions and data contained in all publications are solely those of the individual author(s) and contributor(s) and not of MDPI and/or the editor(s). MDPI and/or the editor(s) disclaim responsibility for any injury to people or property resulting from any ideas, methods, instructions or products referred to in the content.

