Figure 1.
Computational domain for self-propulsion numerical simulation.
Figure 1.
Computational domain for self-propulsion numerical simulation.
Figure 2.
Mesh distribution in different computational domains: (a) free-surface mesh; (b) hull-surface mesh; (c) boundary-layer mesh.
Figure 2.
Mesh distribution in different computational domains: (a) free-surface mesh; (b) hull-surface mesh; (c) boundary-layer mesh.
Figure 3.
Comparison between numerical and experimental results of propeller open-water performance.
Figure 3.
Comparison between numerical and experimental results of propeller open-water performance.
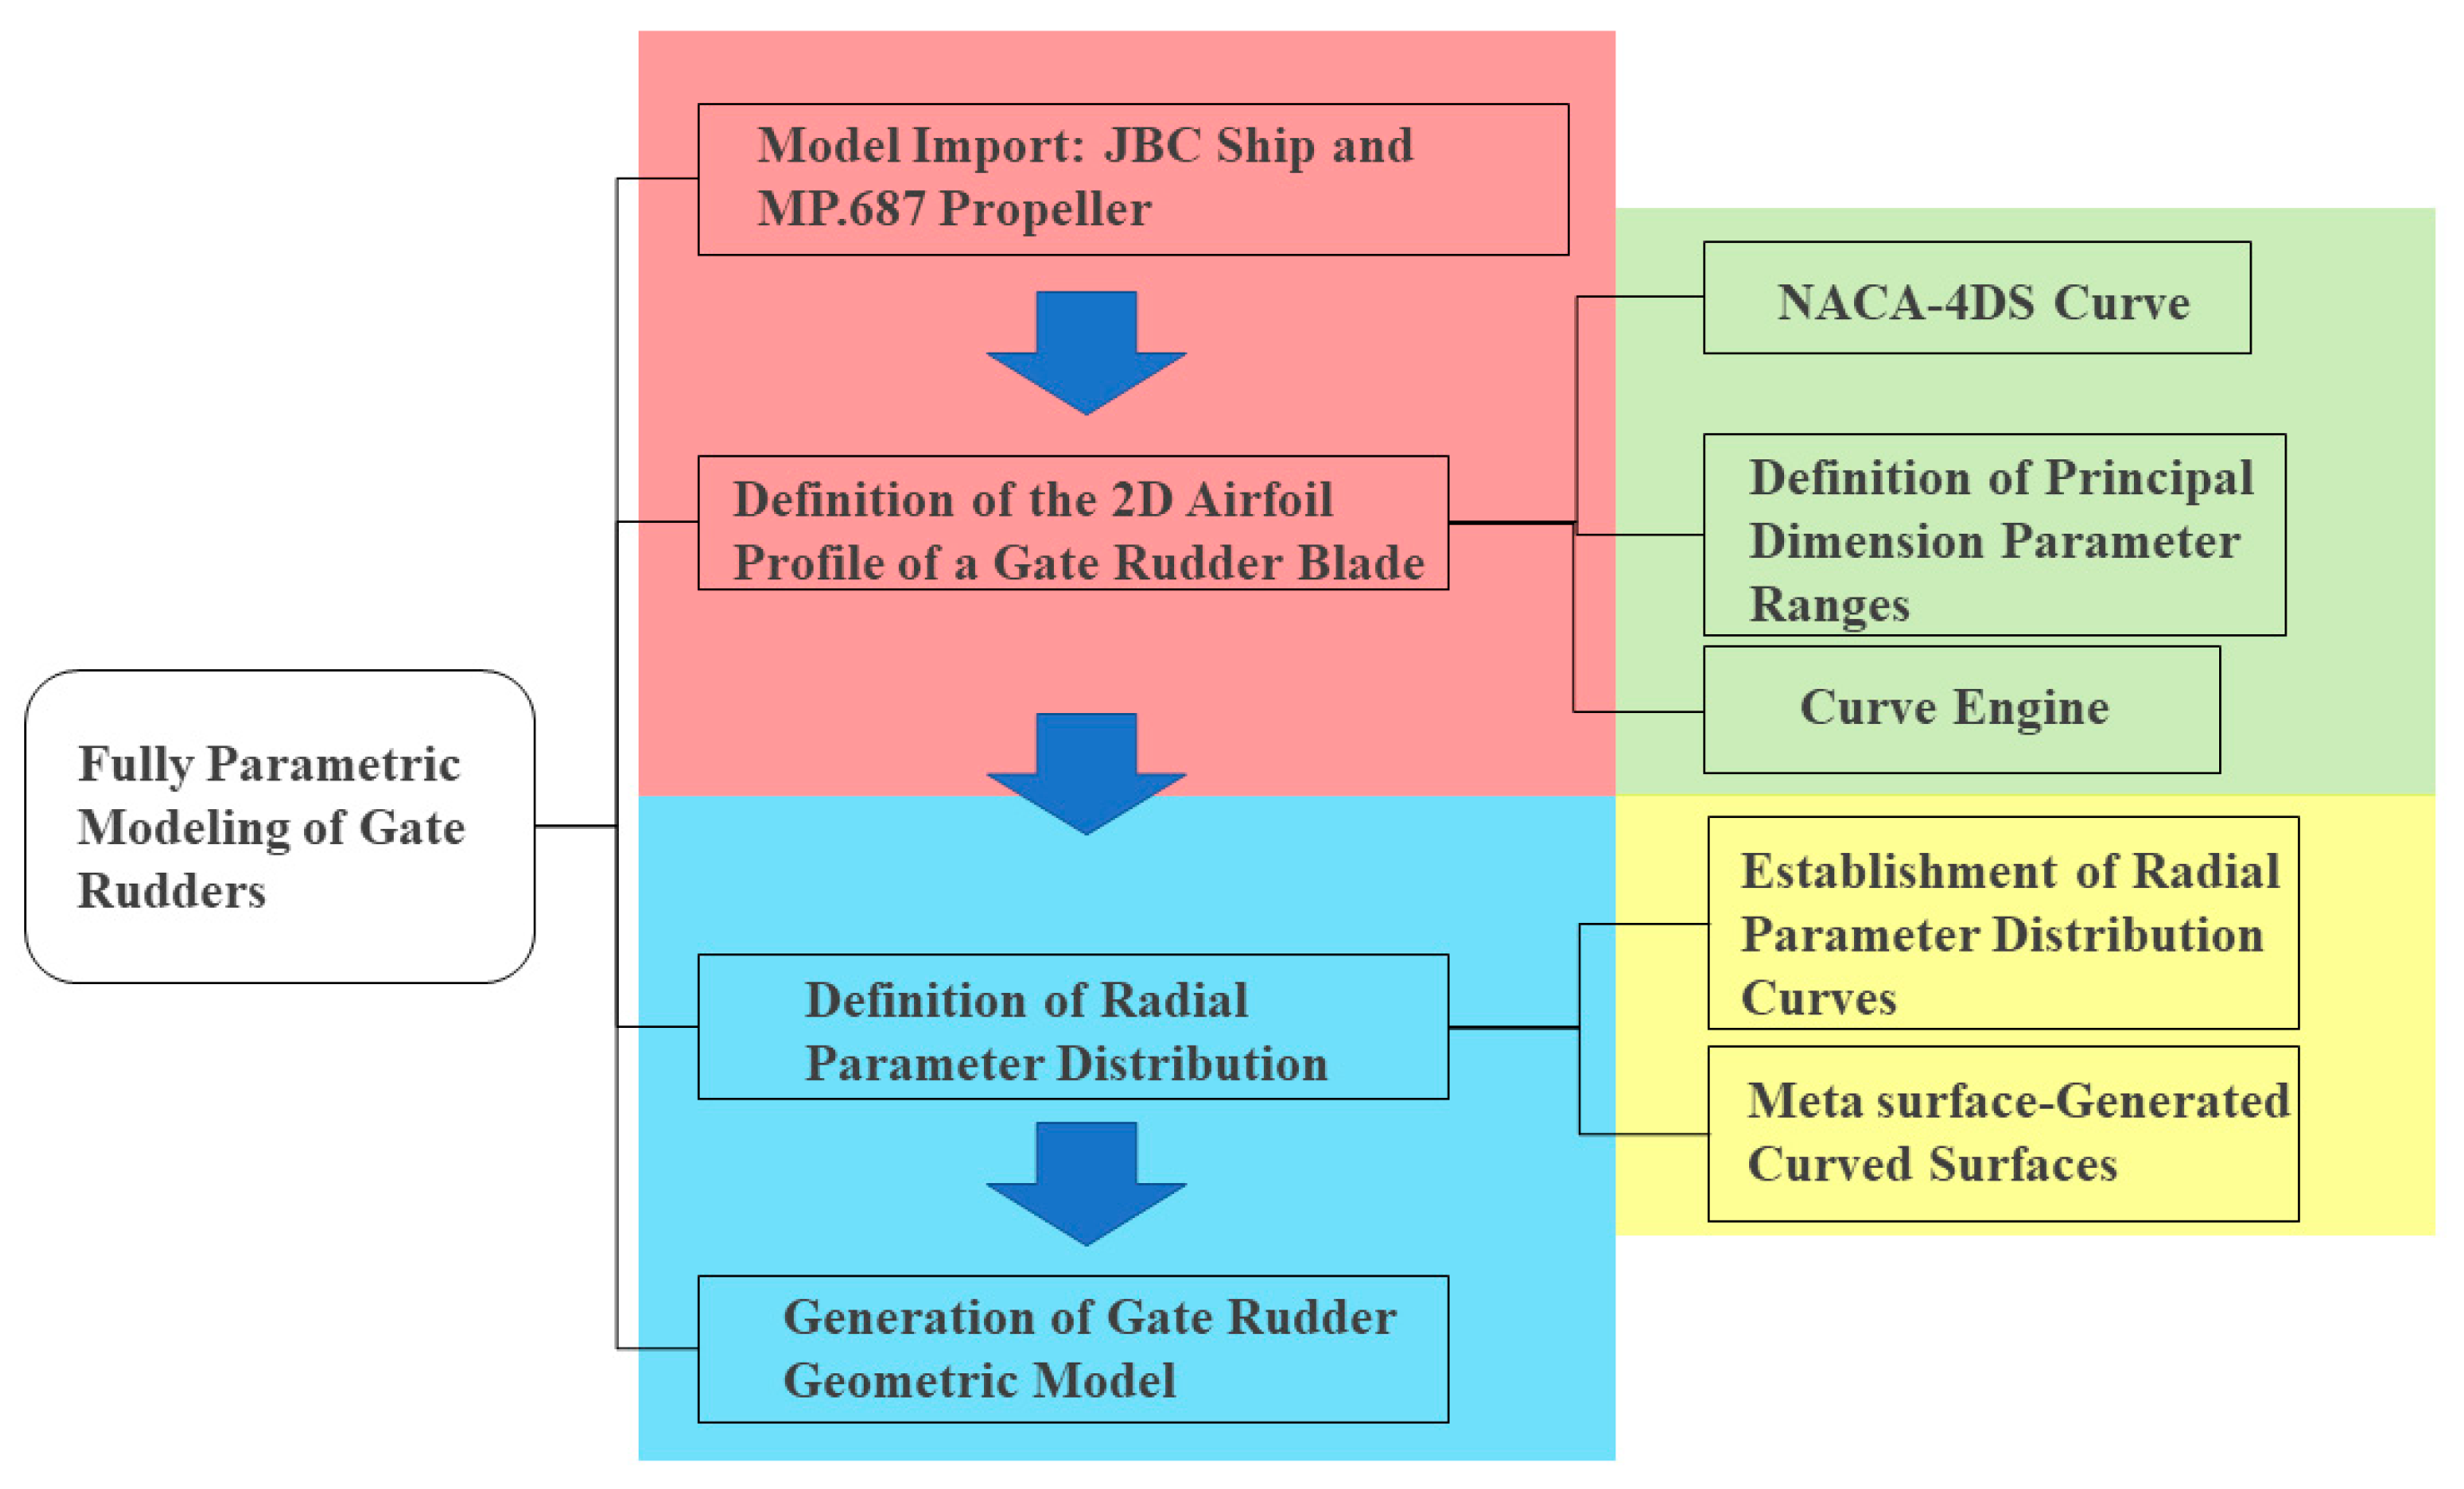
Figure 4.
Gate rudder parametric modeling process.
Figure 4.
Gate rudder parametric modeling process.
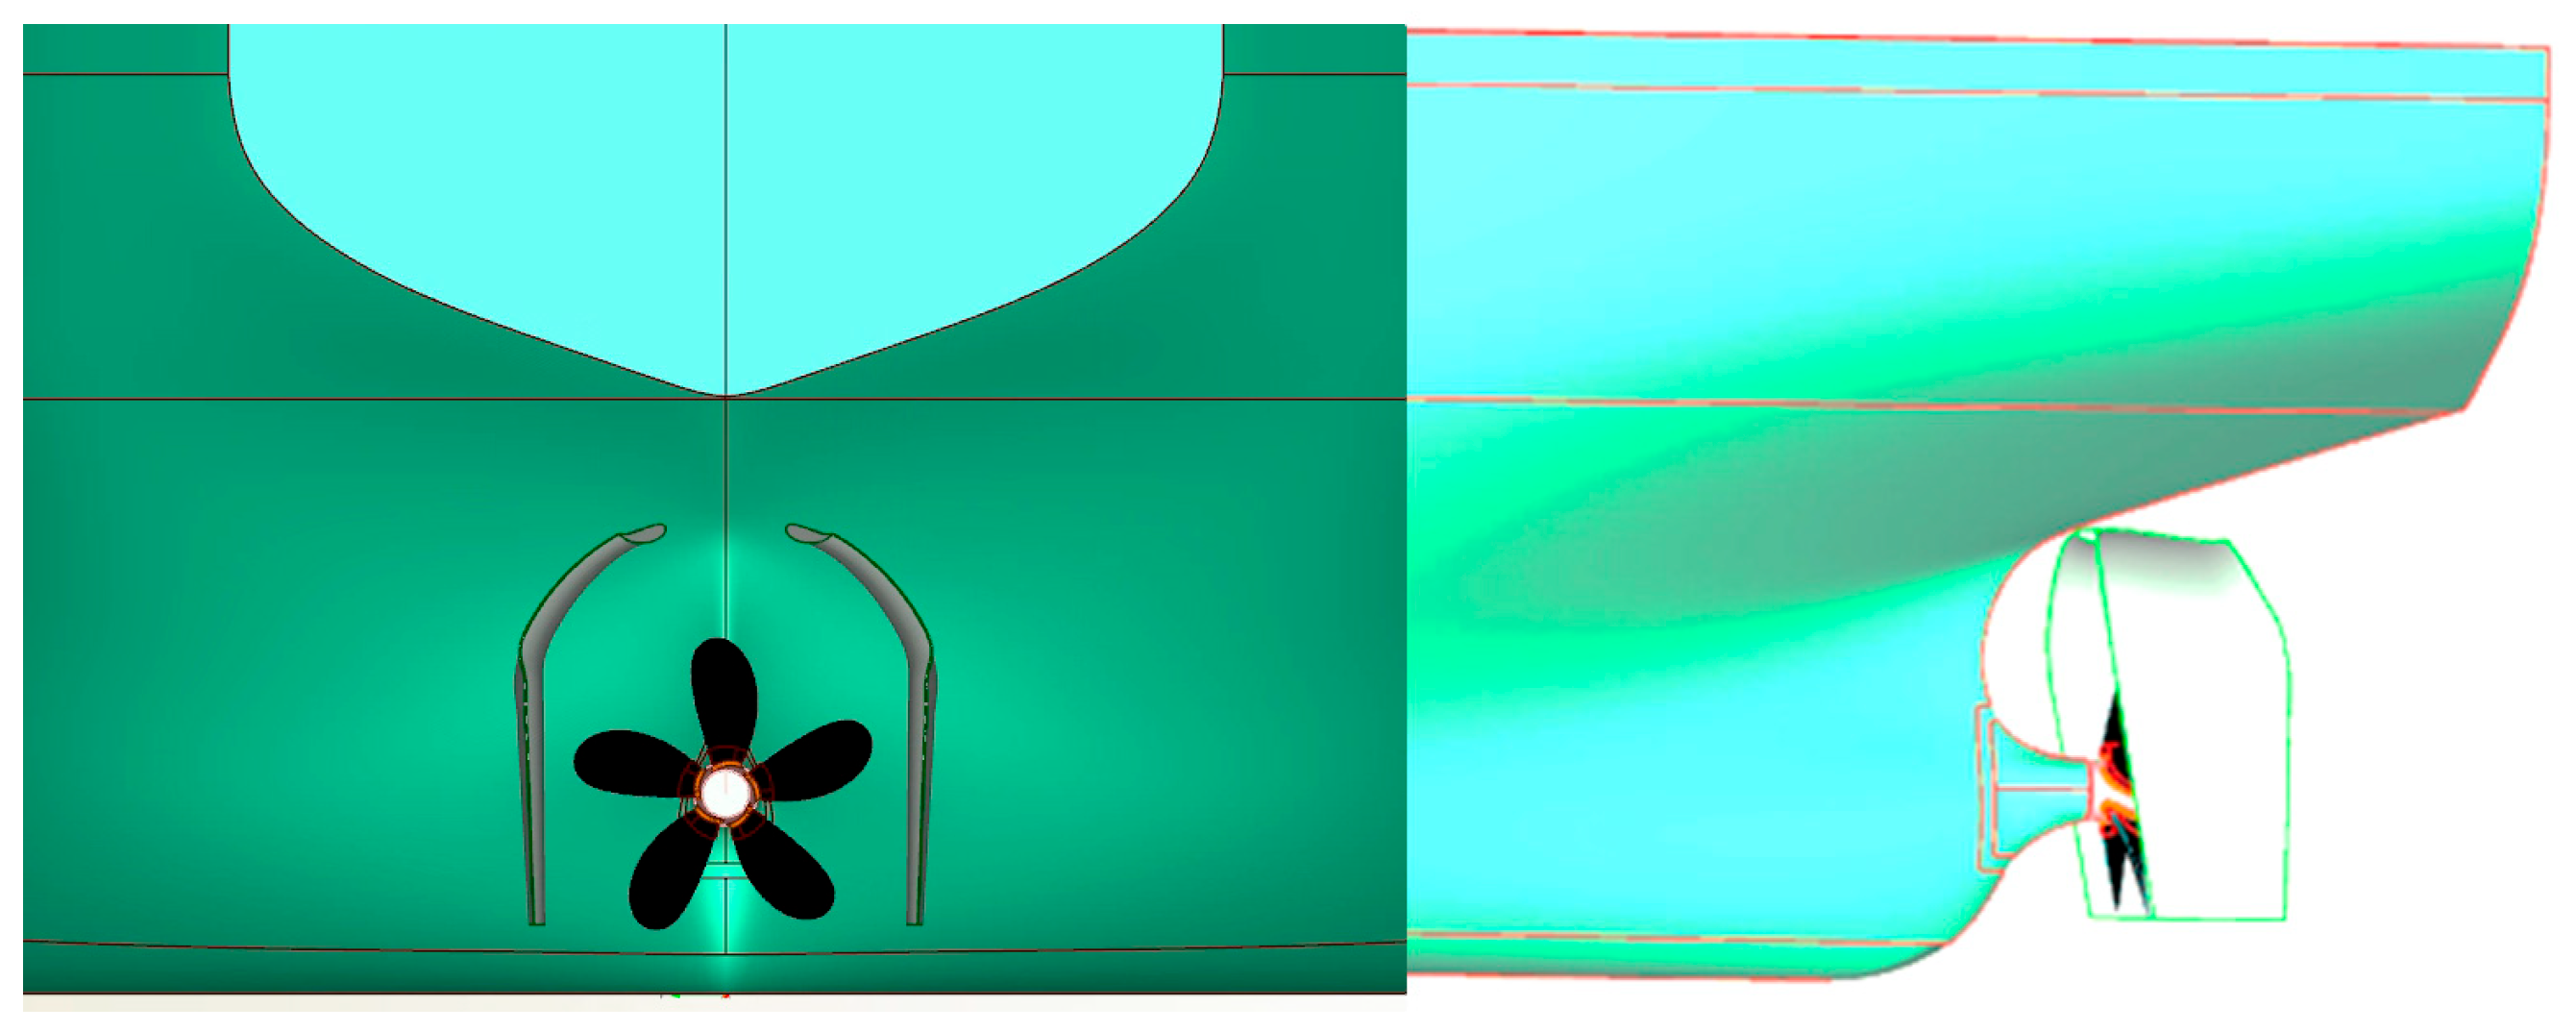
Figure 5.
Hull and propeller geometric model in CAESES.
Figure 5.
Hull and propeller geometric model in CAESES.
Figure 6.
Definition of the 2D airfoil profile for the gate rudder blade.
Figure 6.
Definition of the 2D airfoil profile for the gate rudder blade.
Figure 7.
Distribution curves of characteristic parameters for the gate rudder. (a) Distribution curves of characteristic parameters. Four characteristic parameters are defined: chord length, thickness, camber, and maximum camber position (camber pos). (b) Path curves, with the radial curves of the gate rudder created to control the extrusion path of the airfoil.
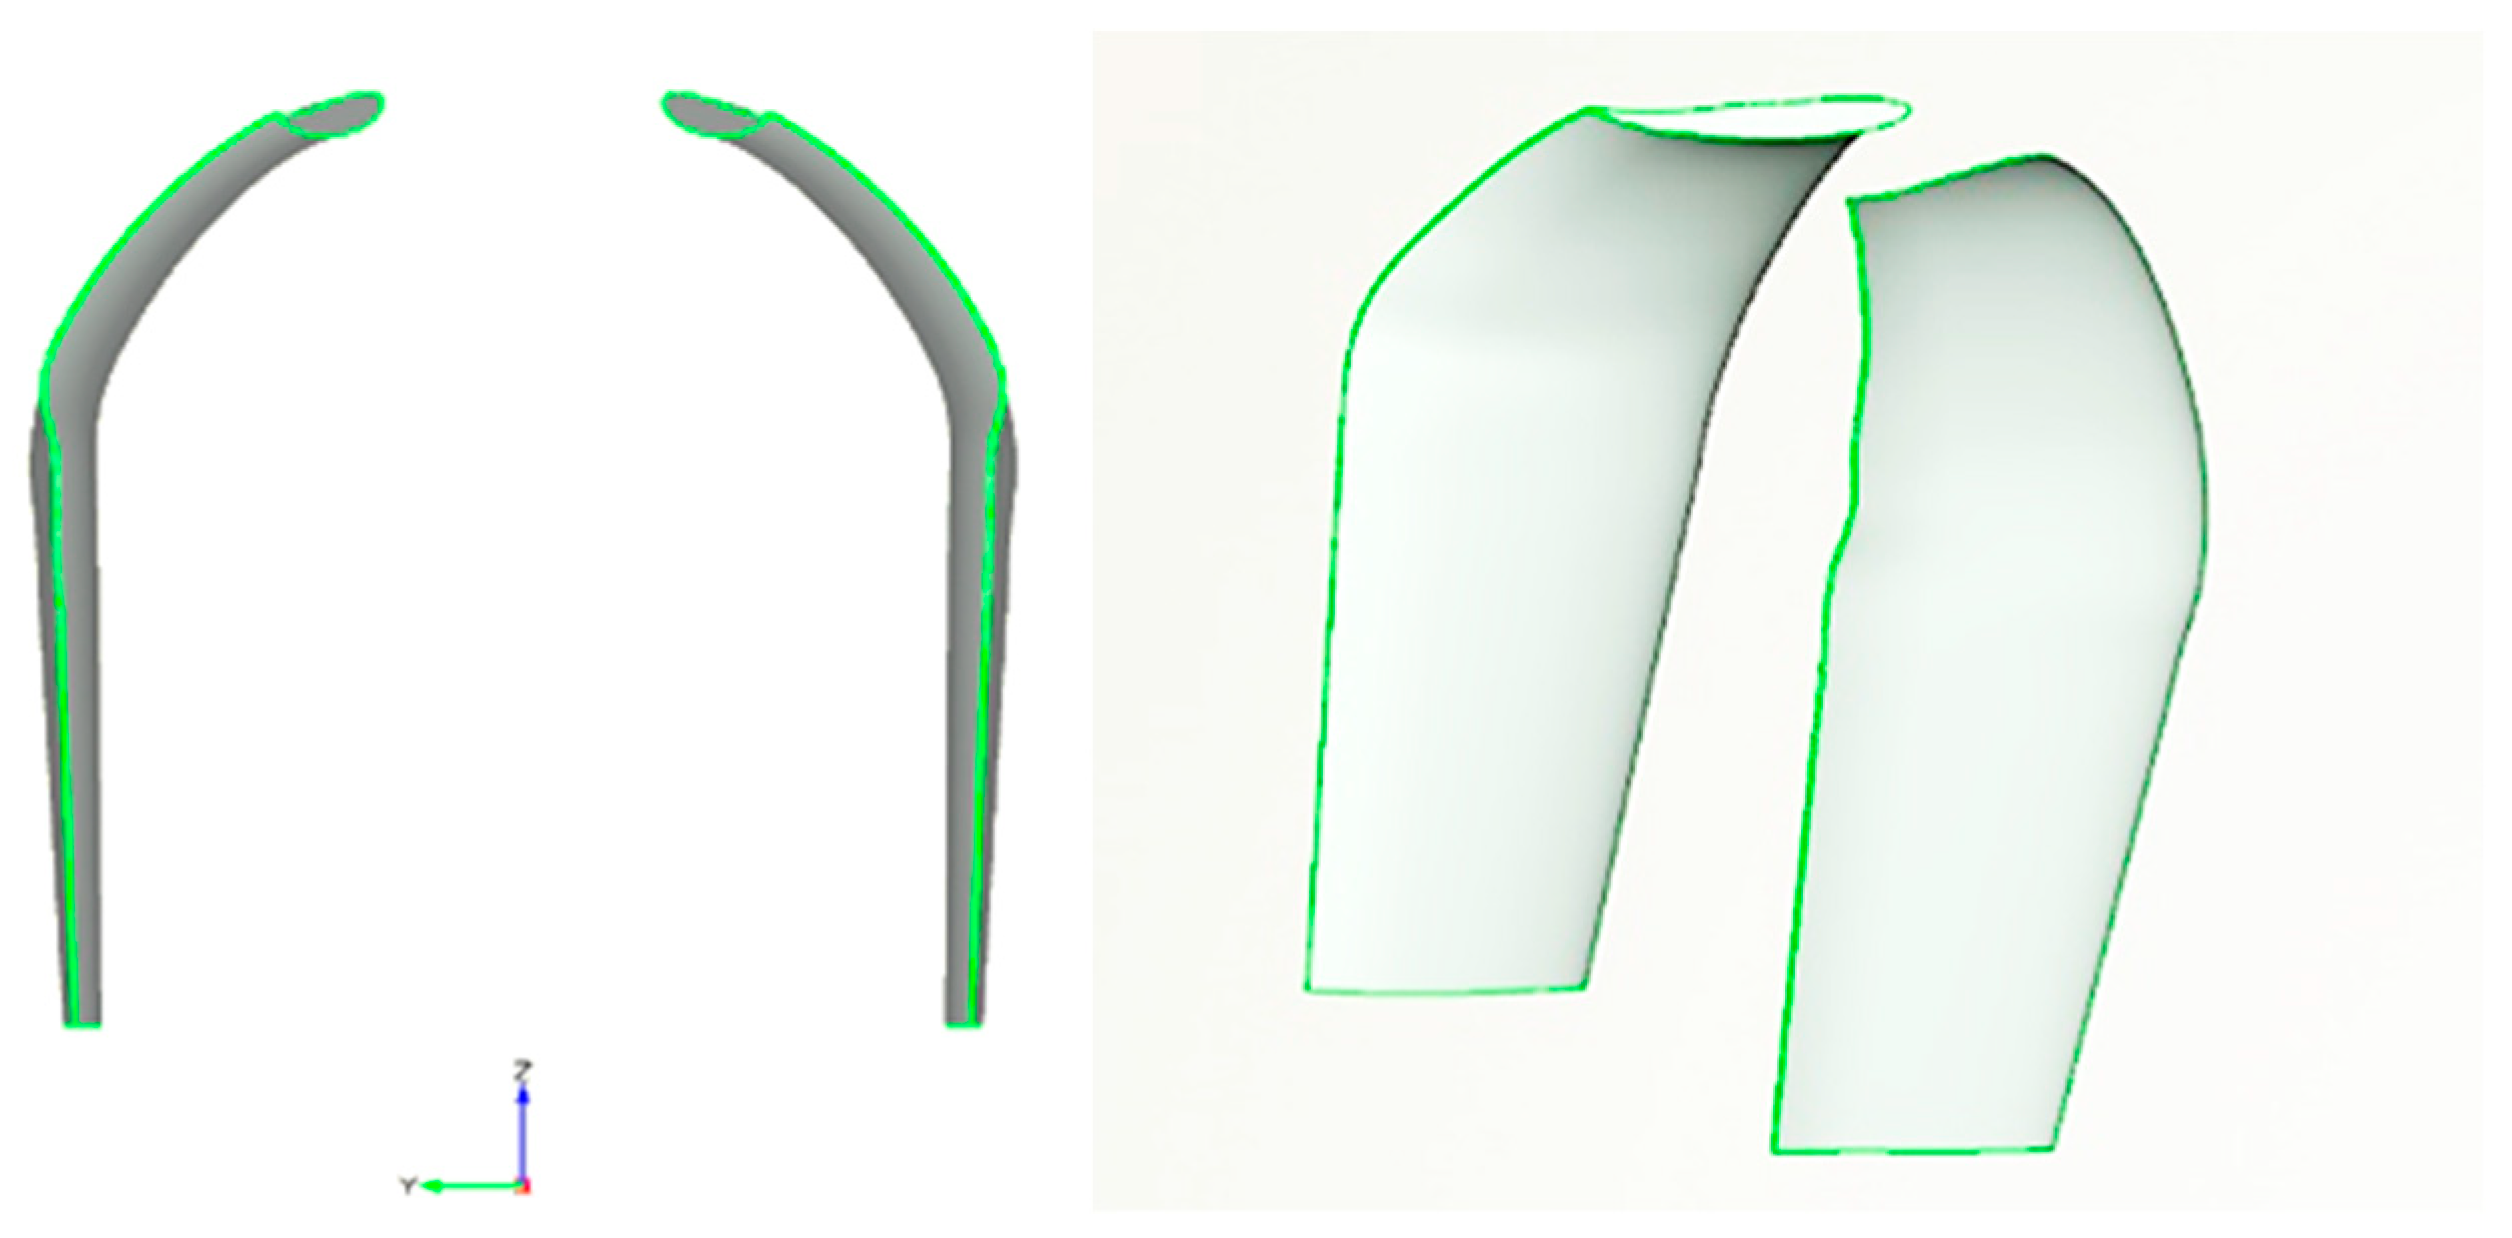
Figure 8.
Fully parametric model of the gate rudder.
Figure 8.
Fully parametric model of the gate rudder.
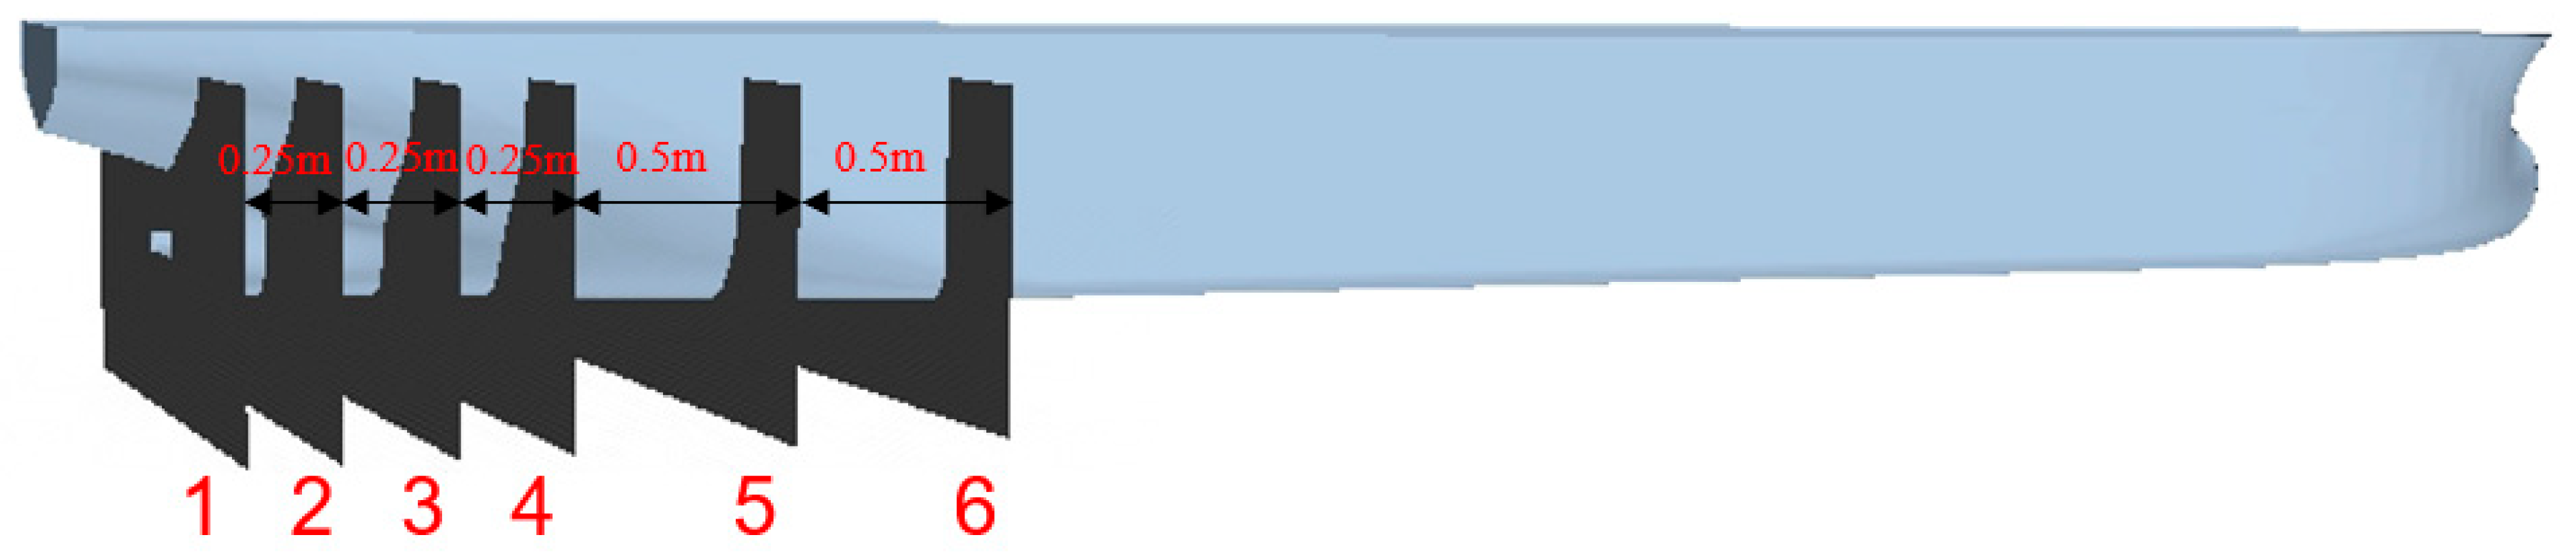
Figure 9.
Arrangement of the gate rudder at the stern.
Figure 9.
Arrangement of the gate rudder at the stern.
Figure 10.
Sample point distribution. (a) Total hull resistance. (b) Thrust generated by gate rudder. (c) Propeller thrust. (d) Propeller torque.
Figure 10.
Sample point distribution. (a) Total hull resistance. (b) Thrust generated by gate rudder. (c) Propeller thrust. (d) Propeller torque.
Figure 11.
Sensitivity of hull resistance.
Figure 11.
Sensitivity of hull resistance.
Figure 12.
Sensitivity of gate rudder thrust.
Figure 12.
Sensitivity of gate rudder thrust.
Figure 13.
Sensitivity of propeller thrust.
Figure 13.
Sensitivity of propeller thrust.
Figure 14.
Sensitivity of propeller torque.
Figure 14.
Sensitivity of propeller torque.
Figure 15.
Main effect of gate rudder airfoil camber on torque.
Figure 15.
Main effect of gate rudder airfoil camber on torque.
Figure 16.
Main effect of propeller–rudder clearance on torque.
Figure 16.
Main effect of propeller–rudder clearance on torque.
Figure 17.
Main effect of the distance between the gate rudder leading edge and propeller plane on torque.
Figure 17.
Main effect of the distance between the gate rudder leading edge and propeller plane on torque.
Figure 18.
Open-water performance curves of the gate rudder–propeller system.
Figure 18.
Open-water performance curves of the gate rudder–propeller system.
Figure 19.
Mesh configuration of the integrated hull–propeller–gate rudder system: (a) mesh generation of the gate rudder at the stern section; (b) surface mesh discretization of propeller blades; (c) surface mesh topology of gate rudder components.
Figure 19.
Mesh configuration of the integrated hull–propeller–gate rudder system: (a) mesh generation of the gate rudder at the stern section; (b) surface mesh discretization of propeller blades; (c) surface mesh topology of gate rudder components.
Figure 20.
Mesh configuration of the integrated hull–propeller–conventional rudder system: (a) mesh discretization of bow and stern sections; (b) rotating-domain mesh generation.
Figure 20.
Mesh configuration of the integrated hull–propeller–conventional rudder system: (a) mesh discretization of bow and stern sections; (b) rotating-domain mesh generation.
Figure 21.
Self-propulsion test curves under different rudder configurations: (a) gate rudder—the self-propulsion test curves for configurations with gate rudders; (b) conventional rudder—the self-propulsion test curves for configurations with conventional rudders.
Figure 21.
Self-propulsion test curves under different rudder configurations: (a) gate rudder—the self-propulsion test curves for configurations with gate rudders; (b) conventional rudder—the self-propulsion test curves for configurations with conventional rudders.
Figure 22.
Schematic diagram of cross-section locations.
Figure 22.
Schematic diagram of cross-section locations.
Figure 23.
Wake distribution at the stern under different configurations: (a) bare hull; (b) hull–propeller configuration; (c) hull–propeller–conventional rudder; (d) hull–propeller–gate rudder.
Figure 23.
Wake distribution at the stern under different configurations: (a) bare hull; (b) hull–propeller configuration; (c) hull–propeller–conventional rudder; (d) hull–propeller–gate rudder.
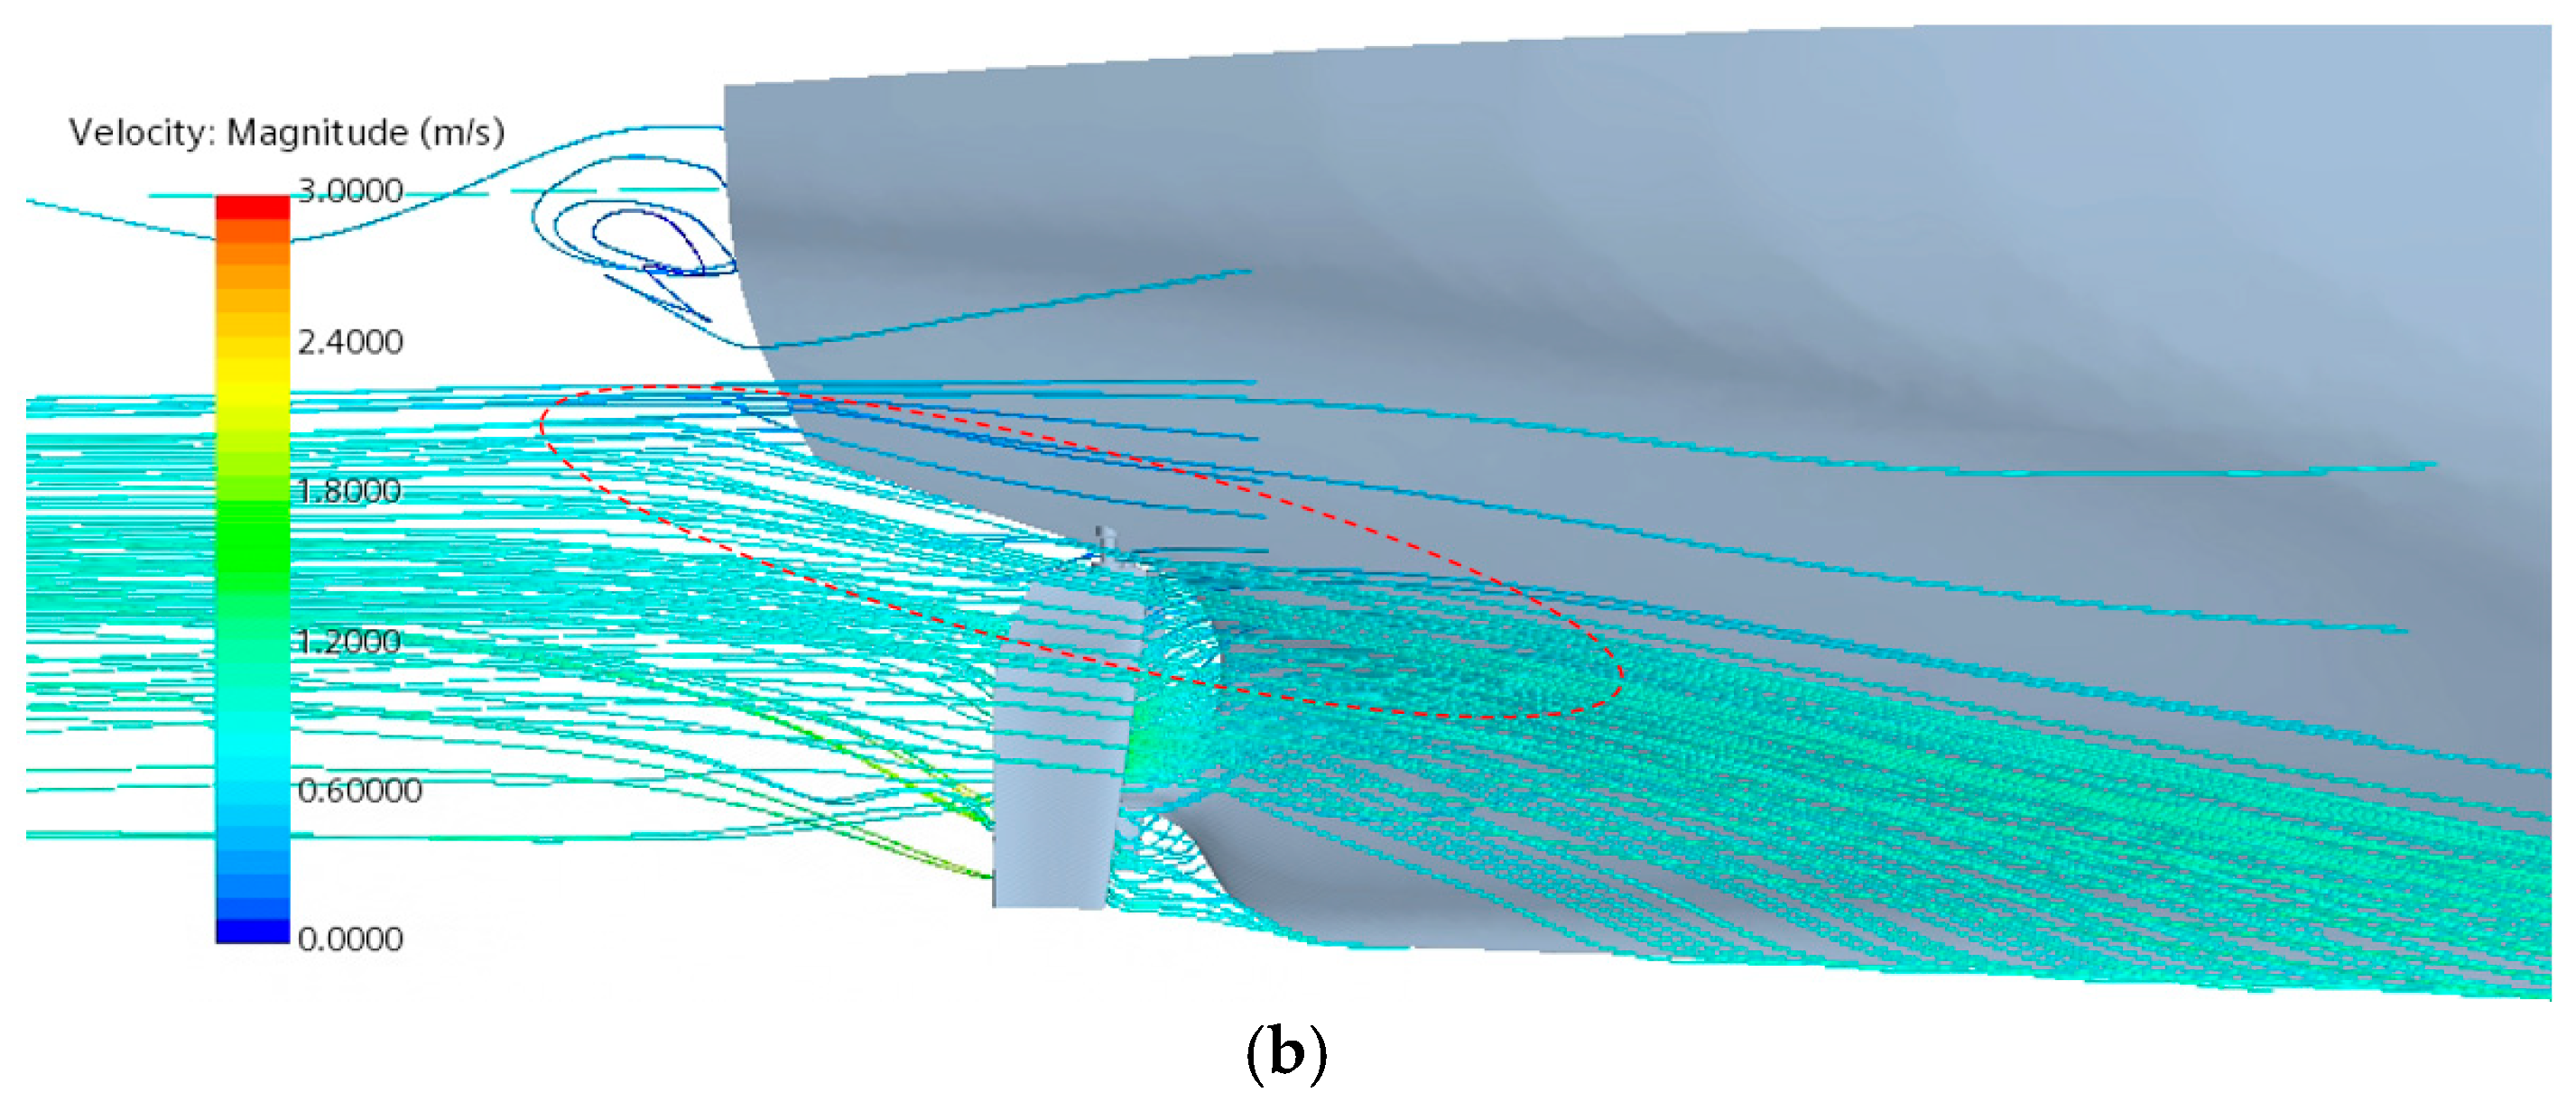
Figure 24.
Local-flow-field details at stern with different rudder configurations: (a) flow-field details with conventional rudder; (b) flow-field details with gate rudder.
Figure 24.
Local-flow-field details at stern with different rudder configurations: (a) flow-field details with conventional rudder; (b) flow-field details with gate rudder.
Figure 25.
Stern-flow-field distribution with different configurations: (a) bare hull; (b) hull–propeller integrated; (c) hull–conventional rudder; (d) hull–propeller–conventional rudder integrated; (e) hull–gate rudder integrated; (f) hull–propeller–gate rudder integrated.
Figure 25.
Stern-flow-field distribution with different configurations: (a) bare hull; (b) hull–propeller integrated; (c) hull–conventional rudder; (d) hull–propeller–conventional rudder integrated; (e) hull–gate rudder integrated; (f) hull–propeller–gate rudder integrated.
Figure 26.
Dimensionless axial velocity distribution in self-propulsion condition: (a) pre-propeller plane (X/D = 0.05); (b) propeller disk plane; (c) post-propeller plane (X/D = −0.05).
Figure 26.
Dimensionless axial velocity distribution in self-propulsion condition: (a) pre-propeller plane (X/D = 0.05); (b) propeller disk plane; (c) post-propeller plane (X/D = −0.05).
Table 1.
Principal particulars of JBC ship model.
Table 1.
Principal particulars of JBC ship model.
| Parameter | Full Scale | Model Scale (λ = 40) |
|---|
| Scale ratio | - | 40 |
| Length between perpendiculars (Lpp) | 280 | 7.000 |
| Length on waterline (Lwl) | 285 | 7.125 |
| Molded breadth (B) | 45 | 1.125 |
| Molded depth (D) | 25 | 0.625 |
| Draft (T) | 16.5 | 0.4125 |
| Displacement volume (∇) | 178,369.9 | 2.7870 |
| Wetted surface area (S) | 19,556.1 | 12.2226 |
Table 2.
Principal geometric parameters of MP. 687 propeller.
Table 2.
Principal geometric parameters of MP. 687 propeller.
| Parameter | Symbol | Unit | Value |
|---|
| Rotation direction | - | - | Right-handed (clockwise) |
| Diameter | D | m | 0.203 |
| Number of blades | Z | - | 5.00 |
| Boss ratio | d/D | - | 0.18 |
| Pitch | P | m | 0.15225 |
| Pitch ratio | P/D | - | 0.75 |
| Parameter | Symbol | Unit | Value |
| Rotation direction | - | - | Right-handed (clockwise) |
Table 3.
Test conditions for calm water resistance tests.
Table 3.
Test conditions for calm water resistance tests.
| Parameter | Symbol | Value | Unit |
|---|
| Reynolds number | Re | 7.46 × 10⁶ | - |
| Froude number | Fr | 0.142 | - |
| Water density | ρ | 998.2 | kg/m3 |
| Kinematic viscosity | ν | 1.107 × 10⁻⁶ | m2/s |
| Gravitational acceleration | g | 9.8 | m/s2 |
| Parameter | Symbol | Value | Unit |
| Reynolds number | Re | 7.46 × 10⁶ | - |
| Froude number | Fr | 0.142 | - |
Table 4.
Resistance calculation results based on three grid sets.
Table 4.
Resistance calculation results based on three grid sets.
| Grid Type | Base Grid Size (m) | Grid Count | Resistance (N) | Error (%) |
|---|
| EFD | - | - | 36.37 | 0 |
| Coarse | 0.12919 | 2.35 M | 35.64 | −2.01 |
| Medium | 0.09135 | 3.32 M | 36.08 | −0.80 |
| Fine | 0.06459 | 4.70 M | 36.14 | −0.63 |
Table 5.
Hydrodynamic parameter results of propeller under three grid sets (J = 0.5).
Table 5.
Hydrodynamic parameter results of propeller under three grid sets (J = 0.5).
| Grid Type | Base Grid Size (m) | Grid Count | Thrust Coefficient (Kt) | Error (%) | Torque Coefficient (10 Kq) | Error (%) | Efficiency (η) | Error (%) |
|---|
| EFD | - | - | 0.1798 | 0 | 0.2479 | 0 | 0.5771 | 0 |
| Coarse | 0.12919 | 4.00 M | 0.176 | 2.11 | 0.249 | 0.44 | 0.555 | 3.83 |
| Medium | 0.09135 | 5.66 M | 0.180 | 0.11 | 0.252 | 1.65 | 0.561 | 2.79 |
| Fine | 0.06459 | 8.00 M | 0.182 | 1.22 | 0.253 | 2.06 | 0.565 | 2.10 |
Table 6.
Comparison between experimental data and simulation results for JBC ship model resistance.
Table 6.
Comparison between experimental data and simulation results for JBC ship model resistance.
| Vm (m/s) | Method | Total Resistance Coefficient (103 CT) | Frictional Resistance Coefficient (103 CF) | Residual Resistance Coefficient (103 CR) |
|---|
| 1.179 | EFD | 4.289 | 3.159 | 1.130 |
| CFD | 4.255 | 3.159 | 1.096 |
| Error (%) | −0.793 | 0 | −3.01 |
Table 7.
Comparison between numerical and experimental results for JBC ship model self-propulsion.
Table 7.
Comparison between numerical and experimental results for JBC ship model self-propulsion.
| Parameter | EFD | CFD | Error (%) |
|---|
| Resistance R (N) | 40.74 | 42.04 | 3.19 |
| Thrust deduction F (N) | 18.20 | 18.42 | 1.21 |
| Propeller thrust T (N) | 22.54 | 23.62 | 4.79 |
| Propeller torque Q (N·m) | 0.5845 | 0.6018 | 2.96 |
Table 8.
Variables and their variation ranges.
Table 8.
Variables and their variation ranges.
| Variable | Description | Lower Bound | Upper Bound |
|---|
| Camber | Airfoil camber (2D profile curvature) | 0.03 | 0.065 |
| Camber_Pos | Maximum camber position (2D profile) | 0.5 | 0.65 |
| Chord_Length | Airfoil chord length (2D profile) | 0.1 | 0.15 |
| Thickness | Airfoil thickness (2D profile) | 0.08 | 0.13 |
| DY | Distance from gate rudder leading edge to propeller disk plane | 0.005 | 0.025 |
| DX | Clearance between gate rudder and propeller blade | 0 | 0.055 |
Table 9.
Sample parameters.
Table 9.
Sample parameters.
| Sample | Camber | Camber_Pos | Chord_Length | Thickness | DY | DX |
|---|
| 1 | 0.0475 | 0.6 | 0.09 | 0.125 | 0.0275 | 0.025 |
| 2 | 0.05625 | 0.55 | 0.095 | 0.1125 | 0.02125 | 0.0375 |
| 3 | 0.03875 | 0.65 | 0.085 | 0.1375 | 0.03375 | 0.0125 |
| 4 | 0.043125 | 0.575 | 0.0925 | 0.10625 | 0.030625 | 0.00625 |
| 5 | 0.060625 | 0.675 | 0.0825 | 0.13125 | 0.018125 | 0.03125 |
| 6 | 0.051875 | 0.525 | 0.0875 | 0.11875 | 0.036875 | 0.04375 |
| 7 | 0.034375 | 0.625 | 0.0975 | 0.14375 | 0.024375 | 0.01875 |
| 8 | 0.0365625 | 0.5625 | 0.08625 | 0.134375 | 0.0384375 | 0.003125 |
| 9 | 0.0540625 | 0.6625 | 0.09625 | 0.109375 | 0.0259375 | 0.028125 |
| 10 | 0.0628125 | 0.5125 | 0.09125 | 0.146875 | 0.0321875 | 0.040625 |
| 11 | 0.0453125 | 0.6125 | 0.08125 | 0.121875 | 0.0196875 | 0.015625 |
| 12 | 0.0409375 | 0.5375 | 0.09875 | 0.128125 | 0.0228125 | 0.009375 |
| 13 | 0.0584375 | 0.6375 | 0.08875 | 0.103125 | 0.0353125 | 0.034375 |
| 14 | 0.0496875 | 0.5875 | 0.08375 | 0.140625 | 0.0165625 | 0.046875 |
| 15 | 0.0321875 | 0.6875 | 0.09375 | 0.115625 | 0.0290625 | 0.021875 |
| 16 | 0.0332812 | 0.59375 | 0.096875 | 0.120313 | 0.0360938 | 0.0265625 |
| 17 | 0.0507812 | 0.69375 | 0.086875 | 0.145313 | 0.0235938 | 0.0015625 |
| 18 | 0.0595313 | 0.54375 | 0.081875 | 0.107813 | 0.0298437 | 0.0140625 |
| 19 | 0.0420312 | 0.64375 | 0.091875 | 0.132812 | 0.0173438 | 0.0390625 |
| 20 | 0.0464063 | 0.51875 | 0.089375 | 0.114062 | 0.0267187 | 0.0328125 |
| 21 | 0.0639062 | 0.61875 | 0.099375 | 0.139063 | 0.0392187 | 0.0078125 |
| 22 | 0.0551562 | 0.56875 | 0.094375 | 0.101562 | 0.0204688 | 0.0203125 |
| 23 | 0.0376563 | 0.66875 | 0.084375 | 0.126562 | 0.0329687 | 0.0453125 |
| 24 | 0.0354688 | 0.53125 | 0.090625 | 0.142187 | 0.0189062 | 0.0296875 |
| 25 | 0.0529688 | 0.63125 | 0.080625 | 0.117188 | 0.0314062 | 0.0046875 |
| 26 | 0.0617188 | 0.58125 | 0.085625 | 0.129688 | 0.0251563 | 0.0171875 |
| 27 | 0.0442188 | 0.68125 | 0.095625 | 0.104688 | 0.0376563 | 0.0421875 |
| 28 | 0.0398437 | 0.55625 | 0.083125 | 0.148438 | 0.0282813 | 0.0359375 |
| 29 | 0.0622656 | 0.628125 | 0.0946875 | 0.110156 | 0.0286719 | 0.0445313 |
| 30 | 0.0535156 | 0.578125 | 0.0996875 | 0.147656 | 0.0224219 | 0.0320312 |
| 31 | 0.0360156 | 0.678125 | 0.0896875 | 0.122656 | 0.0349219 | 0.00703125 |
| 32 | 0.0382031 | 0.515625 | 0.0959375 | 0.107031 | 0.0239844 | 0.0164063 |
Table 10.
Calculation results for minimum-torque sample.
Table 10.
Calculation results for minimum-torque sample.
| Configuration | Hull Resistance (N) | Rudder Resistance (N) | Total Resistance (N) | Thrust (N) | Torque (N·m) |
|---|
Rudderless
Gate Rudder | 42.04 | — | 42.04 | 23.62 | 0.6018 |
| 42.50 | −2.85 | 39.65 | 20.38 | 0.5577 |
Table 11.
Key parameters of the gate rudder.
Table 11.
Key parameters of the gate rudder.
| Parameter | Value |
|---|
| Airfoil Type | Asymmetric |
| Camber | 0.053 |
| Thickness | 0.117 |
| Maximum Camber Position | 0.631 |
| Chord Length | 0.8 R |
| Propeller–Rudder Clearance | 0.2 R–0.35 R |
Table 12.
Resistance components for different configurations.
Table 12.
Resistance components for different configurations.
| Fr = 0.142 | R (N) | R0 (N) | RGR (N) | RCR (N) |
|---|
| Bare Hull | 36.081 | 36.081 | — | — |
| With Conventional Rudder | 35.97 | 35.802 | — | 0.168 |
| With Gate Rudder | 37.095 | 36.889 | 0.206 | — |
Table 13.
Comparison of hydrodynamic performance calculation results.
Table 13.
Comparison of hydrodynamic performance calculation results.
| Rudder Configuration | Hull Resistance (N) | Rudder Resistance (N) | Total Resistance (N) | Thrust T (N) | Torque Q (N·m) |
|---|
| No Rudder | 42.04 | — | 42.04 | 23.62 | 0.6018 |
| Conventional Rudder | 42.89 | 0.40 | 43.29 | 27.07 | 0.6860 |
| Gate Rudder | 42.50 | −2.85 | 39.65 | 20.38 | 0.5577 |
Table 14.
Resistance components under different rudder configurations.
Table 14.
Resistance components under different rudder configurations.
| Rudder Configuration | Total Resistance (N) | Frictional Resistance (N) | Residual Resistance (N) |
|---|
| No Rudder | 42.04 | 25.89 | 16.15 |
| Conventional Rudder | 43.29 | 26.34 | 16.95 |
| Gate Rudder | 39.65 | 26.22 | 13.43 |
Table 15.
Overlapping grid calculation results.
Table 15.
Overlapping grid calculation results.
| Rudder Configuration | Total Resistance (N) | Frictional Resistance (N) | Viscous Pressure Resistance (N) |
|---|
| No Rudder | 40.71 | 26.25 | 14.46 |
| Gate Rudder | 35.63 | 26.52 | 9.11 |
Table 16.
Self-propulsion points for different rudder configurations.
Table 16.
Self-propulsion points for different rudder configurations.
| Rudder Configuration | Rotational Speed (rps) | Advance Coefficient (J) | Thrust (N) | Torque (N·m) |
|---|
| Conventional Rudder | 7.469 | 0.777 | 24.418 | 0.621 |
| Gate Rudder | 7.930 | 0.732 | 21.378 | 0.583 |
Table 17.
Numerical self-propulsion factor analysis results.
Table 17.
Numerical self-propulsion factor analysis results.
| Parameter | No Rudder | Conventional Rudder | Gate Rudder |
|---|
| 4.958 | 5.105 | 4.676 |
| n | 7.800 | 7.469 | 7.930 |
| J | 0.405 | 0.305 | 0.450 |
| KT | 0.219 | 0.258 | 0.2005 |
| 10KQ | 0.285 | 0.319 | 0.268 |
| 1 − t | 0.787 | 0.633 | 0.776 |
| 0.544 | 0.393 | 0.615 |
| 0.495 | 0.391 | 0.534 |
| 1.022 | 0.986 | 0.996 |
| 1.447 | 1.611 | 1.262 |
| 0.732 | 0.621 | 0.671 |


