Abstract
With the development of a power system predominantly reliant on new energy sources, turbine generator sets are increasingly required to operate under wide load conditions, resulting in numerous unstable flow phenomena and substantial economic losses for power stations. This study employs the Shear Stress Transport (SST) k-ω turbulence model to combine numerical simulations with experimental methods. It calculates the guide vane opening at the rated head of a Francis turbine and examines the internal flow field characteristics and pressure pulsations under various operating conditions. The findings indicate that the entropy production ratio in the draft tube is the highest among all load conditions, ranging from about 72.7% to 95.9%. Energy dissipation in the vaneless zone and the runner increases with greater opening. At 45% and 100% load conditions, the draft tube is mainly influenced by dynamic and static interference, single and double frequencies induced by runner rotation, and low-frequency fluctuations of the vortex and. Under 60% load conditions, pressure fluctuations in the draft tube are primarily caused by the eccentric vortex band, characterized by higher intensity and a frequency of 0.2 fn. Numerical results closely align with experimental observations. The findings provide essential guidance for ensuring the stable operation of power plant units.
1. Introduction
The construction and operation of hydropower projects are closely associated with energy supply, flood control safety, and the promotion of sustainable development at both national and regional levels. The water turbine generator set is a crucial component for hydropower energy production, and its stability significantly influences the overall safety and reliability of hydropower projects. With the establishment of new power systems dominated by renewable energy, hydropower generation is required to meet three key criteria: continuous regeneration, flexible regulation, and inertial support. These attributes enable hydropower to perform vital functions such as power grid adjustment and balancing intermittent renewable energy sources. However, the wide-load operation of turbine generator units introduces numerous unstable flow phenomena within the turbine, complicating power station operation and necessitating frequent maintenance. In severe cases, such instability may result in catastrophic damage to equipment and facilities, leading to significant economic losses.
Extensive numerical and experimental research has been conducted by scholars globally to analyze the internal pressure pulsation of hydraulic turbines. Chen et al. [1] discovered that variations in the active guide vane opening of a Francis turbine significantly influence the dynamic and static interactions within the vaneless region. Li et al. [2,3,4,5] conducted unsteady numerical simulations at the rated head for various guide vane openings, investigating the causes and characteristics of pressure pulsations across different flow components. Liang et al. [6,7,8,9,10] analyzed pressure pulsations within the vaneless region, while Ren et al. [11] studied the flow characteristics and pressure pulsations inside the draft tube of a Francis turbine running at its rated head with various guide vane openings. Wang et al. [12] conducted numerical simulations of the unsteady flow field and sound field in a Francis turbine with varying guide blade openings, revealing that pressure pulsations within the runner were primarily influenced by blade passing frequency and low-frequency pressure fluctuations. Zuo et al. [13], through numerical simulations and experimental methods, identified that pressure pulsations of varying frequencies were caused by different types of blade vortices, leading to a weaker pressure fluctuation at the midsection of the runner blade and a stronger fluctuation near the lower ring. Trivedi et al. [14] discovered that the amplitude of pressure pulsation in the vaneless zone and runner decreased when the turbine was shut down under steady-state best efficiency point (BEP) load conditions, compared to normal shutdown scenarios. Hu et al. [15], utilizing computational fluid dynamics (CFD) simulations, investigated the flow characteristics and pressure pulsation distribution of a turbine across five distinct operating conditions. Their analysis provided insights into the variation laws of pressure pulsations. Li et al. [16] employed numerical simulations to evaluate the performance of hydraulic turbines operating at different rotational speeds, concluding that an increase in speed broadened the turbine’s high-efficiency zone and significantly reduced pressure pulsations in the runner. Minakov et al. [17] employed the Detached-Eddy Simulation (DES) turbulence model to simulate unsteady turbulence within the channel of a high-head hydropower station, revealing that low-frequency pulsations in the runner were primarily attributed to the vortex region downstream of the runner. Jamali et al. [18] observed that pressure pulsations are more pronounced at lower power levels. Unterluggauer et al. [19] employed both experimental and numerical approaches to investigate the startup process of a prototype Francis turbine runner. They observed the formation of reverse-rotating vortices in the draft tube as the guide vanes opened. In most instances, four such vortices were found to be the primary cause of high-pressure pulsations. Kumar et al. [20] examined the formation of spiral vortex bands and their influence on hydraulic turbine performance, with a focus on the pressure pulsations caused by these structures. Joy et al. [21] discovered that the adjustable guide vane system in a high-head Francis turbine substantially reduced pressure pulsations and enhanced the operational flexibility of the turbine. Wang et al. [22] determined that pressure fluctuations in the draft tube are a primary factor contributing to hydraulic instability in Francis turbines. Yamamoto et al. [23] found that, under deep load conditions, cavitation eddies formed between the runner blades, causing both pressure pulsations and erosion. Wang et al. [24] employed the shear stress transport (SST) k-ω turbulence model coupled with the pressure implicit with the splitting of operators (PISO) algorithm to more accurately predict runner pressure pulsations. Platonov et al. [25] performed an experimental study to characterize the ground pressure pulsations in a Francis turbine, analyzing the flow structures downstream of the runner.
The hydraulic losses in a turbine are closely associated with factors such as friction losses, vortex motion, and backflow. Traditional assessment methods for hydraulic losses are unable to accurately determine their distribution and specific locations. While the entropy generation theory has been primarily applied to three-dimensional pumps, it remains underutilized in the study of Francis turbines. Compared with the traditional head loss coefficient based on pressure drop calculations, the local entropy generation rate more accurately reflects the physical flow losses. [26] Thus, the proper application of entropy production theory can also serve to assess flow losses in hydraulic machinery, providing a robust theoretical foundation for further enhancing the efficiency of the unit. Based on entropy production theory, Yu et al. [27,28,29] found that the vortex bands inside the draft tube rotate in the same direction as the flow passage, albeit at a lower angular velocity. This results in low-frequency, high-amplitude pressure pulsations within the draft tube. Wang et al. [30] developed a method for identifying the transmission path of fluid pressure pulsations by utilizing the time-delay transfer entropy method combined with wavelet theory. Zhou et al. [31] proposed an improved strategy to mitigate the formation of vortex bands, thereby reducing the associated pressure pulsations in the draft tube of the runner. Luo et al. [32] found that generation at the wall surface of the J-shaped groove and draft tube was significantly lower than that of the non-J-shaped groove. Additionally, the groove reduced the circumferential velocity component, leading to significant weakening of pressure pulsations and eddy current intensity within the conical section. Trived et al. [33] conducted comprehensive experimental and numerical investigations into pressure pulsations within the vaneless space, runner, and draft tube of Francis turbine.
Using the SST k-ω turbulence model, an analysis was performed to examine the flow field characteristics and pressure pulsations in units with varying guide vane openings. The results were compared with experimental data to evaluate the impact of guide vane openings on unit stability, providing insights to support the stable operation and maintenance of Francis turbines.
2. Mathematical Model
2.1. Fundamental Governing Equation
The flowing medium inside the turbine can be regarded as an incompressible fluid, so its basic equation can be expressed as:
Continuum equation:
Momentum equation:
where t is time, u is the fluid velocity, ρ is the fluid density, p is the pressure, g is the gravitational acceleration, ν is the viscosity coefficient of fluid motion, x is the coordinate. The subscripts i and j are coordinate tensors.
2.2. Turbulence Model
The SST k-ω turbulence model is widely employed in fluid machinery due to its robustness. Numerous experts and scholars have utilized this model to investigate the internal flow field and stability of Francis turbines and pumps. By integrating vortex characteristics, entropy production theory, and pressure pulsation analysis, they have gained deeper insights into the performance and reliability of these machines [34,35,36,37].
When simulating turbulent flow, the SST k−ω model automatically applies the standard k−ω model in the near wall region, and automatically switches to the standard k−ω model in the far field. The transport term of turbulent shear stress is reflected in the equation of SST k−ω model, which is widely used in the unsteady flow simulation of rotary hydraulic machinery such as water turbines. Its expression is as follows:
k equation:
ω equation:
where Pk is the turbulent kinetic energy generation term, Pω is the turbulent dissipation term, F1 is a mixed function, νt is the turbulent eddy viscosity, and β, β*, σk, σω and σω2 are turbulent model constants.
3. Construction of Geometric Model and Division of Mesh
3.1. Three-Dimensional Geometrical Model
The geometric model of the complete flow channel for the Francis turbine at the research power station was developed using Unigraphics NX 12.0 modeling software. The design specifications of the turbine are detailed in Table 1, and the three-dimensional model of the water body within the turbine’s full channel is illustrated in Figure 1.

Table 1.
Design Parameters of Hydraulic Turbines.
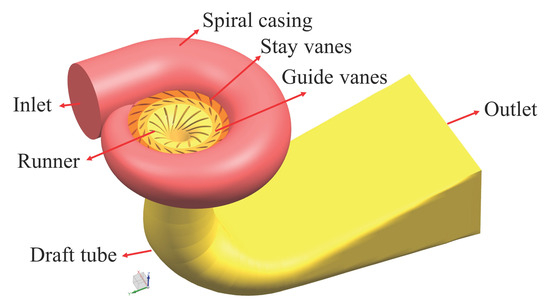
Figure 1.
The 3D water body model of the hydraulic turbine.
3.2. Grid Division and Independence Verification
Meshing was conducted using Ansys ICEM and Ansys Workbench Mesh. Due to the intricate geometry of the turbine flow components, including the runner blade, which is a three-dimensional twisted surface with an irregular shape, and the draft tube, which exhibits a complex flow pattern prone to vortex formation, a structural grid was applied. For the volute, fixed guide vane, and movable guide vane, an unstructured mesh was used, with local encryption in areas of interest. This approach reduces numerical calculation time while ensuring accuracy. The complexity of the runner structure is depicted in Figure 2. Grid independence verification for water intake head and efficiency demonstrated that when the grid count reached 12.1 million, further increases in the number of grids had minimal impact on improving calculation accuracy, with the water head and efficiency stabilizing, as shown in Figure 3. Therefore, 12.1 million grids were selected for the flow calculations.
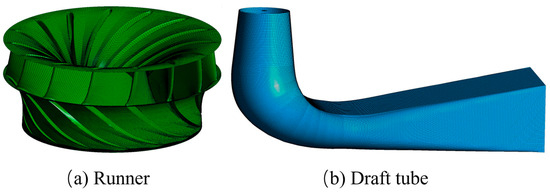
Figure 2.
Component grid.
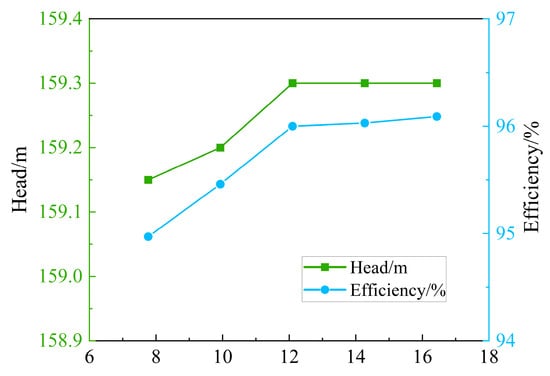
Figure 3.
Verification of Grid Independence.
3.3. Boundary Condition
The calculation employed velocity inlet and static pressure outlet. All solid walls were set as non-slip boundaries. Transient calculations used the results from steady-state analysis as the initial conditions. Each 2° rotation of the runner was taken as a time step, with 180° corresponding to one period, and the runner’s rotational frequency was fn = 4.54 Hz. The time step for one revolution was 0.22 s, with a step length of 0.001 s. The total simulation time for 20 revolutions was 4.4 s, and the convergence criterion for the results was set to 10−5.
4. Analysis of Calculation Results
To evaluate internal flow behavior and stability variations in the turbine under different guide vane openings, three load conditions were selected, corresponding to a rated head of 159.3 m and guide vane openings of 45%, 60%, and 100%. As shown in Figure 4, the calculated results closely match the experimental data, with all errors remaining within 0.5%.
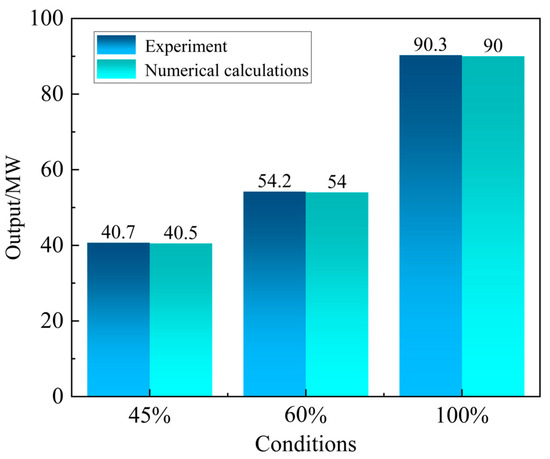
Figure 4.
Comparison of test results with numerical results.
According to the second law of thermodynamics, entropy generation is an inevitable and irreversible process in energy conversion. Due to fluid viscosity, Reynolds stress, and turbulence, mechanical energy is invariably transformed into internal energy [38]. From a thermodynamic standpoint, the energy loss within the internal flow of a Francis turbine can be assessed using the entropy production method. In turbulent flows, the total local entropy production rate includes contributions from both the time-averaged motion and the turbulence-induced entropy production rate, as demonstrated in Equations (5)–(7). It is worth noting that the contribution from the time-averaged motion is minimal and can be disregarded [27,39]. CFX post is used to edit and input the entropy yield formula, and then form a new variable for entropy yield calculation.
where is total entropy production rate; is entropy production rate induced by time-averaged movement; is entropy production induced by velocity fluctuations. T is temperature; ui’ is turbulent fluctuation velocity; is time-averaged velocity; i means the three directions in the Cartesian coordinate system (i = 1, 2, 3); μ is effective dynamic viscosity.
Thus, the draft tube exhibits the highest proportion of entropy production across all load conditions, ranging from approximately 72.7% to 95.9%, as shown in Figure 5. Conversely, the entropy production in the volute, stay vanes, and guide vanes regions is minimal, particularly under the 45% load condition.
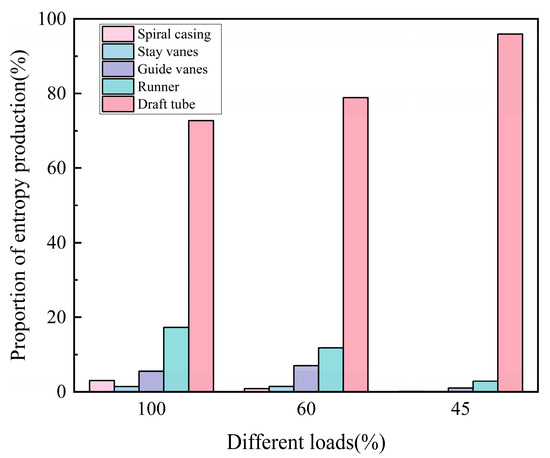
Figure 5.
Distribution of Turbulent Entropy Production for Each Component.
4.1. Internal Flow Field Analysis
The comparison of energy losses at different loads is shown in Table 2
Table 2.
Comparison of energy losses at different loads.
4.1.1. Vaneless Space
As the load increases, the region of high entropy production in the vaneless zone progressively expands, as illustrated in Figure 6. Wake loss and flow separation are primary contributors to the increased entropy production in the guide vane region. The high-velocity flow within the vaneless region generates a significant velocity gradient. As the flow rate increases, the vortex motion and backflow, which result from flow separation, become more prominent in specific flow paths of the guide vanes. This leads to flow path blockage. At 60% load, the entropy production around the stay vane is higher than that at 45% and 100%. In the case of 100% loading, the entropy production near the top and bottom of the guide vane is higher than that in the middle area.
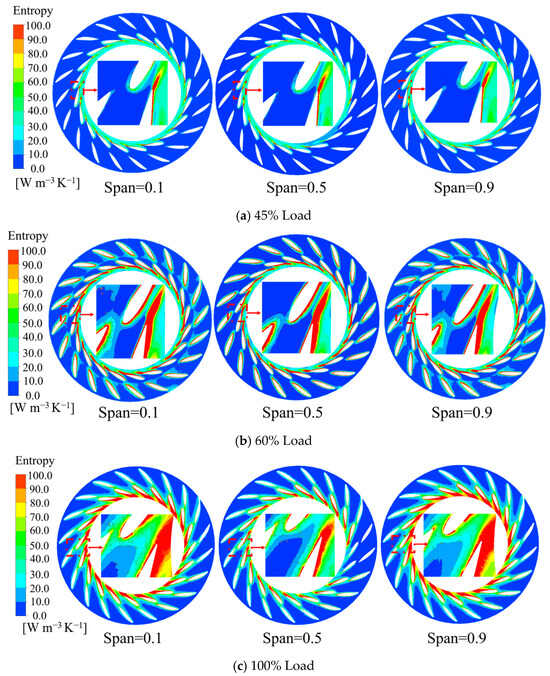
Figure 6.
Distribution of Entropy Production of the Guide Vane under Different Loads and Blade Heights.
4.1.2. Runner
As a primary contributor to hydraulic loss in the turbine unit, entropy generation was analyzed across single rotating surfaces with varying spread directions using blade-to-blade analysis. Three flow surfaces, labeled Span0.1, Span0.5, and Span0.9, are defined from the lower shroud to the upper crown of the flow passage, as illustrated in Figure 7. Across all load conditions, high entropy production on the runner blades was predominantly concentrated at the inlet and outlet of the suction surface. Entropy production near the lower circulation surface was greater than that near the upper crown. The primary cause of entropy generation at the blade inlet was the significant impact of inlet flow on the leading edge of the runner blade, which induced local backflow and substantial hydraulic loss. At the blade outlet, hydraulic losses arose from the high velocity cycle and a notable increase in entropy production.
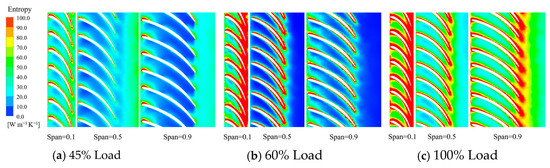
Figure 7.
Entropy Production of the Runner under Different Loads.
Flow separation begins at the inlet of the runner blade and extends from the upper crown to the lower ring, as illustrated in Figure 8. Near the blade inlet at the upper crown, flow separation was minor, with limited reflux observed at the blade’s leading edge. However, as the reflux region expanded and moved, flow separation intensified. With increasing guide vane opening, the extent of flow separation in the runner channel decreased and shifted toward the blade’s trailing edge. The yellow squares mainly mark the small swirls at the edge of the blade intake.
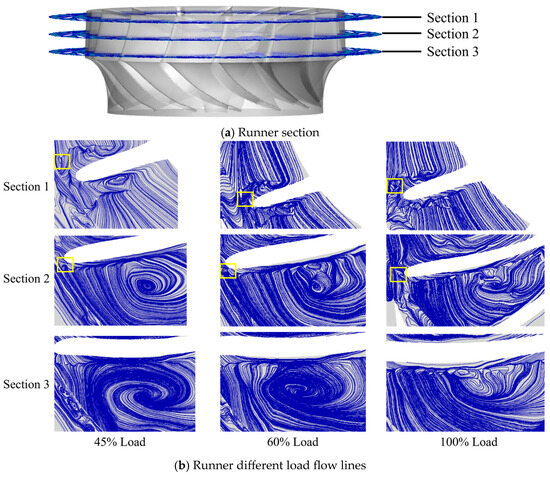
Figure 8.
Runner section local flow diagram.
4.1.3. Draft Tube
The pressure pulsations induced by the eccentric vortex zone in the draft tube constitute a primary source of unit oscillations. Energy losses arise from the precession of the vortex, velocity-induced diffusion near the walls, and secondary flows within the draft tube. Hydraulic losses can be mitigated through measures such as filling the draft tube, modifying the water flow within it, or controlling the eccentricity of the vortex core.
Figure 9 illustrates the distribution of entropy production in the draft tube. Under partial load conditions (non-rated conditions), areas of high entropy production are primarily concentrated at both ends of the straight cone section and the two ends of the elbow section. In contrast, under rated load conditions, these regions are symmetrically distributed in the central area of the straight conical section, exhibiting lower entropy production compared to partial load conditions.
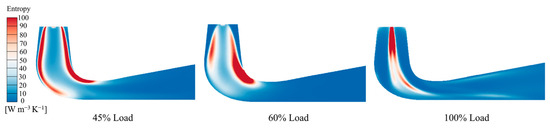
Figure 9.
Entropy Production within the Draft tube.
Figure 10 shows the cross-sectional view of the draft tube. The tangential velocity near the wall is obviously higher than the center velocity in the straight cone section of the draft tube, which results in a significant swirl intensity. This effect is more pronounced as the guide vane opening increases, resulting in the formation of a vortex zone near the wall, as shown in Figure 11a,b. The secondary flow resulting from the vortex zones in the elbow section leads to increased hydraulic losses within the draft tube. Under partial load conditions, the vortex centers at different cross-sections exhibit continuous movement and variation, with the changes in flow lines aligning with regions of high entropy generation. Minimizing the secondary flow near the wall vortex zones in both the vertical cone section and the elbow section can help reduce hydraulic losses within the draft tube during partial load conditions. Under rated load conditions, as the inlet flow velocity of the draft tube increases, the downstream centerline flow velocity remains stable, while the range of maximum flow velocities narrows. The vortex center remains stable, facilitating the formation of a single cylindrical vortex zone, as shown in Figure 11c. Compared to the entropy generation distribution, secondary recirculation in the elbow section is nearly eliminated.
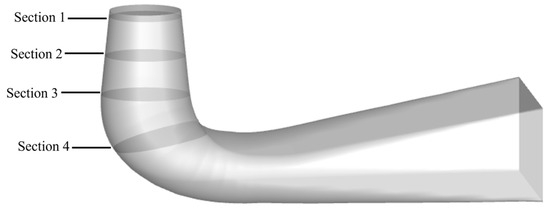
Figure 10.
Inner section of draft tube.
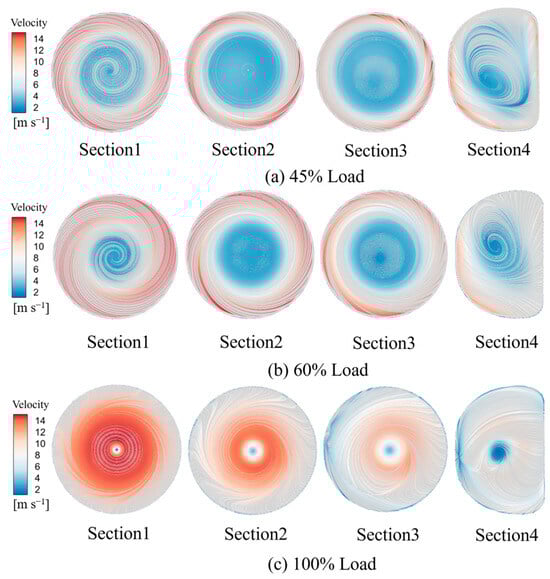
Figure 11.
Flow Lines of Each Section of the Draft tube.
4.2. Pressure Pulsation Analysis
The comparison of pressure pulsations under different loads is shown in Table 3.
Table 3.
Comparison of pressure pulsations under different loads.
4.2.1. Monitoring Point Setting
To monitor transient variations in runner pressure pulsation, monitoring points were strategically arranged along the turbine’s key flow paths. The monitoring points include SG (stay vane to guide vane) and GR (guide vane to runner), representing the vaneless area, R (runner) for the runner flow path located at 50% blade height, and DT (draft tube) for the draft tube, as shown in Figure 12.
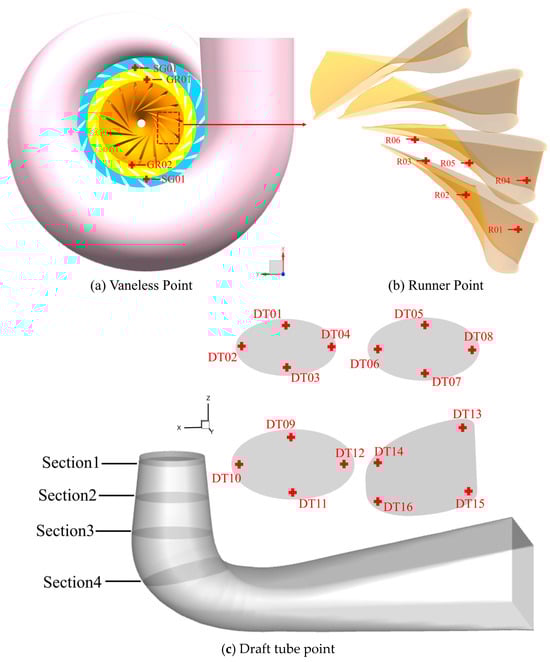
Figure 12.
Monitoring Point for the Francis Turbine.
The pressure pulsation intensity of the Francis turbine was quantified using the pulsation coefficient Cp, calculated as:
where pi is the pressure at point i, Pa; is the average pressure, Pa; and H is the water head, m.
In the unsteady computations, one time step was taken for every 2° rotation of the runner. With a rotational speed of 272.7 rpm (4.54 Hz), pressure pulsation data from the last five periods were extracted. Using the fast Fourier transform (FFT), the time-domain signals were converted to the frequency domain, allowing discrimination of pulsation amplitudes across different frequencies and identification of the pulsation sources.
4.2.2. Vaneless Space
Across all load conditions, the pressure pulsation coefficient near the runner monitoring point was observed to be high, with a peak at the primary frequency of 15. This is due to uneven pressure distribution caused by the runner’s periodic rotation through the vaneless area. A more severe uneven pressure distribution results in higher pulsation amplitudes, as depicted in Figure 13. As the guide vane opening (load) increases, the decreasing gap between the guide vanes and the flow passage results in a rise in pulsation amplitude and enhanced dynamic-static interference. Additionally, at the 60% load condition, a low-frequency pressure pulsation at 0.2 fn was observed, attributed to the strong vortex band formation in the draft tube.
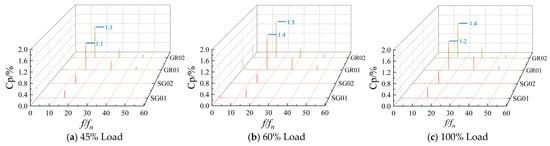
Figure 13.
Pressure Pulsation in Vaneless space under Different Loads.
4.2.3. Runner
Figure 14 illustrates the pressure pulsation variations within the runner. The results indicate that the pressure pulsations in this region are primarily caused by dynamic-static interference, with the maximum pulsation amplitude concentrated at the runner inlet. The dominant frequency of these pulsations is 20 fn. The pressure pulsation decreases progressively downstream. A single frequency generated by the rotation of the runner itself is evident under all three operating conditions. At 60% load, low-frequency pressure pulsations with a frequency of 0.8 fn are observed, increasing gradually from the inlet to the outlet. It shows that under this working condition, the pressure fluctuation generated by the eccentric vortex belt in the tailpipe propagates upstream and the low-frequency pressure fluctuation generated by the vortex inside the runner is caused by the combined action, resulting in the internal flow disorder and unstable operation of the runner. Under 100% load, the pressure pulsation amplitude is higher compared to the other two operating conditions.
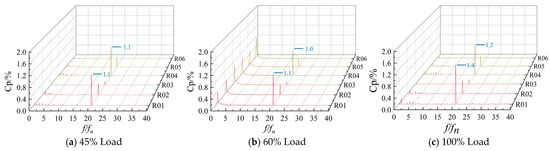
Figure 14.
Pressure Pulsation of Runner under Different Loads.
4.2.4. Draft Tube
According to the principle of vortex motion, under partial load, when the (Q is the flow rate, is the potential equal ring, and R is the radius of the tube) value is small, to a certain extent, there will be reflux in the center of the vortex, and the reflux will flow into the runner blade flow channel and then flow out of the flow channel. The main flow and return flow form a velocity triangle in the flow channel of the runner blades. In this way, the sudden jump in velocity and the change of direction in the flow channel will form a flow discontinuity in both the axial and axial directions, which will become the source of vortex formation. Due to the vortices formed by the circumferential velocity being opposite to the runner’s rotation direction, while those formed by the axial velocity are aligned with it, two phenomena occur at the draft tube inlet: on one hand, a forced vortex forms at the axis center; on the other hand, an axially symmetric vortex ring is generated by the backflow at the blade outlet. In actual operation, various factors prevent the vortex rings from being perfectly axially symmetric, leading to induced axial velocities that cause the original central vortex to deviate from its initial position. This deviation marks the onset of helical vortex formation.
Figure 15 illustrates the variations in pressure pulsation in the draft tube under different operating conditions. It is evident that under 45% and 100% load conditions, the draft tube is primarily affected by dynamic and static interference, the double frequency generated by runner rotation, and low-frequency pressure pulsations induced by the vortex band. The pressure pulsation amplitude with a main frequency of 0.2 fn is notably higher than under other conditions. The amplitude increases progressively from the inlet, reaches a peak at DT06, and then declines at DT13. This behavior occurs because, under these conditions, the vortex band in the draft tube is predominantly concentrated in the straight cone section, with only a portion extending into the elbow section. As a result of the interaction between the runner and the draft tube, the pressure pulsation amplitude is relatively high in the inlet section of the draft tube. The vortex zone entering this region emerges as a key factor contributing to the instability within the draft tube.
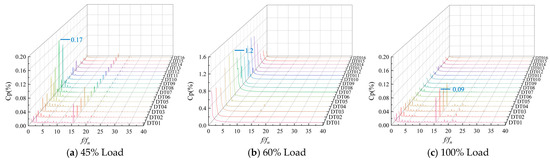
Figure 15.
Pressure Pulsation of Draft Tube under Different Loads.
To mitigate or eliminate the effects of pressure pulsation, several measures can be taken: installing a cross in the draft tube, extending the conical section of the draft tube, increasing the cone angle, adding water barriers and diversion partitions, or improving the design of the discharge cone.
5. Analysis of the Test Results
This evaluation employs a range of sensing elements to transform the non-electrical signals from various sections of the unit into electrical signals. These signals are then processed through electrical measurement techniques. The electrical signals are converted into data displayed on a computer, enabling analysis of the transformed signals. The principle underlying the stability test measurement is illustrated in Figure 16, while the field installation of the sensors is shown in Figure 17.
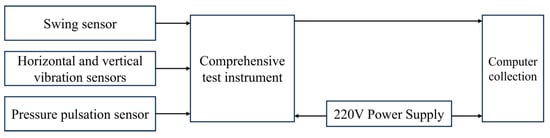
Figure 16.
Principle of test measurement.
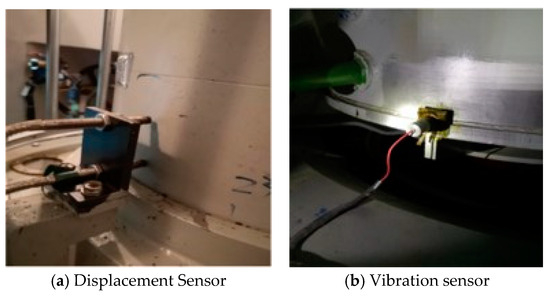
Figure 17.
Mounting Position of the Sensor.
5.1. Pressure Pulsation Within the Vaneless Region
The relative amplitude of pressure pulsation in the vaneless region ranges from 2% to 4.5%, as depicted in Figure 18. Within the output range of 40–60 MW (44%~67% load), the relative amplitude of pressure pulsation in this region initially increases and then decreases, aligning with the numerical simulation results. This trend indicates that during variations in opening, the force exerted by the runner on the guide vane becomes more pronounced, enhancing the radial and axial propagation of pressure pulsations and increasing the likelihood of hydraulic vibration. When the output exceeds 90 MW (100% load), the relative amplitude of pressure pulsation shows a tendency to rise.
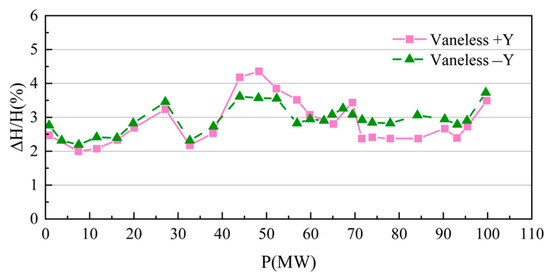
Figure 18.
Pressure Pulsation within the Vaneless Area under Various Working Conditions.
5.2. Pressure Pulsation of the Draft Tube
Figure 19 illustrates the test outcomes regarding the relative amplitude variations of draft tube pressure pulsation across different operating conditions. It is noted that the relative amplitude of these pressure pulsations varies between 0.5% and 5.5%. Overall, the pressure pulsation demonstrates a pattern of initially decreasing followed by an increase. Within the output range of 0–35 MW (below 40% load), the relative amplitude of pressure pulsation in the draft tube is influenced by the reduced flow rate at the runner outlet, which causes a reduction in the axial surface velocity at the runner outlet. Furthermore, a circular, tree-shaped vortex zone predominantly develops within the draft tube, leading to a significant relative amplitude of turbine pressure pulsation. In the output range of 35–70 MW (40%–78% load), the draft tube is mainly influenced by the eccentric vortex zone, which gradually diminishes as the guide vane opening increases. This behavior aligns closely with the results obtained from numerical simulations. At the output range of 80–90 MW (89%–100% load), the amplitude of pressure fluctuation in the draft tube remains relatively moderate, with no evidence of abnormal fluctuations. After 90 MW (100% load), the pressure pulsation demonstrates an upward trend.
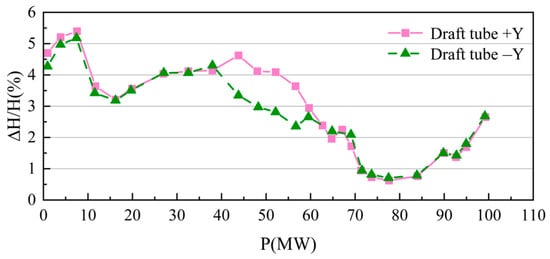
Figure 19.
Pressure Pulsation of the Draft Tube under Various Working Conditions.
6. Conclusions
The effect of guide vane opening on turbine pressure pulsation was evaluated by comparing computational results across different load conditions. These assessments were supported by pressure pulsation measurements taken on the model turbine testing platform. The primary findings and conclusions are as follows:
- The draft tube accounts for the majority of the turbine’s energy dissipation, ranging from about 72.7% to 95.9%. The peak dissipation occurs at the 45% load condition. The energy loss between the vaneless region and the runner is mainly due to backflow and eddy currents caused by flow separation. At full load (100%), the energy loss in the vaneless region and the runner exceeds that observed at 45% and 60% loads.
- The pressure fluctuations caused by the vortex belt are the primary contributors to the unstable operation of the unit. At 45% and 100% load conditions, the draft tube is mainly affected by dynamic and static interference, rotor-generated single and double frequencies, and low-frequency vortex belt oscillations. Under 60% load, the pressure pulsation in the draft tube is predominantly driven by the vortex band at a frequency of 0.2 fn, with its amplitude notably higher than that observed at 45% and 100% load conditions. Measures can be taken to reduce or eliminate hydraulic losses, such as introducing air into the draft tube, modifying the water flow within it, or controlling the eccentricity of the vortex belt.
- The relative amplitude of pressure pulsation in the draft tube ranged from 0.5% to 5.5%, markedly higher than that observed in the vaneless region. Additionally, the amplitude was more pronounced under partial load conditions, consistent with the findings from numerical simulations.
Author Contributions
S.L., C.D. and W.X. proposed the simulation method; S.L., J.P., X.Y. and X.L. completed the numerical simulation; S.L., J.P. and X.L. analyzed the data and wrote the paper. All authors have read and agreed to the published version of the manuscript.
Funding
The research was supported by the National Natural Science Foundation of China Regional Innovation and Development Joint Fund project “Air doping erosion reduction mechanism and control of cavitation wear coupling damage of pump turbine in high altitude area” (No: U23A20669).
Data Availability Statement
The original contributions presented in this study are included in the article. Further inquiries can be directed to the corresponding author.
Conflicts of Interest
Author Chenmei Dan, was employed by the company Sichuan Futang Hydropower Co., Ltd; Author Wenping Xiang and Xutao Yi were employed by the company Gongzui Hydropower General Plant Dadu River Co., Ltd. The remaining authors declare that the research was conducted in the absence of any commercial or financial relationships that could be construed as a potential conflict of interest.
Nomenclature
| SST | Shear Stress Transport |
| CFD | Computational Fluid Dynamics |
| DES | Detached-Eddy Simulation |
| BEP | Best Efficiency Point |
| SG | Stay vane to Guide vane |
| GR | Guide vane to Runner |
| R | Runner |
| DT | Draft Tube |
References
- Chen, H.; Lu, Y.; Liu, K.; Zhang, Z.; Li, H.; Huang, X.; Zhao, W.; Wang, Z. Study on the Internal Flow Characteristics of Long and Short Blade Runners of a 1000 MW Francis Turbine under Different Opening Conditions. Processes 2023, 11, 1796. [Google Scholar] [CrossRef]
- Li, S.; Yao, B.; Pang, J.; Liu, D.; Chengmei, D.; Jiang, D.; Wang, H.; Gang, Y.; Cheng, H.; Liu, X. Research on the technical improvement of the turbine runner of a power station based on improving stability. Energy Sci. Eng. 2024, 12, 4582–4597. [Google Scholar] [CrossRef]
- Pang, J.; Yao, B.; Liu, X.; Li, J.; Xiao, M.; Jiang, D.; Tang, W.; Zhou, L.; Lai, Z. Influence of guide vane opening on channel vortex and pressure pulsation in Francis turbine runners. Phys. Fluids 2024, 36, 043325. [Google Scholar] [CrossRef]
- Pang, J.; Liu, H.; Liu, X.; Yang, H.; Peng, Y.; Zeng, Y.; Yu, Z. Study on sediment erosion of high head Francis turbine runner in Minjiang River basin. Renew. Energy 2022, 192, 849–858. [Google Scholar] [CrossRef]
- Pang, J.; Chang, X.; Gang, Y.; Zhou, Z.; Xiang, W.; Zhou, L.; Liu, X.; Wang, Z. Design and Study of a Sediment Erosion Test Device for a Single-Flow Channel in the Guide Apparatus of a Reaction Hydraulic Turbine. J. Mar. Sci. Eng. 2024, 12, 777. [Google Scholar] [CrossRef]
- Liang, A.; Li, H.; Zhang, W.; Yao, Z.; Zhu, B.; Wang, F. Study on pressure fluctuation and rotating stall characteristics in the vaneless space of a pump-turbine in pump mode. J. Energy Storage 2024, 94, 112385. [Google Scholar] [CrossRef]
- Li, H.; Yang, J.; Zhang, W.; Hu, L.; Liang, A.; Yao, Z. Energy performance and unsteady gas-liquid flow characteristics of a multiphase rotodynamic pump: An experiment. Appl. Energy 2024, 375, 124112. [Google Scholar] [CrossRef]
- Hu, L.; Liang, A.; Li, H.; Zhang, W.; Zhu, B. Impact of rotor–stator axial spacing on the gas–liquid–solid flow characteristics of a multiphase rotodynamic pump based on the Euler multi-fluid model. Phys. Fluids 2024, 36, 063314. [Google Scholar] [CrossRef]
- Wang, H.; Pang, J.; Lai, Z.; Li, S.; Jiang, D.; Wang, X.; Xiang, P.; Yao, B.; Zeng, Y.; Liu, X. Influence of guide vane skirt structure on sediment erosion of high-head turbine in high hardness and sandy river. Phys. Fluids 2024, 36, 103317. [Google Scholar] [CrossRef]
- Wang, H.; Pang, J.; Liu, X.; Zhou, Z.; Gang, Y.; Lai, Z.; Wang, J.; Qin, B. Analysis on cause of erosion of guide vane of high-head Francis turbine in sandy river. Energy Sci. Eng. 2024, 12, 3704–3717. [Google Scholar] [CrossRef]
- Ren, H.; Yu, B.; Wang, K.; Wang, L. Analysis of Flow and Pressure Plusation in Draft Tube of Francis Turbine under Different Guide Vane Opening. Pearl River 2023, 44, 126–133. [Google Scholar]
- Wang, H.; Zheng, Y.; Sun, A.R. The influent of guide vane opening on pressure pulsation characteristics and flow- induced noise in Francis turbine. South-North Water Transf. Water Sci. Technol. 2018, 16, 186–192. [Google Scholar]
- Zuo, Z.; Liu, S.; Liu, D.; Qin, D.Q.; Wu, Y.L. Numerical analyses of pressure fluctuations induced by interblade vortices in a model Francis turbine. J. Hydrodyn. Ser. B 2015, 27, 513–521. [Google Scholar] [CrossRef]
- Trivedi, C.; Gandhi, K.B.; Cervantes, J.M.; Dahlhaug, O.G. Experimental investigations of a model Francis turbine during shutdown at synchronous speed. Renew. Energy 2015, 83, 828–836. [Google Scholar] [CrossRef]
- Hu, D.; Cheng, Y.; Zhang, P.; Wang, X.; Ding, J.; Zhang, X. Distribution features of flow patterns and pressure pulsations of pump-turbine in five operating modes on the four-quadrant plane. Front. Energy Res. 2022, 10, 880293. [Google Scholar] [CrossRef]
- Li, Y.; Zhang, L.; Chen, J.; Zhang, Z.; Jia, K.; Feng, K.; Wang, X. Influence of rotational speed on performance of low specific speed hydraulic turbine in turbine mode. Adv. Mech. Eng. 2022, 14, 16878132221100652. [Google Scholar] [CrossRef]
- Minakov, A.; Platonov, D.; Dekterev, A.; Sentyabov, A.V.; Zakharov, A.V. The numerical simulation of low frequency pressure pulsations in the high-head Francis turbine. Comput. Fluids 2015, 111, 197–205. [Google Scholar] [CrossRef]
- Jamali, R.; Sohani, A.; Hemmatpour, K.; Behrang, M.; Ghobeity, A. Experimental study of pressure pulsation in a large-scale hydropower plant with Francis turbine units and a common penstock. Energy Convers. Manag. X 2022, 16, 100308. [Google Scholar] [CrossRef]
- Unterluggauer, J.; Sulzgruber, V.; Doujak, E.; Bauer, C. Experimental and numerical study of a prototype Francis turbine startup. Renew. Energy 2020, 157, 1212–1221. [Google Scholar] [CrossRef]
- Kumar, S.; Cervantes, M.J.; Gandhi, B.K. Rotating vortex rope formation and mitigation in draft tube of hydro turbines–A review from experimental perspective. Renew. Sustain. Energy Rev. 2021, 136, 110354. [Google Scholar] [CrossRef]
- Joy, J.; Raisee, M.; Cervantes, M.J. Experimental investigation of an adjustable guide vane system in a Francis turbine draft tube at part load operation. Renew. Energy 2023, 210, 737–750. [Google Scholar] [CrossRef]
- Wang, W.; Chen, Q.; Yan, D.; Geng, D. A novel comprehensive evaluation method of the draft tube pressure pulsation of Francis turbine based on EEMD and information entropy. Mech. Syst. Signal Process. 2019, 116, 772–786. [Google Scholar] [CrossRef]
- Yamamoto, K.; Müller, A.; Favrel, A.; Avellan, F. Physical mechanism of interblade vortex development at deep part load operation of a Francis turbine. J. Fluids Eng. 2019, 141, 111113. [Google Scholar] [CrossRef]
- Wang, F.; Liao, C.; Tang, X. Numerical simulation of pressure fluctuations in a large Francis turbine runner. Chin. J. Mech. Eng. 2012, 25, 1198–1204. [Google Scholar] [CrossRef]
- Platonov, V.D.; Maslennikova, V.A.; Dekterev, A.D.; Minakov, A.V.; Abramov, A.V. Experimental study of pressure pulsations in the flow duct of a medium-size model hydroelectric generator with Francis turbine. Thermophys. Aeromechanics 2018, 25, 21–30. [Google Scholar] [CrossRef]
- Schmandt, B.; Herwig, H. Internal flow losses: A fresh look at old concepts. Fluids Eng.-Trans. ASME 2011, 133, 051201. [Google Scholar] [CrossRef]
- Yu, Z.-F.; Yan, Y.; Wang, W.-Q.; Liu, X.-S. Entropy production analysis for vortex rope of a Francis turbine using hybrid RANS/LES method. Int. Commun. Heat Mass Transf. 2021, 127, 105494. [Google Scholar] [CrossRef]
- Yu, Z.-F.; Wang, W.-Q.; Yan, Y.; Liu, X.-S. Energy loss evaluation in a Francis turbine under overall operating conditions using entropy production method. Renew. Energy 2021, 169, 982–999. [Google Scholar] [CrossRef]
- Yu, Z.-F.; Wang, W.-Q.; Yan, Y.; Wang, H.-Y.; Wu, W.-L. Evaluating energy-efficiency improvement of variable-speed operation with the help of entropy: A case study of low-head Francis turbine. Sustain. Energy Technol. Assess. 2022, 53, 102468. [Google Scholar] [CrossRef]
- Wang, S.; Zhang, L.; Yin, G.; Guan, C. Research on Unsteady Hydraulic Features of a Francis Turbine and a Novel Method for Identifying Pressure Pulsation Transmission Path. Water 2019, 11, 1216. [Google Scholar] [CrossRef]
- Zhou, X.; Wu, H.; Shi, C. Numerical and experimental investigation of the effect of baffles on flow instabilities in a Francis turbine draft tube under partial load conditions. Adv. Mech. Eng. 2019, 11, 1687814018824468. [Google Scholar] [CrossRef]
- Luo, Z.; Nie, C.; Lv, S.; Guo, T.; Gao, S. The effect of J-groove on vortex suppression and energy dissipation in a draft tube of Francis turbine. Energies 2022, 15, 1707. [Google Scholar] [CrossRef]
- Trivedi, C.; Cervantes, J.M.; Gandhi, K.B. Investigation of a High Head Francis Turbine at Runaway Operating Conditions. Energies 2016, 9, 149. [Google Scholar] [CrossRef]
- Liu, D.; Li, Z.; Xu, L.; Li, J.; Yang, Y.; Wang, X.; Pang, J.; Liu, X. Vortex motion in vaneless space and runner passage of pump-turbine in S-shaped region. Phys. Fluids 2024, 36, 025115. [Google Scholar] [CrossRef]
- Xu, L.; Kan, K.; Zheng, Y.; Liu, D.; Binama, M.; Xu, Z.; Yan, X.; Guo, M.; Chen, H. Rotating stall mechanism of pump-turbine in hump region: An insight into vortex evolution. Energy 2024, 292, 130579. [Google Scholar] [CrossRef]
- Zhang, D.; Wu, S.; Shi, W.; Pan, D.; Yao, J.; Zhang, G. Application and experiment of different turbulence models for simulating tip leakage vortex in axial flow pump. Editor. Off. Trans. Chin. Soc. Agric. Eng. 2013, 29, 46–53. [Google Scholar]
- Ren, Y.; Liu, H.; Shu, M.; Wu, X. Analysis of applicability of turbulence models in performance prediction for centrifugal pumps at the off-design conditions. Fluid Mach. 2012, 40, 18–22. [Google Scholar]
- Zhang, F.; Appiah, D.; Hong, F.; Zhang, J.; Yuan, S.; Adu-Poku, K.A.; Wei, X. Energy loss evaluation in a side channel pump under different wrapping angles using entropy production method. Int. Commun. Heat Mass Transf. 2020, 113, 104526. [Google Scholar] [CrossRef]
- Zhang, Z.; Lu, Y.; Zhu, R.; Wang, Z.; Li, X. Analysis of hydraulic loss and entropy production characteristics of 1000 MW Francis turbines under multi-operating condition. J. Drain. Irrig. Mach. Eng. (JDIME) 2024, 42, 1142–1149. (In Chinese) [Google Scholar]
Disclaimer/Publisher’s Note: The statements, opinions and data contained in all publications are solely those of the individual author(s) and contributor(s) and not of MDPI and/or the editor(s). MDPI and/or the editor(s) disclaim responsibility for any injury to people or property resulting from any ideas, methods, instructions or products referred to in the content. |
© 2025 by the authors. Licensee MDPI, Basel, Switzerland. This article is an open access article distributed under the terms and conditions of the Creative Commons Attribution (CC BY) license (https://creativecommons.org/licenses/by/4.0/).