Abstract
Fracturing flooding is a new technology that combines traditional conventional water drive, chemical drive, and hydraulic fracturing technologies and injects water under proximity fracture pressure to increase the wave area. It is currently applied in onshore low-permeability oilfields with good results, but the research on the design method of fracturing flooding in offshore low-permeability reservoirs is still lacking. Numerical simulation studies of well fracturing flooding are needed to optimize the key parameters of fracturing flooding development. This study simulates the real-time fracture dynamic expansion process of micro-level fracture expansion for hydraulic fracturing, combines it with a numerical simulation of well pressure-driving, and finally optimizes the parameters of hydraulic flooding. By studying the fracture expansion law, this study determined that the total amount of injection volume had a large influence on both fracture half-length and inflow capacity; the larger the injection rate, the larger the fracture half-length, but the inflow capacity was basically unchanged. It was also found that multiple rounds of fracturing flooding had no effect on fracture morphology or length. In studying the key fracturing flooding parameters in oil wells, it was concluded that the higher the total injection amount, the higher the oil increase in fracturing flooding and the wider the wave area of pressure-driving. Moreover, the higher the displacement, the higher the pressure near the bottom of the well, but there was little difference in the spreading area; in addition, the longer the well shut-in time, the higher the early oil production. Finally, these results were combined with the fracture expansion mechanism model and A21 well model, and the analysis of fracturing flooding parameters based on the simulation results allowed for the following recommendations to be made: the total amount of fracturing flooding injection should be 15,000 m3, the injection rate should be 6 m3/min, the simmering time should be 3–7 days, and only one round of fracturing flooding is required. The mechanism of fracture expansion revealed in this paper can guide the design of fracturing flooding programs in the process of reservoir fracturing flooding development, which is of some significance to the development of the fracturing flooding of offshore reservoirs with low permeability.
1. Introduction
As the global energy demand continues to grow, tight reservoirs with low permeability have become a major focus for the oil and gas industry [1]. However, their development is challenged by a lack of natural energy and rapidly declining production. Fracturing flooding is a new technology that combines traditional conventional water drive, chemical drive, and hydraulic fracturing technologies, and injects water at near-rupture pressure to increase the wave area, which in turn increases injection and production [2]. In recent years, fracturing flooding development has been carried out sequentially in onshore oilfields such as Jiangsu, Tuha, Shengli, and Daqing, and better field results have been achieved [3,4,5,6,7]. However, the optimization of fracturing flooding parameters and prediction of production capacity for offshore reservoirs are still inaccurate. There is still a gap in the research of fracturing flooding reservoir design methods for offshore, vertically fractured reservoirs with low permeability, and numerical simulation studies of fracturing flooding in offshore wells need to be carried out to optimize the parameters of fracturing flooding to guide reservoir development.
Conventional water drives have poor hydrodynamic connections, significant water intrusion and flooding, and fluid non-Darcy flow characteristics. These characteristics lead to dense reservoirs with low permeability, in which “injections cannot enter, and cannot be extracted” [8,9,10,11,12]. In the 1950s, several scholars began to study the basic theory of seepage and suction oil drives in fractured oilfields [13,14,15,16,17]. They obtained the relative permeability curves of repulsion and seepage–absorption types and put forward the model of a double porosity medium. Using this model, they analyzed the multiphase unsteady flow in the double medium to summarize the law of oil–water movement and the seepage–absorption mechanism. Hydraulic fracture technology plays a key role in the development of unconventional reservoirs, and studying the fracture characteristics can improve the flow environment of oil in the subsurface and the utilization of oil formation. Through fracture expansion, the dynamic process of petroleum development can be revealed, and researchers can finely characterize the development of reservoirs. Many scholars have already carried out extensive research on hydraulic fracturing through practical experiments and numerical simulations [18,19,20,21,22,23,24,25,26,27,28,29]. The theoretical mechanism of seepage oil drive and the extensive research on hydraulic fracturing have laid the theoretical foundation for the development of fracturing flooding technology.
Based on hydraulic fracturing. Zhang et al. [30] established a pressure-driven simulation model with quantitative characterization methods on the micron scale. They carried out physical modeling experiments to reveal the mechanism of increasing the pressure-driven injection rate and to deepen the understanding of fracturing flooding fracture expansion. Sun et al. [31] conducted physical modeling experiments via a true triaxial hydraulic fracturing platform to characterize fracture development during fracturing flooding, concluding that the fracture rupture pressure decreases gradually with an increasing injection rate. Zhang et al. [32] also reached similar conclusions in the study on overdrive fracturing flooding in the Shengli oilfield. Cha et al. [33] quantitatively described the fracture expansion caused by changes in geostress during pressure-driven water injection based on Biot’s linear elastic contact theory, using the virtual unit method and considering the effect of natural fractures. Yang et al. [34] selected samples from the mining area, carried out pressure-driving to create seams to increase the seepage law, and established a discrete seam network model, which concluded that pressure-driving would increase the formation pressure and weaken the sensitivity effect of the reservoir. However, the model was not the seam network model after fracturing flooding. In the optimization study of fracturing flooding parameters, some scholars used CMG software (version: 2022.10) to carry out numerical simulations. Da et al. [35] established an energy storage fracturing model to explain the fracturing energy enhancement mechanism during the period of well shut-in from a microscopic point of view. Zhang et al. [36] established a homogeneous mechanism model and optimized fracturing flooding parameters such as injection volume, total injection rate, and fracturing flooding timing, but lacked the study of well shut-in time. Cui et al. [37] coupled the fracture expansion model with the two-phase seepage model of tight reservoirs to establish a model of fracturing flooding water injection and investigated the dynamic characteristics of fracturing flooding development under the high-pressure constant and step-increasing discharge rates, respectively, which showed that the step-increasing discharge rate improves the injection water ripple area and that the effect is better. Lu et al. [38] conducted rock property tests to define fracturing coefficients, established a numerical model for the production capacity of oil–water phases in matrix–fracture media, and optimized fracture morphology under fracturing flooding conditions.
From the above studies, it can be seen that the research on the development technology of fracturing flooding mainly focuses on the physical simulation and mathematical characterization of hydraulic fracturing for onshore oilfields, numerical simulation methods of fracturing flooding, and optimization of parameters of fracturing flooding injection. However, there is still a gap in the research of fracturing flooding reservoir design methods for offshore, low-permeability reservoirs. The optimization of fracturing flooding parameters is incomplete, and these lead to inaccurate capacity prediction of offshore low-permeability fields. Numerical simulations of the fracturing flooding of offshore wells need to be carried out. In this study, we will take the Weizhou 12-2 oilfield as an example, apply the new reservoir numerical simulation software tNavigator (version: 24.2) to reveal the influence of fracture simulation for hydraulic fracturing expansion on the fracture from the micro level, simulate the real-time fracture dynamic expansion process, combine it with the numerical simulation of fracturing flooding of the oil well, and then optimize the parameters of fracturing flooding, which will guide the actual production and will be of some significance for the development of the fracturing flooding of offshore, low-permeability reservoirs.
2. Geological Profile
2.1. Regional Geological Characteristics
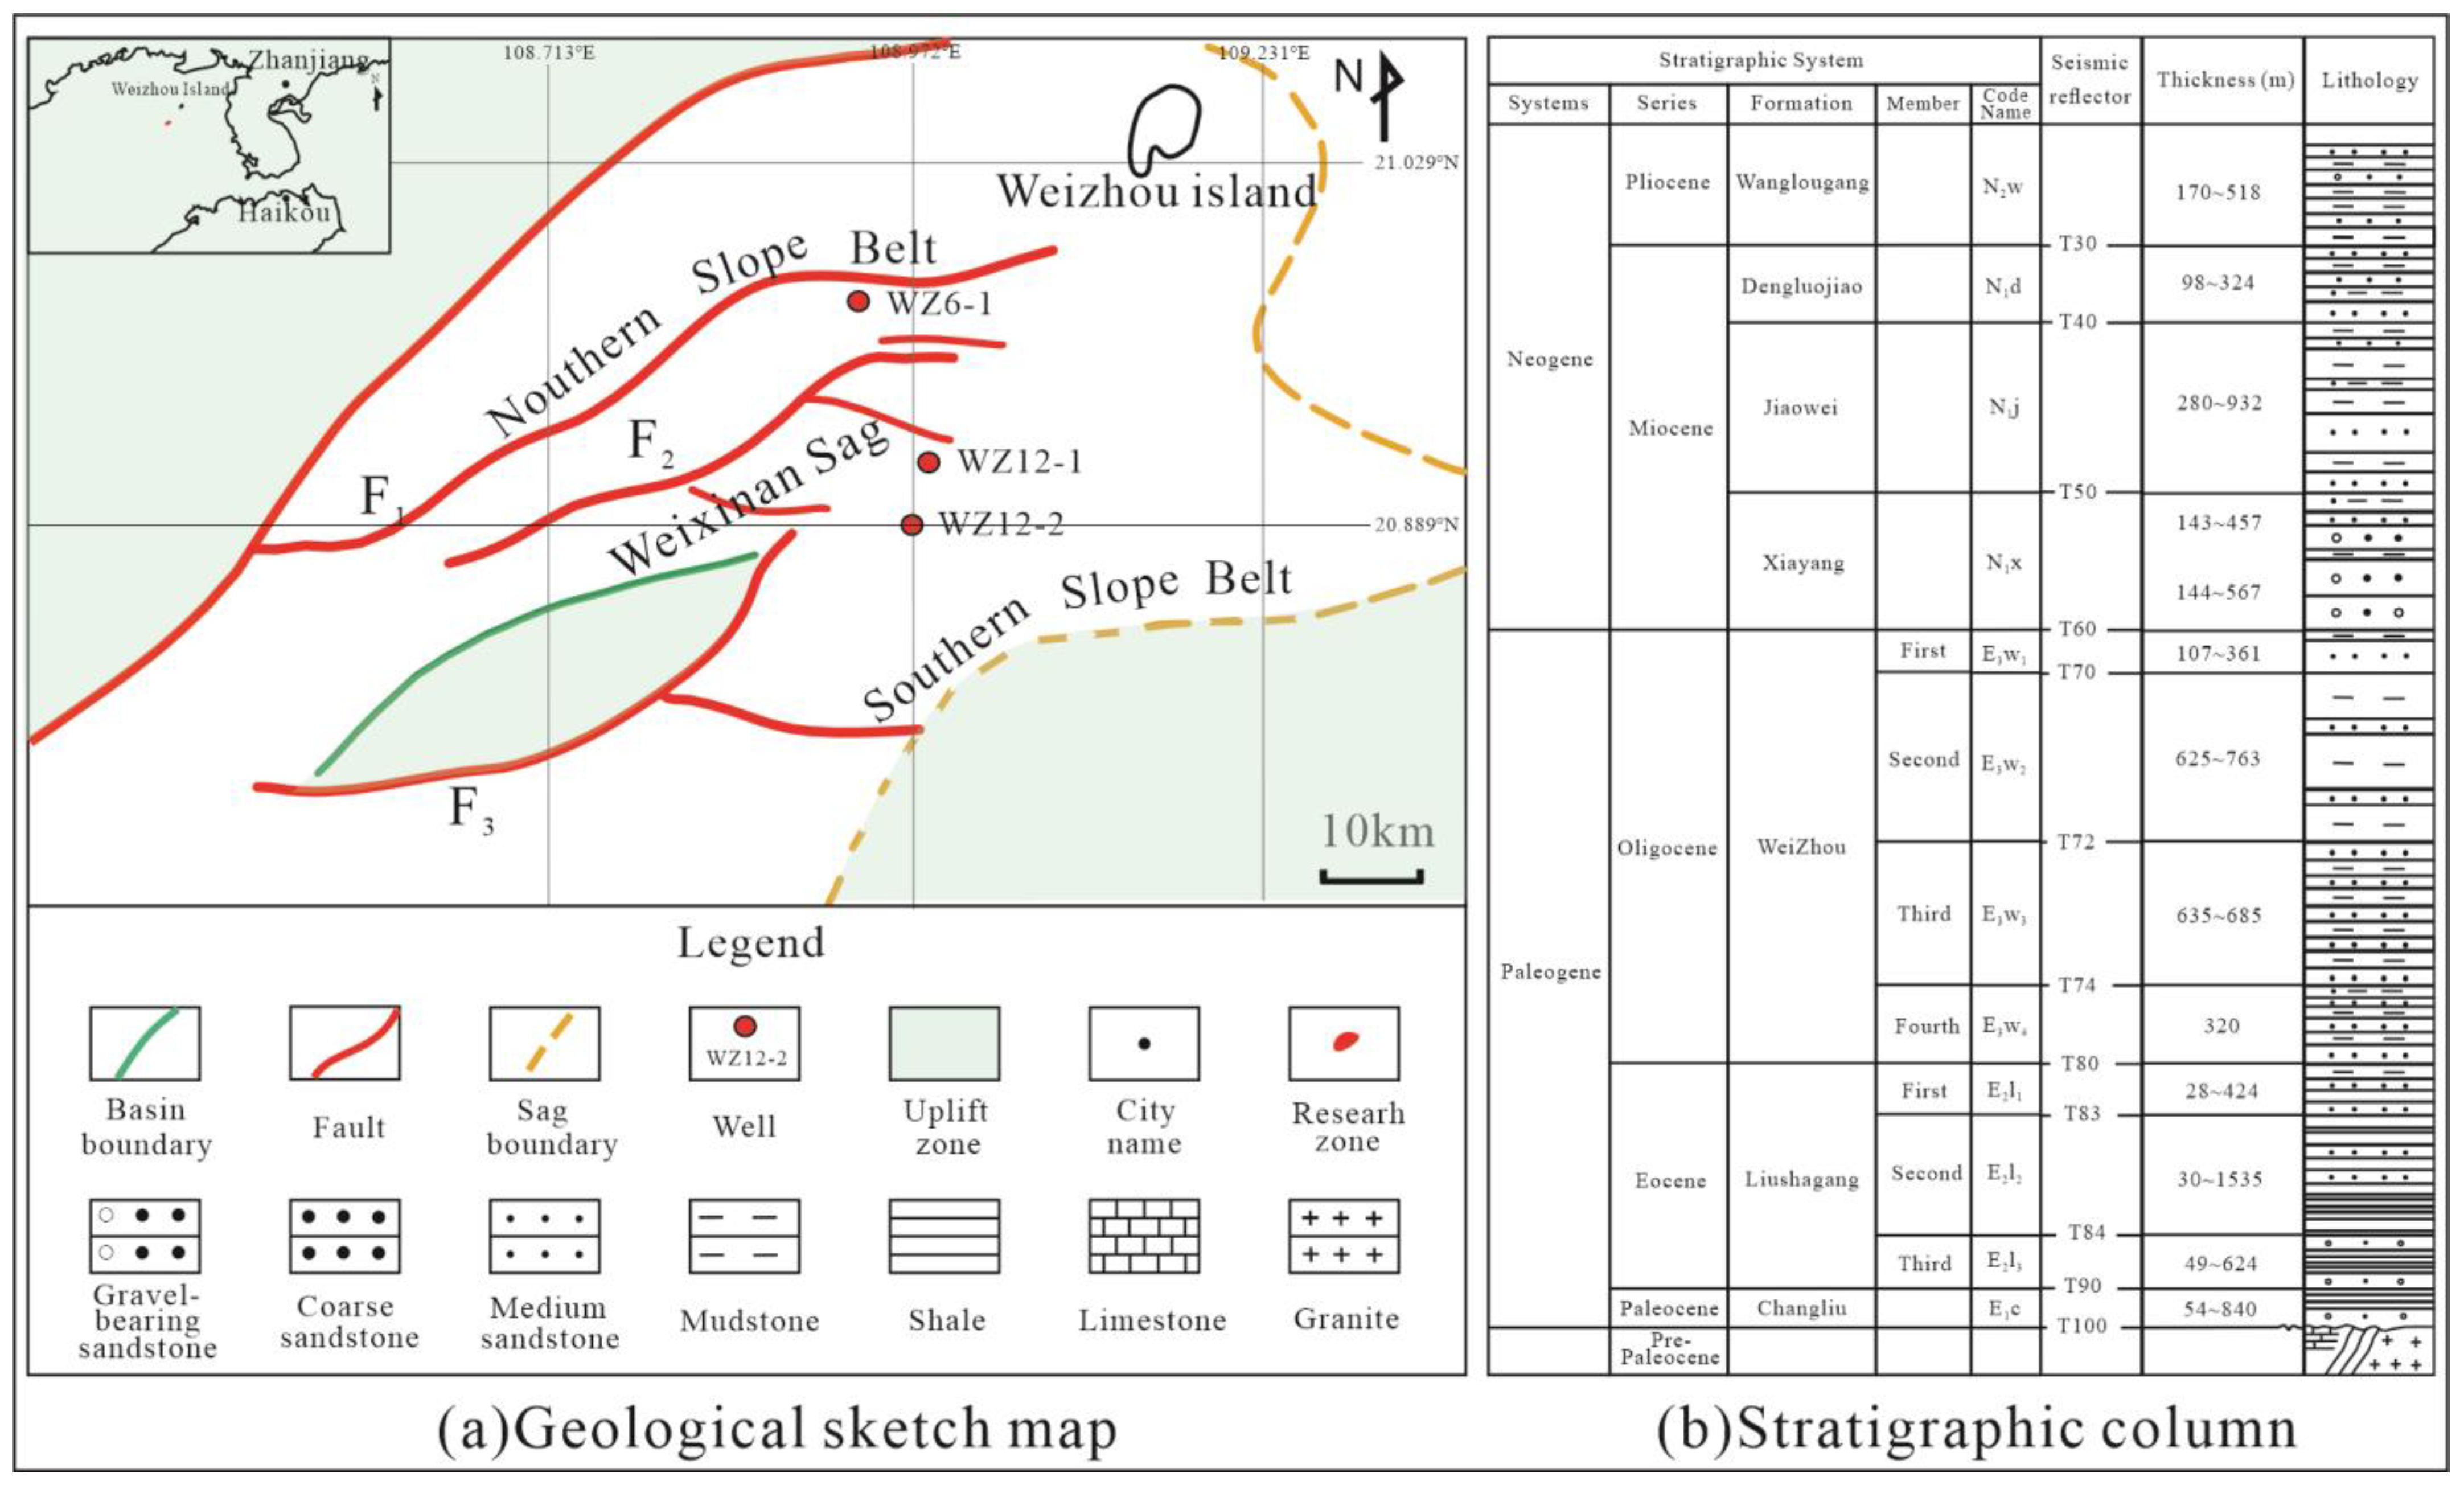
The Weixinan Depression, at the northwestern edge of the northern South China Sea, belongs to the tertiary tectonic unit of the Beibu Gulf Basin and is an important oil-producing area on the continental shelf in the northern part of the South China Sea. It is bounded by the Weixinan Fault in the northwest, adjacent to the Qixi Rise in the southeast, and separated from the Haizhong Depression by the Weixinan Low Bulge and the Haizhong Depression in the southwest, as shown in Figure 1a. During the Paleocene epoch, the depression deposited the Paleocene Changliu Formation, the Eocene Liushagang Formation, and the Oligocene Weizhou Formation. The Liusha section mainly consists of deltaic and fan-deltaic sedimentary bodies of conglomerate, conglomerate-bearing sandstone, and medium-fine sandstone, as shown in Figure 1b, which directly overlie the deep lake-phase hydrocarbon source rocks in Liusha section 2, dominated by mud shale, which is an advantageous area for oil and gas transportation and gathering and has high potential for exploration; it is the main oil reservoir under study [37].
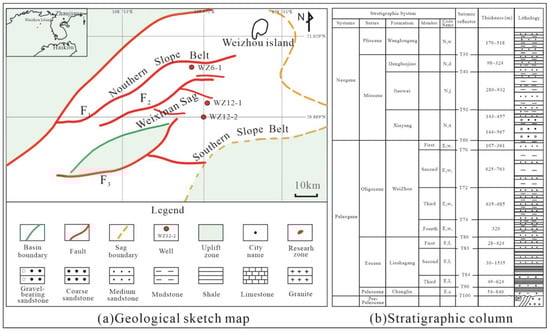
Figure 1.
Tectonic position of the Weisinan Depression in the Beibuwan Basin (a) and stratigraphic column (b) (Modified from [39]).
Geographically, the Weizhou 12-2 oilfield is located in the Beibu Gulf sea area of the South China Sea, 84.0 km away from Beihai City of Guangxi Province and 37.0 km away from Weizhou Island, with a water depth of about 37.0 m, an annual average temperature of 23 °C, and a maximum tidal range of 5.0 m in the sea area. The proven geologic reserves are 3244.79 × 104 m3; tectonically, it is a complex fault block field, with a high level to the east–south and a low level to the northwest, It is divided into north block, middle block, west block, and south block, and the developed blocks include middle block, west block 1, and west block 2 at present. The oil reservoir is vertically divided into three sets of oil-bearing systems, namely, flow section 1, flow section 2, and flow section 3, and only flow section 2 is being developed at present, with light crude oil as the main crude oil. The second section of the production flow includes two oil groups, the L2Ⅰ and L2Ⅱ oil groups, of which the L2Ⅱ oil group is further subdivided into three sand bodies, a, b, and c. The production flow section is divided into three oil-bearing systems, namely, flow section one, flow section two, and flow section three, and the crude oil is mainly light crude oil.
2.2. Current Status of Production
This study selected A21 in the middle block 1 and 3 well area. The source of the L2II oil group in the middle block 1 and 3 well areas is from the fan delta and deltaic depositional system to the southwest. The plane has multi-channel super-positional development characteristics, and the target area was mainly developed via underwater diversion of the river micro-phase. Among these characteristics, the average porosity of the oil formations in each oil group in the second section of the development layer of the potential flow is 9.7–17.8%, and the average permeability is 0.2–16.4 mD, which is mainly a low-porosity, low-permeability-to-extra-low-permeability reservoir.
The average permeability of small layers in the middle block 1 and 3 well area is 6.9–92.5 mD, and the average permeability is 21.7 mD, which are mainly medium- and low-permeability reservoirs, and the medium-permeability reservoirs are mainly developed in the high part of the main river channel in the well area.
Sedimentary relative reservoir physical properties have a greater impact; the overall performance is in the order of the main channel > channel side edge > mat sand > estuarine dam > turbidites characteristics. The overall performance of the south side of the high part of the physical properties are better than the north side of the low part.
Commissioning time: 28 November 2018; production layer: L2I, L2IIa; production method: pumping; drilling reservoir; average permeability: 13.3 mD; effective thickness: 21.0 m; medium depth of reservoir: 2686.3 m; pump working condition: 1201.3 m; daily oil production: 15 m3/d; production capacity: 3.2 m3/(d·MPa); pressure coefficient: 0.77 (2021.8 platform overhaul); cumulative oil production: 4.92 × 10⁴ m3; A21 well put into production at the beginning of 70 m3/d oil production; capacity index: 9.7 m3/(d·MPa); short stabilization period; fast decreasing production; daily oil production: 15 m3/d; capacity index: 3.2 m3/(d·MPa), and the production is at a low level.
The average permeability of the A21 reservoir after drilling is 13.3 mD, the thickness of the sand body after drilling is 32.9 m, and the physical properties of the reservoir are relatively poor; the cumulative injection ratio of the A19-A20-A21 well group is 0.03, the daily water injection of the A19 well is 0 m3/d, and the insufficient replenishment of formation energy leads to a fast decrease in the A21 well and low-level production (Additional information can be found in the Supplementary Material).
Summary: The study area belongs to low-permeability reservoirs, currently facing the problems of depletion development, insufficient formation energy, faster formation pressure drop, low well-fluid volume, intermittent production, and poor development, which need to be resolved by fracturing flooding, and the effect of improving production capacity needs to be evaluated. Well A21 will be used as an example for this study, which has a certain degree of representativeness.
3. Materials and Methods
3.1. Mechanism of Oil Well Fracturing Flooding
The methods used for modeling well fracturing flooding in oil well fracturing flooding mechanisms include the geostress and seepage coupling model, modeling of fracture expansion, seepage–absorption–replacement modeling, hysteresis effects, and surface–activator interactions.
3.1.1. Geostress and Seepage Coupling Model
Geomechanical modeling is used to describe the elastic deformation of rocks. A fully coupled approach is used to model the coupling of geostress and seepage, where the seepage equation and the geostress equation are solved simultaneously at each time step [40].
The coupled systems of equations that describe reservoir filtration processes and geomechanical effects are typically solved on a unified grid system, despite the inherent uncertainty in flow characteristics (including displacements, pressures, and other parameters) prior to obtaining the solution. This integrated computational approach is specifically designed to concurrently account for the complex interactions between fluid flow dynamics and rock mechanical responses within the reservoir system.
The fully coupled method is to take all the physical variables in the coupled field as the research object and model the coupled computation based on the partial differential control equations derived from the variables, whose boundary conditions, loads, and coupling influence matrices are all in explicit form. In geological modeling, the fully coupled approach is mainly used to deal with geological problems involving the interaction of multiple physical fields, simulate fluid flow and rock mechanical behavior in oil and gas reservoirs, and thus more accurately predict the distribution and reserves of oil and gas resources. This method is able to describe the geological phenomena more accurately because it takes into account the interactions of multiple physical fields, which improves the accuracy of the model, enhances the prediction capability, and provides a scientific basis for resource exploration and development.
In the standard seepage equation, porosity is generally considered to be a known quantity, a function of spatial coordinates, independent of time and pore pressure, . In the fully coupled model, porosity is considered one of the unknown quantities and is one of the parameters to be solved for, as follows: .
The fully coupled model of geostress and seepage is shown below:
Equation (1) is the flow equation, Equation (2) is the saturation equation, Equation (3) is the rock displacement and porosity equation, Equation (4) is the rock displacement and pore pressure equation, and Equation (5) is the geostress and pore pressure equation. is the molar density of c-component, SP is the P-phase saturation, is the molar fraction of the c-component P-phase, is the molar density of P-phase, is the stratigraphic displacement vector, is the density of rock at reference pressure, is Biotc’s constant (BIOTC keyword), and is the full tensor of initial stress in the formation (STRESSINIT keyword). is the initial tensor of strain (DISPLINIT keyword), is the initial pore pressure, and is a function of Young’s modulus E and Poisson’s ratio ; definitions are as follows:
3.1.2. Modeling of Fracture Expansion
The modeling of fracture expansion includes the modeling of mud flow, surrounding rock, and the interaction between them, which can be solved jointly in tNavigator. The main aim is to simulate the fracture expansion range of conventional fracturing under different conditions according to the rock fracture criterion and to be able to simulate the effect of different proppants and fracturing fluids in tNavigator’s fracturing simulator, which simulates the dynamic generation process of fracture based on the stress field.
During fracturing flooding, how the fracture forms and expands is a key factor in predicting the effectiveness of fracturing in increasing production. Rock fracture is defined according to the maximum and minimum stress rock fracture criterion, and the fracture of rock materials can be described by the Moore–Cullen failure criterion [41].
According to the Moore–Cullen criterion, the yielding or destruction of a material occurs when the ratio of shear stress to positive stress on the shear plane is maximized, which can be expressed as follows:
Among them, and are the positive and shear stresses on the damage surface, respectively.
The criterion can be understood in the following way: when a slip (shear) occurs at a point in the material on a plane N, the shear stress, , acting on the surface has to overcome the friction due to the positive stress, , acting on the surface, in addition to the cohesive force, c, inherent in the material.
The positive and tangential stresses can be expressed as follows:
Thus, the Moore–Cullen criterion can be written in the following form:
included among these, and are the maximum and minimum principal stresses in the plane, respectively, is the friction angle, and c is the cohesion.
3.1.3. Seepage–Absorption–Replacement Modeling
During the oil well fracturing flooding process, seepage–absorption displacement is one of the main oil enhancement mechanisms. Oil well fracturing flooding injects pressure, driving fluid under conditions close to the fracture pressure of the formation, and a large number of microfractures are formed in the formation. In this case, the sandstone reservoir becomes the main fluid storage space, and the microfractures become the main seepage channels. The capillary force difference between the fractures and the matrix becomes the driving force for oil repulsion. Under the influence of capillary force, the fracturing fluid seeps into the matrix, and, at the same time, the oil in the matrix is driven into the fractures, realizing the oil–water replacement between the fractures in the matrix and achieving the effect of oil driving by fracturing fluid.
At present, there is no special seepage and suction replacement mechanism in the numerical modeling software, and the effect of seepage and suction can only be simulated by modifying the capillary force.
3.1.4. Hysteresis Effects and Surface–Activator Interactions
Relative permeability and capillary pressure depend not only on saturation but also on the direction of change. With hysteresis, it is possible to model saturation functions that depend on prehistory. In a two-phase system (water–oil or gasoline), the wetting relationship is expressed as P1 > P2 if the P1 phase wets the P2 phase. Let the P1 phase be the wetting phase (Wetting Phase) and the P2 phase be the non-wetting phase (Non-Wetting Phase). The process of decreasing the saturation of the wetting phase is called Drainage, and the process of increasing the saturation of the wetting phase is called Imbibition.
The lag model of tNavigator will simulate the effect of a change in the direction of expulsion on the capillary force. Both the surface–activator model and the hysteresis model modify phase penetration by first calculating a new phase penetration curve based on the surface–activator and then by applying the hysteresis option to the new phase penetration curve.
3.2. Fracture Expansion Simulation Experiments
This board primarily uses the Fracture Simulator tool in tNavigator, which is a fracture expansion simulation tool for hydraulic fracturing. The Fracture Simulator is integrated into the Model Design module, allowing for the specification of desired rock properties, well injection states, and fracture expansion solution methods. The module has the advantage of being able to simulate the fracture expansion process in meter-scale grids with a time step of seconds.
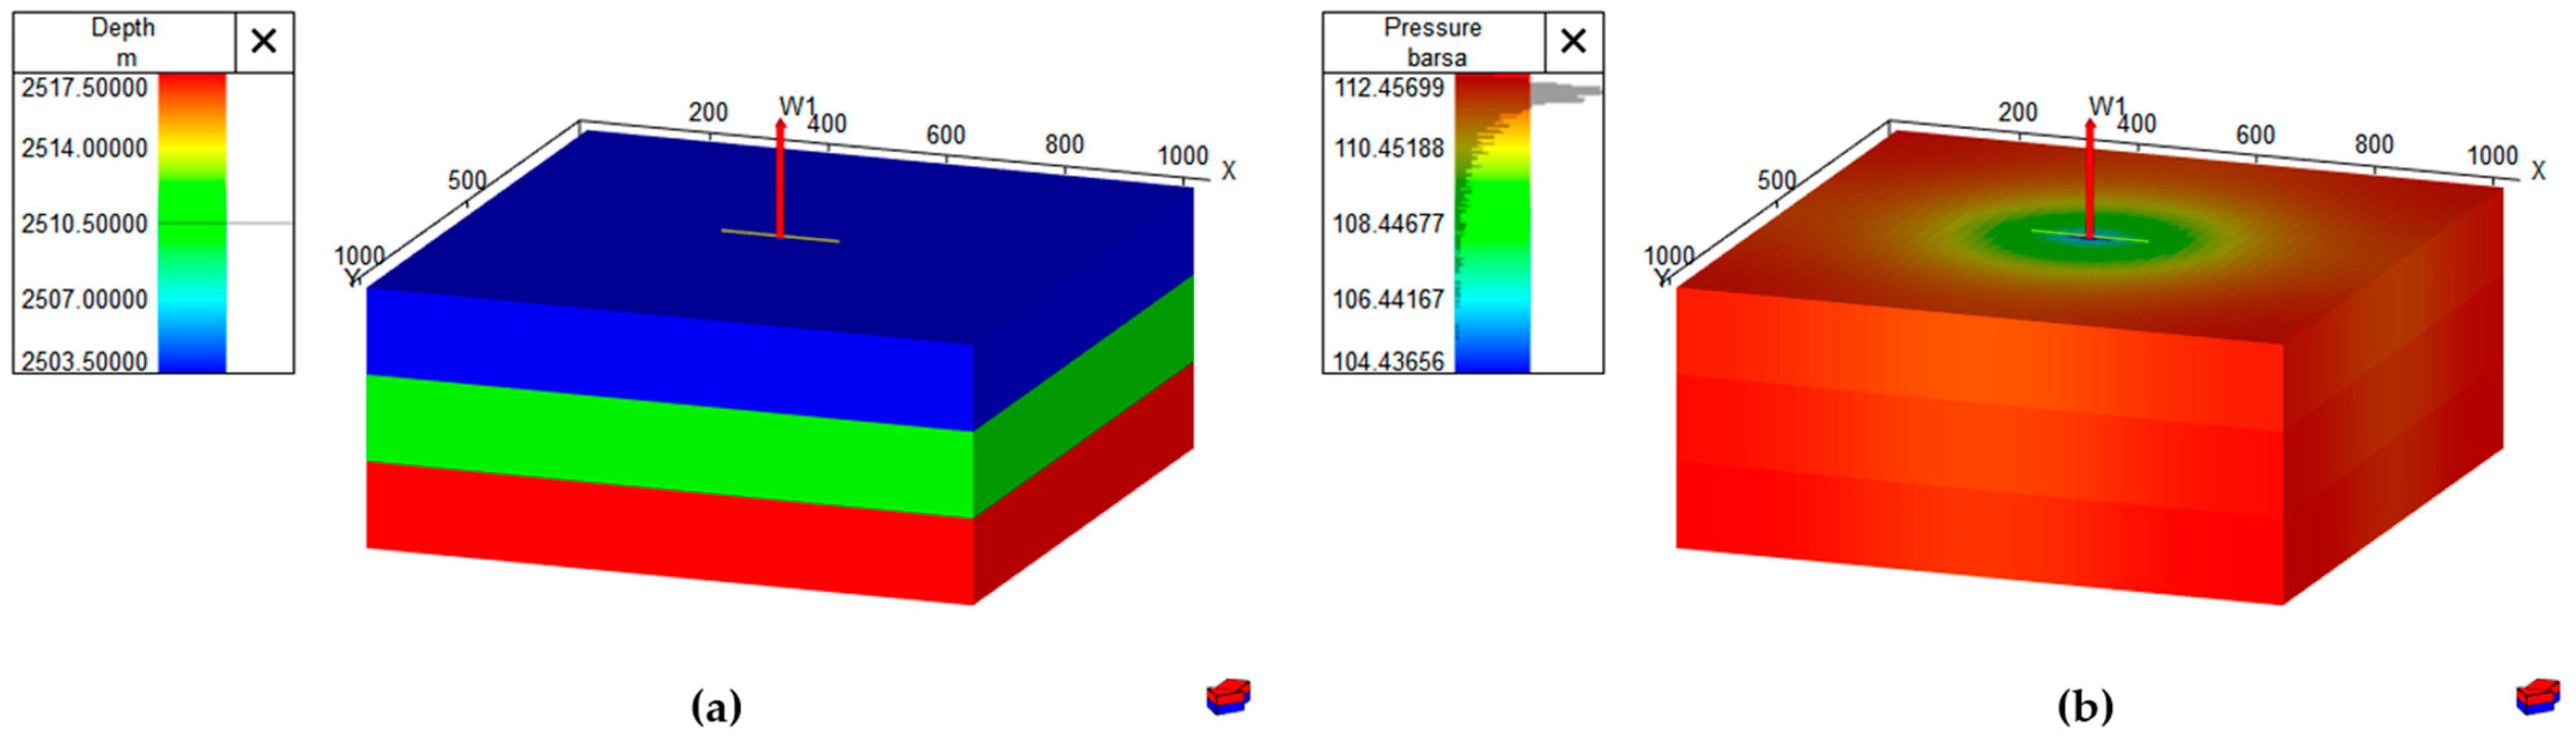
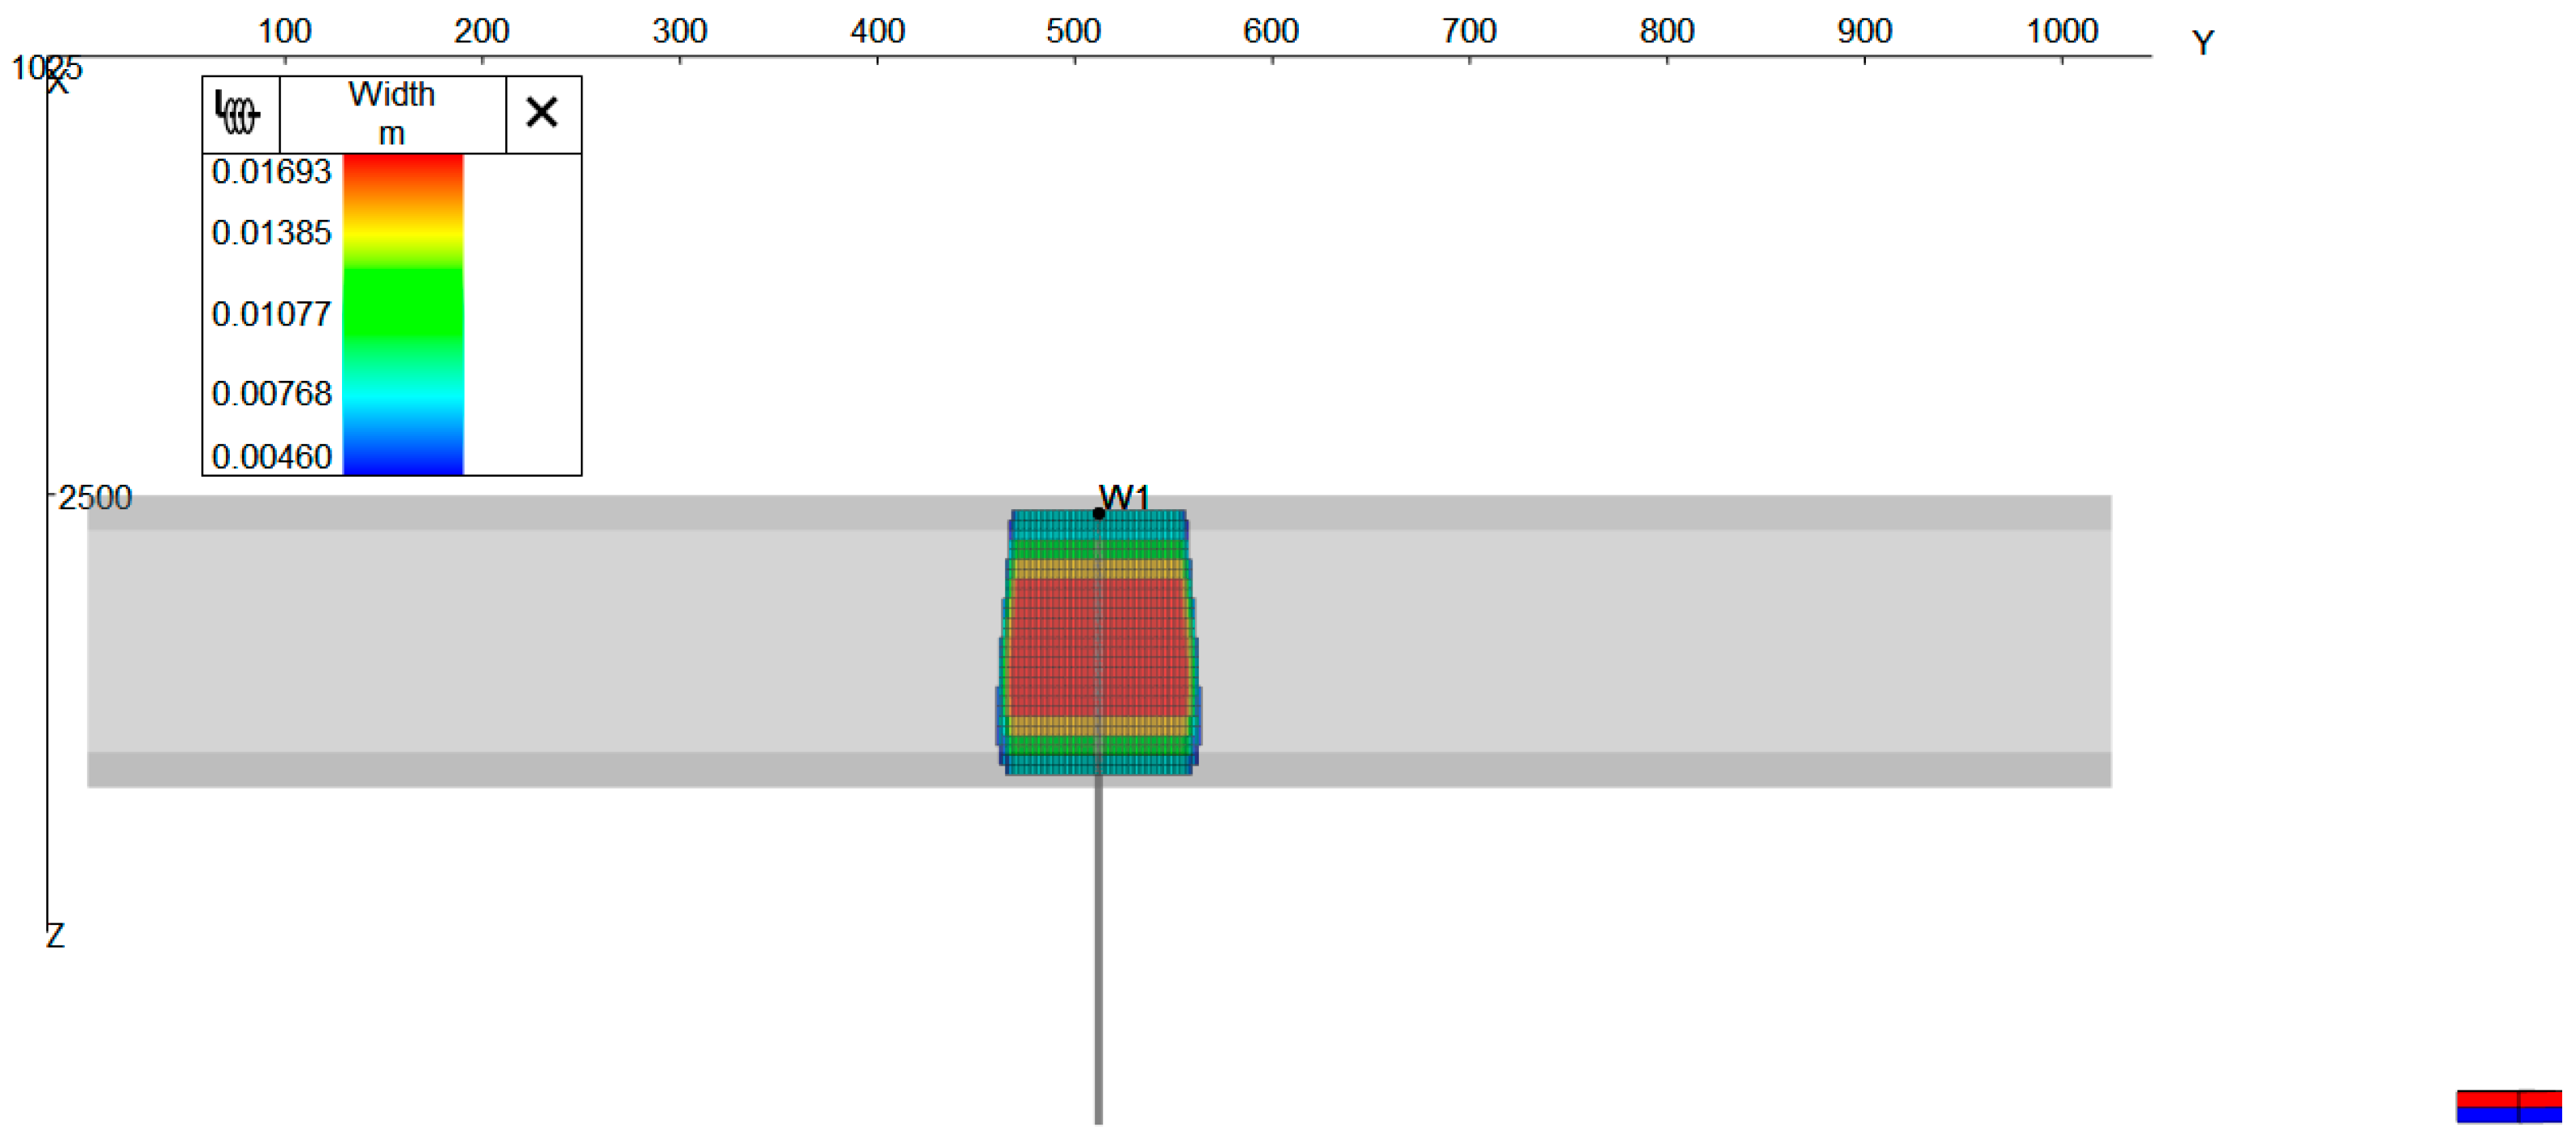
In order to study the influence of the parameters of fracturing flooding on the fracture expansion law during the fracturing stage of oil wells, the fracture expansion mechanism model of oil well fracturing flooding was established. As shown in Figure 2a, the model is a three-layer grid, and the detailed parameters are presented in Table 1. Figure 2b shows the distribution of pressure in the model, with the pressure at the center of the well being the highest and decreasing in concentric circles towards the outside of the well. The figure shows the fracture sheet morphology generated using this module. As can be observed from Figure 3, the vertical upward fracturing crack has the largest width in the middle and smaller widths at the top and bottom.

Figure 2.
Diagram of mechanism model (a) and pressure distribution in the model (b) (the yellow horizontal line indicates the fracture).

Table 1.
Table of mechanism model parameters.
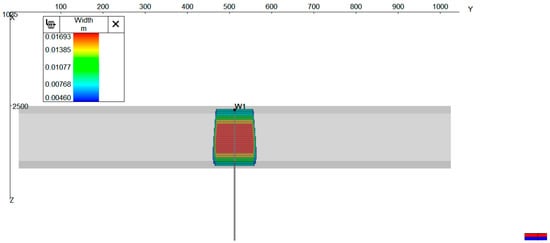
Figure 3.
Schematic diagram of the fracture expansion situation (the gray part is the mesh of the model).
This module was designed to study the influence of fracturing flooding parameters; the fracturing parameters will be unified, and the grid parameters after fracturing flooding will be imported into the simulator. Set up in the fracturing fracture simulator, the injection time is 1000 s, the proppant selection is BMC ATLAS CRC LT 20/40 (A), the injected fluid selection is SlickWater-120F, the production rate of fracturing fluids is 6 m3/min, and the concentration of sand spreading is 20%. The fracturing fracture locations were at 2503, 2507, and 2515 m; the number of injection holes was 1; the diameter of injection holes was 0.01 m; and the pressure loss coefficient was 0.788.
3.3. Numerical Simulation Experiments of Oil Well Fracturing Flooding
3.3.1. Establishment of Numerical Models
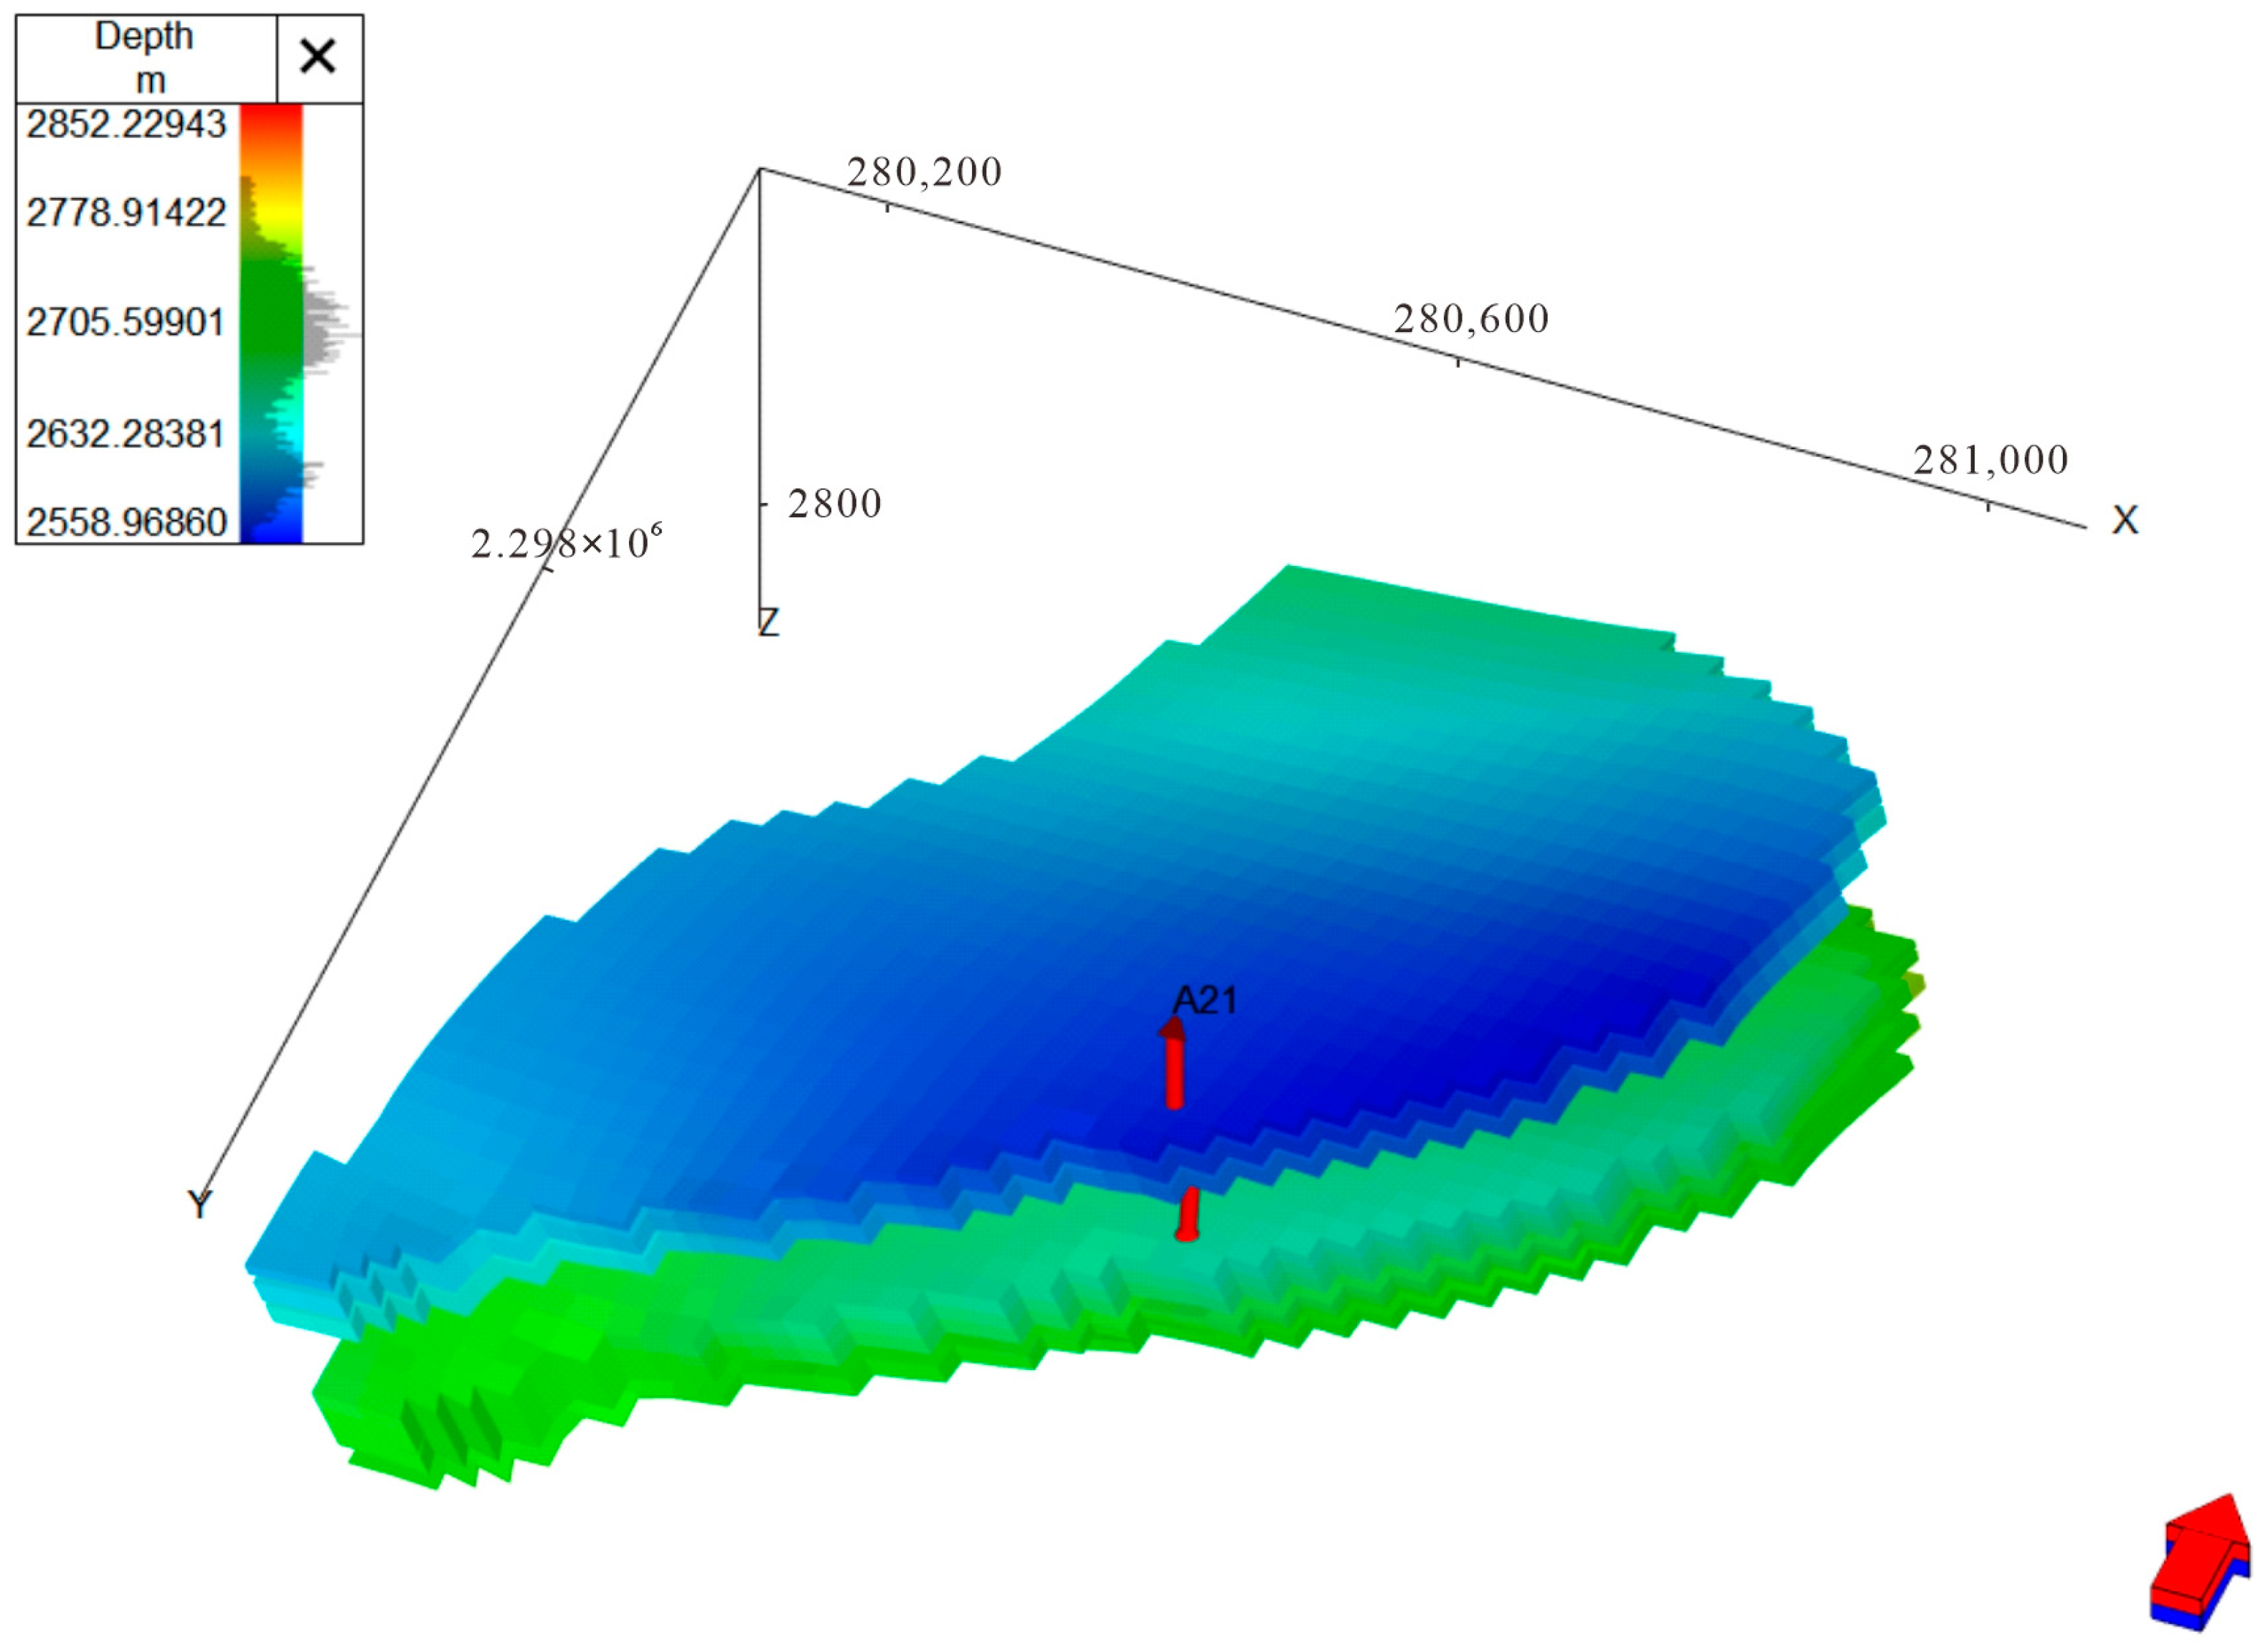
As shown in Figure 4, the numerical model of well A21 is based on the existing WZ12-2 numerical model, from which the formation near well A21 is cut out, and the porosity and permeability fields follow the data of the original numerical model. On this basis, according to the mechanism of oil well fracturing flooding, the mechanisms of the geostress model, hydraulic fracturing model, seepage–absorption–replacement, and surface–activator model are added, which can completely characterize the oil-increasing effect of oil well fracturing flooding.
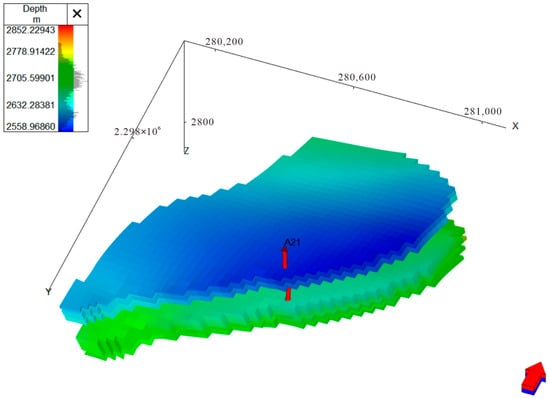
Figure 4.
Modeled bottom depth map of well A21 (the red bar arrow at well A21 shows the trajectory of the well).
3.3.2. Analysis of Key Parameters of Fracturing Flooding in Oil Wells
Oil well fracturing flooding, as an important technology for improving oil recovery, is used to inject high-pressure oil repellent into the underground oil formation in order to overcome the decreasing formation pressure and drive the flow of residual oil to the production wells, so as to realize the enhancement of crude oil production. In the process of fracturing flooding, the selection and control of key parameters of fracturing flooding directly affect the advantages and disadvantages of the oil enhancement effect.
Commonly used key parameters include injection volume, injection rate, fracture half-length, well shut-in time, and so on. These parameters are studied through numerical simulation to analyze how the changes in these parameters affect the oil increase.
Summary: In the oil well fracturing flooding mechanism, the coupling model of geostress and seepage, the fracture expansion model, the seepage replacement model, the hysteresis effect, and surface–activator interaction are combined. The tNavigator software was used for fracture simulation and modeling of oil well fracturing flooding. The method mentioned in this subsection can clearly characterize the fracture expansion morphology and completely characterize the oil enhancement effect of well fracturing flooding, which has a guiding value for simulating fine reservoir development.
4. Results and Discussion
4.1. Study of Fracturing Flooding Parameters of Fracturing Flooding on Fracture Morphology
4.1.1. Injection Volume
In order to study the effect of total injection volume on fracture expansion, the variation range of total injection volume is set to 0.5–25 million cubic meters in the fracturing flooding model, and the injection rate is kept constant at 6 m3/min.
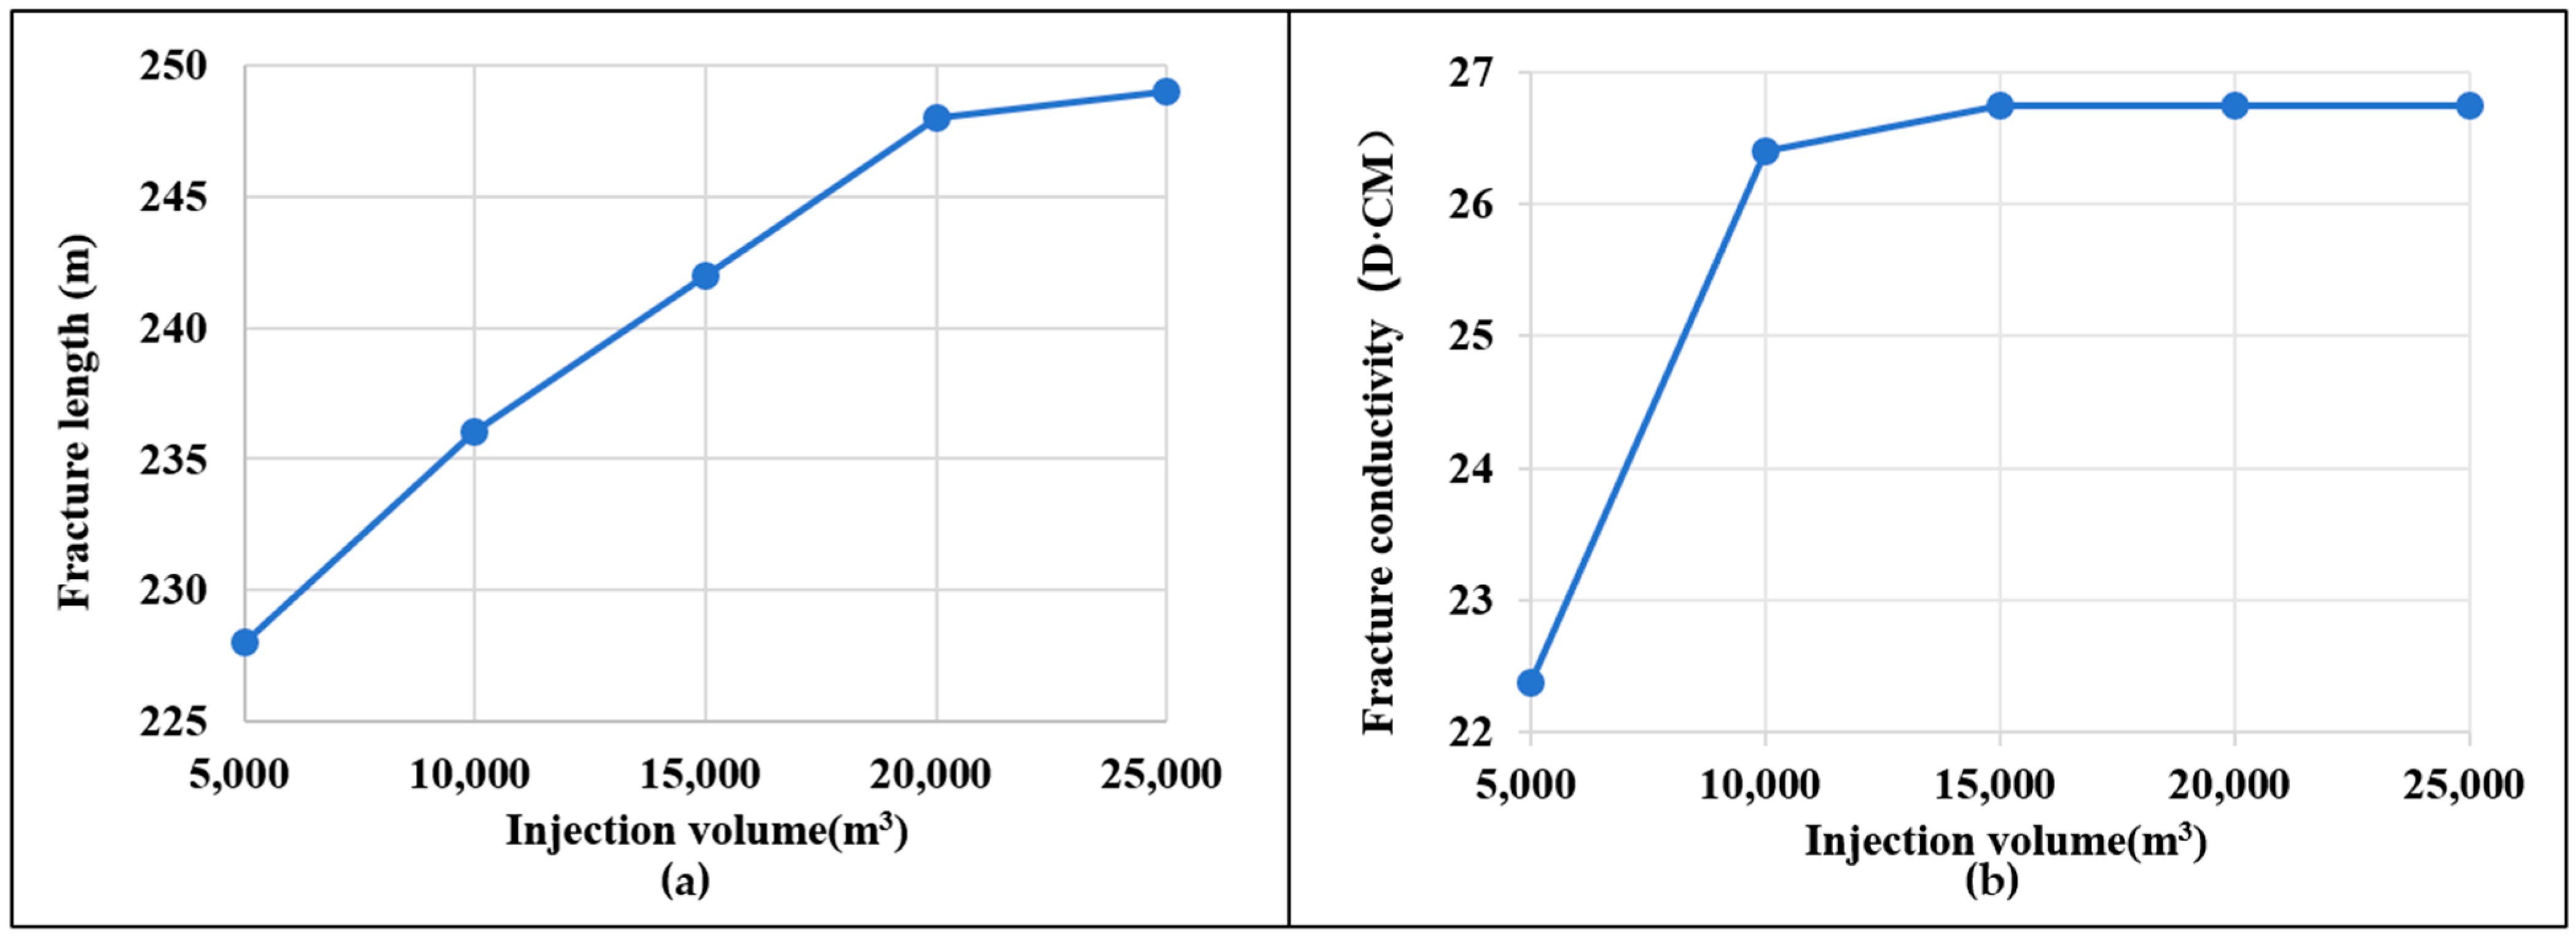
According to the simulation results, as shown in Figure 5a,b, the total injection volume and the fracture length are positively correlated linearly; the larger the total injection volume is, the longer the fracture length is; the larger the total injection volume is, the larger the hydraulic conductivity is; and after the total injection volume reaches 15,000 m3, the total injection volume is increased again, and then the hydraulic conductivity basically stays stable.
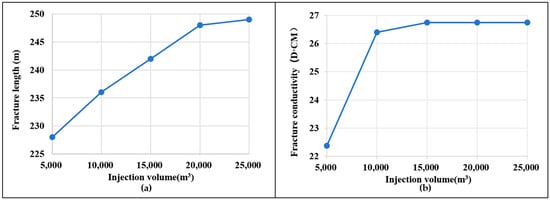
Figure 5.
Plot of total injection volume versus fracture length (a) and fracture conductivity (b).
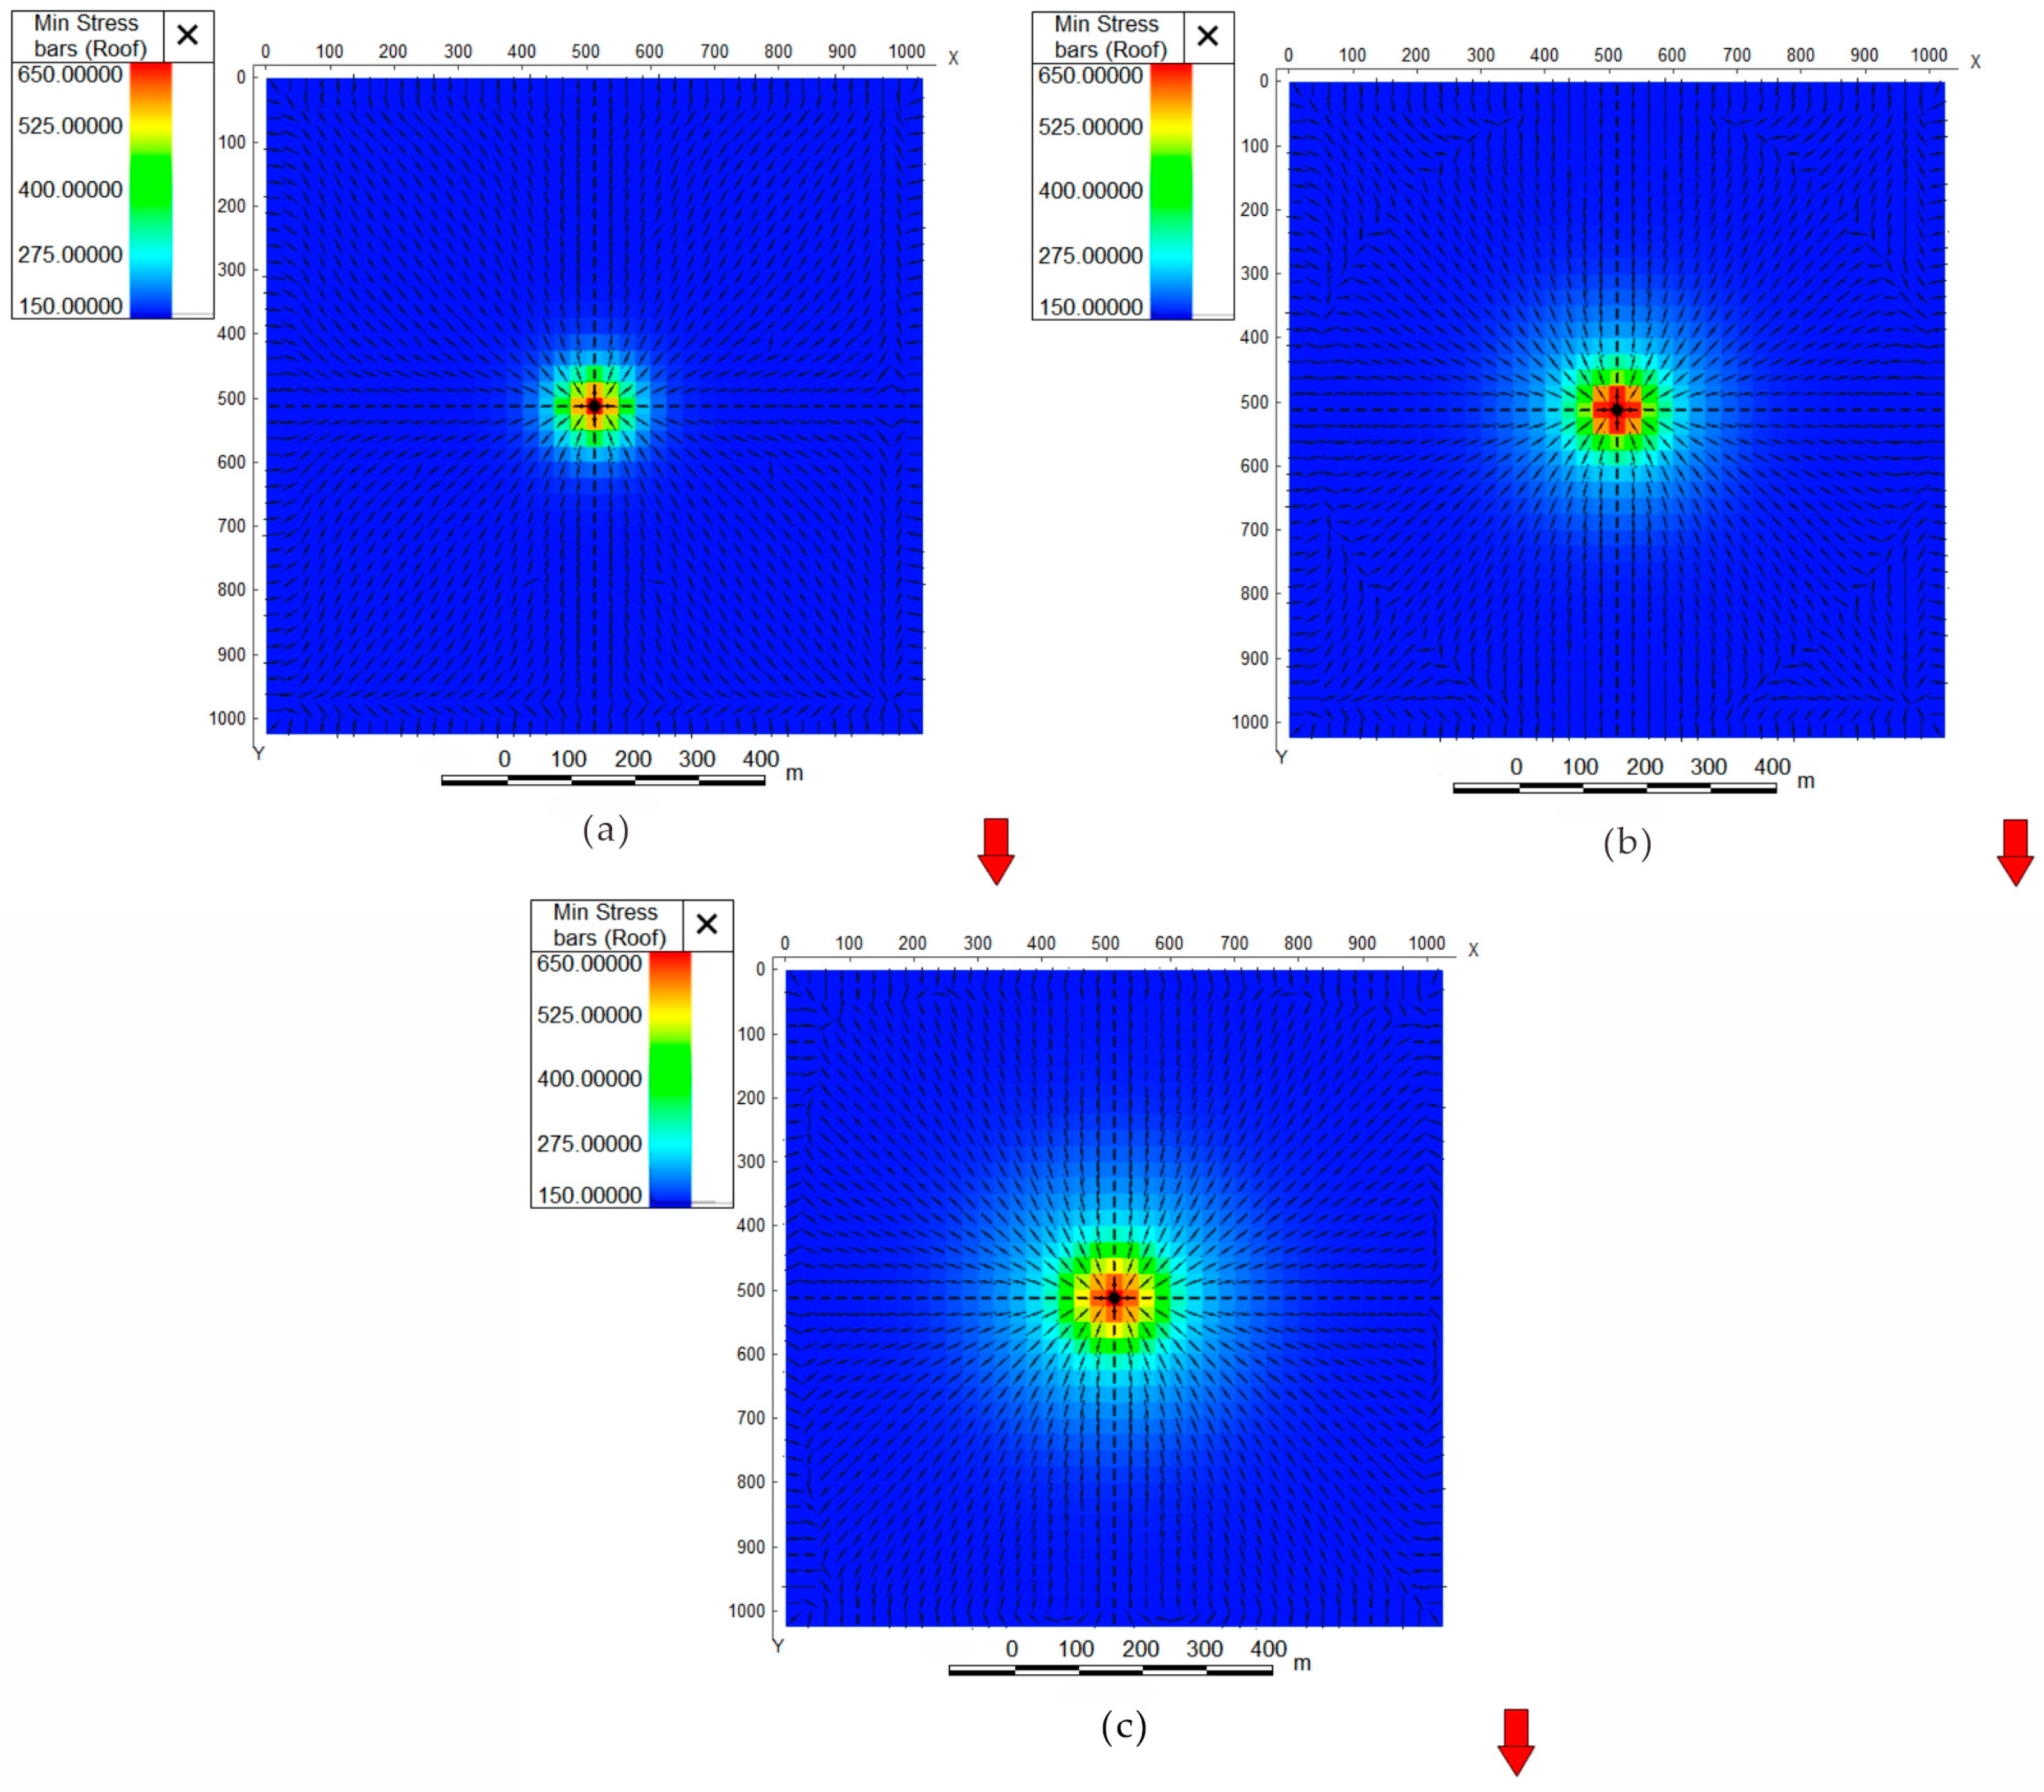
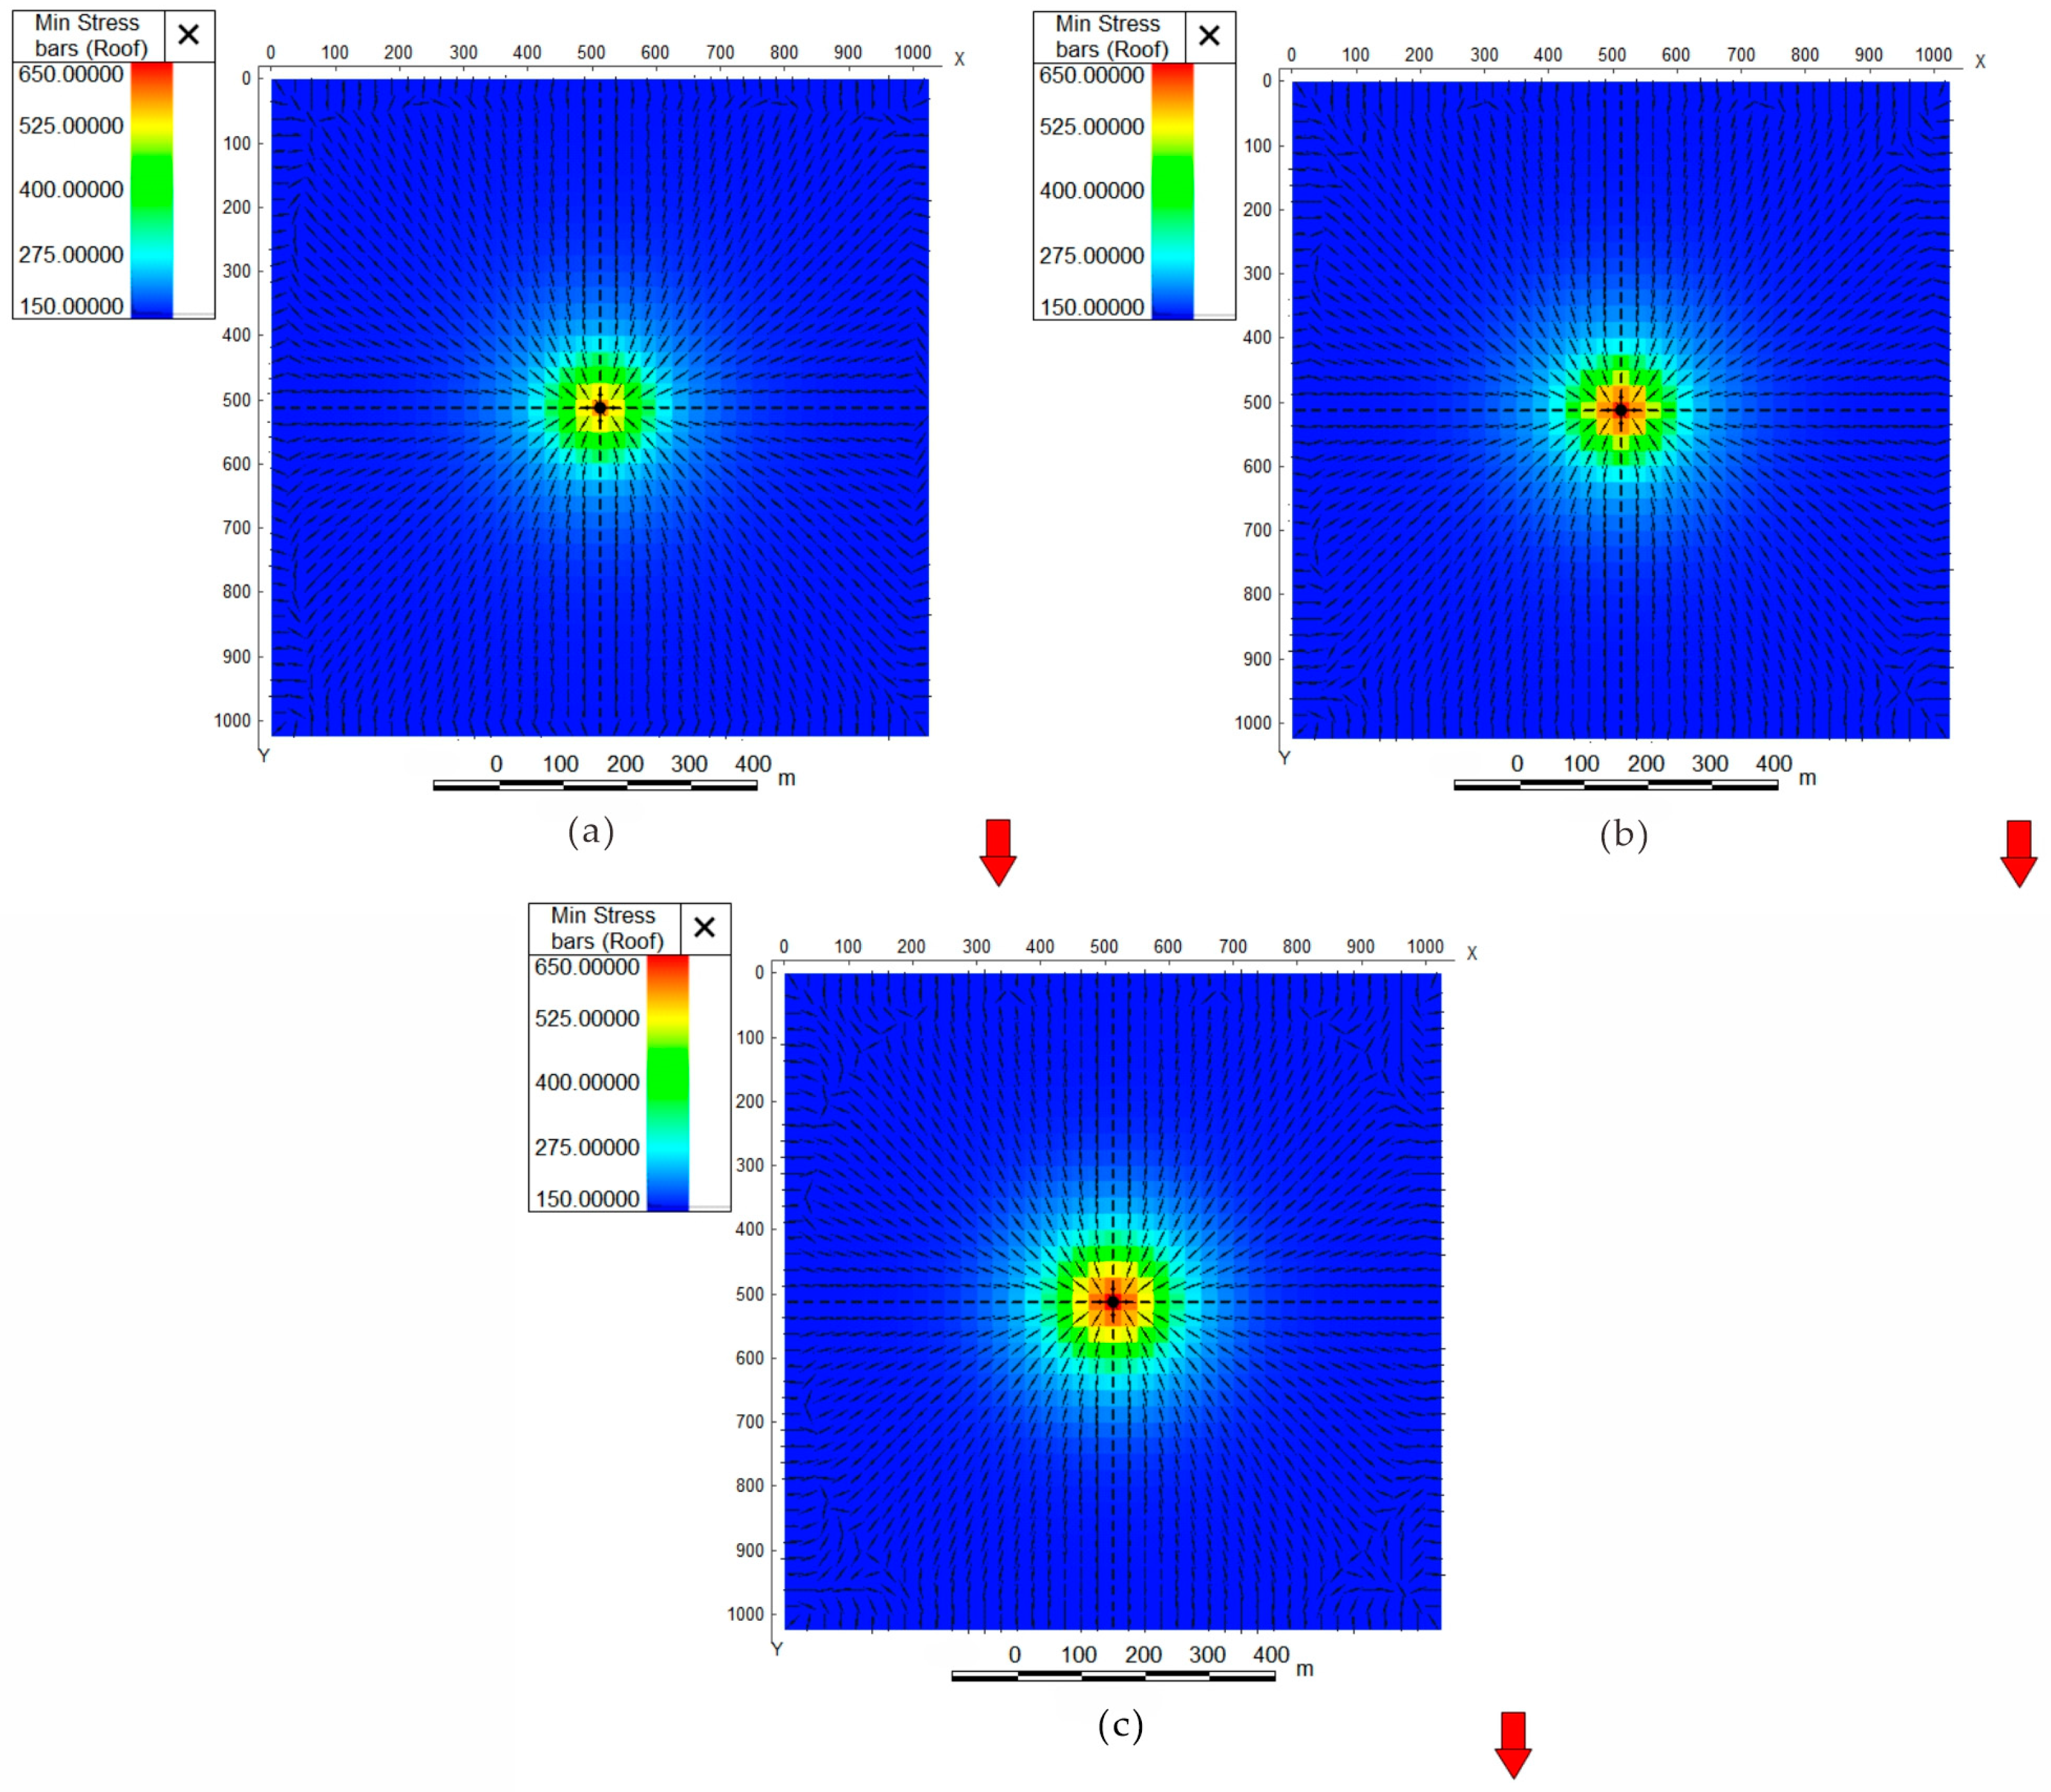
Under different injection volumes, the morphology of the geostress field is similar, as shown in Figure 6a–c are the geostress distribution maps for injection volumes of 5000 m3, 15,000 m3, and 25,000 m3, respectively, which are represented in a concentric circle with high geostress in the near-well zone and low geostress in the far-well zone. The more the total injection volume, the larger the coverage of increasing geostress values. As the total amount of injection volume increases, the value of the geostress field near the well becomes higher and higher, and the concentric circle part of the wave coverage becomes wider and wider.

Figure 6.
Plot of geostress field for different injection volumes. (a): 5000 m3, (b): 15,000 m3, (c): 25,000 m3; the red arrow is the compass.
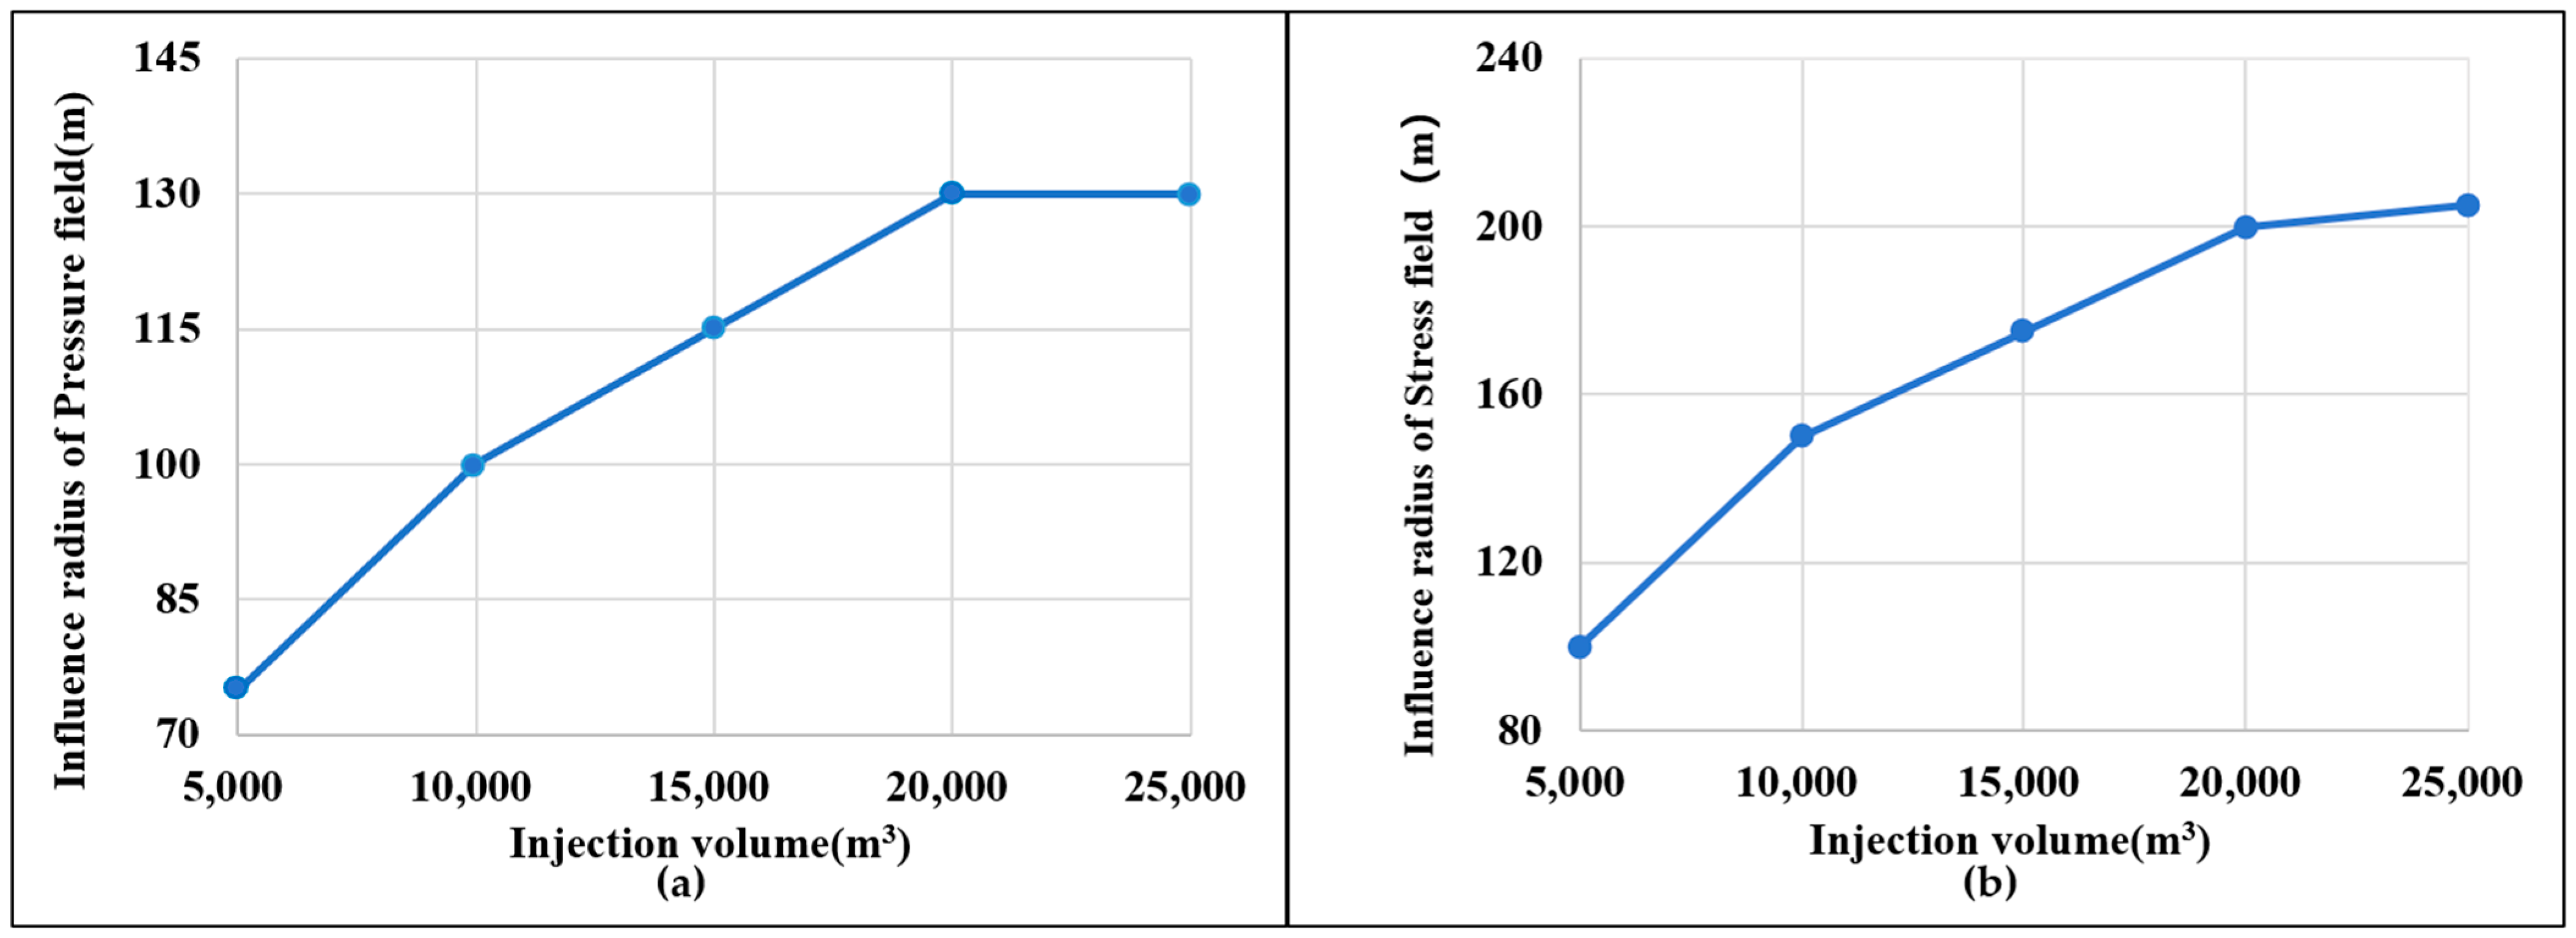
A quantitative study of the pressure coverage around the wellbore as well as the geostress coverage was carried out. The study data show that the pressure field and the range of the geostress field expand with the increase in the injection volume between 5000 and 20,000 m3; however, the pressure field does not change after the injection volume reaches 20,000 m3, and the growth of the range of the geostress field also slows down. As shown in Figure 7a,b, the optimized injection volume of 15,000 m3 is recommended in combination with the previous studies.

Figure 7.
Plot of injection volume versus pressure field (a) and geostress field (b) ripple range.
4.1.2. Injection Rate
In order to study the influence of injection rate on fracture expansion, the range of variation in injection rate is set to 3–6 m3/min in the fracturing flooding model, and the total injection volume is kept constant at 20,000 m3.
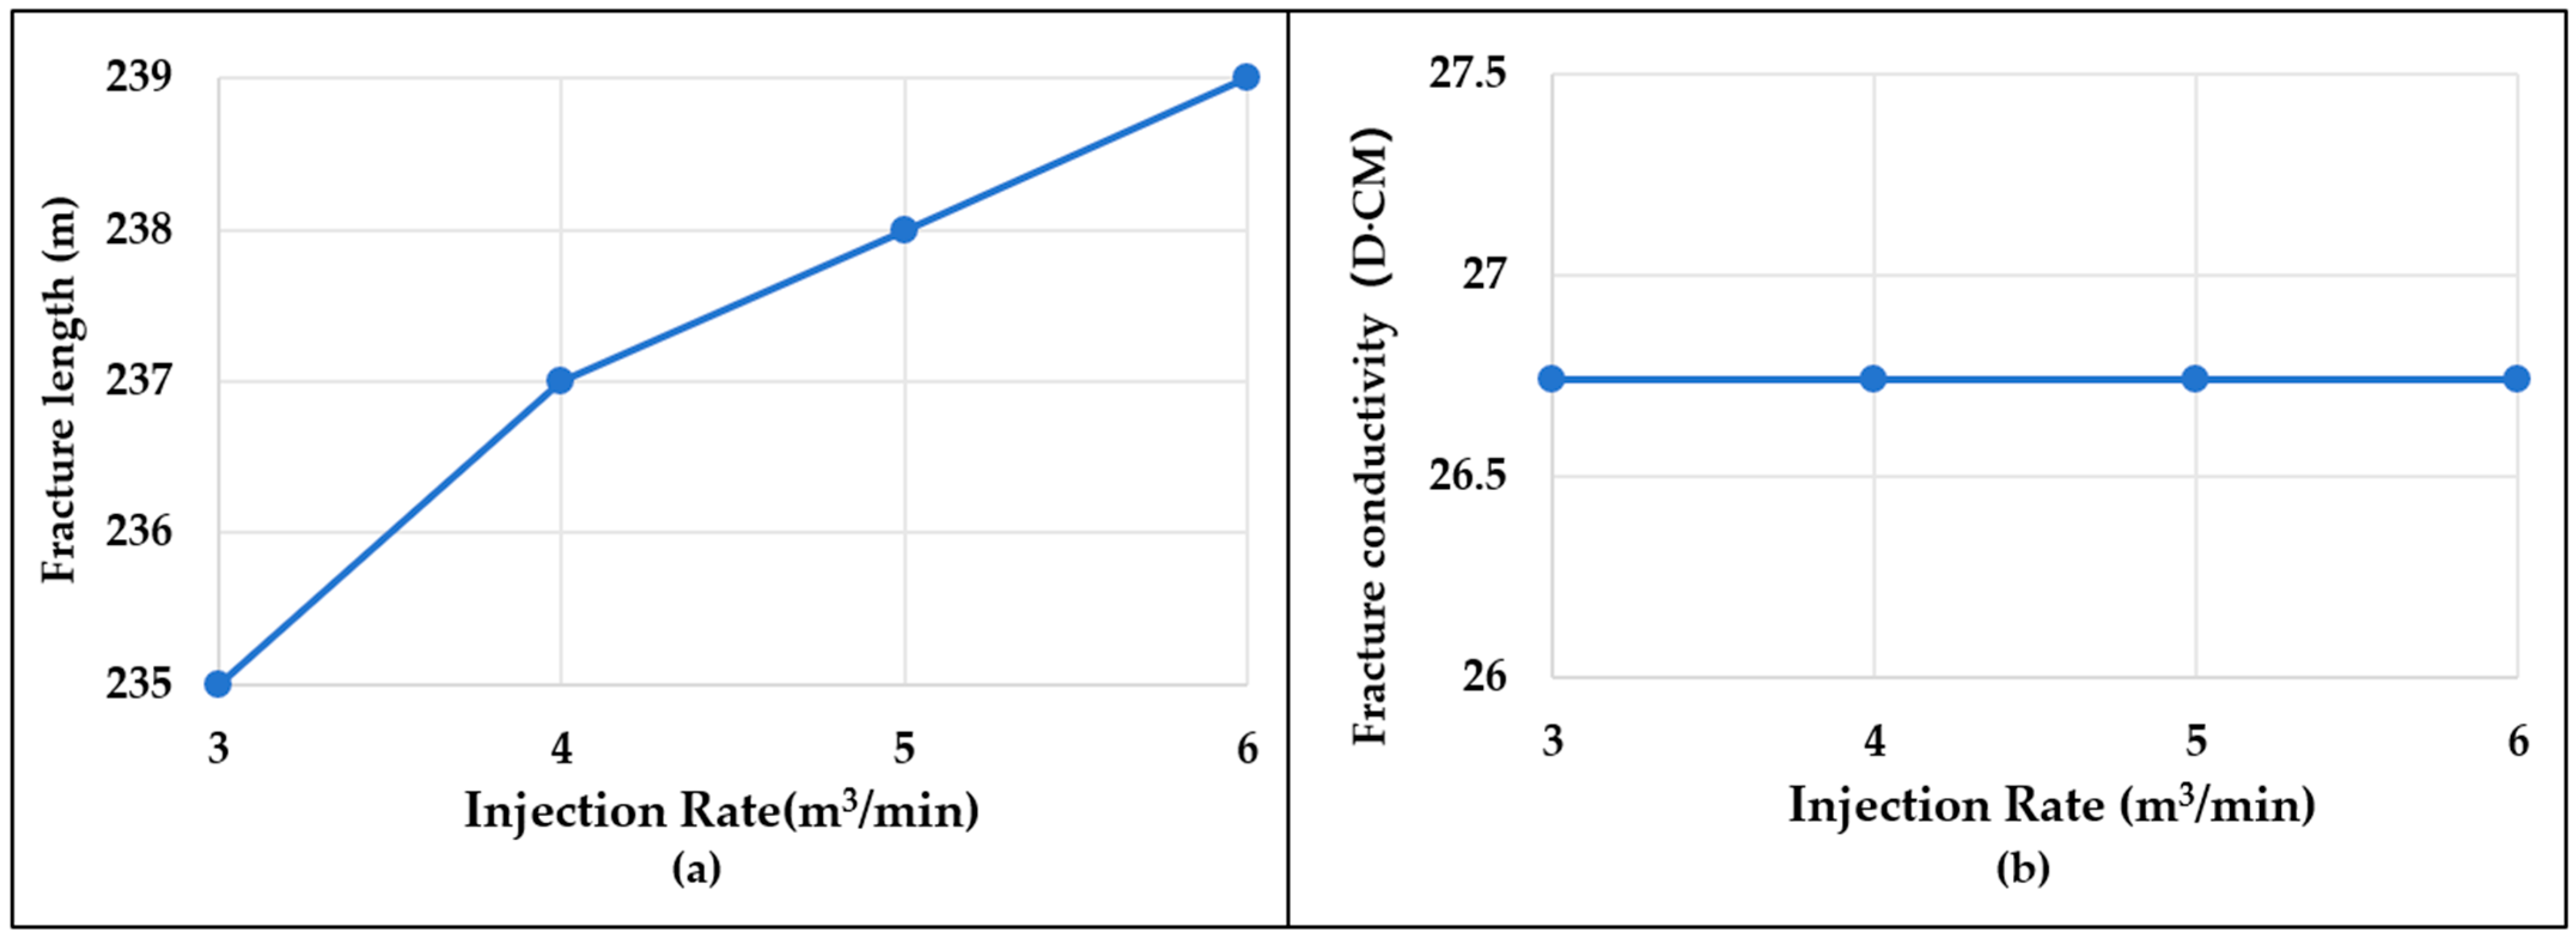
According to the simulation results, as shown in Figure 8a,b, the injection rate and the fracture length are positively correlated linearly, and the larger the injection rate is, the longer the fracture length is; the inflow capacity is basically stable under different injection rates.
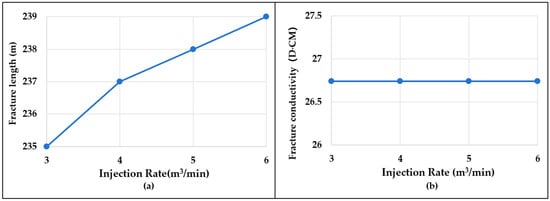
Figure 8.
Plot of injection rate versus fracture length (a) and fracture conductivity (b).
Under different injection rates, the morphology of the geostress field is similar, which is a concentric circle with high geostress in the near-well zone and low geostress in the far-well zone. As shown in Figure 9a–c are plots of the geostress distribution for injection volumes of 4, 5, and 6 m3/min, respectively. The higher the injection rate, the higher the maximum value of the geostress near the well, but the concentric circles are basically the same.

Figure 9.
Map of geostress field for different displacements (a): 4 m3/min, (b): 5 m3/min, (c): 6 m3/min; the red arrow is the compass.
4.1.3. Effect of Fracturing Flooding Rounds on Fracture Morphology
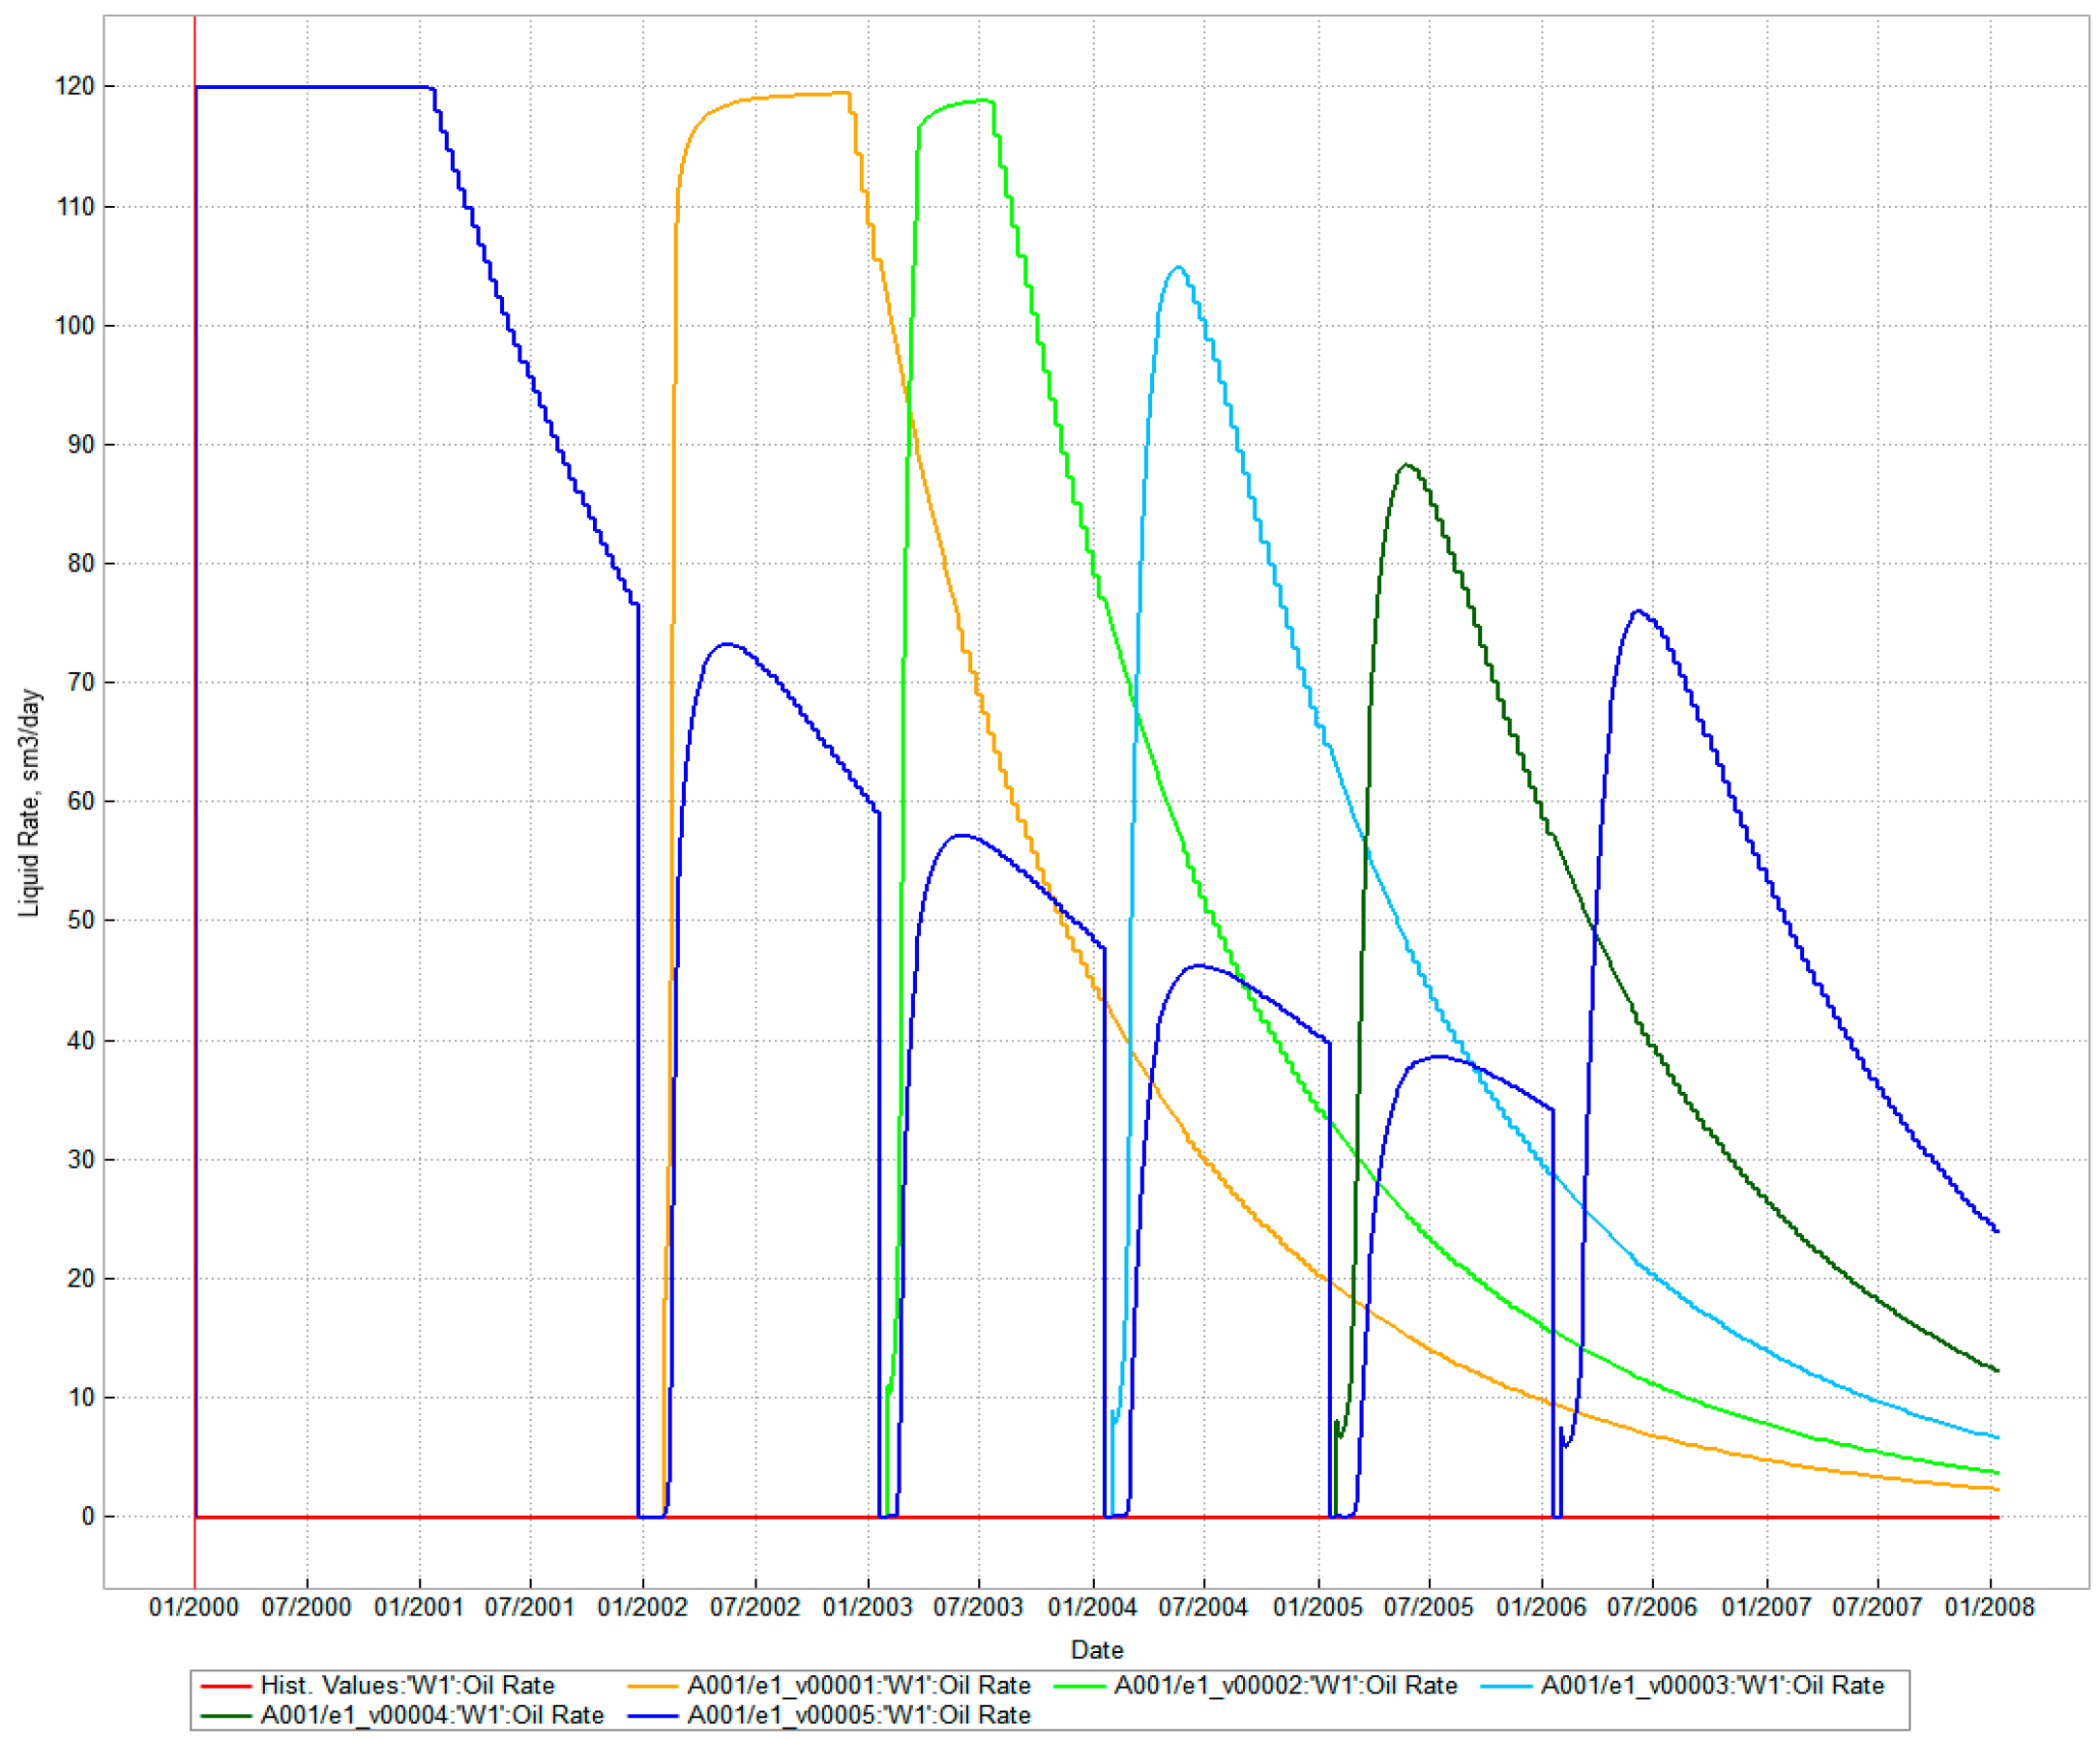
In order to simulate the oil enhancement effect of multiple rounds of pressure-driving, a mechanism model of multiple rounds of pressure-driving is established on the basis of the fracture expansion model in the previous section. The designed fracturing flooding rounds are from 1 to 5, and each round is first fracturing flooding and then production. The amount of fluid injected in the fracturing flooding stage is 20,000 m3; the production time after each round of fracturing flooding is one year, and then the next round starts. Fracturing is restricted to the last round. The previous rounds are only fracturing flooding, not fracturing.
Figure 10 shows the production curves for different fracturing flooding rounds. From the figure, it can be seen that for multiple rounds of fracturing flooding, oil production decreases gradually with each round, with a large boost after the last round of hydraulic fracturing. Figure 11 shows the geostress field and fracture morphology for different rounds; a, b, and c are the geostress distributions for fracturing flooding rounds 2, 3, and 4, respectively. From the figure, it can be seen that for multiple rounds of fracturing flooding, the geostress corresponds to the injection rounds in the form of cyclic changes. There is no significant change in the orientation and morphology of the geostress. The number of fracturing flooding rounds has no effect on the fracture orientation. For multiple rounds of injection, the value of geostress increases slightly, and the fracture length does not change significantly.
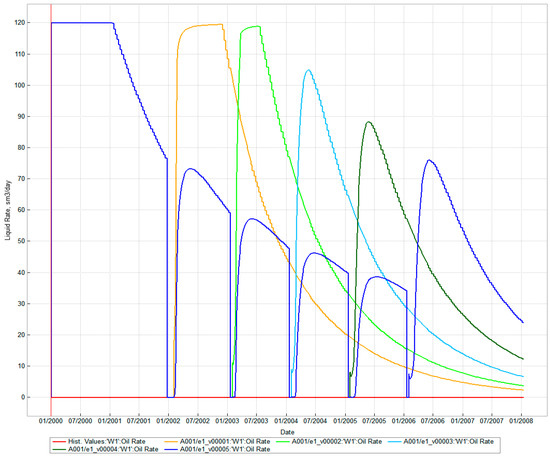
Figure 10.
Yield curves for different fracturing flooding rounds.
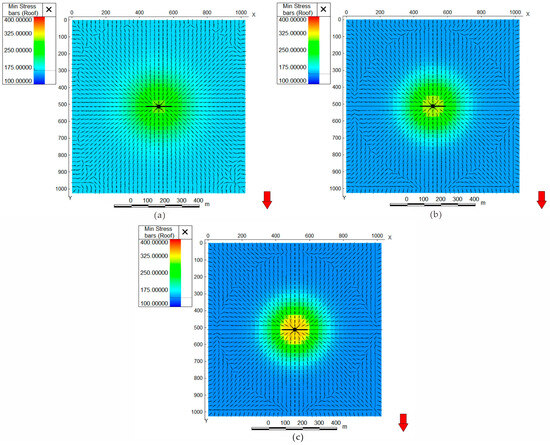
Figure 11.
Geostress field and crack patterns for different rounds (a): 2 rounds, (b): 3 rounds, (c): 4 rounds; the black horizontal line indicates the fracture, and the red arrow is the compass.
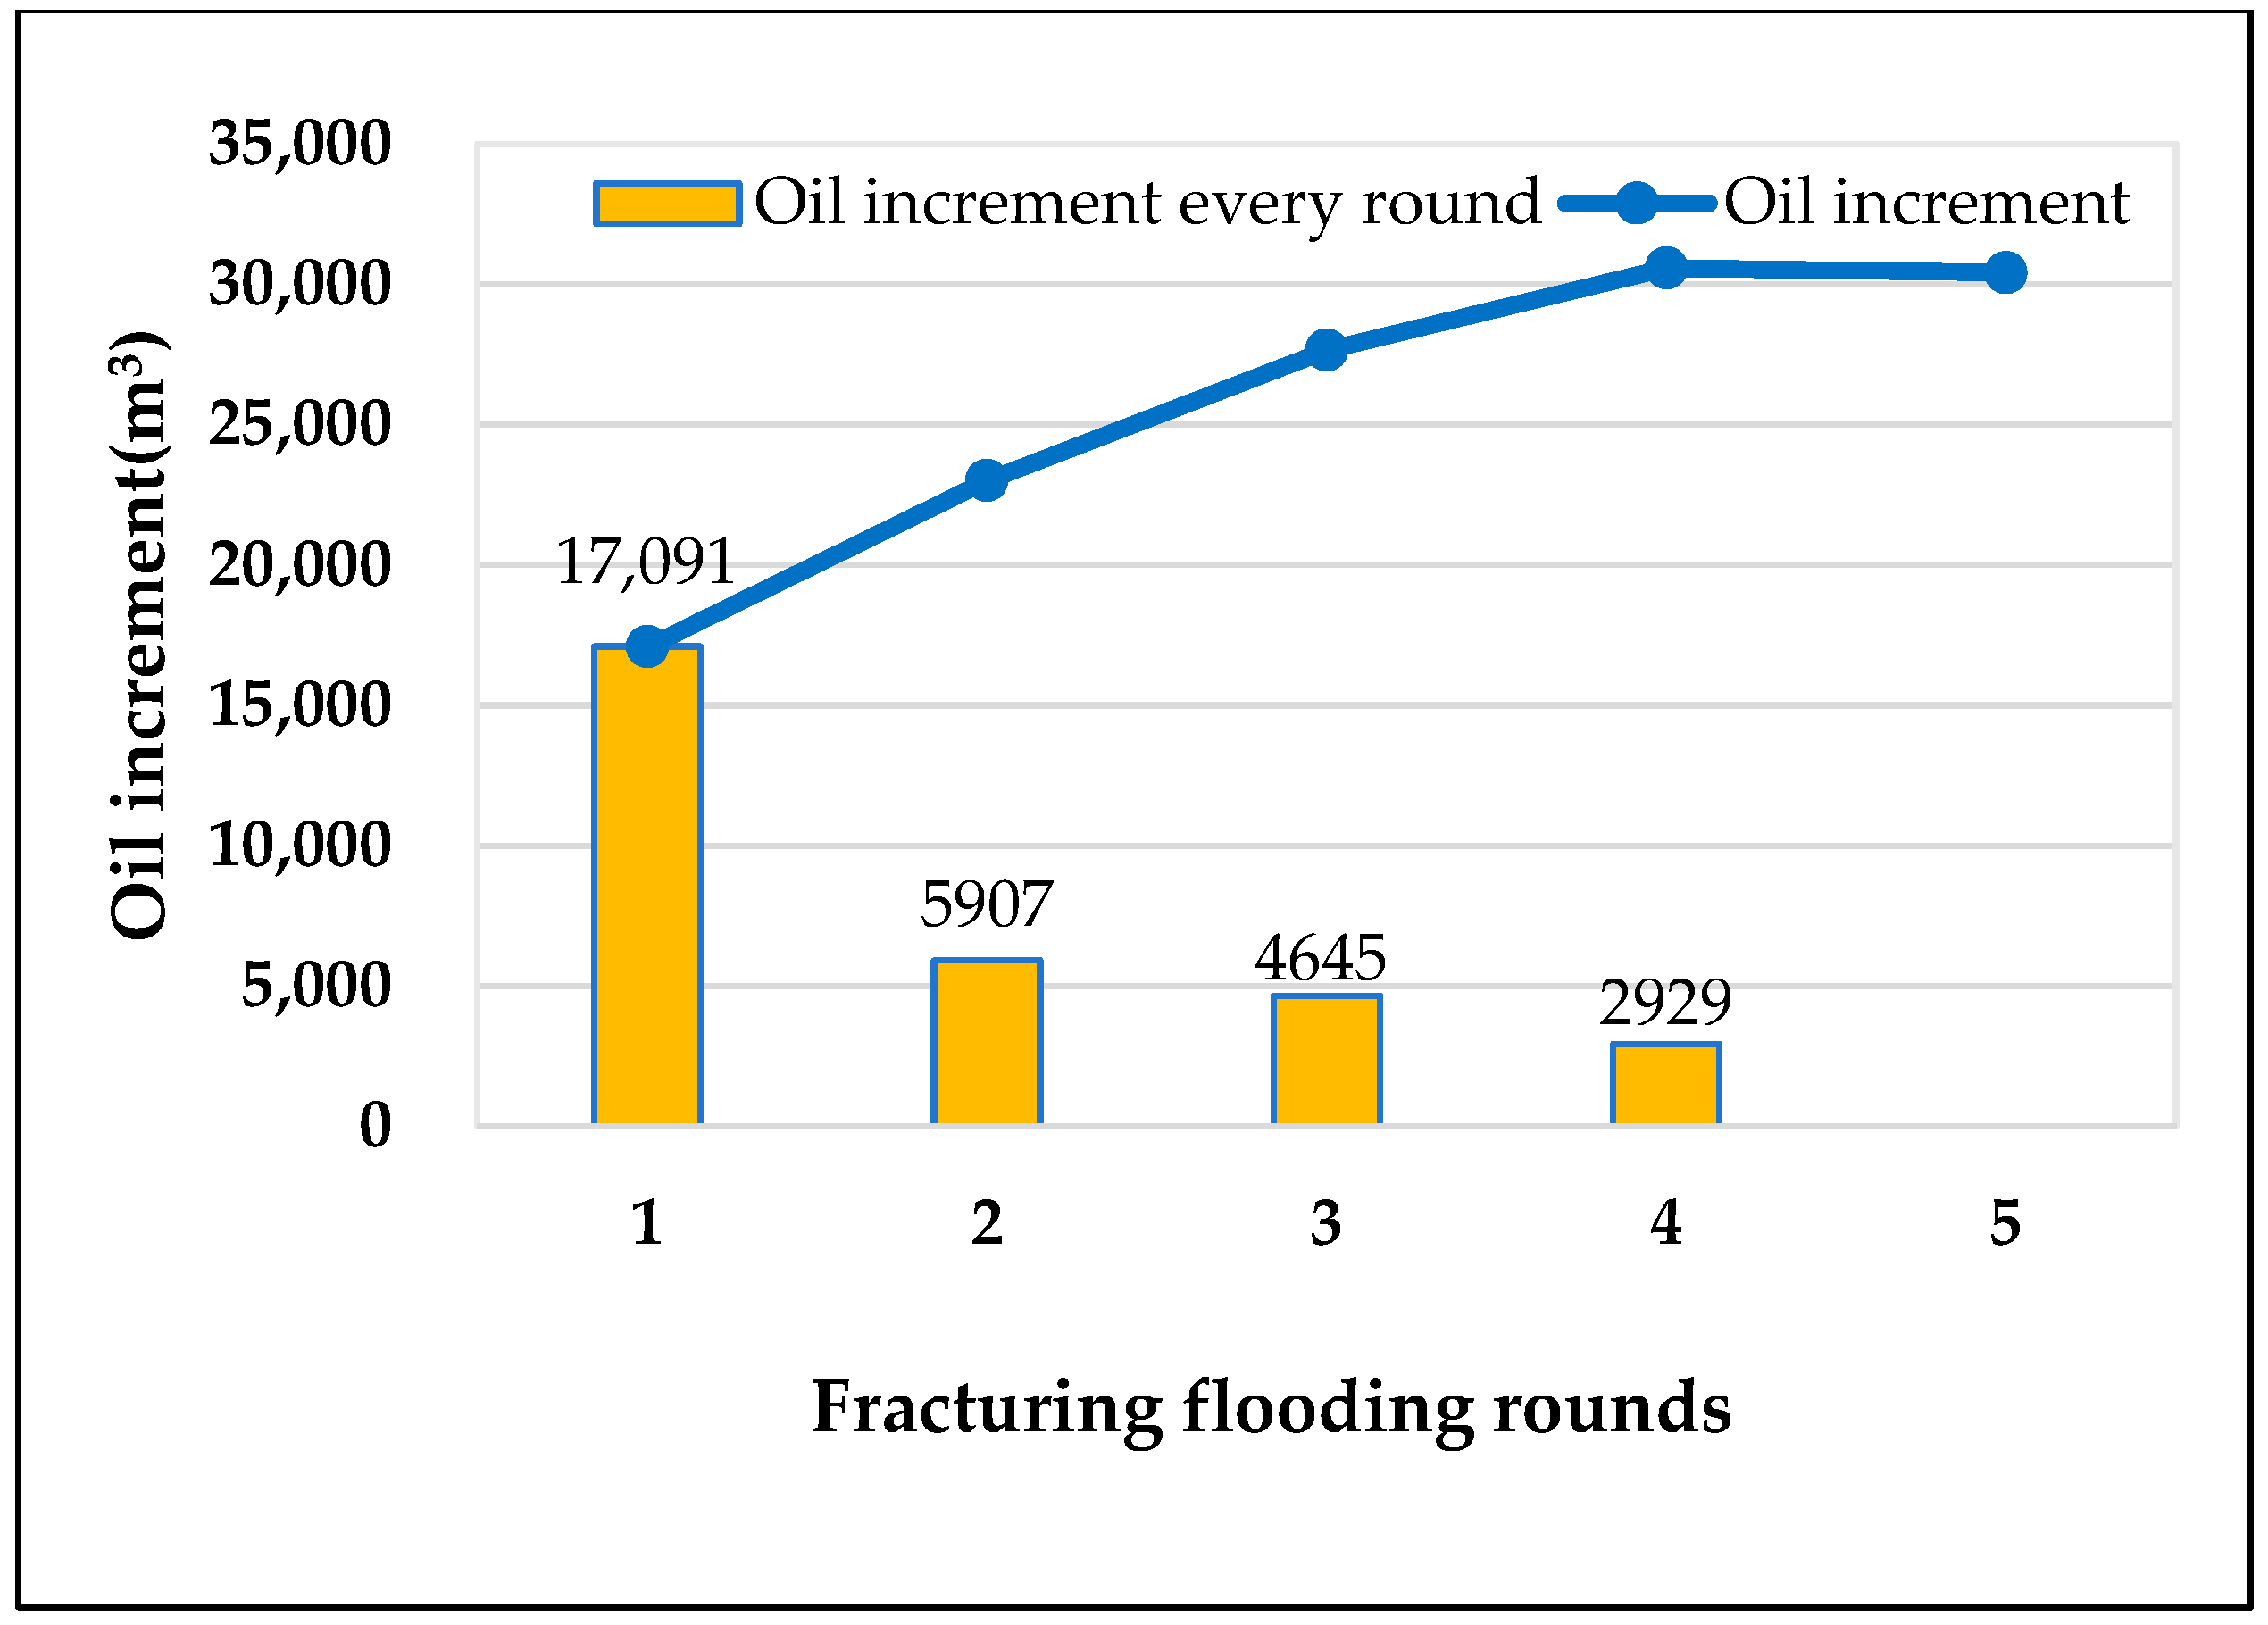
Figure 12 shows the curve of the number of fracturing flooding rounds versus the amount of oil gained. From the figure, it can be seen that the oil increase effect of the first round is the best, and the oil increase effect of the second round is only about 30% of that of the first round. The oil increase effect of the subsequent rounds decreases sequentially. The fifth round has no oil increase effect.
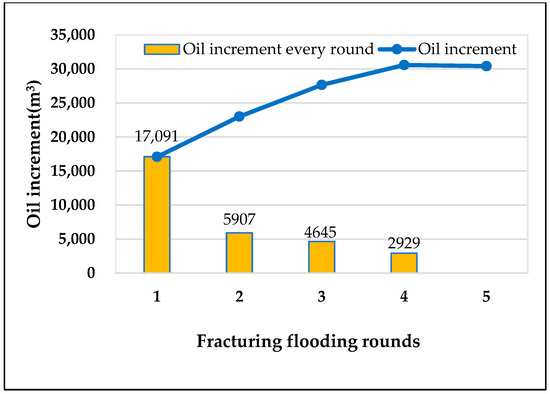
Figure 12.
Curve of the number of fracturing flooding rounds versus the amount of oil gained.
4.2. Optimization of Fracturing Flooding Parameters in Oil Wells
4.2.1. Injection Volume
The total injection volume is the total amount of piezoelectric fluid injected into the formation in the fracturing flooding process. One of the main mechanisms of oil well fracturing flooding is to replenish formation energy. Therefore, the larger the total injection volume is, the better the effect of replenishing energy and the larger the cumulative oil increase is.
Multiple simulation schemes are devised to simulate the effect of the injection volume, with reference to the actual fracturing flooding construction data of well A21. The design is based on four sections of injection, and the injection rate of each section is 6 m3/min, 1/4 of the total liquid volume; the injection time is determined according to the injection volume. The pumps are stopped for 3 h in between the two adjacent segments. The range of variation in total liquid volume designed to be injected is 2000–6000 m3.
Well A21 was under operation for 4 years before fracturing flooding, with a cumulative oil production of 50,000 m3, and there was a large deficit in the formation. The injection of fracturing flooding fluid in the process of pressure-driving can play the role of supplementing formation energy. At the same time, fracturing flooding fluid also has the role of reducing interfacial tension and assisting oil repulsion, so the total injection volume is positively correlated with the oil increase effect.
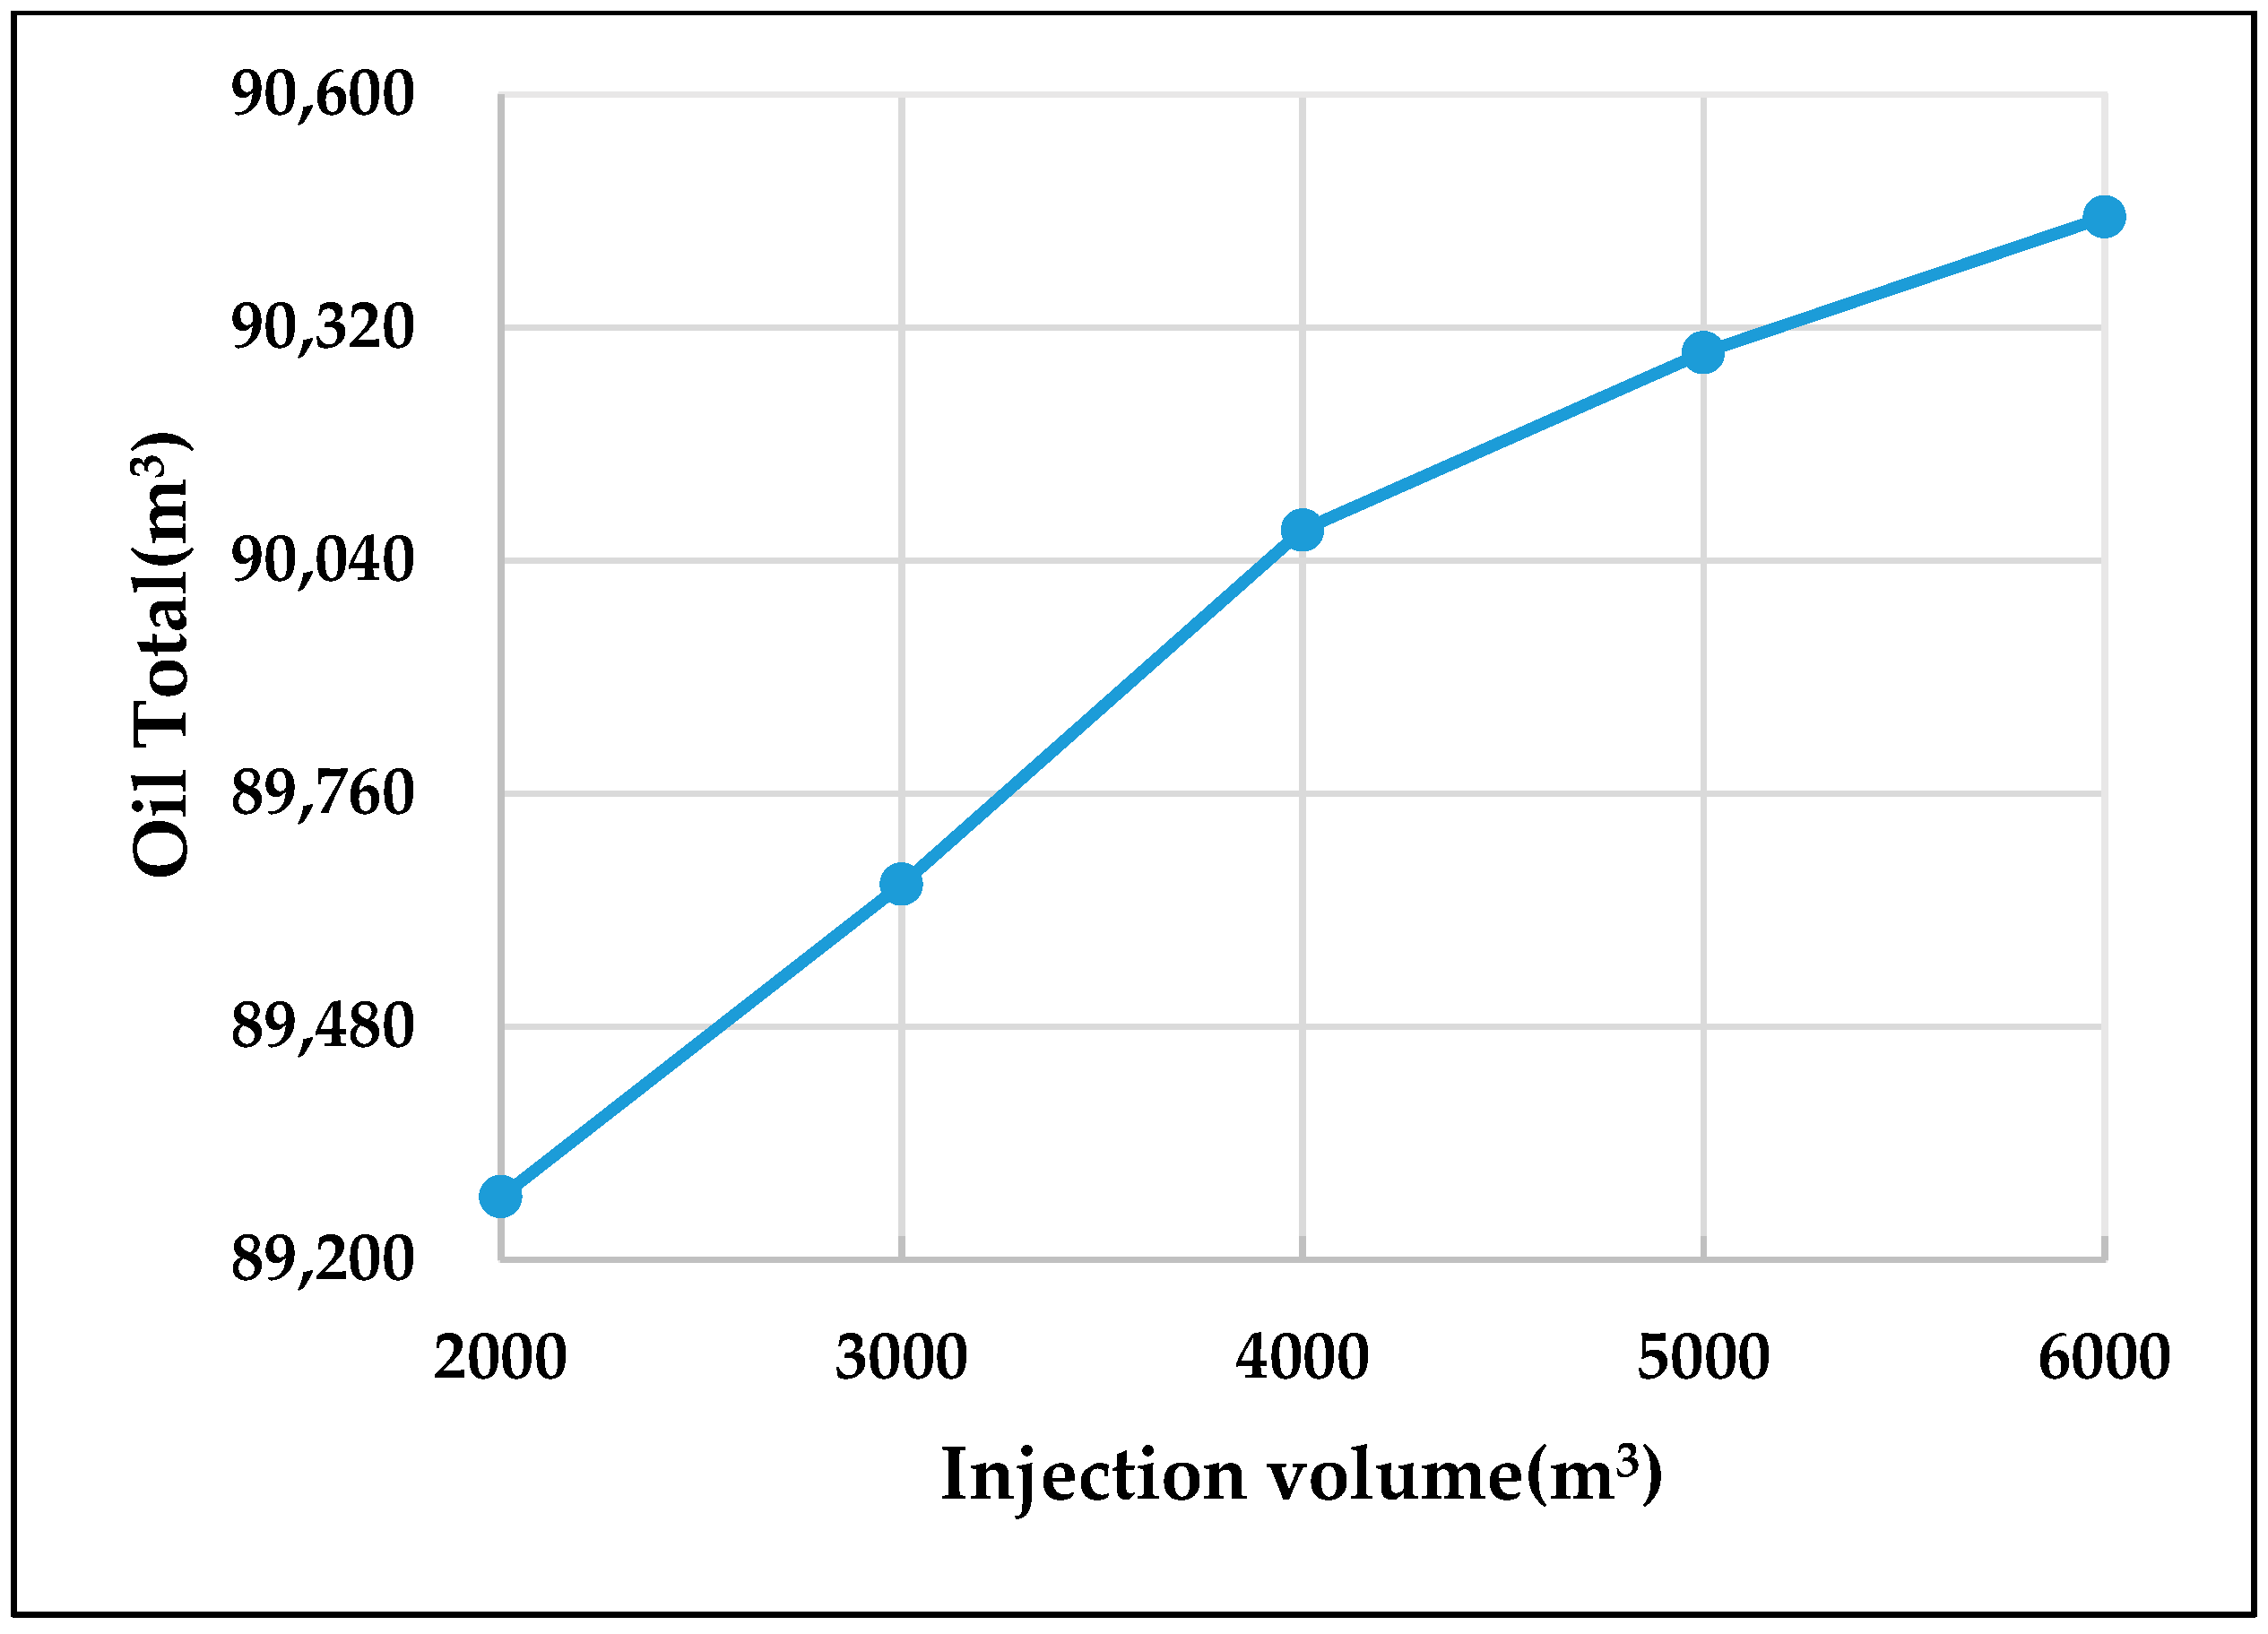
Figure 13 shows the formation pressure expansion under different injection volumes. The figure shows that the larger the total injection volume is, the higher the formation pressure is, and, at the same time, the larger the fracturing flooding range is. Figure 14 shows the curve of total injection volume versus cumulative oil production. It can be seen from the figure that the larger the injection volume is, the higher the cumulative oil production is and the better the effect of oil increase is. However, when the total injection volume is larger than 4000 m3, the cumulative oil production rate starts to slow down.
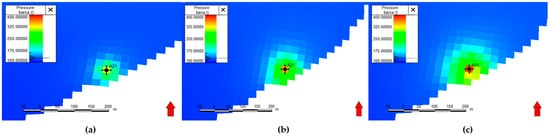
Figure 13.
Expansion of formation pressure with different injection volumes (a): 2000 m3, (b): 4000 m3, (c): 6000 m3; the red arrow is the compass.

Figure 14.
Curve of total injection volume versus cumulative oil production.
4.2.2. Injection Rate
Multiple simulation scenarios are designed to simulate the effect of injection rate according to the actual construction conditions of A21 well. The range of injection rate was set from 3 m3/min to 7 m3/min.
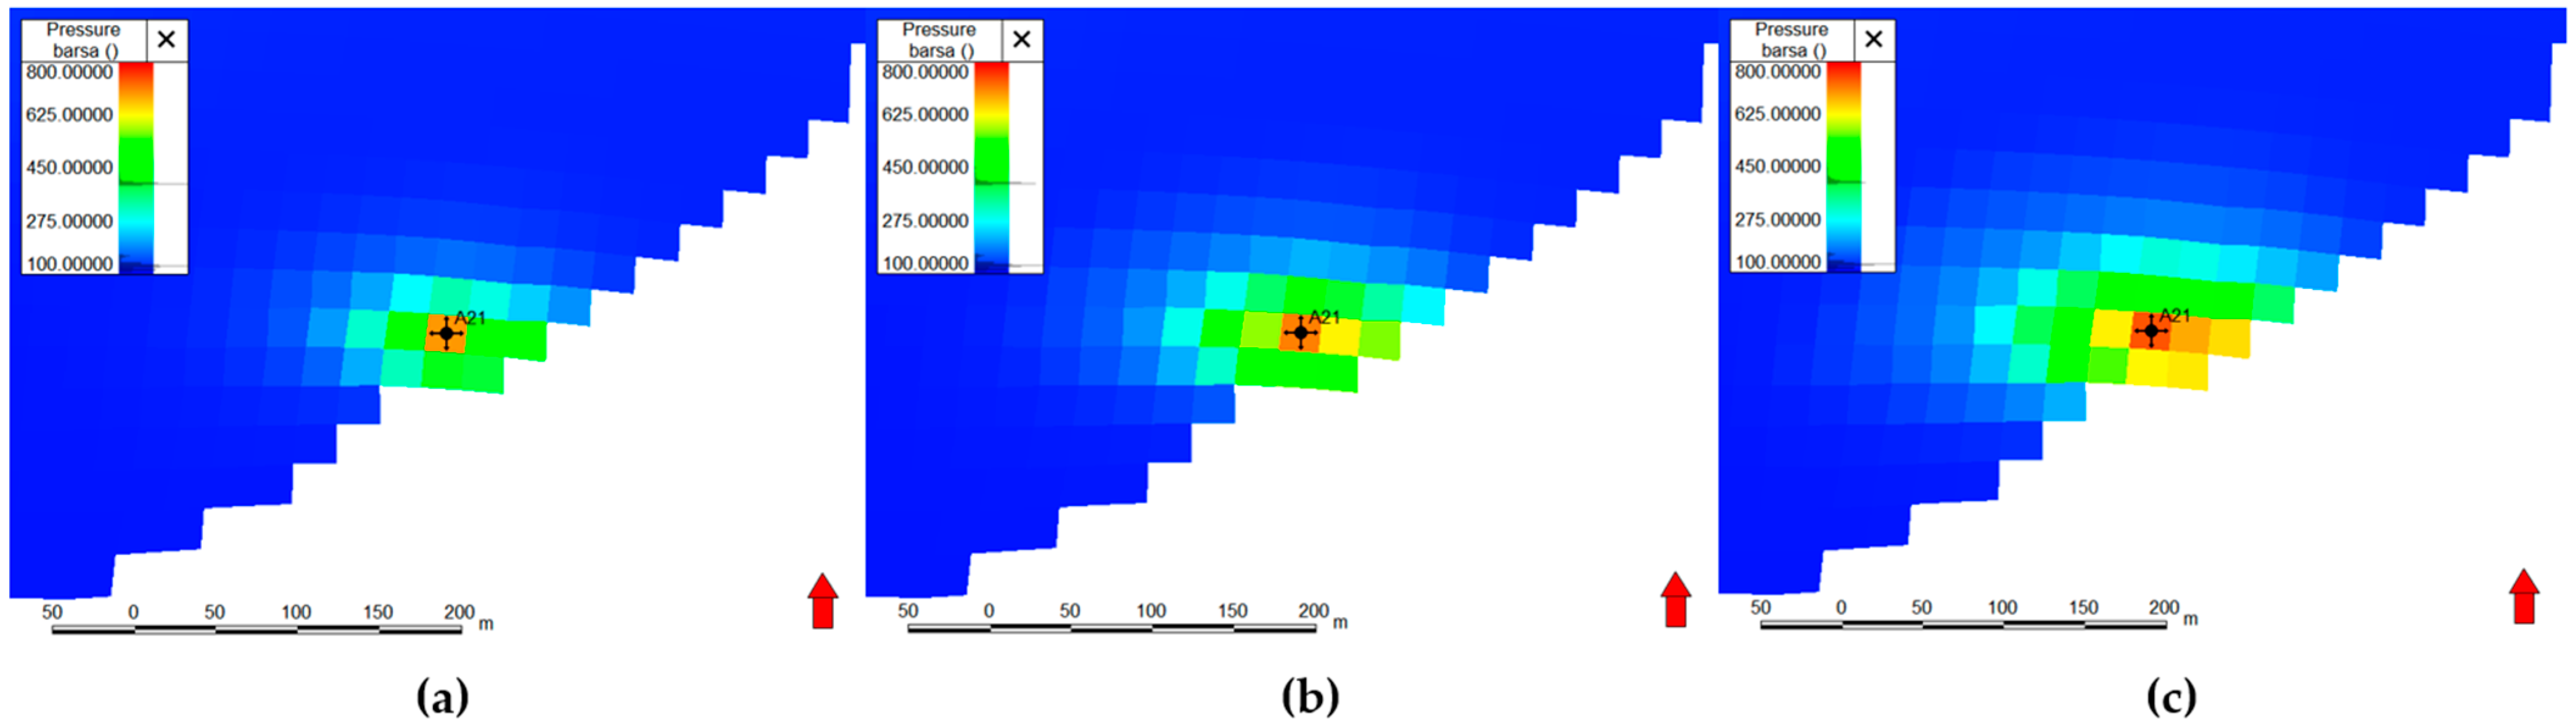
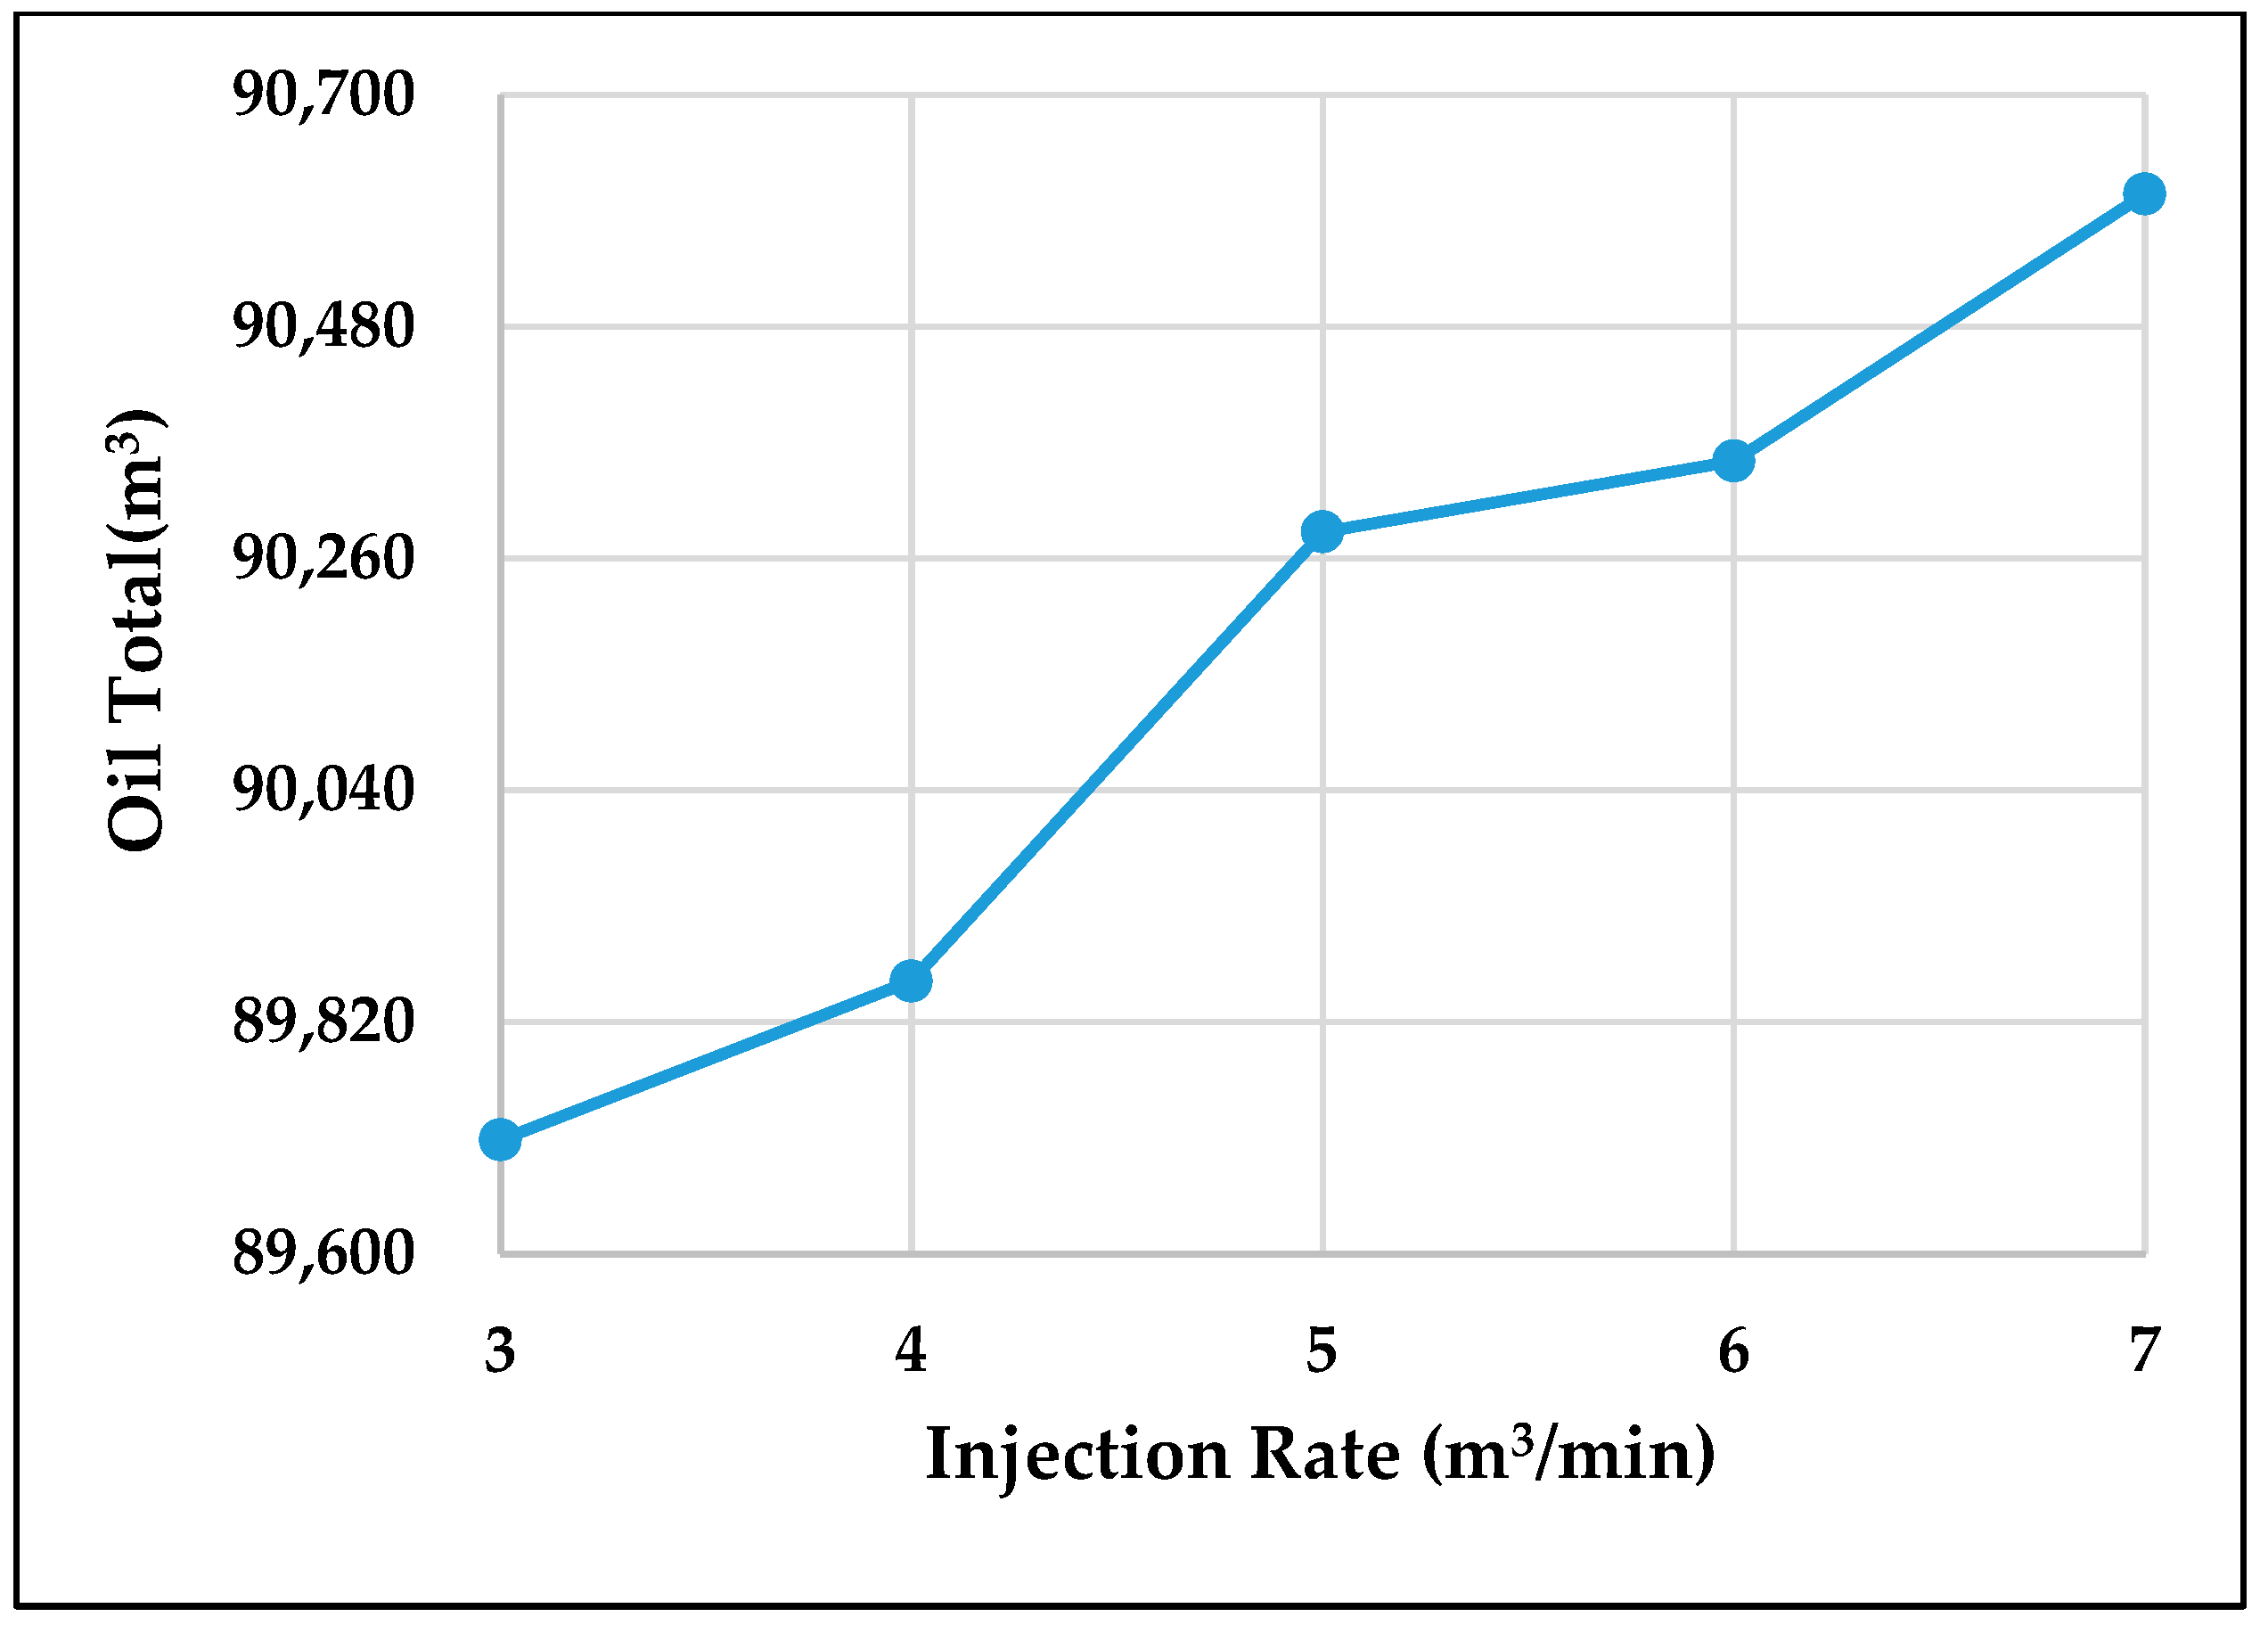
Under different injection speeds, the injection time of each stage was changed accordingly to keep the injection volume and bottomhole flow pressure unchanged. Figure 15 shows the formation pressure expansion at the end of fracturing flooding injection with different injection rates. From the figure, it is apparent that the higher the injection rate, the higher the formation pressure, but the pressure extension range is not very different. Figure 16 shows the displacement versus cumulative oil production curve. From the figure, it is apparent that, overall, the higher the injection rate, the higher the cumulative oil production. At an injection rate of 5 m3/min, there is a large increase in cumulative oil production, which is due to the increase in formation pressure increasing the area of the seam network. In addition, the difference in accumulated oil output between different injection rates is not large, and rising the injection rate is limited by the capacity of the equipment, so it is not necessary to use too high of an injection rate.
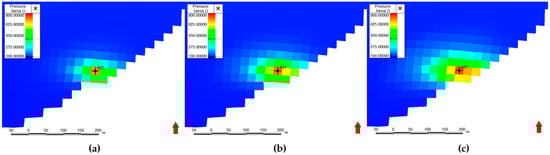
Figure 15.
Expansion of formation pressure with different injection rates (a):3 m3/min; (b):5 m3/min; (c): 7 m3/min; the red arrow is the compass.
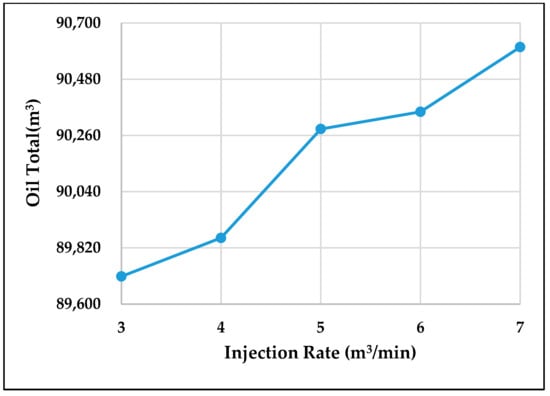
Figure 16.
Displacement versus cumulative oil production curve.
4.2.3. Well Shut-In Time
Odumabo et al. [42] found that increasing the well shut-in time increases effective permeability. Many researchers have used numerical simulation methods in the study of fracturing well shut-in time to study the effect of shut-in time on the increase in oil and gas production.
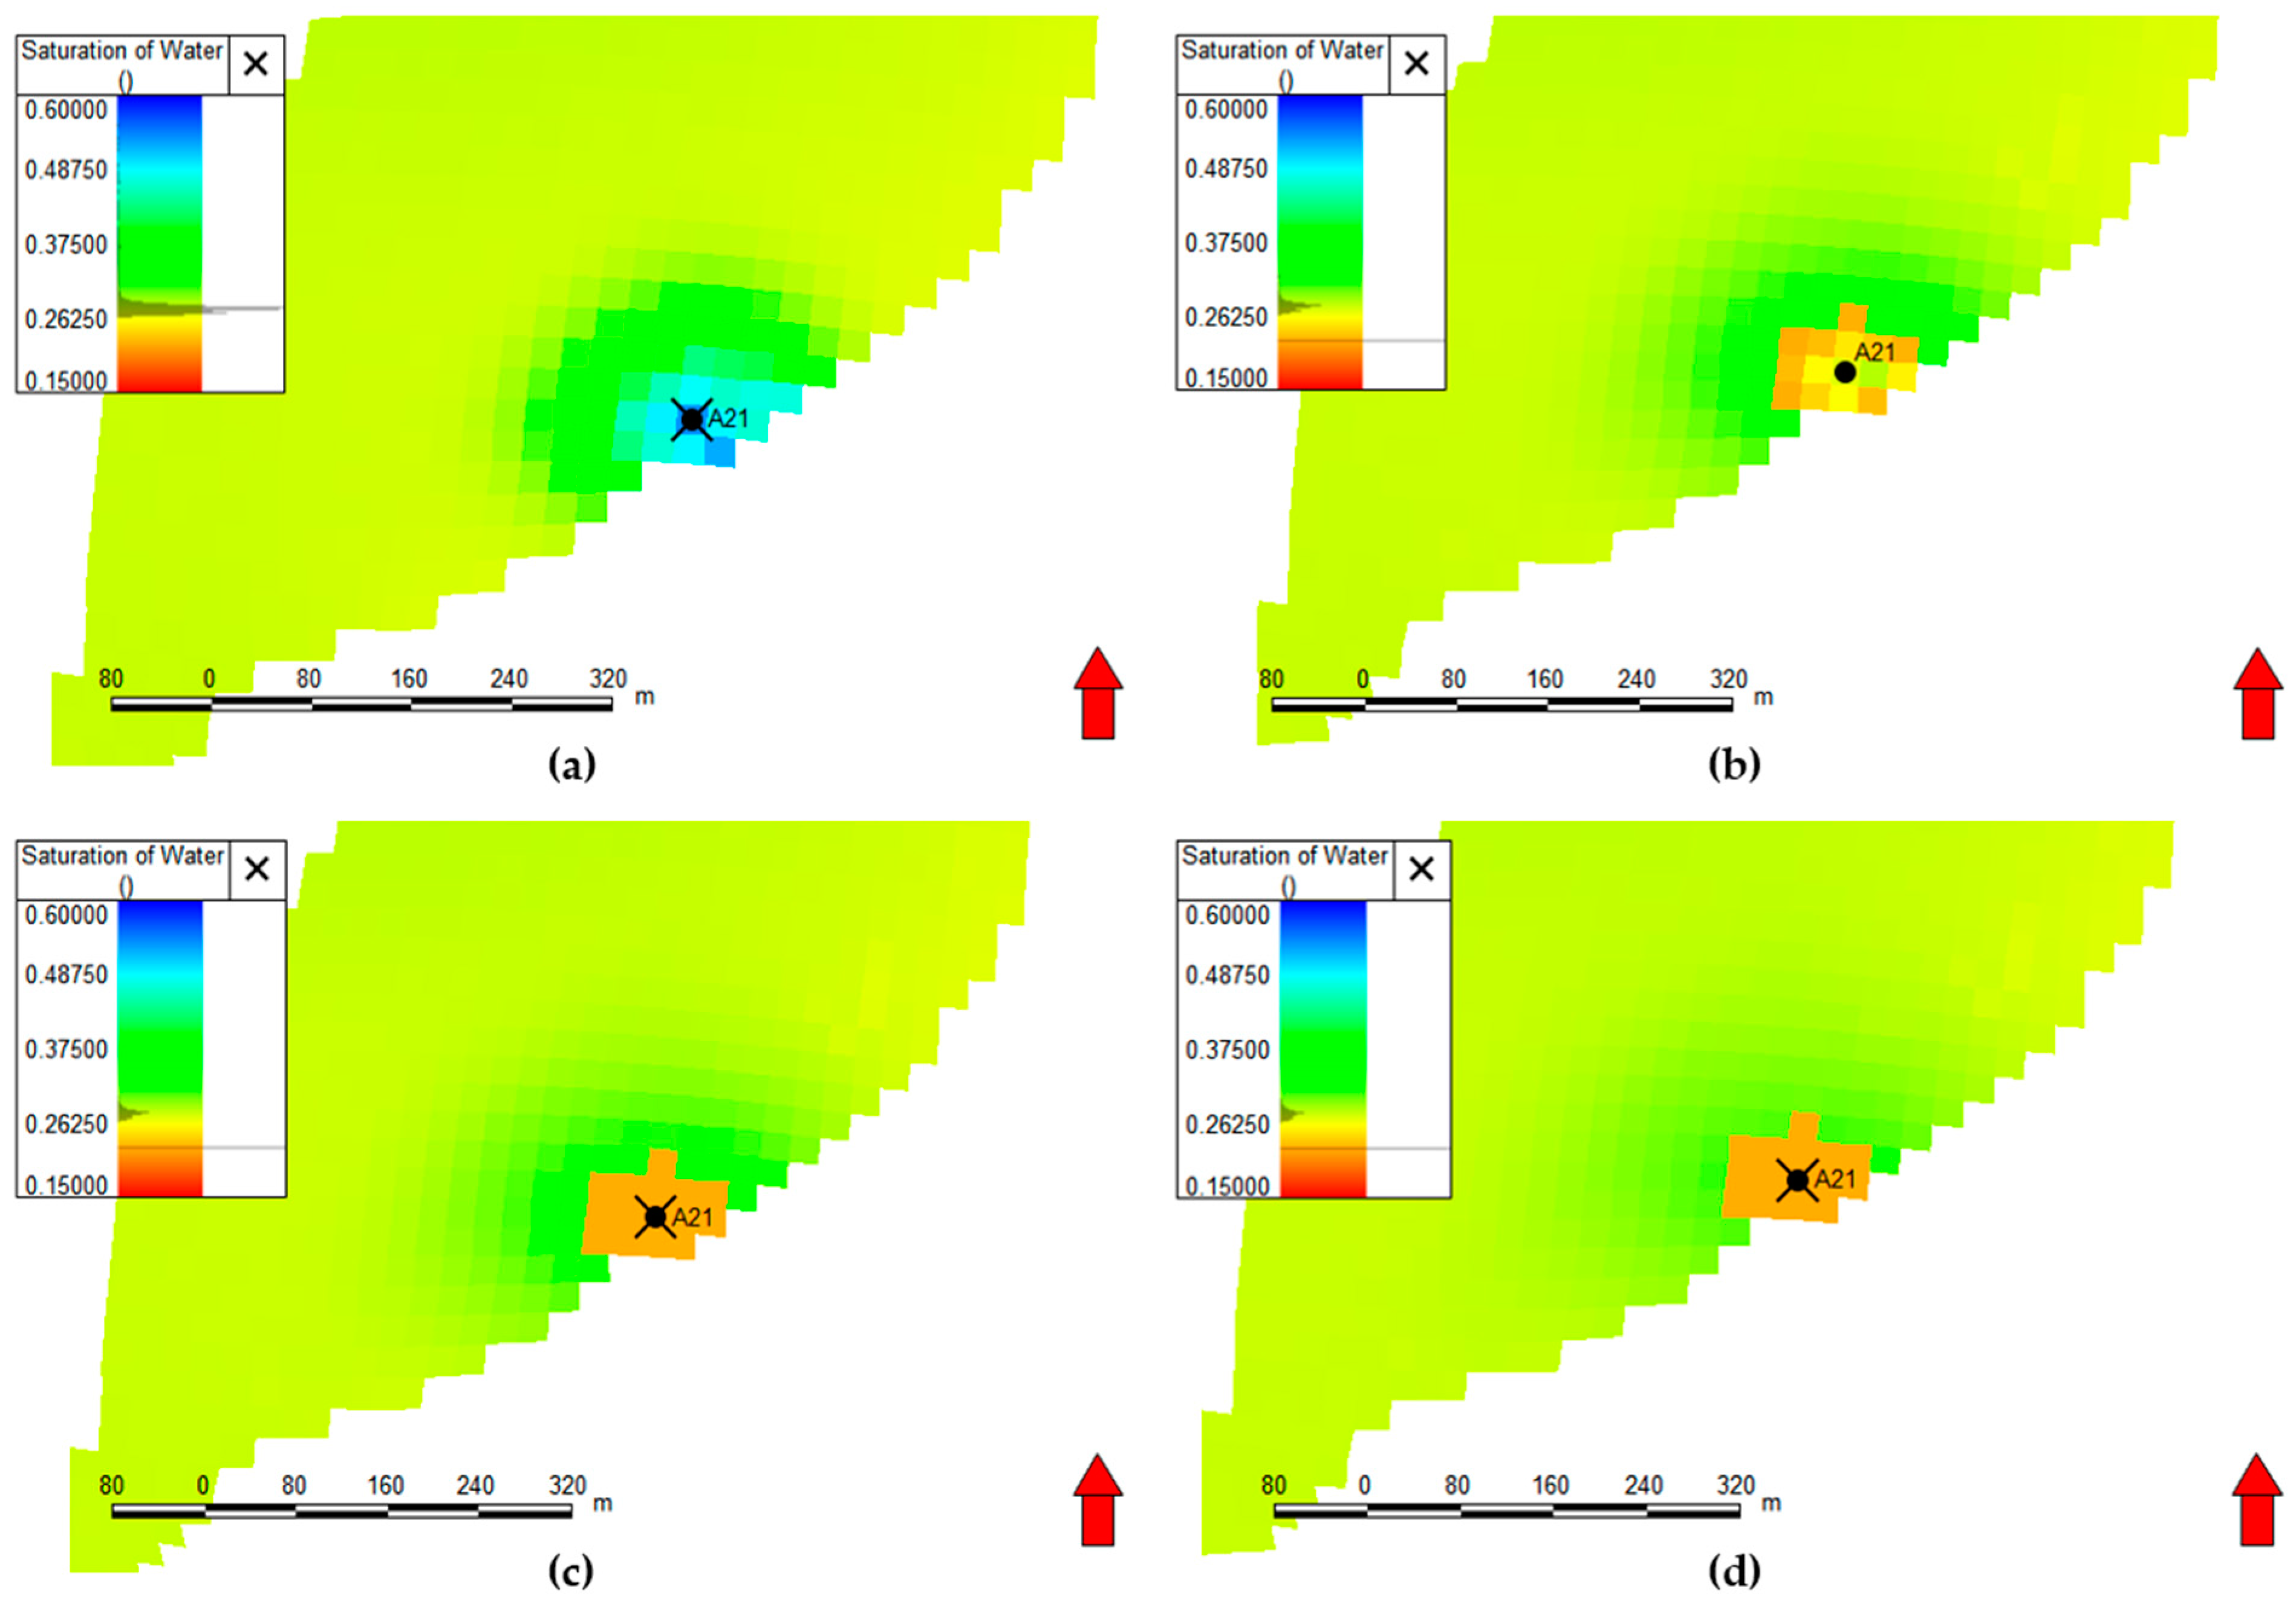
Multiple simulation schemes are developed to simulate the impact of well shut-in time according to the actual construction conditions of well A21. The variation ranges in well shut-in time were set as 1 day, 7 days, 15 days, and 30 days. Figure 17 shows the water saturation plan after different shut-in times and before the well is opened for production. From the figure, it can be seen that the longer the well shut-in time, the lower the water saturation before opening the well for production. This indicates that seepage oil extraction is at work during well shut-in, and the formation oil is driven from the pores to the microfractures through the capillary pressure difference.
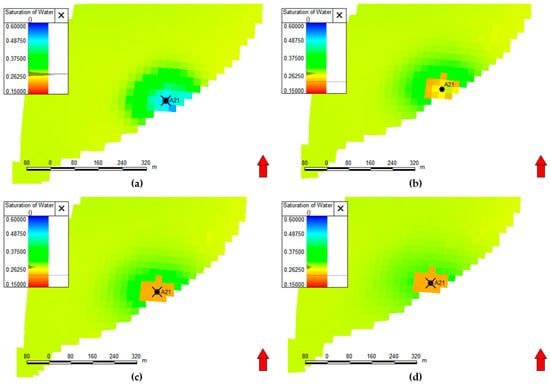
Figure 17.
Plot of water saturation after different shut-in times (a): 1 day; (b): 7 days; (c): 15 days; (d): 30 days; the red arrow is the compass.
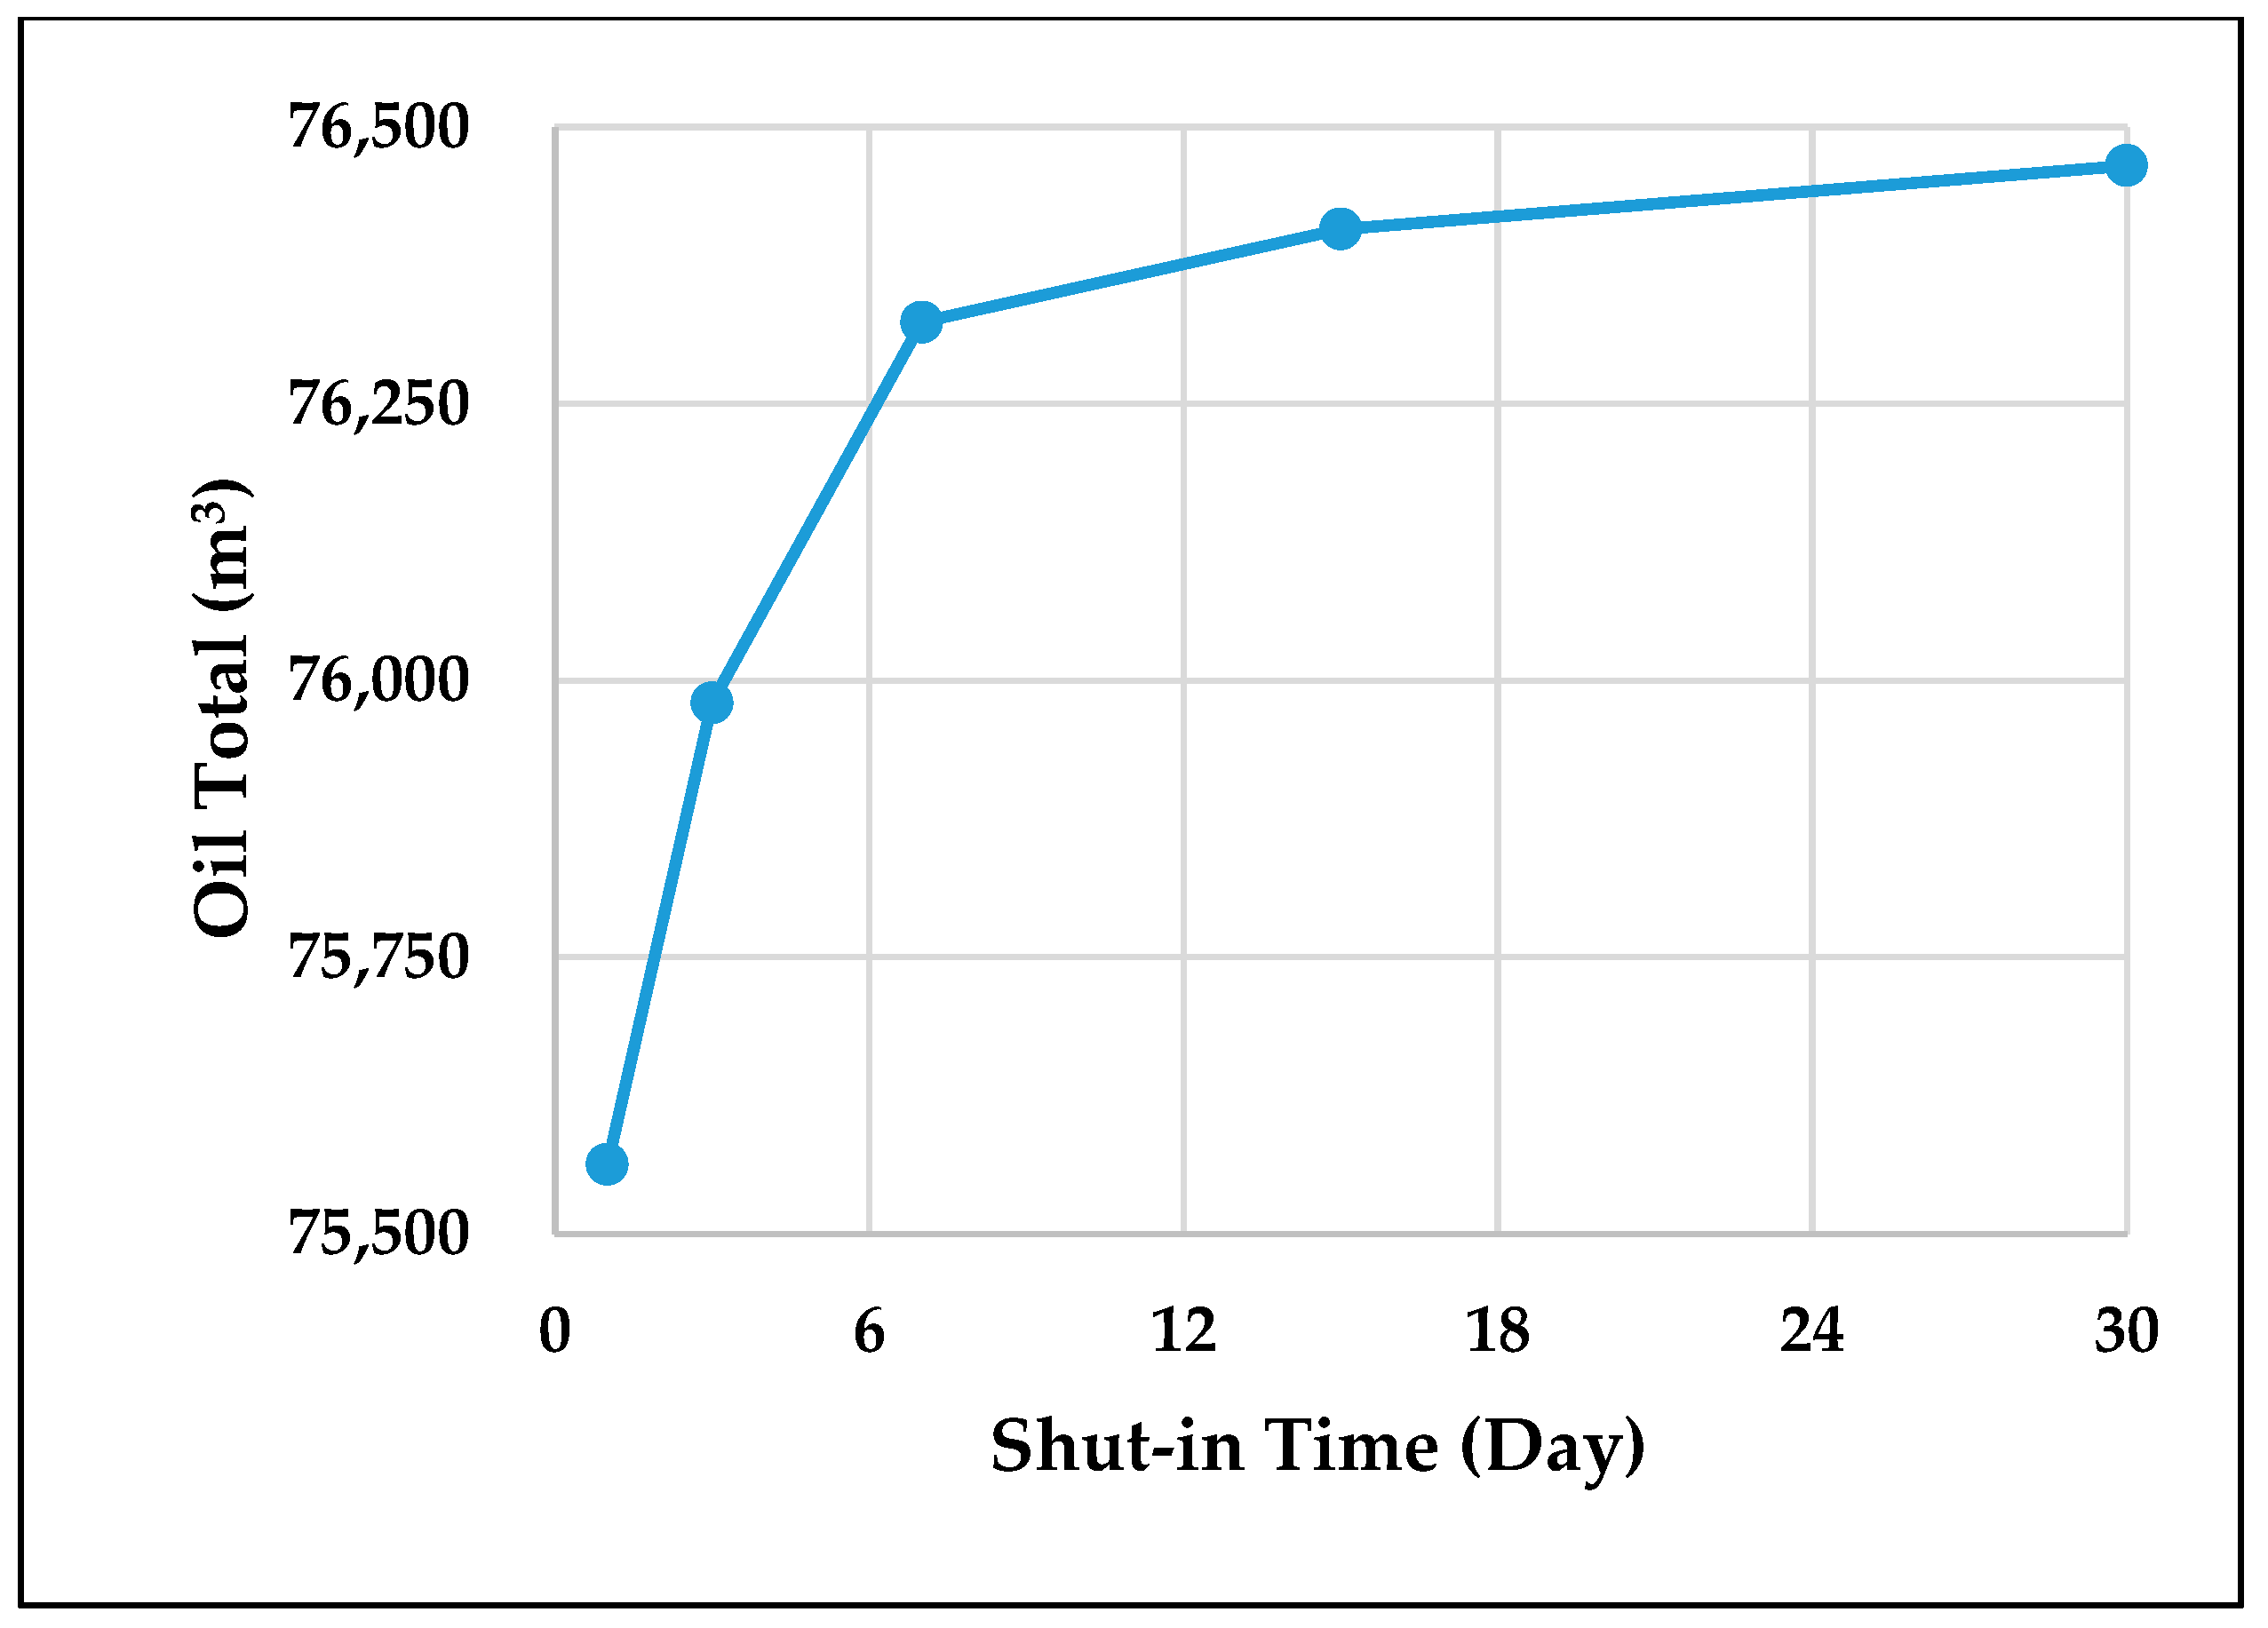
Figure 18 shows the curves of different shut-in times versus cumulative oil production. From the figure, the boost in cumulative oil production is no longer evident after a well shut-in time greater than 7 days. Therefore, there is no need to extend the well shut-in time. From the point of view of economic efficiency and improvement of early yield, 3–7 days of well shut-in is a better choice.

Figure 18.
Curve of different shut-in times versus cumulative oil production.
4.2.4. Fracture Half-Length
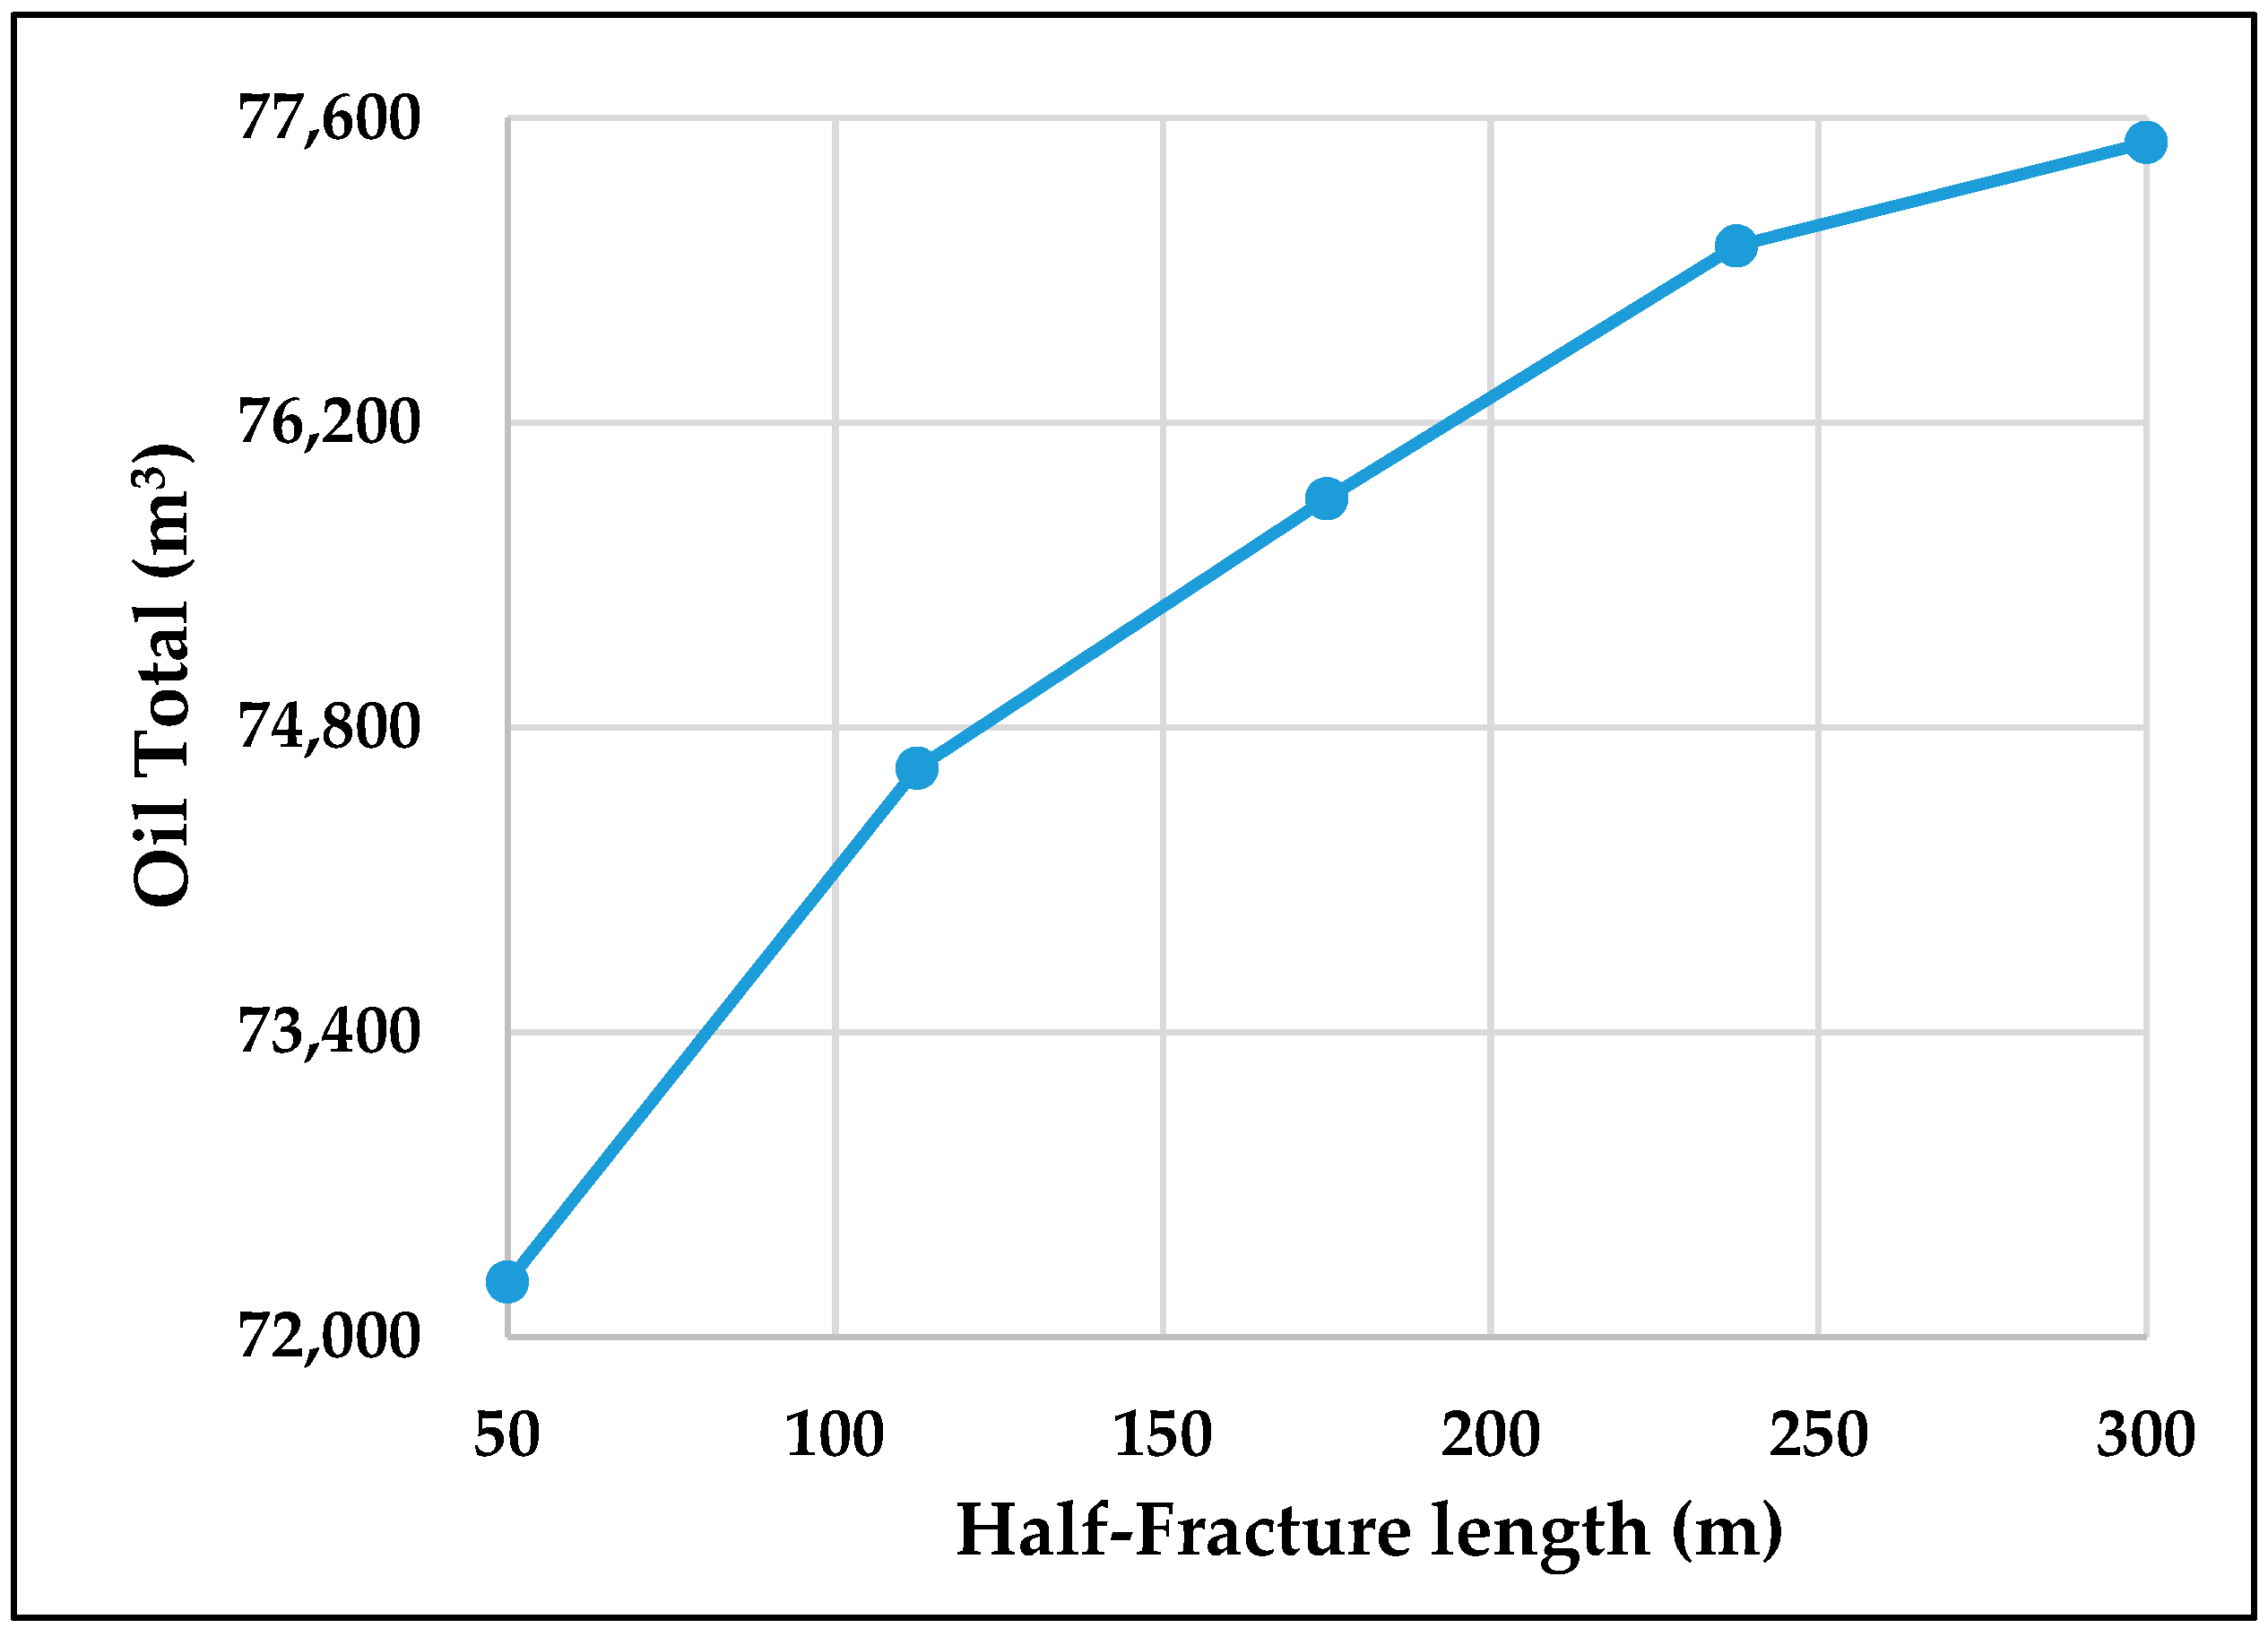
Fracture half-length is of great significance in the parameters of fracturing flooding of oil wells. The fracture half-length determines the extent of oil drainage around the well, and a longer fracture half-length can effectively expand the contact area between the well and the reservoir. Generally speaking, the longer the fracture, the larger the range of reservoirs affected and the stronger the ability to increase oil. Setting the set fracture half-length variation range is 50–300 m, as shown in Figure 19, comparing the variation in tired oil production.
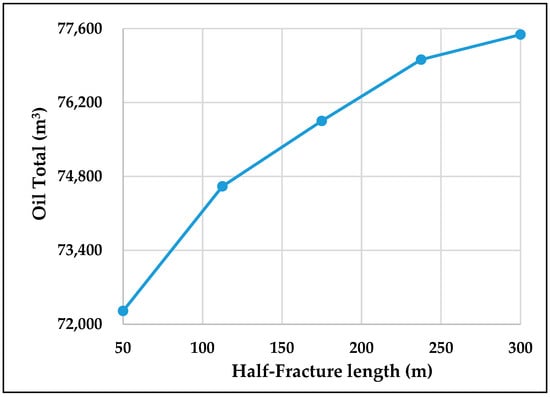
Figure 19.
Fracture half-length versus cumulative oil production curve.
It is evident that cumulative oil production rises with the increase in the fracture half-length, but during actual site-specific construction, depending on the construction pressure, it may be necessary to consider that excessively long fractures communicate with fractures in other wells, triggering water runoff problems.
4.2.5. Fracture Conductivity
The flow conductivity of a fracture refers to the ability of a proppant-filled fracture to pass fluids under the effect of reservoir geostress. Good fracture flow conductivity can make the distribution of the replacement fluid in the reservoir more uniform; in low-permeability reservoirs, due to the small pore size and poor connectivity of the rock, the fluid flow is difficult, and the greater the fracture flow conductivity, the easier the crude oil will be replaced. In the late stage of the reservoir extraction, most of the easy-to-extract crude oil has already been extracted, and the residual oil is mainly distributed in the reservoir’s tiny pore size and other difficult-to-extract areas. Fractures with high flow conductivity can penetrate deep into these areas and displace the remaining oil, thus improving the utilization rate of the remaining oil and increasing the final recovery rate.
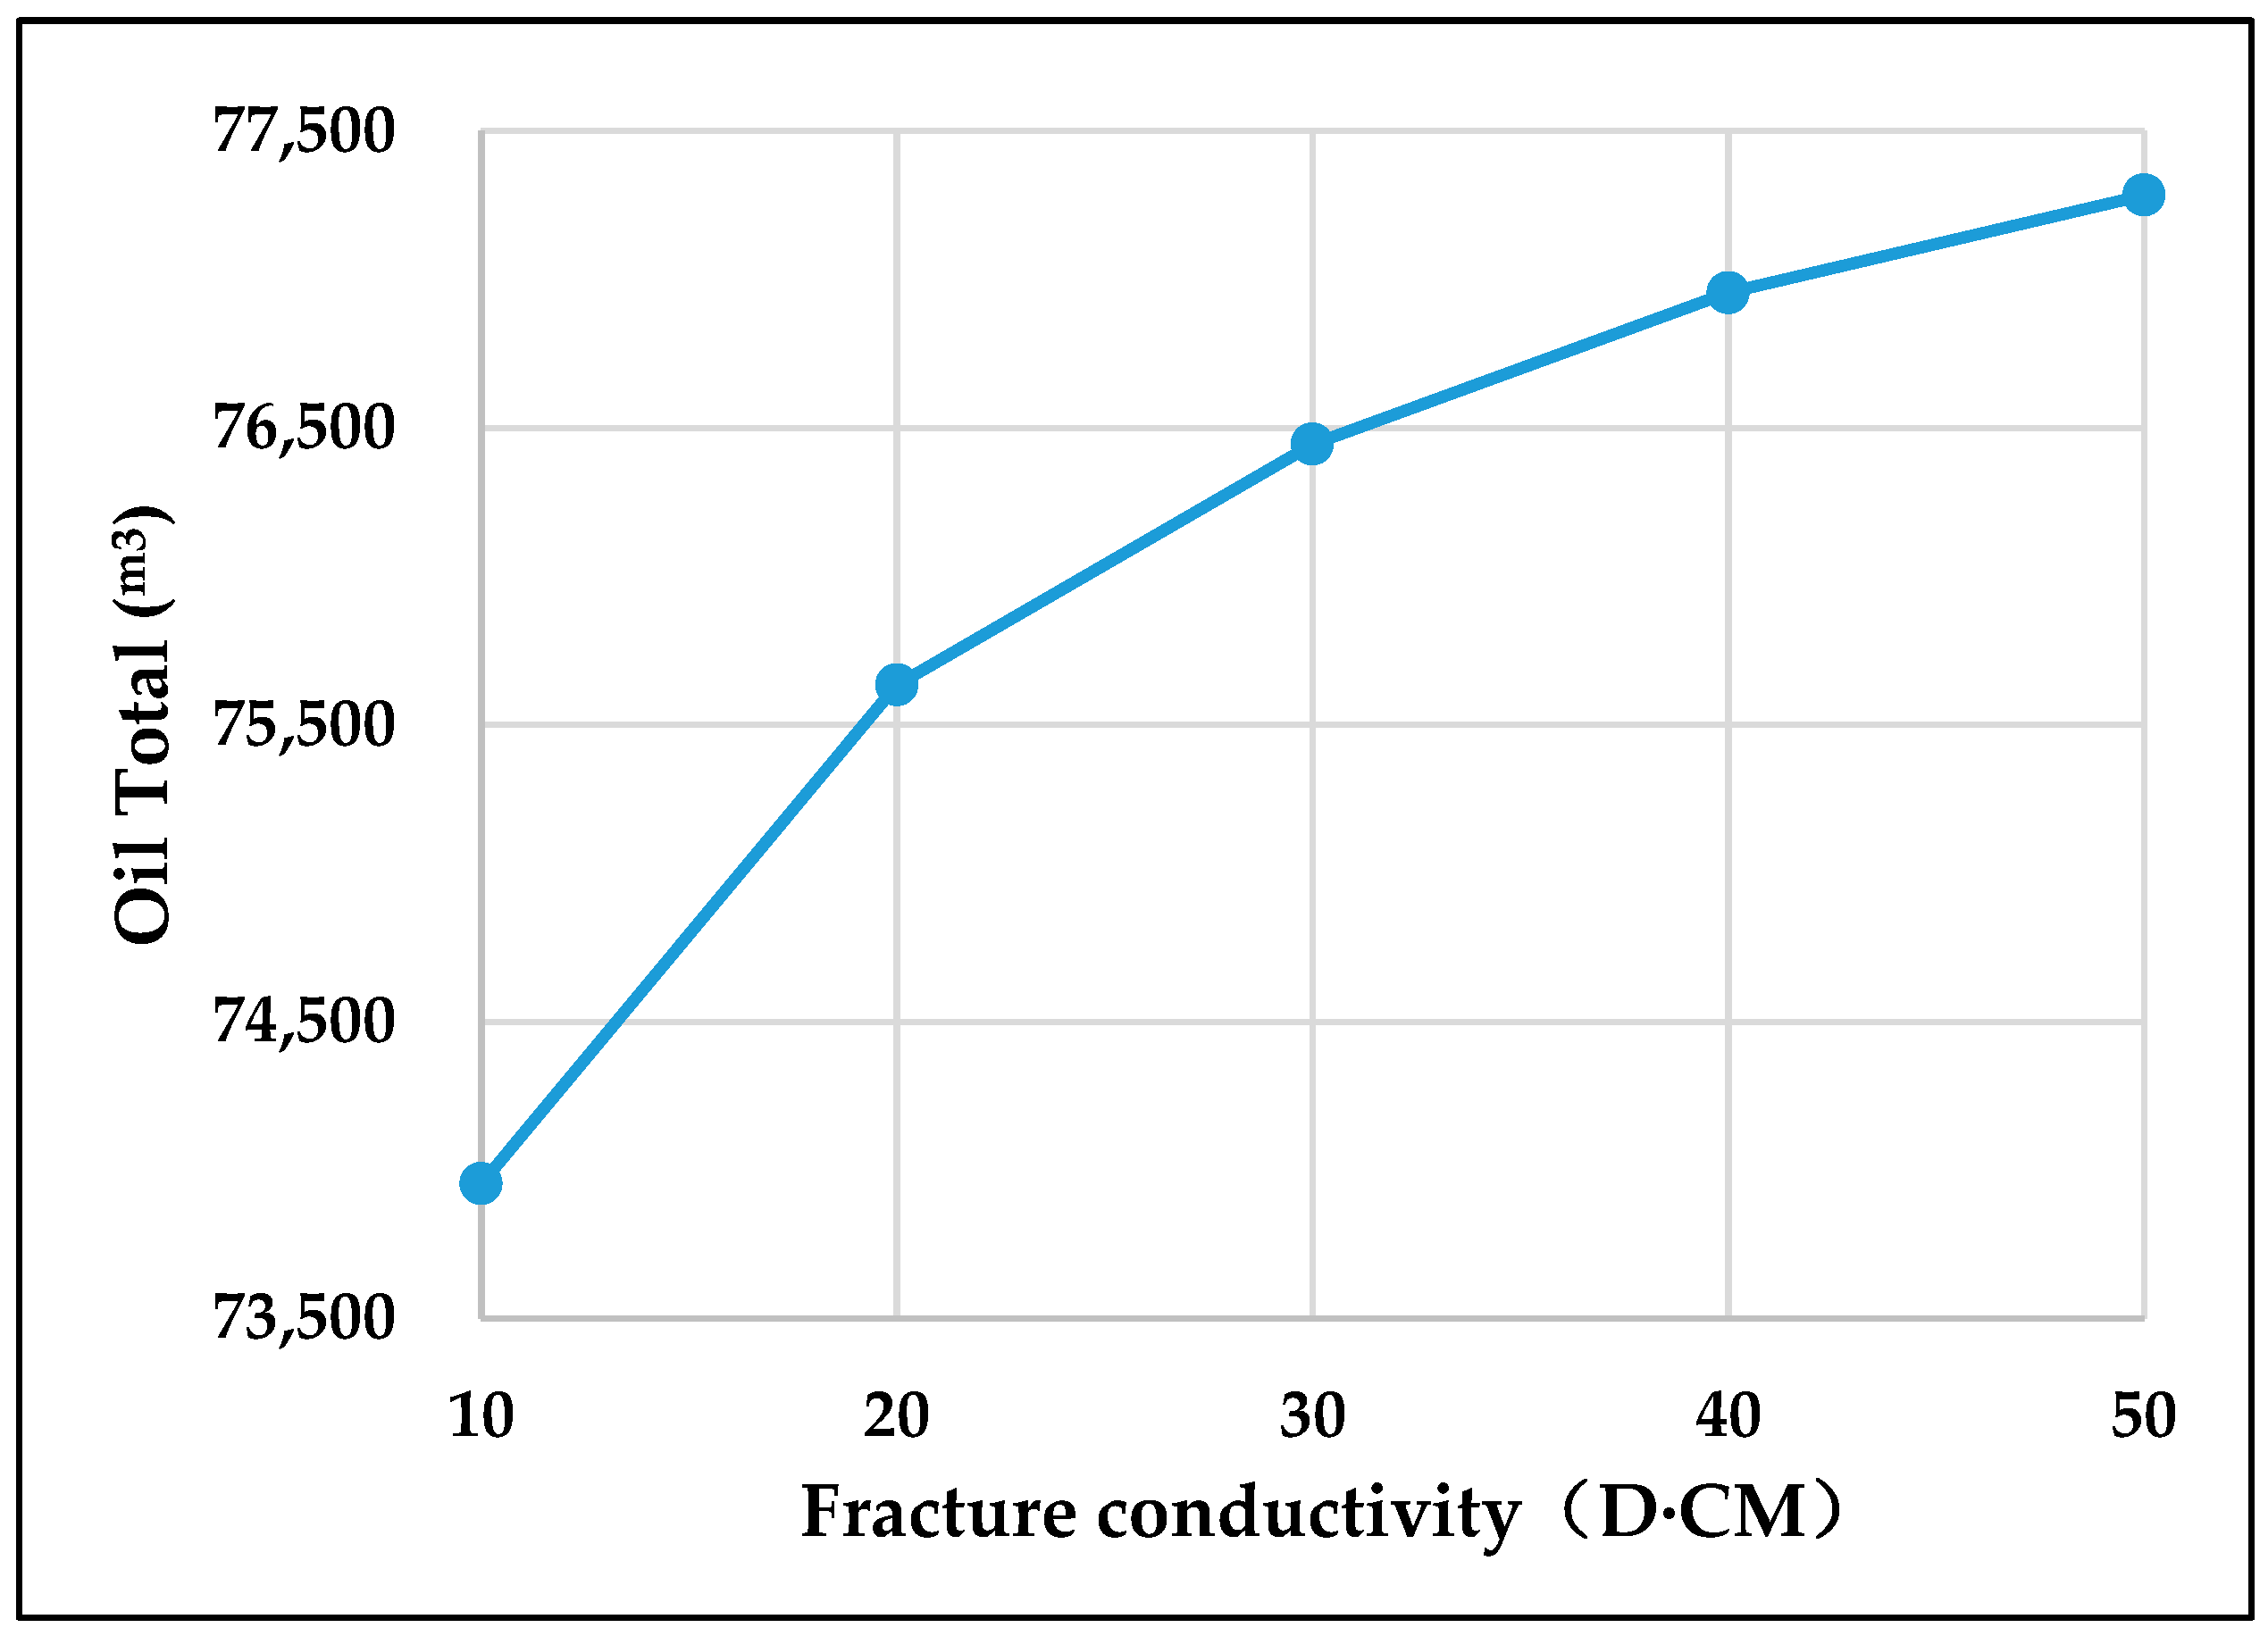
We set the range of variation in inflow capacity from 10 to 50 D·cm. As can be seen from Figure 20, the larger the inflow capacity, the larger the cumulative oil production, but the rate of increase gradually becomes slower. Different inflow capacity has a smaller effect on formation pressure. When the fracture conductivity is too large, the injected replacement fluid will preferentially flow rapidly along the fracture with high conductivity, and the injected water may break through the fracture rapidly to the production well during the reservoir development process, resulting in a smaller ripple volume, not effectively replacing the crude oil in the reservoir, lowering the ripple efficiency, and not being conducive to the enhancement of the recovery rate. Therefore, it is more appropriate to maintain the fracture conductivity capacity in the range of 20–30 D·cm.
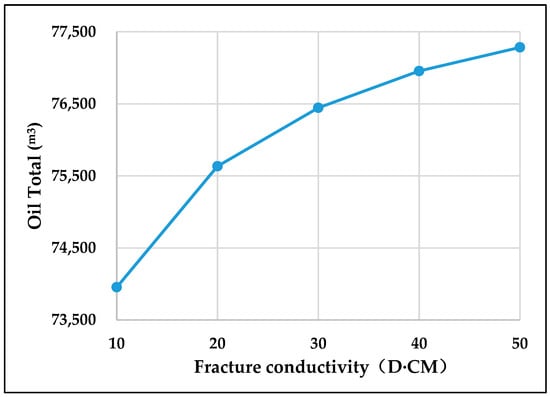
Figure 20.
Conductivity versus cumulative oil production curve.
Summary: The specific influence of fracturing flooding parameters on fracturing flooding is characterized by studying the fracture expansion law; then, the parameters of fracturing flooding are simulated from actual wells, and the parameters of fracturing flooding are optimized according to oil production. The numerical simulation study of well fracturing flooding carried out in this subsection, combined with the actual production, has a certain guiding significance for the development of fracturing flooding in offshore, low-permeability reservoirs.
5. Conclusions
This study into fracture propagation dynamics revealed that the cumulative injection volume significantly impacts both the fracture half-length and the conductivity. The increased injection rate correlated with the extended fracture half-length, whereas the inflow capacity remained relatively constant. For multiple rounds of fracturing flooding, the first round had the best oil increase effect, and the oil increase effect of the second round was only about 30% of that of the first round. The oil enhancement effect decreased in the following rounds. The fifth round had no oil enhancement effect. Additionally, it was noted that multiple rounds had no effect on fracture morphology and length.
The results indicated a positive correlation between the total injection volume and both the incremental oil production from fracturing flooding and the spatial extent of the stimulated reservoir area. Specifically, an increase in the total injection volume led to a greater volume of incremental oil recovery and a more extensive fracturing flooding zone. It was observed that higher injection rates resulted in elevated pressure levels near the wellbore. However, this increase in injection rate did not significantly alter the spreading of the area of the fracturing fluid within the reservoir. Additionally, it was noted that well shut-in time mainly affected early production—the longer the shut-in time, the higher the early oil production.
Finally, these results were combined with the fracture expansion mechanism model and A21 well model, and the analysis of fracturing flooding parameters based on the simulation results allowed for the following recommendations to be made: the total amount of fracturing flooding injection should be 15,000 m3, the injection rate should be 6 m3/min, the simmering time should be 3–7 days, and only one round of fracturing flooding is required.
Supplementary Materials
The following supporting information can be downloaded at: https://www.mdpi.com/article/10.3390/jmse13020282/s1. Introduction to the Supplementary Materials: Well A 21 of Weizhou 12-2 oilfield is located in the Beibu Gulf of the South China Sea and is an oil production well. The geological design report for the workover operation of the well records detail a basic overview of the well, a brief history of the production, the current production status and problems, the contents and purpose of the operation, the forecast of the indicators, the geological requirements of the operation, safety tips, and the accompanying maps in the attached tables and charts. The report provides detailed data and analysis of the well’s production status, from drilling to the current production status, including well position, well slope data, oil formation data, etc., and forecasts and plans for future operation contents and geological requirements.
Author Contributions
Conceptualization, S.J.; methodology, T.L. and Y.Z.; software, T.L. and J.W.; validation, Z.Z.; formal analysis, Z.Z. and J.W.; investigation, J.W.; resources, Y.Z.; data curation, Z.Z.; writing—original draft preparation, Z.Z.; writing—review and editing, S.J., T.L., J.W. and Y.Z.; visualization, Z.Z. and Y.Z.; supervision, S.J.; project administration, J.W.; funding acquisition, S.J. and T.L. All authors have read and agreed to the published version of the manuscript.
Funding
This research received no external funding.
Institutional Review Board Statement
Not applicable.
Informed Consent Statement
Not applicable.
Data Availability Statement
All data and materials are available on request from the corresponding author. The data are not publicly available due to ongoing research using some of the data.
Conflicts of Interest
Authors Jinwei Wang and Yafei Zhang were employed by the company China 595 Oilfield Services Limited. The remaining authors declare that the research was conducted in the 596 absence of any commercial or financial relationships that could be construed as a potential conflict 597 of interest.
References
- Zhang, K.; Zhang, L.; Liu, D. Situation of China’s oil and gas exploration and development in recent years and relevant suggestions. Acta Pet. Sin. 2022, 43, 15–28. [Google Scholar]
- Guo, J.; Ma, L.; Lu, C. Progress and development directions of fracturing flooding technology for tight reservoirs in China. Acta Pet. Sin. 2022, 43, 1788–1797. [Google Scholar]
- Huang, Y.; Jin, Z.; Qiao, C.; Zhang, H.; Ma, W. Practice of fracturing flooding and water injection technology in small fractured low permeability reservoirs in Jiangsu Oilfield. Petrochem. Appl. 2022, 41, 48–51. [Google Scholar]
- Wang, J.; Jiang, M.; Xiang, H.; Duan, Y.; Zhang, N.; Deng, Q. Research and application of new process of fracturing flooding in three types of oil reservoirs in Shanshan Oilfield. Tech. Superv. Pet. Ind. 2020, 36, 6–9. [Google Scholar]
- Zhang, Y. Reverse fracturing flooding of water-driven three types of oil reservoirs in SaZhong. Chem. Eng. Equip. 2022, 124–125, 130. [Google Scholar]
- Xu, D.; Wu, Y.; Xiong, Q.; Pu, X.; Feng, J.; Yue, S. Status and developmemt trend of fracturing-flooding technology in low pemeability reservoirs. Fract. Block Oil Gas Field 2024, 31, 533–540. [Google Scholar]
- He, J.; Wang, H. Design and Effect of Fracture-flooding in Class Ⅲ Oil Reservoirs. J. Southwest Pet. Univ. Nat. Sci. Ed. 2018, 40, 95–104. [Google Scholar]
- Sang, C.; Wang, P. Influencing Factors of High Pressure Flooding Effect in Low Permeability Reservoir. J. Beijing Inst. Petrochem. Technol. 2023, 31, 27–32. [Google Scholar]
- Gao, J. Design and application of fracturing flooding water injection program in Niu 35 block. Neijiang Sci. Technol. 2022, 43, 28–29. [Google Scholar]
- Ma, Y. Application of fracturing-flooding EOR technique in Type Ⅲ oil reservoirs in Daqing Placanticline Oilfield. Daqing Pet. Geol. Dev. 2021, 40, 103–109. [Google Scholar]
- Liu, Y.; Wang, F.; Wang, Y.; Li, B.; Zhang, D.; Yang, G.; Zhi, J.; Sun, S.; Wang, X.; Deng, Q.; et al. Mechanism of fracturing flooding for enhanced recovery in medium and low permeability reservoirs. Pet. Explor. Dev. 2022, 49, 752–759. [Google Scholar] [CrossRef]
- Dang, Z.; An, N.; Yang, L.; Huang, G. Study on effective displacement pressure system of ultra-low permeability reservoir. Petrochem. Appl. 2022, 41, 62–68. [Google Scholar]
- Burdine, N.T. Relative permeability calculations from pore size distribution data. J. Pet. Technol. 1953, 5, 71–78. [Google Scholar] [CrossRef]
- Mattax, C.C.; Kyte, J.R. Imbibition oil recovery from fractured, water-drive reservoir. Soc. Pet. Eng. J. 1962, 2, 177–184. [Google Scholar] [CrossRef]
- Warren, J.E.; Root, P.J. The Behavior of Naturally Fractured Reservoirs. Soc. Pet. Eng. J. 1963, 3, 245–255. [Google Scholar] [CrossRef]
- Land, C.S. Calculation of imbibition relative permeability for two-and three-phase flow from rock properties. Soc. Pet. Eng. J. 1968, 8, 149–156. [Google Scholar] [CrossRef]
- Yamamoto, R.H.; Padgett, J.B.; Ford, W.T.; Boubeguira, A. Compositional reservoir simulator for fissured systems—The single-block model. Soc. Pet. Eng. J. 1971, 11, 113–128. [Google Scholar] [CrossRef]
- Carter, B.J.; Desroches, J.; Ingraffea, A.R.; Wawrzynek, P.A. Simulating fully 3D hydraulic fracturing. Model. Geomech. 2000, 200, 525–557. [Google Scholar]
- Davies, R.J.; Mathias, S.A.; Moss, J.; Hustoft, S.; Newport, L. Hydraulic fractures: How far can they go? Mar. Pet. Geol. 2012, 37, 1–6. [Google Scholar] [CrossRef]
- King, G.E. Thirty years of gas shale fracturing: What have we learned? In Proceedings of the SPE Annual Technical Conference and Exhibition, Florence, Italy, 20–22 September 2010, SPE: Dallas, TX, USA, 2010; SPE-133456-MS.
- Huang, L.; Liu, J.; Zhang, F.; Fu, H.; Zhu, H.; Damjanac, B. 3D lattice modeling of hydraulic fracture initiation and near-wellbore propagation for different perforation models. J. Pet. Sci. Eng. 2020, 191, 107169. [Google Scholar] [CrossRef]
- Komoróczi, A.; Abe, S.; Urai, J.L. Meshless numerical modeling of brittle–viscous deformation: First results on boudinage and hydrofracturing using a coupling of discrete element method (DEM) and smoothed particle hydrodynamics (SPH). Comput. Geosci. 2013, 17, 373–390. [Google Scholar] [CrossRef]
- Sun, Y.; Liu, Z.; Tang, X. A hybrid FEMM-Phase field method for fluid-driven fracture propagation in three dimensions. Eng. Anal. Bound. Elem. 2020, 113, 40–54. [Google Scholar] [CrossRef]
- Yang, Y.; Ren, X.; Zhou, L.; Lu, Y. Numerical study on competitive propagation of multi-perforation fractures considering full hydro-mechanical coupling in fracture-pore dual systems. J. Pet. Sci. Eng. 2020, 191, 107–109. [Google Scholar] [CrossRef]
- Wang, H.; Liu, H.; Wu, H.A.; Zhang, G.M.; Wang, X.X. A 3D nonlinear fluid-solid coupling model of hydraulic fracturing for multilayered reservoirs. Pet. Sci. Technol. 2012, 30, 2273–2283. [Google Scholar] [CrossRef]
- Shin, D.H.; Sharma, M.M. Factors controlling the simultaneous propagation of multiple competing fractures in a horizontal well. In Proceedings of the SPE Hydraulic Fracturing Technology Conference and Exhibition, The Woodlands, TX, USA, 4–6 February 2014; SPE: Dallas, TX, USA, 2014. SPE-168599-MS. [Google Scholar]
- Paluszny, A.; Salimzadeh, S.; Zimmerman, R.W. Finite-element modeling of the growth and interaction of hydraulic fractures in poroelastic rock formations. In Hydraulic Fracture Modeling; Gulf Professional Publishing: Houston, TX, USA, 2018; pp. 1–19. [Google Scholar]
- Salimzadeh, S.; Paluszny, A.; Zimmerman, R.W. Effect of cold CO2 injection on fracture apertures and growth. Int. J. Greenh. Gas Control 2018, 74, 130–141. [Google Scholar] [CrossRef]
- Wu, B.; Wu, G.; Wang, L.; Lou, Y.; Liu, S.; Yin, B.; Li, S. Study on Fracturing Parameters Optimization of Horizontal Wells in Low-Permeability Reservoirs in South China Sea. Processes 2023, 11, 2999. [Google Scholar] [CrossRef]
- Zhang, Y.; Yang, Y.; Sun, Z.; Yu, C.; Sun, Q.; Bei, J. Physical simulation of fracturing-flooding and quantitative characterization of fractures in low-permeability oil reservoirs. Oil Gas Geol. Recovery 2022, 29, 143–149. [Google Scholar]
- Cha, L.; Feng, Q.; Wang, S.; Xu, S.; Liu, G.; Huang, W. Numerical Simulation of Fracture-flooding with Virtual Element Method in a Continuous Damage Model. Comput. Phys. 2023, 40, 81–90. [Google Scholar]
- Yang, Y.; Zhang, S.; Cao, X.; Lu, Q.; Wang, J.; Liu, H.; Yu, C.; Sun, H. Practice and understanding of pressure drive development technology for low-permeability reservoirs in Shengli Oilfield. Oil Gas Geol. Recovery 2023, 30, 61–71. [Google Scholar]
- Sun, Q.; Zhang, Y.; Yu, C.; Sun, Z.; Cao, H.; Yang, L. Experimental study on fracture initiation and propagation characteristics caused by pressure drive in low-permeability sandstone reservoirs. Oil Gas Geol. Recovery 2024, 31, 160–167. [Google Scholar]
- Zhang, S.; Yang, Y.; Cao, X.; Liu, H.; Wang, J.; Sun, Z. Advanced fracturing-flooding technique and its application in ultra-low permeability beach-bar sandbody reservoir. Daqing Pet. Geol. Dev. 2024, 43, 193–202. [Google Scholar]
- Da, Y.; Xue, X.; Liu, M. Energy Enhancement Mechanism of Energy Storage Refracturing in Ultra-low Permeability Oil Fields. Sci. Technol. Eng. 2021, 21, 14139–14146. [Google Scholar]
- Zhang, H.; Jin, Z.; Ma, W. Numerical simulation of pressure flooding design for low-permeability reservoirs. Complex Reserv. 2023, 16, 347–351. [Google Scholar]
- Cui, C.; Wang, J.; Wu, Z.; Sui, Y.; Li, J.; Lu, S. Establishment and Application of Pressure Drive Dynamic Fracture Model for Tight Oil Reservoirs. Spec. Reserv. 2023, 30, 87–95. [Google Scholar]
- Lu, C.; Ma, L.; Guo, J.; Zhao, L.; Xu, S.; Chen, B.; Zhou, Y.; Yuan, H.; Tang, Z. Fracture Parameters Optimization and Field Application in Low-Permeability Sandstone Reservoirs under Fracturing Flooding Conditions. Processes 2023, 11, 285. [Google Scholar] [CrossRef]
- Deng, X.; Yang, X.; You, L.; Wu, S.; Zhong, S.; Zhu, P.; Dai, L. Characteristics and constrains of low-permeability reservoirs in the first member of Eocene Liushagang Formation, Weixinan Sag, Beibuwan Basin. Petroleum Exp. Geol. 2021, 43, 628–637. [Google Scholar]
- Bogachev, K.Y.; Piskovskiy, E.V.; Piatsky, G.G. A method for the coupled solution of the filtration problem and the system of elasticity equations. Numer. Methods Program. 2017, 18, 221–226. [Google Scholar]
- Belousov, V.V. Structural Geology; Moscow State University: Moscow, Russia, 1986. [Google Scholar]
- Odumabo, S.M.; Karpyn, Z.T. Investigation of gas flow hindrance due to fracturing fluid leakoff in low permeability sandstones. J. Nat. Gas Sci. Eng. 2014, 17, 1–12. [Google Scholar] [CrossRef]


Disclaimer/Publisher’s Note: The statements, opinions and data contained in all publications are solely those of the individual author(s) and contributor(s) and not of MDPI and/or the editor(s). MDPI and/or the editor(s) disclaim responsibility for any injury to people or property resulting from any ideas, methods, instructions or products referred to in the content. |
© 2025 by the authors. Licensee MDPI, Basel, Switzerland. This article is an open access article distributed under the terms and conditions of the Creative Commons Attribution (CC BY) license (https://creativecommons.org/licenses/by/4.0/).