Abstract
In container terminal operations, truck lifting accidents pose a serious threat to the safety and efficiency of automated equipment. Traditional detection methods using visual cameras and single-line Light Detection and Ranging (LiDAR) are insufficient for capturing three-dimensional spatial features, leading to reduced detection accuracy. Moreover, the boundary features of key accident objects, such as containers, truck chassis, and wheels, are often blurred, resulting in frequent false and missed detections. To tackle these challenges, this paper proposes an accident detection method based on multi-line LiDAR and an improved PointNet++ model. This method uses multi-line LiDAR to collect point cloud data from operational lanes in real time and enhances the PointNet++ model by integrating a multi-layer perceptron (MLP) and a mixed attention mechanism (MAM), optimizing the model’s ability to extract local and global features. This results in high-precision semantic segmentation and accident detection of critical structural point clouds, such as containers, truck chassis, and wheels. Experiments confirm that the proposed method achieves superior performance compared to the current mainstream algorithms regarding point cloud segmentation accuracy and stability. In engineering tests across various real-world conditions, the model exhibits strong generalization capability.
1. Introduction
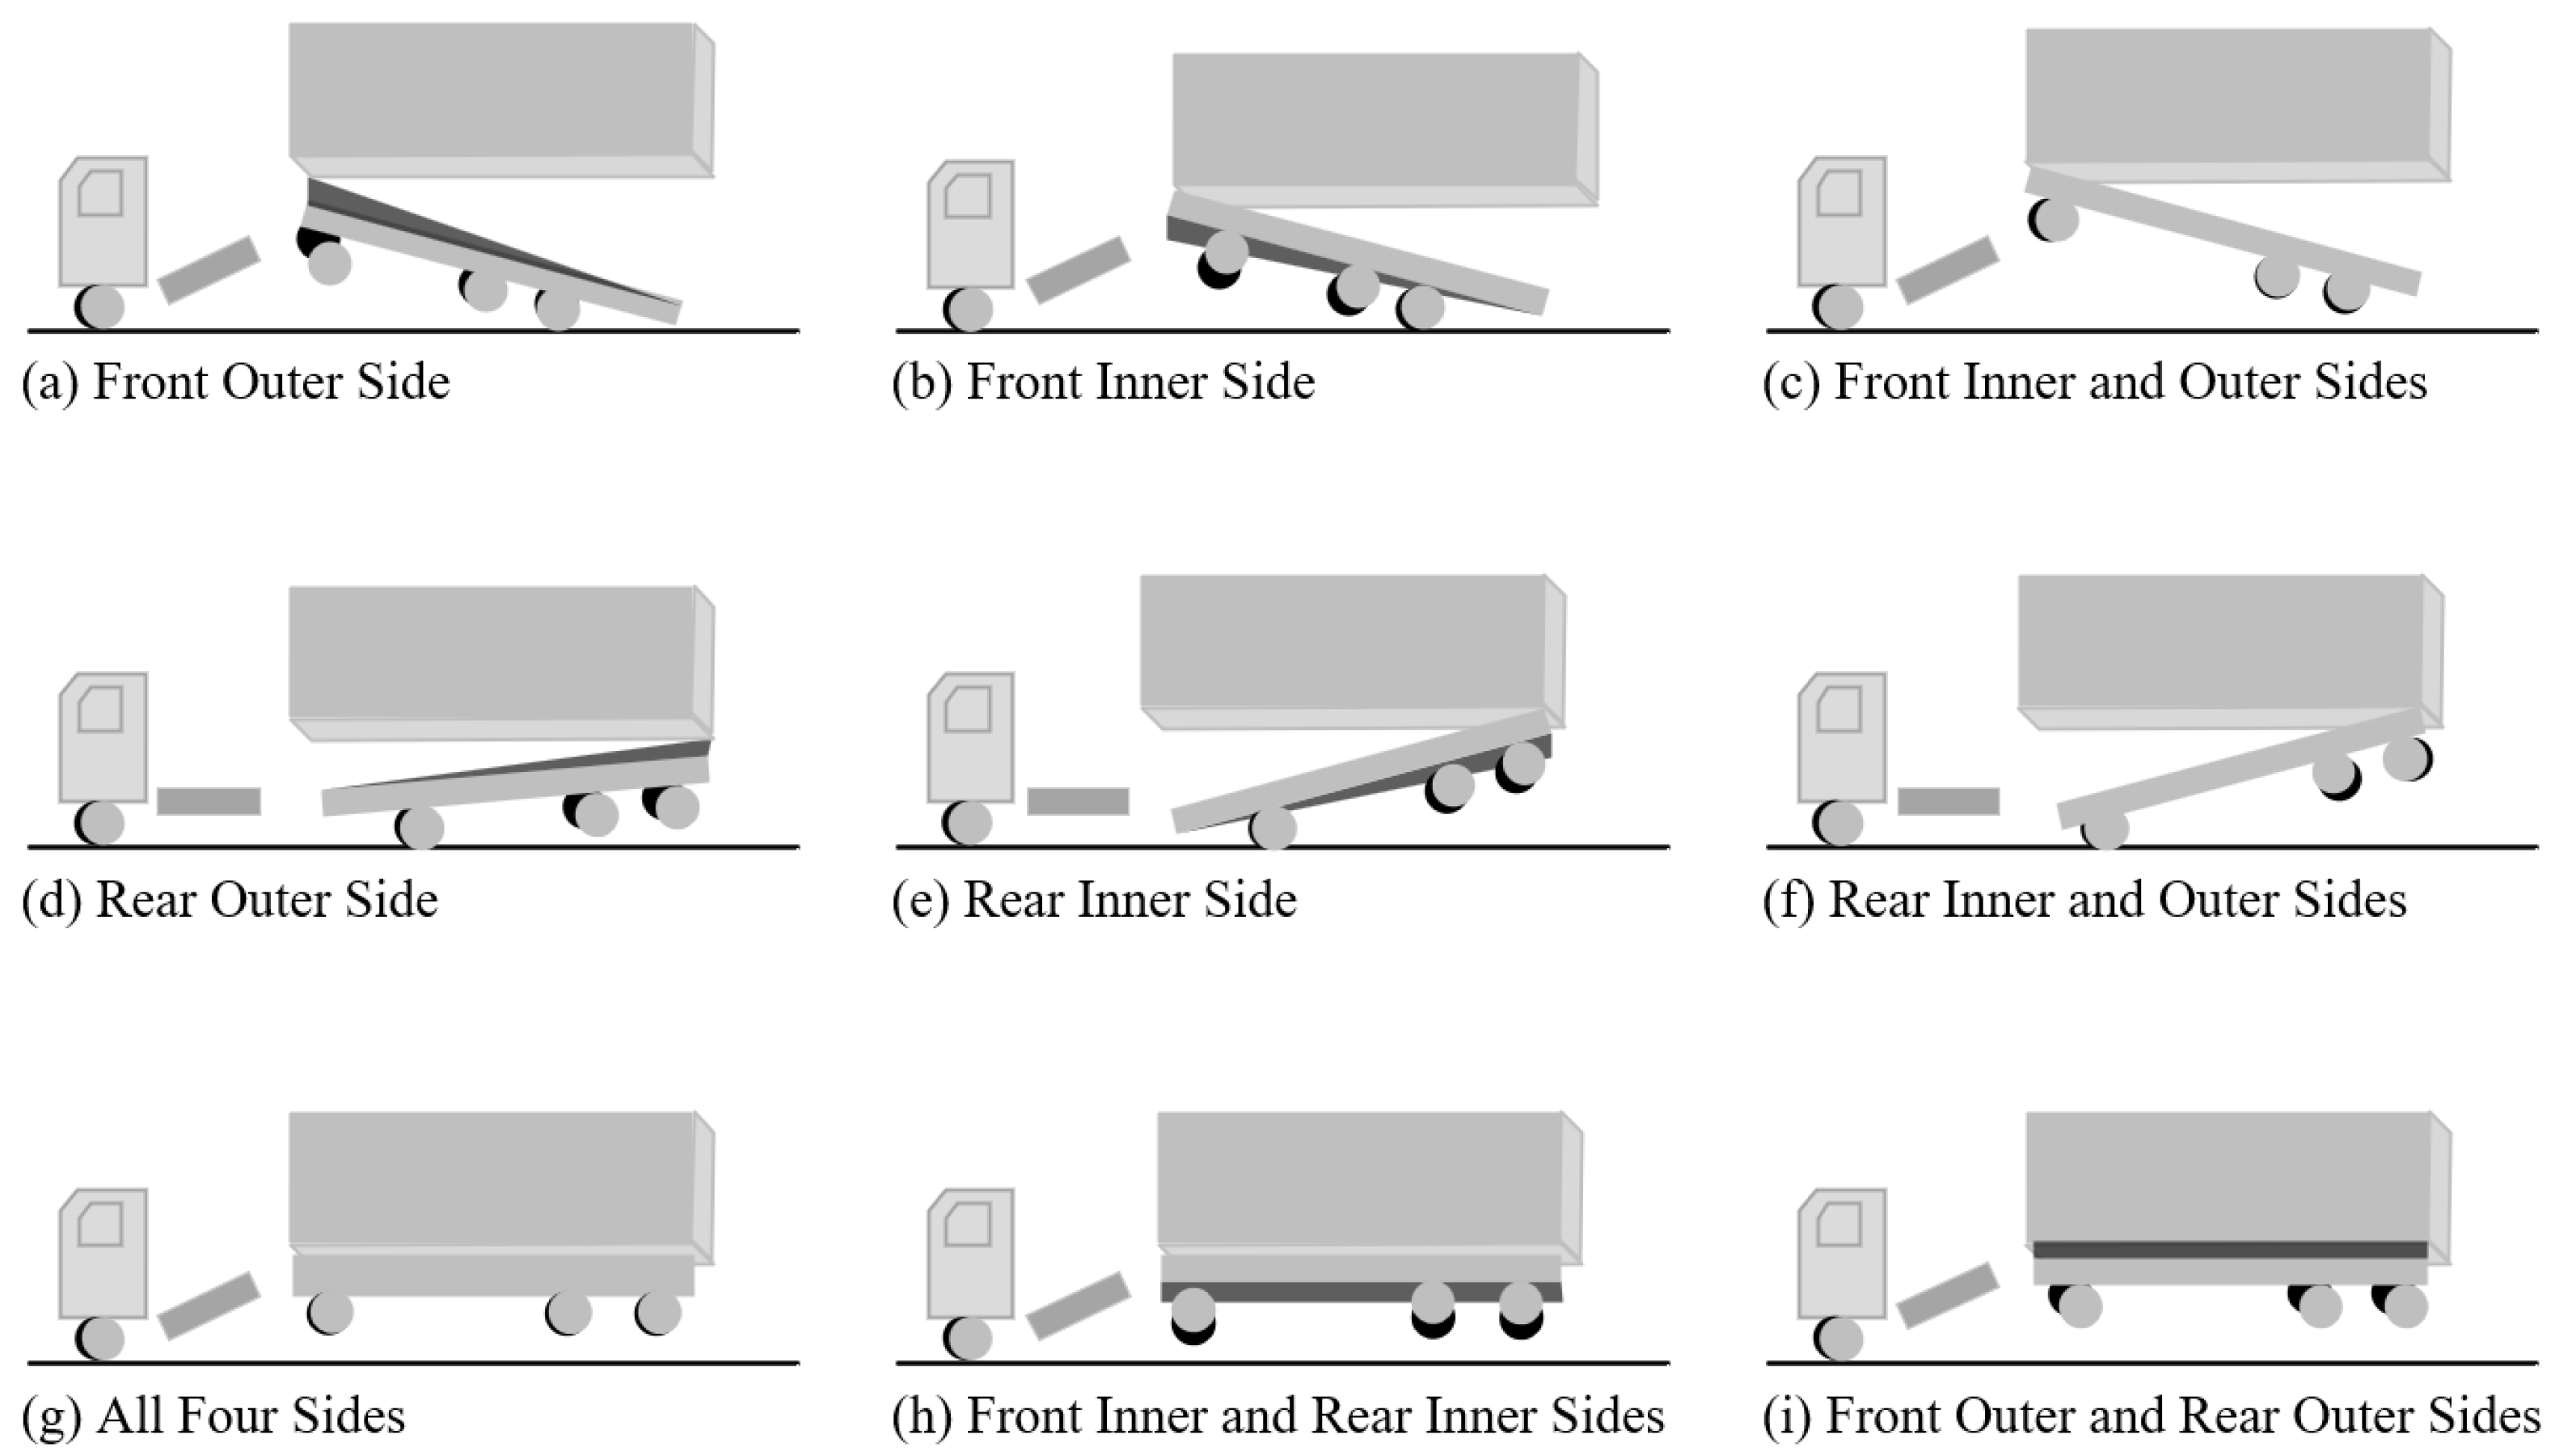
With the rapid development of container terminals and the widespread adoption of automation technology, the efficiency of loading and unloading operations at terminals has significantly improved. The container truck, as the key link between the container and the port machinery, directly affects the smooth operation of the entire terminal. During unloading operations at the terminal, when the lock on the truck’s chassis does not separate from the corner fittings of the container, the truck may be lifted together with the container, a situation commonly referred to as a truck lifting accident. These truck lifting accidents not only result in damage to containers and equipment failure but also pose safety threats to workers. Therefore, the prevention and management of such accidents have become important tasks in the management of modern ports. Figure 1 shows nine different types of truck lifting accidents during the operation of 40-foot containers.
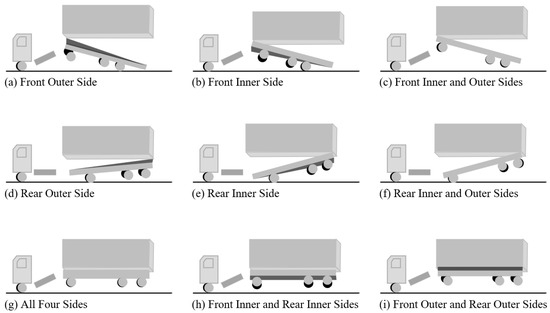
Figure 1.
Nine different types of truck lifting accidents.
Currently, the traditional truck lifting accident detection methods mainly rely on visual cameras and single-line LiDAR, both of which exhibit specific limitations that this study aims to address. Vision-based detection systems [1,2] process image data, which lack three-dimensional spatial information, making it difficult to accurately capture the geometric characteristics of objects. Additionally, vision-based systems are highly sensitive to environmental lighting conditions, further reducing their reliability in real-world operational environments. On the other hand, single-line LiDAR-based detection systems [3] acquire a limited number of points due to their single scanning line. These systems can be categorized into horizontal and vertical scanning types and are prone to installation effects. The impact of installation can lead to incomplete or inconsistent data capture, resulting in high rates of missed detections. Therefore, while these two methods are applicable in specific situations, they exhibit shortcomings regarding precision and stability.
Compared to the above two methods, multi-line LiDAR provides richer three-dimensional raw feature data through multiple scanning channels, offering higher spatial resolutions and depth information. This provides a new approach for addressing truck lifting accident detection.
This paper proposes a detection method based on multi-line LiDAR and an improved PointNet++ algorithm to address the constraints of the current detection techniques and methodologies. This method uses multi-line LiDAR to collect real-time point cloud data from operational lanes and enhances the PointNet++ model by integrating a multi-layer perceptron (MLP) and a mixed attention mechanism (MAM), enhancing the model’s capacity to capture both local and global features, enabling high-precision semantic segmentation and accident detection of critical structures such as containers, truck chassis, and wheels.
The contributions of this paper are as follows:
- (1)
- A truck lifting accident detection system based on multi-line LiDAR is designed to overcome the limitations of traditional vision cameras and single-line LiDAR in terms of three-dimensional information acquisition and environmental lighting conditions.
- (2)
- An improved PointNet++ network model that combines an MLP and MAM is proposed, addressing the limitations of the traditional PointNet++ in extracting features from blurry boundary regions and capturing global features.
- (3)
- Building upon the improved PointNet++ network, this paper introduces a new approach for the accurate and efficient detection of truck lifting accidents by computing the shortest distance between the point clouds of the container and the truck chassis.
2. Related Work
With the rapid development of 3D point cloud machine learning, LiDAR-based detection and measurement technologies have been widely applied in industrial fields, especially in port logistics. Examples include container lock pin detection [4], unmanned truck navigation and obstacle avoidance [5], container ship guide rail segmentation [6], and bulk carrier cargo hold and material detection [7]. These applications show that LiDAR can stably provide reliable and accurate detection capabilities in complex environments with unstable lighting conditions.
In order to meet the demand for high-precision three-dimensional information for containers and truck chassis in truck lifting accident detection, point cloud segmentation algorithms have become a key research direction. Traditional unsupervised clustering algorithms, such as K-means [8], are limited in handling complex and high-dimensional point cloud data. Support Vector Machines (SVMs) [9], as a supervised learning method, perform well in classification tasks but still face challenges in point cloud segmentation tasks. With the advent of deep neural networks (DNNs) [10], PointNet [11], PointNet++ [12], and PointCNN [13], the processing capabilities regarding point cloud data have been significantly improved. In particular, PointNet++ can directly handle raw point cloud data through hierarchical feature learning and local feature extraction, enabling both global classification and local segmentation tasks. This has greatly advanced the research on point cloud object recognition and semantic segmentation. Recently, PointNet++ has been widely applied across various fields. Zhang and Wang [14] proposed a convergence segmentation method based on PointNet++ and edge information, effectively improving the accuracy of cervical vertebra segmentation. Fan et al. [15] addressed the difficulty of tree species classification due to uneven point cloud quality and quantity from airborne LiDAR and validated the feasibility of using PointNet++ in addressing these issues. Hu et al. [16], facing the challenge of recognizing complex regional terrain features, proposed a multi-information fusion method based on PointNet++, effectively improving the accuracy of Digital Elevation Model (DEM) construction. Lin and Knudby [17] developed and tested an automated method based on PointNet++ for the global extraction of bathymetric photons from ICESat-2 ATLAS data. Patel et al. [18] used multiple deep learning models, including PointNet++, for plant organ segmentation and extracted phenotypic features based on segmentation results, verifying the potential application of LiDAR point cloud data in plant phenotyping. Therefore, given the numerous advantages of PointNet++, including its ability to effectively process unstructured point cloud data, capture both local and global features, adapt to point clouds of varying densities, and its extensive successful applications in engineering fields, this paper selects PointNet++ as the base architecture.
Despite the good performance of PointNet++ in point cloud segmentation tasks, it still has some limitations, such as sensitivity to point cloud density and inadequate feature extraction ability for blurry boundary regions. Researchers have proposed several improvement methods to address these issues. Jing et al. [19] introduced the Squeeze-and-Excitation PointNet++ (SE-PointNet++) architecture, incorporating an SE module to enhance the selectivity of feature channels. Guo et al. [20] proposed an improved PointNet++ model that combines deep learning with clustering algorithms, optimizing the Density-Based Spatial Clustering of Applications with Noise (DBSCAN) algorithm and incorporating an improved attention module to enhance semantic segmentation accuracy. Chen et al. [21] proposed a point cloud segmentation and depth measurement approach based on PointNet++ and the Depth Measurement for Cigarette Perforation (DMCP) algorithm, using clustering and an attention mechanism to solve issues such as the identification of small holes and depth calculation. Cheng and Gu [22], to address the limited ability of PointNet++, proposed the Shuffle Attention and Offset-Attention PointNet++ (SO-PointNet++) architecture, combining Shuffle Attention and Offset-Attention to enhance feature extraction ability and solve the gradient vanishing problem. Yu et al. [23] introduced the Double Self-Attention Mechanism PointNet++ (DSPNet++) network using a double self-attention mechanism for airborne LiDAR point cloud segmentation, leveraging local feature aggregation modules and self-attention convolution networks to adaptively extract semantic features from the point cloud. However, their approach primarily focused on improving the segmentation accuracy of specific types of point cloud data, such as airborne LiDAR or small-scale objects, and did not fully address the challenges of handling complex high-dimensional point cloud data with blurry boundary features, which are common in industrial environments like container terminals. Additionally, while these improvements have enhanced the performance of PointNet++ in certain scenarios, they often lack the ability to effectively balance the extraction of local and global features, which is crucial for accurate semantic segmentation tasks in dynamic and complex operational environments. This limitation becomes particularly evident in applications such as truck lifting accident detection.
In summary, researchers have partially solved the limitations of PointNet++ in handling different types of point cloud data by introducing attention mechanisms, optimizing loss functions, and combining clustering algorithms. However, there is still room for improvement in feature extraction capabilities for blurry boundary regions and the fusion of local and global features. To fill the gaps in the current research, this paper proposes a truck lifting accident detection method based on multi-line LiDAR and an improved PointNet++, which aims to further enhance the model’s feature extraction ability and segmentation accuracy for key structures by integrating an MLP and a mixed attention mechanism, providing reliable technical support for the safe and efficient operation of container terminals.
3. Truck Lifting Accident Detection Method
3.1. Hardware System
This paper designs a truck lifting accident detection system for container terminals based on multi-line LiDAR. The system’s hardware platform consists of a single multi-line LiDAR and an edge computing module, which can be mounted on various container handling machinery at container terminals, such as gantry cranes and rail-mounted gantry cranes. As shown in Figure 2, the LiDAR is mounted on the rigid leg of a rail-mounted gantry crane, facing the truck operational lane for scanning. Compared to the flexible leg, the rigid leg structure is more stable, making it suitable for installing precision equipment such as LiDAR, avoiding sensor malfunctions caused by vibrations. The edge computing module is installed in the electrical room above the rigid leg and is responsible for receiving and processing point cloud data collected by the LiDAR during container lifting operations. Additionally, it listens to the status information of the gantry crane’s Programmable Logic Controller (PLC), such as the spreader lock and unlock status and the height encoder, to accurately determine when the system triggers accident detection and alarms.
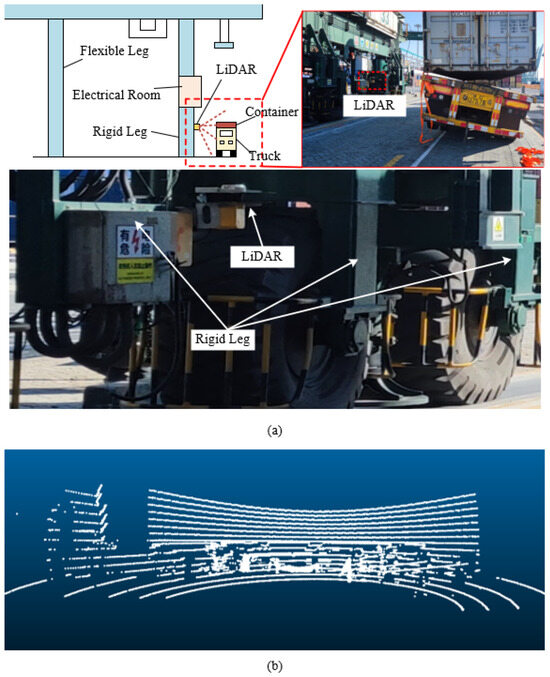
Figure 2.
LiDAR installation and data collection. (a) Shows LiDAR installation; (b) shows a point cloud of a container being lifted as captured by the LiDAR.
3.2. Algorithm Design
3.2.1. Truck Lifting Accident Detection Process Framework
In the detection of truck lifting accidents, the quantification of boundary features for accident-related objects (such as containers, truck chassis, and wheels) is based on the spatial distribution and geometric relationships of points in the point cloud, including geometric attributes such as curvature, normal vectors, and the density of neighboring points. These features are crucial for distinguishing between different objects or components, especially in regions where boundaries are blurred. In this paper, an improved PointNet++ model is used to extract these boundary features from the point cloud and represent them as high-dimensional feature vectors, thereby enhancing the model’s ability to recognize blurry boundary regions.
The truck lifting accident detection process based on multi-line LiDAR and the improved PointNet++ model is shown in Figure 3. First, multi-line LiDAR collects real-time 3D point cloud data from the scene. Through 3D Region of Interest (ROI) cropping, the point cloud data are preprocessed to extract the point cloud from the container lifting operation area, reducing data redundancy while retaining key features. The processed point cloud is then input into the improved PointNet++ model, which incorporates MLP to enhance the high-dimensional feature expression of the point cloud. It also combines MAM to optimize feature extraction for blurry boundary regions from both local and global perspectives. Through point cloud segmentation, the model can accurately identify key structures such as containers, truck chassis, and wheels, and further detect if there is any adhesion between the truck and the container after the container is lifted based on a distance threshold method, thus determining whether a truck lifting accident has occurred.
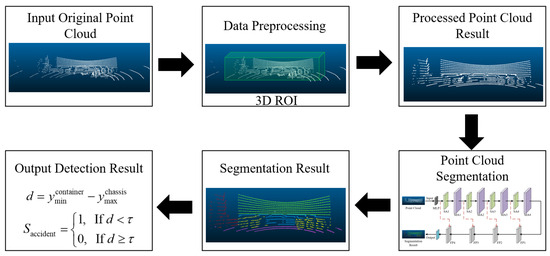
Figure 3.
Truck lifting accident detection process.
3.2.2. Improved PointNet++ for Point Cloud Segmentation Model
PointNet++ effectively captures local features on multi-scale structures through its hierarchical feature extraction mechanism, making it suitable for general point cloud segmentation tasks. However, when processing point cloud data from complex container terminal scenarios, PointNet++ still suffers from insufficient dependence on local and global features, especially in segmenting point clouds with blurry boundary features in truck lifting accident detection. Therefore, this paper proposes the following improvements to address these issues:
(1) At the input stage, an MLP module [24] is introduced to enhance the model’s ability to learn high-dimensional features, particularly when handling complex geometric structures. This enables the model to better capture subtle differences in boundary regions, such as minor relative positional changes between container and truck chassis, thereby improving segmentation accuracy. Additionally, through adaptive feature learning, the MLP enables the model to learn more suitable feature representations based on the varying scales of objects, further enhancing overall performance.
(2) At the feature abstraction stage, a feature extraction module based on MAM is introduced. MAM can perform weighted processing on different modalities of input data, such as point cloud positional data and boundary features, enabling the model to automatically focus on critical regions. This enhances the extraction of boundary features and strengthens the model’s global perception capabilities. The MAM includes a channel attention mechanism (CAM) [25] for channel feature enhancement and a self-attention mechanism (SAM) [26] for global feature extraction. The CAM learns the correlations between different channels, assigning higher weights to important channels, thus improving the model’s detection accuracy in truck lifting accident regions. The SAM enhances the model’s ability to capture global point cloud features, enabling more comprehensive analysis of boundary features between containers and truck chassis.
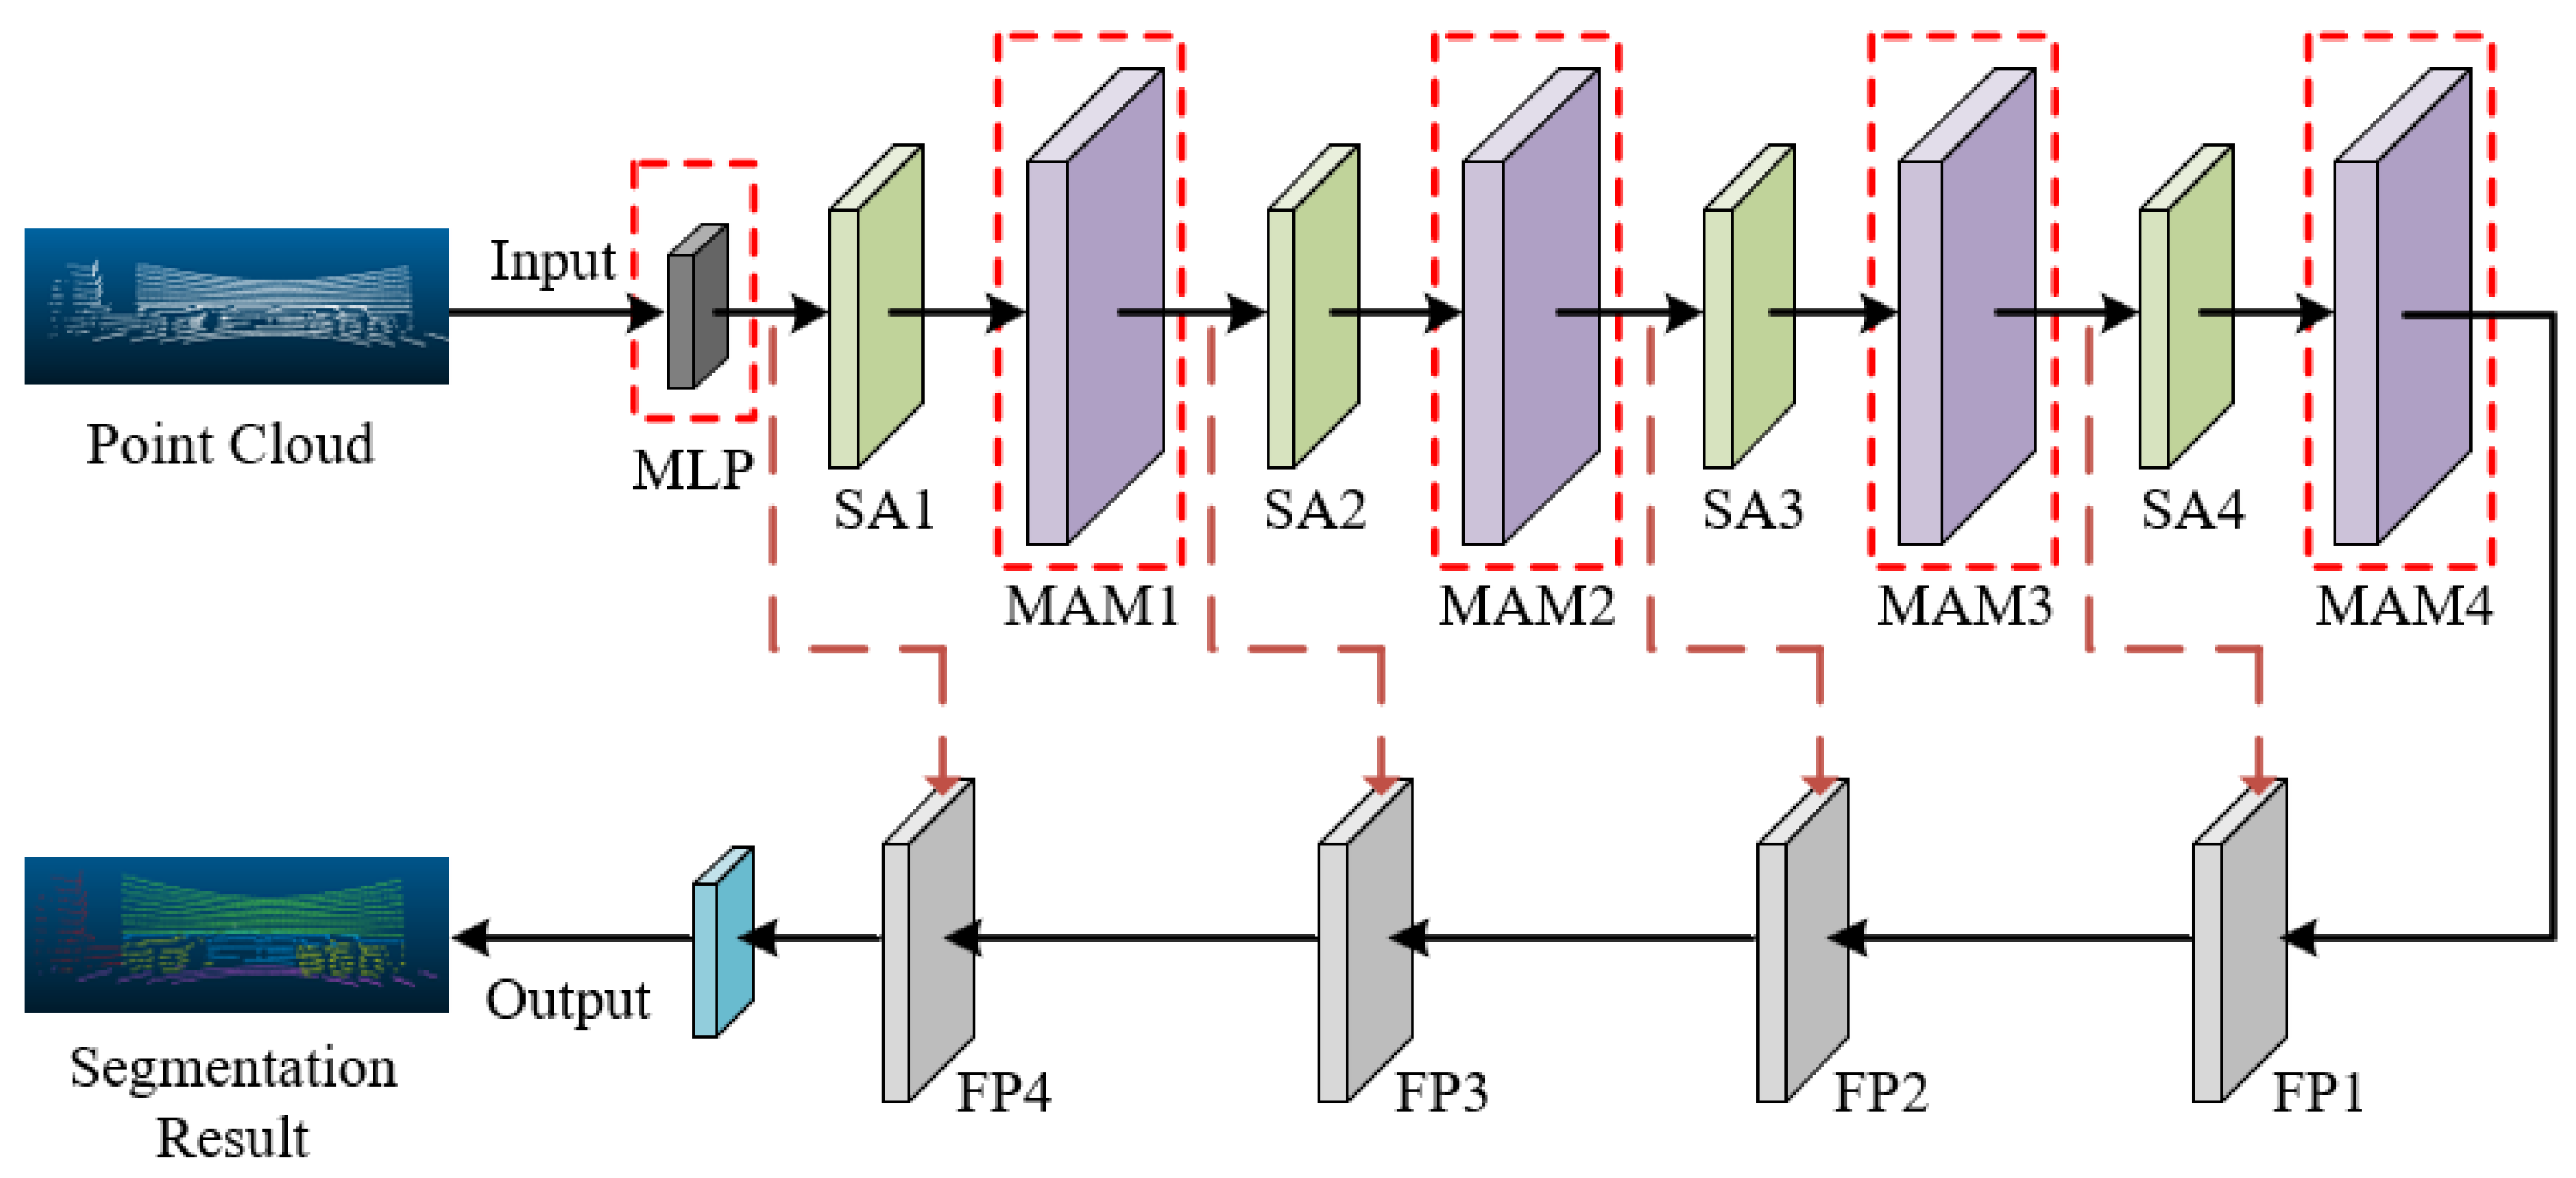
As shown in Figure 4, the improved PointNet++ network introduces MLP and MAM into the classic PointNet++ model, specifically adapting and optimizing it for complex container lifting scenarios to enhance point cloud segmentation performance.
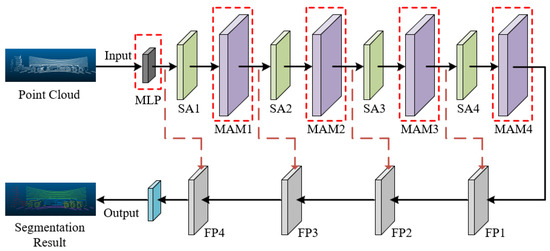
Figure 4.
Improved PointNet++ network structure.
- (1)
- Multi-layer Perceptron
In this paper, the input point cloud features are represented by the position coordinates of each point. Through the nonlinear transformations of hidden layers, the MLP can map these raw features into a higher-dimensional space, resulting in more abstract and discriminative feature representations.
As shown in Figure 5, the input point cloud feature matrix , where N is the number of points and is the initial feature dimension of each point. After processing by the MLP, the high-dimensional transformed features are obtained, where d is the feature dimension after the high-dimensional transformation. The MLP consists of L fully connected layers, and the input and output features of each layer are represented by and . The output of layer l is calculated as follows:
where represent the weight matrix and and represent the feature dimensions of the previous and current layers, respectively. is the bias, is the activation function used to introduce nonlinear transformations, and represents the input features of the first layer.
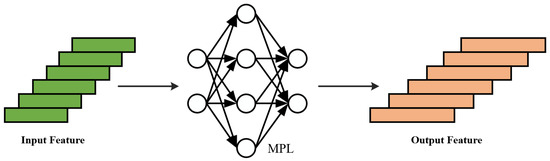
Figure 5.
Multi-layer perceptron.
- (2)
- Mixed Attention Mechanism
The classic PointNet++ model struggles to capture local and global feature dependencies effectively when processing point cloud data from complex container terminal scenarios. This is mainly due to the complex and variable structural features of containers and trucks. Therefore, we propose a feature extraction module based on MAM that combines both channel attention and self-attention to enhance the model’s overall feature learning ability.
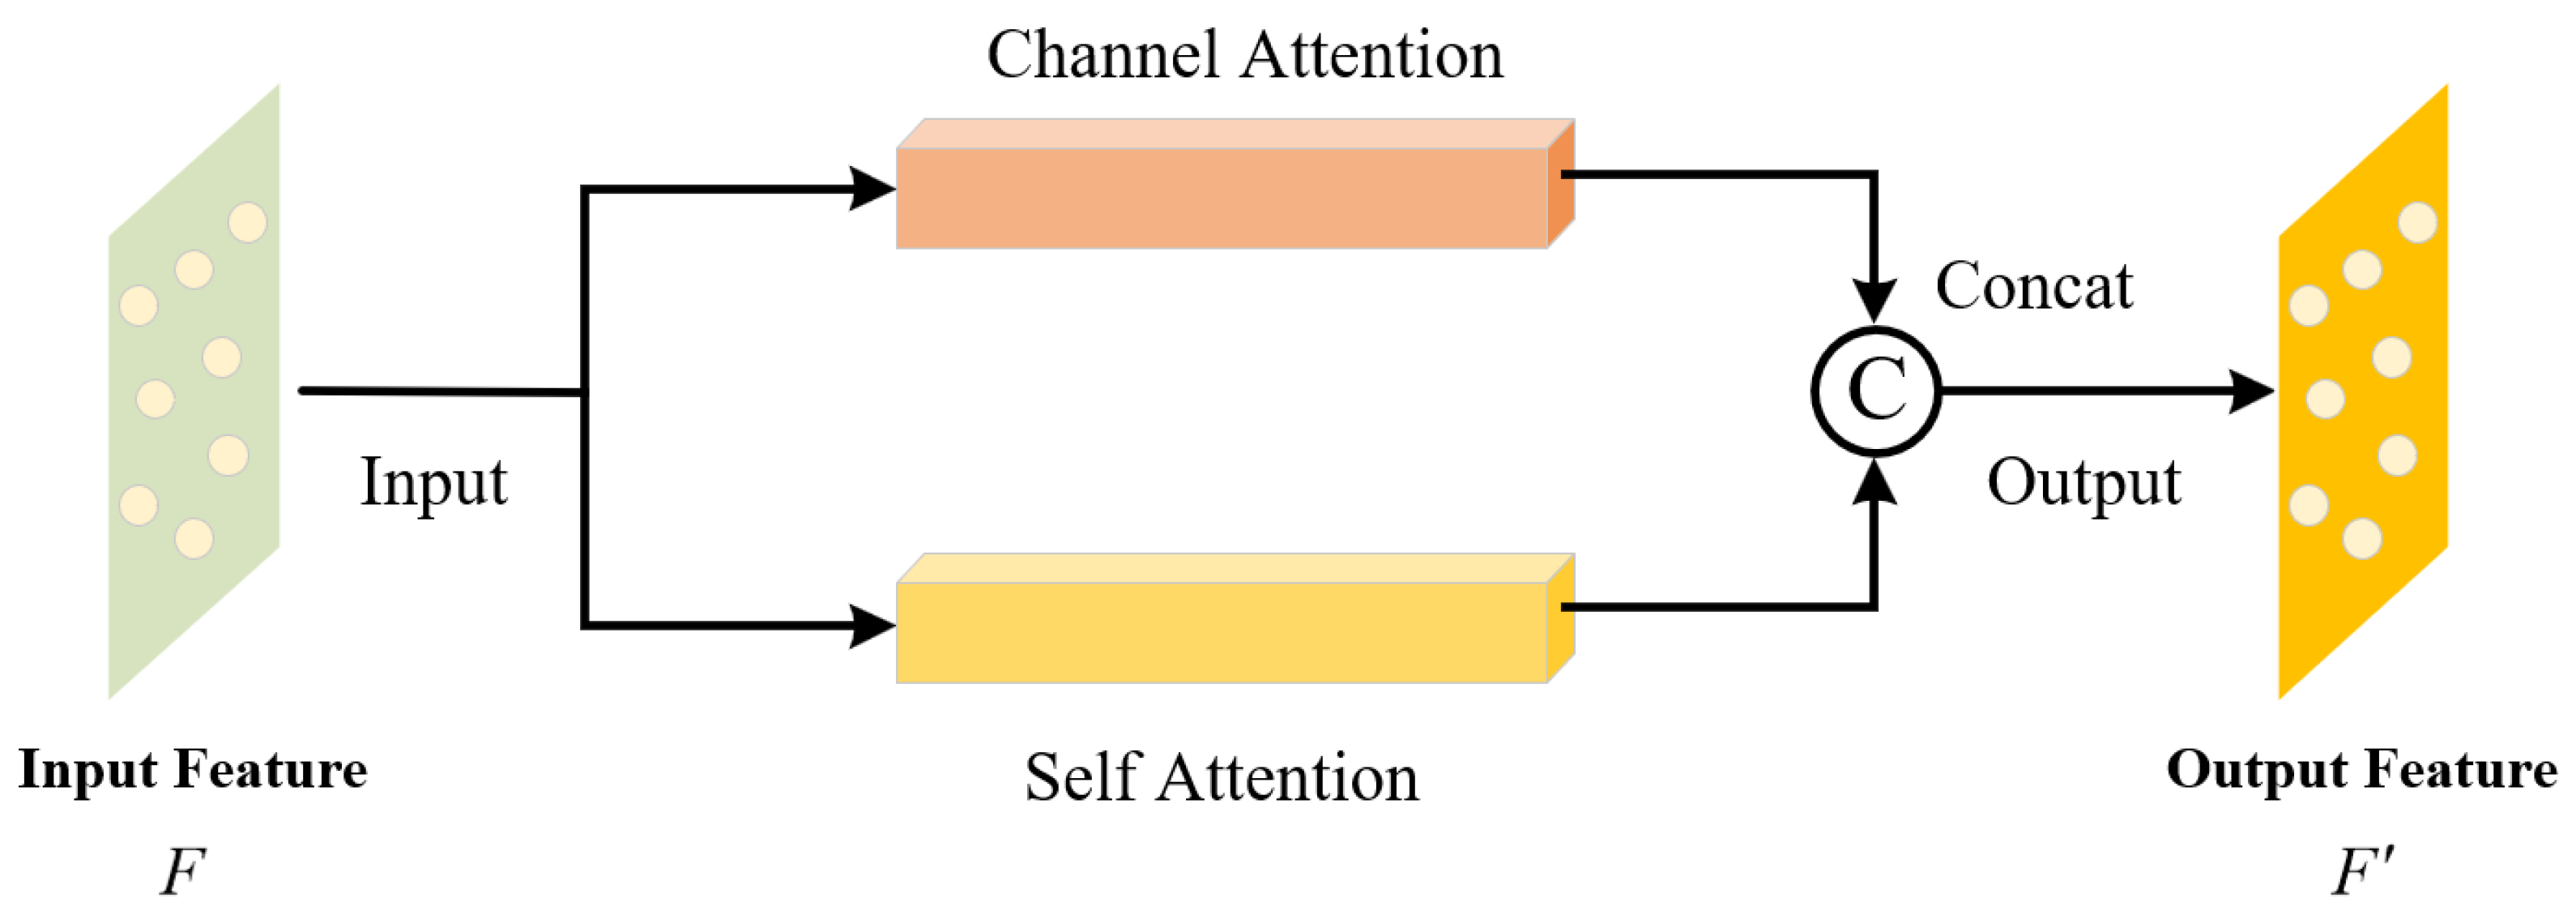
The implementation mechanism of MAM is shown in Figure 6, with the specific steps as follows:

Figure 6.
Feature extraction module based on mixed attention mechanism.
Step One: Input the feature matrix , where B is the batch size, N is the number of points in each sample, and C is the point set feature dimension.
Step Two: Enhance the cross-channel feature learning through the channel attention module, generating the feature vector , where is the feature dimension output by CAM.
Step Three: Simultaneously, the self-attention module strengthens the global feature dependencies between distant points in the point cloud, generating the feature vector , where is the feature dimension output by SAM.
Step Four: By concatenating and , the feature representation capability of the point cloud features is enhanced while compensating for any geometric feature loss. The enhanced feature can be represented as .
Step Five: Output the new feature matrix , where .
- (a)
- Channel Attention Mechanism
CAM assigns different weights to different channels, enabling the model to prioritize critical features while suppressing irrelevant ones. This mechanism helps the model to better distinguish between overlapping or closely positioned objects. CAM achieves this by performing global max pooling and global average pooling on the input features, followed by a shared-weight MLP to generate channel attention weights. These weights are then applied to the original features, enhancing the representation of important channels. The main principle is illustrated in Figure 7, with the specific steps as follows:
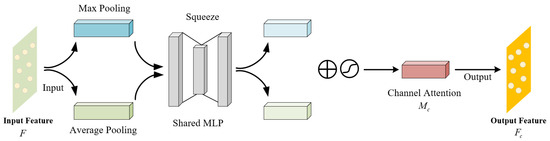
Figure 7.
Channel attention mechanism.
The input point cloud feature F has dimensions , where C is the number of channels. F is subjected to global max pooling and global average pooling, resulting in two feature vectors with dimensions :
These two feature vectors are then input into a shared-weight MLP for dimensionality reduction as follows:
where is the Sigmoid activation function; is the channel attention weight.
is then multiplied with the original input feature F to obtain the enhanced channel feature .
- (b)
- Self-Attention Mechanism
SAM complements the function of CAM by capturing long-range dependencies within the point cloud data. SAM calculates attention weights for each point by learning the internal relationships between points, thereby adaptively adjusting the importance of each point. This mechanism is particularly effective in handling irregular and complex structures. By strengthening global feature dependencies, SAM ensures that the model can accurately capture the spatial relationships between distant points. The workflow of SAM is shown in Figure 8 and is described as follows:
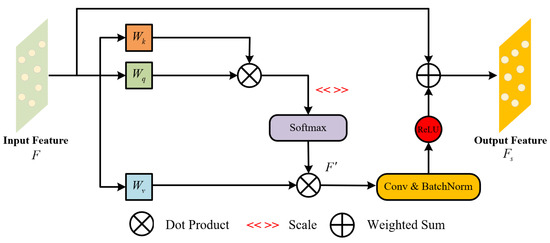
Figure 8.
Self-attention mechanism.
Similar to the CAM described earlier, the input point cloud feature F has dimensions . Through three independent linear layers, the query matrix Q, key matrix K, and value matrix V are generated, which are expressed as follows:
where , , and represent the weight matrices for Q, K, and V, each with dimensions , and are shared across all samples in the batch.
The dot product similarity between Q and k is calculated, normalized using the Softmax function to obtain the attention weight matrix, which is then multiplied with the value matrix V to generate the weighted feature matrix :
The point cloud feature is subsequently processed through convolutional linear transformations, batch normalization, and the ReLU activation function. Finally, the processed feature is added to the original feature vector, and the sum is computed to obtain the final output point cloud feature matrix .
3.2.3. Truck Lifting Accident Detection Algorithm
Based on the segmentation results from the network model, truck lifting accidents are precisely detected by analyzing the geometric relationship between the container and the truck chassis. The judgment logic is as follows: when the container is lifted to a detection height, if the container point cloud and the truck chassis point cloud still have adhesion, it may result in a truck lifting accident. By detecting the minimum distance between the two point clouds, we can effectively determine if an accident has occurred.
Assume the point set for the container lifting operation is represented by , where is a point in the point set. After processing through the above point cloud segmentation network, we obtain the point set for container and the point set for truck chassis . The minimum value of on the y-axis and the maximum value of on the y-axis can be expressed as
The minimum distance between and along the y-axis can be represented as
By setting a safety threshold , when the container is lifted to the detection height, the accident detection status is as follows:
This means that, if the minimum distance d between the container and the chassis is less than the safety threshold , a potential accident is detected (); otherwise, if the distance exceeds or equals the threshold, the situation is deemed safe ().
4. Point Cloud Segmentation Experiment Validation and Results Analysis
4.1. Container Lifting Operation Dataset
The improved PointNet++ model for truck lifting accident detection is applied to real container terminal handling machinery to effectively prevent truck lifting accidents. The hardware equipment includes the WLR-720 16-line LiDAR from Wanji Technology and an edge computing module. Figure 9 shows the point cloud data collection process for 20-foot and 40-foot container lifting accidents.
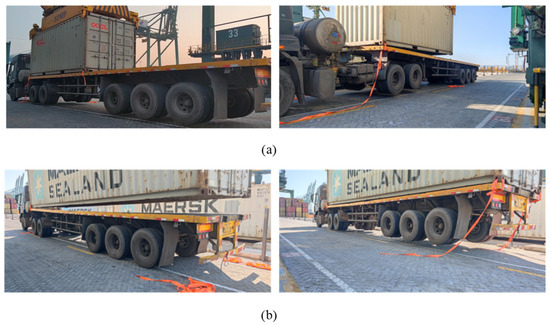
Figure 9.
Point cloud dataset collection process. (a) Shows the collection process for a truck lifting accident involving a 20-foot container; (b) shows the collection process for a truck lifting accident involving a 40-foot container.
The main parameters of the LiDAR are shown in Table 1. Additionally, its maximum ranging distance is 60 m. To ensure point cloud density while covering the height of the truck unloading operation (0–3.5 m vertically), the LiDAR should be positioned at a horizontal distance of 2–8 m from the truck.

Table 1.
Main parameters of the LiDAR.
Each scene is divided into six categories for point cloud segmentation: “Ground”, “Container”, “Truck Cab”, “Truck Chassis”, “Truck Wheel”, and “Others”, with the data annotated using CloudCompare software.
4.2. Experiment Environment Configuration
To verify the effectiveness of the proposed model, experiments were conducted based on a custom container lifting operation point cloud dataset. Table 2 outlines the hardware and software configurations utilized in the experiment.
Table 2.
Experiment training environment configuration.
The experimental training involved a total of 8911 point cloud samples, divided into training and test sets in an 8:2 ratio. Among these, 6230 samples represent normal scenarios (before and after normal container lifting), while 2681 samples represent anomalous scenarios (multiple types of truck lifting accidents). The training set contains 2145 accident samples, whereas the test set contains 536 accident samples. This distribution ensures a balanced representation of both normal and anomalous conditions during model training and evaluation.
4.3. Model Evaluation Metrics
The evaluation of boundary features is conducted after the point cloud segmentation. Based on the extracted boundary features, the model segments the point cloud into different categories. The accuracy of the segmentation is evaluated using the mean Intersection over Union (mIoU), where a higher mIoU value indicates better accuracy in boundary feature extraction and segmentation. Additionally, the Overall Accuracy (OA) and mean Class Accuracy (mAcc) are used to further quantify the model’s overall performance in boundary feature extraction and segmentation tasks. These metrics are used to comprehensively evaluate the performance of point cloud segmentation. The formulas for calculation are as follows:
where C is the number of categories. , , and represent the true positive, false negative, and false positive for category i.
4.4. Comparison Experiments and Analysis
In the experiment environment configuration used in this study, the following training parameters were set during model training: a batch size of 8, a total of 4096 sampling points, and the Adam optimization algorithm. The initial learning rate was set to 0.001, and the number of epochs was 200.
To explore the performance differences between the proposed optimized model and mainstream point cloud segmentation networks, comparison experiments were conducted using the same training parameters and sample training data. The comparison results of the training are shown in Table 3.
Table 3.
Segmentation test results of different models.
The experimental results show that PointNet, as a pioneering model in point cloud segmentation, performs well in extracting global features but has limitations in handling local geometric features. Its mIoU is relatively low at only 67.9%, showing a clear gap compared to other models. Point Transformer performs better than PointNet, achieving a mIoU of 76.2%, which surpasses PointNet++ (74.5%) and PointCNN (74.1%). However, it still falls 1.2% behind the improved model in terms of mIoU. The proposed improved model outperforms existing mainstream point cloud semantic segmentation models in terms of performance metrics. Its OA, mAcc, and mIoU reach 91.4%, 82.3%, and 77.4%, respectively. Compared to PointNet, PointCNN, Point Transformer, and PointNet++, the improved model shows mIoU increases of 9.5%, 3.3%, 1.2%, and 2.9%, respectively.
In terms of training time, the proposed model requires 22.7 h, which is longer than PointNet (13.4 h) and PointNet++ (17.9 h) but shorter than Point Transformer (26.3 h). Despite the increased training time, the proposed model achieves higher accuracy and robustness, making it suitable for truck lifting accident detection tasks. Additionally, the proposed model achieves a throughput (119 instances per second) that surpasses Point Transformer (71 instances per second) but slightly trails behind PointNet++ (136 instances per second). Despite this slight drop compared to PointNet++, the proposed model still maintains solid efficiency for real-time applications.
These results confirm that the proposed model has significant advantages in terms of segmentation accuracy and robustness, making it suitable for truck lifting accident detection tasks.
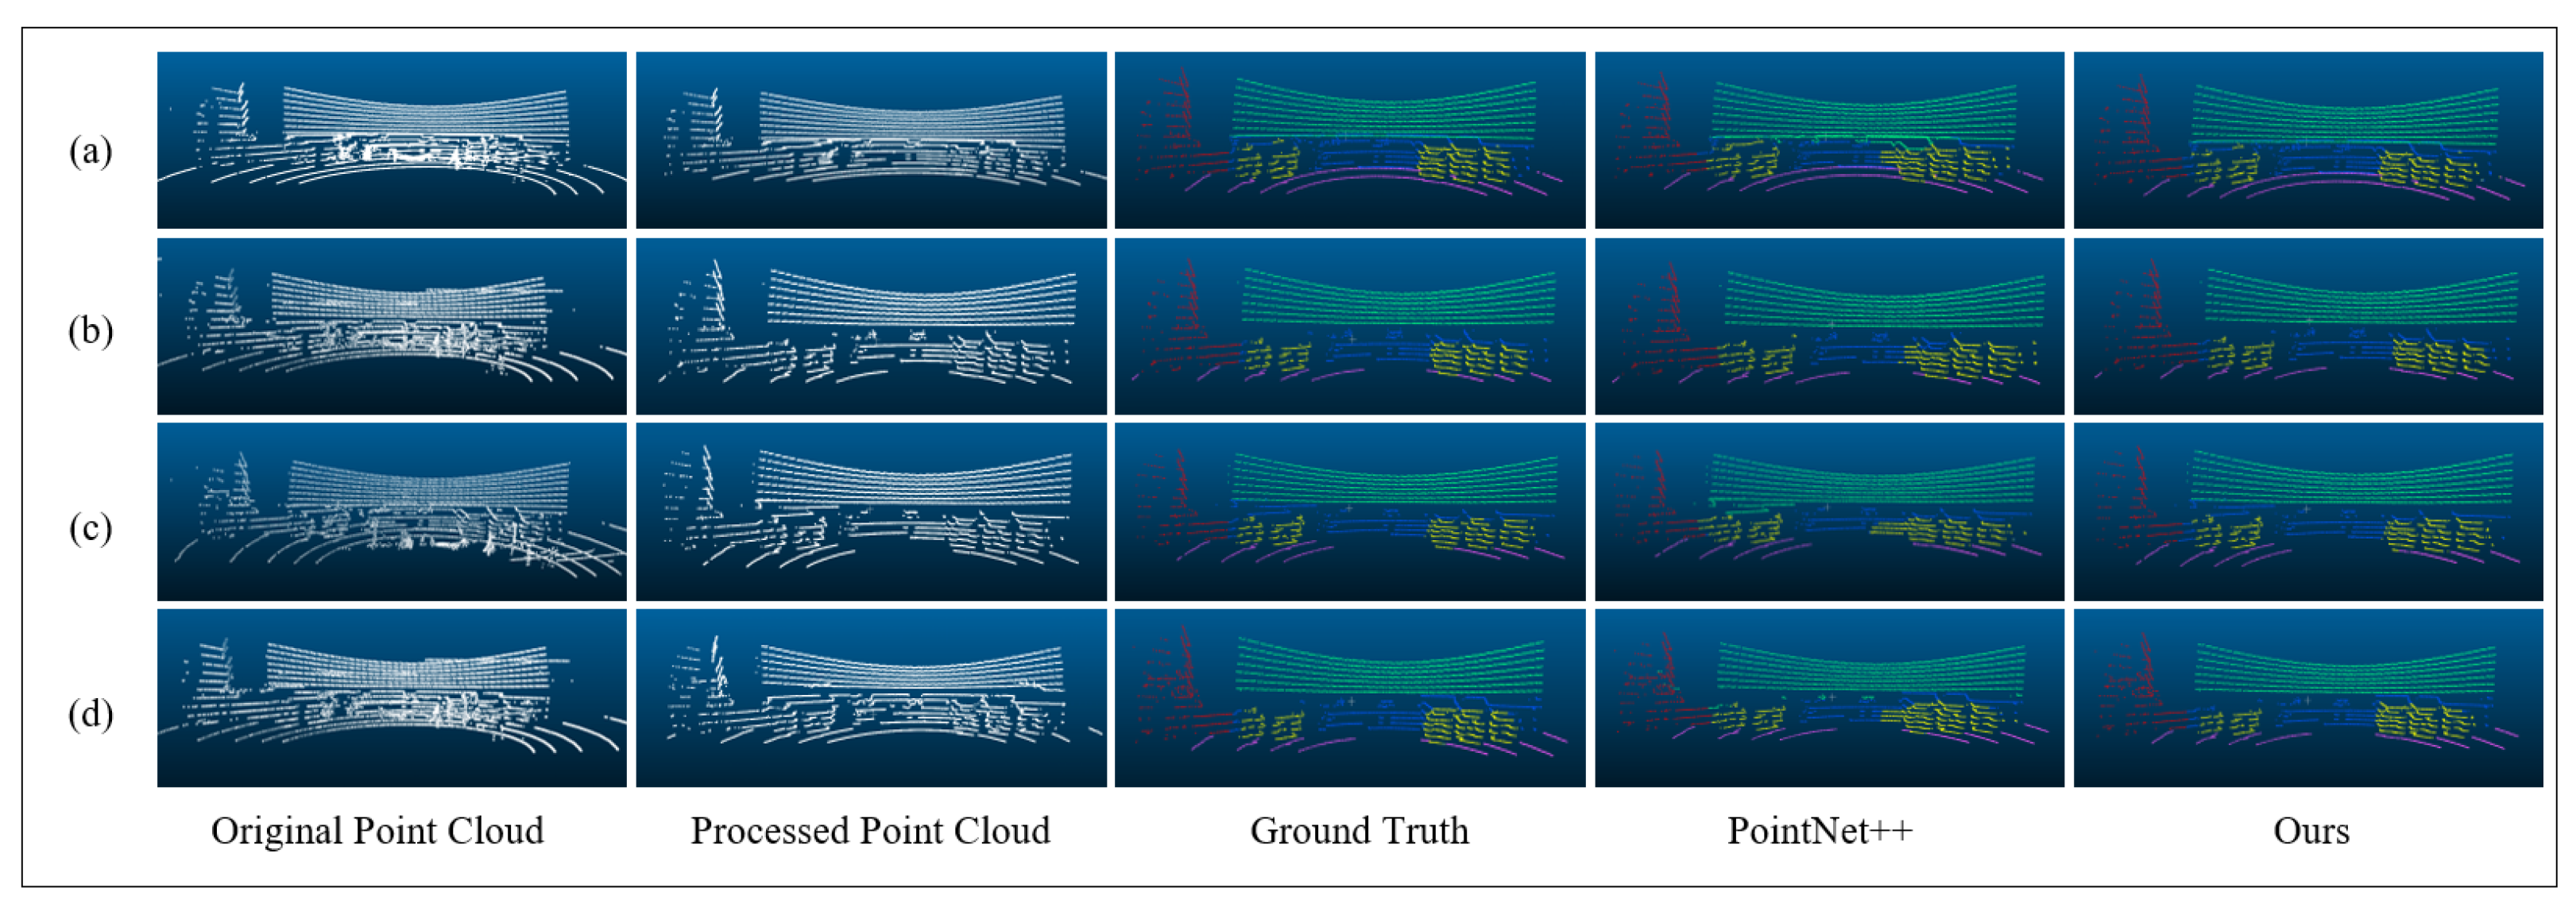
Figure 10 presents the visualized results of the segmentation comparison experiments. Under various container lifting operation scenarios, the proposed model performs better in accurately and clearly segmenting truck chassis and containers. In contrast, the baseline PointNet++ model exhibits incorrect segmentation in some edge regions. This difference is mainly due to PointNet++’s insufficient feature extraction ability in blurry boundary regions and limited ability to capture global features. The proposed model, however, enhances the learning of local detailed features and strengthens the interaction of features across channel and spatial dimensions, thus achieving finer segmentation in the boundary areas between containers and chassis.
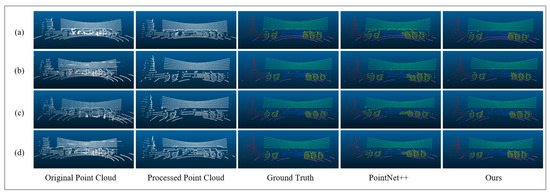
Figure 10.
Visualization of point cloud segmentation results. (a) Shows a container remaining stationary without being lifted; (b) shows a container being lifted successfully under normal conditions; (c) shows a lifting accident occurring with the front lock engaged; (d) shows a lifting accident occurring with the rear lock engaged.
4.5. Ablation Experiment
To verify the improvement in point cloud segmentation performance achieved by the MLP and MAM modules, a series of ablation experiments were conducted, using PointNet++ as the baseline model. The experiments progressively added the improvement modules, and the performance was recorded. The results are shown in Table 4.
Table 4.
Ablation experiment results comparison.
As shown in Table 4, the OA, mAcc, and mIoU of PointNet++ are 88.7%, 79.6%, and 74.5%, respectively. When MLP, CAM, and SAM are individually introduced, they enhance the baseline model’s performance, demonstrating that these modules can improve the ability to extract both local and global features to a certain extent. Among them, MLP improves feature representation, resulting in a slight increase in mIoU to 75.0%, although the improvement in mIoU is relatively small. CAM enhances the model’s focus on important channels, improving feature selection, and increasing mIoU to 75.4%. SAM performs the best among these three modules, leading to a significant increase in mIoU to 76.9%. When MLP, CAM, and SAM are combined, the OA, mAcc, and mIoU reach 91.4%, 82.3%, and 77.4%, respectively, showing a significant improvement compared to the baseline model. These results fully validate the effectiveness and complementarity of MLP and MAM modules in enhancing point cloud segmentation performance.
4.6. Engineering Application Comparison Test
To further study the generalization capability of the proposed improved PointNet++ model in real-world scenarios, multi-condition engineering application tests were conducted in an actual container terminal environment. The tests focused on examining the impact of different lighting and weather conditions on truck lifting accident detection. In the experiment, a server with identical hardware configurations was used to perform segmentation and detection on real-time point cloud data. To ensure comprehensive evaluation, each of the nine types of truck lifting accidents were artificially replicated under every test condition. The test results are shown in Table 5, where each condition is tested with a sample size of 500.
Table 5.
Comparison of multi-condition real-world scene tests.
As shown in Table 5, the proposed model demonstrates superior performance compared to PointNet++ across all conditions. In stable conditions such as daytime and nighttime, the detection accuracy (Acc) of the proposed model is 97.4% and 97.8%, respectively, with false positive rates (FPRs) as low as 1.7% and 1.5% and false negative rates (FNRs) of 4.0% and 3.0%. In contrast, PointNet++ achieves lower Acc of 88.6% and 89.2% under the same conditions, with significantly higher FPRs of 13.0% and 12.3% and FNRs of 9.0% and 8.6%. The mean inference (Inf.) time of the proposed model is slightly longer (120 ms and 122 ms) compared to PointNet++ (105 ms and 106 ms), but the improvement in accuracy and reduction in false positives and false negatives justify the additional computational cost.
As weather conditions deteriorate, the detection performance of both models decreases due to the reduction in the quality of the return signal from the LiDAR. During light rain, the Acc of the proposed model drops slightly to 96.1%, while PointNet++ achieves an Acc of 86.8%. In more adverse conditions such as heavy rain and fog, the detection performance is significantly affected. The proposed model maintains Acc of 93.0% and 94.5% in heavy rain and fog, respectively, with FPRs of 4.7% and 4.4% and FNRs of 10.5% and 7.0%. In comparison, PointNet++ achieves lower Acc of 82.8% and 83.2% in heavy rain and fog, with higher FPRs of 17.5% and 16.0% and higher FNRs of 18.5% and 18.0%.
Despite the slight increase in inference time, the proposed model demonstrates superior Acc, lower FPRs, and lower FNRs across all the conditions. By leveraging a continuous multi-frame detection mechanism, the system can effectively mitigate the impact of adverse weather conditions, maintaining its usability even in severe environments such as heavy rain and fog.
5. Conclusions
This paper addresses the safety issue of truck lifting accidents during container terminal operations by proposing a detection method based on multi-line LiDAR and the improved PointNet++ model. By incorporating a multi-layer perceptron and a mixed attention mechanism, the feature extraction and point cloud segmentation performance of the model are optimized, effectively improving the model’s ability to segment blurry boundary regions. The experimental results show that this method significantly outperforms the traditional methods in terms of point cloud segmentation accuracy and robustness, with all the performance metrics showing substantial improvements. The real-world engineering tests further validate the model’s reliability and stability under various conditions, especially under stable weather conditions. Compared with the existing detection methods based on visual cameras or single-line LiDAR, the proposed method fully utilizes the rich three-dimensional spatial information from multi-line LiDAR, providing higher precision and stronger adaptability for truck lifting accident detection.
Author Contributions
Conceptualization, Y.S. and X.M.; methodology, Y.S. and X.M.; software, J.W. and Y.Z.; validation, Y.S. and X.M.; formal analysis, Y.S. and C.M.; investigation, X.M. and J.W.; resources, C.M., J.W., and Y.Z.; data curation, Y.S.; writing—original draft preparation, Y.S., X.M., and J.W.; writing—review and editing, Y.S. and X.M.; visualization, Y.S. and C.M.; supervision, Y.S., X.M., and J.W.; project administration, Y.S. and J.W.; funding acquisition, Y.S. and C.M. All authors have read and agreed to the published version of the manuscript.
Funding
This research was supported by National Natural Science Foundation of China (No. 52472435), the Education Science Research Project of Shanghai Municipality (No. B2023003), and the Science and Technology Commission of Shanghai Municipality (No. 22ZR1427700).
Institutional Review Board Statement
Not applicable.
Informed Consent Statement
Not applicable.
Data Availability Statement
Restrictions apply to the availability of these data. Data were obtained from Shanghai SMUVision Smart Technology Ltd. and are available from the authors with the permission of Shanghai SMUVision Smart Technology Ltd.
Conflicts of Interest
The authors declare no conflicts of interest.
References
- Huang, Q.F.; Huang, Y.G.; Zhang, Z.W.; Zhang, Y.J.; Mi, W.J.; Mi, C. Truck-Lifting Prevention System Based on Vision Tracking for Container-Lifting Operation. J. Adv. Transp. 2021, 2021, 9612480. [Google Scholar] [CrossRef]
- Ji, Z.Y.; Zhao, K.K.; Liu, Z.X.; Hu, H.; Sun, Z.H.; Lian, S.G. A Novel Vision-Based Truck-Lifting Accident Detection Method for Truck-Lifting Prevention System in Container Terminal. IEEE Access 2024, 12, 42401–42410. [Google Scholar] [CrossRef]
- Asborno, M.I.; Burris, C.G.; Hernandez, S. Truck Body-Type Classification using Single-Beam Lidar Sensors. Transp. Res. Rec. 2019, 2673, 26–40. [Google Scholar] [CrossRef]
- Zhang, L.; Zhang, W.; Li, Y.; Li, B.; Li, C.; Sun, X. Acquisition Method of Container Lock Pin Model Based on Point Cloud Data. In Proceedings of the 2022 China Automation Congress (CAC), Xiamen, China, 25–27 November 2022; IEEE: Piscataway, NJ, USA, 2022; pp. 490–494. [Google Scholar] [CrossRef]
- Ma, Z.; Postolache, O.; Yang, Y. Obstacle Avoidance for Unmanned Vehicle based on a 2D LIDAR. In Proceedings of the 2019 International Conference on Sensing and Instrumentation in IoT Era (ISSI), Lisbon, Portugal, 29–30 August 2019; IEEE: Piscataway, NJ, USA; pp. 1–6. [Google Scholar] [CrossRef]
- Zong, C.J.; Wan, Z.B. Container Ship Cell Guide Accuracy Check Technology Based on Improved 3D Point Cloud Instance Segmentation. Brodogradnja 2022, 73, 23–35. [Google Scholar] [CrossRef]
- Mi, C.; Shen, Y.; Mi, W.J.; Huang, Y.F. Ship Identification Algorithm Based on 3D Point Cloud for Automated Ship Loaders. J. Coast. Res. 2015, 73, 28–34. [Google Scholar] [CrossRef]
- Saglam, A.; Makineci, H.B.; Baykan, Ö.; Baykan, N.A. Clustering-Based Plane Refitting of Non-planar Patches for Voxel-Based 3D Point Cloud Segmentation Using K-Means Clustering. Trait. Signal 2020, 37, 1019–1027. [Google Scholar] [CrossRef]
- Zhang, J.X.; Lin, X.G.; Ning, X.G. SVM-Based Classification of Segmented Airborne LiDAR Point Clouds in Urban Areas. Remote Sens. 2013, 5, 3749–3775. [Google Scholar] [CrossRef]
- Hinton, G.E.; Salakhutdinov, R.R. Reducing the dimensionality of data with neural networks. Science 2006, 313, 504–507. [Google Scholar] [CrossRef] [PubMed]
- Qi, C.R.; Su, H.; Mo, K.; Guibas, L.J. Pointnet: Deep learning on point sets for 3d classification and segmentation. In Proceedings of the IEEE Conference on Computer Vision and Pattern Recognition, Honolulu, HI, USA, 21–26 July 2017; IEEE: Piscataway, NJ, USA; pp. 652–660. [Google Scholar]
- Qi, C.R.; Yi, L.; Su, H.; Guibas, L.J. Pointnet++: Deep hierarchical feature learning on point sets in a metric space. In Proceedings of the 31st International Conference on Neural Information Processing Systems, Long Beach, CA, USA, 4–9 December 2017. [Google Scholar]
- Li, Y.; Bu, R.; Sun, M.; Wu, W.; Di, X.; Chen, B. Pointcnn: Convolution on x-transformed points. In Advances in Neural Information Processing Systems; Neural Information Processing Systems Foundation, Inc. (NeurIPS): La Jolla, CA, USA, 2018; Volume 31. [Google Scholar]
- Zhang, L.; Wang, H. A novel segmentation method for cervical vertebrae based on PointNet plus plus and converge segmentation. Comput. Methods Programs Biomed. 2021, 200, 105798. [Google Scholar] [CrossRef] [PubMed]
- Fan, Z.M.; Wei, J.H.; Zhang, R.Y.; Zhang, W.X. Tree Species Classification Based on PointNet plus plus and Airborne Laser Survey Point Cloud Data Enhancement. Forests 2023, 14, 1246. [Google Scholar] [CrossRef]
- Hu, H.; Zhang, G.H.; Ao, J.F.; Wang, C.L.; Kang, R.H.; Wu, Y.L. Multi-information PointNet plus plus fusion method for DEM construction from airborne LiDAR data. Geocarto Int. 2023, 38, 2153929. [Google Scholar] [CrossRef]
- Lin, Y.W.; Knudby, A.J. Global automated extraction of bathymetric photons from ICESat-2 data based on a PointNet plus plus model. Int. J. Appl. Earth Obs. Geoinf. 2023, 124, 103512. [Google Scholar] [CrossRef]
- Patel, A.K.; Park, E.S.; Lee, H.; Priya, G.G.L.; Kim, H.; Joshi, R.; Arief, M.A.A.; Kim, M.S.; Baek, I.; Cho, B.K. Deep Learning-Based Plant Organ Segmentation and Phenotyping of Sorghum Plants Using LiDAR Point Cloud. IEEE J. Sel. Top. Appl. Earth Obs. Remote Sens. 2023, 16, 8492–8507. [Google Scholar] [CrossRef]
- Jing, Z.W.; Guan, H.Y.; Zhao, P.R.; Li, D.L.; Yu, Y.T.; Zang, Y.F.; Wang, H.Y.; Li, J. Multispectral LiDAR Point Cloud Classification Using SE-PointNet plus. Remote Sens. 2021, 13, 2516. [Google Scholar] [CrossRef]
- Guo, R.C.; Xie, J.L.; Zhu, J.X.; Cheng, R.F.; Zhang, Y.; Zhang, X.H.; Gong, X.J.; Zhang, R.W.; Wang, H.; Meng, F.F. Improved 3D point cloud segmentation for accurate phenotypic analysis of cabbage plants using deep learning and clustering algorithms. Comput. Electron. Agric. 2023, 211, 108014. [Google Scholar] [CrossRef]
- Chen, R.; Yang, M.; Guan, A.; Lan, Z.; Wang, L.; Wang, Y.; Niu, Q. Cigarette Perforation Point Cloud Segmentation and Hole Depth Calculation Based on the Improved PointNet++ Network and DMCP Algorithm. IEEE Sensors J. 2024, 24, 21048–21061. [Google Scholar] [CrossRef]
- Cheng, G.; Gu, C. Enhancing Point Cloud Classification and Segmentation with Attention-Enhanced SO-PointNet++. IEEE Access 2024, 12, 195986–195995. [Google Scholar] [CrossRef]
- Yu, L.; Yu, H.; Yang, S. A Deep Neural Network Using Double Self-Attention Mechanism for ALS Point Cloud Segmentation. IEEE Access 2022, 10, 29878–29889. [Google Scholar] [CrossRef]
- Rosenblatt, F. The perceptron: A probabilistic model for information storage and organization in the brain. Psychol. Rev. 1958, 65, 386–408. [Google Scholar] [CrossRef] [PubMed]
- Hu, J.; Shen, L.; Albanie, S.; Sun, G.; Wu, E.H. Squeeze-and-Excitation Networks. IEEE Trans. Pattern Anal. Mach. Intell. 2020, 42, 2011–2023. [Google Scholar] [CrossRef] [PubMed]
- Vaswani, A. Attention is all you need. In Advances in Neural Information Processing Systems; Neural Information Processing Systems Foundation, Inc. (NeurIPS): La Jolla, CA, USA, 2017. [Google Scholar] [CrossRef]


Disclaimer/Publisher’s Note: The statements, opinions and data contained in all publications are solely those of the individual author(s) and contributor(s) and not of MDPI and/or the editor(s). MDPI and/or the editor(s) disclaim responsibility for any injury to people or property resulting from any ideas, methods, instructions or products referred to in the content. |
© 2025 by the authors. Licensee MDPI, Basel, Switzerland. This article is an open access article distributed under the terms and conditions of the Creative Commons Attribution (CC BY) license (https://creativecommons.org/licenses/by/4.0/).