1. Introduction
Nuclear energy, as a clean energy source with extremely high energy density, is the subject of ongoing development and is utilized in a range of fields. The safety issues associated with this energy source have attracted considerable attention. As an emerging type of utilization of nuclear energy, floating nuclear power plants are subject to a range of movements, including lateral tilt, longitudinal tilt, pitch, sway, heave, and so forth, on the reactor platform. These movements are a consequence of the interaction between the marine environment and the floating nuclear power plant, specifically the action of wind, waves, currents, and other environmental factors. During the design life, floating reactors not only have to withstand low-frequency fatigue caused by temperature and pressure, but they also have to endure long-term oscillation inertial forces generated by waves [
1,
2]. The lateral inertial force generated by waves is a constantly changing dynamic load that causes alternating stress in equipment structures, which may cause fatigue damage to the structure. Fatigue failure is the main form of mechanical structural failure [
3,
4,
5,
6]. As a vital component of large-scale nuclear power equipment, the potential consequences of Reactor Pressure Vessel (RPV) failure are significant and far-reaching. It is therefore imperative that the fatigue damage analysis of the RPV is completed with the utmost expediency and precision during the design phase in order to ensure the safety of floating nuclear power plants.
According to the requirements of the nuclear power standard ASME BPVC III [
7], fatigue analysis requires the superposition calculation of possible transient loads, considering different transient combinations to find the most dangerous position for fatigue analysis. The transient load resulting from temperature and pressure fluctuations is relatively straightforward in its fundamental structure, straightforward to calculate, and susceptible to fatigue damage under thermal pressure. Nevertheless, the transient loads generated by wave action under different wave heights and periods are not identical. It is necessary to consider that each transient load requires a significant amount of time to simulate the complete time-domain nonlinear coupling calculation. Consequently, the fatigue damage caused by wave load action is predominantly examined through the lens of spectral analysis techniques. In theory, due to the nonlinear relationship between damage and stress, the direct addition of fatigue damage obtained from the two methods would be a highly conservative and potentially dangerous approach. In the fatigue analysis of the riser system by Luo et al. [
8], the result of the direct addition of damage is 20–60% lower than the actual result; Lotsberg [
9] also pointed out that this direct addition method should not be used to calculate the combined fatigue damage under two types of loads.
Additionally, numerous studies have been conducted on the combination methods of damage under varying loads. Lotsberg [
9] proposed a simple and clear formula based on the principle of damage equivalence, which equates a low-frequency and high-frequency random stress response process to a combination of two constant amplitude stress time processes. This formula has been applied in DNV specifications. Huang and Moan [
10] proposed a formula similar to DNV, but it can only provide more accurate fatigue damage in some cases. Similarly, Temple [
11] proposed a new damage combination formula called the sum of squares of damage square root method, which has no theoretical background, and the damage results are not satisfactory. Han and Ma [
12] proposed a pseudo spectral method based on the superposition of two constant amplitude sine waves to construct a new spectrum to solve the fatigue damage combination problem under high and low frequency loads. The method is relatively straightforward to use; however, in floating nuclear power plants, low-frequency loads are no longer sinusoidal, rendering the method inapplicable. Conversely, the theoretical foundation for estimating damage using these methodologies is Miner’s linear accumulation theory. Although spectral methods based on the Miner’s rule have proven to be effective in estimating fatigue life [
13,
14], it must be acknowledged that the Miner’s rule does not consider the interaction between loads, which is inconsistent with the actual damage accumulation behavior of many materials. In engineering, the total cumulative damage of a structure when it fails is not necessarily 1, and there is usually a large fluctuation range [
15]. To address the shortcomings of Miner’s criterion, many scholars have proposed different cumulative damage models, which are categorized into two types: modified linear cumulative damage models and nonlinear cumulative damage models. Among the modified linear cumulative damage models, the Corten–Dolan [
16] model is the most classical one, and the main difference between it and Miner’s criterion is that it replaces the slope parameter m of the S–N curve with the damage index “d”.
Nonlinear damage accumulation models include the accumulation model based on the damage curve, the accumulation model based on the energy criterion, the accumulation model based on the continuous damage mechanics, and the accumulation model considering the effect of loading sequence. Marco and Starkey [
17] constructed a nonlinear fatigue damage model considering stress amplitude by conducting experiments with different loading sequences on the concept of a damage curve. Subsequently, Manson and Halford [
18] provided the damage index and proposed an analytical expression for the damage curve based on the empirical formula of the effective crack propagation model. Based on the application of the energy dissipation process in fatigue damage, Ye et al. [
19] proposed a toughness dissipation model, which requires fewer parameters, has a simple form, and is more accurate in calculating fatigue cumulative damage under multi-stage loading. Niu et al. [
20] obtained the rule of change of the hardening coefficient and hardening index with the load cycle through strain cycling experiments and put forward a fatigue damage model related to the energy of plastic strains. This is a nonlinear cumulative model based on the energy criterion, and this kind of model is simple without additional physical parameters, but there is the problem of not considering the order of loads and the interaction between loads. Following the proposal of the concepts of “continuity” and “damage factor” by Kachanov [
21] through the analysis of creep damage, the theory of continuum damage mechanics was gradually developed. Consequently, the cumulative damage model based on continuum damage mechanics began to evolve. Lemaitre [
22] combined the theory of continuum damage mechanics with thermodynamics to obtain a new model of fatigue damage evolution; Dattoma [
23] established the theory of continuous medium damage on the basis of Chaboche and Lemaitre’s model; Xu [
24] utilized the continuous damage model for the fatigue assessment of suspension bridges under multiple loads. These models have a more perfect mechanical theoretical basis, but due to the large number of parameters in the model, some parameters are difficult to determine. More and more models represent the effect of the loading sequence on fatigue damage by introducing specific parameters. Chen [
25] took the static toughness of the material as the damage parameter, considering the loading sequence effect, and proposed a convenient nonlinear fatigue damage accumulation criterion. Gao [
26] provided a definition for the correction factor as the ratio of two successive applied stress levels, and Wang’s [
27] contributions to the field entailed the refinement of Ye’s model through the incorporation of primary and secondary terms representing the ratio of anterior and posterior loads. This methodological advancement yielded more precise results.
In the study of pressure-bearing equipment in floating nuclear power plants, the fatigue damage under wave load and thermal pressure load was calculated using the methods of the ship standard and the nuclear power standard, respectively. Considering the joint action of thermal pressure load and wave load, a more convenient damage calculation formula was proposed based on Liu and Wang’s [
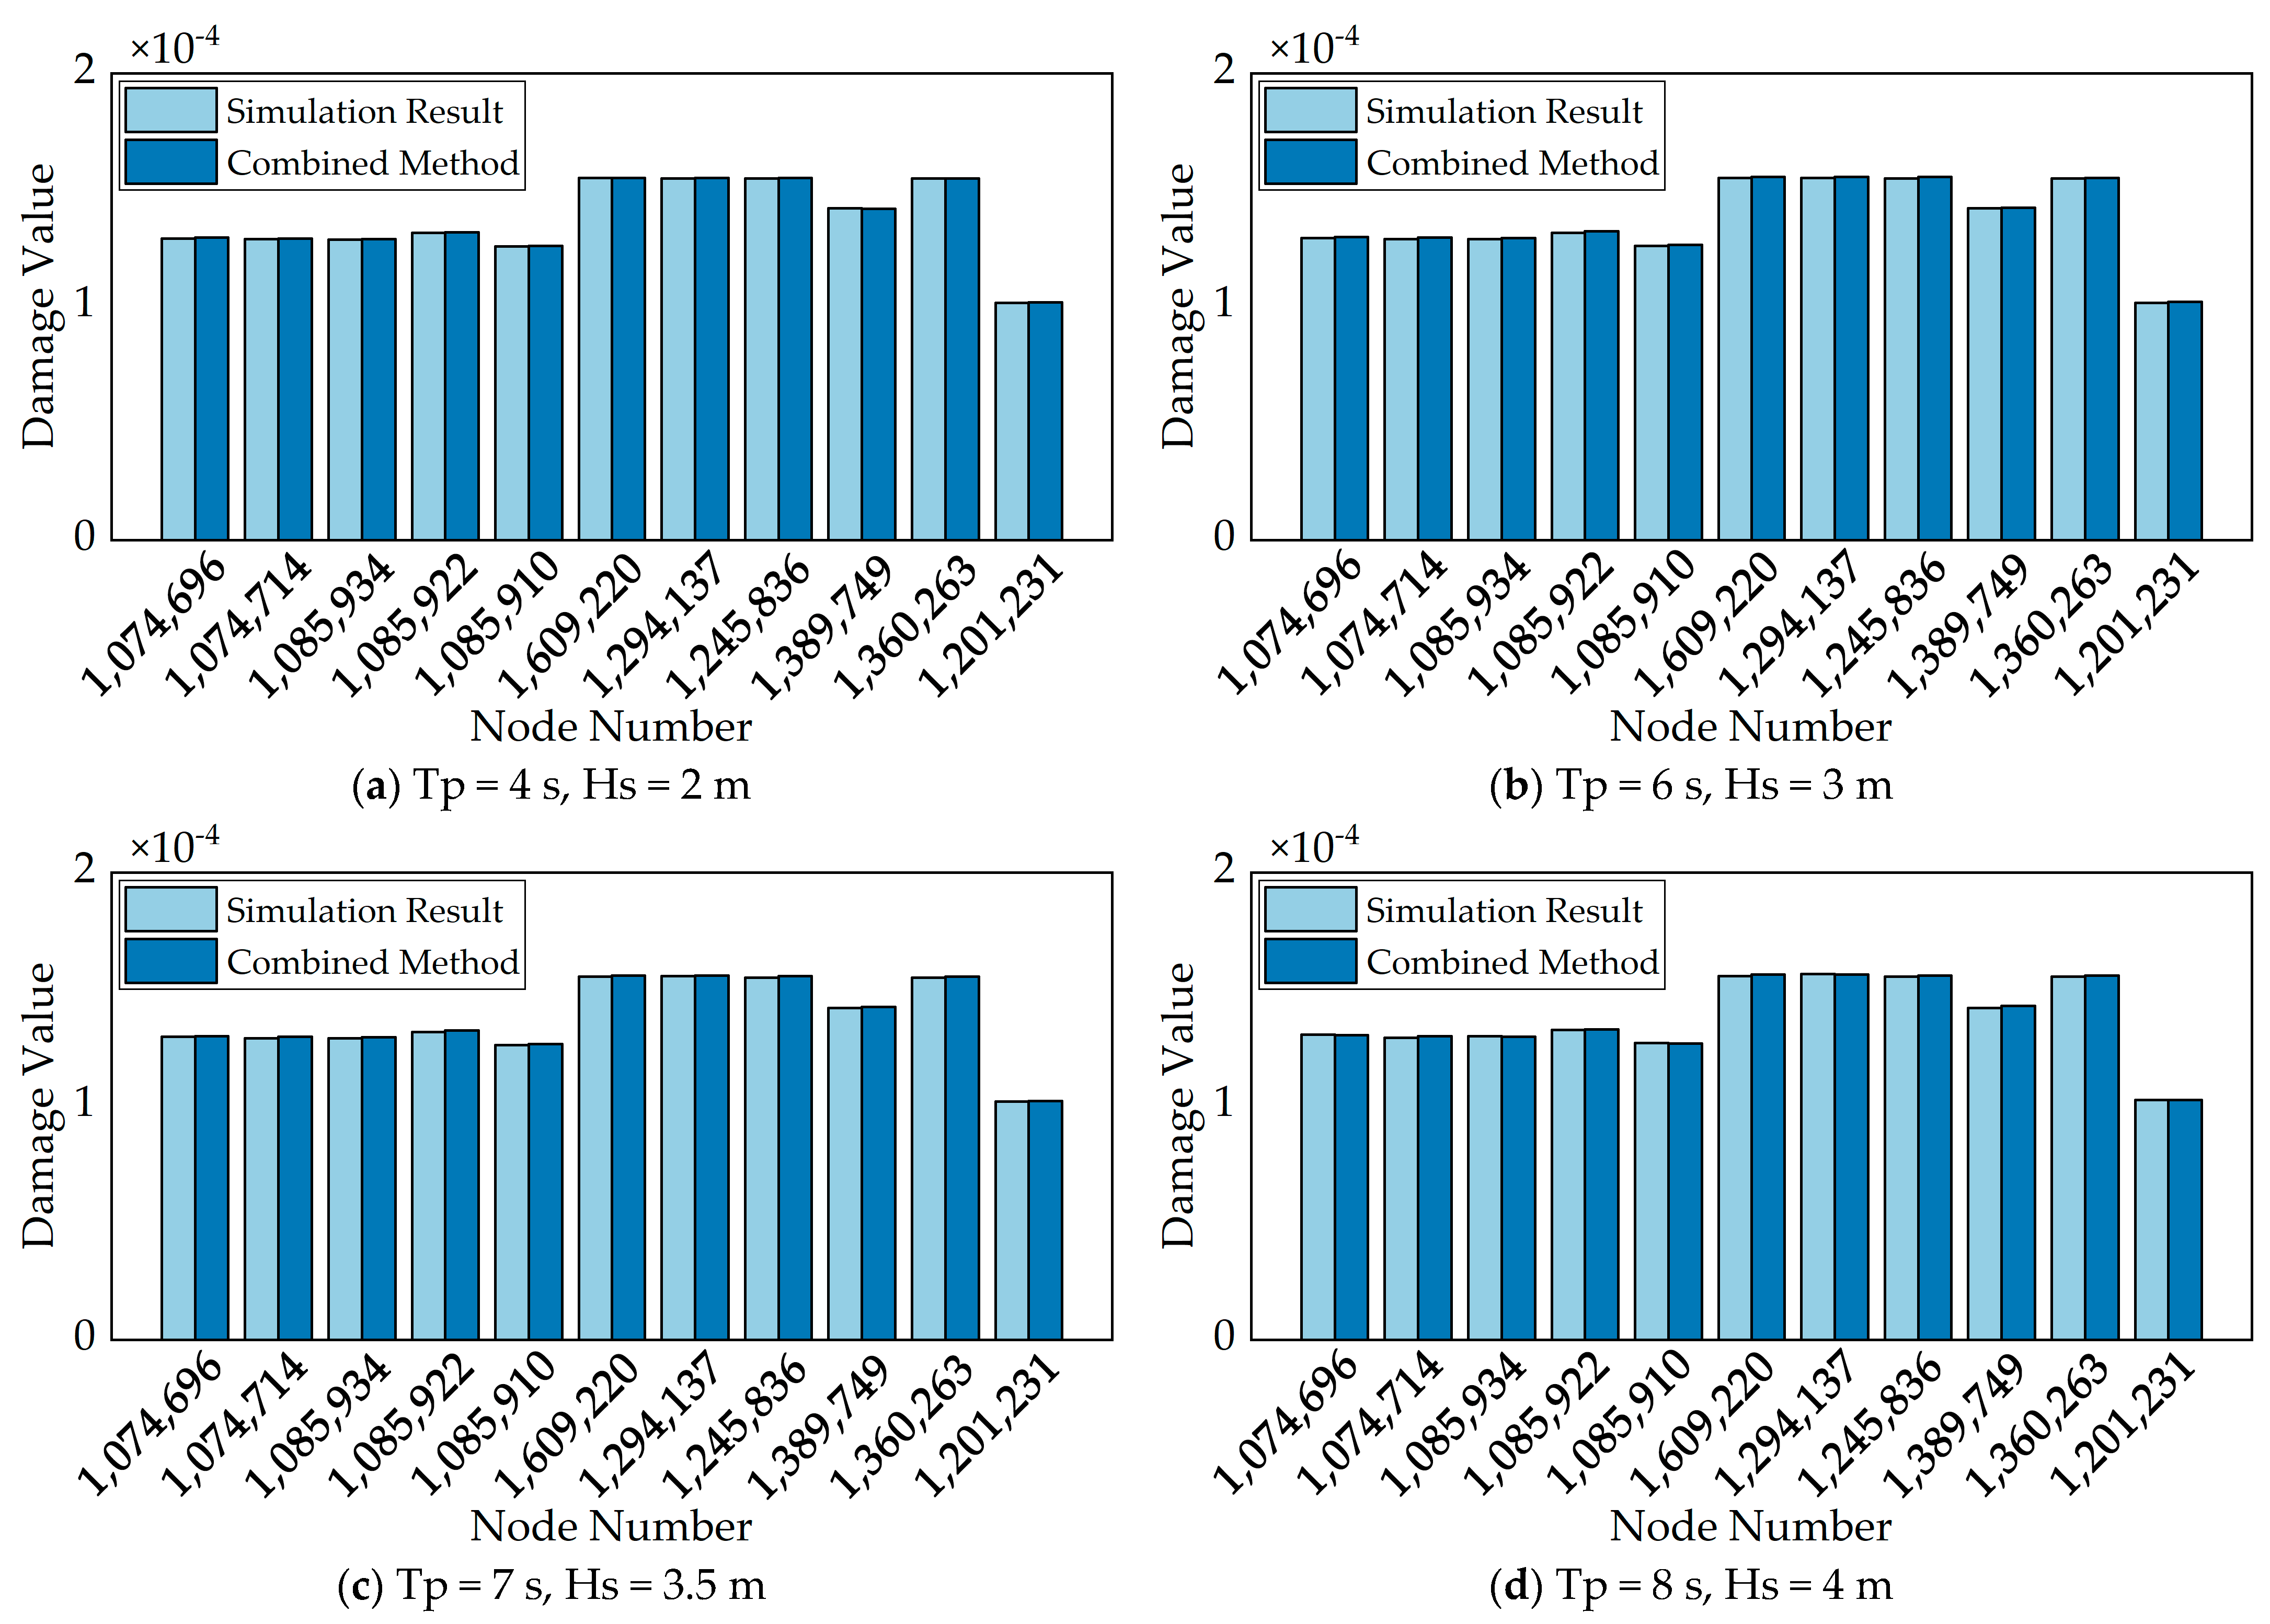
28] damage formula. Ultimately, the stress time history curve and fatigue damage value of the structural verification node were derived through time-domain simulation calculations for a range of operational scenarios. The findings demonstrate that the combined approach exhibited superior accuracy in predicting damage values compared to the linear model while offering a more expedient solution than time-domain simulation calculations.
2. Fatigue Analysis Method for Ship Structure
Fatigue analysis methods for ship structures are mainly divided into two categories: time-domain methods [
29] and frequency-domain methods [
30,
31] (spectral methods). The former are based on the random process simulation of fatigue loads and a structural transient analysis. Previous methods include using the rainflow counting formula (RCF) to extract the average and amplitude of stress response time history [
32], and then using these values as inputs to the fatigue damage equation to evaluate fatigue damage and life. This method is capable of simulating actual fatigue damage in a more realistic manner; however, it is relatively inefficient in terms of computational resources. The latter method, the spectral method, directly calculates fatigue damage by obtaining the power spectral density (PSD) of stress based on the PSD of random loads. The computational efficiency of spectral methods is considerable, as frequency domain response analysis is more rapid than transient dynamics analysis over an extended period.
2.1. Spectral Analysis Method
Spectral analysis is a frequently employed methodology in the fatigue analysis of maritime vessels, facilitating the investigation of load and structural response. The theoretical basis for this method is the transformation of linear systems in the context of stochastic process theory. Assuming that the wave process is a stationary stochastic process, then the alternating stress caused by waves can also be considered a stochastic process. In accordance with the tenets of stochastic process theory, the power spectral density of two stationary stochastic processes is related by the following equation:
where
is called the transfer function,
is the power spectral density function of the input process,
is the power spectral density function of the response process, and
is circular frequency.
In the context of operating pressure-bearing equipment in floating nuclear power plants, the oscillation inertia force generated by waves represents a continually evolving dynamic load. Its magnitude is contingent upon acceleration. In order to employ spectral analysis methods, it is first necessary to convert the wave spectrum into an acceleration spectrum. This is followed by the calculation of the alternating stress intensity power spectrum of the pressure-bearing equipment through the acceleration spectrum. The formula should be expressed as follows:
where
is the alternating stress intensity power spectrum,
is the acceleration power density spectrum,
is the wave spectrum,
is the transfer function from the acceleration spectrum to the alternating stress intensity power spectrum, and
is the transfer function from the wave spectrum to the acceleration spectrum.
The fatigue calculation of the full structure using the narrow band correction method can be expressed as follows:
where
is the fatigue damage value calculated using the narrow band correction method, T is the duration, K and m are material parameters, and
is the average cross-zero rate, calculated by the following equation:
where
and
are the spectral moment, calculated by the following equation:
where
is the power density spectrum, and
is circular frequency.
2.2. Transfer Function
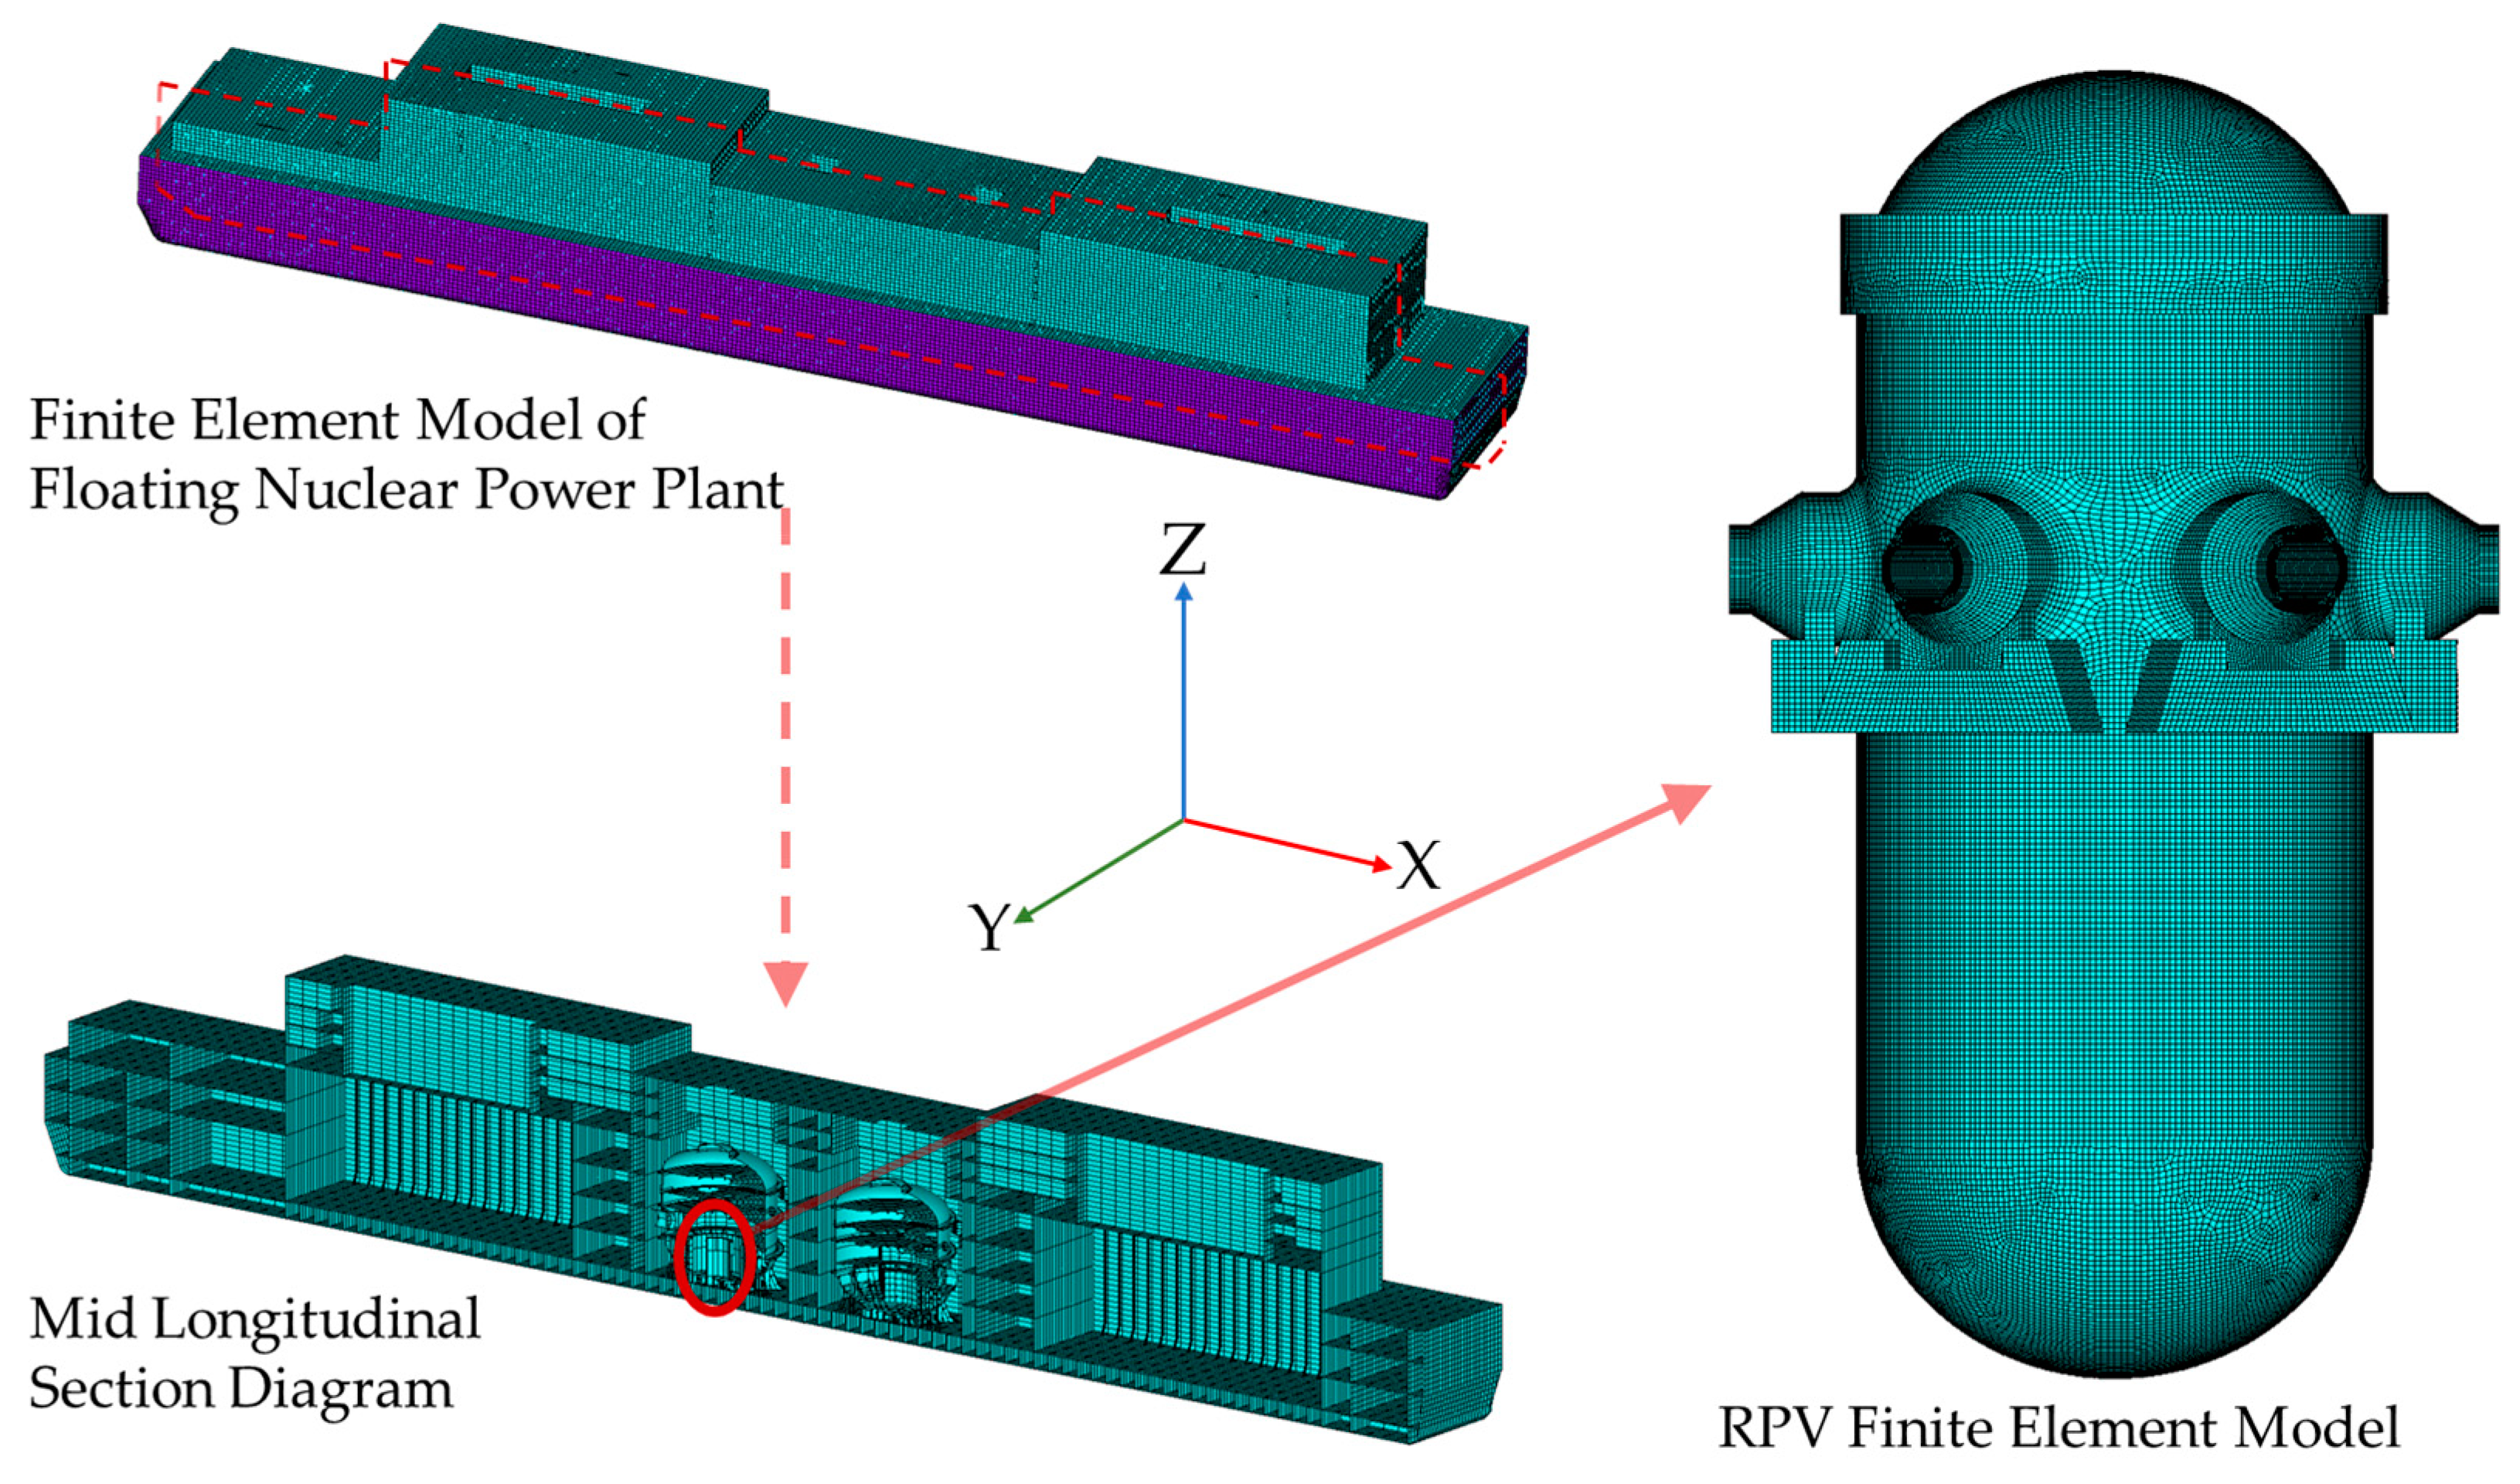
The ratio of the structural displacement amplitude to the wave amplitude under wave action, calculated by the software under the Hydrodynamic Diffraction plate in ANSYS Workbench (v. 22.1), is defined as the transfer function,
, from the wave spectrum to the displacement spectrum. Furthermore, a relationship exists between the displacement spectrum and the acceleration spectrum. The displacement spectrum and acceleration spectrum have the following relationship:
where
is the transfer function from the wave spectrum to the acceleration spectrum.
The acceleration power spectrum is calculated as follows:
where
is power spectral density function of the acceleration response.
The transfer function from the acceleration power spectrum to the alternating stress power spectrum is calculated using the complex frequency response method. For a multi-load input linear system, under a multi-input process
, the multi-output process of the structure is
, and there is a relationship between the input process power spectral density function matrix,
, and the output process power spectral density function matrix,
, expressed as follows:
where
is the input process power spectral density function matrix,
is the output process power spectral density function matrix, and
is the frequency transfer function matrix. The matrix form is as follows:
where
is the cross-spectral density function of response processes
and
;
is the cross-spectral density function of input processes
and
.
is the frequency transfer function between and , representing the frequency transfer function generated at j by a unit harmonic load acting at k, and and are conjugate functions with each other.
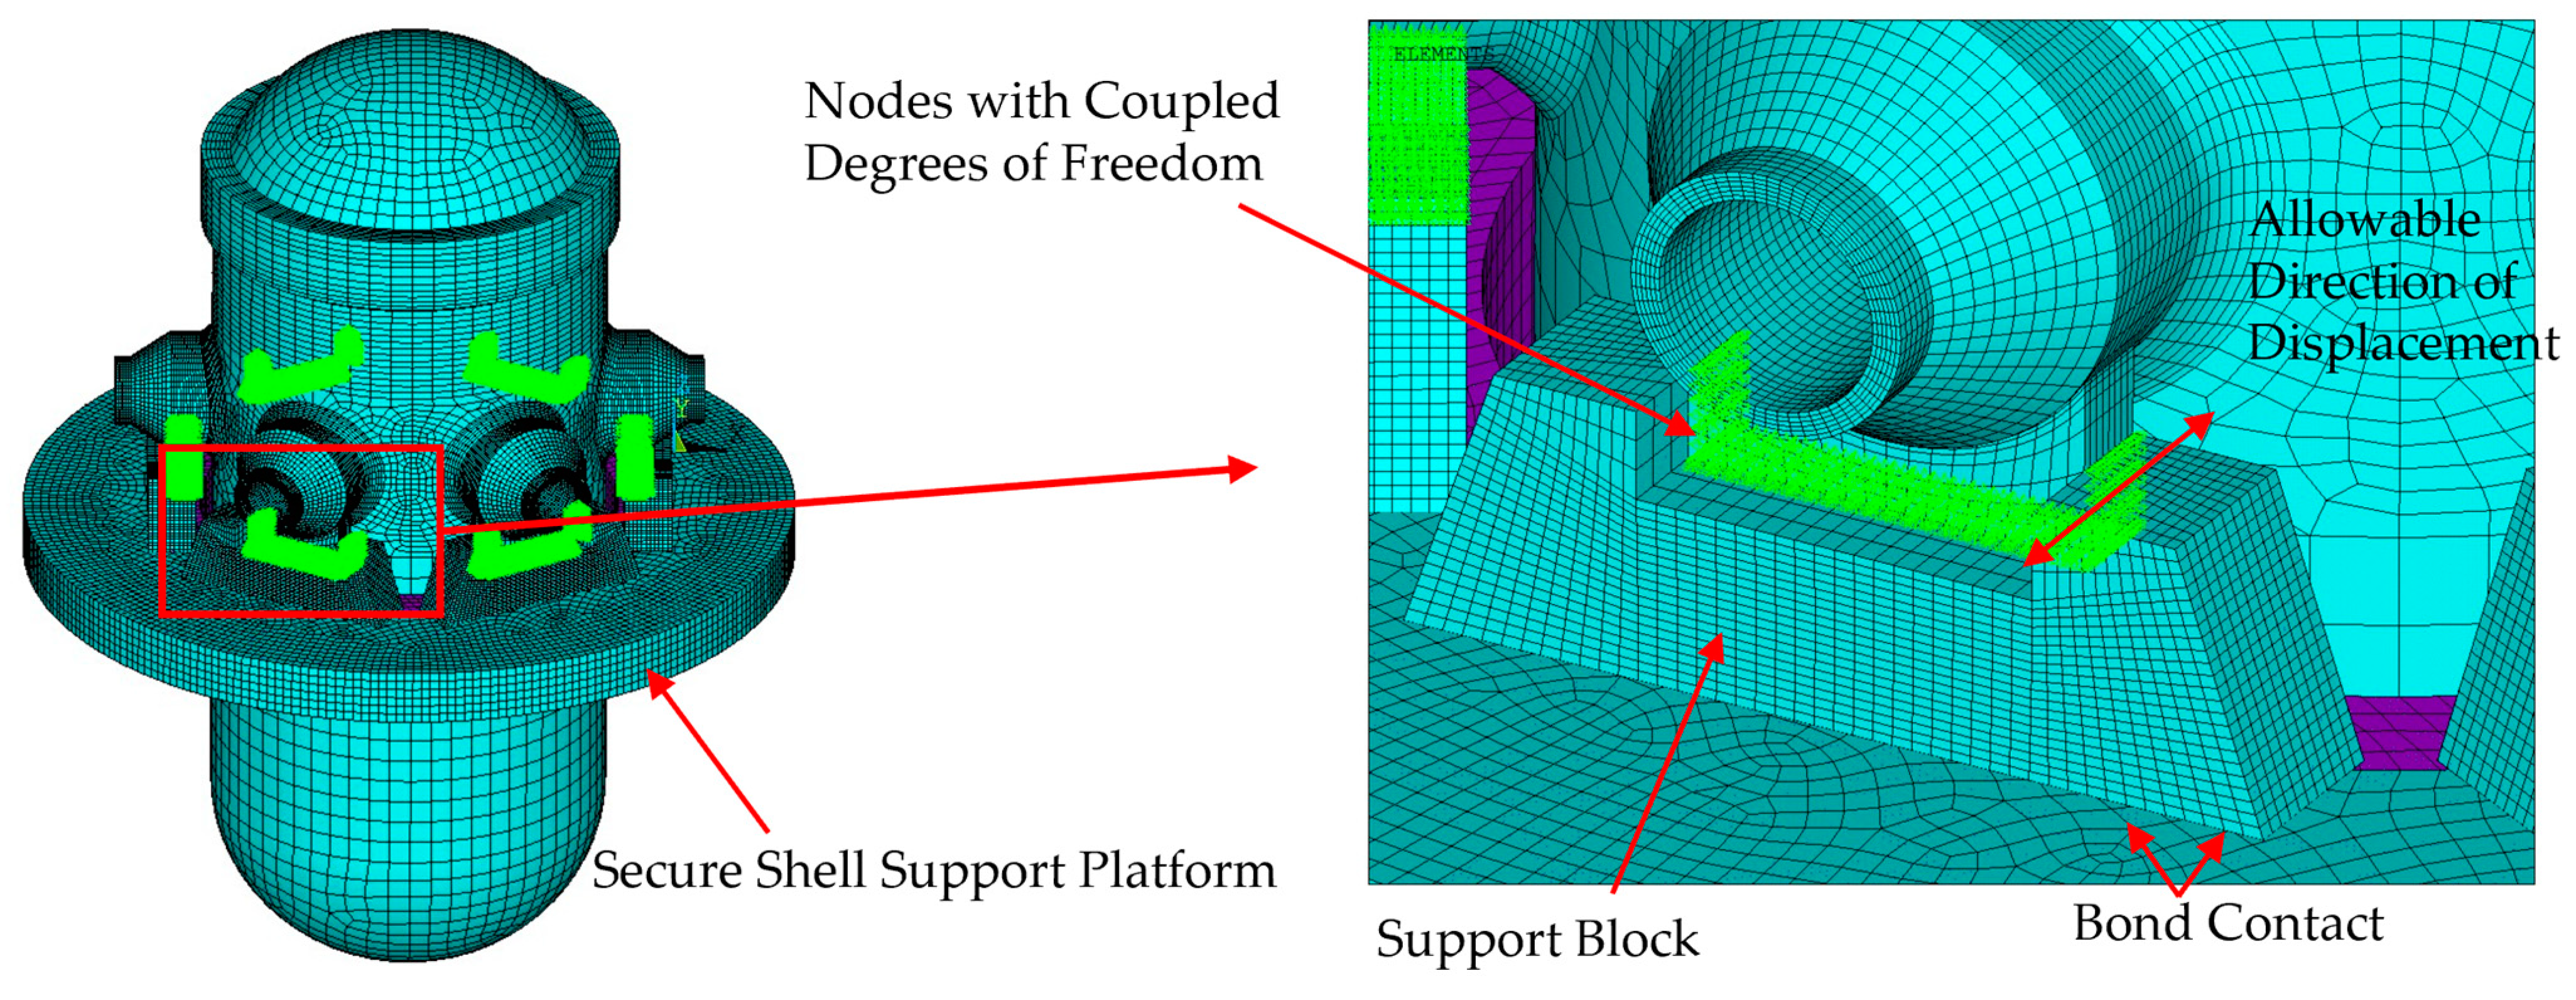
By using the harmonic response analysis module of ANSYS APDL, the calculation results are combined with real and imaginary data to obtain the transfer function from input to output. Unit acceleration is applied in six directions in APDL to obtain the transfer function of acceleration in six directions to structural stress intensity.
2.3. Alternating Stress Intensity Power Spectral Density
The ASME standard requires the use of alternating stress intensity to evaluate fatigue damage in structures. The alternating stress intensity in the standard refers to half of the maximum absolute value of the difference between the three principal stresses.
For a linear system, the relationship between a single load
and six stress components is linear.
where C represents the stress component under the action of a unit load, and
represent different stress components.
The calculation of the principal stress can be expressed as
where
,
, and
represent different principal stresses.
For the same load form and structure, the coefficients of each stress component in the equation are determined, so there is also a linear relationship between
and the principal stress.
The stress intensity
is calculated as follows:
So, in a linear system, the input single load, F, and the stress intensity response, , are also linearly related.
For a linear system under the simultaneous action of several loads, without considering the influence of direction and assuming that the effects of different loads are not correlated, the response of the alternating stress intensity can be considered as the sum of the response values under the individual action of each load. In fact, the direction of the principal stress is different, and the loads also influence each other, so the sum of the response values under the individual action of each load is a more conservative result.
2.4. Inertial Acceleration Conversion
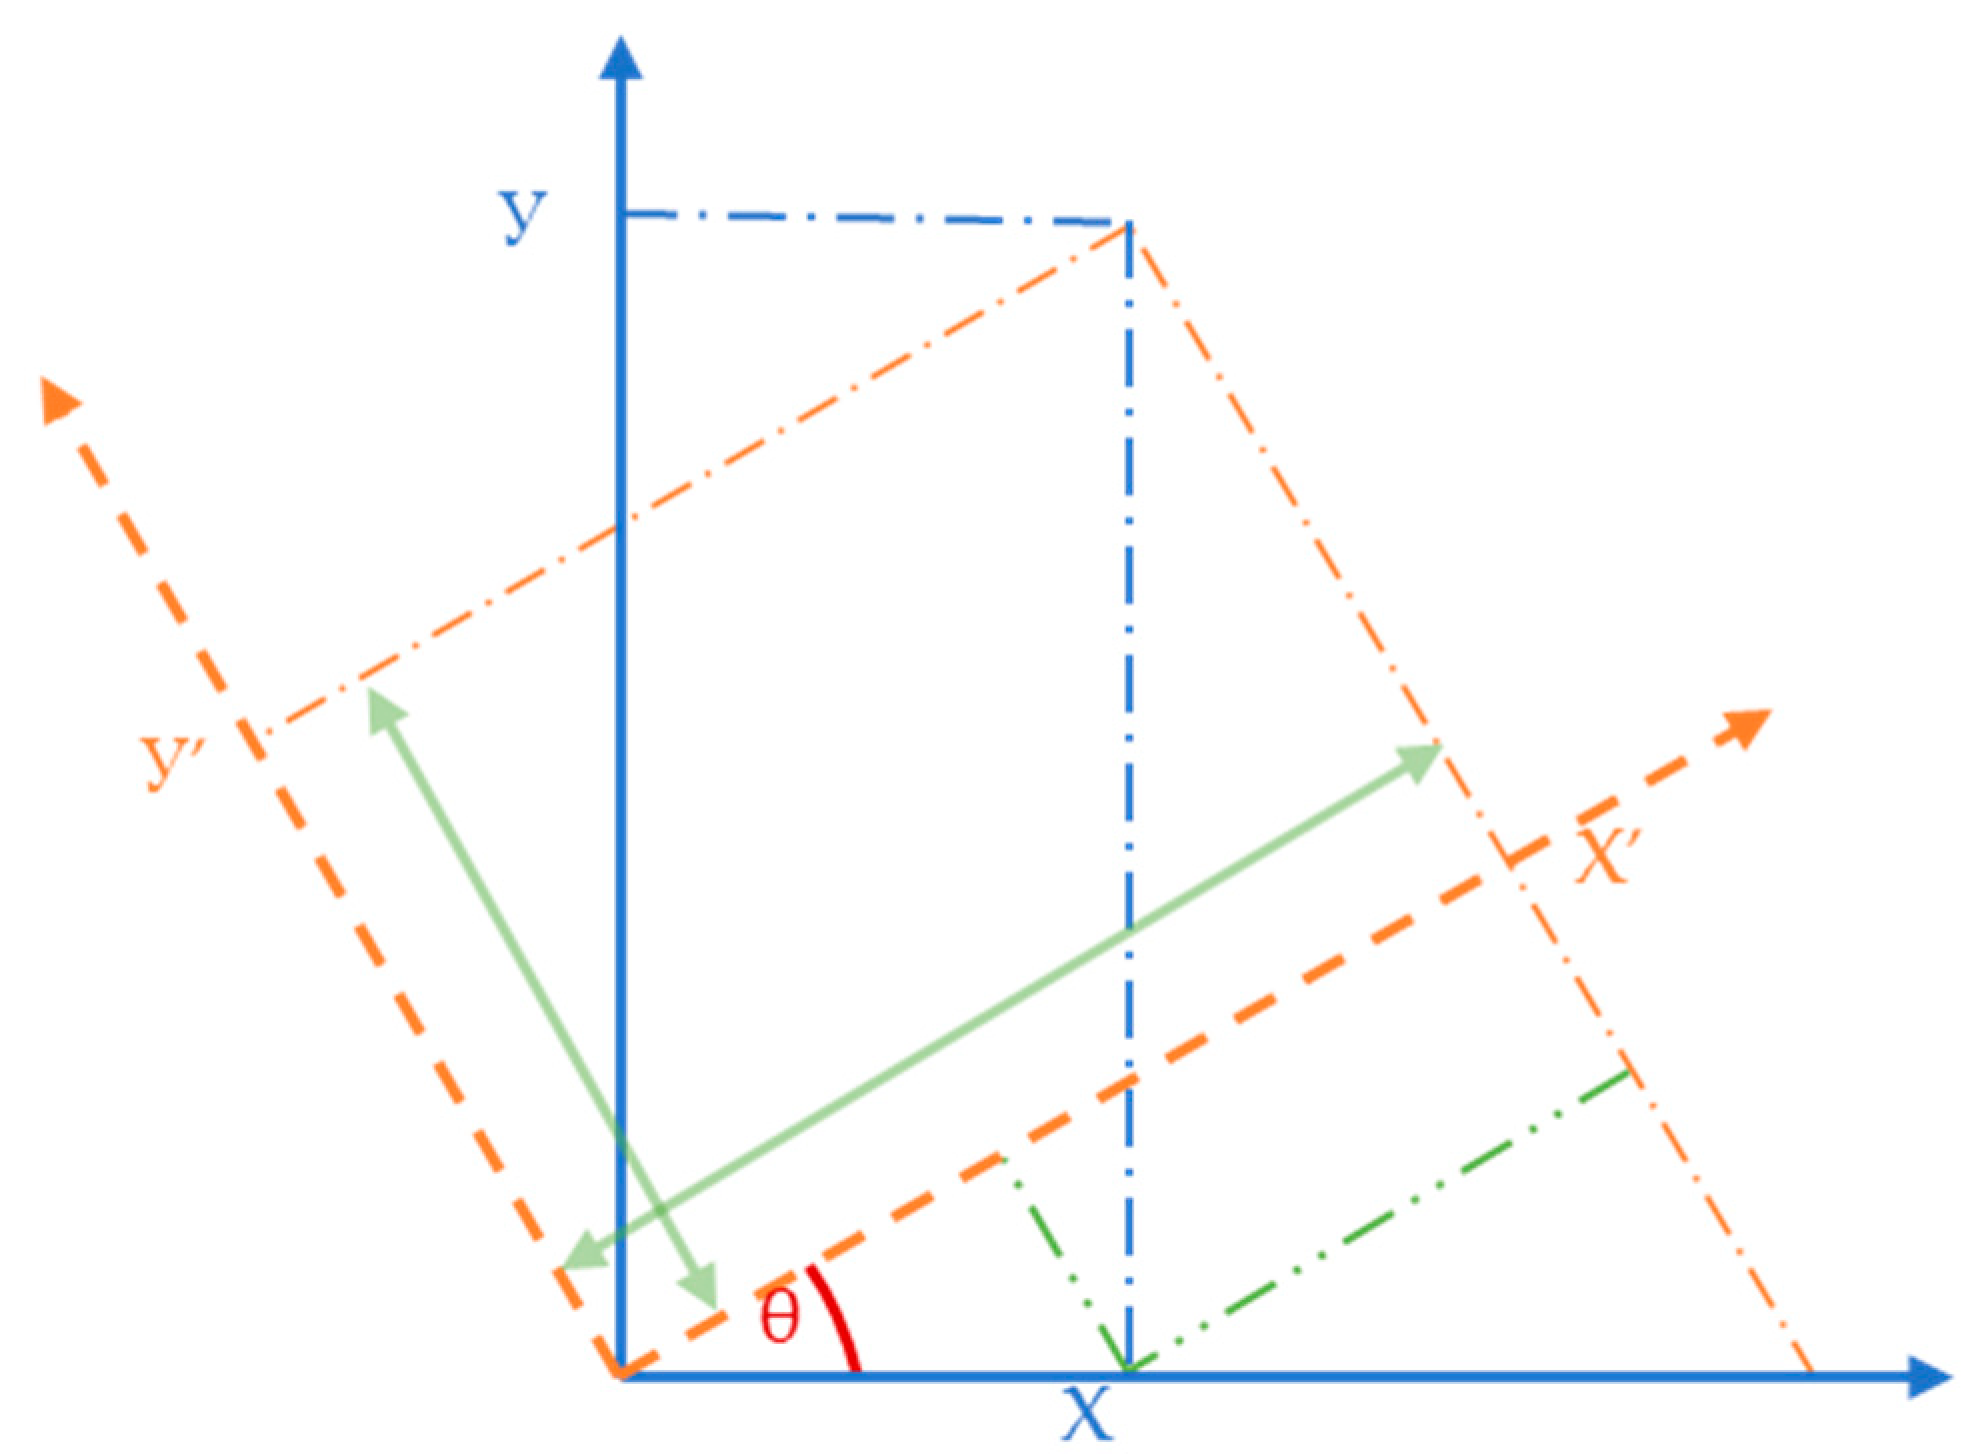
Based on the idea of coordinate transformation, the inertial acceleration caused by the movement of the ship is transformed into acceleration in three directions, X, Y, and Z, to calculate the inertial load caused by the change in position of the pressure equipment. In two-dimensional rotation, it is established that a counter-clockwise rotation of the coordinate system along the Z axis is positive, with a rotation angle of θ, as shown in
Figure 1 below.
They are expressed in matrix form as follows:
For three-dimensional rotations, only three two-dimensional rotations need to be performed. By extrapolation, the coordinate axes are rotated by α, β, and γ along the X, Y, and Z axes, and the corresponding coordinate transformations are as follows:
After obtaining the pitch, roll, and yaw angles, the gravitational acceleration can be converted into linear acceleration in three directions. Taking the effect in the Rx direction as an example, the calculation of the stress intensity power spectral density of the pressure equipment verification point is performed as follows:
where
,
, and
are the power density spectral functions of stress intensity in the Y, Z, and Rx directions;
is the power spectral density function of the total stress intensity;
is the wave spectrum;
is the transfer function from the wave spectrum to the structural motion acceleration spectrum; and
is the transfer function from motion acceleration to structural response, alternating stress intensity.
2.5. S-N Curve
From the ASME, we can obtain the material number used for RPV as SA-508 GR.3 CL.1 with the following chemical composition and material properties at different temperatures. The specific chemical composition is shown in
Table 1 and the material properties at various temperatures are shown in
Table 2.
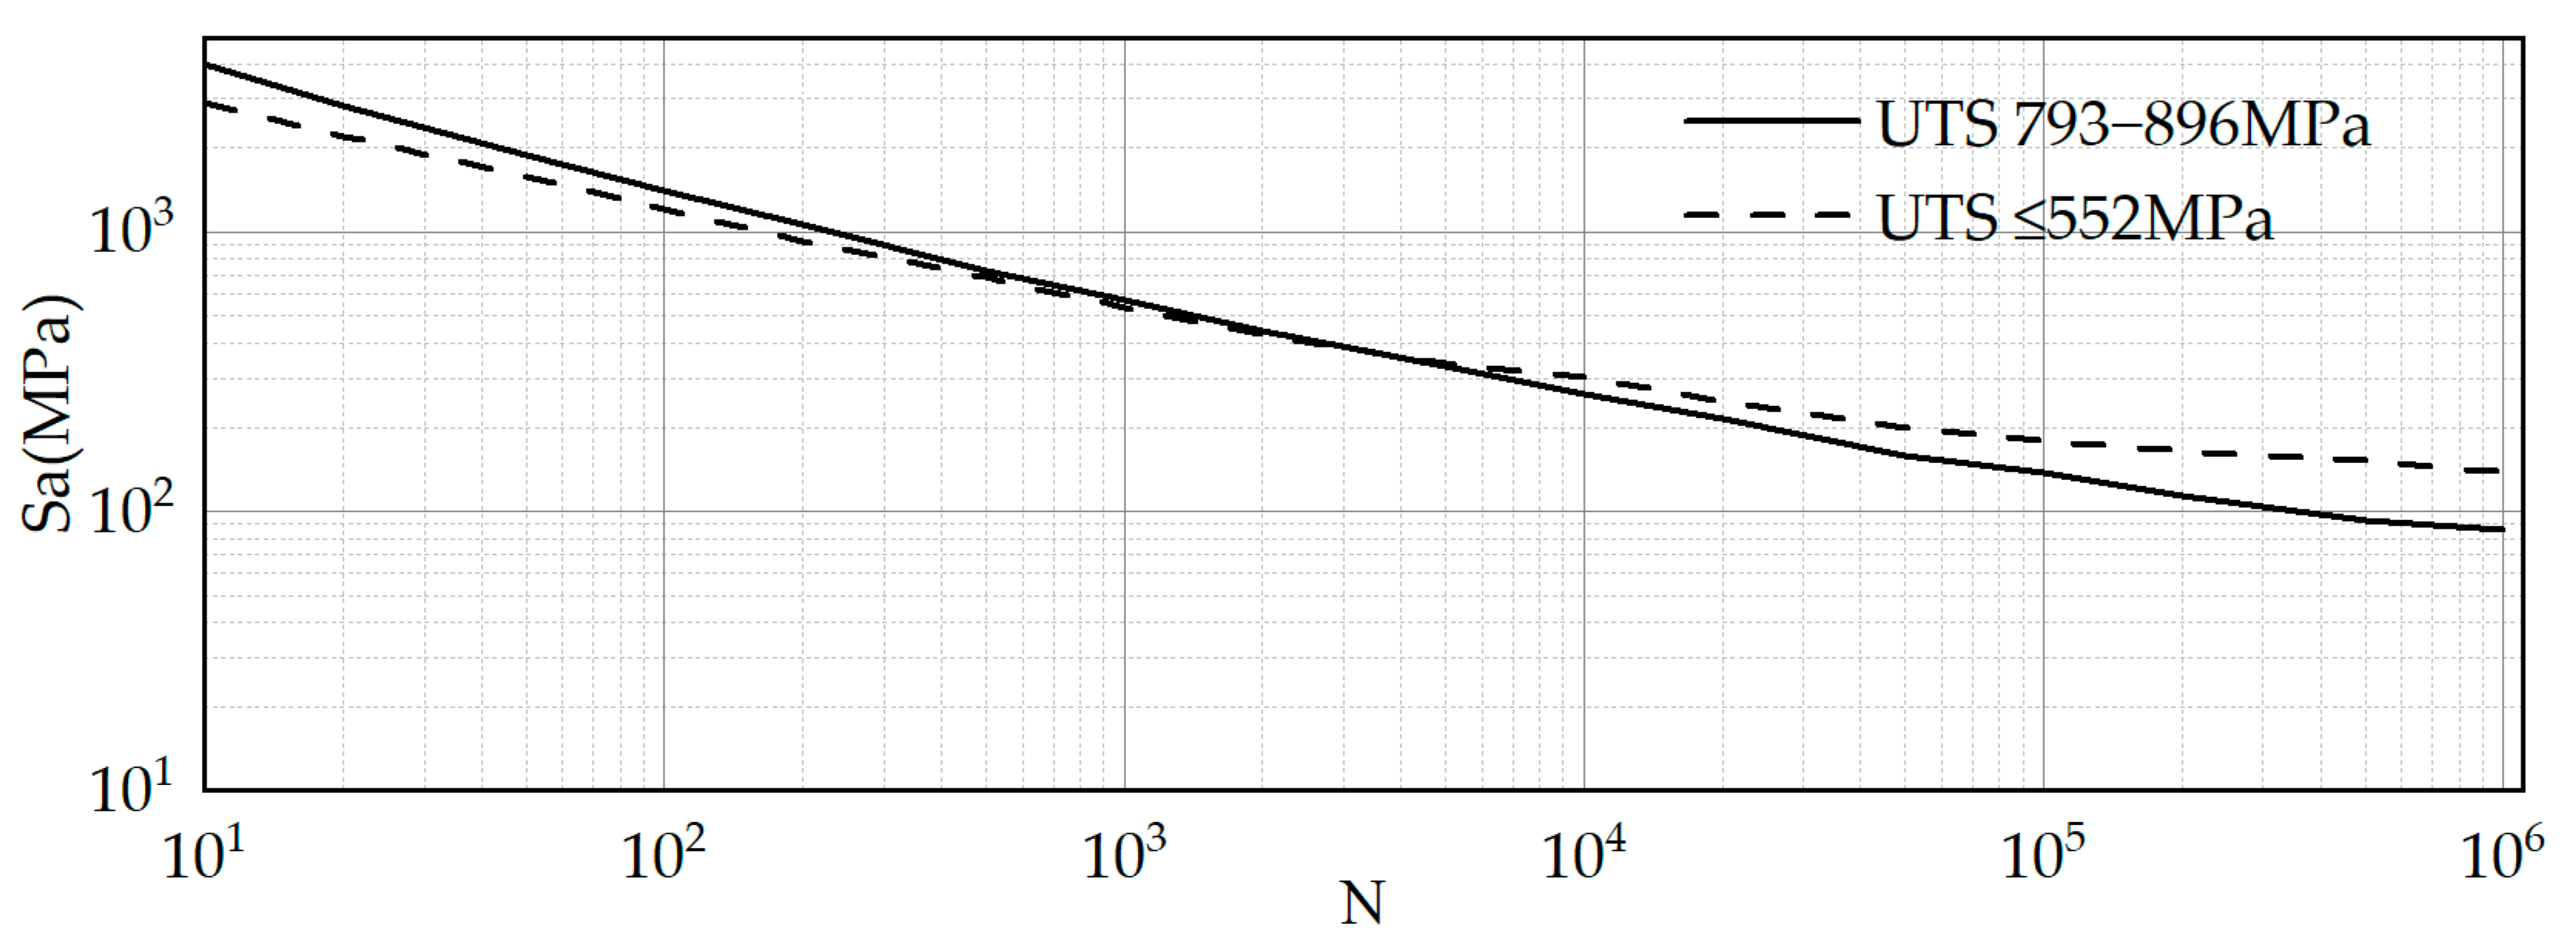
The Appendix of ASME BPVC-III Volume 1 provides the design fatigue curve for the corresponding material. The specification does not directly provide the fatigue performance curve for a particular grade of material but first classifies materials with similar fatigue performance and then provides the fatigue performance envelope for each type of material. Therefore, when using the design fatigue curve in the ASME specification for evaluation, a conservative estimate is obtained with a certain margin to meet engineering requirements. The specific design fatigue curve is shown in
Figure 2 below.
The general idea of using the spectral analysis method for fatigue calculation is to first calculate the environmental load on the structure, apply the load in the form of unit load at different frequencies to the finite element model to calculate the frequency domain response of the structure, and obtain the linear relationship between load and stress in the frequency domain. The short-term distribution of the load is calculated based on the short-term sea state information, and the stress range distribution of the structure under this working condition is obtained through the linear relationship obtained previously. The cumulative damage theory is used to calculate various short-term damages, and all of the damage are combined based on long-term service conditions to obtain the total damage. This method has many assumptions, and no one has used it to calculate structural fatigue in the nuclear power field, nor has it been mentioned in the nuclear power standard.
3. Fatigue Analysis Method for Nuclear Pressure Vessels
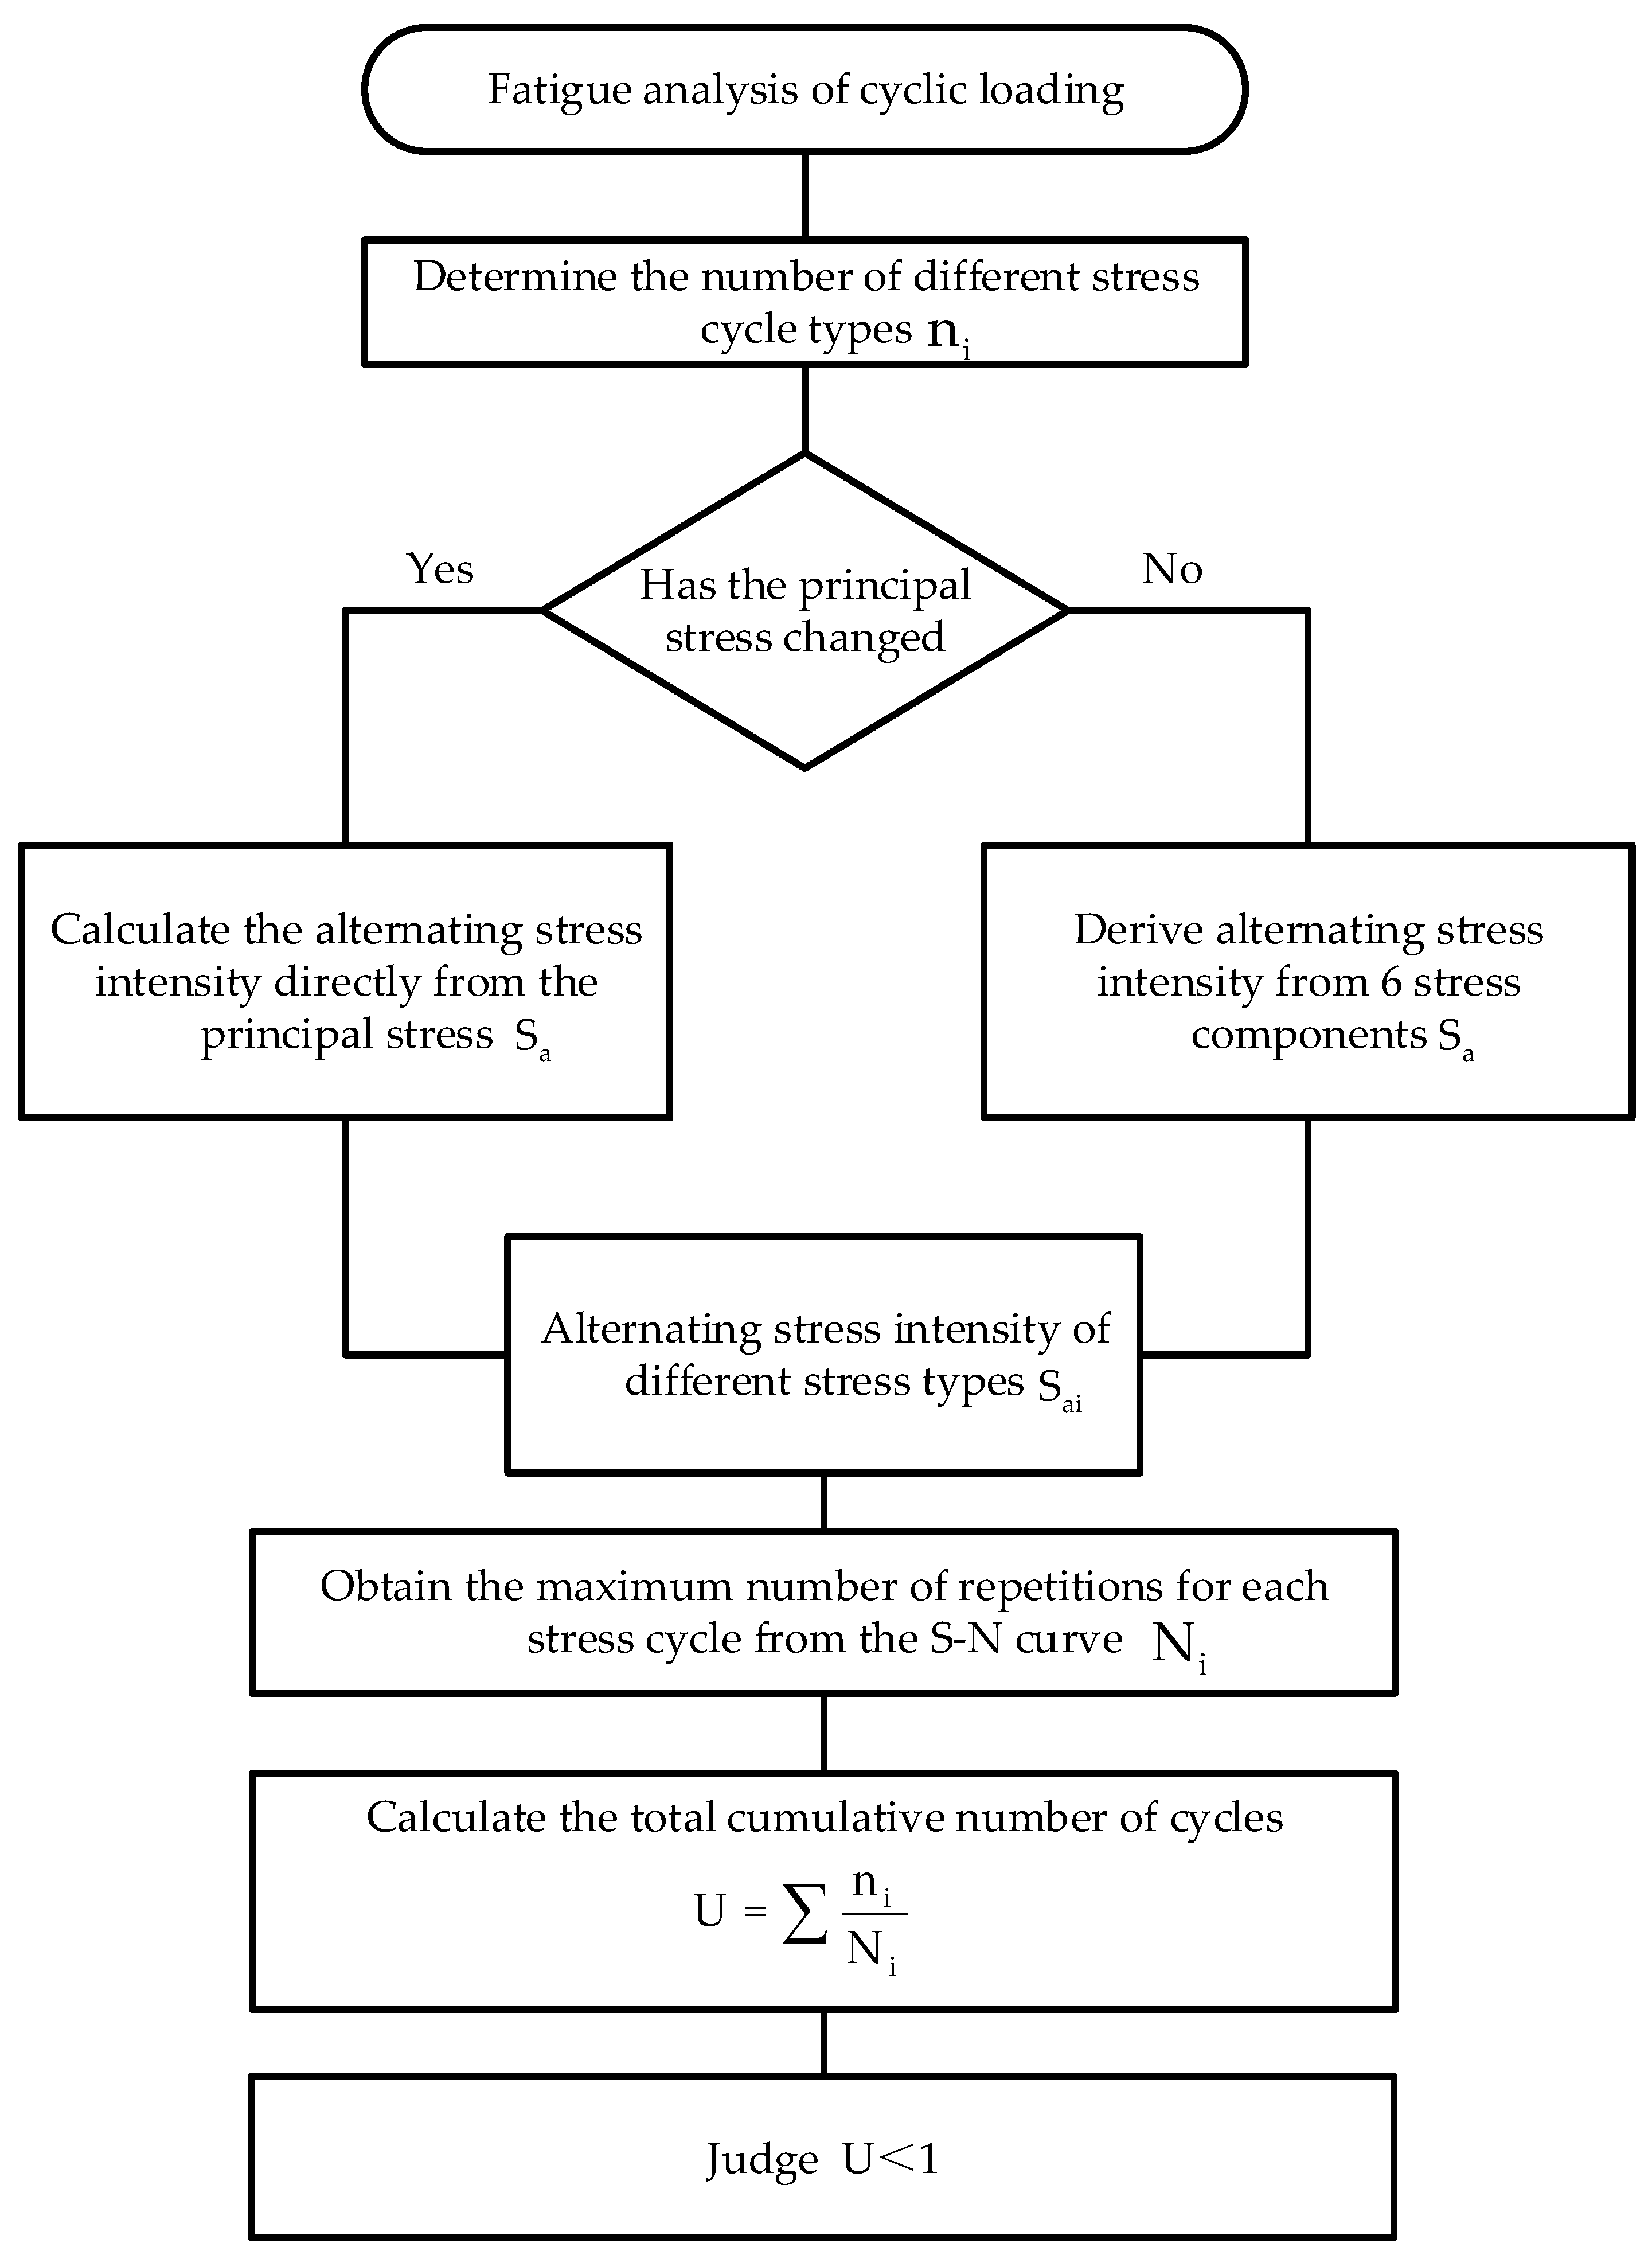
The ASME Boiler and Pressure Vessel Standard is a comprehensive technical specification for boilers and pressure vessels jointly issued by the American Society of Mechanical Engineers (ASME) and the American National Standards Institute (ANSI). It is the earliest and most authoritative boiler and pressure vessel standard in the world. Among other things, it requires the use of alternating stress intensity for fatigue analysis. As shown in
Figure 3, the main methods to obtain RPV structural stresses are theoretical analysis, experimental verification, and numerical calculation.
Theoretical analysis methods are often impractical due to the complexity of actual structures, and the structure must be simplified, requiring analysts to have a deep understanding of mechanical theory and mathematical solving skills to complete them. The experimental verification method has more advantages and persuasiveness, but it has high time and economic costs. At the same time, the representative demonstration of component experimental design is more complex, so it is not suitable for widespread application in the structural design process. The most effective, widespread, and economical method in engineering is numerical calculation, usually using sophisticated finite element analysis methods. Ma [
33] and Liu [
34] used the finite element method for a fatigue analysis of RPVs in marine environments. By simulating the stress state of the structure under various operating conditions using finite element analysis; accurately or conservatively calculating its temperature, deformation, and stress; and evaluating the various performance indicators of the reactor pressure vessel structure, the design cycle is greatly shortened, and research and development costs are reduced.
The specific steps are as follows:
Create a finite element model. Subdivide the mesh, discretize the mathematical model into a finite number of elements, and discretize the load and support and apply them to the finite element mesh. The finer the grid subdivision, the smaller the error in the analysis results, but the more elements there are, the less time it takes to solve. It is therefore necessary to design the optimum mesh density in terms of both accuracy and time.
Solve the finite element model. Apply the finite element algorithm to calculate the required stress and strain.
Analyze the results. Establishing mathematical models during finite element analysis can result in modeling errors, creating finite element models can result in discrete errors, and solving processes can result in numerical errors. Taking into account these three types of errors, objectively analyze the calculation results.
Combining the stress results under various working conditions in accordance with ASME specifications, complete the fatigue analysis of key parts of RPV according to the fatigue analysis process.
According to the provisions outlined in ASME BPVC—III, Division 1, NB, the specific fatigue analysis process is delineated in
Figure 4 for instances wherein two or more stress cycles result in effective stress fluctuations.
When the direction of principal stress remains unchanged, for the entire stress cycle, considering the three principal stress pairs at this point and their respective values over time, while also taking into account the overall and local structural discontinuities represented by , , and , respectively, determine the stress differences , , and over time, and determine the absolute value of the extreme value of each stress difference fluctuation range. , where the alternating stress intensity, , is the maximum value in .
When the direction of principal stresses changes, investigate the various values of the six stress components over time throughout the entire stress cycle. Choose a time point that corresponds to one of the extreme states of the cycle (either the algebraic maximum or minimum). At each time point during the cycle, subtract each of the six stress components from their respective counterparts to derive new stress components. Subsequently, at each time point, determine the principal stress based on the newly obtained six stress components. Finally, calculate the stress difference using the principal stress to obtain the maximum absolute value of any stress difference at any given time. The alternating stress intensity is half of this value.
This method is based on the time-domain method and requires the acquisition of time-history data of stress intensity during the operation of pressure vessels. Whether it is the ASME specification in the United States, the RCC-M specification in France, the JIS specification in Japan, etc., their fatigue analysis clearly requires that fatigue caused by transient loads be evaluated when performing a stress assessment. The methods and ideas used are consistent with the requirements in the ASME, and it is necessary to obtain the structural stress under different transient loads, but the combination in specific service condition analysis varies. Irregular wave action can cause stress cycles of different magnitudes in structures, making data statistics more complex. Using ASME methods to calculate fatigue under wave loading is not ideal for engineering applications.
4. Fatigue Damage Combination Analysis Method
Compared with conventional onshore nuclear power plants, pressurized equipment in floating nuclear power plants is not only subjected to low-frequency, high-stress internal pressure–heat loads, but also to high-frequency, low-stress wave loads. When high-frequency and low-amplitude loads are superimposed on low-frequency and high-amplitude loads, it usually promotes the cumulative damage of the material and accelerates its fatigue failure to a large extent, which is known as combined high and low cycle fatigue (CCF). Their fatigue damage analysis cannot only focus on fatigue damage under one load as in onshore nuclear power plants, but must also consider the influence between high and low cycle loads. The common method of simply adding the fatigue damage values under two environments cannot accurately give the total fatigue damage value. Yan [
35] conducted fatigue tests on turbine blades under CCF loads and found that the combination of high cycle loads and low cycle loads significantly reduced the fatigue life of turbine blades. The fatigue life of alloys under composite loads at high temperatures showed greater dispersion. Zhao [
36] et al. studied the effect of high and low cycle loading on the fatigue performance of TC11 titanium alloy, and the results show that CCF loading significantly reduced the fatigue life of TC11 titanium alloy.
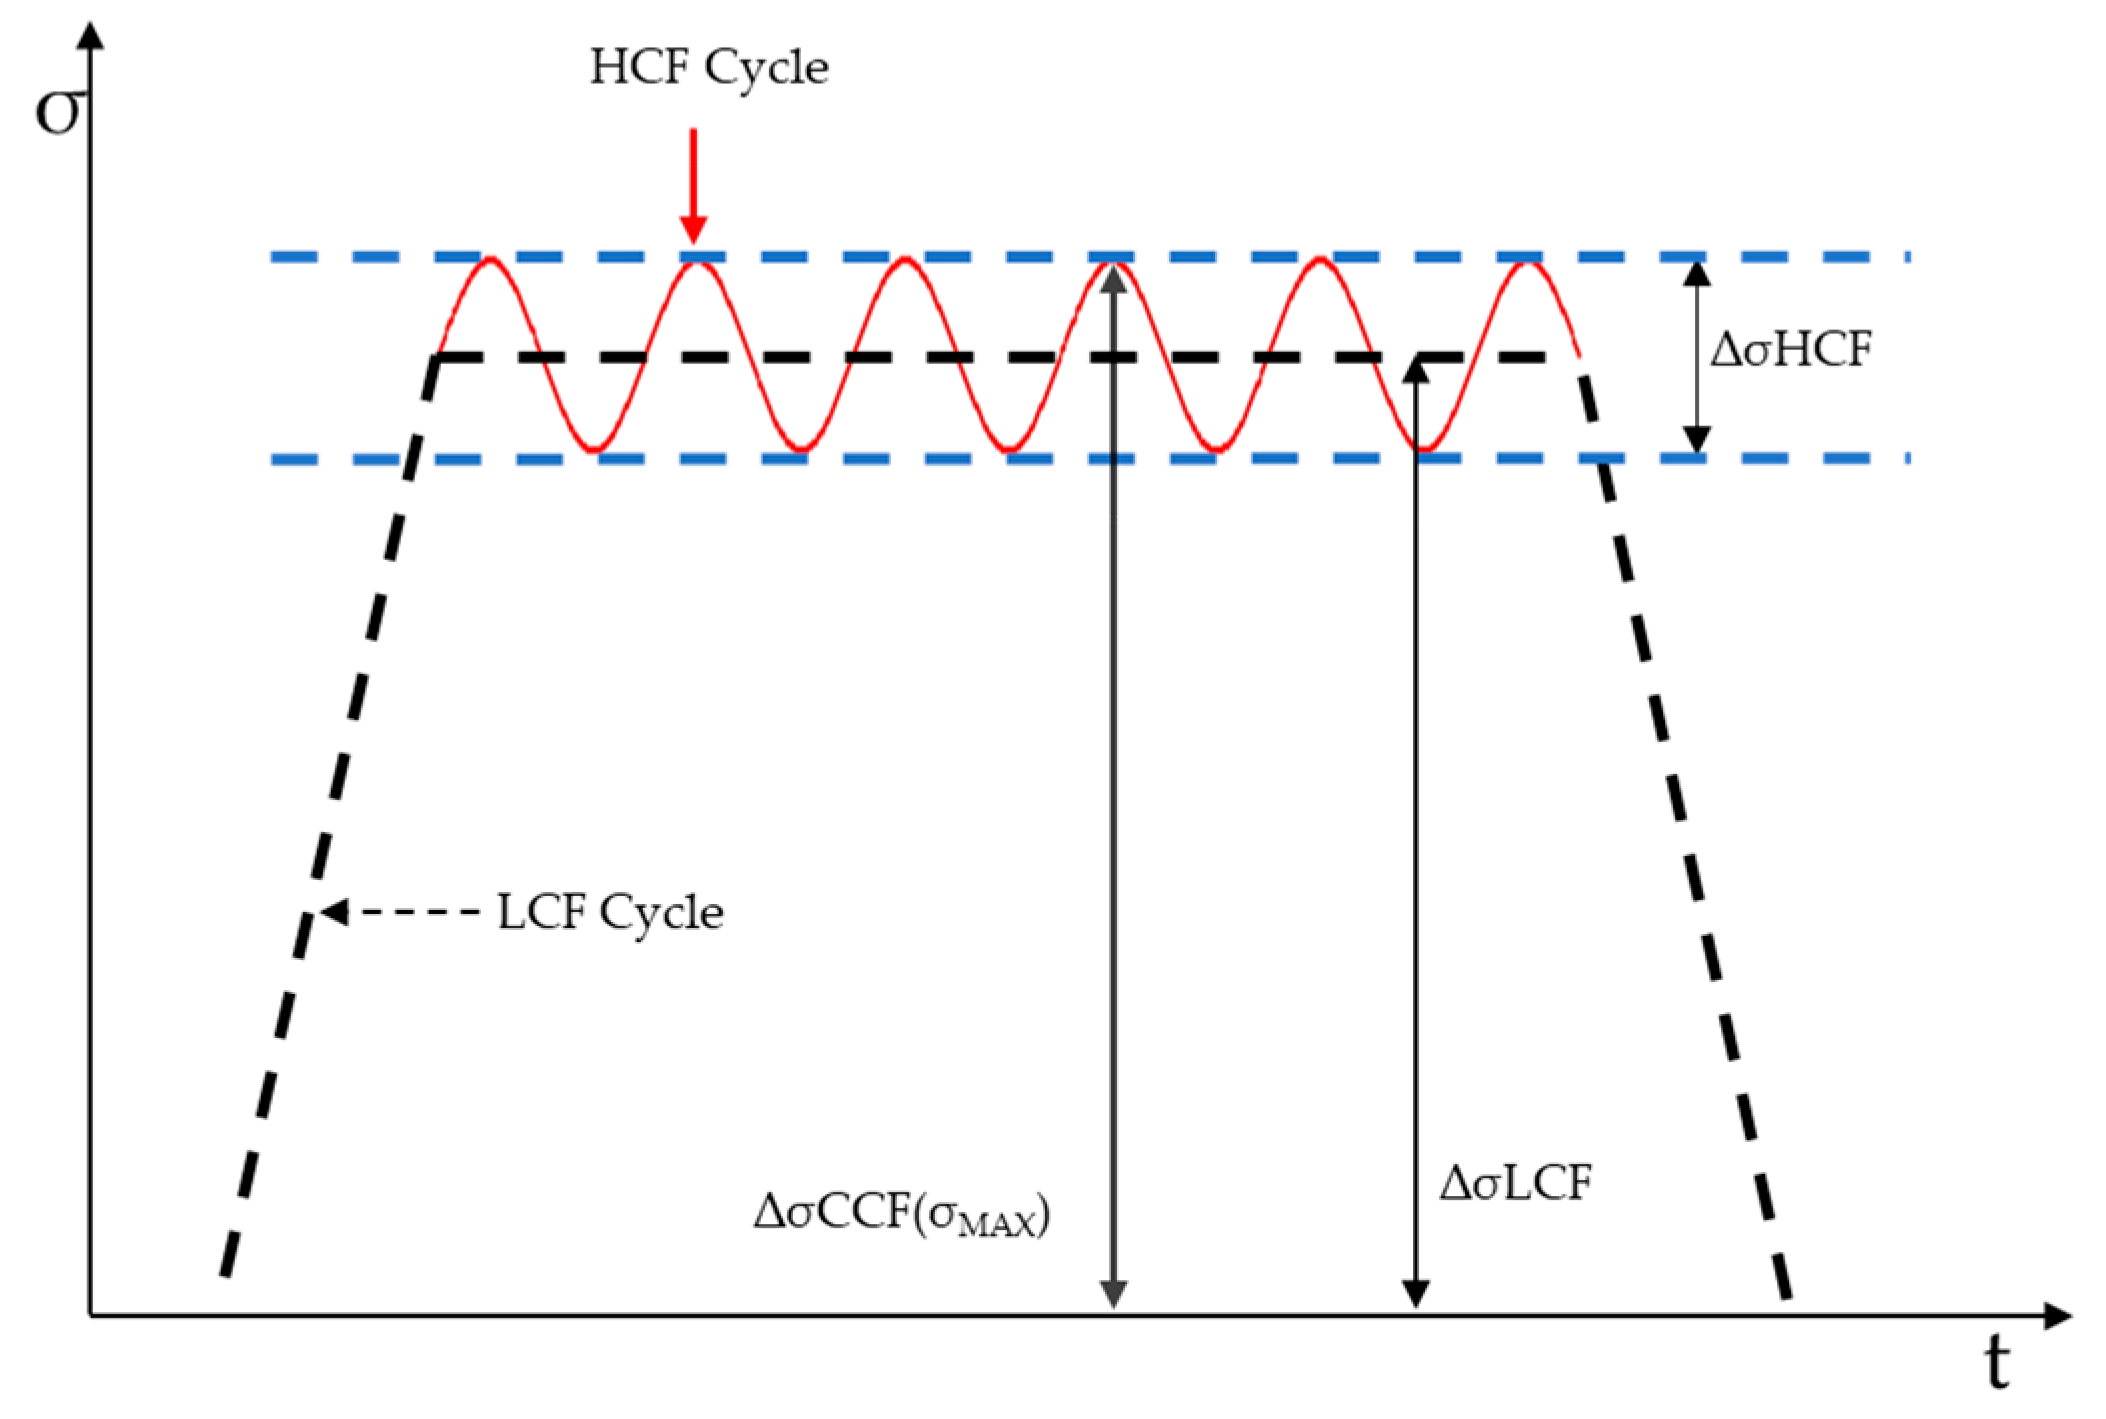
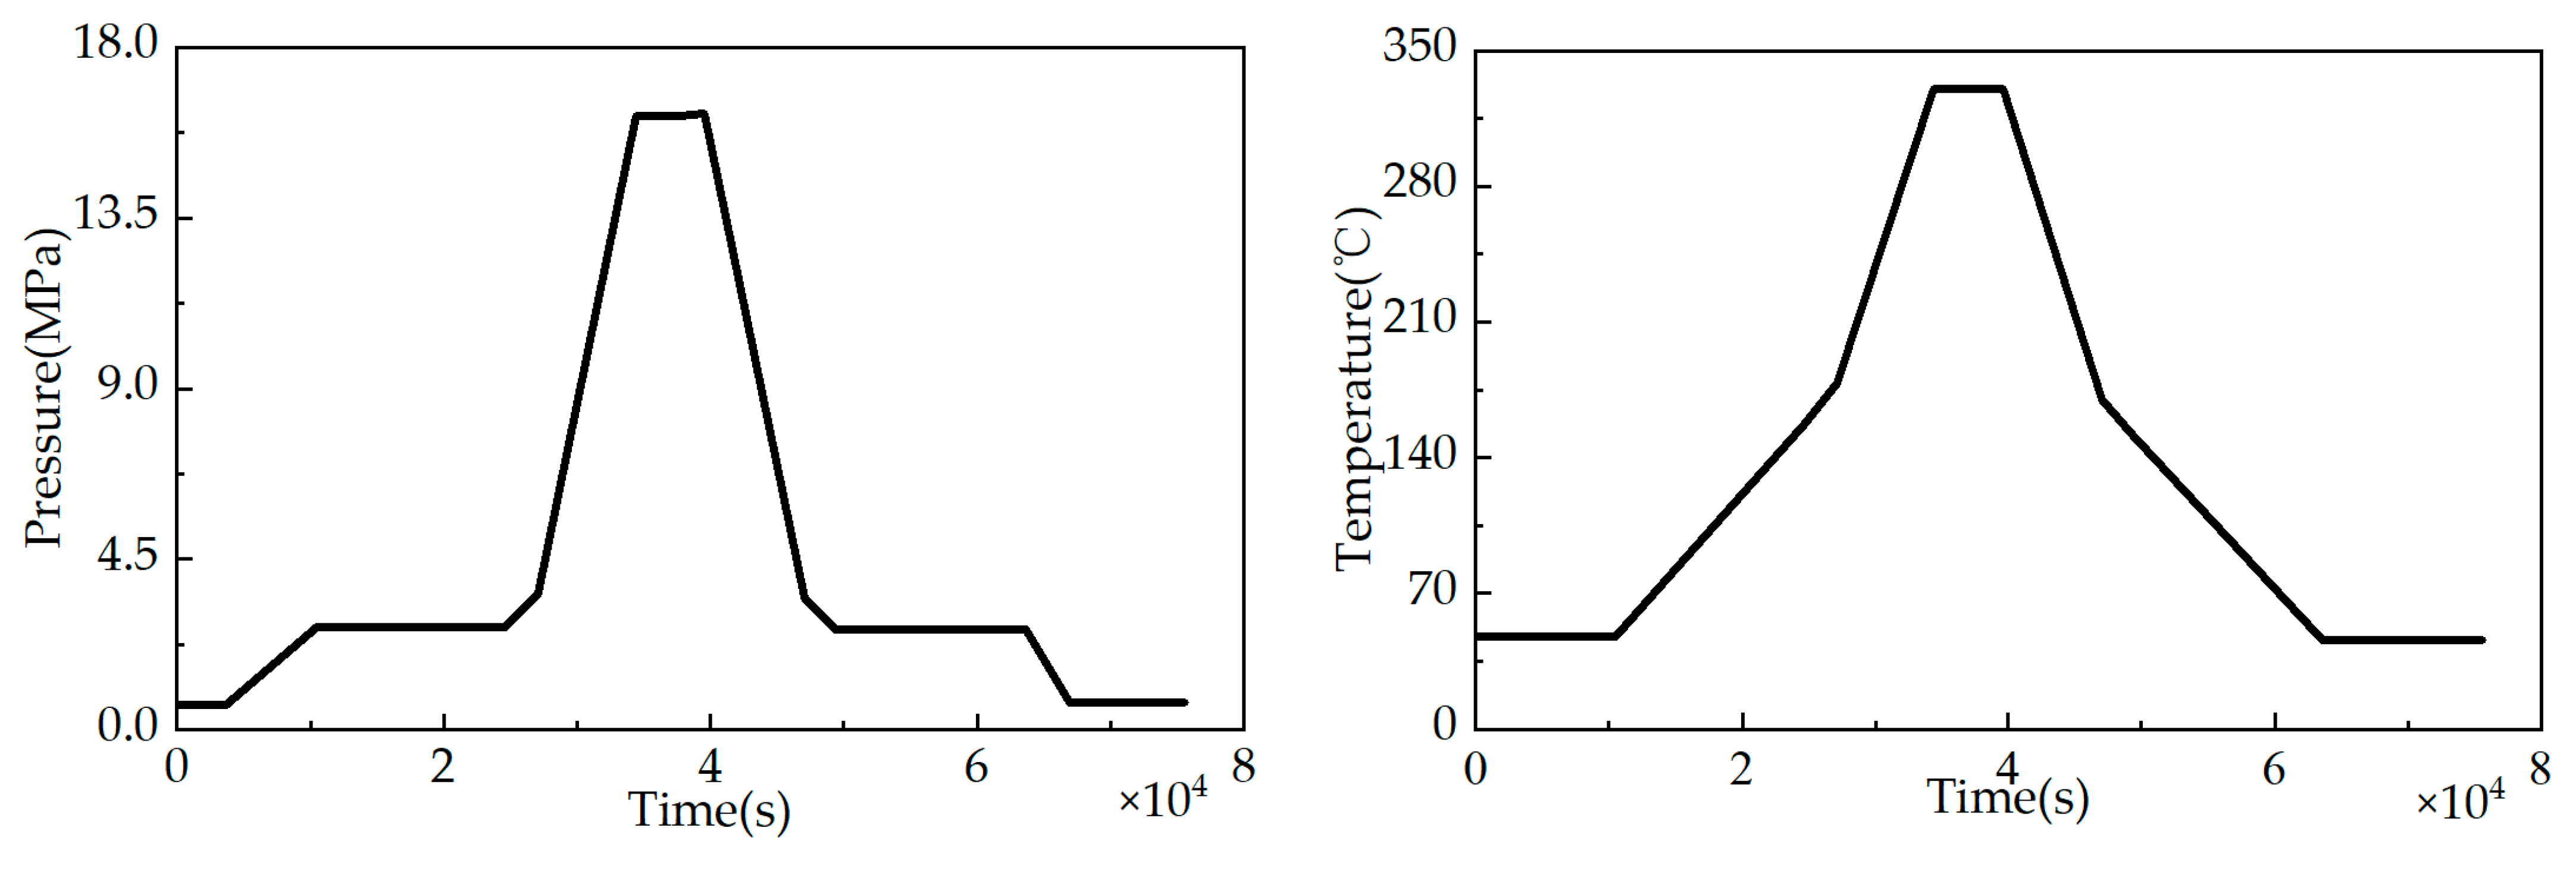
To illustrate the variation in alternating stress intensity, the startup and shutdown process during the operation of a floating nuclear power plant is examined. As shown in
Figure 5, the wave load cycle is considered as HCF (high cycle fatigue), and the thermal pressure load cycle is considered as LCF (low cycle fatigue).
The formula for calculating cumulative damage under joint loads using the Miner’s rule is
where n
i and N
i represent the number of cyclic loading cycles and the corresponding fatigue life at stress level σ
i, respectively.
For the CCF process, the cumulative damage during one loading is
where N
HCF and N
LCF are the fatigue life for HCF and LCF, respectively.
Under the operating environment of pressure equipment, Equation (20) can be rewritten as
where
represents the fatigue damage caused by thermal pressure load during a single start-up and shutdown, and
represents the fatigue damage caused by wave load during a single start-up and shutdown. This equation simply adds the fatigue damage values directly.
In the study by Hashin and Rotem [
37], they proposed new equations to express fatigue damage under two-stage loading based on the concept of damage curves for fatigue life analysis with constant and continuously varying cyclic amplitude segments:
where N
e is the number of cycles corresponding to the fatigue limit.
By transforming Equation (23), we can obtain the following:
By analyzing the exponential part of Equation (24), the following equations can be obtained:
Equation (23) can be further expressed as follows:
According to the equivalent damage theory, the damage caused by LCF loading is equivalent to the cumulative damage deduced by HCF loading. As shown in
Figure 6, according to the equivalent damage theory, the damage of LCF at point A is equivalent to the damage at point B in the CCF damage curve with a stress level of σCCF, where the equivalent number of loading cycles with a stress level of σCCF is m’’CCF; similarly, the damage of HCF at point C is equivalent to the damage at point B in the CCF damage curve with a stress level of σCCF.
Therefore, the relationship between
and
can be obtained as follows:
In the S-N curve of materials, there is a relationship between stress cycle S and fatigue life N, expressed as follows:
where K and m are the fatigue parameters.
Thus, by transforming Equation (29), the following equation can be obtained:
Since K and m are constants related to materials, logN is inversely proportional to logS. By combining Equations (28) and (30), the following formula can be obtained:
where ΔσLCF is the LCF stress range, and ΔσHCF is the HCF stress range.
Thus, by combining Equation (31) with Miner’s rule, the nonlinear cumulative damage model for CCF is proposed as follows:
In Liu and Wang’s study [
28], they considered the interaction between loads and derived a new nonlinear formula for calculating cumulative fatigue damage during combined loading process based on Equation (32):
They used
to represent the effect of load interaction on cumulative damage and experimentally demonstrated that the calculation results of Equation (33) are more refined. In the working environment of RPV, Equation (33) can be expressed as follows:
In RPV, ΔσLCF is the maximum value of alternating stress intensity under a hot pressure environment, and ΔσHCF is an irregular wave load with multiple peaks.
For a signal with a unit bandwidth, the power spectrum is the square of the root mean square amplitude spectrum. The power spectrum can be seen as the integral of the power spectral density in a certain frequency range, and the data of the root mean square amplitude spectrum can be obtained from the power spectral density function.
where
is the amplitude spectrum,
is the power spectral density function, and f
1 and f
2 are the starting and ending frequencies of the power spectral density function.
The process of wave action is often regarded as a zero mean Gaussian random process; therefore,
is numerically equal to the zero-order spectral moment
of the power spectral density function. Equation (34) above can be transformed into
Consider the root mean square amplitude ΔσHCF as input into Equation (34), which is changed to
where
is the accumulated fatigue damage caused by thermal compression during a start–stop process, and
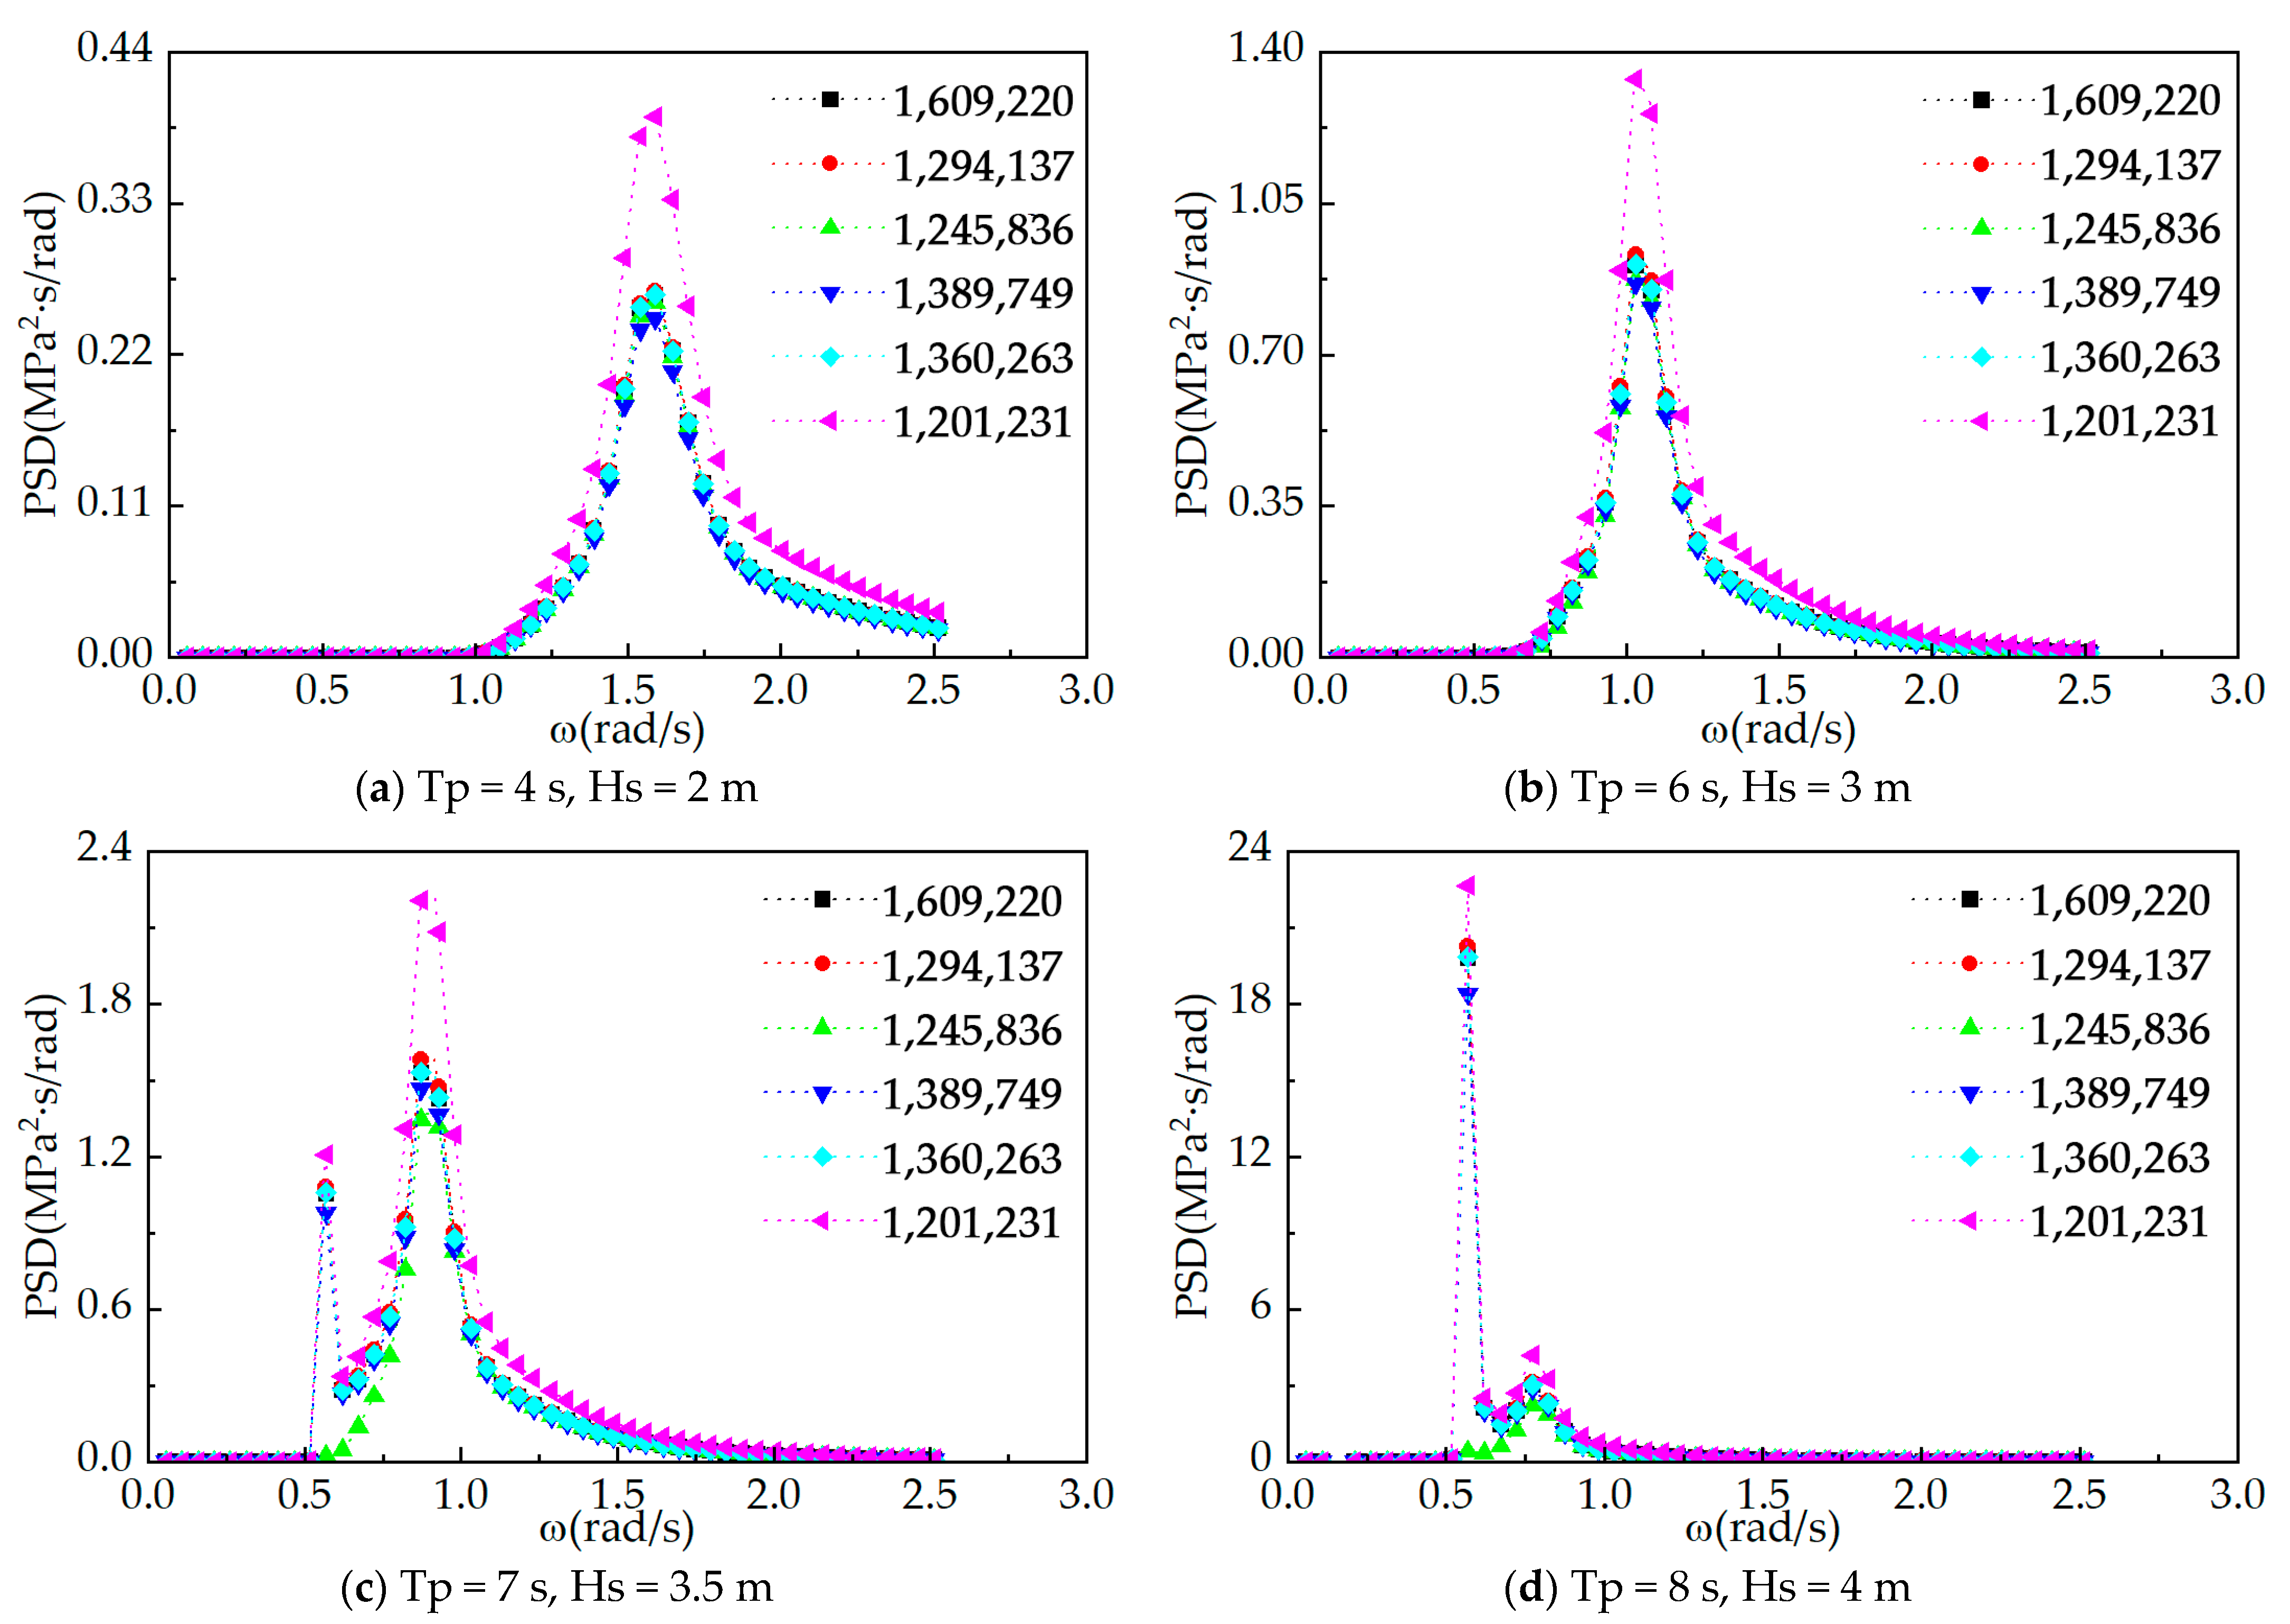
is calculated using a spectral analysis to determine the fatigue damage values under different sea conditions.
In this way, when calculating the total fatigue damage, the fatigue damage and thermal pressure damage under each sea state are calculated individually, they are combined using the new method, and then the probability of occurrence of each sea state is considered. Finally, the total fatigue damage can be obtained by summing up the damage values of all combinations.
