Article

Quantitative Assessment of Oysters’ Multiple Nitrogen Removal Pathways in a Subtropical Bay

1
Earth, Ocean and Atmospheric Sciences Thrust, Function Hub, The Hong Kong University of Science and Technology (Guangzhou), Guangzhou 511458, China
2
Center for Ocean Research in Hong Kong and Macau, The Hong Kong University of Science and Technology, Hong Kong 999077, China
3
School of Marine Sciences, Sun Yat-sen University, Guangzhou 510275, China
4
Pearl River Estuary Marine Ecosystem Research Station, Ministry of Education, Zhuhai 519082, China
*
Author to whom correspondence should be addressed.
J. Mar. Sci. Eng. 2025, 13(1), 21; https://doi.org/10.3390/jmse13010021
Submission received: 6 December 2024 / Revised: 21 December 2024 / Accepted: 26 December 2024 / Published: 27 December 2024
(This article belongs to the Section Marine Aquaculture)

Abstract

:
Oyster aquaculture helps mitigate coastal eutrophication by assimilating organic nitrogen for biomass and by denitrification in both the oyster digestive tract and sediment below. Efforts are needed in the quantitative assessment of oysters’ multiple nitrogen removal pathways at large-scale aquaculture sites, especially removal in oyster bodies, which has been much less quantified among these pathways. This study takes a subtropical estuary (Shenzhen Bay in South China) as a testbed to conduct laboratory rearing experiments and field investigation. The laboratory results show that an oyster individual of harvest size can remove 0.59 mg-N day−1 through denitrification within the body, which can be proportionally extrapolated to 4.6 kg-N km−2 day−1 in Shenzhen Bay. Assimilating field measurements into a “flux inventory model” yields the oyster-induced total nitrogen removal of Shenzhen Bay as 33.3 kg-N km−2 day−1, in which biomass harvest, denitrification in oysters, and sediment contributed 26%, 14%, and 60%, respectively. Additionally, the oyster’s filter-feeding lifestyle exports nitrogen from the water column to the sediment, which can contribute to ~3% of the daily nitrogen input into the bay. This study confirms the potential of oyster nitrogen removal, especially within the body, and provides a working framework for quantitative assessment of coastal nitrogen removal by the growing scale floating oyster aquaculture.

1. Introduction

Ongoing coastal eutrophication caused by excess nitrogen (N) loading from upstream airsheds and watersheds has become one of the most serious threats to the global coastal ecosystem in the 21st century [1,2]. Thereinto, species of dissolved inorganic nitrogen (DIN), including ionic nitrate (NO3), nitrite (NO2), and ammonium (NH4+), contribute over 50% of the total fixed N loading in the global euphotic zone [3]. In addition, excess organic nitrogen (ON) loading and emission of gaseous nitrous oxide (N2O), as negative consequences of coastal eutrophication, are posing future challenges [4]. Management strategies are urgently needed to control excess N loading by either reducing N inputs or promoting N removal [5,6].
As one of the most important aquaculture industries in the coastal region, the production of oyster aquaculture has been rapidly increasing hundreds of times on a global scale in recent decades [7], contributing 6.0 million tons with a value of $7.5 billion annually [8]. Beyond oysters’ important role in global food security, increasing the oyster population through aquaculture or restoring oyster reefs is also one important N removal strategy [9]. Based on the oyster’s filter-feeding lifestyle by which no artificial feed is needed in the oyster’s growth [10], the impact of oyster aquaculture on estuarine N removal is threefold (Figure 1), namely biomass harvest (pathway 1), denitrification by the microbiome in the oyster’s body (pathway 2), and induced sedimentary denitrification below the oyster (pathway 3). Among them, pathway 1 removes ON by oyster biomass assimilation, which can be deduced by multiplying the mass content of N in the oyster body with the annual oyster yield [11,12,13]. Pathways 2 and 3 remove the biologically available NOx (NO3 and NO2) by converting them into dinitrogen gas (N2) through the denitrification process [14,15]. Therefore, pathway 2 relies on a diverse and high abundance of denitrifiers and the micro-anoxic environment inside the digestive tract, as well as the oyster’s shell biofilm [14,16,17]. Pathway 3 relies on denitrifiers and labile organic matter deposited to the underlying sediment via the export of unassimilated ON in pseudofeces and feces from live oysters [18,19,20]. Meanwhile, these nitrogenous biodeposits can be remineralized to NH4+ [21], which, together with the oyster-excreted NH4+, can indirectly promote N removal via a coupled nitrification–denitrification process [22]. Such oyster-induced N removal through denitrification can be substantial, as suggested by in situ flux chamber measurements that reported significantly higher N2 efflux from the growing oyster reef than the nearby bare sediment [23,24].
Quantifying the importance of oysters’ multiple N removal pathways is critical to assessing their potential in mitigating coastal eutrophication, yet such assessment remains limited and uncertain. For example, the widely used N2 efflux measurements have uncertainties in distinguishing the N removal via pathway 2 (denitrification in the oyster body) and pathway 3 (oyster-induced sedimentary denitrification). The assessment is also complicated by the complexity of the sedimentary environment [25]. For instance, since oxygen is a regulating factor of the coupled nitrification–denitrification process (CND), oyster reef tends to be a DIN sink in the oxidized surficial sediments but can release DIN above the relatively reducing sediments [20]. In certain cases, N removal is higher when oysters are cultivated closer to the sediment [26] or on siltier sediments than sandier sediments [27], likely because oyster-induced sedimentary denitrification (pathway 3) is stronger when oysters are accessing higher levels of nutrients and abundant denitrifying assemblage.
Moreover, N removal potential via large-scale floating oyster aquaculture remains unconstrained, and the relevant research is unevenly distributed geographically. A recent review shows that studies on oyster-induced N removal were mostly conducted in temperate areas (>94%), mainly in North America (61%), and the majority of them focused on oyster reefs [25]. There is a growing scale of floating oyster aquaculture worldwide, particularly along the coastlines of China [28]. As the world’s largest oyster producer, China contributed a 6.2-megaton yield in 2022 [29], equivalent to 83.3% of global production [30]. However, the research on the N removal potential of such large-scale floating oyster farming in China is limited, especially in (sub)tropical areas. A particular example is Shenzhen Bay (SZB, 113°55′58″–114°5′13″ E, 22°26′23″–22°30′46″ N) in South China, a shallow (averaged water depth of 2.9 m), semi-enclosed water body (90.8 km2) where oyster aquaculture has been an important industry since the 18th century [31,32]. The SZB lies on the eastern side of the Pearl River Estuary (PRE), surrounded by two megacities, Shenzhen (SZ) and Hong Kong SAR (HK). The Shenzhen River and three other small streams discharging from the eastern end into the bay are major nutrient sources that cause eutrophication at SZB [33]. The jurisdictional boundary between the two cities divides the SZB into the SZ side and the HK side. The HK side of the bay has floating oyster rafts spanning tens of km2, while the SZ side has no oyster aquaculture, making the SZB an ideal testbed to study the effect of large-scale oyster aquaculture on N removal. However, no sampling scheme has directly compared oyster and non-oyster water bodies, although there has been continuous monthly monitoring of water quality (including N species) by the Environmental Protection Department of Hong Kong SAR within the HK side since 1986 [34].
To fill the gaps in assessing the contributions of multiple pathways to N removal by large-scale floating oyster aquaculture in subtropical estuaries of China, the SZB is studied for field surveys across the SZ side (without oyster aquaculture) and HK side (with oyster aquaculture), which was complemented by laboratory oyster rearing experiments. First, NOx removal by denitrification in the oyster body (pathway 2) is quantified individually at the lab scale and extrapolated to the bay scale. Second, the difference in NOx inventory between the SZ and HK sides captured by the field survey is used to quantify NOx removal by oyster-induced denitrification (pathways 2 + 3). Third, the N removal masses of three pathways in SZB are distinguished and compared by combining the above two estimates and the ON removal via the harvested oyster biomass (pathway 1). Such a framework can infer the potential of N removal by large-scale oyster aquaculture.

2. Materials and Methods

2.1. Laboratory Oyster Rearing and Lab-to-Bay Extrapolation

The NO3 and NO2 (NOx) removal by denitrification in oyster body (pathway 2) was individually and directly assessed by laboratory rearing experiments. In this lab-scale experiment, oysters in harvest size of Shenzhen Bay were utilized and were reared in artificial ON-free seawater to rule out the denitrification in regions other than oyster’s body. All physicochemical parameter settings below were representative of the average seawater conditions of SZB during 220-day oyster aquaculture season from June 2023 to January 2024 [34]. Four customized cylindrical plexiglass incubators with 28 cm of inner diameter and height and a total volume of 17.2 L were filled with artificial seawater prepared with N-free sea salt (Taoge Technology Co., Beijing, China). Ion concentrations were as follows (g L−1): Na+ 6.17, Mg2+ 0.74, Ca2+ 0.23, K+ 0.23, Cl 11.09, SO42− 1.54, HCO3 0.08, and Br 0.04. The initial NO2, NO3, and NH4+ concentrations were set by mixing the tap water with ultrapure water to 0.5, 50, and 5 μM, respectively. The configured artificial seawater was aerated for 12 h before the rearing experiment. Commercially available oysters (Crassostrea hongkongensis), having a shell height of 9.6 ± 0.5 cm and weight of 80.1 ± 13.2 g, were reared in four densities (amounts per incubator), including 0 (four-halves of oyster shell), 1, 2 and 4, to mimic the range of actual rearing density inside the SZB oyster-rearing rafts.
In each incubator, the salinity and pH during laboratory rearing were controlled at 20 ppt and 7–8, respectively, which are physiologically optimal for C. hongkongensis [35]. Water temperature was maintained at 26.0 ± 0.5 °C by automatic temperature heating rod (Zhenhua Electrical Appliance Co., Zhongshan, Guangdong, China). Dissolved oxygen concentration was maintained at 6.2 ± 0.1 mg L−1 (~86% saturation) by continuous aeration and monitored in real time (SJG-209, INESA Scientific Instrument Co., Shanghai, China). Water mixing in the incubator was realized by a circulation rate of 0.2 L per minute using a centrifugal pump (ZP600, LRFluid Co., Shanghai, China) connecting the upper and lower sides of the incubator. Incubators were placed in the dark to minimize light-sensitive autotrophic processes. Since the initiation of the rearing experiment, water was sampled into three replications (n = 3, 10 mL each) from the outlet of each incubator every 2 h and was immediately filtered through 0.45 μm mixed cellulose esters membrane (MCE syringe filter, BKMAM Biotechnology Co., Changde, China) and stored at −20 °C for subsequent NOx analysis.
Since the decrease in NO2 and NO3 concentrations during oyster rearing directly represented denitrification by oyster body, laboratory results were then processed by proportional extrapolation to estimate oyster-induced NOx removal mass in SZB per day (MP2) as the product of lab-scale NOx removal (ΔMlab) and a scaling factor (ASZB/Alab):
MP2 = ΔMlab × (ASZB/Alab)
ΔMlab was calculated by daily NO2 and NO3 variation (ΔClab, see Table S1) by multiplying the incubator volume (Vlab = 17.2 L). ASZB represented the number of oyster individuals in SZB, which was the product of the number of harvested oysters underneath each raft (18,000), the number of rafts on HK side of SZB (7200, estimated from the satellite map), and the survival rate of oysters in SZB (52.5%, calculated by Lee et al. [36]). Alab represented the number of oysters in each laboratory incubator (1, 2, and 4). In addition, the NOx removal by the whole oyster could be distinguished into the removal on the shell and removal inside digestive tract. The NOx concentration variation in 0-density group, which only had four halves of oyster shell, was used to calculate the NOx removal through two oyster shells. Such shell-induced impact can then be proportionally subtracted from other density groups, where whole oysters were reared, to obtain the NOx removal inside the digestive tract alone.

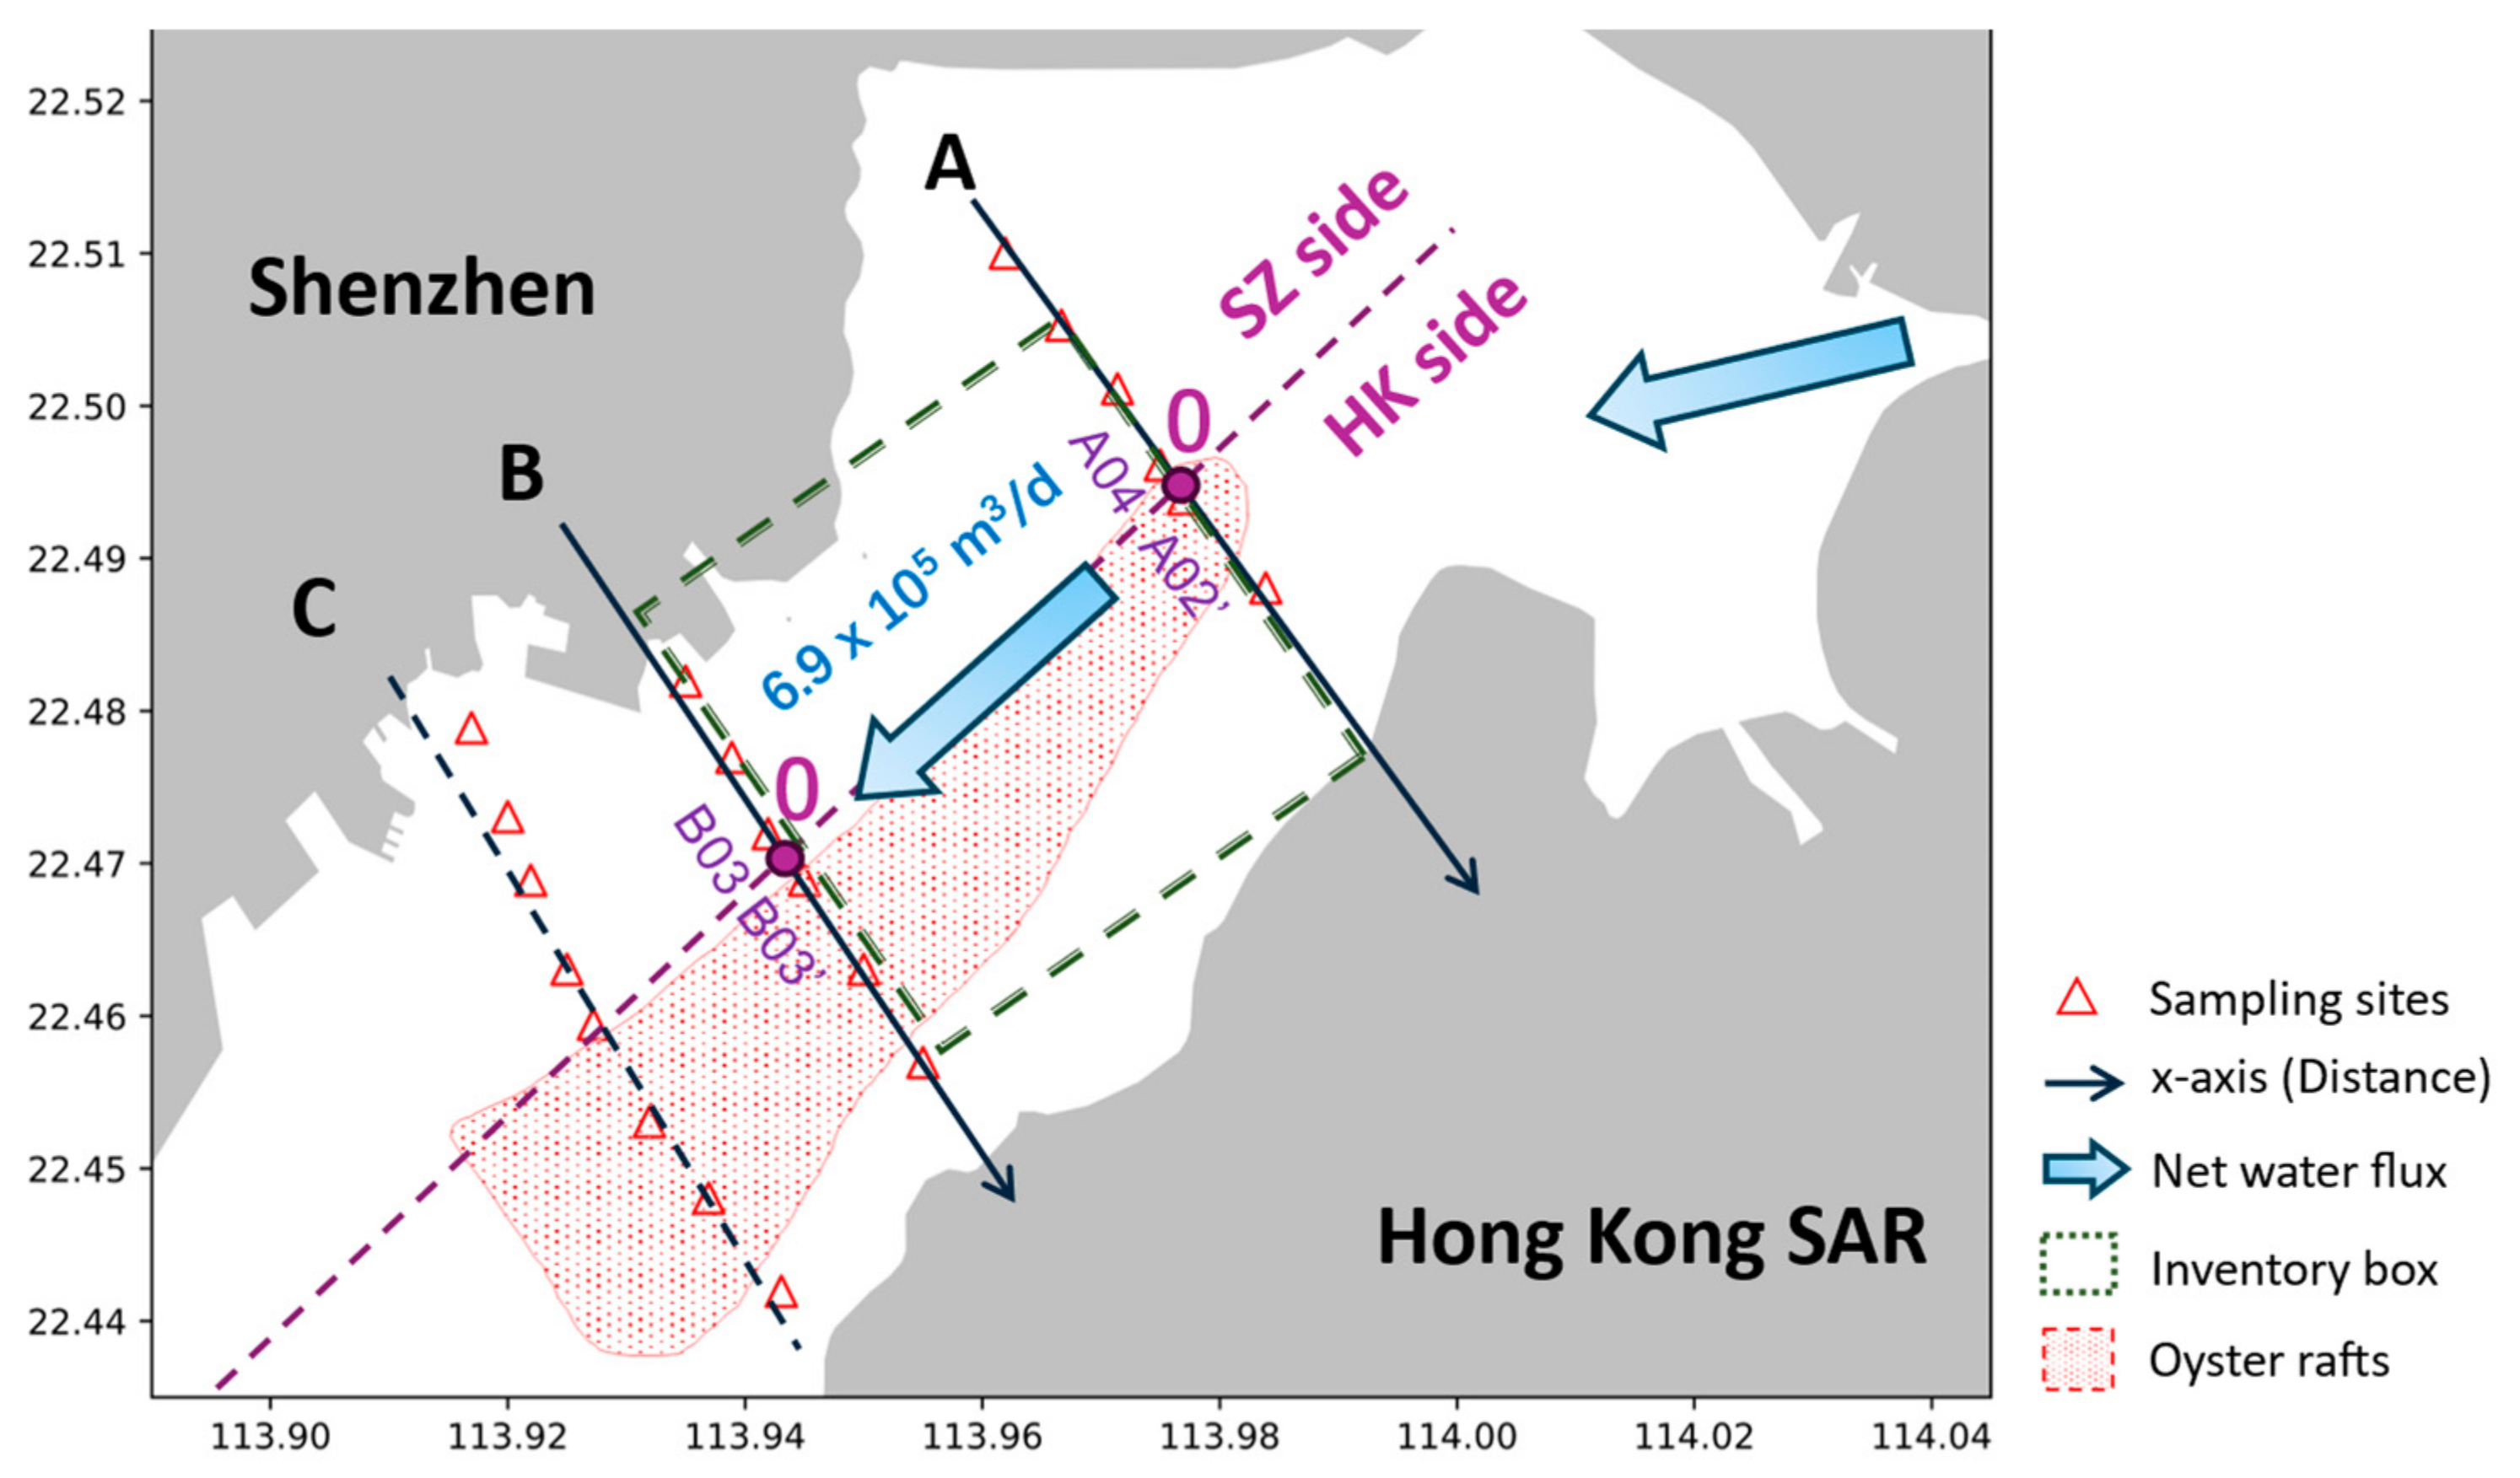
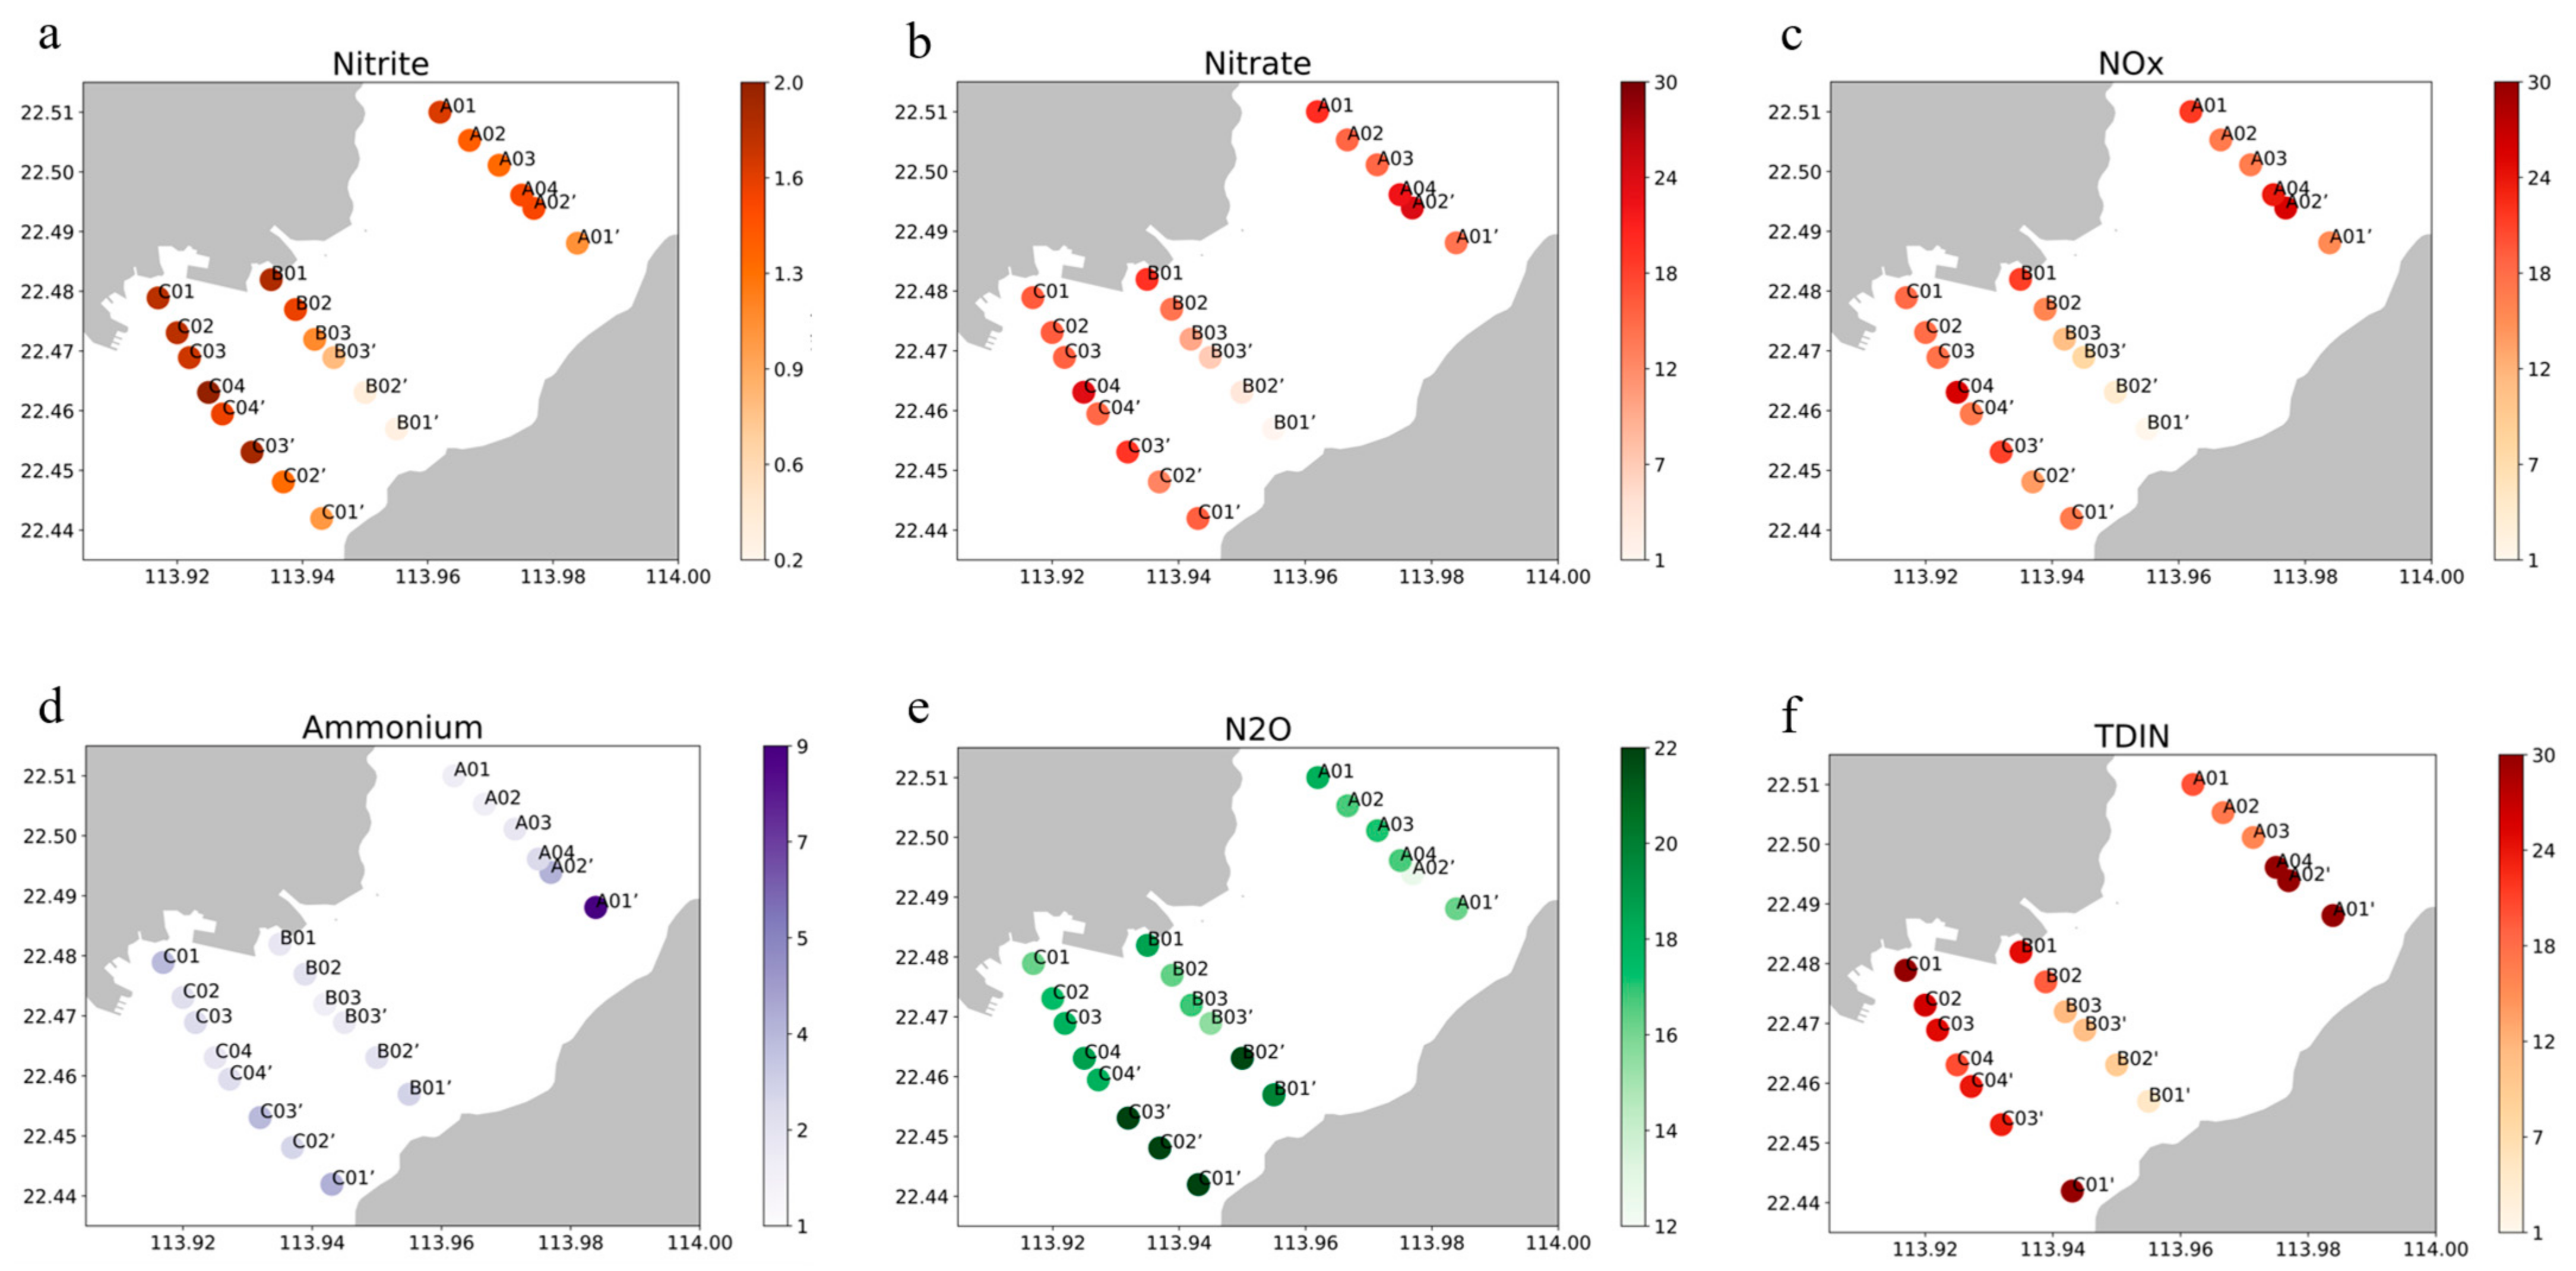
2.2. Shenzhen Bay Field Sampling and Analyses

The total oyster-induced NOx removal by denitrification in both oyster’s body and sediment below (pathways 2 + 3) in SZB was combined and assessed by field sampling on 8, 9, and 10 January 2024. The sampling consisted of 20 sites along three transects perpendicular to the SZ-HK boundary (referred to as transects A, B, and C from inner to outer bay; see Figure 2a). The sites were divided into two groups in each transect: the SZ side (A01, A02…) and HK side (A01’, A02’…). On the HK side, oyster rafts extended from the near-coast sites A01’, B01’, and C01’ seaward to the sites A02’, B03’, and C04’ near the SZ-HK boundary. The sampling was conducted at the same hour as each field survey date, and the results were averaged over the three sampling dates to minimize diel or daily variations in physiochemical characteristics of water column.
Water depth, temperature, and salinity of each site (Table S2 and Figure 2b,c) were measured with a Pro Plus Multiparameter (YSI Inc., Yellow Springs, OH, USA). Surface water samples (at 30 cm depth) for DIN measurement were collected using 3 L cylindrical acrylic hydrophore (Leigu Instrument Co., Shanghai, China) and processed by the same filtration and storage method as previously described (see Section 2.1). Samples for dissolved N2O were collected in three 20 mL glass vials, overflowing three times the volume, and sealed bubble-free with rubber septa and aluminum rings, preserved by adding 100 μL of 10 M sodium hydroxide solution for later analysis.
Samples from both laboratory rearing and SZB field sampling for NO2, NO3, and NH4+ concentrations were analyzed by nutrient autoanalyzer (AA500, Seal Analytical, Mequon, WI, USA). The N2O concentration at SZB was measured by headspace equilibrium method [37], during which 10 mL of high-purity nitrogen headspace in each sample vial was introduced for at least 12 h to reach gas–water equilibrium, followed by analysis on automatic headspace sampler (HS-54P, Tatton Technology, Guangzhou, China) coupled with a gas chromatography–electron capture detector (M6, Asicotech Co., Shanghai, China).

2.3. Flux Inventory Model

To realize the quantification of the total oyster-induced NOx removal from NOx concentration measurements, the “flux inventory model” derived from previous conceptualization [38,39] was adopted. In this model, a conceptual 3D “water box” covering the oyster rafts between transects A to B (Figure 3) was set, and differences of NOx between two transects driven by net east-to-west water flow crossing the box from A to B were utilized to calculate the total oyster-induced NOx removal. A few assumptions were made below for model calculation, and the uncertainties will be discussed in Section 4. First, the difference in NOx inventories between HK and SZ sides along each transect was solely attributed to oyster-induced denitrification because oysters were cultivated on the HK side only. Second, the difference between SZ and HK sides along transect A differed from that of transect B, which was attributed to the cumulative removal by oysters from transects A to B along the major east-to-west water flow direction. Third, the NOx removal rates obtained from the inventories in the selected conceptual box can be representative of the whole SZB.
Given the above assumptions, the “flux inventory model” was applied by establishing the coordinate system in which NOx concentration varies with distance and integrating the optimal “Distance-Concentration” regression in each transect (details in Method S1). The daily NOx removal mass by pathways 2 + 3 in SZB (MP2+3) was the product of daily NOx concentration variation rate from A to B (Rbox) and water volume of SZB (VSZB, obtained by multiplying the mean water depth of all sampling sites, 3.009 m, and oyster aquaculture area of SZB, 8.77 km2, from Li et al. [40]):
MP2+3 = Rbox × VSZB
where Rbox was calculated by dividing the variation in SZ-HK NOx species difference from transects A to B (ΔCbox, calculated by data in Table 1) by the water residence time (τ) in the conceptual box between transects A to B (equivalent to the time duration of the water being affected by oysters):
Rbox = ΔCbox × 14/τ
The number “14” represents the relative atomic mass of N (g mol−1). “τ” was set to 10 days, which was estimated by applying mass-balance model to the long-time series monitoring of salinity (detail in Method S2). Based on the definition of ΔCbox, Equation (3) can be re-written as follows:
Rbox = [(CSZ-B − CHK-B) − (CSZ-A − CHK-A)] × 14/τ
After considering the “Distance-Concentration” integrals (Int) calculated at the step (3) of Method S1 (integrals in Table 2), Equation (4) can be re-written as follows:
Rbox = [(IntSZ-B − IntHK-B) − (IntSZ-A –IntHK-A)] × 14/(τ × L)
In this model, all data for calculation were the average of three-day replicates (8, 9, and 10 January 2024) at each sampling site (n = 3). All concentrations were in units of μM or mmol m−3, and integrals were in units of mol m−2.
To avoid the interaction of different species in integration, the fitting and integration processes were utilized for NO3 and NO2 species separately; they were then combined to obtain the result of NOx. We also acknowledge that the estimation of Rbox has some caveats that can be improved in future investigations. For instance, the net effects of biogeochemical cycling of NOx from transects A to B were considered the same at SZ and HK sides, which might be true given the short distance between transects A and B. Contribution of the horizontal transport along each transect to the difference between SZ and HK side was neglected. Tidal variations and external input were not taken into account.
According to the principles described in Introduction, the NOx removal by pathway 3, namely the oyster-induced sedimentary NOx removal mass (MP3), was the total oyster-induced removal (MP2+3) minus the removal by denitrification in oyster body (MP2).

2.4. Organic and Total N Removal Calculation in SZB

The removal of N through biomass harvest (MP1) can be determined by several parameters, including (1) the amount of annual oyster yield in SZB (ASZB, as described in Section 2.1); (2) the biomass accumulation of individual oyster, determined as 70 g by assuming an initial weight of ~1 g (which is the average weight of the spat of C. hongkongensis) and the harvested wet weight of ~71 g (estimated using “weight-length” equation [41] and an average shell length of commercial-size oyster of 90 mm [42]); (3) mean wet weight N content of oyster (0.35% was adopted following Cubillo et al. [10] and Labrie et al. [20]); and (4) annual duration of oyster aquaculture in SZB (220 days, according to field investigation). In this 220-day growing period, the dead oysters deposited to the sediment and the assimilated biomass before their deaths were not removed from the SZB water–sediment system; thus, the daily estimation of pathway 1 only considered the N in harvested biomass, which can be calculated as MP1 = ASZB × 70 g × 0.35%/220. The total oyster-induced N removal in SZB was then determined as the sum of MP1 and MP2+3.

3. Results

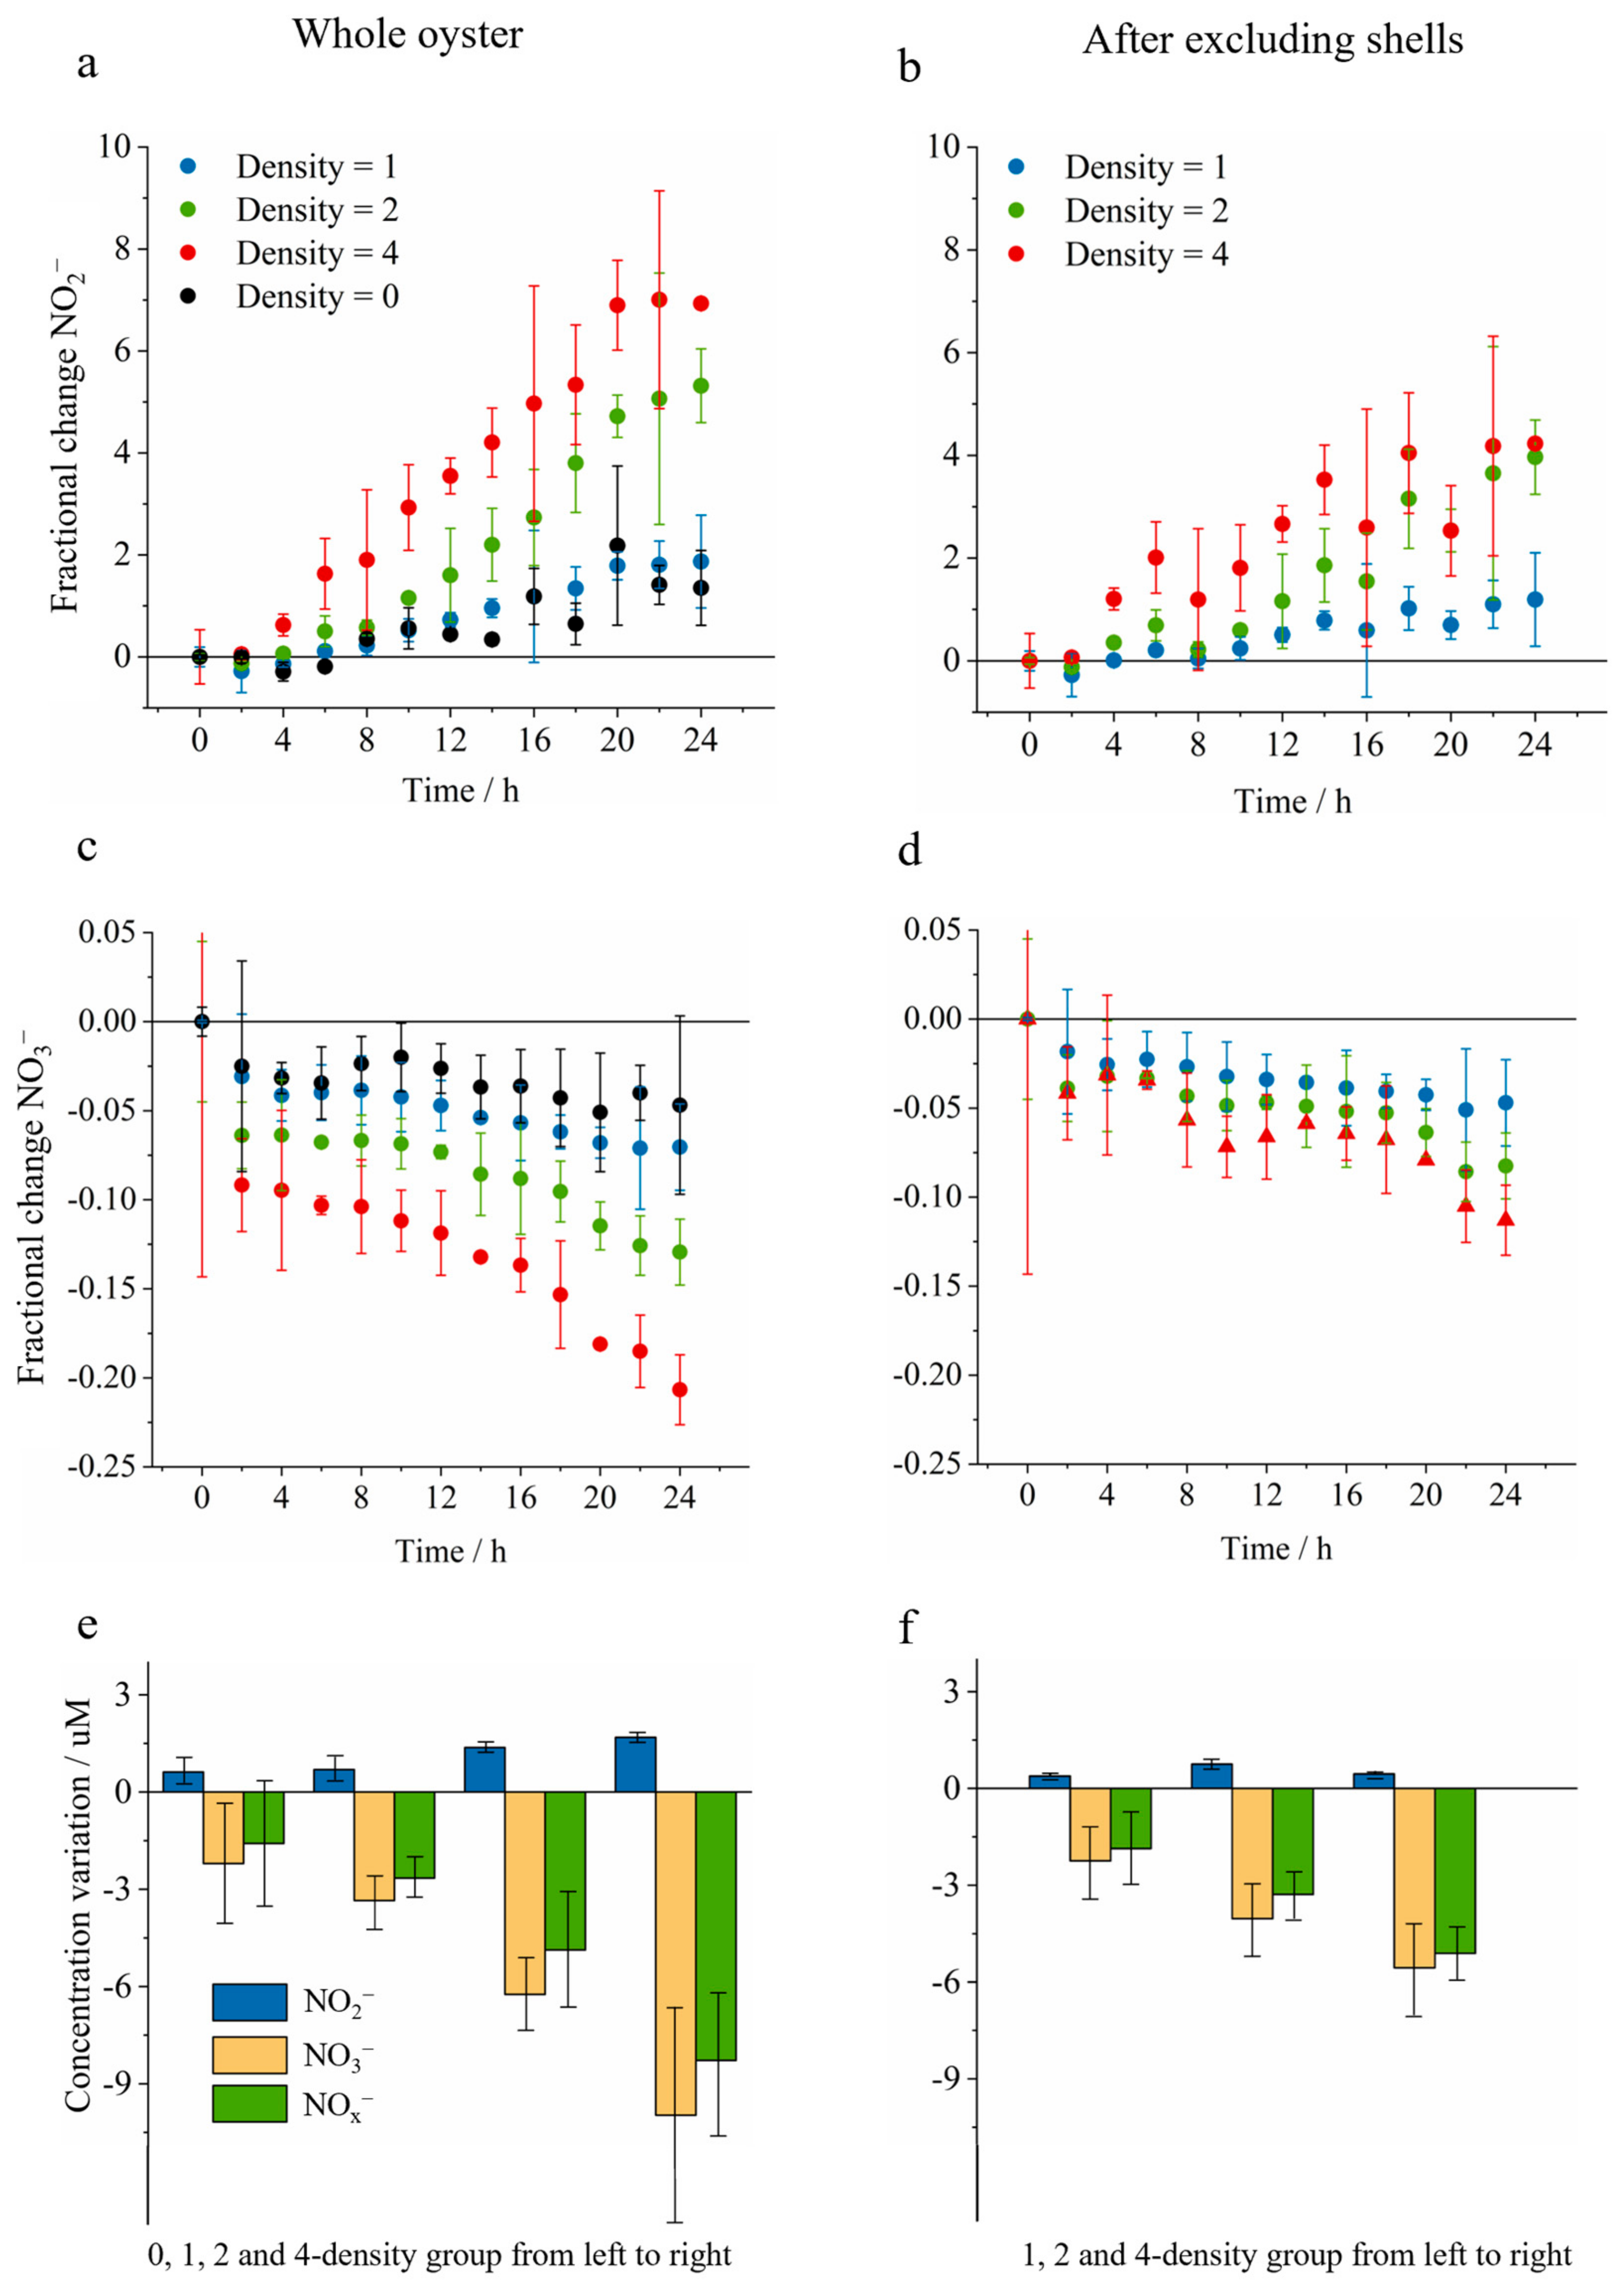
3.1. Laboratory- and Bay-Scale Oyster-Induced Nitrogen Removal

Laboratory oyster rearing experiments showed apparent nitrogen removal at all oyster densities within 24 h period (Figure 4 and Table S1), during which NO2 increased by 0.6–1.7 μM, but NO3 and total NOx decreased by 2.2–10.0 and 1.6–8.3 μM, respectively. Should the effect of shell biofilm be excluded (Figure 4b,d,f), variations caused by oyster tissue would have the same trend as those caused by whole oysters in NO2 (increased by 0.38–0.75 μM), NO3 (decreased by 2.2–5.6 μM), and total NOx (decreased by 1.9–5.1 μM). Among all the density groups, tissue-induced NOx decreases were lower than whole oyster-induced decreases correspondingly, indicating that both shell and tissue of the oyster body had similar potential in NOx removal.
Field sampling at SZB demonstrated lower concentrations of NOx species at the HK side than on the SZ side along transect B with oyster aquaculture (Table S2, Figure 5 and Figure S1). In detail, concentrations of NO2, NO3, and total NOx at the HK side were lower than the SZ side by 1.1, 10.9, and 11.9 μM, respectively, accounting for 69%, 72%, and 72% of SZ concentration, respectively. Contrastingly, along transects A and C, similar NOx levels occurred between two sides, e.g., the mean NOx concentration of the SZ side in transect A was 20.2 μM, and HK had 21.0 μM. For other DIN species, field sampling showed that the HK side had significantly higher NH4+ concentration in both transects A, B, and C (by 4.6, 0.38, and 0.55 μM, respectively) but no statistical difference in N2O concentrations in both transects A and B (difference by less than 0.003 μM). It is worth noting that the HK side of transects A and C had higher concentrations of NH4+ (Figure 5d) and N2O (Figure 5e), respectively.

3.2. Quantitative Nitrogen Removal Assessment

In the lab-scale experiment, the oyster-induced NOx decreases in 1-, 2-, and 4-density groups were 0.64, 1.2, and 2.0 mg-N day−1 per incubator, respectively, and were converted to 0.64, 0.59, and 0.50 mg-N day−1 per individual oyster, respectively. According to the estimation in Section 2.1, the approximate annual yield (ASZB) was 6.8 × 10⁷ oysters. Substituting the lab-scale measurement and ASZB into Equation (1) obtained the NOx removal mass by individual oysters in three groups, which were 43.5, 40.1, and 34.0 kg-N day−1 for low to high densities in SZB, respectively. Since the rearing density of the 2-density group was closest to the mean oyster aquaculture density inside the rafts, NOx removal mass by oyster denitrification (pathway 2) was determined as 40.1 kg-N day−1 in SZB.
To estimate the bay-scale oyster-induced N removal, the calculation was performed according to Section 2.3, Methods S1 and S2, during which the majority of the selected “Distance-Concentration” regressions had R2 over 0.9, and the transect B had R2 over 0.999 in both NO2 and NO3 regressions (Table 2). The total oyster-induced NOx removal mass of SZB (M2+3, pathways 2 + 3) was then obtained as 216.3 kg-N day−1; therefore, NO2 and NO3 contributed 14.7 and 201.6 kg-N day−1, respectively. Distinguishing oyster denitrification (pathway 2) and sedimentary denitrification (pathway 3), the NOx removal masses by pathway 2 and pathway 3 in whole SZB were obtained as 40.1 and 176.2 kg-N day−1, respectively, indicating that pathway 2 in oyster bodies contributed ~20% of microbial NOx removal in SZB.
Combining ASZB (6.8 ×10⁷) with the other constants described in Section 2.3, the organic nitrogen (ON) removal by the biomass harvest of oysters (pathway 1) was 75.7 kg-N day−1 in the whole SZB.
To summarize, oyster aquaculture in the HK side of SZB totally removed 292.0 kg-N day−1, in which the biomass harvest contributed ON removal as 75.7 kg (26%), the denitrification by oyster contributed NOx removal as 40.1 kg (14%, 27.0 kg from tissue and 13.1 kg from shell), and the promoted oyster-induced sedimentary denitrification contributed to NOx removal by 176.2 kg (60%). Given the total oyster aquaculture area in SZB (8.77 km2), the total N removal mass in SZB was translated to 33.3 kg-N km−2 day−1, in which pathways 1, 2, and 3 contributed 8.6, 4.6, and 20.1 kg-N km−2 day−1, respectively.

4. Discussion

Laboratory rearing experiments indicated that floating oysters have great potential for NO3 removal, presumably via microbial denitrification in the digestive tract. Owing to oyster excretion of NH4+ into water [43,44], the oxygenated condition promoting NH4+ oxidation and incomplete denitrification may cause the increase of NO2 (Figure 4e,f). Although NH4+ oxidation was not measured during lab rearing, the NOx reduction could be treated as net rates after considering the cooperated contribution of nitrification and denitrification on NOx within 24 h. Most importantly, the lab rearing experiment quantified the denitrification in oyster bodies and distinguished the contributions by shell and tissue of oysters, which was further extrapolated to obtain the bay-scale N removal rate by oyster aquaculture. Previous studies on oyster-induced NOx removal were mainly based on N2 efflux measurement in sediment incubation [45,46]. This widely used method may be biased by sediment incubation in the heterogeneous sedimentary environment and may overlook the importance of the denitrification process inside the digestive tract and external biofilm on the oyster shell. Here, we provide a working framework to tease apart denitrification by oyster bodies from sedimentary denitrification. The results also showed that the individual NOx removal mass decreased with increasing rearing density, suggesting a tradeoff between the economic benefit of oyster aquaculture through harvesting more oysters and the ecological benefits of oyster-induced N removal.
The SZB field sampling demonstrated km2-scale N removal by oyster aquaculture. From the eastern end of the bay to transect A, there was no oyster aquaculture; NOx concentrations between SZ and HK sides in transect A had no statistical difference, implying that terrigenous input of NOx via freshwater discharge can be considered identical between the two sides. Therefore, the difference in NOx between SZ and HK sides observed in transect B provided strong justification for oyster’s capacity in NOx removal. However, no SZ-HK difference in NOx was detected in transect C, whose HK side was also occupied by oyster rafts. Such a contradiction reflects a limitation of the “flux inventory model” adopted here. The model might be only applicable to regions with sufficiently longer residence time, such as the transects A-B (~10 days), where the effect of oyster-induced N removal could be sufficiently accumulated to be detected by the daily cruise sampling. The residence time in transect C, closer to the outer SZB, has a shorter residence time due to the stronger tidal intrusion from the Pearl River Estuary. Other factors, such as the horizontal transport along the transect, can also contribute to diluting the oyster-induced difference in the HK side, which may be diagnosed by combining the observations and high-resolution, three-dimensional hydrodynamic model simulations.
The apparent drawdown of NH4+ from transects A to B at the HK side (Figure 5d) indicated that oysters may induce NH4+ removal, which was not observed by previous studies [19,25,47]. The decrease of all three DIN species in SZB could be a combined result of three processes: First, the NH4+ increase by oyster excretion and remineralization of organic nitrogen (ON) were ultimately offset by coupled nitrification–denitrification [22]. Second, denitrification as a NOx sink was greater than the NOx source by NH4+ oxidation. Third, oyster-induced anaerobic ammonium oxidation (anammox) could be caused by consuming NH4+ and NO2. The above three processes need further verification and exploration.
In addition, different aquacultural modes can affect the oyster NOx removal potential. Almost all oyster aquaculture sites on the coast of southern China use large-scale floating apparatuses, which are usually > 1 m above the sediment. As such, floating oysters promote pathway 2 more easily because of the increased reactive surfaces (shell + tissue) within the water column compared to oyster reefs. In contrast, most of the existing research in North America and Europe focused on oyster reefs [9,19,25], in which the settled biodeposits tended to promote sedimentary denitrification (pathway 3). To summarize, incorporated with the laboratory rearing experiment, the proposed framework of NOx removal quantification in SZB filled the knowledge gap by directly quantifying and distinguishing the impacts of two pathways of floating oyster-induced NOx removal at the estuarine scale.
This study estimated reasonable total N removal mass by SZB’s oyster aquaculture, and the quantitative distribution of multiple pathways (26%, 14%, and 60% for pathways 1, 2, and 3, respectively) can be compared with previous studies on oyster reef-induced N removal quantification (Table 3). In detail, the total N removal mass of SZB can be viewed as relatively mid-level within the ranges reported by previous studies on oyster-induced N removal along intensive reefs [10,11,12,48,49,50,51,52,53]. Such a broad range of oyster-induced N removal is likely due to the complexity of physiochemical conditions, oyster varieties, rearing densities, and policy management among different areas of the world. The SZB had N removal that was significantly larger than Pensacola Bay and Mobile Bay but smaller than Piscataqua River and Loch Creran. Notably, the floating oysters in SZB had the highest oyster-induced denitrification (DN in Table 3, 24.7 kg-N km−2 day−1) but relatively lower ON removal via biomass harvest (BH in Table 3, 8.6 kg-N km−2 day−1) than studies conducted in US and UK. Compared to high-density oyster aquaculture on reefs, floating oyster aquaculture has considerable potential in mitigating coastal eutrophication by increasing the rearing density, such that an increase in oyster production could have higher ON removal mass.
Combining laboratory rearing and field survey directly distinguished multiple N removal pathways induced by oysters, providing a more comprehensive perspective than previous methodologies. For example, Lai et al. [12] estimated that more than 60% of N removal was contributed by microbial denitrification (pathways 2 + 3), but the contributions by oyster and sedimentary denitrification were not distinguished (Table 3). Caffrey et al. [49] estimated that the oyster had a greater impact on denitrification by a microbe in the gut (pathway 2) rather than sediments adjacent to the oyster reefs (pathway 3). Different results also exist; for example, Labrie et al. [20] estimated that the biomass harvest (pathway 1) contributed 74% of N removal in Lonnie’s Pond, USA, and oyster-induced denitrification (pathways 2 + 3) contributed only 26%. Similarly, Caffrey et al. [49] showed that denitrification only contributed less than 40% of total oyster-induced N removal. Large-scale floating oysters may have a stronger positive impact on sedimentary denitrification (pathway 3), which contributed the most to N removal, followed by pathways 1 and 2, which were not exactly consistent with previous studies. These different results indicated that in-depth investigations towards regulating factors of oyster-induced N removal are needed.
To further assess the ecological benefit of oyster aquaculture, a comparison between N loading in SZB and oyster-induced N removal is performed as follows. The total N removal by oysters, 292.0 kg-N day−1, only constitutes a minor fraction (~1%) of the mean daily N input (3.0 × 10⁴ kg-N day−1 [54]). However, beyond the seemingly unimportant N removal by oysters, one should be aware of oysters’ filter-feeding lifestyle, which has great potential to remove N as well as export water column ON to sediment below. When only the water column is examined, the exported ON (polymerized in oyster pseudofeces and feces), which was removed by oyster filtration from the water column, should be addressed. According to Bayne [55], 90% of total N filtered by floating oysters was exported out of the water column system. Thus, the N reduction in the water column by oysters could be ten times the assimilated N in harvested biomass. To that end, oyster aquaculture in SZB at present density could remove 973.3 kg-N day−1 (the exported-ON accounting for 681.3 kg-N day−1), or 3.2% of total daily N input in SZB, demonstrating great potential in reduction of N loading by estuary-scale oyster aquaculture.
Quantification on each pathway inevitably has an uncertainty range attributed to variabilities of various parameters, such as the number of oyster individuals in SZB (ASZB) and daily variation of NOx by oyster (ΔMlab). Specifically, ASZB may have a margin of error of ± 10%, and the individual ΔMlab utilized in this study, 0.59 mg-N day−1, probably has a range from 0.50 to 0.64 mg-N day−1 if the rearing density in SZB changed. By taking the above variations into consideration, the removal mass and contribution of pathway 2 probably have a variation of ± 20%, and the total oyster-induced exported N in SZB probably varies from 2.9% to 3.4% of the daily N input in SZB. A physical–biogeochemical modeling study in the Pearl River Estuary by Yu and Gan [56], which defined an oyster farming density of 200 individuals m−2 (much higher than SZB rearing condition) and oyster farming area of 10 km2 (larger than SZB), showed that the N reduction by oyster aquaculture was equivalent to 10% of river nutrient input. This estimation is another piece of evidence about improving oyster-induced ecological benefit by increasing production. Furthermore, with similar filter-feeding lifestyle and aquaculture mode, the N removal potential in estuary-scale, especially removal by microbial denitrification, has also been demonstrated and quantified in other shellfish species such as clams (Ruditapes philippinarum) [57] and mussel (Geukensia demissa) [58], indicating that co-culture of shellfish species may well be able to increase N removal.
Algal blooms and consequent water hypoxia are recently alarming ecological disasters induced by coastal eutrophication [56,59]. As the SZB is located in the middle reach of the Pearl River Estuary, where the majority of algal blooms were found during the dry season [60], oyster aquaculture may provide an ecological solution to reducing N loading and mitigating the harmful algal bloom, especially in the dry season, by denitrifying water column NOx, assimilating the phytoplankton and exporting suspended ON from water column to the sediment. Our quantitative assessment scheme captured a snapshot of the N removal potential of large-scale floating oyster aquaculture in SZB during wintertime. The mechanism behind the distribution of three pathways, especially the denitrification in the sediment below oyster rafts, lacks in-depth investigation. In addition, beyond one snapshot at the harvest season of SZB, different environmental conditions corresponding to different spatial and temporal scales should be the future research direction in the field of oyster-induced N removal.

5. Conclusions

This study presents a quantitative framework for N removal by floating oyster aquaculture in a subtropical bay (Shenzhen Bay, SZB) via both laboratory rearing experiments and field surveys, taking advantage of SZB’s unique setting. The extrapolation of laboratory results fills the gap in distinguishing denitrification in oyster bodies with sedimentary counterparts. In addition, different managements on the HK and SZ sides (with and without oyster aquaculture, respectively) permit a “flux inventory model” to realize the quantitative estimation of the km2-scale effect of oyster aquaculture on coastal DIN distribution. In summary, the oyster-induced N removal mass in SZB is quantified as 33.3 kg-N km−2 day−1 within oyster aquaculture coverage in the harvest season. The microbial denitrification pathways contribute 24.7 g-N km−2 day−1, ~20% of which is from oyster bodies. Furthermore, if only the water column is examined, the oyster aquaculture can reduce 3.2% of total daily N input in SZB when addressing the unassimilated organic nitrogen exported by oysters to the sediment below. From the lab- to bay-scale extrapolation and a snapshot of the field sampling, this study makes a successful attempt to quantitatively characterize the N removal via floating oyster aquaculture, especially in oyster bodies. It is possible to increase the oyster yield to improve its ecological benefit.

Supplementary Materials

The following supporting information can be downloaded at https://www.mdpi.com/article/10.3390/jmse13010021/s1. Method S1: Description of coordinate system definition, model regression, and integration in each transect in “flux inventory model”; Method S2: Description of residence time (τ) estimation process; Table S1: The nitrite, nitrate, and ammonium concentration (μM) at 0 and 24 h and their variation (μM) during the 24 h rearing period in four densities; Table S2: Characteristics and concentrations of sampling sites and fitting data for “Distance-Concentration” regressions in three transects of SZB; Table S3: Comparison of fitting performance metrics of “Distance-Concentration” regressions on each NOx species in A and B transects of SZB, respectively; Figure S1: Concentrations of different NOx species (in μM) in SZB on 8 (a–c), 9 (d–f), and 10 January (g–i), respectively.

Author Contributions

Conceptualization, Q.J.; methodology, R.L.; formal analysis, R.L.; investigation, R.L., Z.C. and H.Z.; data curation, R.L.; writing—original draft preparation, R.L.; writing—review and editing, Q.J. and H.Z.; visualization, R.L.; supervision, Q.J.; project administration, Q.J.; funding acquisition, Q.J. All authors have read and agreed to the published version of the manuscript.

Funding

This research is collectively funded by the National Natural Science Foundation of China (42006038), Guangzhou Municipal Science and Technology Bureau (2023A03J0642), and a grant from the Research Grants Council of the Hong Kong SAR, China (AoE/P-601/23-N).

Institutional Review Board Statement

Not applicable.

Informed Consent Statement

Not applicable.

Data Availability Statement

The original contributions presented in this study are included in the article and Supplementary Materials. Further inquiries can be directed to the corresponding author.

Acknowledgments

We express sincere gratitude to Liuqian Yu from EOAS thrust in HKUST (GZ) for her constructive comments and suggestions to improve the clarity of the manuscript, as well as Wenping Gong from the School of Marine Sciences in SYSU for providing access to Shenzhen Bay and supplying physical data of water column. The research was conducted at the Earth and Environmental Systems Research Facility at HKUST (GZ) with the support of Yang Wang and Zhouxiao Liu in cruise, Ye Liu in the oyster rearing experiment, and Zheng Chen in data analysis and visualization.

Conflicts of Interest

The authors declare no conflicts of interest.

References

  1. Howarth, R.W.; Marino, R. Nitrogen as the limiting nutrient for eutrophication in coastal marine ecosystems: Evolving views over three decades. Limnol. Oceanogr. 2006, 51, 364–376. [Google Scholar] [CrossRef]
  2. Ayvazian, S.; Mulvaney, K.; Zarnoch, C.; Palta, M.; Reichert-Nguyen, J.; McNally, S.; Pilaro, M.; Jones, A.; Terry, C.; Fulweiler, R.W. Beyond bioextraction: The role of oyster-mediated denitrification in nutrient management. Environ. Sci. Technol. 2021, 55, 14457–14465. [Google Scholar] [CrossRef] [PubMed]
  3. Gruber, N. Chapter 1—The Marine Nitrogen Cycle: Overview and Challenges. In Nitrogen in the Marine Environment, 2nd ed.; Capone, D.G., Bronk, D.A., Mulholland, M.R., Carpenter, E.J., Eds.; Academic Press: San Diego, CA, USA, 2008; pp. 1–50. [Google Scholar]
  4. Wan, X.S.; Sheng, H.X.; Liu, L.; Shen, H.; Tang, W.; Zou, W.; Xu, M.N.; Zheng, Z.; Tan, E.; Chen, M.; et al. Particle-associated denitrification is the primary source of N2O in oxic coastal waters. Nat. Commun. 2023, 14, 8280. [Google Scholar] [CrossRef] [PubMed]
  5. Duarte, C.M.; Krause-Jensen, D. Intervention options to accelerate ecosystem recovery from coastal eutrophication. Front. Mar. Sci. 2018, 5, 470. [Google Scholar] [CrossRef]
  6. Boesch, D.F. Barriers and bridges in abating coastal eutrophication. Front. Mar. Sci. 2019, 6, 123. [Google Scholar] [CrossRef]
  7. Botta, R.; Asche, F.; Borsum, J.S.; Camp, E.V. A review of global oyster aquaculture production and consumption. Mar. Policy 2020, 117, 103952. [Google Scholar] [CrossRef]
  8. FAO. The State of World Fisheries and Aquaculture 2020: Sustainability in Action; FAO: Rome, Italy, 2020. [Google Scholar]
  9. Ray, N.E.; Hancock, B.; Brush, M.J.; Colden, A.; Cornwell, J.; Labrie, M.S.; Maguire, T.J.; Maxwell, T.; Rogers, D.; Stevick, R.J.; et al. A review of how we assess denitrification in oyster habitats and proposed guidelines for future studies. Limnol. Oceanogr. Methods 2021, 19, 714–731. [Google Scholar] [CrossRef]
  10. Cubillo, A.M.; Lopes, A.S.; Ferreira, J.G.; Moore, H.; Service, M.; Bricker, S.B. Quantification and valuation of the potential of shellfish ecosystem services in mitigating coastal eutrophication. Estuar. Coast. Shelf Sci. 2023, 293, 108469. [Google Scholar] [CrossRef]
  11. Bricker, S.B.; Grizzle, R.E.; Trowbridge, P.; Rose, J.M.; Ferreira, J.G.; Wellman, K.; Zhu, C.; Galimany, E.; Wikfors, G.H.; Saurel, C.; et al. Bioextractive removal of nitrogen by oysters in Great Bay Piscataqua River estuary, New Hampshire, USA. Estuaries Coasts 2020, 43, 23–38. [Google Scholar] [CrossRef]
  12. Lai, Q.T.; Irwin, E.R.; Zhang, Y. Estimating nitrogen removal services of eastern oyster (Crassostrea virginica) in Mobile bay, Alabama. Ecol. Indic. 2020, 117, 106541. [Google Scholar] [CrossRef]
  13. Clements, J.C.; Comeau, L.A. Nitrogen removal potential of shellfish aquaculture harvests in eastern Canada: A comparison of culture methods. Aquacult. Rep. 2019, 13, 100183. [Google Scholar] [CrossRef]
  14. Ray, N.E.; Henning, M.C.; Fulweiler, R.W. Nitrogen and phosphorus cycling in the digestive system and shell biofilm of the eastern oyster Crassostrea virginica. Mar. Ecol. Prog. Ser. 2019, 621, 95–105. [Google Scholar] [CrossRef]
  15. Rose, J.M.; Gosnell, J.S.; Bricker, S.; Brush, M.J.; Colden, A.; Harris, L.; Karplus, E.; Laferriere, A.; Merrill, N.H.; Murphy, T.B.; et al. Opportunities and challenges for including oyster-mediated denitrification in nitrogen management plans. Estuaries Coasts 2021, 44, 2041–2055. [Google Scholar] [CrossRef] [PubMed]
  16. Arfken, A.; Song, B.; Bowman, J.S.; Piehler, M. Denitrification potential of the eastern oyster microbiome using a 16S rRNA gene based metabolic inference approach. PLoS ONE 2017, 12, e0185071. [Google Scholar] [CrossRef]
  17. Voet, H.; Soetaert, K.; Moens, T.; Bodé, S.; Boeckx, P.; Van Colen, C.; Vanaverbeke, J. N2O production by mussels: Quantifying rates and pathways in current and future climate settings. Front. Mar. Sci. 2023, 10, 1101469. [Google Scholar] [CrossRef]
  18. Newell, R.I.; Jordan, S.J. Preferential ingestion of organic material by the American oyster Crassostrea virginica. Mar. Ecol. Prog. Ser. 1983, 13, 47–53. [Google Scholar] [CrossRef]
  19. Ray, N.E.; Fulweiler, R.W. Meta-analysis of oyster impacts on coastal biogeochemistry. Nat. Sustain. 2021, 4, 261–269. [Google Scholar] [CrossRef]
  20. Labrie, M.S.; Sundermeyer, M.A.; Howes, B.L. Quantifying the effects of floating oyster aquaculture on nitrogen cycling in a temperate coastal embayment. Estuaries Coasts 2023, 46, 494–511. [Google Scholar] [CrossRef]
  21. Bronk, D.A.; Steinberg, D.K. Chapter 8—Nitrogen Regeneration. In Nitrogen in the Marine Environment, 2nd ed.; Capone, D.G., Bronk, D.A., Mulholland, M.R., Carpenter, E.J., Eds.; Academic Press: San Diego, CA, USA, 2008; pp. 385–467. [Google Scholar]
  22. Hamersley, M.R.; Howes, B.L. Coupled nitrification-denitrification measured in situ in a Spartina alterniflora marsh with a 15NH4+ tracer. Mar. Ecol. Prog. Ser. 2005, 299, 123–135. [Google Scholar] [CrossRef]
  23. Hoellein, T.J.; Zarnoch, C.B. Effect of eastern oysters (Crassostrea virginica) on sediment carbon and nitrogen dynamics in an urban estuary. Ecol. Appl. 2014, 24, 271–286. [Google Scholar] [CrossRef]
  24. Humphries, A.T.; Ayvazian, S.G.; Carey, J.C.; Hancock, B.T.; Grabbert, S.; Cobb, D.; Strobel, C.J.; Fulweiler, R.W. Directly measured denitrification reveals oyster aquaculture and restored oyster reefs remove nitrogen at comparable high rates. Front. Mar. Sci. 2016, 3, 74. [Google Scholar] [CrossRef]
  25. Filippini, G.; Dafforn, K.A.; Bugnot, A.B. Shellfish as a bioremediation tool: A review and meta-analysis. Environ. Pollut. 2023, 316, 120614. [Google Scholar] [CrossRef] [PubMed]
  26. Mara, P.; Edgcomb, V.P.; Sehein, T.R.; Beaudoin, D.; Martinsen, C.; Lovely, C.; Belcher, B.; Cox, R.; Curran, M.; Farnan, C.; et al. Comparison of oyster aquaculture methods and their potential to enhance microbial nitrogen removal from coastal ecosystems. Front. Mar. Sci. 2021, 8, 174. [Google Scholar] [CrossRef]
  27. Filippini, G.; Bugnot, A.B.; Ferguson, A.; Gribben, P.E.; Palmer, J.; Erickson, K.; Dafforn, K.A. The influence of oyster reefs and surrounding sediments on nitrogen removal—An in-situ study along the East coast of Australia. Environ. Res. 2023, 237, 116947. [Google Scholar] [CrossRef]
  28. Yu, S.; Mu, Y. Evaluation of green development in mariculture: The case of Chinese oyster aquaculture. Aquaculture 2023, 576, 739838. [Google Scholar] [CrossRef]
  29. Bureau of Fisheries, Ministry of Agriculture. China Fishery Statistical Yearbook; China Agriculture Press: Beijing, China, 2023. [Google Scholar]
  30. FAO. The State of World Fisheries and Aquaculture 2022: Towards Blue Transformation; FAO: Rome, Italy, 2022. [Google Scholar]
  31. Cheung, S.C.H. Floating mountain in Pearl River: A study of oyster cultivation and food heritage in Hong Kong. Asian Educ. Dev. Stud. 2019, 8, 433–442. [Google Scholar] [CrossRef]
  32. Wang, R.; Wu, J.; Yiu, K.-F.; Shen, P.; Lam, P.K.S. Long-term variation in phytoplankton assemblages during urbanization: A comparative case study of Deep Bay and Mirs Bay, Hong Kong, China. Sci. Total Environ. 2020, 745, 140993. [Google Scholar] [CrossRef]
  33. Wan, Y. Determination of Hydrodynamic Time of Deep Bay and Evaluation of Effect on Leading Nutrient Reduction. Ph.D. Thesis, Tsinghua University, Beijing, China, 2009. [Google Scholar]
  34. Environmental Protection Department, Hong Kong SAR. Marine Water Quality Data. Available online: https://cd.epic.epd.gov.hk/EPICRIVER/vicmarineannual/result/ (accessed on 29 April 2024).
  35. Huo, Z.; Wang, Z.; Liang, J.; Zhang, Y.; Shen, J.; Yao, T.; Su, J.; Yu, R. Effects of salinity on embryonic development, survival, and growth of Crassostrea hongkongensis. J. Ocean Univ. China 2014, 13, 666–670. [Google Scholar] [CrossRef]
  36. Lee, T.H.; Dang, X.; Mumby, H.S.; Xiao, S.; Chung, S.C.; Thiyagarajan, V. Winter mortality syndrome in Hong Kong oyster (Crassostrea hongkongensis): Causes and impacts. Aquaculture 2024, 591, 741139. [Google Scholar] [CrossRef]
  37. Wilson, S.T.; Bange, H.W.; Arévalo-Martínez, D.L.; Barnes, J.; Borges, A.V.; Brown, I.; Bullister, J.L.; Burgos, M.; Capelle, D.W.; Casso, M.; et al. An intercomparison of oceanic methane and nitrous oxide measurements. Biogeosciences 2018, 15, 5891–5907. [Google Scholar] [CrossRef]
  38. Jain, R.K.; Cui, Z.C.; Domen, J.K. Chapter 4—Environmental Impacts of Mining. In Environmental Impact of Mining and Mineral Processing; Jain, R.K., Cui, Z.C., Domen, J.K., Eds.; Butterworth-Heinemann: Boston, MA, USA, 2016; pp. 53–157. [Google Scholar]
  39. Mareddy, A.R. Chapter 5—Impacts on air environment. In Environmental Impact Assessment; Mareddy, A.R., Ed.; Butterworth-Heinemann: Boston, MA, USA, 2017; pp. 171–216. [Google Scholar]
  40. Li, H.; Zhang, G.; Zhu, Y.; Kaufmann, H.; Xu, G. Inversion and driving force analysis of nutrient concentrations in the ecosystem of the Shenzhen-Hong Kong Bay area. Remote Sens. 2022, 14, 3694. [Google Scholar] [CrossRef]
  41. Grizzle, R.E.; Ward, K.M.; Peter, C.R.; Cantwell, M.; Katz, D.; Sullivan, J. Growth, morphometrics and nutrient content of farmed eastern oysters, Crassostrea virginica (Gmelin), in New Hampshire, USA. Aquacult. Res. 2017, 48, 1525–1537. [Google Scholar] [CrossRef] [PubMed]
  42. Loaiza, I.; Wong, C.; Thiyagarajan, V. Comparative analysis of nutritional quality of edible oysters cultivated in Hong Kong. J. Food Compos. Anal. 2023, 118, 105159. [Google Scholar] [CrossRef]
  43. Buzin, F.; Dupuy, B.; Lefebvre, S.; Barillé, L.; Haure, J. Storage of Pacific oysters Crassostrea gigas in recirculating tank: Ammonia excretion and potential nitrification rates. Aquacult. Eng. 2015, 64, 8–14. [Google Scholar] [CrossRef]
  44. Wang, T.; Li, Q. Effects of temperature, salinity and body size on the physiological responses of the Iwagaki oyster Crassostrea nippona. Aquacult. Res. 2020, 51, 728–737. [Google Scholar] [CrossRef]
  45. Kellogg, M.L.; Cornwell, J.C.; Owens, M.S.; Paynter, K.T. Denitrification and nutrient assimilation on a restored oyster reef. Mar. Ecol. Prog. Ser. 2013, 480, 1–19. [Google Scholar] [CrossRef]
  46. Smyth, A.R.; Geraldi, N.R.; Thompson, S.P.; Piehler, M.F. Biological activity exceeds biogenic structure in influencing sediment nitrogen cycling in experimental oyster reefs. Mar. Ecol. Prog. Ser. 2016, 560, 173–183. [Google Scholar] [CrossRef]
  47. Loren, D.C.; Robert, D.B.; David, B.; Ray, G.; Mark, W.L.; Martin, H.P.; Sean, P.P.; Tolley, S.G. Ecosystem services related to oyster restoration. Mar. Ecol. Prog. Ser. 2007, 341, 303–307. [Google Scholar] [CrossRef]
  48. Bayer, S.R.; Cubillo, A.M.; Rose, J.M.; Ferreira, J.G.; Dixon, M.; Alvarado, A.; Barr, J.; Bernatchez, G.; Meseck, S.; Poach, M.; et al. Correction: Refining the farm aquaculture resource management model for shellfish nitrogen removal at the local scale. Estuaries Coasts 2024, 47, 1331. [Google Scholar] [CrossRef]
  49. Caffrey, J.M.; Hollibaugh, J.T.; Mortazavi, B. Living oysters and their shells as sites of nitrification and denitrification. Mar. Pollut. Bull. 2016, 112, 86–90. [Google Scholar] [CrossRef]
  50. Dvarskas, A.; Bricker, S.B.; Wikfors, G.H.; Bohorquez, J.J.; Dixon, M.S.; Rose, J.M. Quantification and valuation of nitrogen removal services provided by commercial shellfish aquaculture at the subwatershed scale. Environ. Sci. Technol. 2020, 54, 16156–16165. [Google Scholar] [CrossRef] [PubMed]
  51. Ferreira, J.; Andersson, H.; Corner, R.; Desmit, X.; Fang, Q.; De Goede, E.; Groom, S.; Gu, H.; Gustafsson, B.; Hawkins, A. Sustainable Options for People Catchment and Aquatic Resources: The SPEAR Project an International Collaboration on Integrated Coastal Zone Management. In Proceedings of the Coimbra: IMAR—Institute of Marine Research/European Commission, Coimbra, Portugal, 31 March 2008. [Google Scholar]
  52. Ferreira, J.G.; Sequeira, A.; Hawkins, A.J.S.; Newton, A.; Nickell, T.D.; Pastres, R.; Forte, J.; Bodoy, A.; Bricker, S.B. Analysis of coastal and offshore aquaculture: Application of the FARM model to multiple systems and shellfish species. Aquaculture 2009, 289, 32–41. [Google Scholar] [CrossRef]
  53. Grizzle, R.E.; Burdick, D.M.; Greene, J.; Abeels, H.; Capone, M. Reef Structure Alternatives for Restoration of Oyster (Crassostrea virginica) Populations in New Hampshire; University of New Hampshire; Piscataqua Region Estuaries Partnership: Durham, NH, USA, 2006; p. 272. [Google Scholar]
  54. Zhao, C.-C.; Zhang, S.; Mao, X.-Z. Variations of annual load of TN and TP in the Deep Bay Watershed, Shenzhen. Huan Jing Ke Xue (Chin. Engl. Abstr.) 2014, 35, 4111–4117. [Google Scholar] [CrossRef]
  55. Bayne, B.L. Chapter 4—Ecology II: Distribution at Local Scales. In Developments in Aquaculture and Fisheries Science; Bayne, B., Ed.; Elsevier: Amsterdam, The Netherlands, 2017; Volume 41, pp. 139–208. [Google Scholar]
  56. Yu, L.; Gan, J. Mitigation of eutrophication and hypoxia through oyster aquaculture: An ecosystem model evaluation off the Pearl River Estuary. Environ. Sci. Technol. 2021, 55, 5506–5514. [Google Scholar] [CrossRef]
  57. Welsh, D.T.; Nizzoli, D.; Fano, E.A.; Viaroli, P. Direct contribution of clams (Ruditapes philippinarum) to benthic fluxes, nitrification, denitrification and nitrous oxide emission in a farmed sediment. Estuar. Coast. Shelf Sci. 2015, 154, 84–93. [Google Scholar] [CrossRef]
  58. Galimany, E.; Wikfors, G.H.; Dixon, M.S.; Newell, C.R.; Meseck, S.L.; Henning, D.; Li, Y.; Rose, J.M. Cultivation of the ribbed mussel (Geukensia demissa) for nutrient bioextraction in an urban estuary. Environ. Sci. Technol. 2017, 51, 13311–13318. [Google Scholar] [CrossRef]
  59. Zhang, X.; Gao, S.; Ji, X.; Zhu, X.; Zheng, J.; Guo, S. Impact of typhoons on the ecological environment of the Pearl River Estuary in the summer of 2021—A study of an algal bloom event. Front. Mar. Sci. 2024, 11, 1395804. [Google Scholar] [CrossRef]
  60. Lu, Z.; Gan, J. Controls of seasonal variability of phytoplankton blooms in the Pearl River Estuary. Deep. Sea Res. Part II 2015, 117, 86–96. [Google Scholar] [CrossRef]
Figure 1. Conceptual diagram showing three pathways of N removal by floating oysters. Pathway 1: biomass harvest. Pathway 2: denitrification in oyster body. Pathway 3: oyster-induced sedimentary denitrification.
Jmse 13 00021 g001
Figure 2. Sampling sites and water depth (m) in Shenzhen Bay (a), temperature ((b), in °C), and salinity ((c), in ppt) averaged over sampling periods from 8 to 10 January 2024. Note that the floating oyster aquaculture was only on the HK side but not the SZ side.
Jmse 13 00021 g002
Figure 3. Diagram of the conceptual water box in “flux inventory model” applied in Shenzhen Bay (SZB). The net water flow through the water box was along an east-to-west direction from transects A to B, with a flow rate of 6.9 × 10⁵ m3 day−1.
Jmse 13 00021 g003
Figure 4. Fractional change in NO2 or NO3 concentration relative to its initial concentration (i.e., C(t)-(t = 0 h))/C(t = 0 h), where C denotes the concentration) for oyster rearing experiments under different densities (ad); change in concentration of NO2, NO3, and NOx (NO3 + NO2) after one-day rearing (e,f). Specifically, (a,c,e) represent results by whole oysters, while (b,d,f) represent results excluding oyster shells. A positive value represents an increase in concentration, while a negative value represents removal.
Jmse 13 00021 g004
Figure 5. Concentrations of different DIN species including NO2 (a), NO3 (b), NH4+ (d) and N2O (e), NOx (c) and total DIN (f) (N2O in nM and others in μM) in Shenzhen Bay. Concentrations are averaged over the sampling periods from 8–10 January 2024.
Jmse 13 00021 g005
Table 1. Data for regressions in transects A and B.
TransectSideSiteDistance (km)Concentration (μM)
NO2NO3
AHKA01’1.1221.076 ± 0.01714.960 ± 3.962
A02’0.1591.543 ± 0.11624.429 ± 0.964
SZA01−2.2941.672 ± 0.36420.363 ± 3.970
A02−1.4901.397 ± 0.09416.040 ± 3.157
A03−0.8271.321 ± 0.17715.904 ± 3.626
A04−0.1591.529 ± 0.14822.545 ± 3.287
BHKB01’1.9100.273 ± 0.1711.371 ± 0.124
B02’1.0580.340 ± 0.2424.071 ± 2.145
B03’0.2310.791 ± 0.0117.288 ± 0.903
SZB01−1.5491.865 ± 0.16919.873 ± 0.543
B02−0.8651.600 ± 0.21414.905 ± 1.006
B03−0.2311.121 ± 0.14510.528 ± 1.577
Table 2. Selected optimal “Distance-Concentration” regressions and calculated integral results of the SZ side and HK side in A and B transects, respectively.
TransectSpeciesBest Regression EquationR2Integral (mol m−2)
x < 0 (SZ)x > 0 (HK)
ANO2y = 1.524 + 0.042x − 0.245x2 − 0.128x30.9572.4221.988
NO3y = 18.763 + 4.536sin[π(x+0.610)/1.403]0.92630.2431.69
BNO2y = 1.072 + 0.833sin[π(x−3.299)/3.443]1.0003.7081.903
NO3y = e2.188−0.693x−0.114x^20.99925.608.294
Table 3. Quantitative comparison of all pathways of N removal (in kg N km−2 day−1) in some previous studies and this study (DN: denitrification; BH: biomass harvest). Each removal per unit was calculated by dividing the total removal by corresponding annual aquaculture duration and area.
Study AreaOyster SpeciesPathwayRemovalReference
New Hampshire, USCrassostrea virginicaDN5.0Grizzle et al. [53]
Pensacola Bay, USTotal15.1Caffrey et al. [49]
DN5.6
Mobile Bay, USTotal9.2Lai et al. [12]
BH0.5
DN5.8
Piscataqua River, USTotal48.8Bricker et al. [11]
Greenwich Bay, USBH25.8Dvarskas et al. [50]
43.6Bayer et al. [48]
Sanggou Bay, ChinaCrassostrea gigasTotal34.5Ferreira et al. [51]
Loch Creran, UK63.6Ferreira et al. [52]
Northern Ireland, UKOstrea edulisBH42.2Cubillo et al. [10]
Shenzhen Bay, ChinaC. hongkongensisTotal33.3this study
BH8.6
DN24.7
Disclaimer/Publisher’s Note: The statements, opinions and data contained in all publications are solely those of the individual author(s) and contributor(s) and not of MDPI and/or the editor(s). MDPI and/or the editor(s) disclaim responsibility for any injury to people or property resulting from any ideas, methods, instructions or products referred to in the content.

