Article

Assessing the Geological Environment Resilience Under Seawater Intrusion Hazards: A Case Study of the Coastal Area of Shenzhen City

1
College of Civil and Transportation Engineering, Shenzhen University, Shenzhen 518060, China
2
Key Laboratory of Coastal Urban Resilient Infrastructures (Shenzhen University), Ministry of Education, Shenzhen 518060, China
3
Shenzhen Key Laboratory of Green, Efficient and Intelligent Construction of Underground Metro Station, Shenzhen University, Shenzhen 518060, China
4
Urban Disaster Research Center, National Institute of Natural Hazards, Beijing 100085, China
5
Shenzhen Geotechnical Surveying & Investigation Institute (Group) Co., Ltd., Shenzhen 518028, China
6
School of Civil Engineering, Tsinghua University, Beijing 100084, China
*
Author to whom correspondence should be addressed.
J. Mar. Sci. Eng. 2025, 13(1), 18; https://doi.org/10.3390/jmse13010018
Submission received: 14 November 2024 / Revised: 20 December 2024 / Accepted: 23 December 2024 / Published: 27 December 2024

Abstract

:
Revealing geological environment resilience (GER) under seawater intrusion (SWI) hazards is a prerequisite for solving groundwater resource depletion, land salinization, and ecological degradation in coastal cities. This study applies the resilience design approach based on urban complex adaptive systems theory to understand the impact of SWI on the geological environment. Taking SWI as the research object, the GER evaluation method under SWI disaster was established by selecting five elastic indexes: disturbance intensity, geological environment vulnerability, stress resistance, recovery, and adaptability. This method is used to evaluate the GER level of the coastal areas of Shenzhen in recent years under the impact of SWI hazards. The study found that there is a negative correlation between the intensity of disturbance and precipitation amount. The vulnerability is greater the closer the distance to the coastline and the shallower the depth of bedrock burial. Resistance is composed of early warning ability and disaster prevention ability, and the result is 10.07, which belongs to the medium level. The recovery is 1.49, which is at a relatively high level, indicating a high capacity for restoration ability. The adaptability increased from 3.03 to 3.13, so that the area of seawater intrusion is becoming smaller. GER is affected by precipitation amount and depth of bedrock burial; the greater the precipitation and the shallower the bedrock burial, the lower the GER. Precipitation amount significantly impacts the SWI situation in the eastern coastal area of Shenzhen. In the central region, the impact of precipitation on GER is less significant. However, in the western region, the depth of bedrock burial primarily affects GER. Compared to completely weathered granite, Pleistocene fluvial plain sediments are more susceptible to SWI effects in freshwater environments. This study contributes to a deeper understanding of the impact of SWI on the geological environment in coastal areas, providing decision-makers with the necessary knowledge to develop targeted and effective governance and prevention strategies.

1. Introduction

Seawater intrusion (SWI) is a severe global geological hazard facing coastal areas. It can damage the ecological [1] and geological environment [2] and affect local biodiversity [3]. As one of the geological hazards coastal cities frequently face, SWI is complex, including global climate change [4,5], geological conditions [6,7], groundwater flow direction [8], and human activities [7,9]. Excessive groundwater extraction [10], overdevelopment of coastal areas, coastal engineering projects, and oil and gas exploration can contribute to SWI. SWI degrades groundwater quality [11,12,13] and leads to freshwater scarcity [14], significantly impacting local industries such as agriculture [15], fisheries, and tourism.
Many researchers have made significant progress in studying the impact of natural conditions and human activities on SWI hazards. They used numerical simulations, experimental simulations, and hydro-chemical analysis to determine the temporal variation, extent, and depth of SWI. For instance, researchers utilized a three-dimensional hydrodynamic model to simulate the blocked and confined seawater intrusion in coastal lagoons, revealing the spatiotemporal evolution of seawater intrusion and its mixing efficiency with lagoon water [16]. In other studies, the effects of sea-level rise on seawater intrusion in layered aquifers were simulated using SEAWAT and sharp-interface models [17]. Hydrogeochemical methods and enveloping analysis based on lake measurement data were employed to investigate the characteristics and potential risks of seawater intrusion in coastal cities in southern China [18]. The degree of seawater intrusion was determined by assessing the Na/Cl ratio in groundwater samples through chemical analysis [19]. Geophysical measurements, core drilling, and groundwater chemical analysis have been utilized to determine the spatial extent and degree of SWI affecting groundwater in various regions, including the western Nile Delta area [20], the Thermaikos Bay, eastern Greece [21], the town of Buzhuang, and southwest of Laizhou Bay, China [22]. Countries have developed a series of measures to cope with seawater intrusion, including rational exploitation of groundwater, land use planning, groundwater monitoring and the construction of anti-seepage walls, which have played a certain role in reducing seawater intrusion [23].
Scholars primarily use sensitivity and vulnerability analyses to assess the extent of damage caused by SWI to the geological environment and groundwater. These assessments provide valuable insights for managing and preventing SWI. A comprehensive groundwater pollution risk assessment method is proposed for the Beijing Plain, integrating inherent vulnerability, pollution sources, and groundwater functional zoning to determine the levels of groundwater pollution risk [24]. Vulnerability assessment models are developed and applied to analyze vulnerability based on groundwater data from Jeju volcanic island and Beihai city, followed by classification based on the assessment results [25,26]. To address the vulnerability of coastal aquifers in northern Greece to SWI, an improved fuzzy multicriteria decision-making approach is proposed, resulting in the development of preventive strategies such as aquifer recharge and optimization of pumping efficiency based on the assessment outcomes [27]. In evaluating the risk of SWI in the Eastern Mediterranean coastal aquifer, the quantitative analysis of interactions among natural, anthropogenic, and climate-driven factors is conducted, along with a comprehensive analysis of strengths, weaknesses, opportunities, and threats [28].
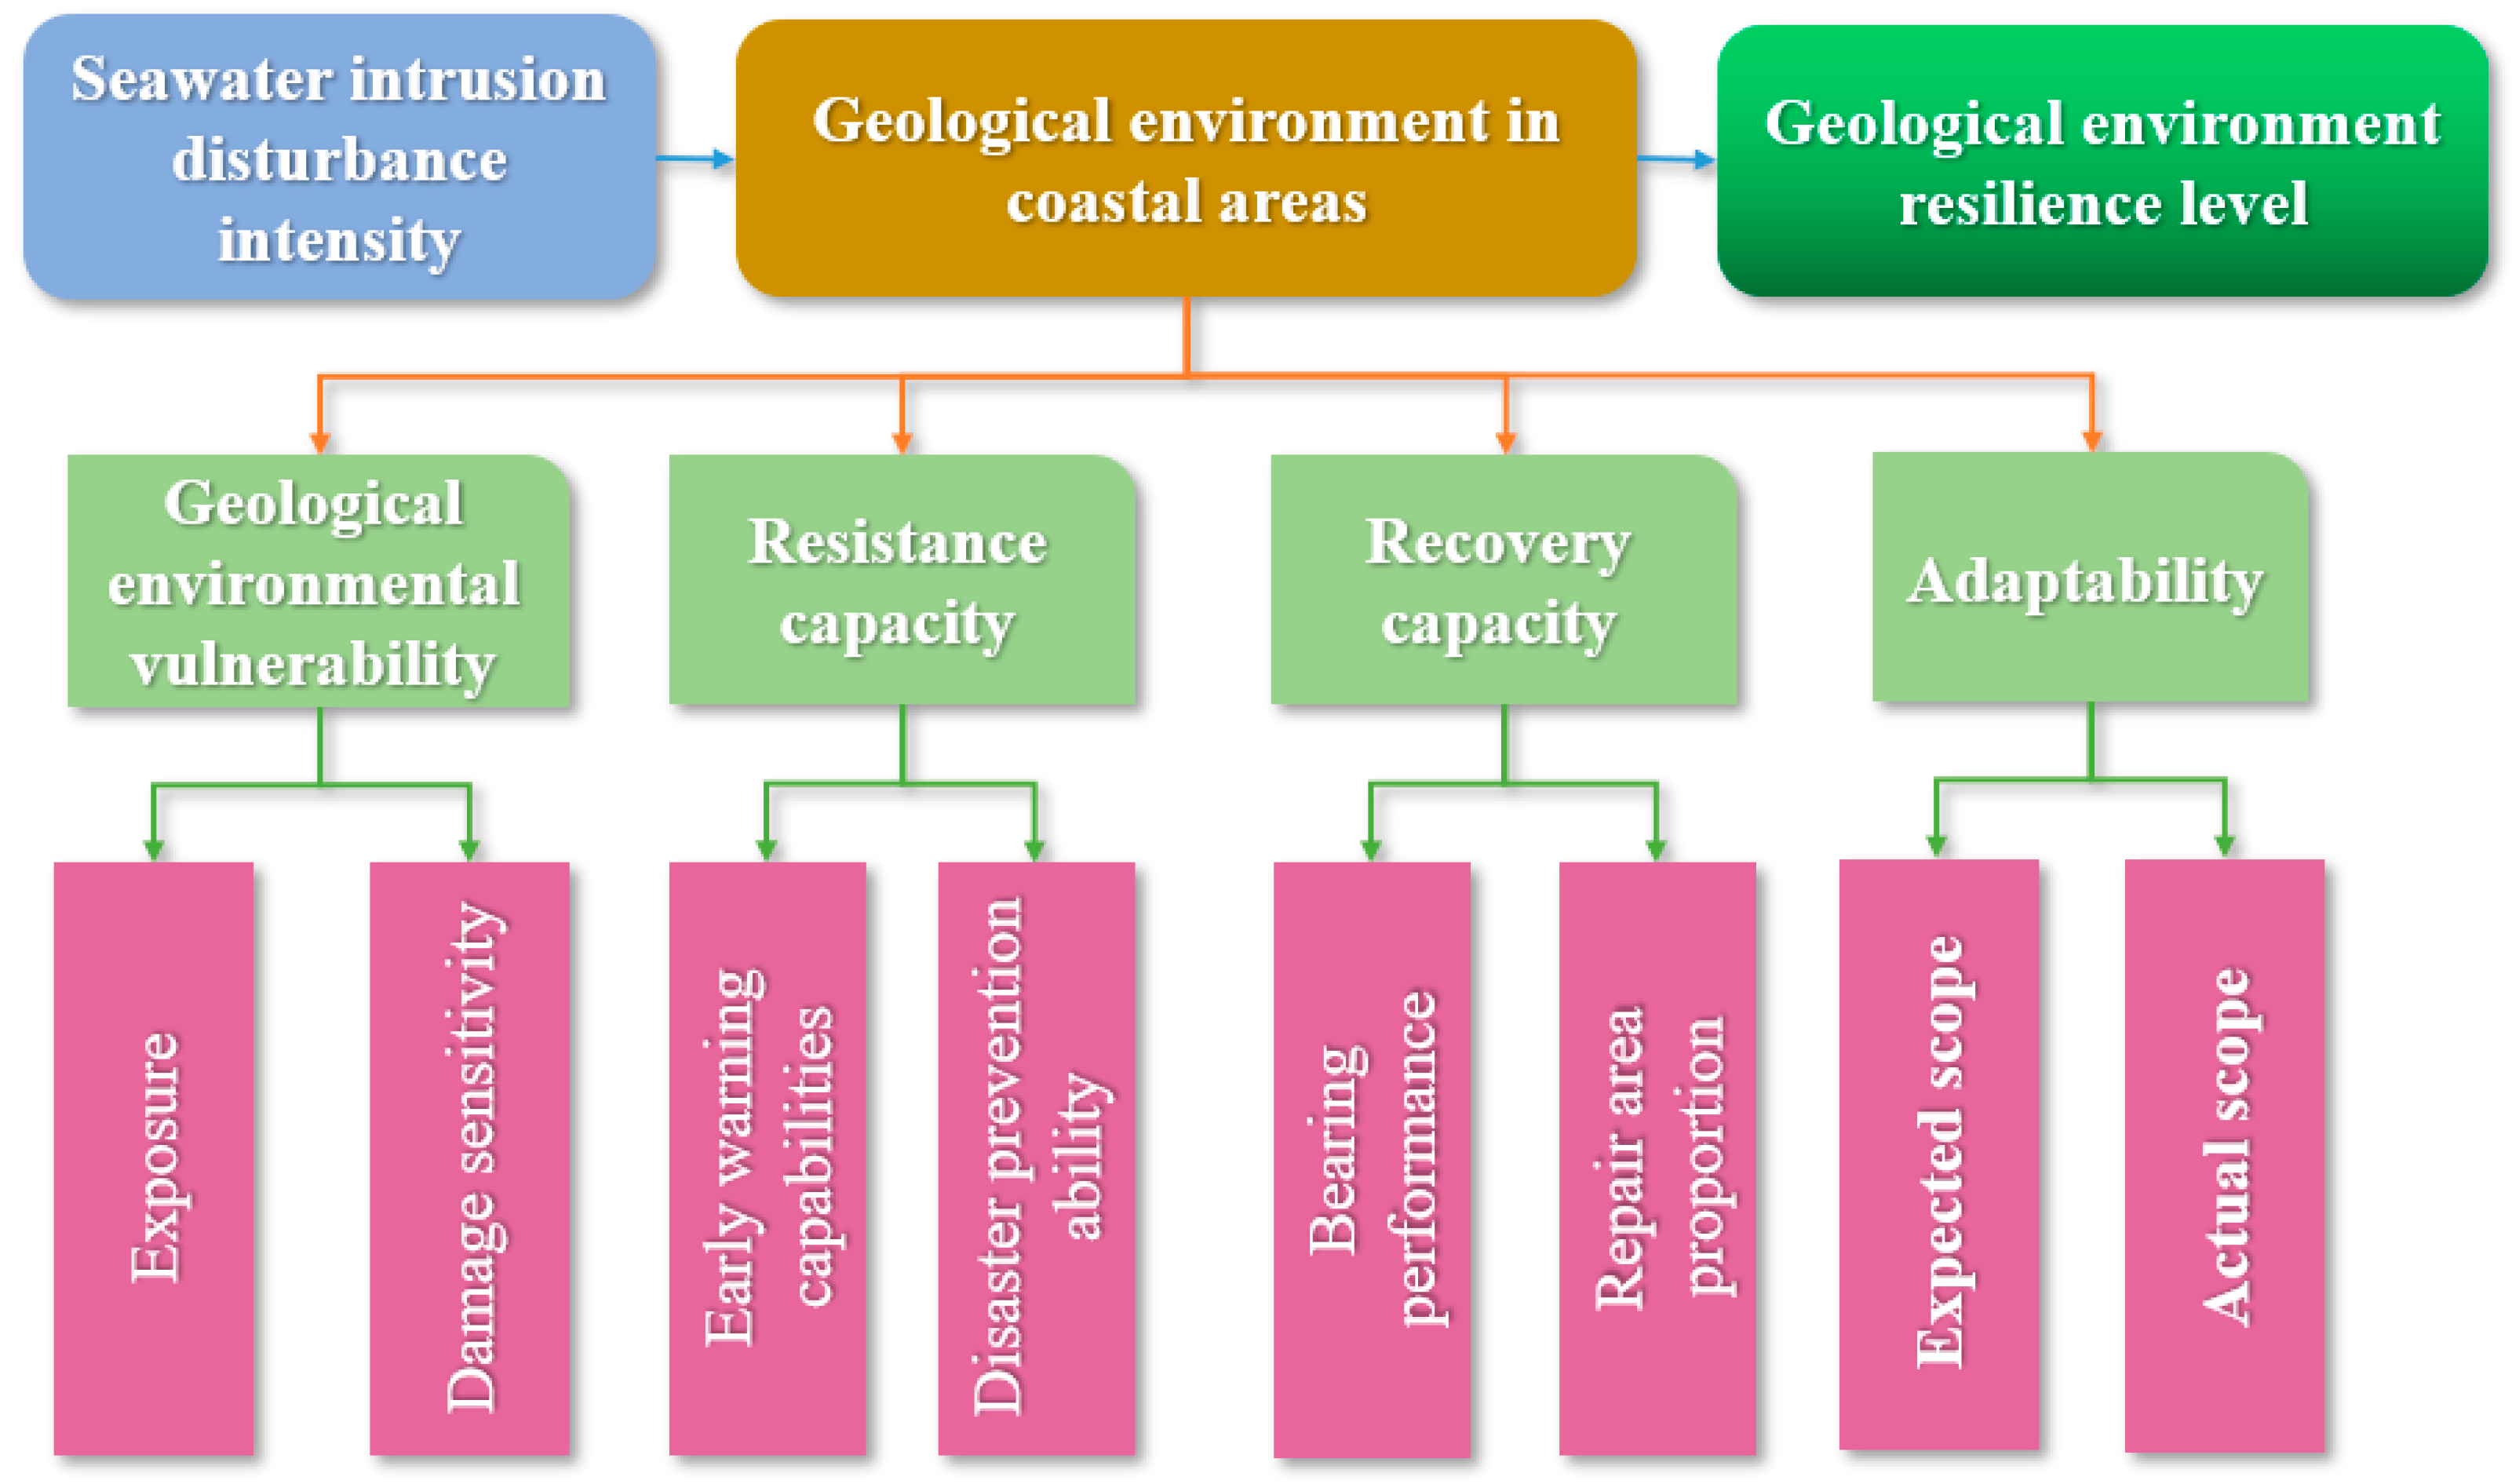
Numerous valuable insights are amassed in the analysis of the causes of seawater intrusion, the evaluation of its severity, and the formulation of prevention and control strategies. However, while there have been some achievements in the risk assessment of the geological environment caused by SWI, research on the geological environment resilience (GER) to SWI is not sufficiently explored, with most studies focusing on sensitivity and vulnerability analyses. Because Shenzhen is a coastal city, has a flat terrain and serious seawater erosion, is economically developed and densely populated, and has extensive use of underground space, studying this problem is of significance for protecting the underground space. Therefore, this study takes Shenzhen city as an example. Based on the three basic requirements of robustness, recoverability, and adaptability, we evaluate the geological environment resilience under the influence of SWI by assessing the disturbance factors, vulnerability, resistance capacity, recovery capacity, and adaptability. This study will help to better understand the impact of SWI on the geological environment in coastal areas and provide reference for the prevention and control of seawater intrusion and the protection of underground freshwater resources.

2. Study Area

2.1. Geographical Location

Shenzhen is in the southeastern part of Guangdong Province, China. It is situated on the eastern side of the Pearl River Estuary (Figure 1a). Shenzhen is narrow and elongated, with a wider width from east to west and a narrower width from north to south. It features diverse landforms, including low mountains, high and low hills, high and low plateaus, terraces, and plains. Shenzhen’s coastline is 260.5 km long, with 160.1 km being artificial and 100.4 km being natural. There are 11 watershed systems and 362 rivers with a basin area larger than 1 km2, primarily distributed in the central and eastern parts of the city; the specific hydrogeological situation is shown in Figure 1b. Shenzhen’s rivers display a rain-fed characteristic, where uneven rainfall distribution leads to a lack of sustained and effective water replenishment capacity for the rivers. Consequently, the carrying capacity of the water environment is low.

2.2. Climatic Conditions

Shenzhen has a subtropical monsoon climate, with a mild climate, abundant sunshine, and rainfall. The average annual precipitation is 1932.9 mm, and 86% of the annual rainfall occurs during the flood season (from April to September). The annual precipitation in all districts generally ranges from 1600 to 2500 mm, and the average precipitation in the whole city is 1995.3 mm. The precipitation is distributed with “more in the east and less in the west”. Yantian, Dapeng, and Pingshan have relatively large amounts of rainfall, basically above 2000 mm, while Guangming, most of Longhua, the northern part of Bao’an, and the northeastern part of Longgang have relatively small amounts of rainfall, below 1800 mm (Figure 2).

2.3. Geological Conditions

The hydrogeological conditions in the eastern and western regions of Shenzhen differ significantly due to variations in topography (Table 1). In the eastern region, characterized by low mountains and hills with intercalated alluvial and colluvial plains such as Xichong and Kuichong, the main aquifers consist of Quaternary unconsolidated rock pore water, bedrock fracture water, and karst water. The Quaternary unconsolidated rock pore water is present in gravel, sand, and silt layers within terraces and alluvial-floodplain deposits of the middle and lower river reaches, with a groundwater depth ranging from 0.36 to 4.00 m, primarily recharged by atmospheric precipitation. Bedrock fracture water occurs in exposed or shallowly buried bedrock areas, where weathering-induced fractures facilitate groundwater flow and storage, with depths from 1.3 to 9.5 m, also recharged by infiltration of atmospheric precipitation. Karst water exists within cavities and fractures of Carboniferous carbonate rocks, particularly in the upper and middle sections of the Kuichong river valley plain, at depths of 8.0 to 12.90 m, covered by low-permeability silty clay layers, with a groundwater depth of 4.0 to 6.0 m and pressurized characteristics, mainly replenished by Quaternary unconsolidated rock pore water, especially when overlying sand or gravel layers are present.
In contrast, the western region has a relatively flat topography, with groundwater systems comprising Quaternary unconsolidated rock pore water, bedrock fracture water, and fill area pore water. The Quaternary unconsolidated rock pore water is widely distributed in gravel, coarse sand, and gravel layers of terraces, alluvial-floodplain, and marine deposits in the middle and lower river reaches, with groundwater depths ranging from 1.6 to 6.2 m, primarily recharged by atmospheric precipitation infiltration. Bedrock fracture water is found in exposed or shallowly buried granite areas, influenced by weathering, with groundwater depths from 1.2 to 11.5 m, also recharged by atmospheric rainfall infiltration. Fill area pore water, resulting from land reclamation projects, consists of two layers: an upper layer of highly permeable fill materials (such as mud, boulders, and gravel) that readily accepts atmospheric precipitation to form phreatic water and a lower layer of original seabed strata containing seawater that was not fully drained during the reclamation process.

3. Data and Methods

3.1. Data

The data sources of this article include groundwater detection data and hydro-geological and engineering-geological conditions in the geological survey reports of actual buildings or subway projects. These data are distributed at different locations in the Shenzhen coastal area and can reflect the changes in the groundwater level in this area as well as the characteristics of the stratum structure and geological structure. Meanwhile, this article also obtains the rainfall data of different years from meteorological monitoring data, which are helpful for analyzing the relationship between seawater intrusion and rainfall. In addition, this article also cites the data on the area changes in seawater intrusion in different years from reference documents. These data can help us understand the development trend and scale of seawater intrusion. Finally, this article also refers to the early-warning and emergency measures on the government official websites. These measures and policies can provide us with effective methods and means to deal with seawater intrusion and serve as the basis for calculating the resistance index of geological environment resilience.

3.2. Geological Environment Resilience Assessment Steps

The GER assessment under SWI hazards is accomplished through the following steps. First, the disturbance factors related to SWI are explored to understand their influence on the geological environment. Subsequently, a geological vulnerability analysis in the coastal zones is performed to assess the level of hazard risk. Furthermore, an assessment of the existing hazard prevention systems is conducted, and the potential effectiveness of unimplemented hazard mitigation measures is deduced to determine the resistance capacity of the affected areas. A quantitative assessment of the effectiveness of mitigation efforts is conducted to ascertain the recovery capacity of the affected areas. Additionally, an analysis of adaptability to SWI geological hazards is conducted. Lastly, a comprehensive assessment of the GER level under the influence of SWI hazards is performed to understand their resistance and recovery capabilities. Figure 3 shows the specific assessment process.

3.3. Methods for Geological Environment Resilience Assessment

GER refers to the dynamic assessment of the ability of the geological environment to maintain or restore its carrying capacity under the influence of natural hazards and underground engineering activities. It reflects the dynamic carrying capacity of the geological environment during hazards, resistance, and recovery and examines the characteristics of GER from various aspects, such as natural geology, social conditions, and hazard impacts. By assessing robustness, recoverability, adaptability, and other resilience attributes, GER can provide macrolevel predictions for the post-hazard evolution of the geological environment.
This study focuses on SWI as the research subject and is based on three fundamental requirements: robustness, recoverability, and adaptability. By analyzing the factors influencing GER, this study selects disturbance intensity, geological environmental vulnerability, resistance capacity, recovery capacity, and adaptability as GER indicators. Following the principles of scientificity, systematicity, operability, and a combination of qualitative and quantitative approaches [29,30], eight assessment indicators corresponding to the GER indicators are selected. Based on this, a GER-level assessment indicator system is established (Figure 4).

3.3.1. Disturbance Intensity

Disturbance intensity refers to the degree of impact of disturbance factors on the geological environment. Different disturbance factors have different effects and impacts on the geological environment, resulting in varying disturbance intensities and effects on geological hazards. Disturbance intensity assessment should select appropriate indicators based on the causes of geological hazards. The weight determination can be conducted using the AHP or entropy weighting method [31]. The magnitude of disturbance intensity is divided and scored. Disturbance intensity is calculated by multiplying the weights and scores. The specific calculation method is shown in Formula (1),
D = i = 1 N w D , i · e D , i ,
where D represents the disturbance intensity, N represents the total number of disturbance indicators involved, w D , k represents the weight of the ith indicator, and e D , k represents the evaluation score of the ith indicator.

3.3.2. Geological Environment Vulnerability

Vulnerability is reflected in the exposure to danger (disturbance and pressure) and the sensitivity and resilience of systems that have experienced such dangers [32]. Geological environment vulnerability refers to the expected degree of loss caused by geological hazards under the action of disturbance factors on the geological environment. Assessing geological environment vulnerability requires analyzing the exposure characteristics and hazard sensitivities of different geological hazards to the geological environment and establishing an assessment indicator system. The geological environment vulnerability assessment must select appropriate evaluation indicators based on the actual impact of geological hazards and adopt the AHP method to calculate the weights of indicators and vulnerability grading [33]. The results of exposure and hazard damage sensitivity vulnerability are equal to the product of their corresponding weights and scores, respectively. The geological environmental vulnerability result is equal to the product of exposure and hazard damage sensitivity. The assessment can be conducted using Formulas (2)–(4):
V = E · M ,
E = i = 1 N w E , i · e E , i , and
M = k = 1 L w M , k · e M , k ,
where V is the geological environment vulnerability, E is the exposure of the geological environment, M represents the hazard sensitivity of the geological environment, N is the total number of assessment indicators for the exposure of the geological environment, and L represents the total number of assessment indicators for the hazard sensitivity of the geological environment. w E , i is the weight of the ith exposure indicator, e E , i is the assessment score of the ith exposure indicator, w M , k is the weight of the kth hazard sensitivity indicator, and e M , k is the assessment score of the kth hazard sensitivity indicator.

3.3.3. Resistance Capacity

The ability of a city to resist natural hazards, including SWI, is related to its economic foundation, hazard prevention equipment, and response speed [34]. Therefore, the resistance capacity to SWI includes early warning and hazard prevention capabilities. Based on the characteristics of urban early warning and hazard prevention capabilities for geological hazards, a corresponding evaluation indicator system is established (Figure 5). The early warning capability is determined by the coverage rate of monitoring facilities and the accuracy of early warnings, generally taking the minimum value of the two. The hazard prevention capability is determined by investment, hazard prevention technology, and hazard response efficiency, and the hazard prevention capability is calculated using the AHP method. To highlight the importance of early warning capability and reduce the variability of the calculation results, the result of the early warning capability is multiplied by the natural logarithm exponent and the hazard prevention capability result, giving the calculation result of the resistance capacity, as shown in Formula (5):
B = P b · e W b ,
where B is the resistance capacity, P b is the hazard prevention capability, and W b is the early warning capability.

3.3.4. Recovery Capacity

Resilience refers to the ability to restore the original state after a hazard occurs. For example, urban resilience to flooding is measured by the rate of rainwater infiltration and the drainage capacity [35]. The resilience to SWI hazards is measured by the extent of restoration of the affected area. The restoration effect enhances the carrying capacity of the geological environment, reduces its vulnerability, and strengthens its ability to withstand hazards. Recovery capacity is primarily measured by the ratio of the restored area to the affected area. The proportion of the restored area to the affected area is calculated as the natural logarithm exponent in recovery capacity measurement. The specific formula is shown in Formula (6):
R = exp ( V 1 V 2 ) ,
where R is the recovery capacity; V1 is the area of the repaired SWI damage, measured in area; and V2 is the extent of the geological environment affected by SWI, measured in area.

3.3.5. Adaptability

The hazard impact range of adaptability includes the expected and actual impact ranges. The expected impact range refers to the ability to implement corresponding prevention and control measures based on the summary of historical hazards and to control the impact range of hazards within the expected range during the planning period to minimize the impact of hazards on the geological environment. The actual impact range reflects the actual governance effect of prevention and control measures. The magnitude of adaptability is determined by the ratio of the time integral of the expected impact range to the time integral of the actual impact range, as shown in Formula (7):
ln A = t 0 t 1 H P t d t t 0 t 1 H t d t ,
where A represents adaptability, Hp(t) is the attenuation function of the expected impact range during the planning period, H(t) is the actual impact range function during the planning period, t0 is the initial calculation time set as t0 = 0 from the beginning of the planning period, and t1 is the end time of the calculation.
After governance, the extent of SWI follows an exponential decay formula. The expected range is determined by the product of the affected area and the attenuation function (Formula (8)). The attenuation coefficient is determined by the expected area, actual area, and governance time (Formula (9)).
H P t = H 0 e k t , and
k = 1 t 1 t 0 ln H H 0 ,
where H0 is the maximum impact range of SWI during the planning period, k is the coefficient for the expected attenuation effect of the impact range during the planning period, H′ is the expected impact range of the hazards at time t1, and the impact range is measured in terms of the SWI area.

3.4. GER Assessment Formula

To comprehensively consider the positive and negative impacts of the five factors on the GER level and the relationship between urban resilience and the components of the urban system, this study applies the multifactor comprehensive assessment model of urban resilience [36,37,38] to construct a mathematical model for assessing the GER level. The mathematical expression of the model is shown in Formula (10):
G E R = ln R · B · A ln D · V
where GER is the GER level, D is the disturbance intensity, V is the geological environment vulnerability, R is the recovery capacity, B is the resistance capacity, A is the adaptability capacity, and all indicators are dimensionless.

4. Results

4.1. Disturbance Intensity

Studies have shown a negative correlation between the degree of SWI and rainfall [24], indicating that sufficient rainfall could reduce the degree of SWI. Based on the disturbance intensity of SWI related to rainfall and its impact on the dynamic balance between saline and freshwater in Shenzhen’s coastal areas, the rainfall was categorized into five levels of disturbance intensity (Table 2). The rainfall conditions from 2019 to 2022 were assessed according to Table 1. The disturbance intensity distribution during this period was obtained (Figure 6) based on the characteristics of the disturbance intensity related to SWI and its impact on the dynamic balance between saline and freshwater in Shenzhen’s coastal areas. The disturbance intensity of SWI in Shenzhen City exhibits a pattern of being higher in the eastern part, lower in the western part, and moderate in the central part. From 2019 to 2020, the area with high disturbance intensity gradually increased, and the disturbance intensity increased. However, from 2020 to 2022, the area with high disturbance intensity gradually decreased, and the disturbance intensity decreased. In summary, the western part of the city consistently maintained a higher disturbance intensity than the eastern and central parts.

4.2. Geological Environment Vulnerability

4.2.1. Exposure

The impact range of SWI includes coastal areas, downstream areas of rivers, and adjacent lands. In coastal areas like coastal plains without significant barriers to prevent seawater infiltration, the influence of seawater can extend up to 2.5 km from the coastline. If SWI affects rivers, the impact of seawater on riverbanks can extend up to 1.5 km from the riverbank. Therefore, the coastal and riverside areas are divided, and the exposed regions are determined using a boundary of 2.5 km from the coastline. A dividing line of 500 m is used, and the exposure assessment is the quantitatively assigned values based on Table 3. Geological environment vulnerability is calculated using Formula (3) and presented in Figure 7. The exposed area of SWI in Shenzhen is 500.16 km2, accounting for 25% of Shenzhen’s total area. Overall, Shenzhen’s coastal and riverside areas are severely exposed, affecting a significant proportion.

4.2.2. Damage Sensitivity

The shallower the burial depth of the bedrock is, the more susceptible it is to SWI [39]. Based on the distribution of the bedrock burial depth in different areas of Shenzhen and the grading criteria in Table 4, a sensitivity assessment of geological environmental hazard damage was conducted for the coastal zone. The sensitivity values were calculated using Formula (4), and the assessment results are shown in Figure 8. The proportion of geological environmental vulnerability levels classified as “high” and “very high” is significant in the Bao’an, Nanshan, and Futian districts in Shenzhen’s western region. However, the proportion of vulnerability levels classified as “low” and “very low” is higher in the eastern region. Some areas fall into moderate-to-high-vulnerability levels.

4.2.3. Vulnerability

The vulnerability results are obtained by integrating the exposure and hazard damage sensitivity results. Before the calculations, the study area was divided into a grid by dividing Shenzhen’s coastal areas into rectangular regions with dimensions of 100 m × 100 m, and 53,583 calculation units were divided. According to Formula (2), the vulnerability of the geological environment was calculated for each calculation unit. The results are shown in Figure 8. Considering the hydrogeological characteristics of Shenzhen’s coastal areas, the vulnerability of SWI is classified into five levels (Table 5). According to the vulnerability assessment results (Figure 9), the distribution of geological environmental vulnerability in Shenzhen’s coastal areas is uneven. The brown-red areas indicate the highest vulnerability, concentrated in Shenzhen’s western coastal region. The light green areas represent moderate vulnerability and are primarily distributed in the eastern coastal area. The dark blue areas have lower vulnerability and are primarily found in the eastern coastal area, far from the coastline in the west, and the southern region.

4.3. Resistance Capacity

Table 6 shows the calculated resistance level. The resistance level is B = 10.07. In the past decade, Shenzhen has attached great importance to preventing and controlling seawater intrusion disasters. It has improved the prevention and control effects of seawater intrusion disasters in many aspects. For example, it improves the groundwater seepage conditions in newly reclaimed areas by improving the filling materials in the reclamation areas; it also comprehensively monitors the inland rivers and the groundwater in the coastal areas; by standardizing sewage discharge measures and monitoring means, it prevents unpurified domestic sewage or industrial wastewater from being discharged into rivers and groundwater, reducing the accuracy of hydrological monitoring; by building embankments at the estuaries to block seawater seepage and by building interception and regulation ponds along the riverbanks and constructing groundwater cut-off walls and other measures, it separates fresh water from salt water and improves the resistance to seawater intrusion.

4.4. Recovery Capacity

According to Formula (6), the recovery capacity value is 1.49. Shenzhen has taken resistance measures such as building interception and regulation ponds and embankments; the coastal areas have acquired a certain resistance ability to seawater intrusion disasters caused by storm surges. By taking restoration measures such as surface rainwater recharge to replenish groundwater, it can not only maintain a relatively high underground freshwater level, prevent seawater from intruding into the groundwater when the freshwater level is low, and push the salt-fresh water interface towards the riverbanks and seashores but also dilute the residual salt of seawater in the soil and groundwater so as to achieve the purpose of “washing away salinity”. By implementing recovery techniques, the geological environment can be restored to its original state in a short period or exhibit better carrying capacity, effectively reducing the vulnerability of the geological environment, enhancing its recovery capacity against hazards, and improving overall stability. Taking Shenzhen’s western coastal area as an example (416 km2), the SWI area in 2005 was 332 km2. After 15 years of management and prevention measures, by 2020, the SWI area decreased to 199 km2, with a restoration area of 133 km2 [40].

4.5. Adaptability

Adaptability refers to the ability demonstrated after historical hazards that is reflected in people summarizing past hazard experiences and improving the environment. It involves continuously enhancing the carrying capacity and GER to prevent the recurrence of hazards or reduce their impact on the geological environment. Based on the disturbance intensity, vulnerability, resistance, and recovery capacity analyses, it is assumed that 20% of the land–sea SWI area will be restored within 15 years, resulting in an attenuation coefficient k of 0.0149. Due to the severity of land–sea SWI in Shenzhen’s western coastal areas, refer to (Table 7) for specific land–sea SWI conditions. By analyzing the adaptability of Shenzhen’s western coastal areas, we can represent the adaptability of land–sea SWI management. Taking 2005 as the starting point (i.e., t = 0), in 2005 (t0), the land–sea SWI area was 332 km2, and in 2020 (t = 1), it was 199 km2.
According to Formulas (8)–(10) and the information provided in Table 6, the adaptability for 2019–2022 is calculated. As time progresses, the adaptability to SWI continues to strengthen, increasing from 3.03 in 2019 to 3.13 in 2022, indicating that over the past few years, effective measures have been implemented to enhance the geological environment’s capacity to adapt to SWI hazards.

4.6. Geological Environmental Resilience

The classification of the corresponding GER levels is presented in Table 8. The very low level reflects extreme vulnerability and minimal resistance, resulting in SWI, even with slight disturbances, making subsequent management and recovery efforts challenging. The low level indicates elevated vulnerability and lower resistance, increasing the likelihood of SWI and posing difficulties in prevention and recovery. The medium level represents moderate resilience, presenting balanced vulnerability and resistance, reducing the occurrence of SWI under external disturbances, with moderate difficulty in prevention and recovery. The high level indicates greater resilience, with low vulnerability and higher resistance, making SWI less probable, resulting in easier prevention and recovery. The very high level demonstrates exceptional resilience, minimal vulnerability, and superior resistance, minimizing the risk of SWI, even under significant disturbances, and showcasing strong mitigation capabilities.
From 2019 to 2022, the GER in Shenzhen’s western coastal areas remained at a low–low level, whereas the northwestern areas further from the coast had a medium resilience level (Figure 10). The central areas had a resilience level from high to very high and showed little annual variation. The resilience level in the eastern areas exhibited significant annual fluctuations. In 2019, the resilience level was mainly high, with some areas at moderate to low levels. In 2020 and 2021, the resilience level continued to decline, with a significant proportion of areas at low and medium. By 2022, the resilience level in the eastern areas had continuously improved.

5. Discussion

5.1. Disturbance Intensity

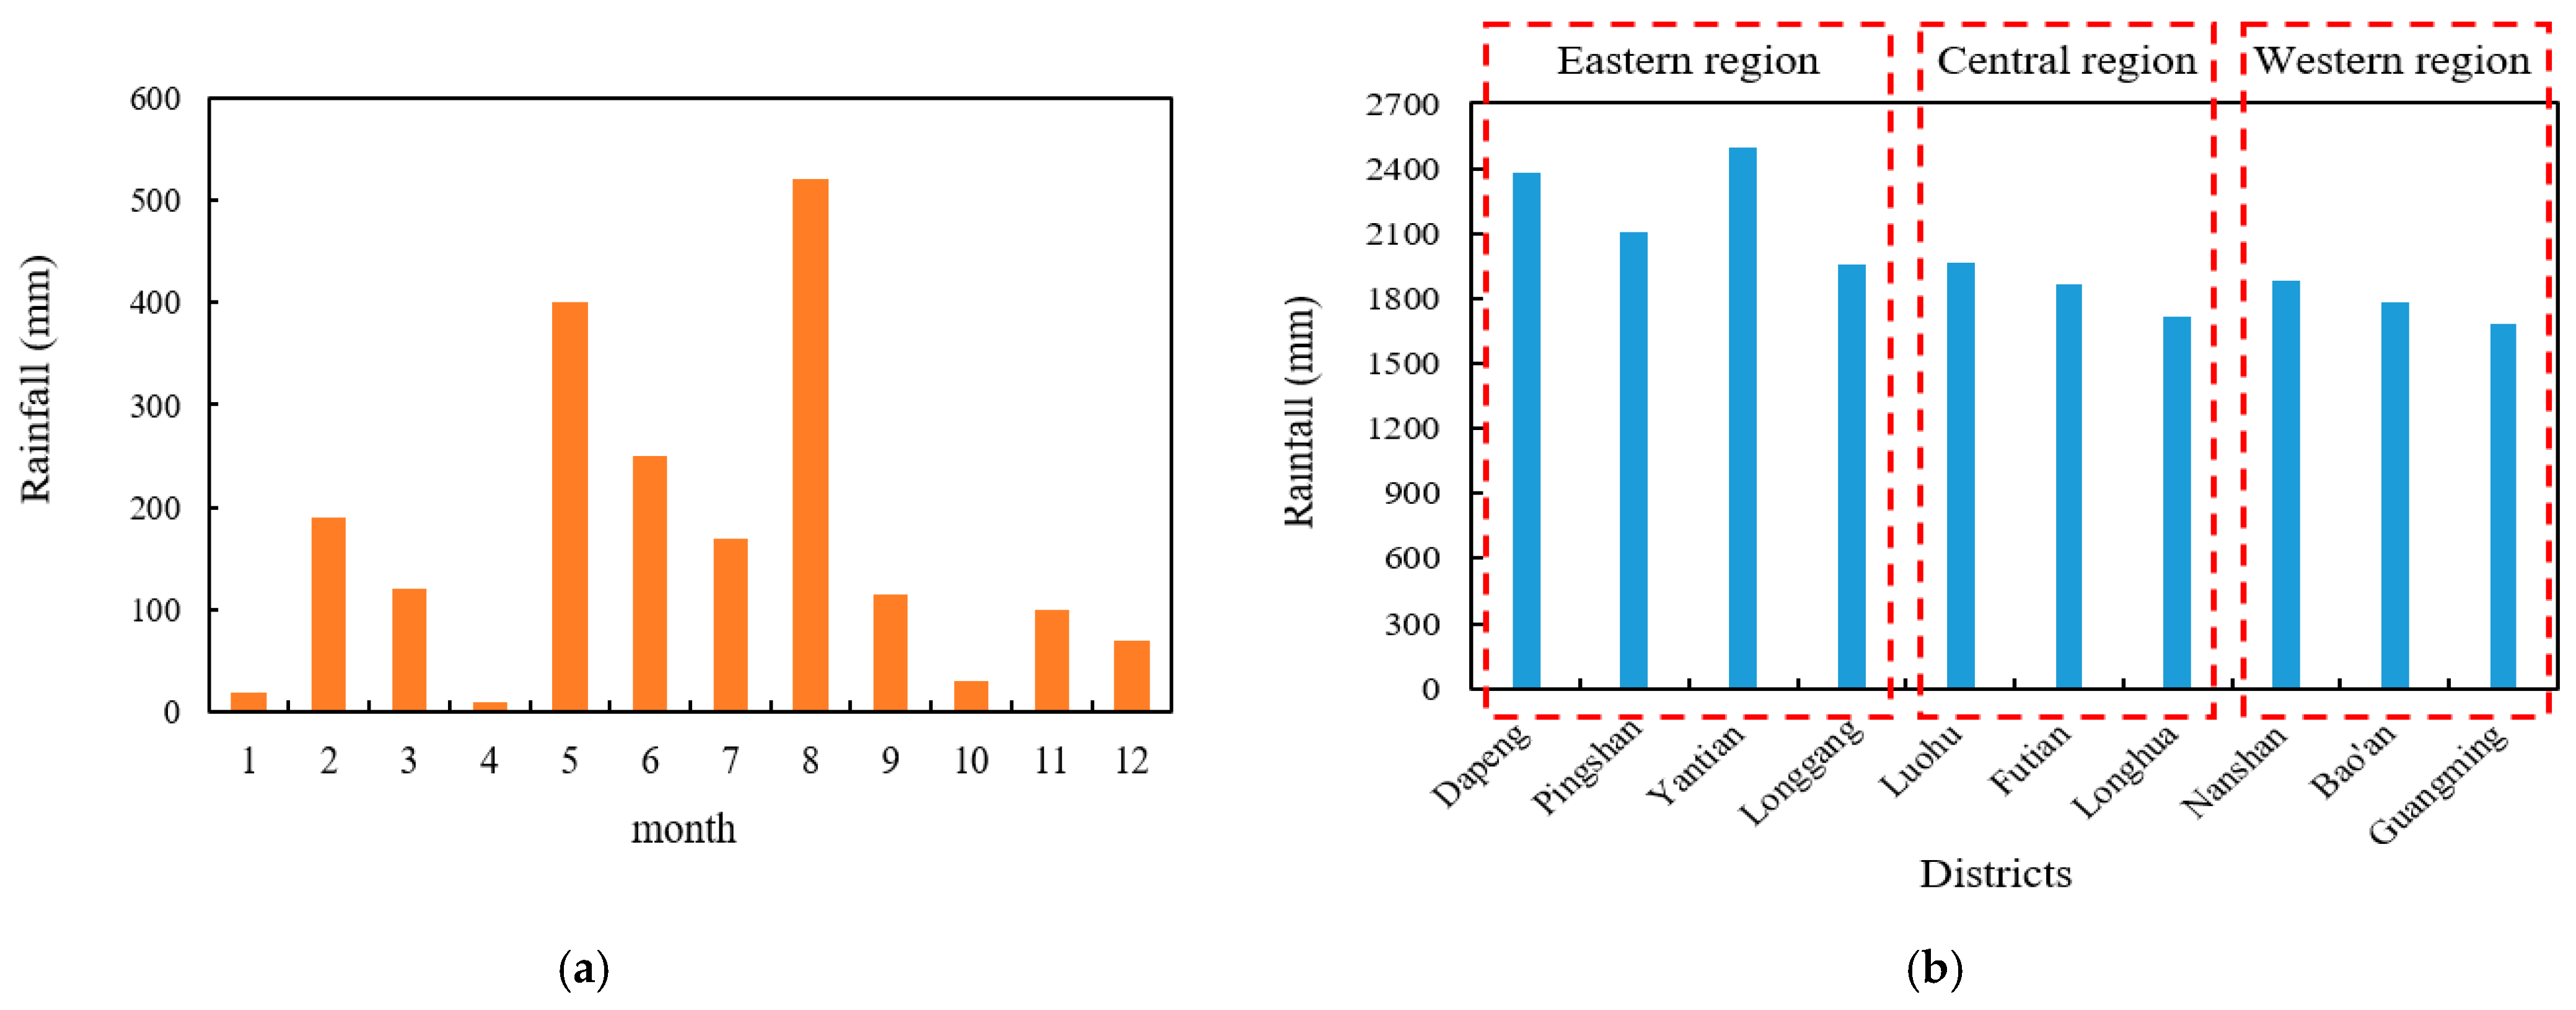
According to climate bulletins for Shenzhen from 2019 to 2022 and the annual distribution of rainfall (Figure 11), the western coastal area experienced a sharp decrease in precipitation in 2020 and 2021, leading to insufficient groundwater replenishment and the migration of the salt–freshwater interface toward the freshwater area, making it easier for seawater to intrude into the land. Therefore, the disturbance intensity in this area was high to relatively high. However, the disturbance intensity in the eastern coastal area was moderate to moderately high. In 2019 and 2022, there was sufficient rainfall, especially in 2022, which resulted in the disturbance intensity of SWI in the western coastal area being moderate, whereas the disturbance intensity in the eastern coastal area was low because sufficient rainfall can replenish freshwater and push the salt–freshwater interface toward the seawater area, reducing the degree of SWI.
The freshwater area will be invaded by seawater while the salt–freshwater interface in underground water moves toward the freshwater area. Conversely, when the interface moves toward the seawater area, it indicates that the freshwater resource has been replenished. Many natural and human factors can affect the salt–freshwater interface in underground water and the occurrence of SWI. Natural factors include storm surges, seawater upstream along river channels, and global-warming-induced sea-level rise. Human activities include groundwater extraction, high-altitude seawater aquaculture, and the construction of reservoirs upstream of rivers. In the 1980s to 1990s, due to the need for economic development, blind groundwater extraction in Shenzhen caused a drop in water levels and high-altitude seawater aquaculture, leading to severe SWI. After entering the 21st century, in order to protect the environment and promote high-quality economic development, measures such as prohibiting groundwater exploitation, transforming the water intake channels and aquaculture areas of high-altitude mariculture into anti-seepage channels and ponds, and carrying out seawater desalination and salt removal work have, to a certain extent, protected the freshwater resources of groundwater. The infiltration of atmospheric precipitation replenishes underground freshwater, promotes the movement of the salt–freshwater interface toward the seawater area, and prevents SWI.
Therefore, this article concludes that groundwater extraction and high-altitude seawater aquaculture are no longer the primary disturbing factors causing SWI in Shenzhen’s coastal areas. On the contrary, atmospheric precipitation is a natural disturbing factor that causes SWI in Shenzhen’s geological environment and can be a crucial measure to prevent SWI.

5.2. Geological Environment Vulnerability

5.2.1. Exposure

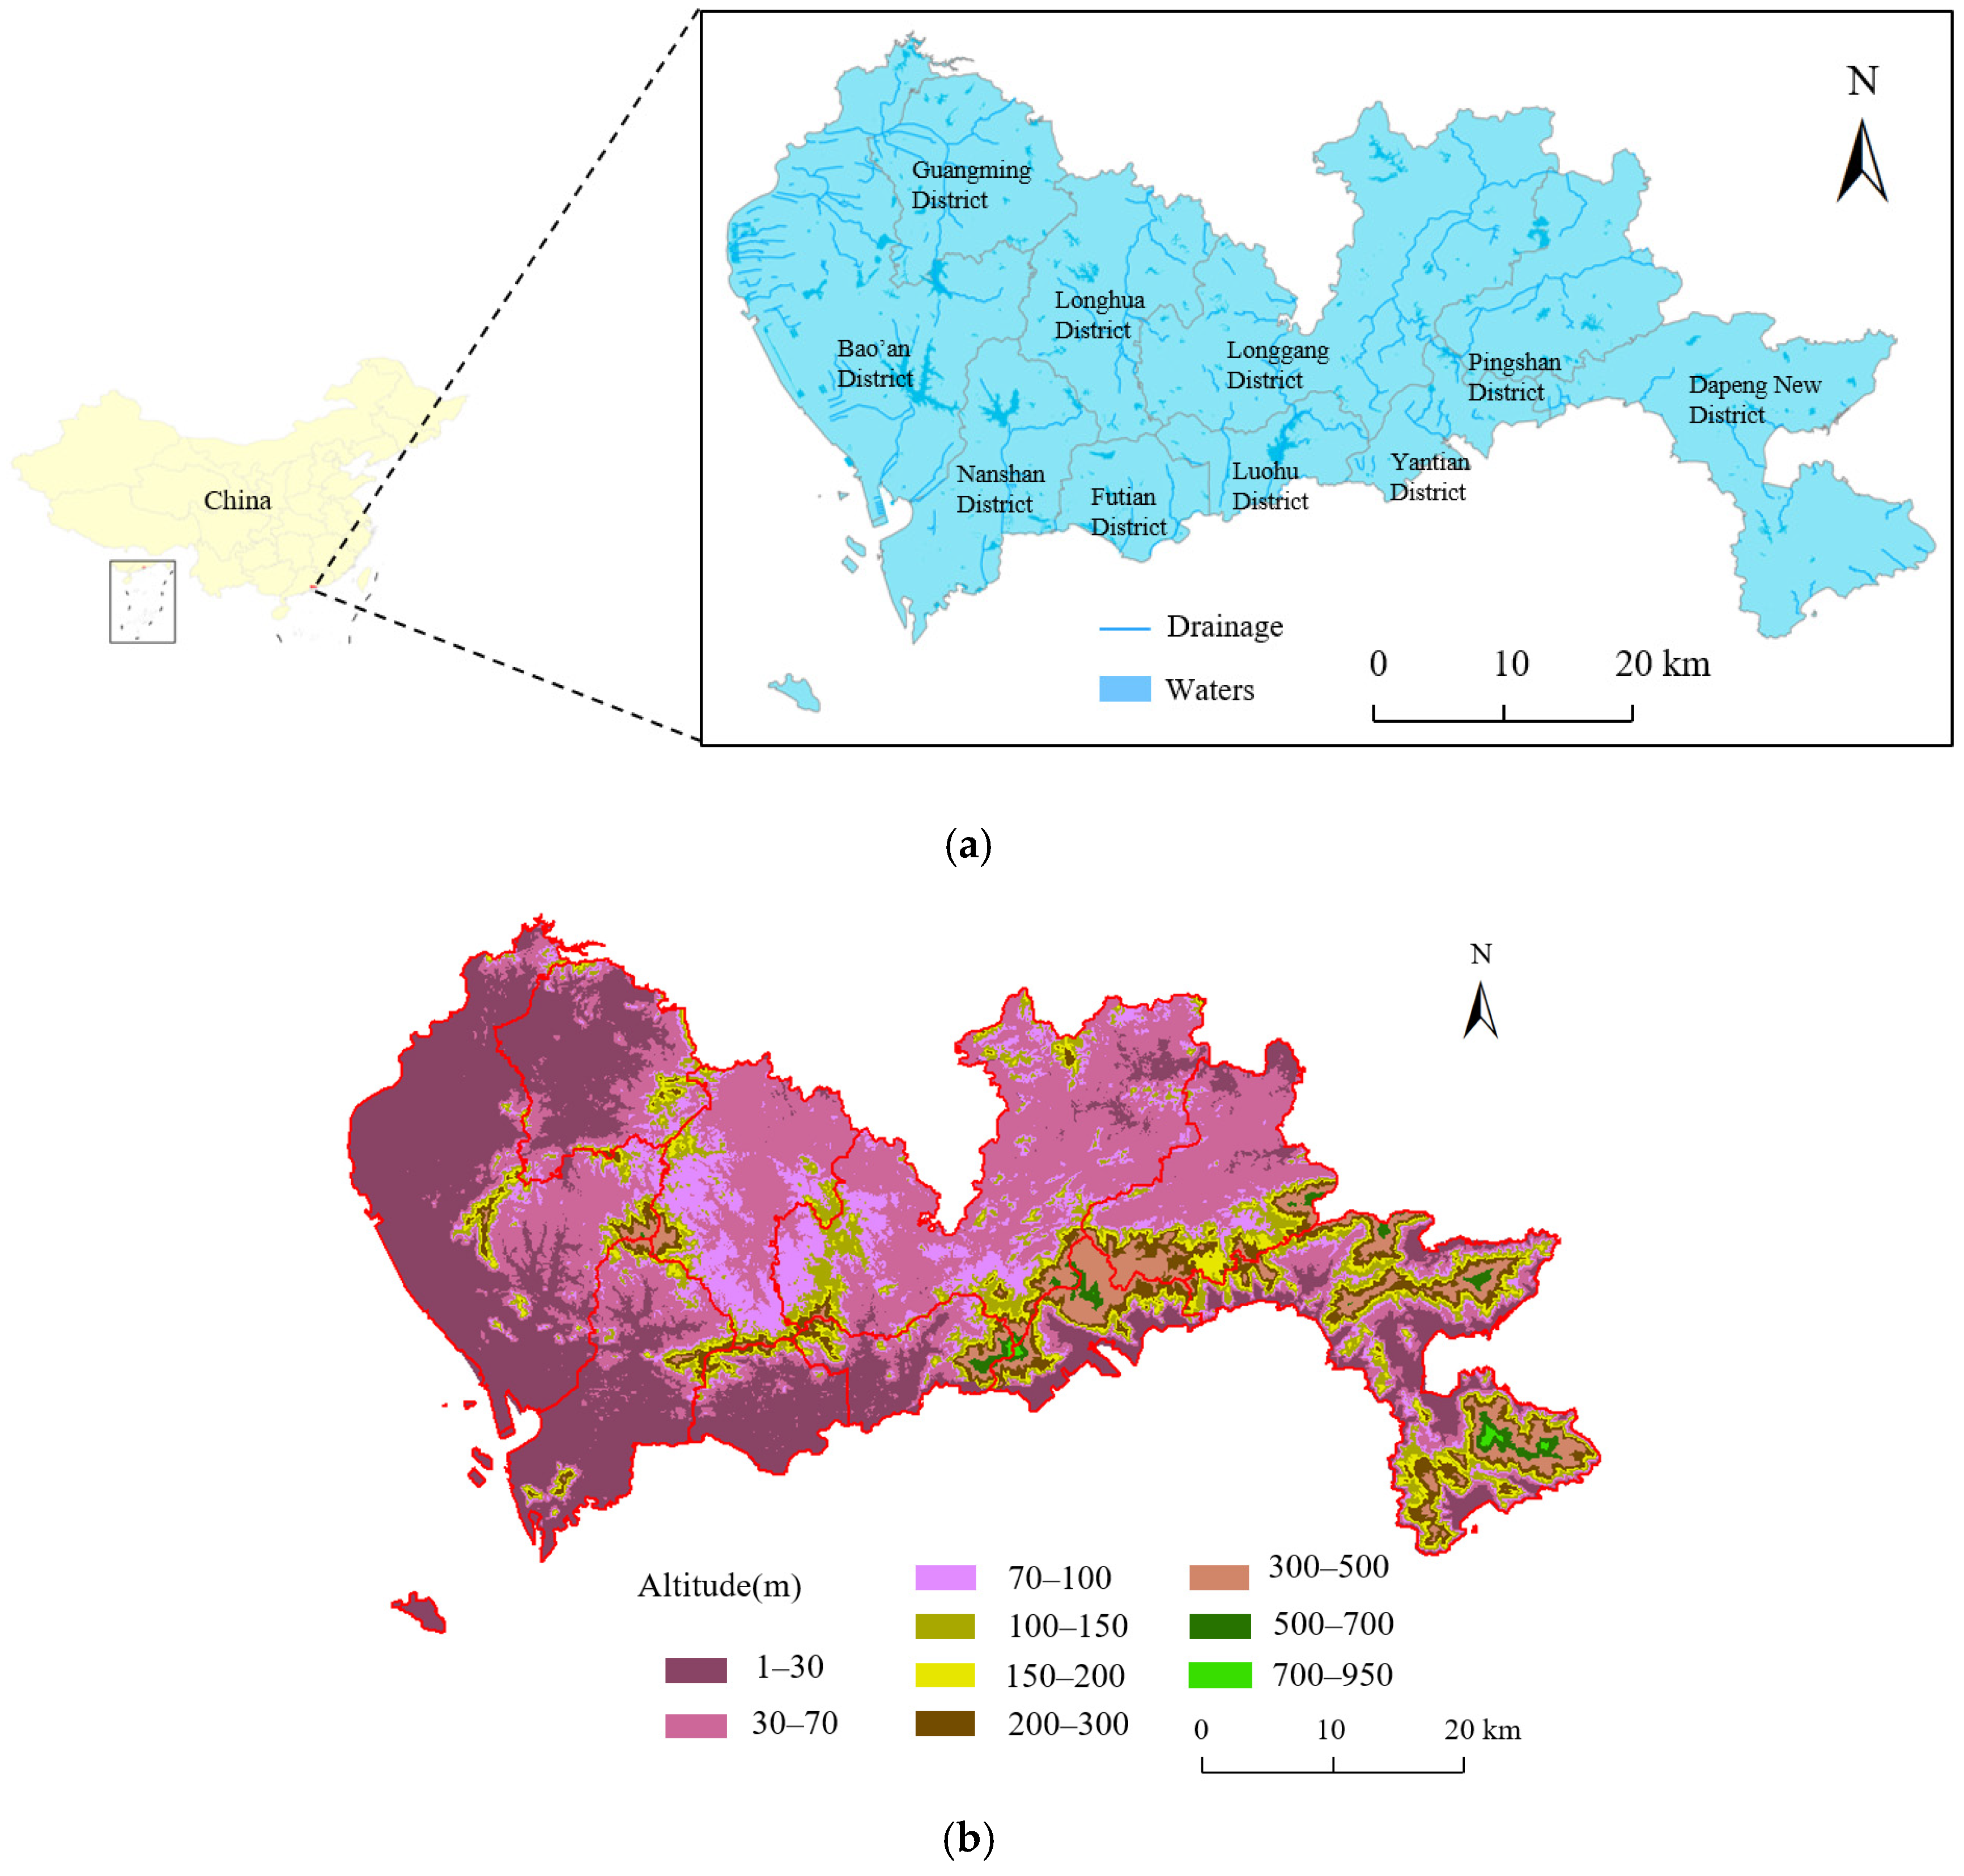
The exposed area of SWI in Shenzhen is concentrated in the western coastal areas, in the estuary region of the Pearl River. The topography is characterized by coastal plains primarily comprising marine sediments, such as silty clay and sandy soil. It is prone to SWI and is currently experiencing significant effects from SWI. Therefore, it is necessary to strengthen monitoring and management, implement measures to protect and regulate freshwater resources, mitigate the negative impacts of SWI on the local environment and ecology, and promote sustainable development in the coastal and riverside areas.

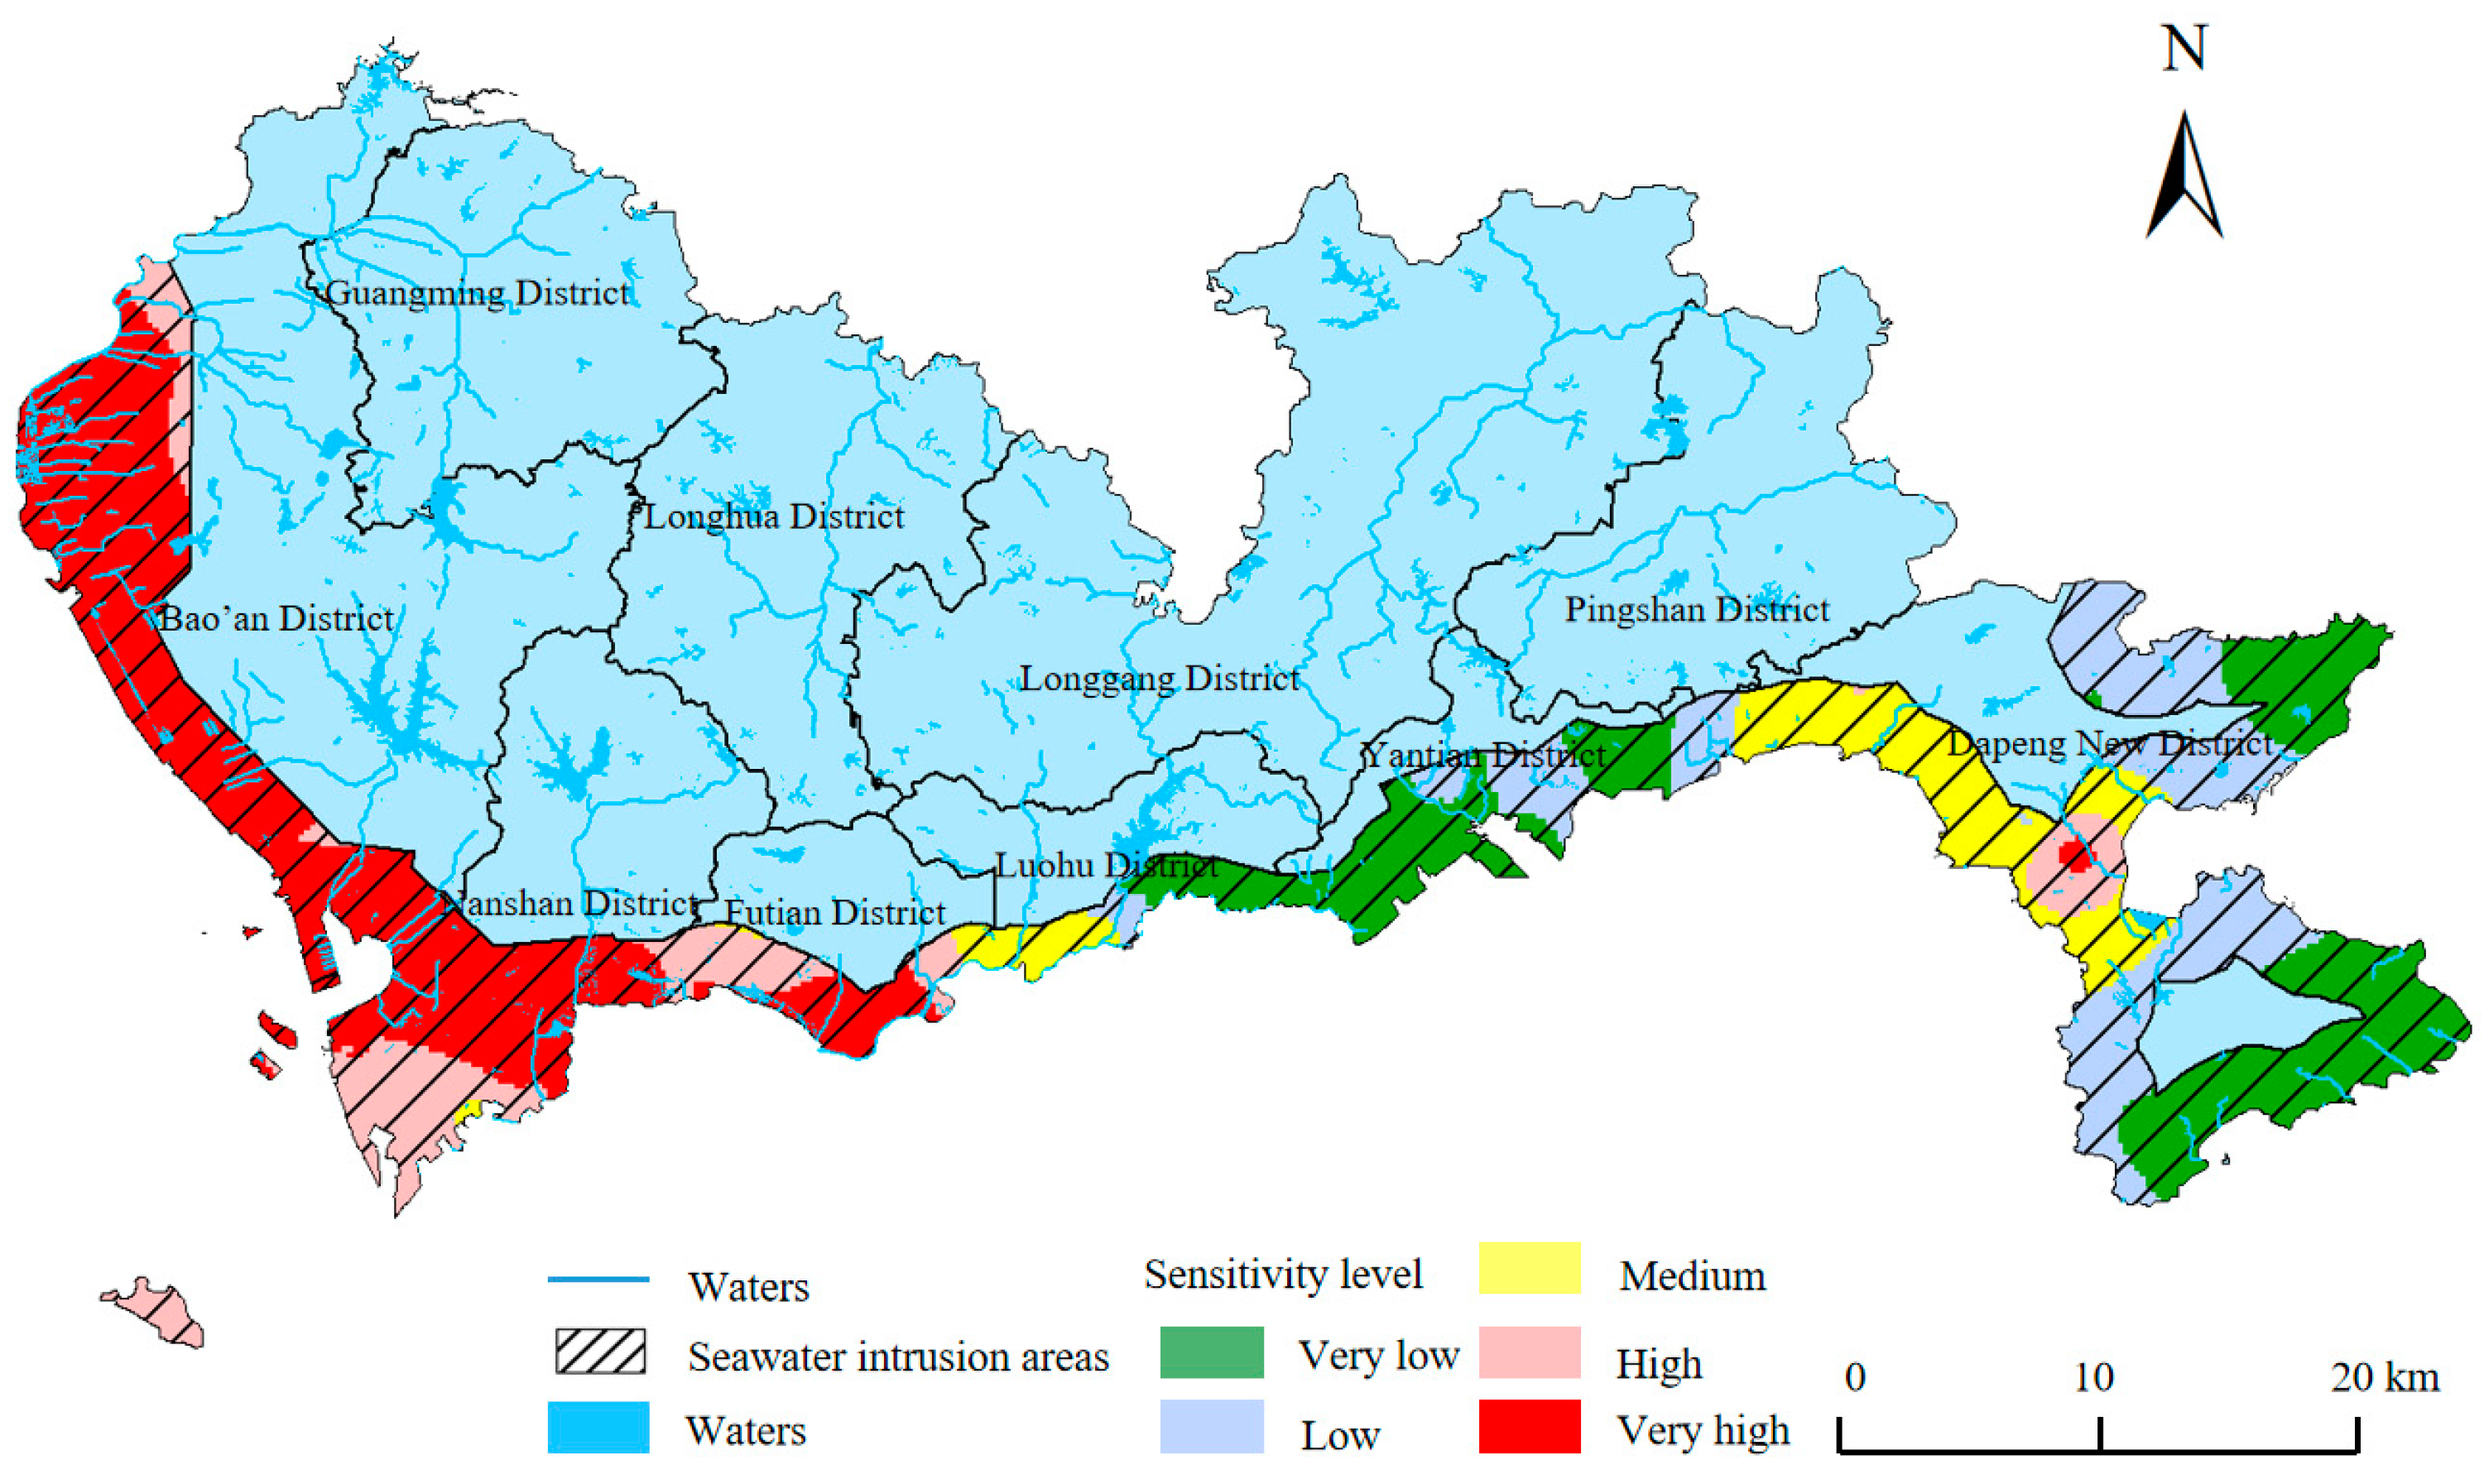
5.2.2. Damage Sensitivity

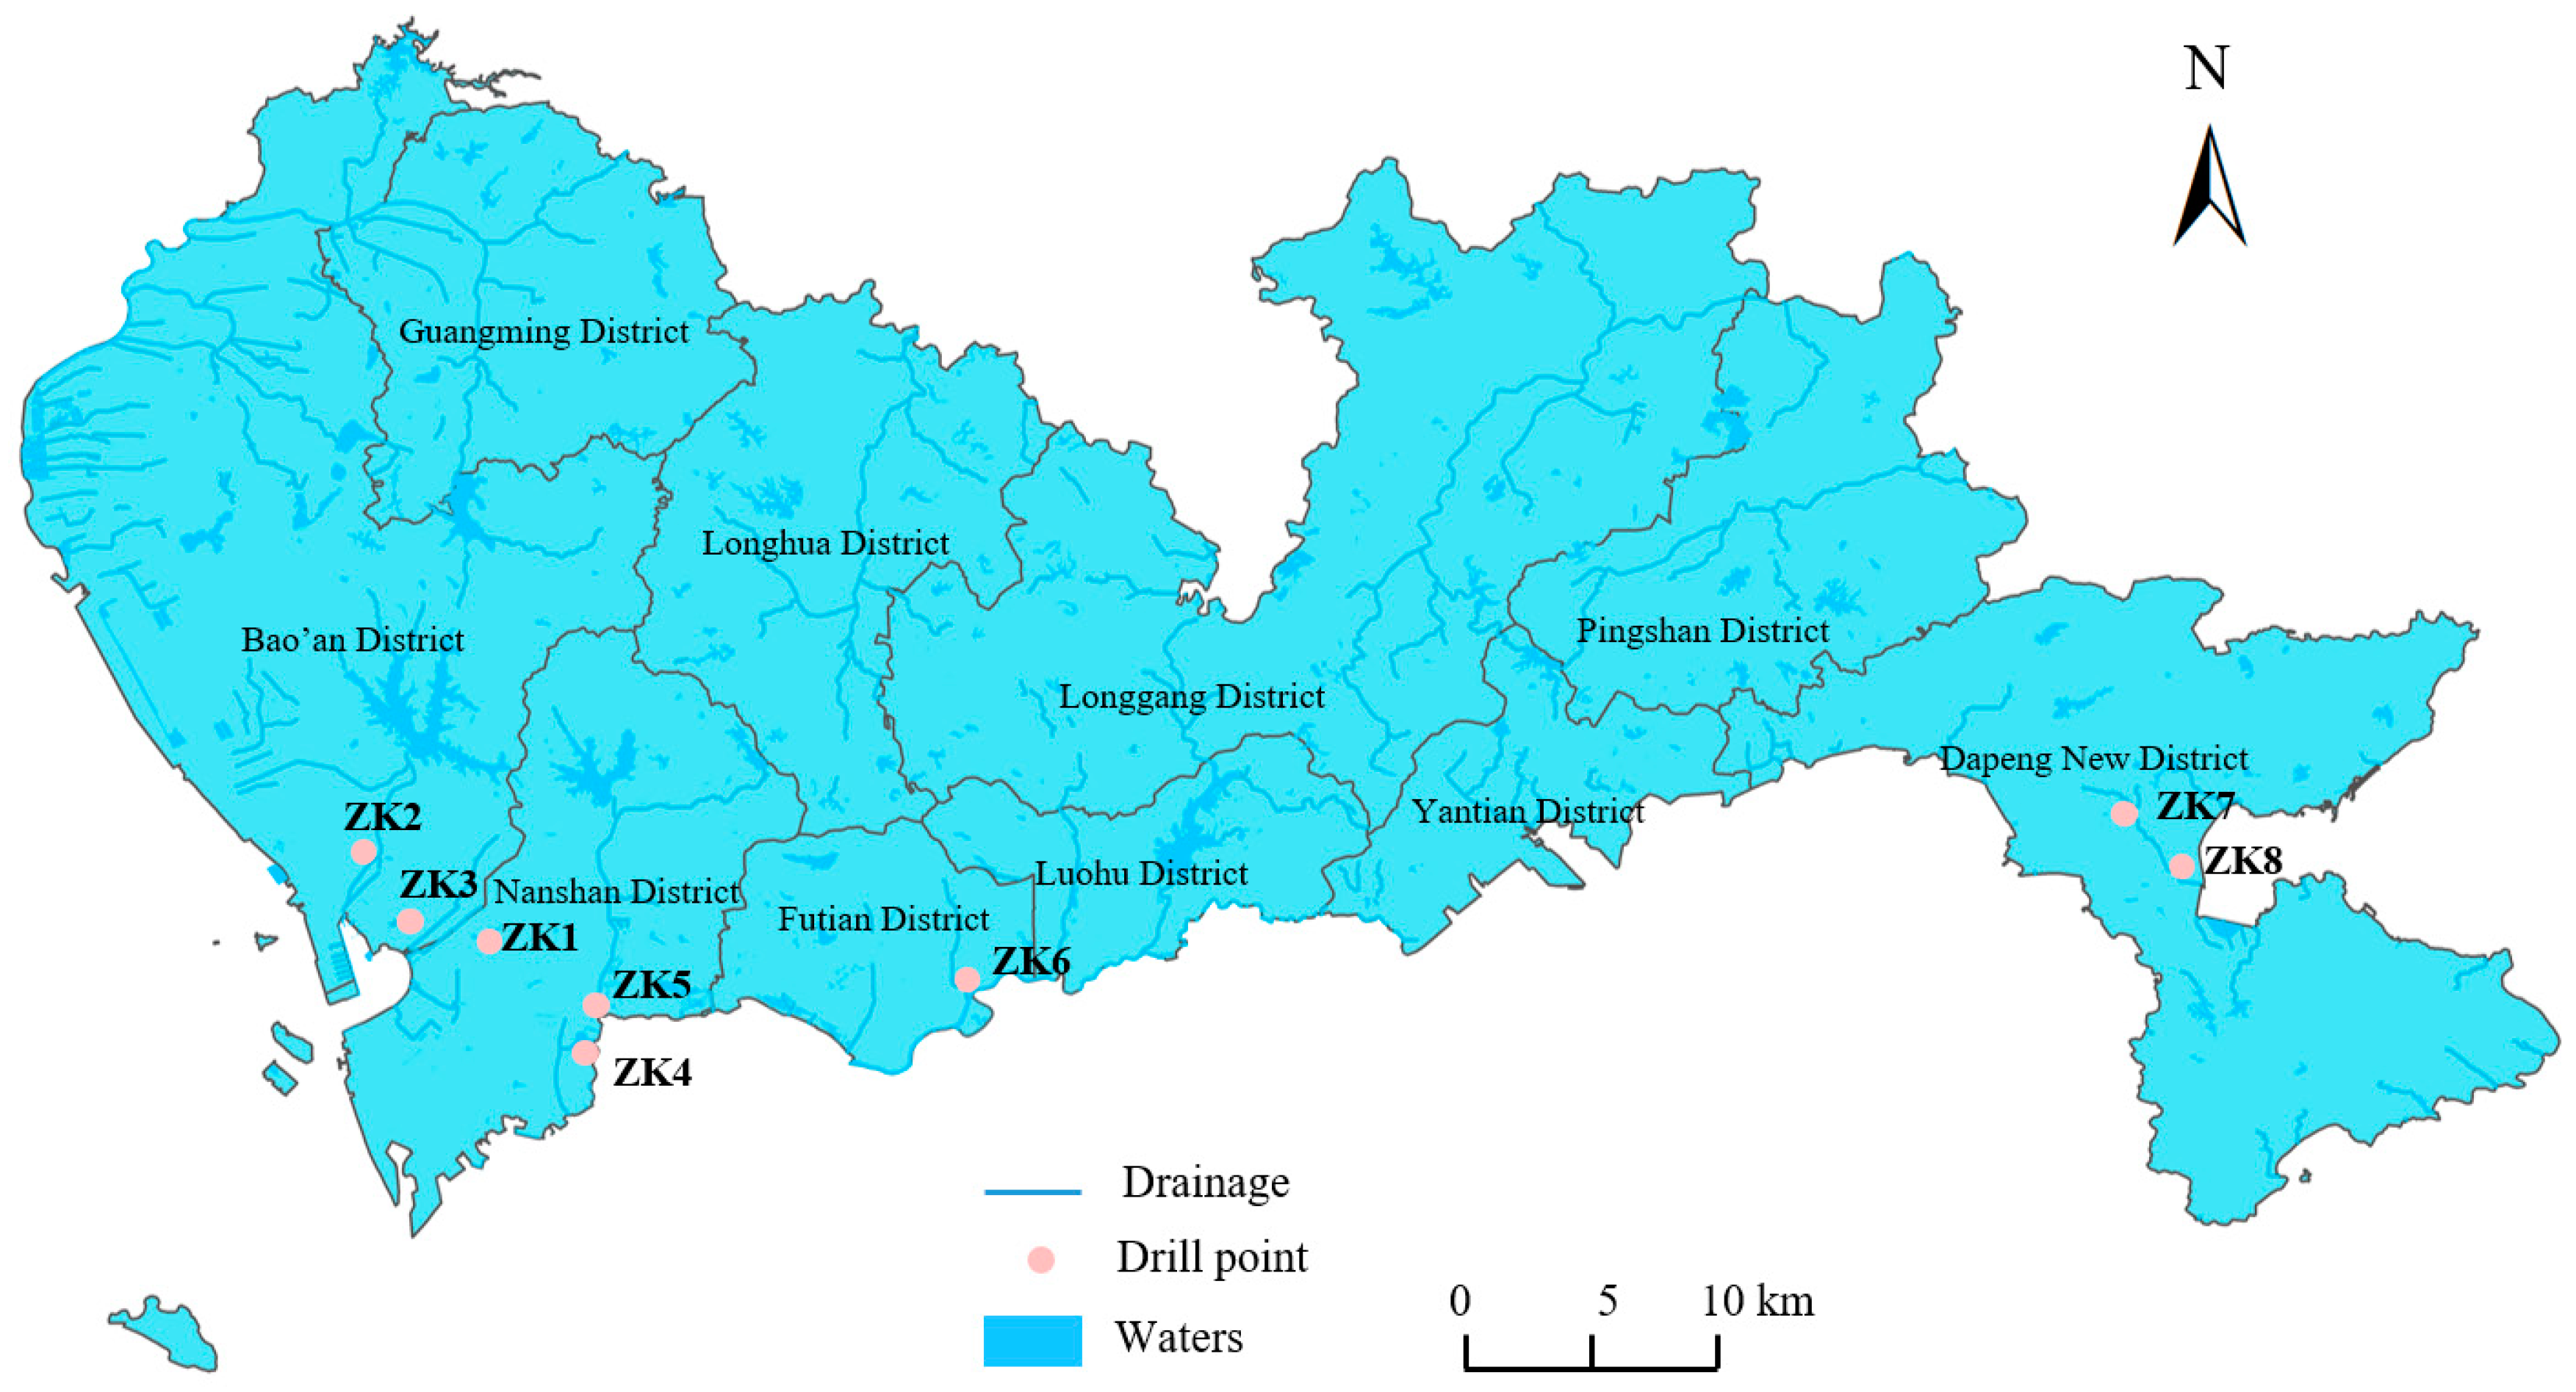
The disaster sensitivity influences the ease of SWI in the geological environment. Different geological structures have varying levels of difficulty for SWI. Loose soil layers are more susceptible to SWI, whereas hard bedrock can resist SWI. Based on the hydrochemical analysis of groundwater using engineering exploration borehole data, Figure 12 shows the locations of the borehole points. Table 8 summarizes the extent of SWI in some coastal areas of Shenzhen. Since the concentration of Cl is crucial for identifying and evaluating SWI, the degree of SWI can be classified based on the Cl concentration in groundwater: no intrusion (<250 mg/L), mild intrusion (250–500 mg/L), moderate intrusion (500–1000 mg/L), and severe intrusion (>1000 mg/L) [41]. According to the results in Table 9, severe SWI occurs in Shenzhen’s western region, with a large extent of intrusion. Even at 1600 m from the coastline, severe SWI occurs because the geological formations in Shenzhen’s western region, such as Bao’an, Nanshan, and Futian, primarily comprise silty clay, gravelly clay, and sandy soil. The geological formations are diverse and unevenly distributed, with a thick layer of Quaternary soil. Consequently, the soil layers are loose, poorly consolidated, and have low-bearing capacity, making the groundwater vulnerable to influences [6,7]. Therefore, this region exhibits higher sensitivity to SWI, with intrusion extending over 2000 m. In the eastern region, at 1900 m from the coastline, the Cl concentration is 32.16 mg/L, indicating no SWI because the bedrock in Yantian District and Dapeng Peninsula is shallow, with some areas exposing bedrock. The geological formations mainly comprise fully weathered granite, with well-developed fractures in the bedrock, reaching a depth of up to 40 m. These fractures are good channels for groundwater storage and transport. However, due to the limited extent of fracture development, the range of SWI in the eastern region is smaller, only 100–200 m from the coastline, verifying the reasonableness of the chosen range for the exposure zone.

5.2.3. Vulnerability

The vulnerability of the geological environment is a crucial indicator for assessing the risk of geological hazards and is the foundation for hazard prevention, reduction, and urban development planning. The uneven distribution of geological environmental vulnerability in Shenzhen’s coastal areas implies that different regions face varying geological hazard risks. Factors such as the distance from the coastline and the depth of bedrock burial influence the vulnerability of the geological environment. The closer an area is to the coastline and the deeper the bedrock burial, the higher its vulnerability. Figure 13 shows the bedrock burial depth in Shenzhen’s coastal areas. According to the figure, most of Shenzhen’s western coastal areas have a bedrock burial depth of over 15 m, with surface soil comprising reclaimed soil and Quaternary alluvial deposits. These areas are highly susceptible to SWI, resulting in a low GER value [42]. However, Shenzhen’s central and eastern areas generally have a bedrock burial depth below 10 m, effectively resisting SWI and exhibiting a high GER value. However, the GER level decreases in some areas of Dapeng New District where the bedrock burial depth is greater. Therefore, targeted hazard prevention and reduction measures should be developed, including grouting to seal rock fractures, to enhance the resilience of high-vulnerability areas. Additionally, strengthening monitoring and risk early warning systems for the geological environment are crucial. These efforts will help reduce the impact of SWI disasters in these areas, ensuring the stable development of the city and protecting the safety of its residents.

5.3. Resistance Capacity

During the early stages of development in Shenzhen, excessive groundwater extraction led to a significant decline in groundwater levels, gradually causing SWI and bringing severe geological hazards to the coastal areas. In recent years, Shenzhen has placed considerable importance on preventing and controlling SWI hazards, continuously implementing various measures to enhance its resilience against such hazards. Among these measures, improving the groundwater infiltration conditions in newly reclaimed areas is critical. Furthermore, comprehensive monitoring of inland rivers and coastal groundwater has been conducted. Shenzhen’s current groundwater monitoring network includes 116 monitoring wells, covering the primary eight groundwater systems across the city (Table 10). This network enables effective monitoring of SWI and provides a basis for managing and mitigating its impact. Additionally, Shenzhen has implemented constructing embankments, intercepting and storing reservoirs, and employing groundwater isolation walls to separate freshwater from saltwater. These measures have improved the effectiveness and capacity to prevent and control SWI hazards.

5.4. Recovery Capacity

The recovery capability of SWI is expressed in terms of the ability to prevent the affected area from expanding and control and mitigate the affected area. Due to the deep bedrock burial depth in Shenzhen’s western part, with the upper soil being Quaternary alluvial deposits, a combination of impermeable walls and underground water storage facilities can be used to separate freshwater from seawater, achieving the goal of preventing and controlling SWI. In Shenzhen’s central and eastern parts, where the degree of SWI is moderately low, river intercepting gates can be constructed at a specific distance from the sea to prevent seawater from moving upstream along rivers, effectively preventing SWI upstream. Along the coastal areas, protective measures, such as diversion and storage reservoirs and estuary intercepting gates, provide a level of resistance against disasters like storm surges. Subsequently, restoration measures, such as recharging rainwater at the surface, can help maintain a higher groundwater level, preventing SWI at lower freshwater levels [43]. Additionally, recharging rainwater helps dilute residual saltwater in the soil and groundwater, moving the salt–freshwater interface toward the ocean and achieving desalination. Improving the recovery capability is crucial for environmental protection, reducing disaster impacts and achieving sustainable development. However, effective use of recovery capability to address geological and environmental issues requires further strengthening scientific research and technological innovation, including the development of more effective recovery techniques and methods. Furthermore, enhanced monitoring and assessment are needed to understand changes in geological environments and disaster trends, enabling the timely implementation of appropriate recovery measures. By using recovery technologies and methods rationally, the vulnerability of geological environments can be reduced, their resilience against disasters can be enhanced, and stable development of geological environments can be achieved. Further research, innovation, and strengthening monitoring and assessment efforts remain crucial to address challenges in geological environments.

5.5. Adaptability

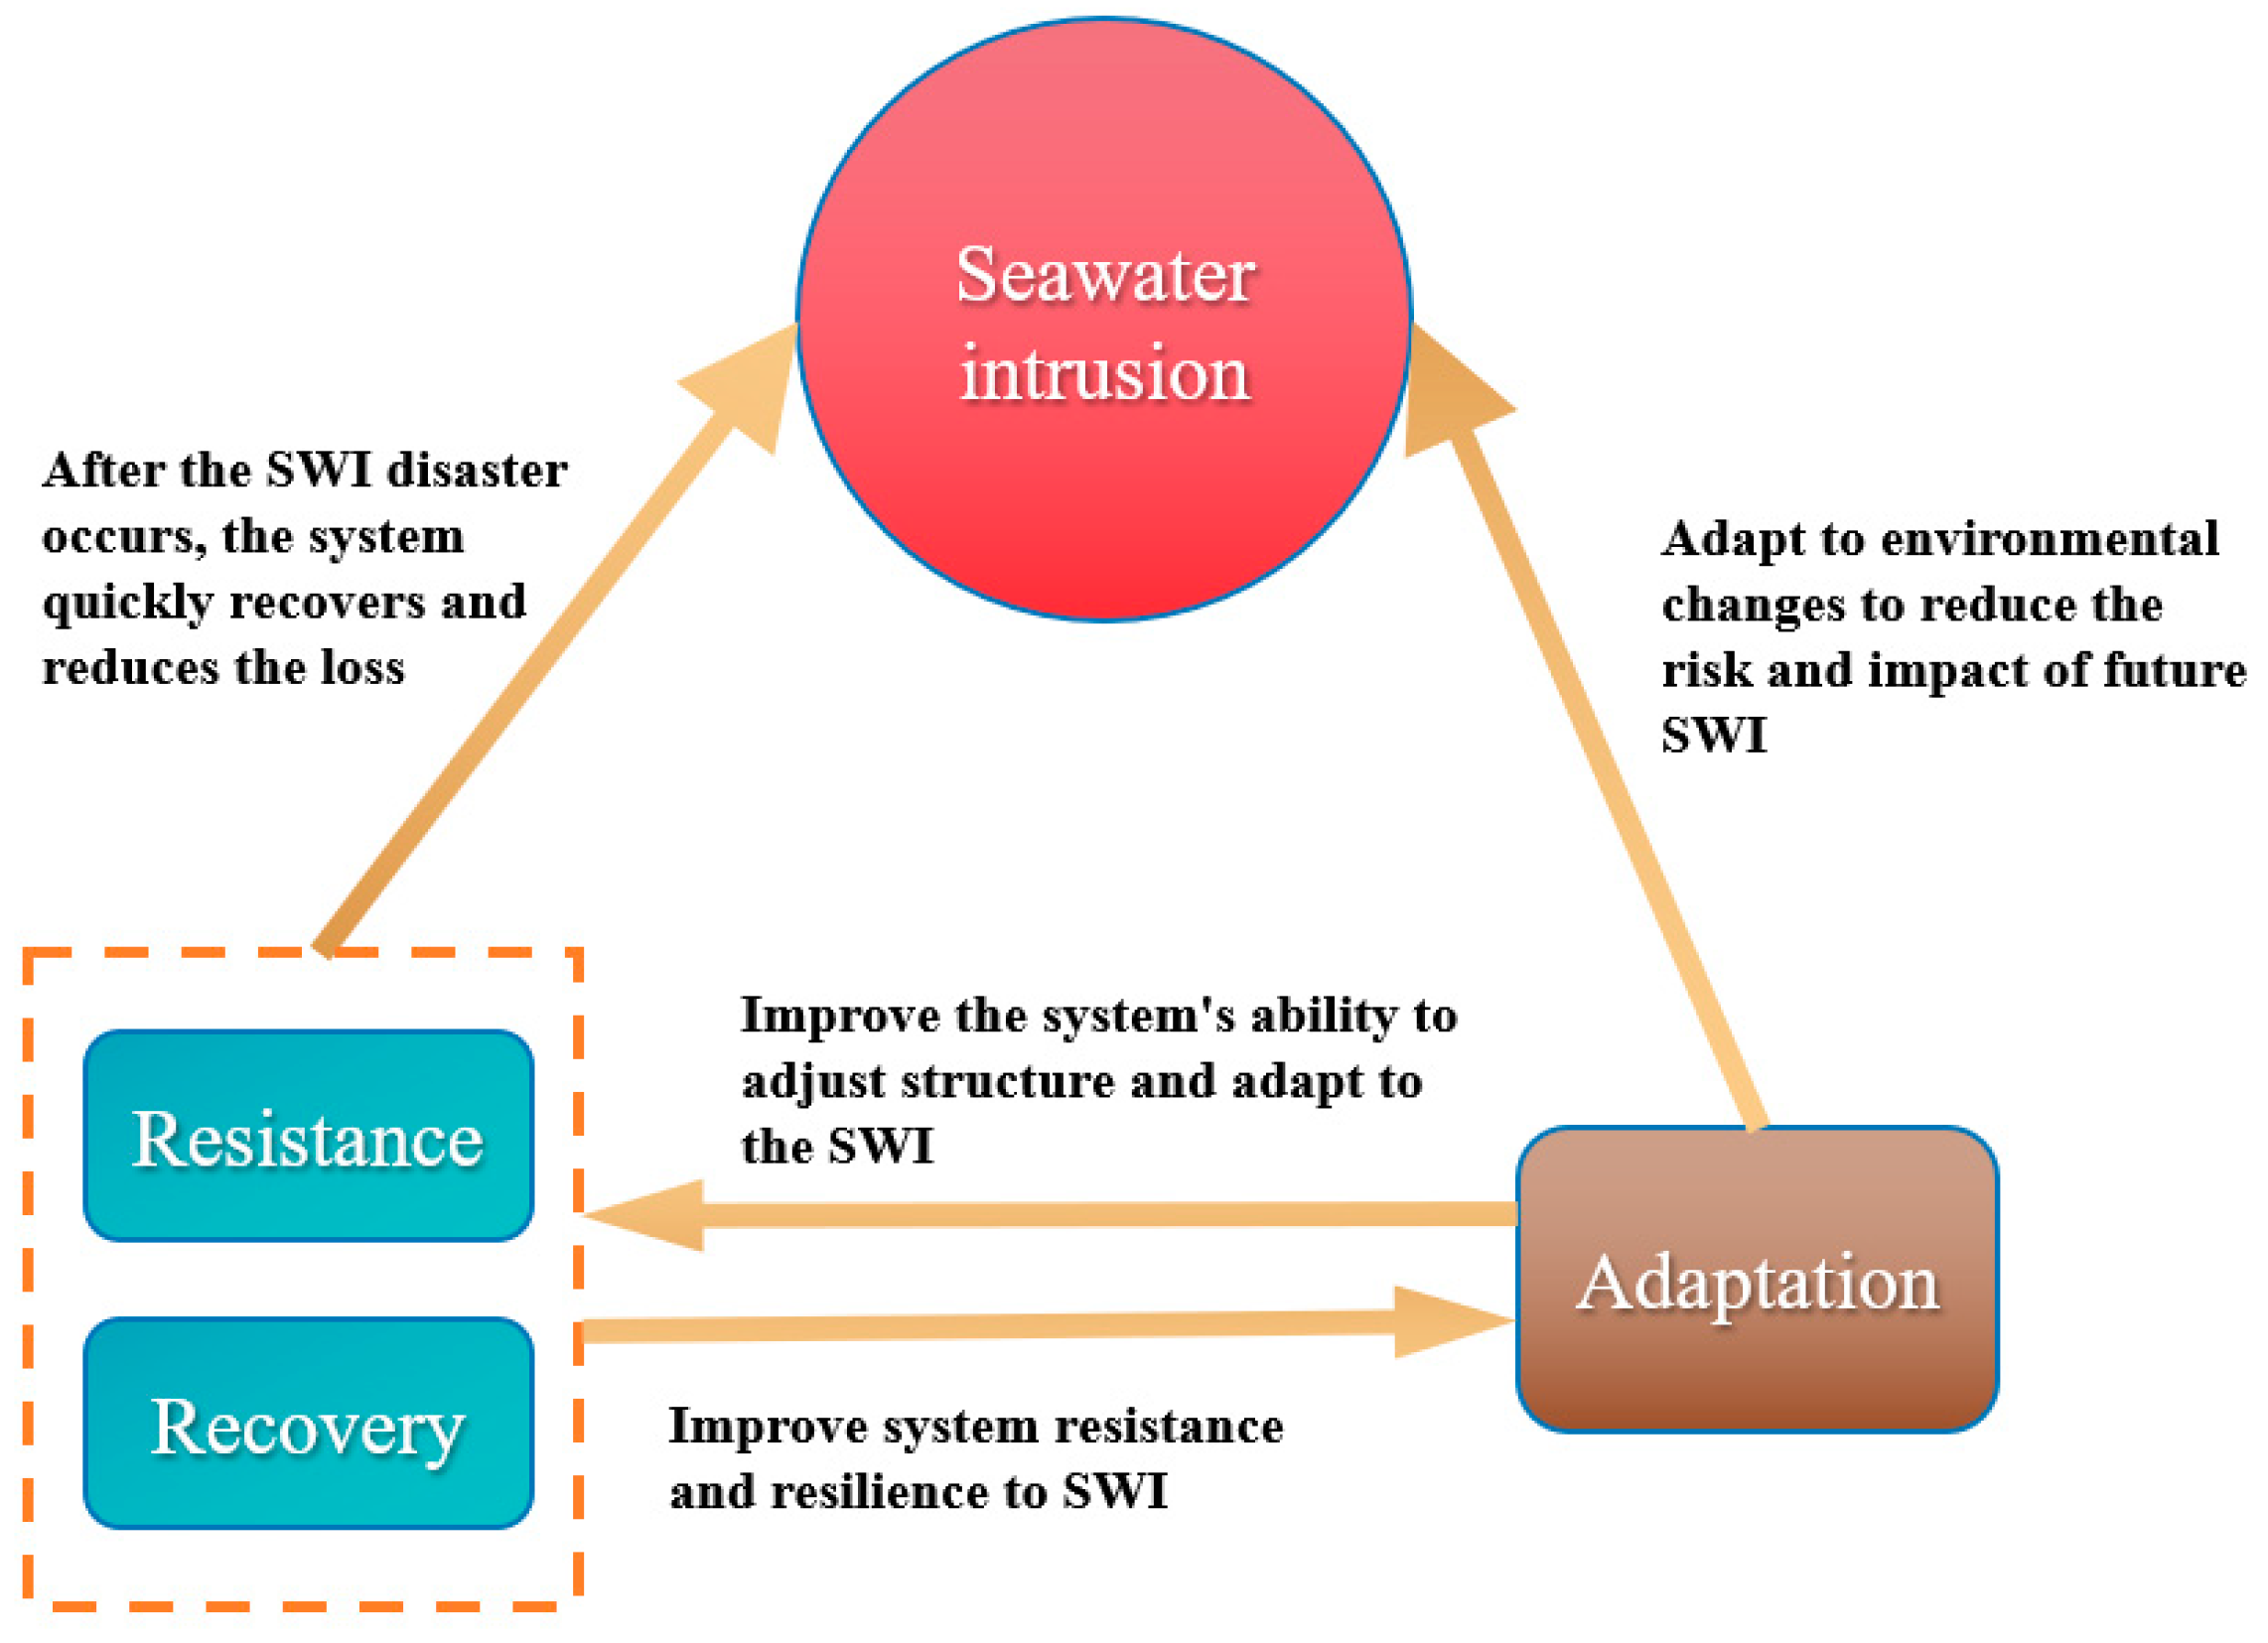
Due to the characteristics of SWI hazards, which involve rapid intrusion and slow retreat and cannot be fully controlled, adaptation is needed to adjust and change the system’s structure, functionality, and organizational methods to reduce the future risks and impacts of SWI. Figure 14 shows the role of adaptation in preventing and controlling SWI. Adaptation enables modifying and improving the existing defense and prevention measures, repairs, and recovery work based on changing environmental conditions, better coping with disasters and risks, reducing losses and impacts, and enhancing resistance to external shocks. Enhancing recovery capability and resistance enables the system to adapt to changing environmental conditions and take appropriate measures to reduce future risks and impacts. If SWI disasters no longer occur or the frequency significantly decreases in a specific area, and the overall range of geological hazards gradually diminishes, it indicates that the stability of the geological environment remains at a high level, demonstrating strong adaptability. Therefore, to enhance adaptability to SWI disasters, it is crucial that Shenzhen establishes a more comprehensive groundwater monitoring network, which allows for the real-time monitoring of parameters such as groundwater levels and water quality. This enables the city to promptly grasp the dynamics of seawater intrusion. Based on the monitoring data, relevant departments can quickly adjust early warning systems and disaster prevention measures, effectively addressing any potential issues that may arise. These actions will enhance adaptability, improve the carrying capacity and resistance of the geological environment, reduce the potential impact of SWI disasters on the geological environment, and increase the GER value.

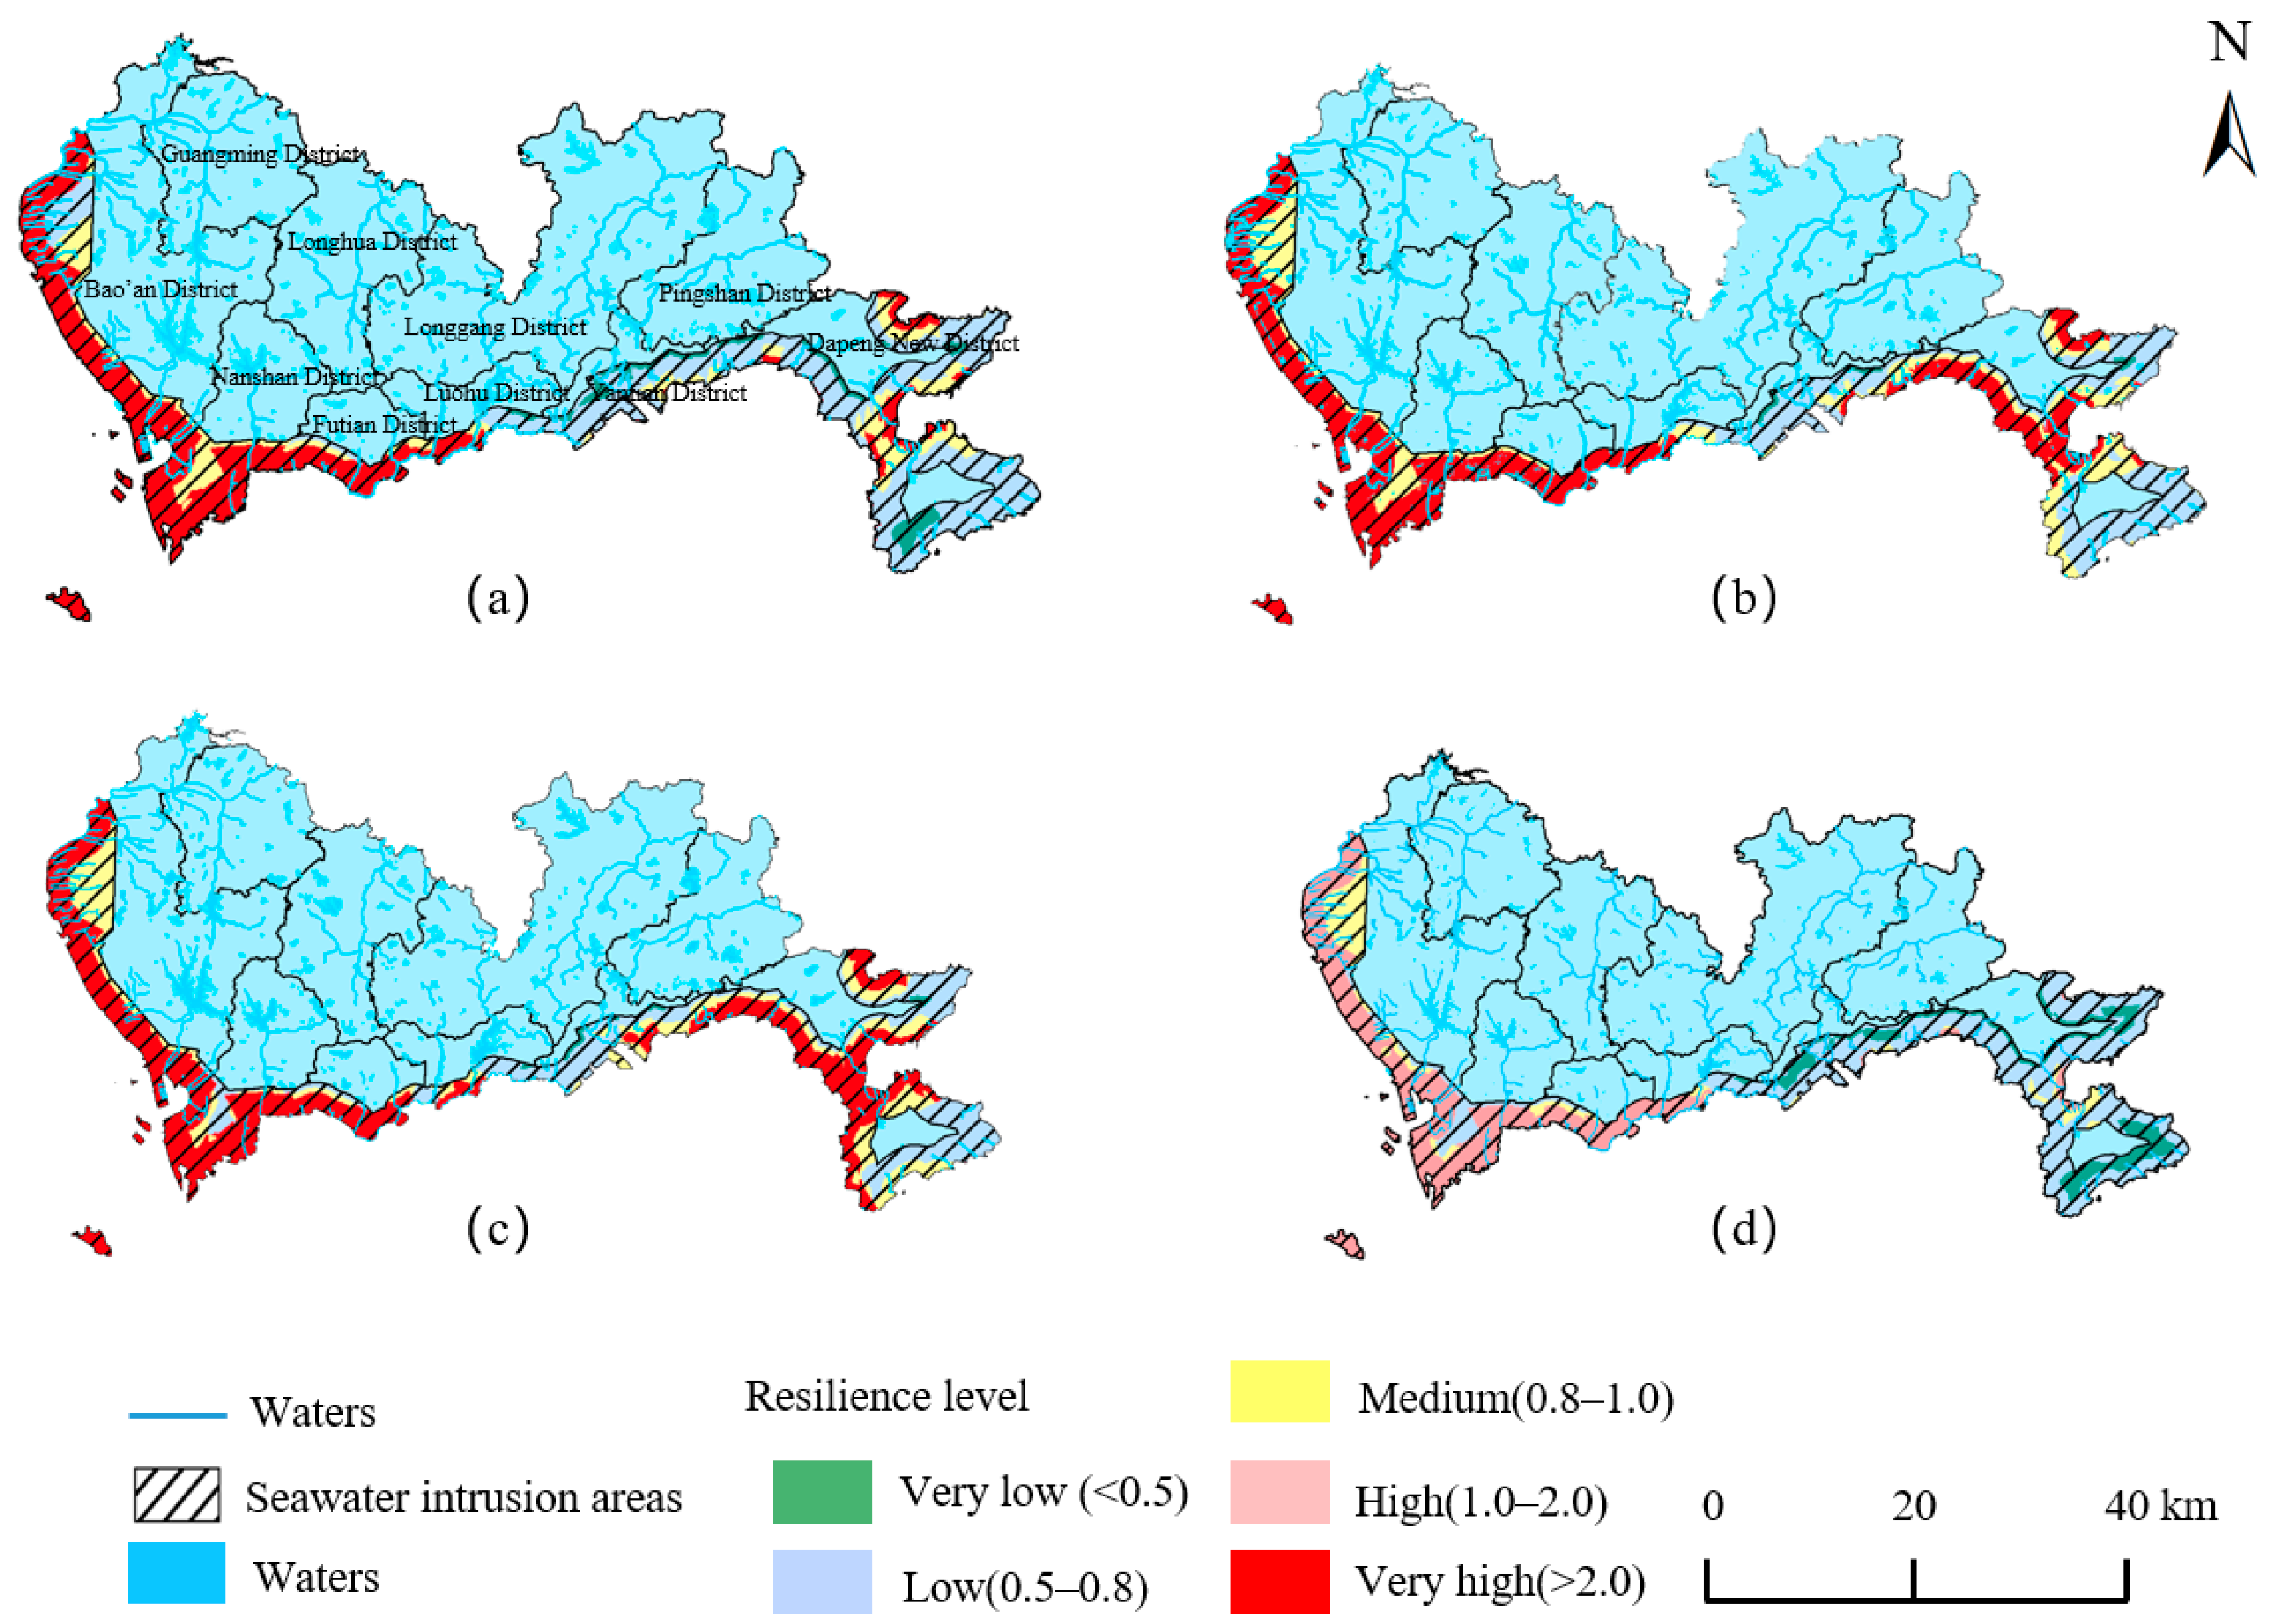
5.6. Geological Environment Resilience

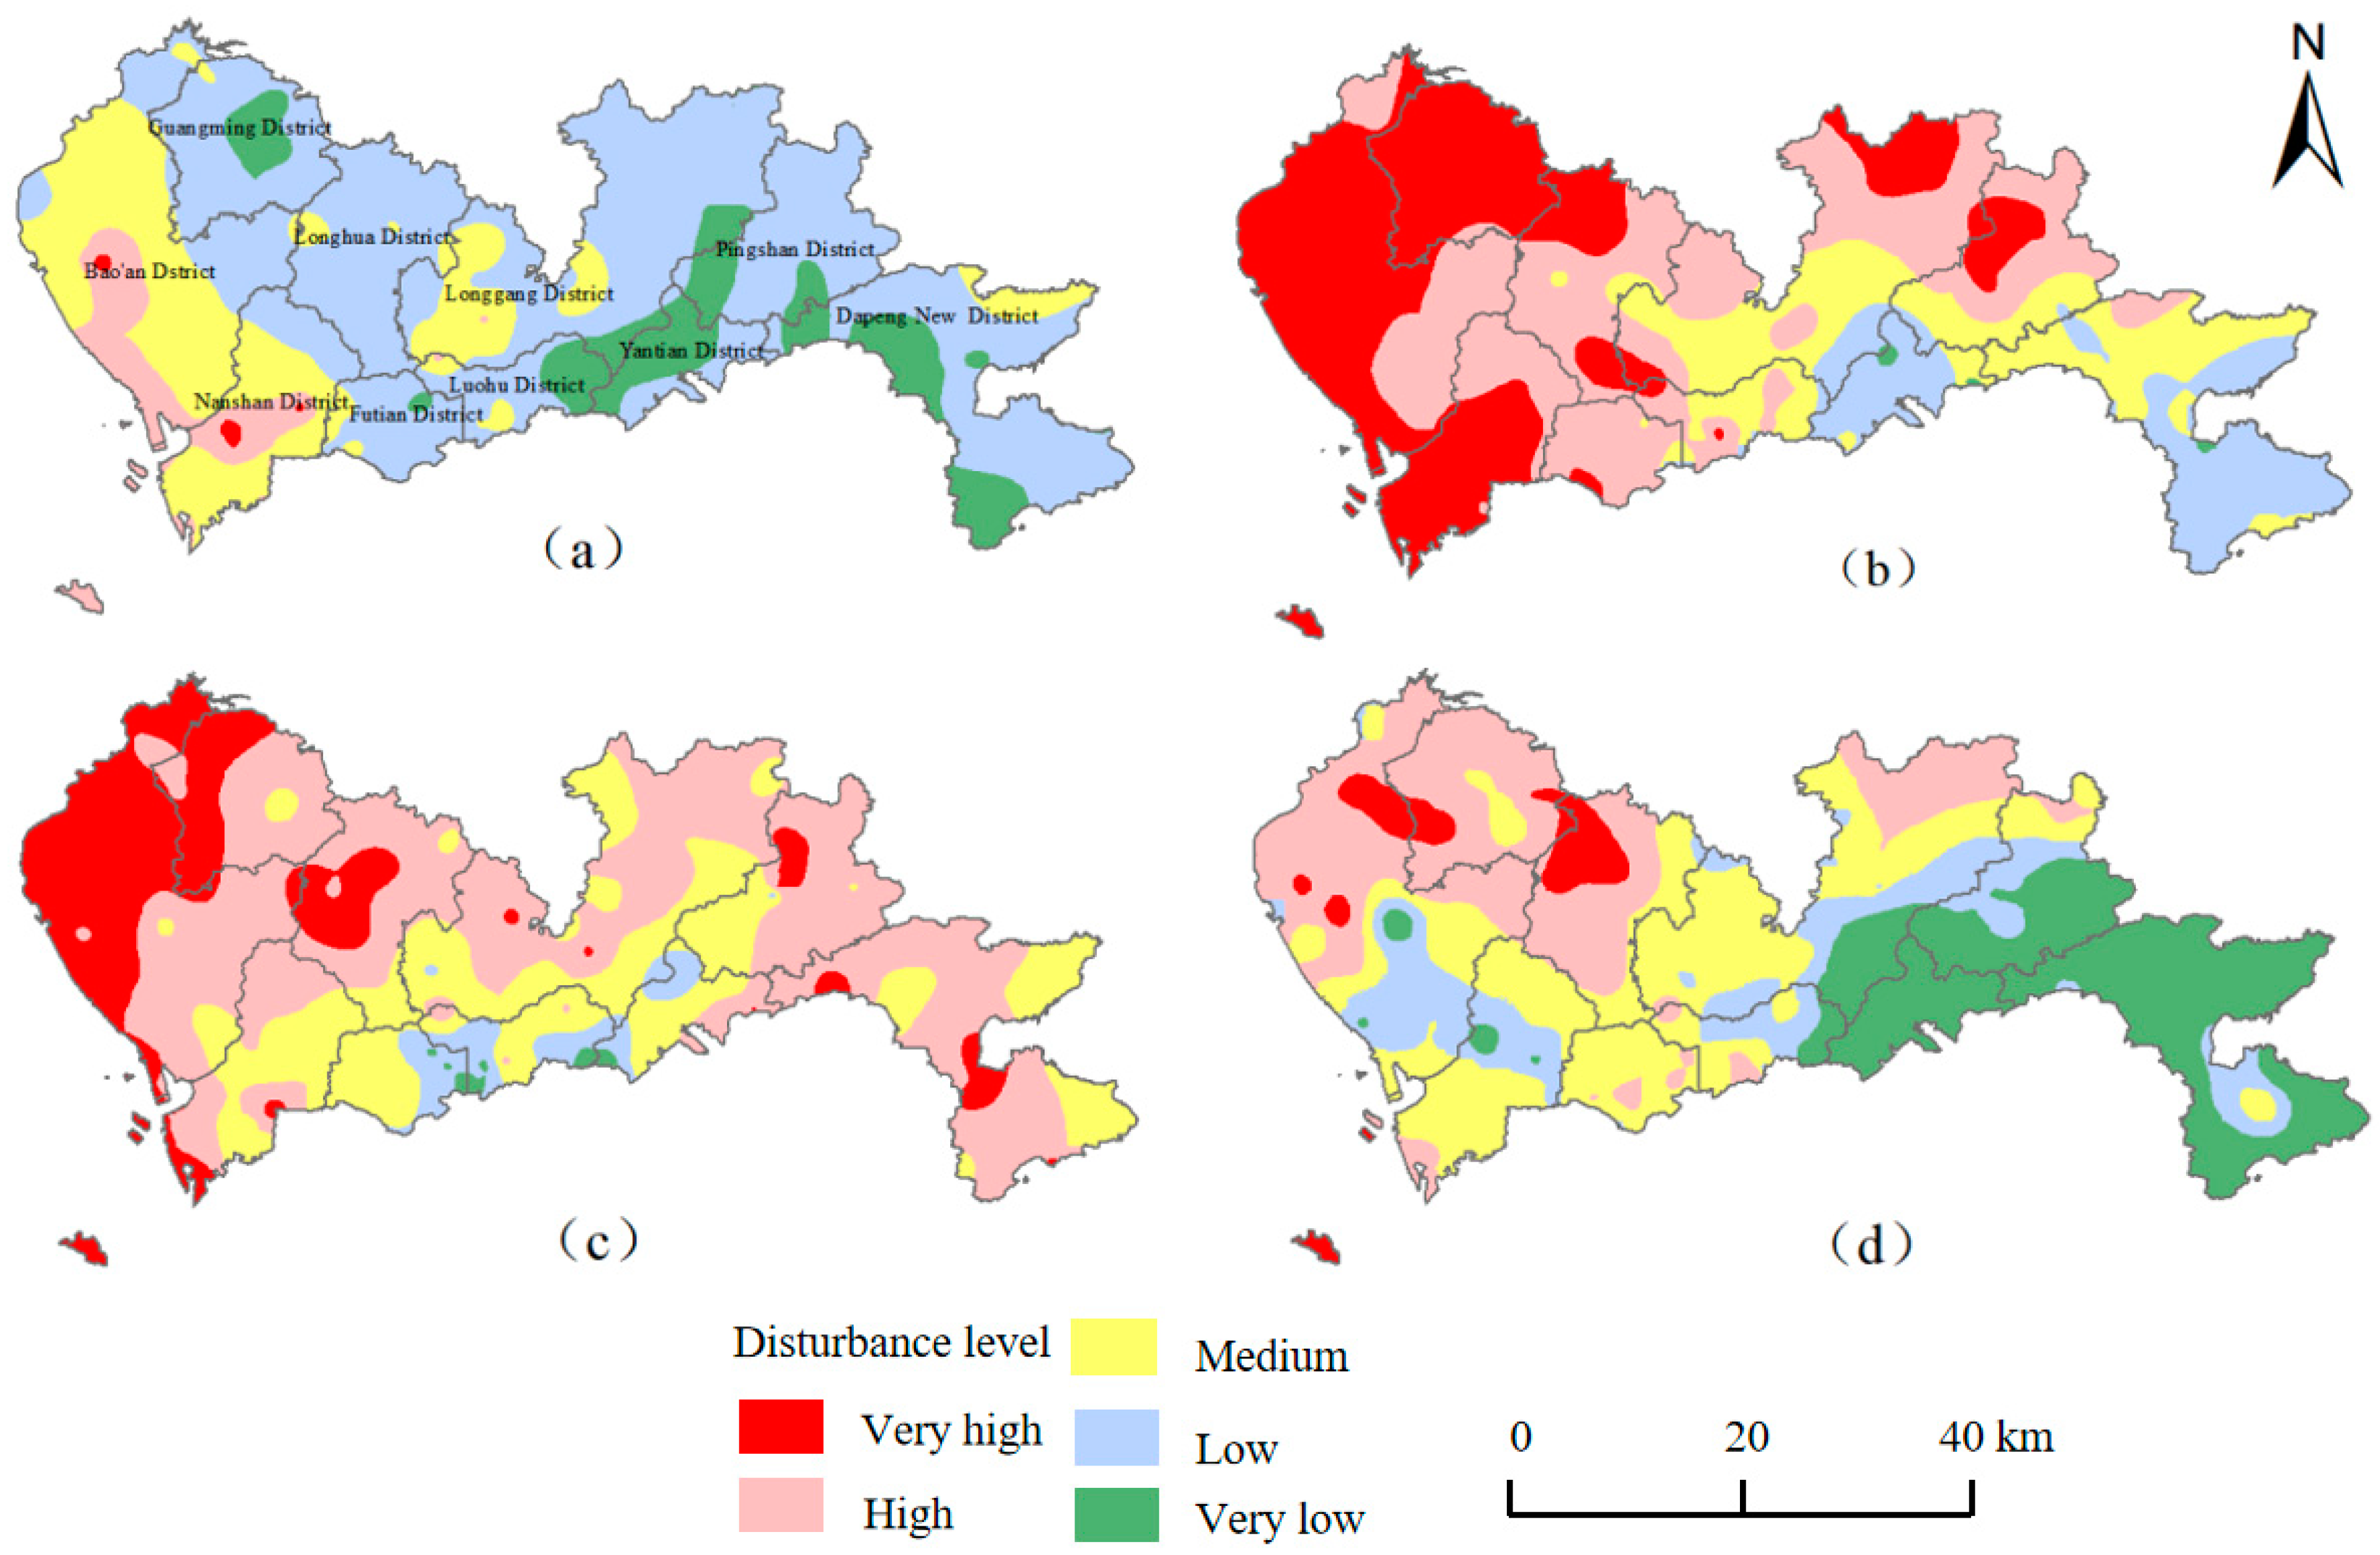
Based on the data in (Figure 10), it can be concluded that disturbance intensity, geological vulnerability, resistance, recovery capacity, and adaptability influence the GER, with different influencing factors in different regions.
During 2019–2022, there were significant changes in the GER in Shenzhen’s eastern coastal area, with the highest resilience level in 2022 and the lowest in 2020. According to the precipitation data from 2019 to 2022, 2020 had the lowest value, whereas 2022 had the highest. Therefore, the changes in GER in Shenzhen’s eastern coastal area are related to precipitation, and heavy rainfall can increase the resilience level by 1–2 grades. The granite in the eastern region is less susceptible to SWI due to the small gaps, resulting in a higher GER than the central and western regions. Similarly, the resilience level of the coastal areas in the eastern region will also decrease in drought conditions, making SWI more likely.
Compared to the eastern region, the GER in Shenzhen’s central and western regions remained moderately low during 2019–2022, with minimal annual changes, indicating that the impact of rainfall on these areas is small. Shenzhen’s western region primarily comprises Quaternary fluvio–deltaic deposits with a greater bedrock depth. Compared to completely weathered granite, these deposits are more susceptible to the influence of SWI, making it easier for seawater to penetrate freshwater environments, resulting in a lower GER. Even under the strong rainfall conditions in 2022, the GER in the western region, especially along the coast of Bao’an District, remains at a low level.
In conclusion, the changes in GER in Shenzhen are closely related to precipitation and bedrock depth. Resistance, recovery capacity, and adaptability increase GER, which is beneficial for preventing and managing SWI disasters.

6. Conclusions

This paper focuses on the study of SWI and establishes a geological resilience-level assessment index system by analyzing the factors influencing geological resilience, selecting disturbance intensity, geological environment vulnerability, resistance, recovery, and adaptability as resilience indicators. By analyzing the resilience level of Shenzhen’s coastal areas under the influence of SWI, the following conclusions are drawn.
(1)
The primary factor causing disturbance in SWI is the annual rainfall. The disturbance intensity is negatively correlated with the amount of rainfall and is influenced by seasonal variations in rainfall.
(2)
The distance from the coastline and the bedrock depth influence the vulnerability of the geological environment. The closer the distance to the coastline and the shallower the depth of the bedrock, the greater the vulnerability.
(3)
The inherent connection between resistance, recovery, and adaptability enhances GER. Resistance comprises warning and hazard prevention capabilities. The resistance level is higher when warning and hazard prevention capabilities are high. Recovery is related to the ratio of the area restored to the area damaged. The faster the damaged area is restored, the higher the recovery capacity. The less frequent the incidents of SWI hazards in a region, the higher the adaptability.
(4)
The changes in GER in Shenzhen are closely related to precipitation and bedrock depth. Resistance, recovery capacity, and adaptability increase GER, which is beneficial for preventing and managing SWI disasters.
This paper constructs a geological environment resilience model to evaluate the resilience level of the coastal areas in Shenzhen under the influence of seawater intrusion disasters, and the results obtained have certain reference value. However, in view of the small number of groundwater data samples, the accuracy of the evaluation results is not high and needs to be further refined.

Author Contributions

Conceptualization, M.H., E.W. and X.C.; Methodology, D.S. and W.H.; Software, J.Z.; Formal analysis, M.H.; Data curation, A.L.; Writing—original draft, J.Z.; Writing—review & editing, W.H.; Visualization, J.Z. All authors have read and agreed to the published version of the manuscript.

Funding

This research was funded by the National Science Foundation of China (Grant No. 52090081 and 51938008).

Institutional Review Board Statement

Not applicable.

Informed Consent Statement

Not applicable.

Data Availability Statement

Data are contained within the article.

Conflicts of Interest

Aiguo Li was employed by Shenzhen Geotechnical Surveying & Investigation Institute (Group) Co., Ltd. The remaining authors declare that the research was conducted in the absence of any commercial or financial relationships that could be construed as a potential conflict of interest. The funding agency had no influence on the data collection of the research design.

References

  1. Fan, Y.; Wu, Q.H.; Cui, H.D.; Lu, W.X.; Ren, W.L. Stochastic simulation of seawater intrusion in the Longkou area of China based on the Monte Carlo method. Environ. Sci. Pollut. Res. 2023, 30, 22063–22077. [Google Scholar] [CrossRef]
  2. Liu, Z.; He, X.F.; Fan, J.; Zhou, C.Y. Study on the Softening Mechanism and Control of Red-Bed Soft Rock under Seawater Conditions. J. Mar. Sci. Eng. 2019, 7, 235. [Google Scholar] [CrossRef]
  3. Prakash, D.; Tiwary, C.B.; Kumar, R. Ecosystem Variability along the Estuarine Salinity Gradient: A Case Study of Hooghly River Estuary, West Bengal, India. J. Mar. Sci. Eng. 2023, 11, 88. [Google Scholar] [CrossRef]
  4. Yang, H.; Yang, T.; Yang, F.; Yang, X. Assessment of groundwater salinization impact in coastal aquifers based on the shared socioeconomic pathways: An integrated modeling approach. Environ. Res. 2023, 234, 116618. [Google Scholar] [CrossRef]
  5. Dong, L.Q.; Cao, J.M.; Liu, X. Recent Developments in Sea-Level Rise and Its Related Geological Disasters Mitigation: A Review. J. Mar. Sci. Eng. 2022, 10, 355. [Google Scholar] [CrossRef]
  6. Seenipandi, K.; Nainarpandian, C.; Kandathil, R.K.; Sellamuthu, S. Seawater intrusion vulnerability in the coastal aquifers of southern India-an appraisal of the GALDIT model, parameters’ sensitivity, and hydrochemical indicators. Environ. Sci. Pollut. Res. 2019, 26, 9755–9784. [Google Scholar] [CrossRef]
  7. Hermides, D.; Makri, P.; Kontakiotis, G.; Antonarakou, A. Advances in the Coastal and Submarine Groundwater Processes: Controls and Environmental Impact on the Thriassion Plain and Eleusis Gulf (Attica, Greece). J. Mar. Sci. Eng. 2020, 8, 944. [Google Scholar] [CrossRef]
  8. Yu, X.; Wu, L.; Yu, X.; Xin, P. Tidal fluctuations relieve coastal seawater intrusion caused by groundwater pumping. Mar. Pollut. Bull. 2022, 184, 114231. [Google Scholar] [CrossRef]
  9. Kanagaraj, G.; Elango, L.; Sridhar, S.G.D.; Gowrisankar, G. Hydrogeochemical processes and influence of seawater intrusion in coastal aquifers south of Chennai, Tamil Nadu, India. Environ. Sci. Pollut. Res. 2018, 25, 8989–9011. [Google Scholar] [CrossRef] [PubMed]
  10. Hasan, I.; Reza, S.; Siddique, A.; Akbor, A.; Hasan, M.; Nahar, A.; Islam, I. Assessment of groundwater vulnerability for seawater intrusion using DRASTIC model in coastal area at Patuakhali District, Bangladesh. Environ. Sci. Pollut. Res. 2023, 30, 109021–109040. [Google Scholar] [CrossRef] [PubMed]
  11. Hajji, S.; Allouche, N.; Bouri, S.; Aljuaid, A.M.; Hachicha, W. Assessment of Seawater Intrusion in Coastal Aquifers Using Multivariate Statistical Analyses and Hydrochemical Facies Evolution-Based Model. Int. J. Environ. Res. Public Health 2021, 19, 155. [Google Scholar]
  12. Li, C.Z.; Fu, T.F.; Fu, Y.S.; Wang, Z.Y.; Li, B.; Qi, C.; Chen, G.Q.; Xu, X.Y.; Yu, H.J. Origin and Implications of Pollution in Coastal Groundwater of the Guangdong Province. J. Mar. Sci. Eng. 2022, 10, 1394. [Google Scholar] [CrossRef]
  13. Guo, J.; Ma, Y.; Ding, C.; Zhao, H.W.; Cheng, Z.X.; Yan, G.X.; You, Z.J. Impacts of Tidal Oscillations on Coastal Groundwater System in Reclaimed Land. J. Mar. Sci. Eng. 2023, 11, 2019. [Google Scholar] [CrossRef]
  14. Idowu, T.E.; Jepkosgei, C.; Nyadawa, M.; Korowe, M.O.; Waswa, R.M.; Lasisi, K.H.; Kiplangat, N.; Munyi, J.; Ajibade, F.O. Integrated seawater intrusion and groundwater quality assessment of a coastal aquifer: GALDIT, geospatial and analytical approaches. Environ. Sci. Pollut. Res. 2022, 29, 36699–36720. [Google Scholar] [CrossRef]
  15. Chi, W.; Yang, Y.; Zhang, K.; Wang, P.; Du, Y.; Li, X.; Sun, Y.; Liu, T.; Li, F. Seawater intrusion induced cadmium activation via altering its distribution and transformation in paddy soil. Chemosphere 2022, 307, 135805. [Google Scholar] [CrossRef] [PubMed]
  16. Fiandrino, A.; Ouisse, V.; Dumas, F.; Lagarde, F.; Pete, R.; Malet, N.; Le Noc, S.; de Wit, R. Spatial patterns in coastal lagoons related to the hydrodynamics of seawater intrusion. Mar. Pollut. Bull. 2017, 119, 132–144. [Google Scholar] [CrossRef]
  17. Mehdizadeh, S.S.; Karamalipour, S.E.; Asoodeh, R. Sea level rise effect on seawater intrusion into layered coastal aquifers (simulation using dispersive and sharp-interface approaches). Ocean Coast. Manag. 2017, 138, 11–18. [Google Scholar] [CrossRef]
  18. Xiong, G.; Chen, G.; Wu, J.; Wang, Z.; Yu, H.; Fu, T.; Liu, W.; Xu, X.; Hou, G.; Yang, Y.; et al. Identifying the characteristics and potential risk of seawater intrusion for southern China by the SBM-DEA model. Sci. Total Environ. 2022, 844, 157205. [Google Scholar] [CrossRef]
  19. Salem, Z.E.E.; ElNahrawy, A.; Attiah, A.M.M.; Edokpayi, J.E.N. Vertical and spatial evaluation of the groundwater chemistry in the Central Nile Delta Quaternary aquifer to assess the effects of human activities and seawater intrusion. Front. Environ. Sci. 2022, 10, 961059. [Google Scholar] [CrossRef]
  20. Salem, Z.E.; Osman, O.M. Use of major ions to evaluate the hydrogeochemistry of groundwater influenced by reclamation and seawater intrusion, West Nile Delta, Egypt. Environ. Sci. Pollut. Res. 2017, 24, 3675–3704. [Google Scholar] [CrossRef] [PubMed]
  21. Kazakis, N.; Pavlou, A.; Vargemezis, G.; Voudouris, K.S.; Soulios, G.; Pliakas, F.; Tsokas, G. Seawater intrusion mapping using electrical resistivity tomography and hydrochernical data. An application in the coastal area of eastern Thermaikos Gulf, Greece. Sci. Total Environ. 2016, 543, 373–387. [Google Scholar] [CrossRef]
  22. Zeng, X.; Wu, J.; Wang, D.; Zhu, X. Assessing the pollution risk of a groundwater source field at western Laizhou Bay under seawater intrusion. Environ. Res. 2016, 148, 586–594. [Google Scholar] [CrossRef]
  23. Perumal, M.; Sekar, S.; Carvalho, P.C.S. Global Investigations of Seawater Intrusion (SWI) in Coastal Groundwaters in the Last Two Decades (2000–2020): A Bibliometric Analysis. Sustainability 2024, 16, 1266. [Google Scholar] [CrossRef]
  24. Zhao, Y.; Zhang, J.; Chen, Z.; Zhang, W. Groundwater contamination risk assessment based on intrinsic vulnerability, pollution source assessment, and groundwater function zoning. Hum. Ecol. Risk Assess. 2019, 25, 1907–1923. [Google Scholar] [CrossRef]
  25. Lee, D.; Park, J.; Lee, H.A.A.; Woo, N.C.C. A Numerical Approach to Evaluating Groundwater Vulnerability to Seawater Intrusion on Jeju Volcanic Island, South Korea. Sustainability 2023, 15, 3081. [Google Scholar] [CrossRef]
  26. Ma, C.; Li, Y.; Li, X.; Gao, L. Evaluation of groundwater sustainable development considering seawater intrusion in Beihai City, China. Environ. Sci. Pollut. Res. 2020, 27, 4927–4943. [Google Scholar] [CrossRef]
  27. Kazakis, N.; Spiliotis, M.; Voudouris, K.; Pliakas, F.-K.; Papadopoulos, B. A fuzzy multicriteria categorization of the GALDIT method to assess seawater intrusion vulnerability of coastal aquifers. Sci. Total Environ. 2018, 621, 524–534. [Google Scholar] [CrossRef]
  28. Rachid, G.; Alameddine, I.; El-Fadel, M. SWOT risk analysis towards sustainable aquifer management along the Eastern Mediterranean. J. Environ. Manag. 2021, 279, 111760. [Google Scholar] [CrossRef] [PubMed]
  29. Dongming, Z.; Hongfeng, D.; Hui, W.; Hongwei, H.; Dejun, L. Investigating the Effect of Geological Heterogeneity of Strata on the Bearing Capacity of Shallow Foundations Using Markov Random Field. ASCE-ASME J. Risk Uncertain. Eng. Syst. Part A Civ. Eng. 2021, 7, 04021060. [Google Scholar]
  30. Zhu, S.; Li, D.; Feng, H.; Gu, T.; Hewage, K.; Sadiq, R. Smart city and resilient city: Differences and connections. Wiley Interdiscip. Rev. Data Min. Knowl. Discov. 2020, 10, e1388. [Google Scholar] [CrossRef]
  31. Bodin, L.; Gass, S.I. On teaching the analytic hierarchy process. Comput. Oper. Res. 2003, 30, 1487–1497. [Google Scholar] [CrossRef]
  32. Kajikawa, Y. Research core and framework of sustainability science. Sustain. Sci. 2008, 3, 215–239. [Google Scholar] [CrossRef]
  33. Roque, M.P.B.; Neto, J.A.F.; Vieira, W.D.; Rocha, B.D.; Calegario, A.T. Social vulnerability to environmental disasters in the Paraopeba River Basin, Minas Gerais, Brazil. Nat. Hazards 2023, 118, 1191–1210. [Google Scholar] [CrossRef]
  34. Song, J.L.; Huang, B.; Li, R.R. Assessing local resilience to typhoon disasters: A case study in Nansha, Guangzhou. PLoS ONE 2018, 13, e0190701. [Google Scholar] [CrossRef] [PubMed]
  35. Zhang, Y.; Yue, W.; Su, M.; Teng, Y.; Huang, Q.; Lu, W.; Rong, Q.; Xu, C. Assessment of urban flood resilience based on a systematic framework. Ecol. Indic. 2023, 150, 110230. [Google Scholar]
  36. Qiu, B. Methods and Principles of Designing Resilient City Based On Complex Adaptive System Theory. Urban Stud. 2018, 25, 1–3. [Google Scholar]
  37. Zhao, D.; Chen, C.; Yi, L.; Lei, P.; Xu, L. Research on comprehensive assessment model of urban resilience with multi-factor. J. Saf. Sci. Technol. 2022, 18, 54–59. [Google Scholar]
  38. Chen, C.K.; Xu, L.L.; Zhao, D.Y.; Xu, T.; Lei, P. A new model for describing the urban resilience considering adaptability, resistance and recovery. Saf. Sci. 2020, 128, 104756. [Google Scholar] [CrossRef]
  39. Azari, T.; Tabari, M.M.R. An integrated approach based on HFE-D, GIS techniques, GQISWI, and statistical analysis for the assessment of potential seawater intrusion: Coastal multilayered aquifer of Ghaemshahr-Juybar (Mazandaran, Iran). Environ. Sci. Pollut. Res. 2024, 31, 13335–13371. [Google Scholar] [CrossRef]
  40. Yu, Y.; Zhi, J.; Wei, B.; Cheng, J.; Hu, L.; Lu, W.; Gong, S. Seawater intrusion on the west coast of Shenzhen during 1980–2020 due to the influence of anthropogenic activities. Environ. Monit. Assess. 2023, 195, 545. [Google Scholar] [CrossRef] [PubMed]
  41. Zhang, B.; Song, X.; Han, D.; Guo, Z.; Xiao, G.; Yang, J. Seawater Intrusion Degree Evaluation Based on Mathematical Statistics and Fuzzy Mathematics in Qinhuangdao Yangdai River Plain. Sci. Geogr. Sin. 2013, 33, 342–348. [Google Scholar]
  42. Zhou, Q.; Zhang, B.; Li, Y.T.; Li, J.Y. Experimental Study on Seawater Intrusion Law and Countermeasures within Island Underground Water-Sealed Oil Storage Caverns. J. Mar. Sci. Eng. 2023, 11, 2139. [Google Scholar] [CrossRef]
  43. Miky, Y.; Issa, U.H.; Mahmod, W.E. Developing Functional Recharge Systems to Control Saltwater Intrusion via Integrating Physical, Numerical, and Decision-Making Models for Coastal Aquifer Sustainability. J. Mar. Sci. Eng. 2023, 11, 2136. [Google Scholar] [CrossRef]
Figure 1. Study area condition. (a) Study area location. (b) Altitude distribution of Shenzhen city.
Jmse 13 00018 g001
Figure 2. Rainfall data of Shenzhen. (a) Monthly rainfall. (b) Regional rainfall.
Jmse 13 00018 g002
Figure 3. Steps for resilience assessment of the geological environment under seawater intrusion (SWI) hazards.
Jmse 13 00018 g003
Figure 4. Indicator system for assessing the level of geologic environment resilience (GER).
Jmse 13 00018 g004
Figure 5. Indicators for assessing resistance capacity.
Jmse 13 00018 g005
Figure 6. The disturbance intensity distribution from 2019 to 2022: (a) 2019; (b) 2020; (c) 2021; (d) 2022.
Jmse 13 00018 g006
Figure 7. Exposure of the geological environment along Shenzhen’s coastal zone.
Jmse 13 00018 g007
Figure 8. Hazard sensitivity of geological bodies in Shenzhen’s coastal zone.
Jmse 13 00018 g008
Figure 9. Geological and environmental vulnerability of Shenzhen’s coastal zone.
Jmse 13 00018 g009
Figure 10. Levels of geological environment resilience (GER) under the effects of seawater intrusion (SWI) hazards: (a) 2019; (b) 2020; (c) 2021; (d) 2022.
Jmse 13 00018 g010
Figure 11. Rainfall for 2019–2022: (a) 2019; (b) 2020; (c) 2021; (d) 2022 (mm).
Jmse 13 00018 g011
Figure 12. The locations of the drill points.
Jmse 13 00018 g012
Figure 13. Bedrock depth distribution map in Shenzhen’s coastal area.
Jmse 13 00018 g013
Figure 14. The role of resilience in geological environmental toughness methods.
Jmse 13 00018 g014
Table 1. Aquifer geology.
Main Water-Bearing FormationGroundwater DistributionMain Water-Bearing FormationGroundwater Distribution
Plain fillInterstitial waterPlain fillInterstitial water
Sand Interstitial waterSand Interstitial water
Heavily weathered granite (massive)Bedrock fissure waterHeavily weathered granite/
Moderately weathered graniteBedrock fissure waterModerately weathered granite/
Table 2. Quantitative criteria for grading the disturbance intensity.
Objective LayerCriterion LayerAssessment IndexMeasure IndexGrading StandardAssignment QuantitativeLevelData Source
Disturbance intensityClimateMeteoric watersAnnual precipitation/mm≤14009Very highClimate Bulletin of Shenzhen Municipality, 2019–2022
1400–16007High
1600–18005Medium
1800–20003Low
>20001Very low
Table 3. Exposure index grading criteria, assignment quantification, and weights.
Evaluation IndexClassification StandardValuation
Distance from the coast or distance from the bank/km>2/1.5–2/1.0–1.5/0.5–1.0/<0.51/3/5/7/9
Table 4. Criteria for grading, quantification, and weighting of hazard sensitivity indicators.
Assessment IndexClassification StandardValuation
Bedrock depth/m<3/3–6/6–9/9–12/>121/3/5/7/9
Table 5. Classification of vulnerability of geological bodies.
Vulnerability Score<99–1515–2525–35>35
LevelVery lowLowMediumHighVery high
Table 6. Calculation of resistance capacity.
Assessment IndexClassification ResultValuationWeightComputational Model
Early warning capabilities/WbCoverage of environmental monitoring facilities/%/100%/Pb = 5.00,
Wb = 0.7,
B = 10.07
Early warning accuracy/%/70%/
Early warning capabilities/PbHazard prevention investmentMedium50.524
Emergency techniqueMedium50.141
Hazard prevention efficiency
/Hazard response efficiency
Medium50.335
Table 7. The scope of the Shenzhen west coast seawater intrusion (SWI).
All Kinds of Areas200520152020
Total area of SWI (km2) 230170143
High-position saltwater aquaculture (km2) 58133
Total invasion area (km2) 288183146
Coastal reclamation area (km2) 444953
Total332232199
Source: Shenzhen west coast of the evolution process of SWI [40].
Table 8. Classification of resilience levels.
Resilience Levels<0.50.5–0.80.8–1.01.0–2.0>2.0
LevelVery lowLowMediumHighVery high
Table 9. Groundwater chemical analysis of Shenzhen coastal areas.
NumberDistance from the CoastCa2+ (mg/L)Mg2+ (mg/L)Cl (mg/L)SO42− (mg/L)Total Salinity (mg/L)Degree of SWI
ZK1700.00 310.30 15.70 2128.90 390.50 4047.80 Severe intrusion
ZK21600.00 302.52 77.15 1121.75 559.12 1868.92 Severe intrusion
ZK31200.00 229.00 1.00 1429.30 304.20 2848.70 Severe intrusion
ZK4750.00 357.35 173.50 3541.52 500.00 4651.73 Severe intrusion
ZK5900.00 84.56 192.46 1378.30 800.00 3265.03 Severe intrusion
ZK64200.00 26.40 2.43 31.32 19.17 116.97 No intrusion
ZK72100.00 70.84 7.77 13.16 56.28 /No intrusion
ZK81900.00 /18.03 32.16 133.13 391.43 No intrusion
Table 10. Groundwater monitoring points in Shenzhen city.
RegionNumber of Monitoring StationsMonitoring Program
The Temperature and Level of the WaterCl
Maozhou River15121
Western Coastal River241513
Dasha River853
Shenzhen River1383
Guanlan River12120
Longgang River16130
Pingshan River960
Dapeng Bay River1162
Daya Bay River833
Total1168625
Disclaimer/Publisher’s Note: The statements, opinions and data contained in all publications are solely those of the individual author(s) and contributor(s) and not of MDPI and/or the editor(s). MDPI and/or the editor(s) disclaim responsibility for any injury to people or property resulting from any ideas, methods, instructions or products referred to in the content.

