
Comparison of Coupled and Uncoupled Modeling of Floating Wind Farms with Shared Anchors


Abstract
1. Introduction
2. Case Study Description
2.1. Platform, Site Selection, and Load Cases
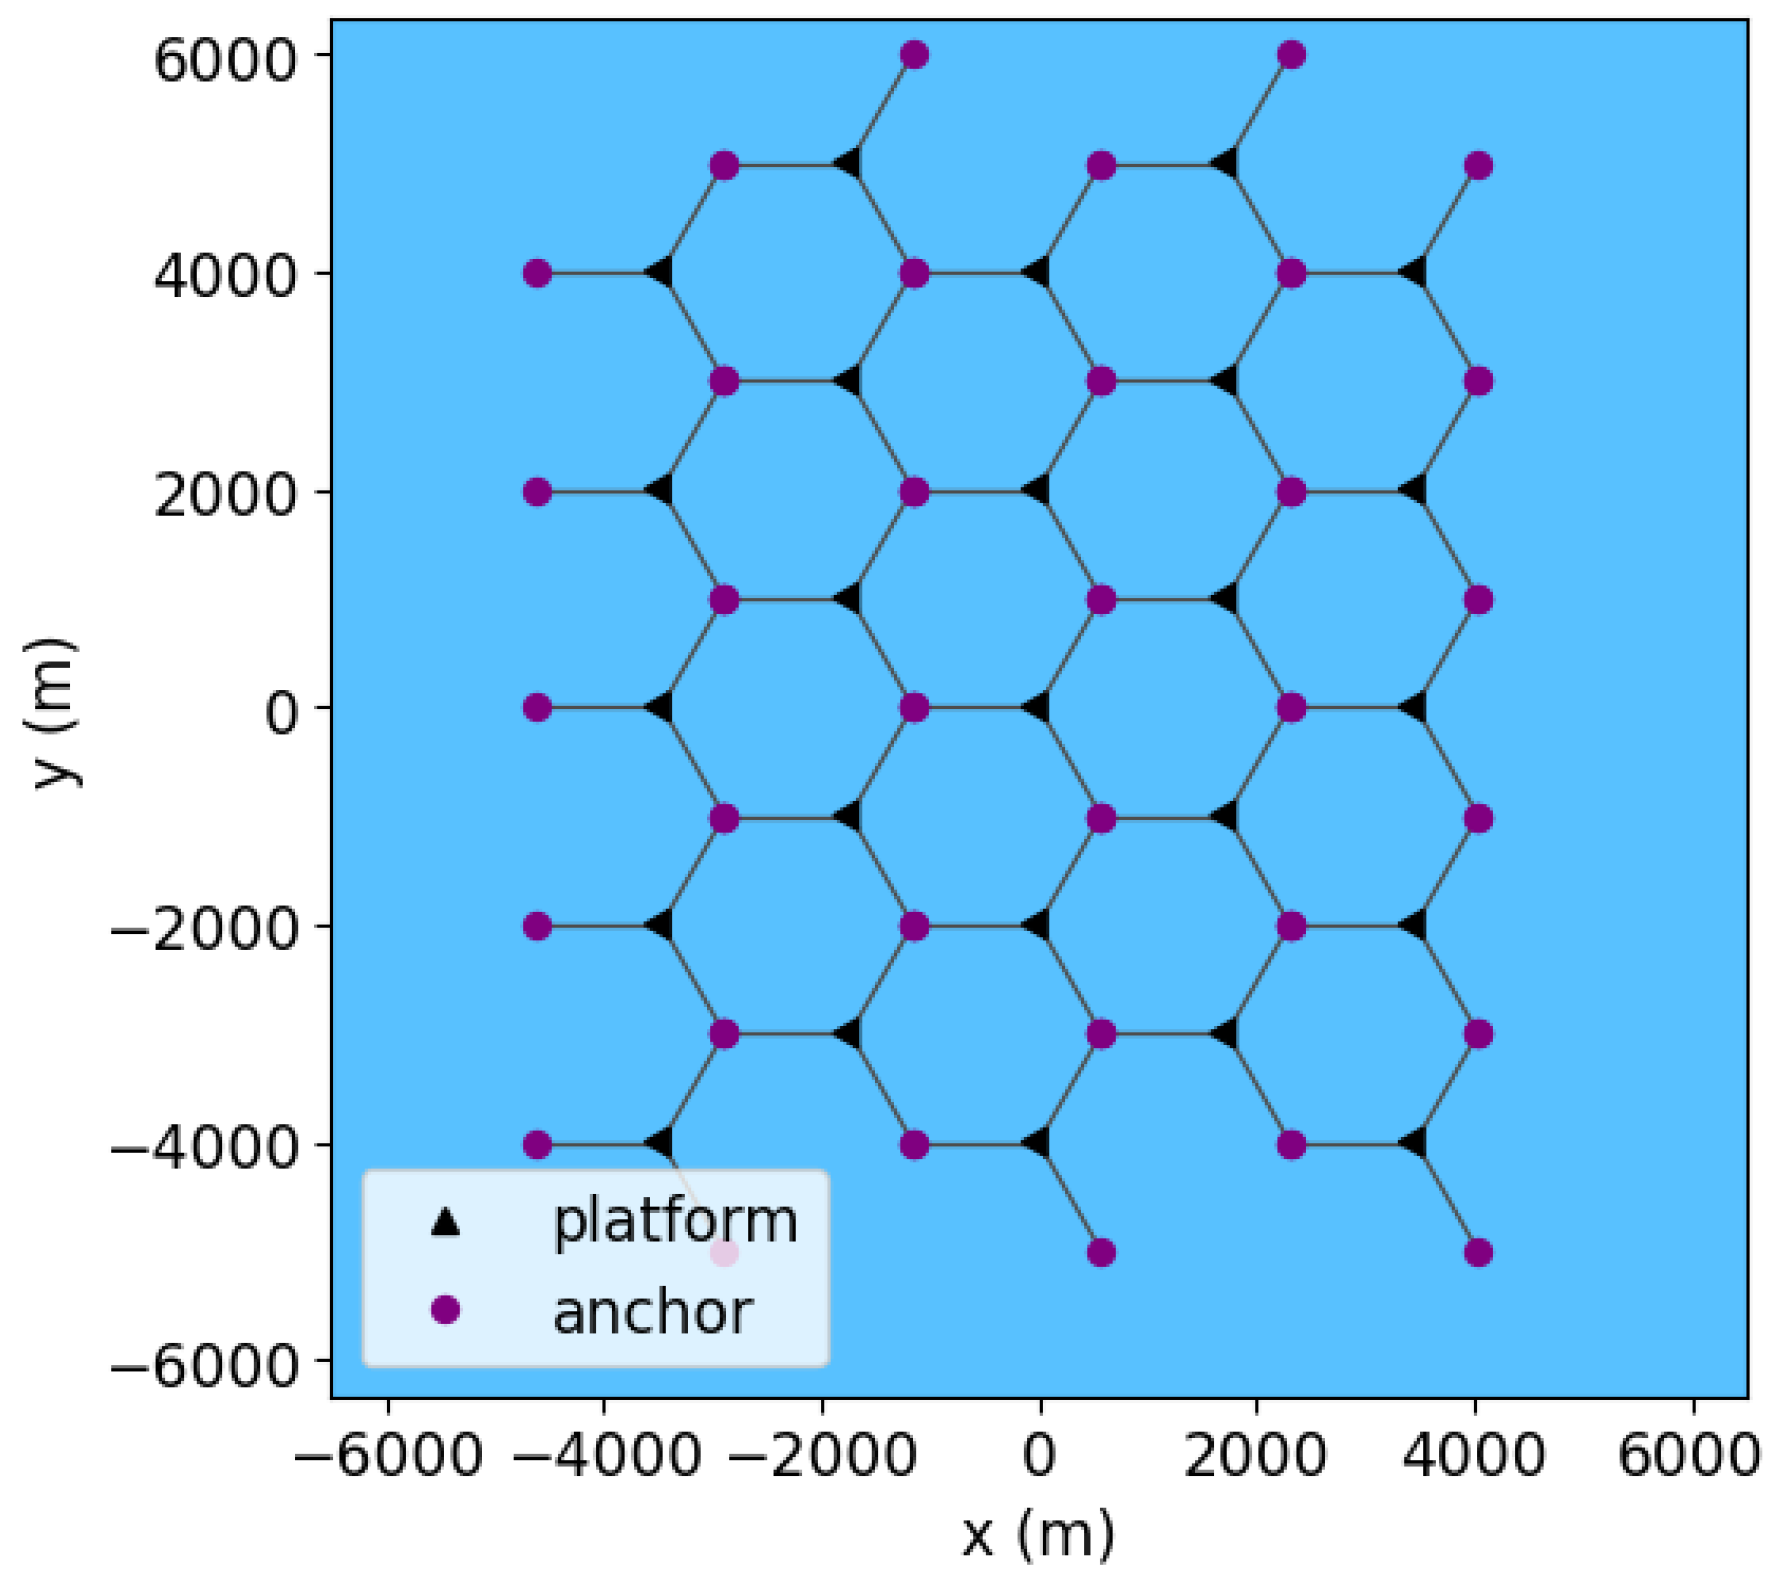
2.2. Mooring System and Farm Design
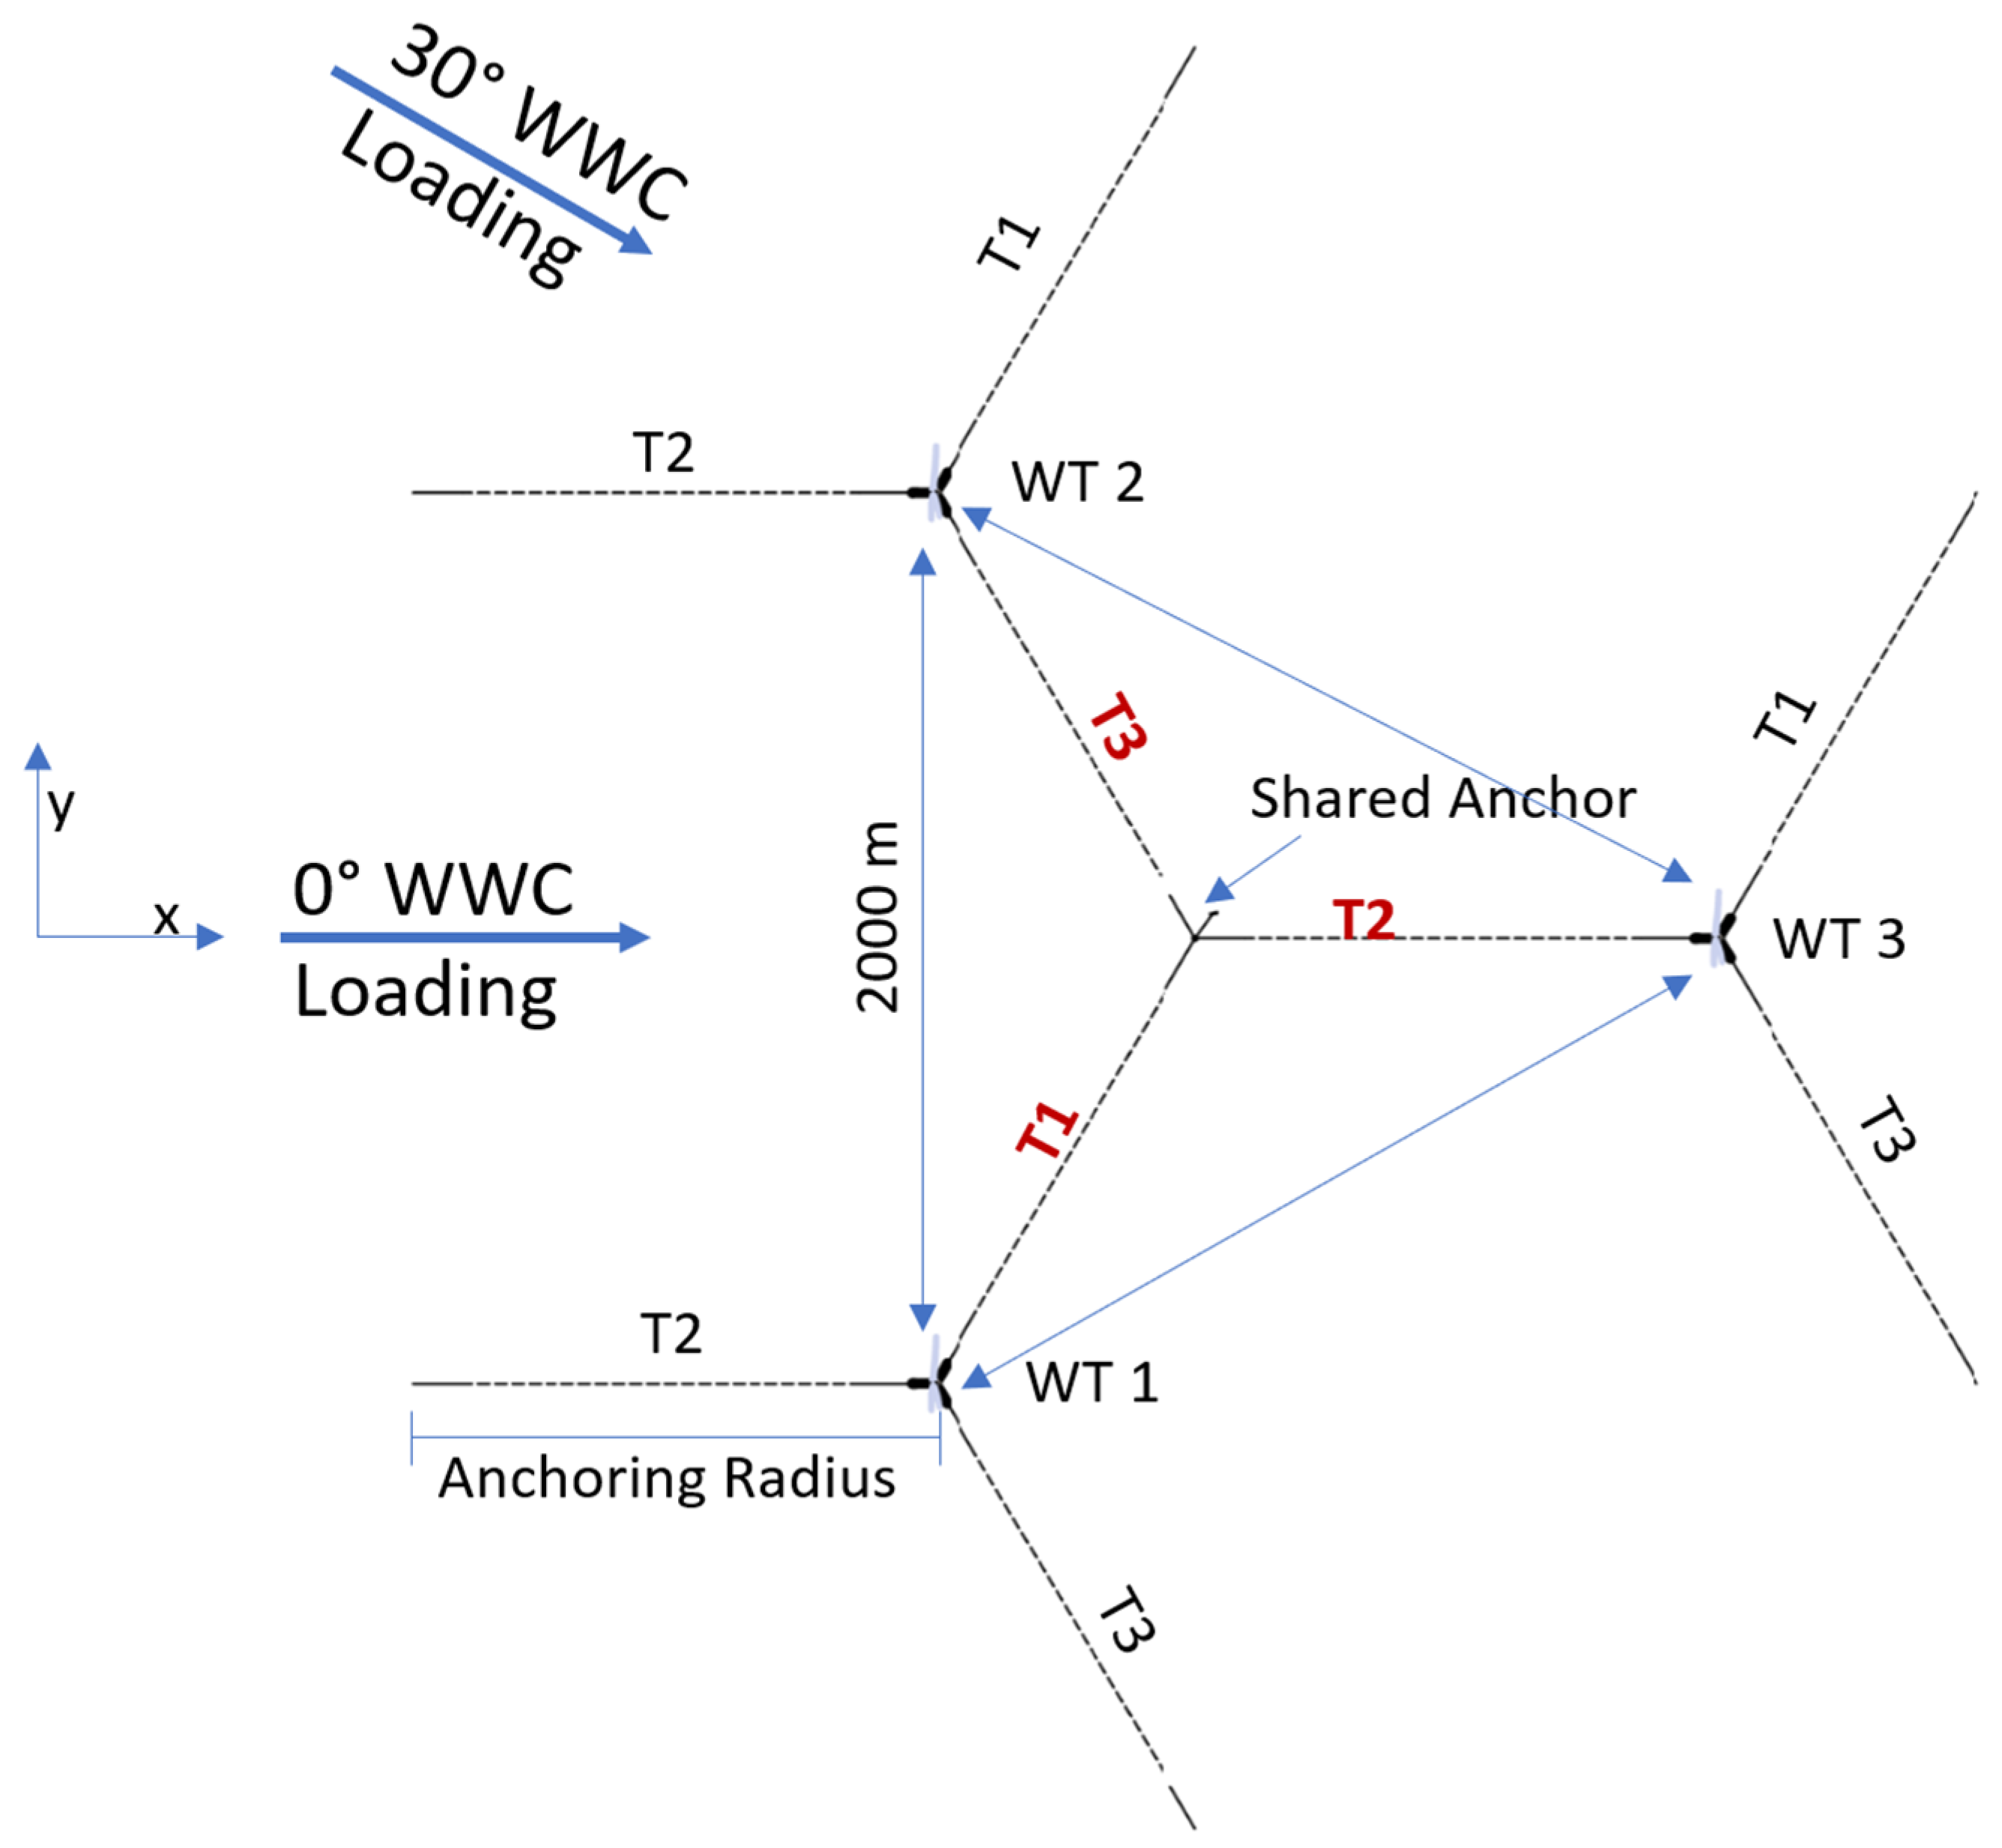
2.3. Shared Anchor Terminology
3. Simulation Setup
3.1. Uncoupled Modeling with OpenFAST
3.2. Coupled Modeling with FAST.Farm
3.3. Impact of Current and Wave Loading on Mooring Line Dynamics
4. Results
4.1. Wave Field Impacts
4.1.1. Anchor Forces for 0° WWC
4.1.2. Multiline Force Directionality for 0° WWC
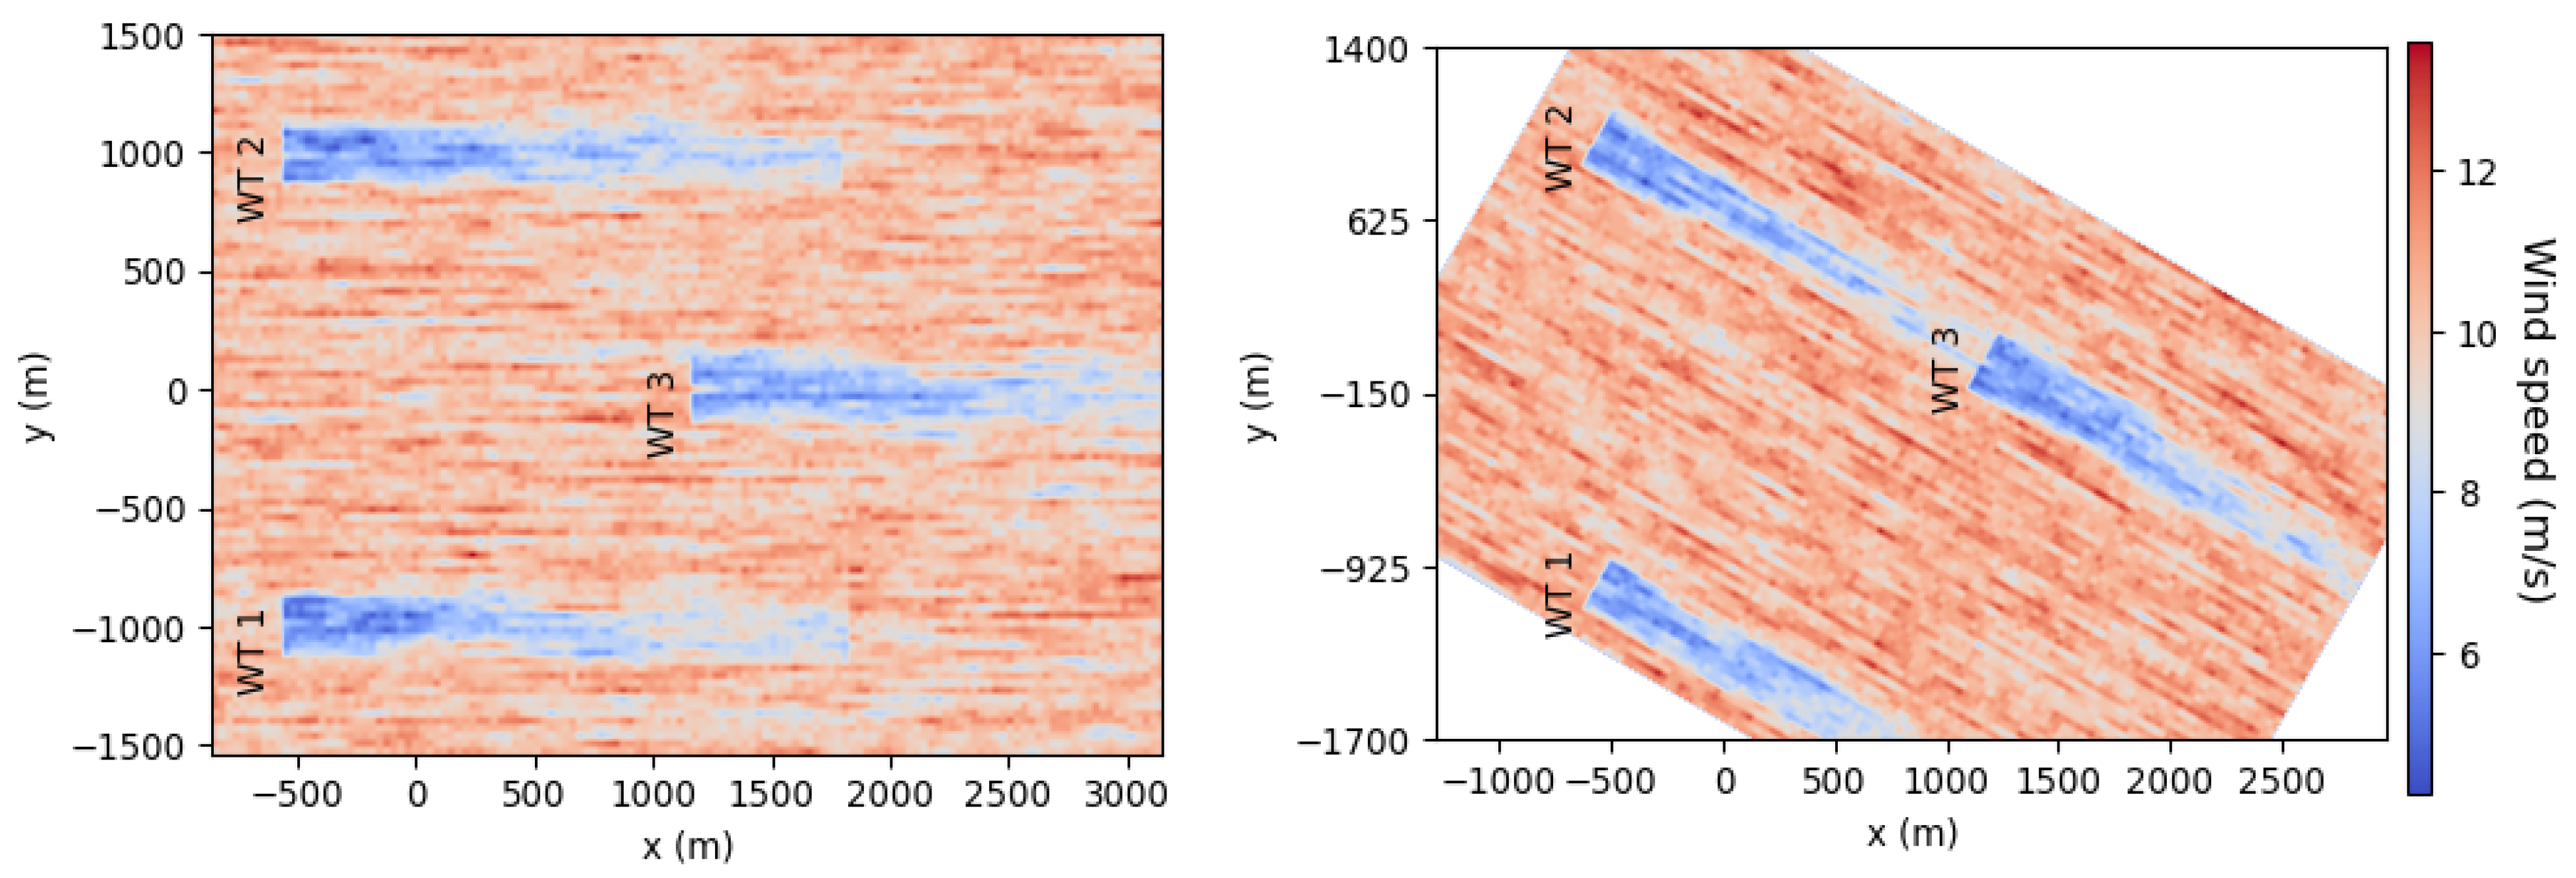
4.2. Wake Impacts
4.2.1. Evaluation of Wake Effects
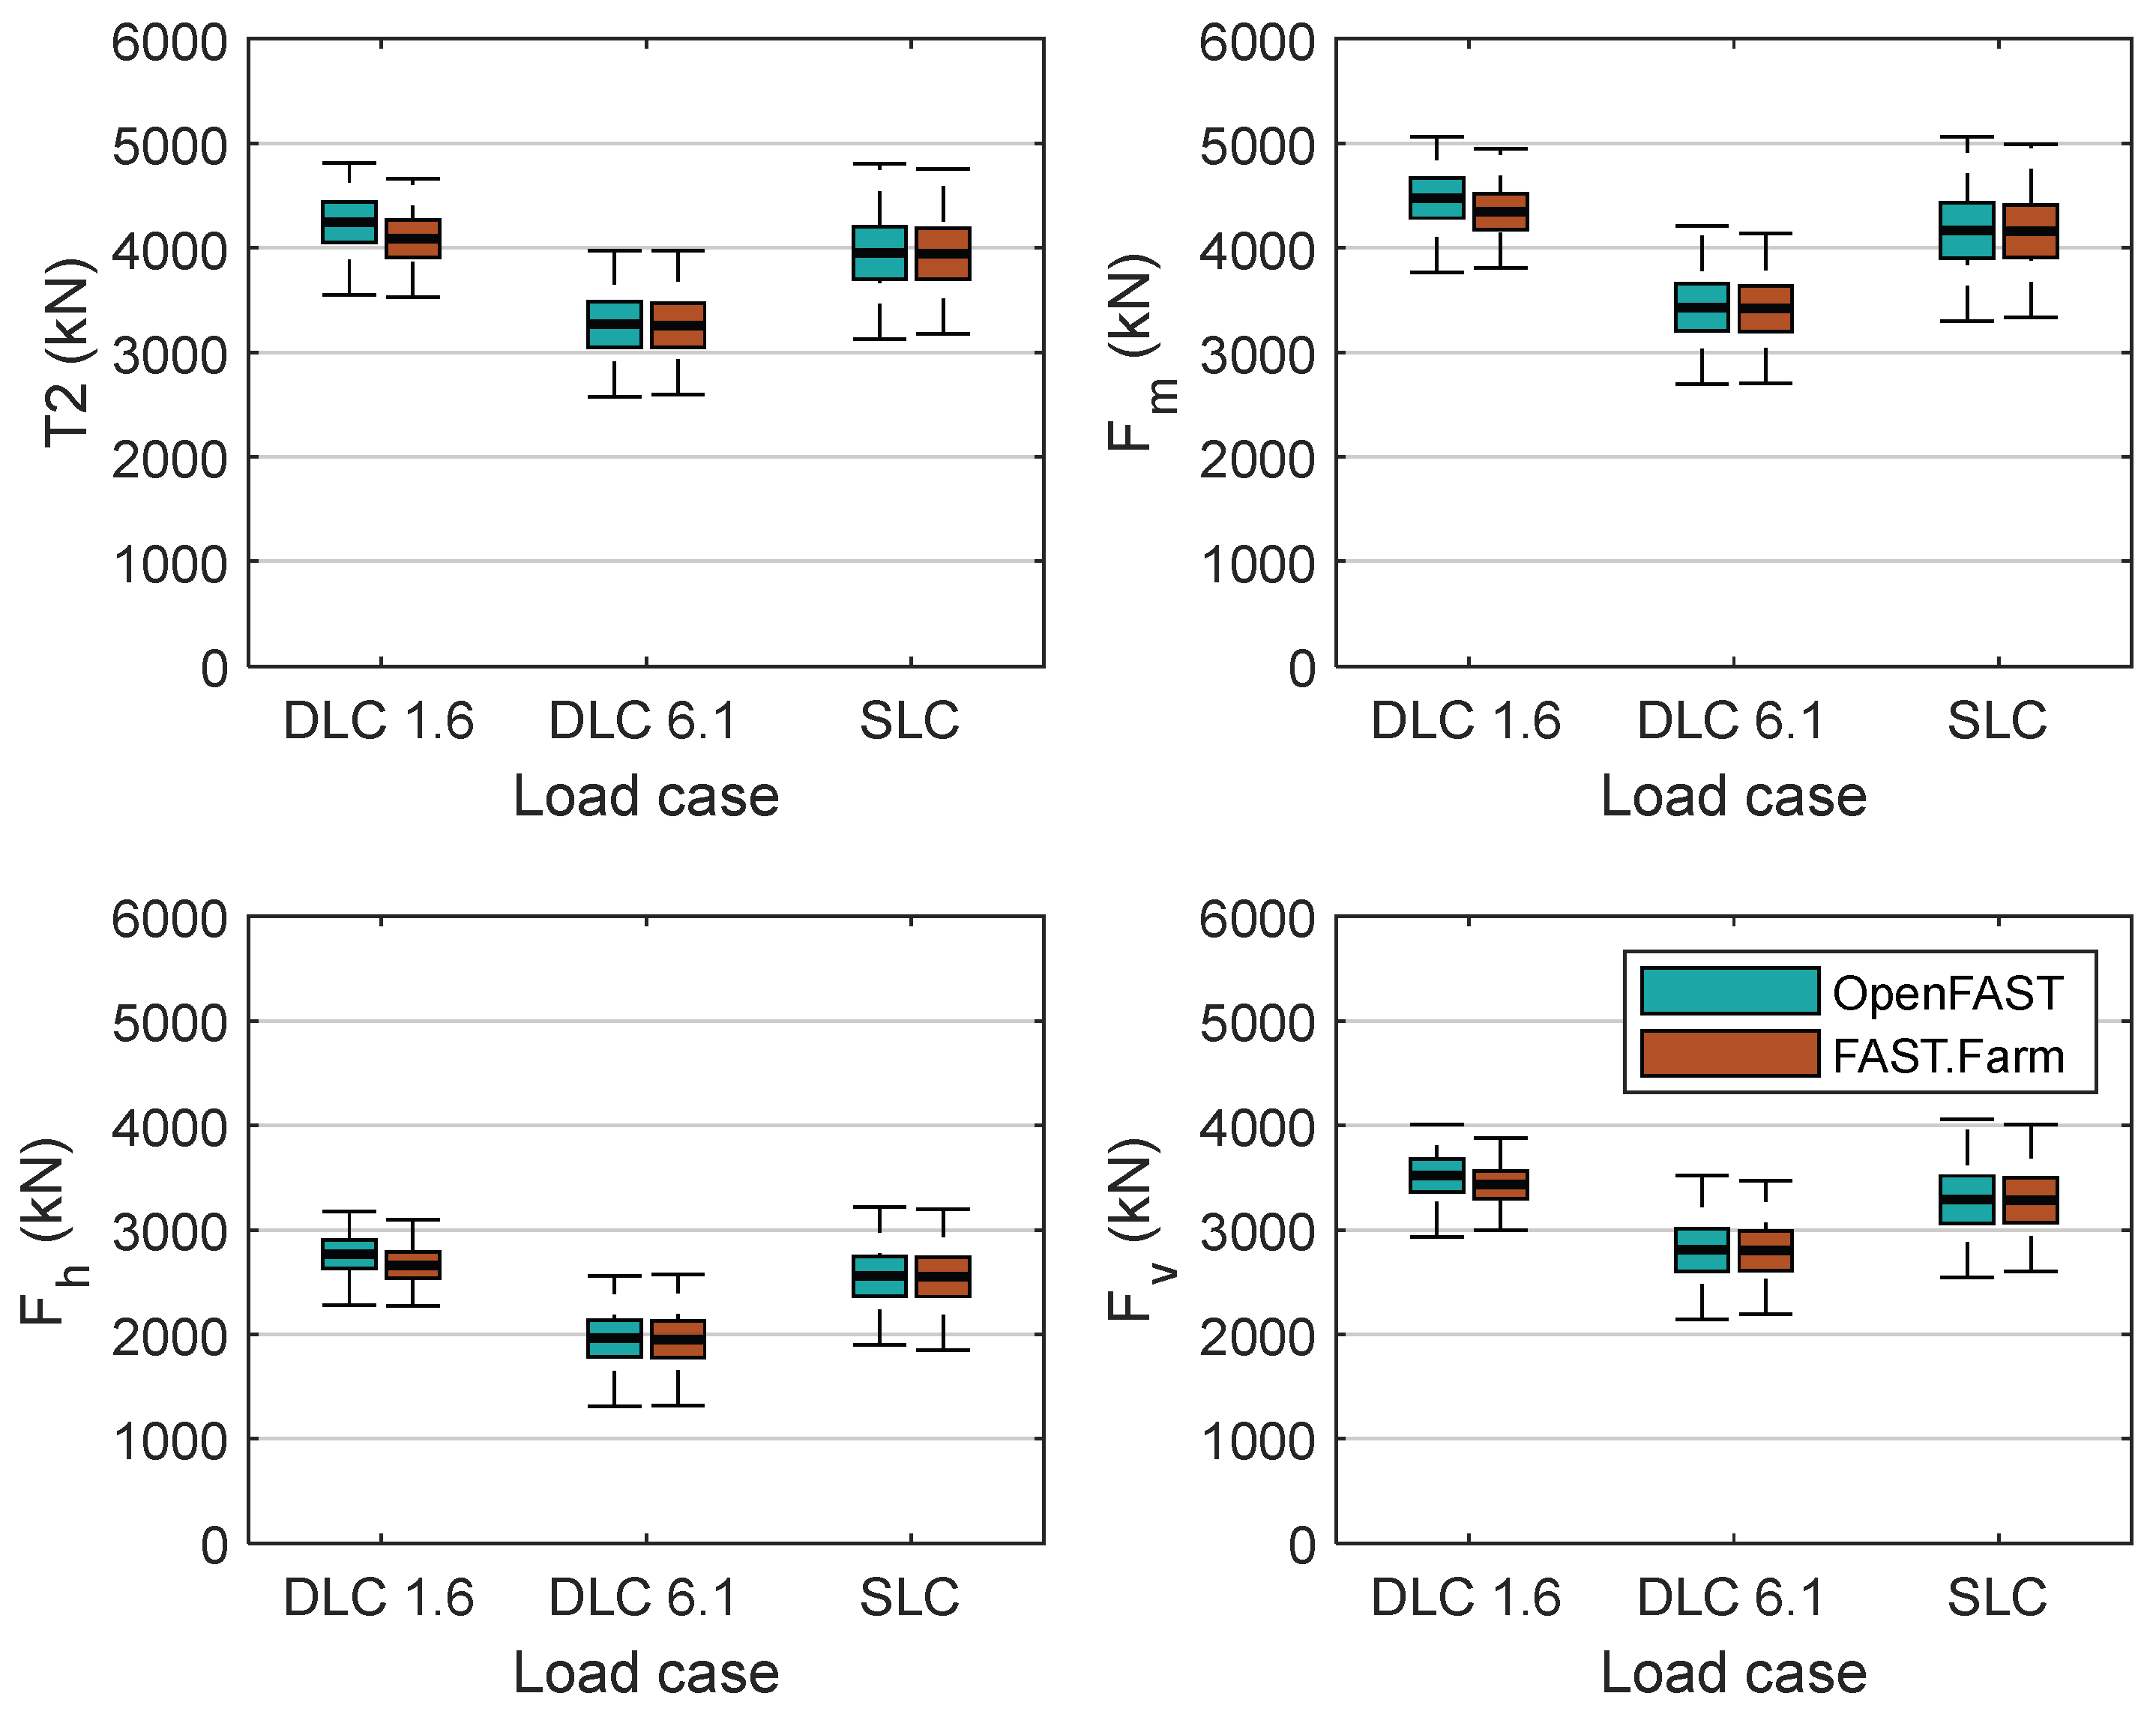
4.2.2. Anchor Forces for 30° WWC
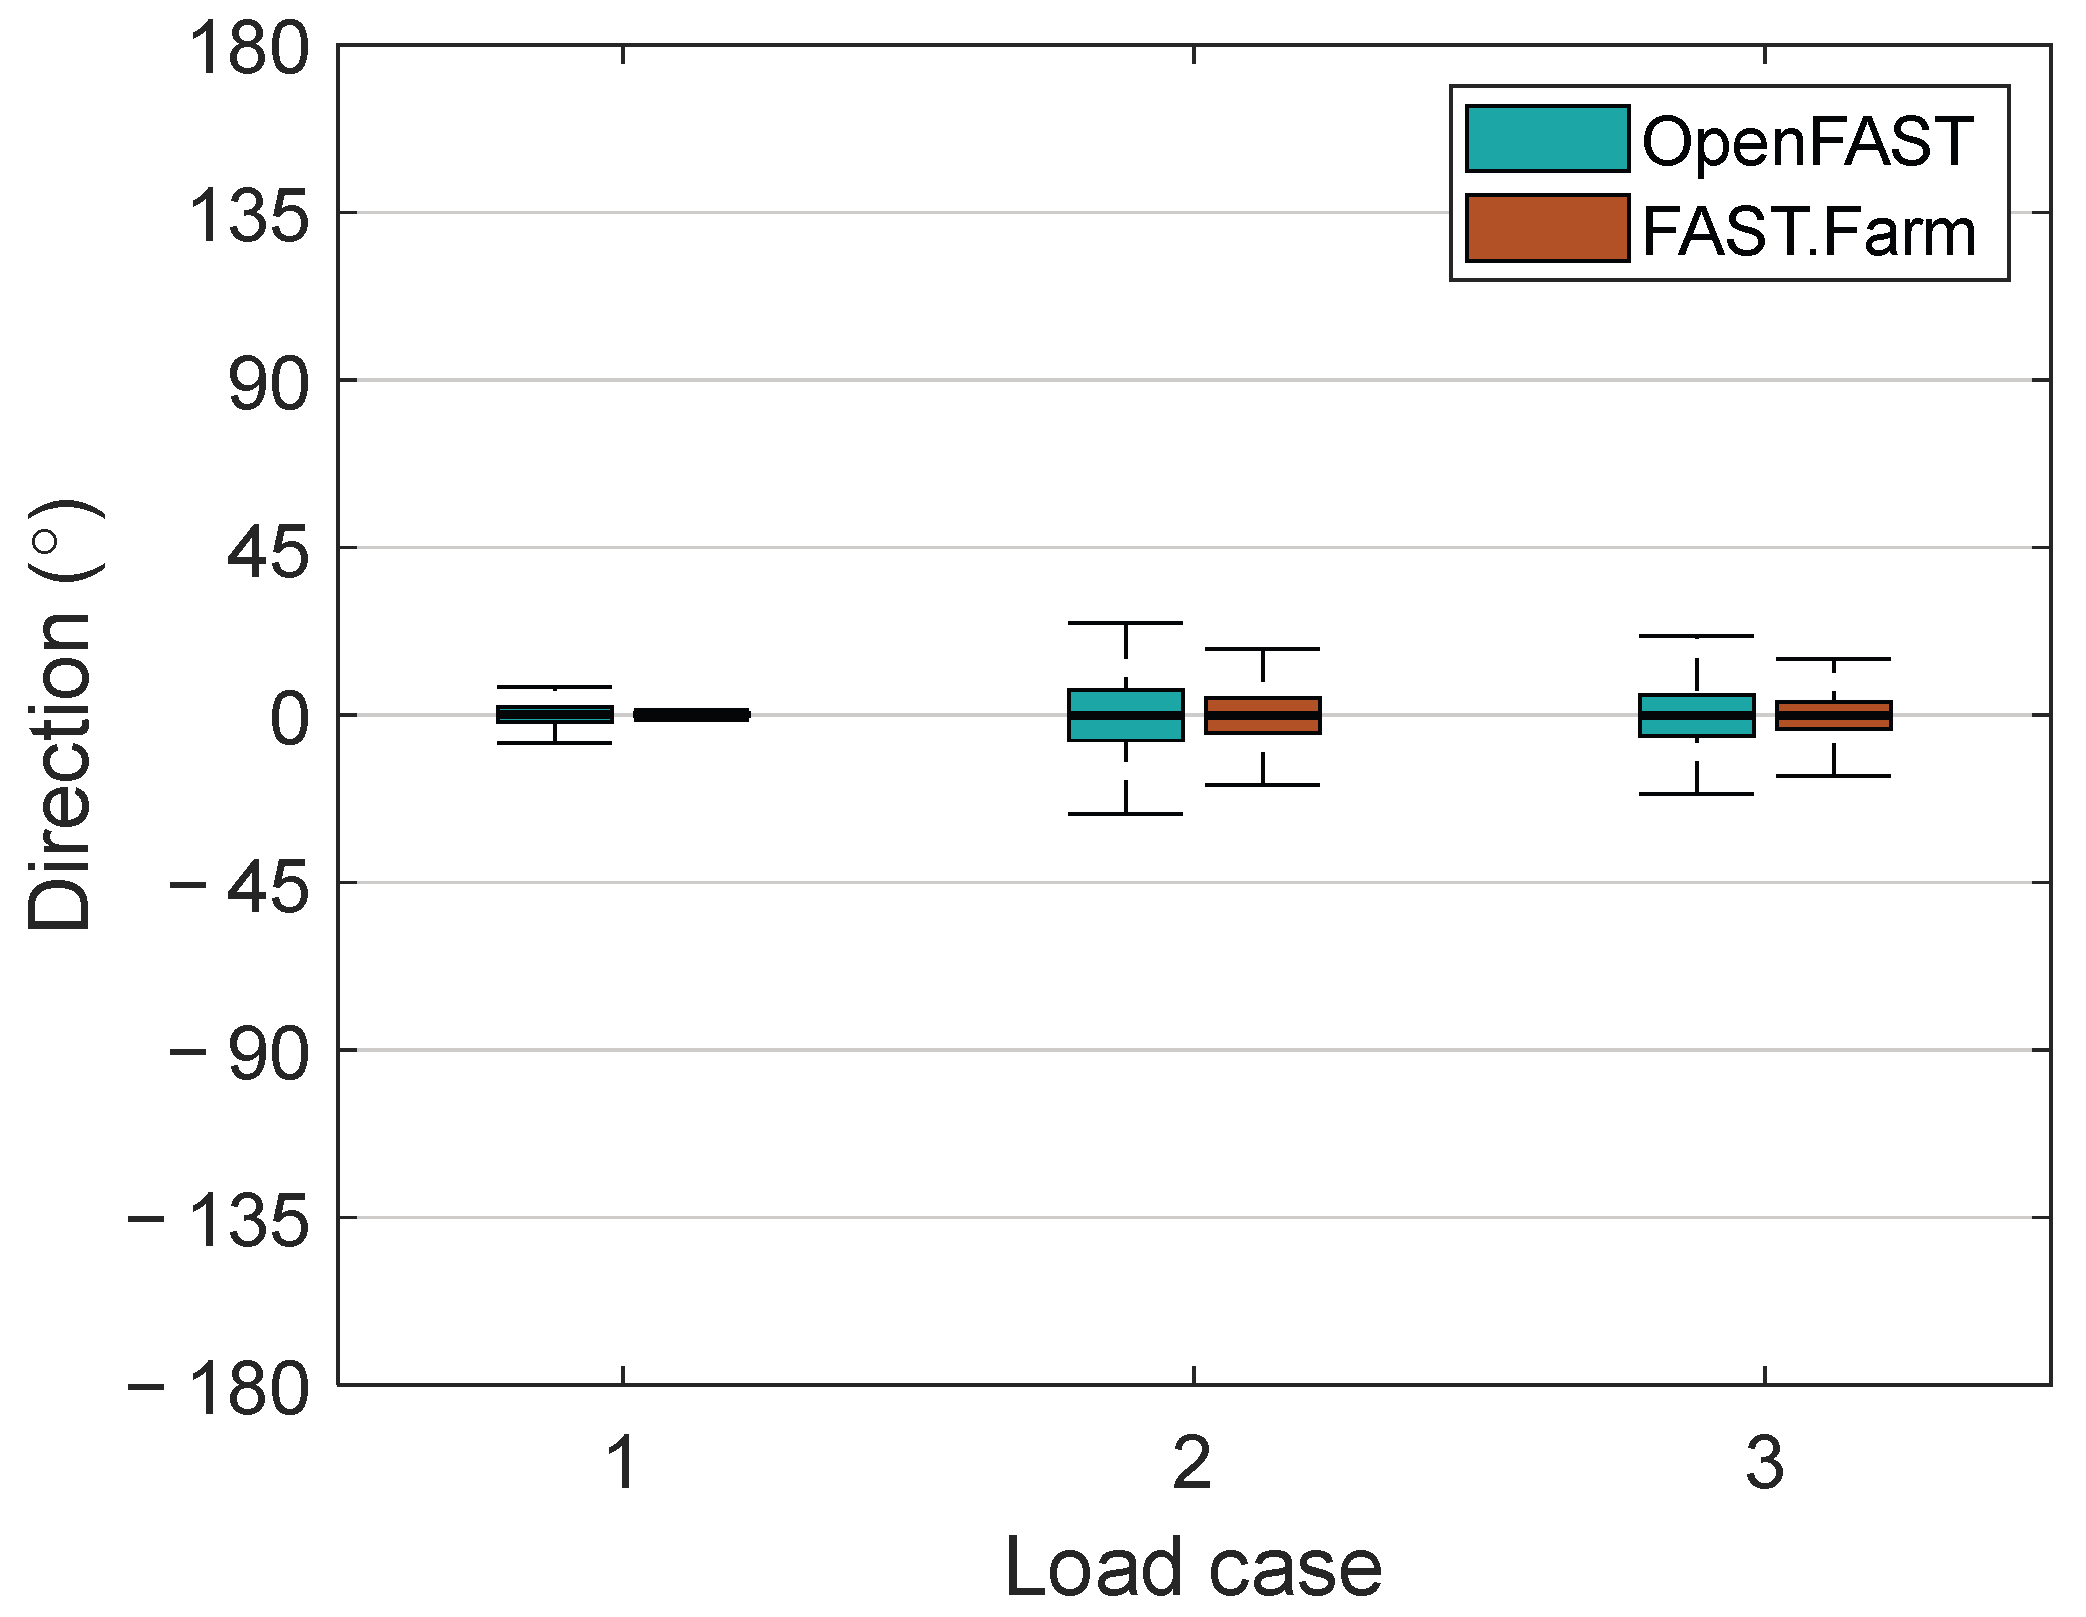
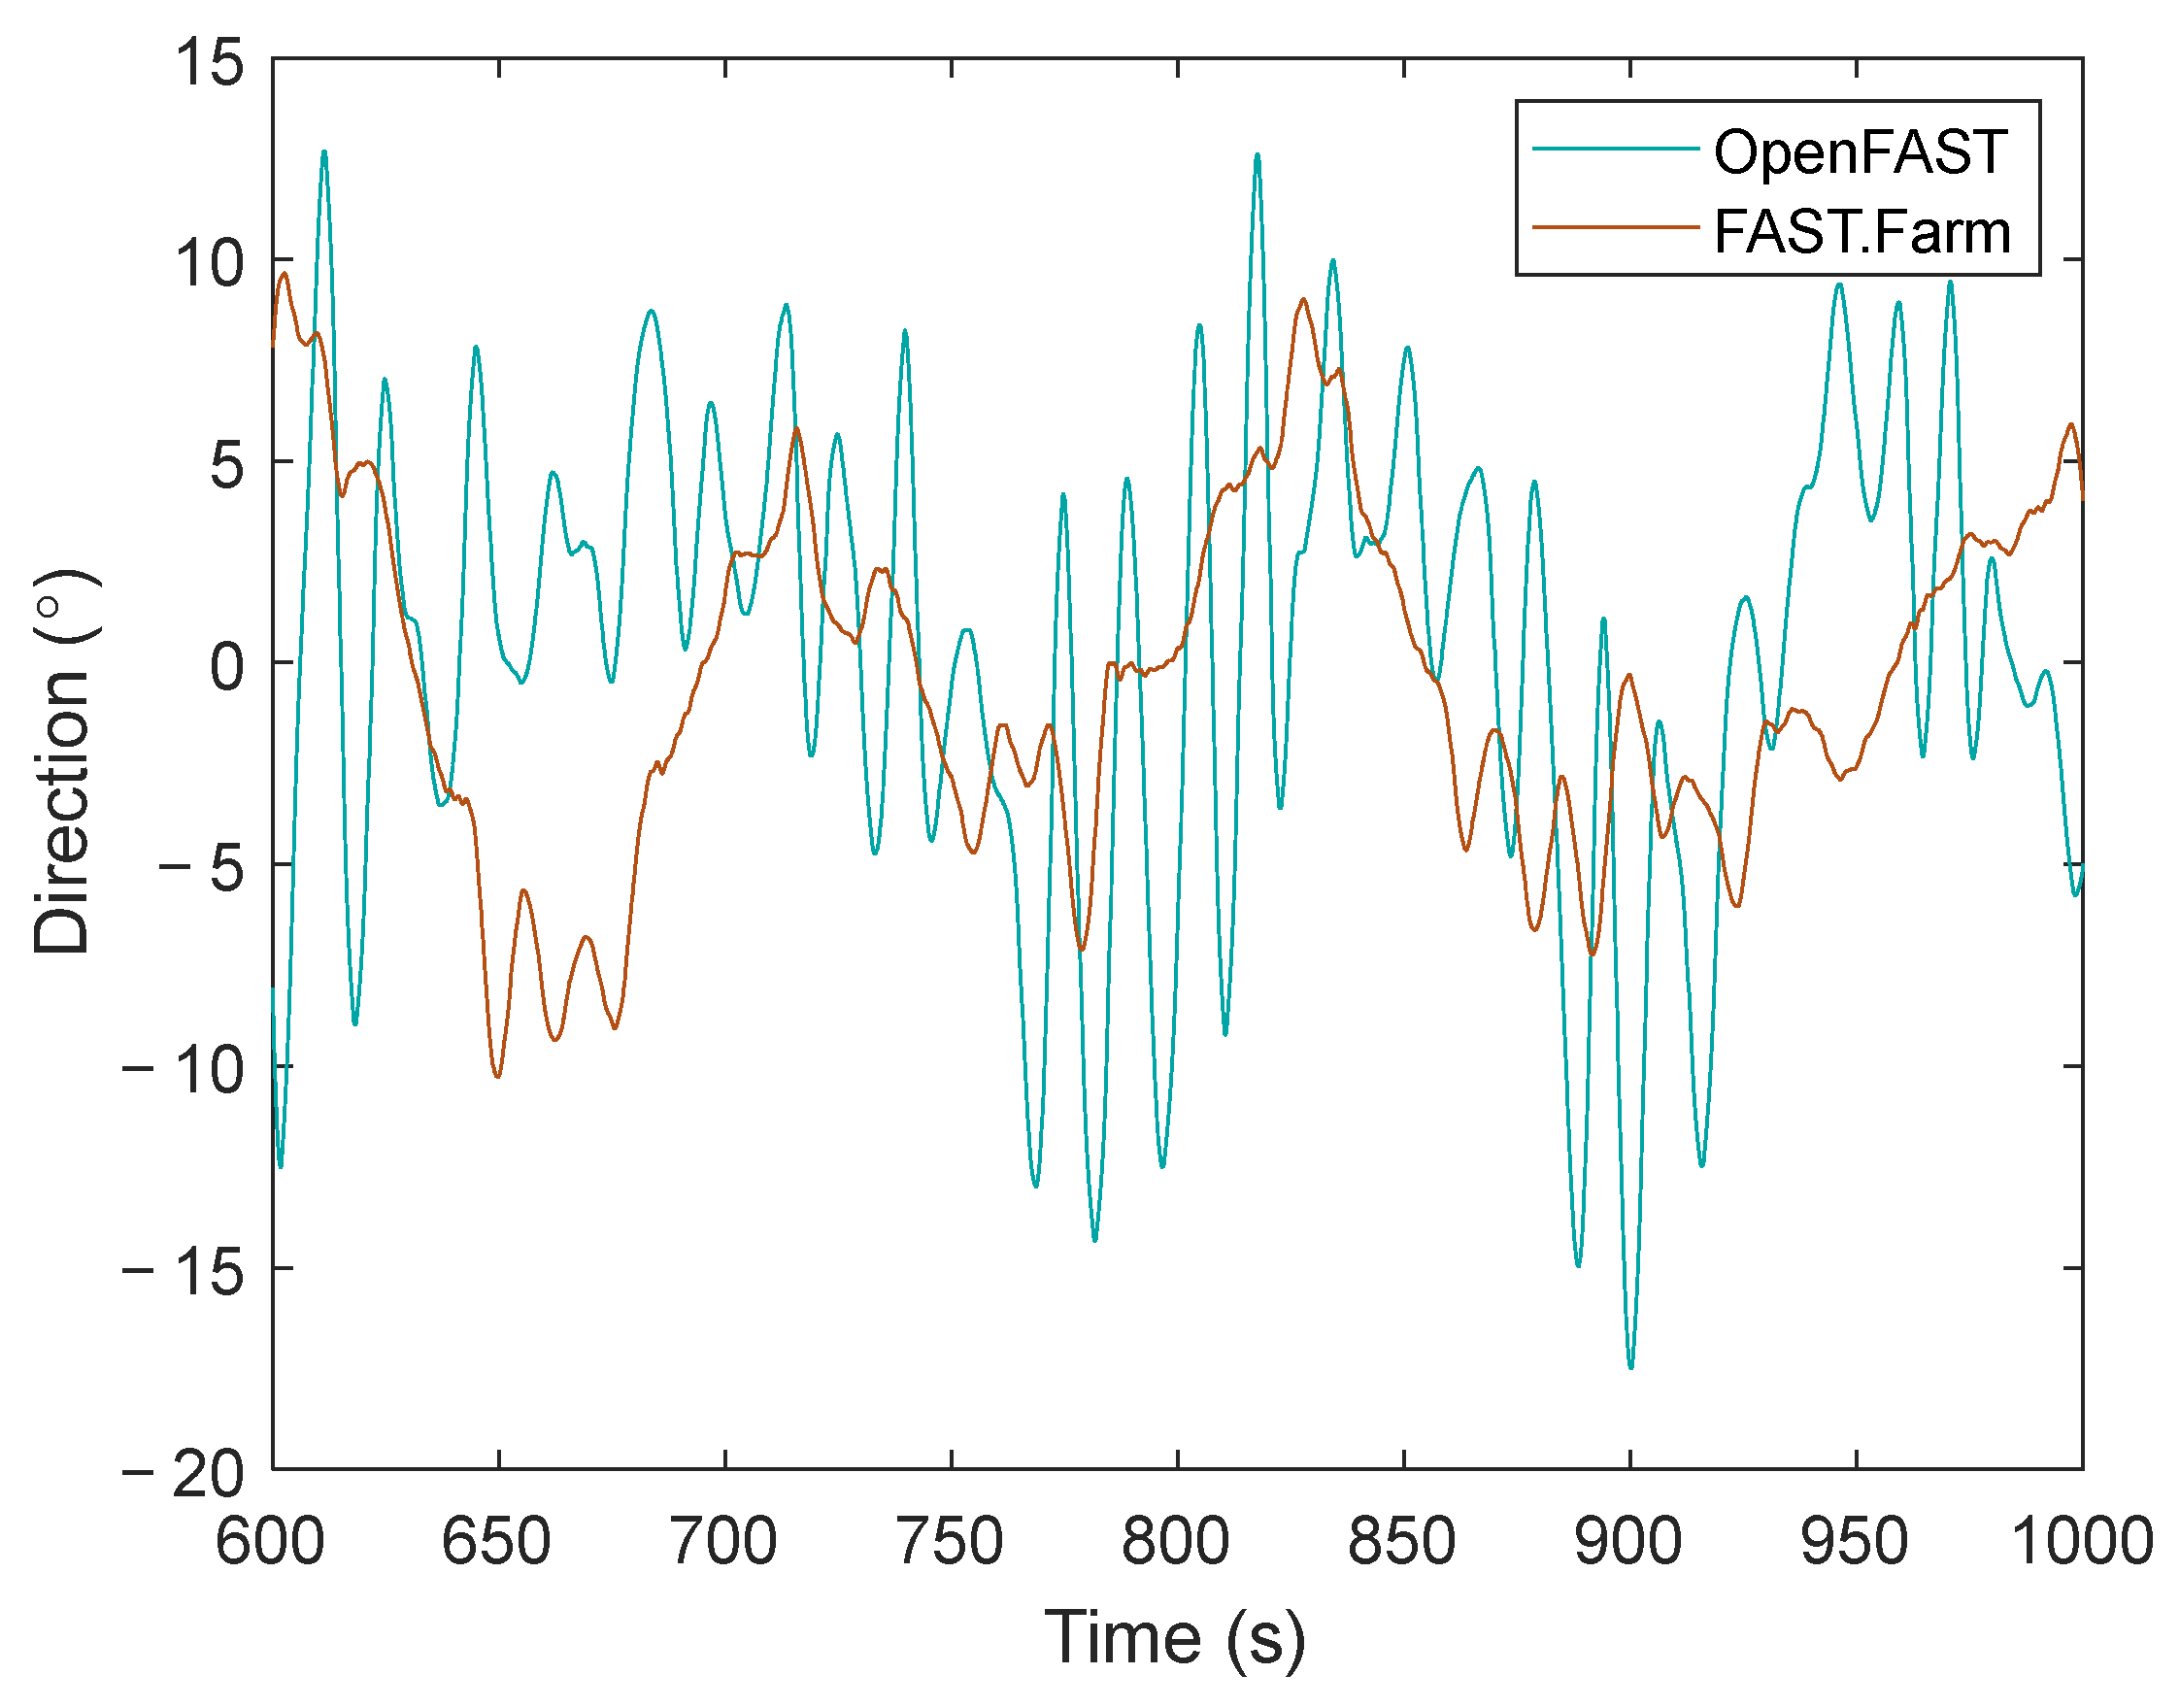
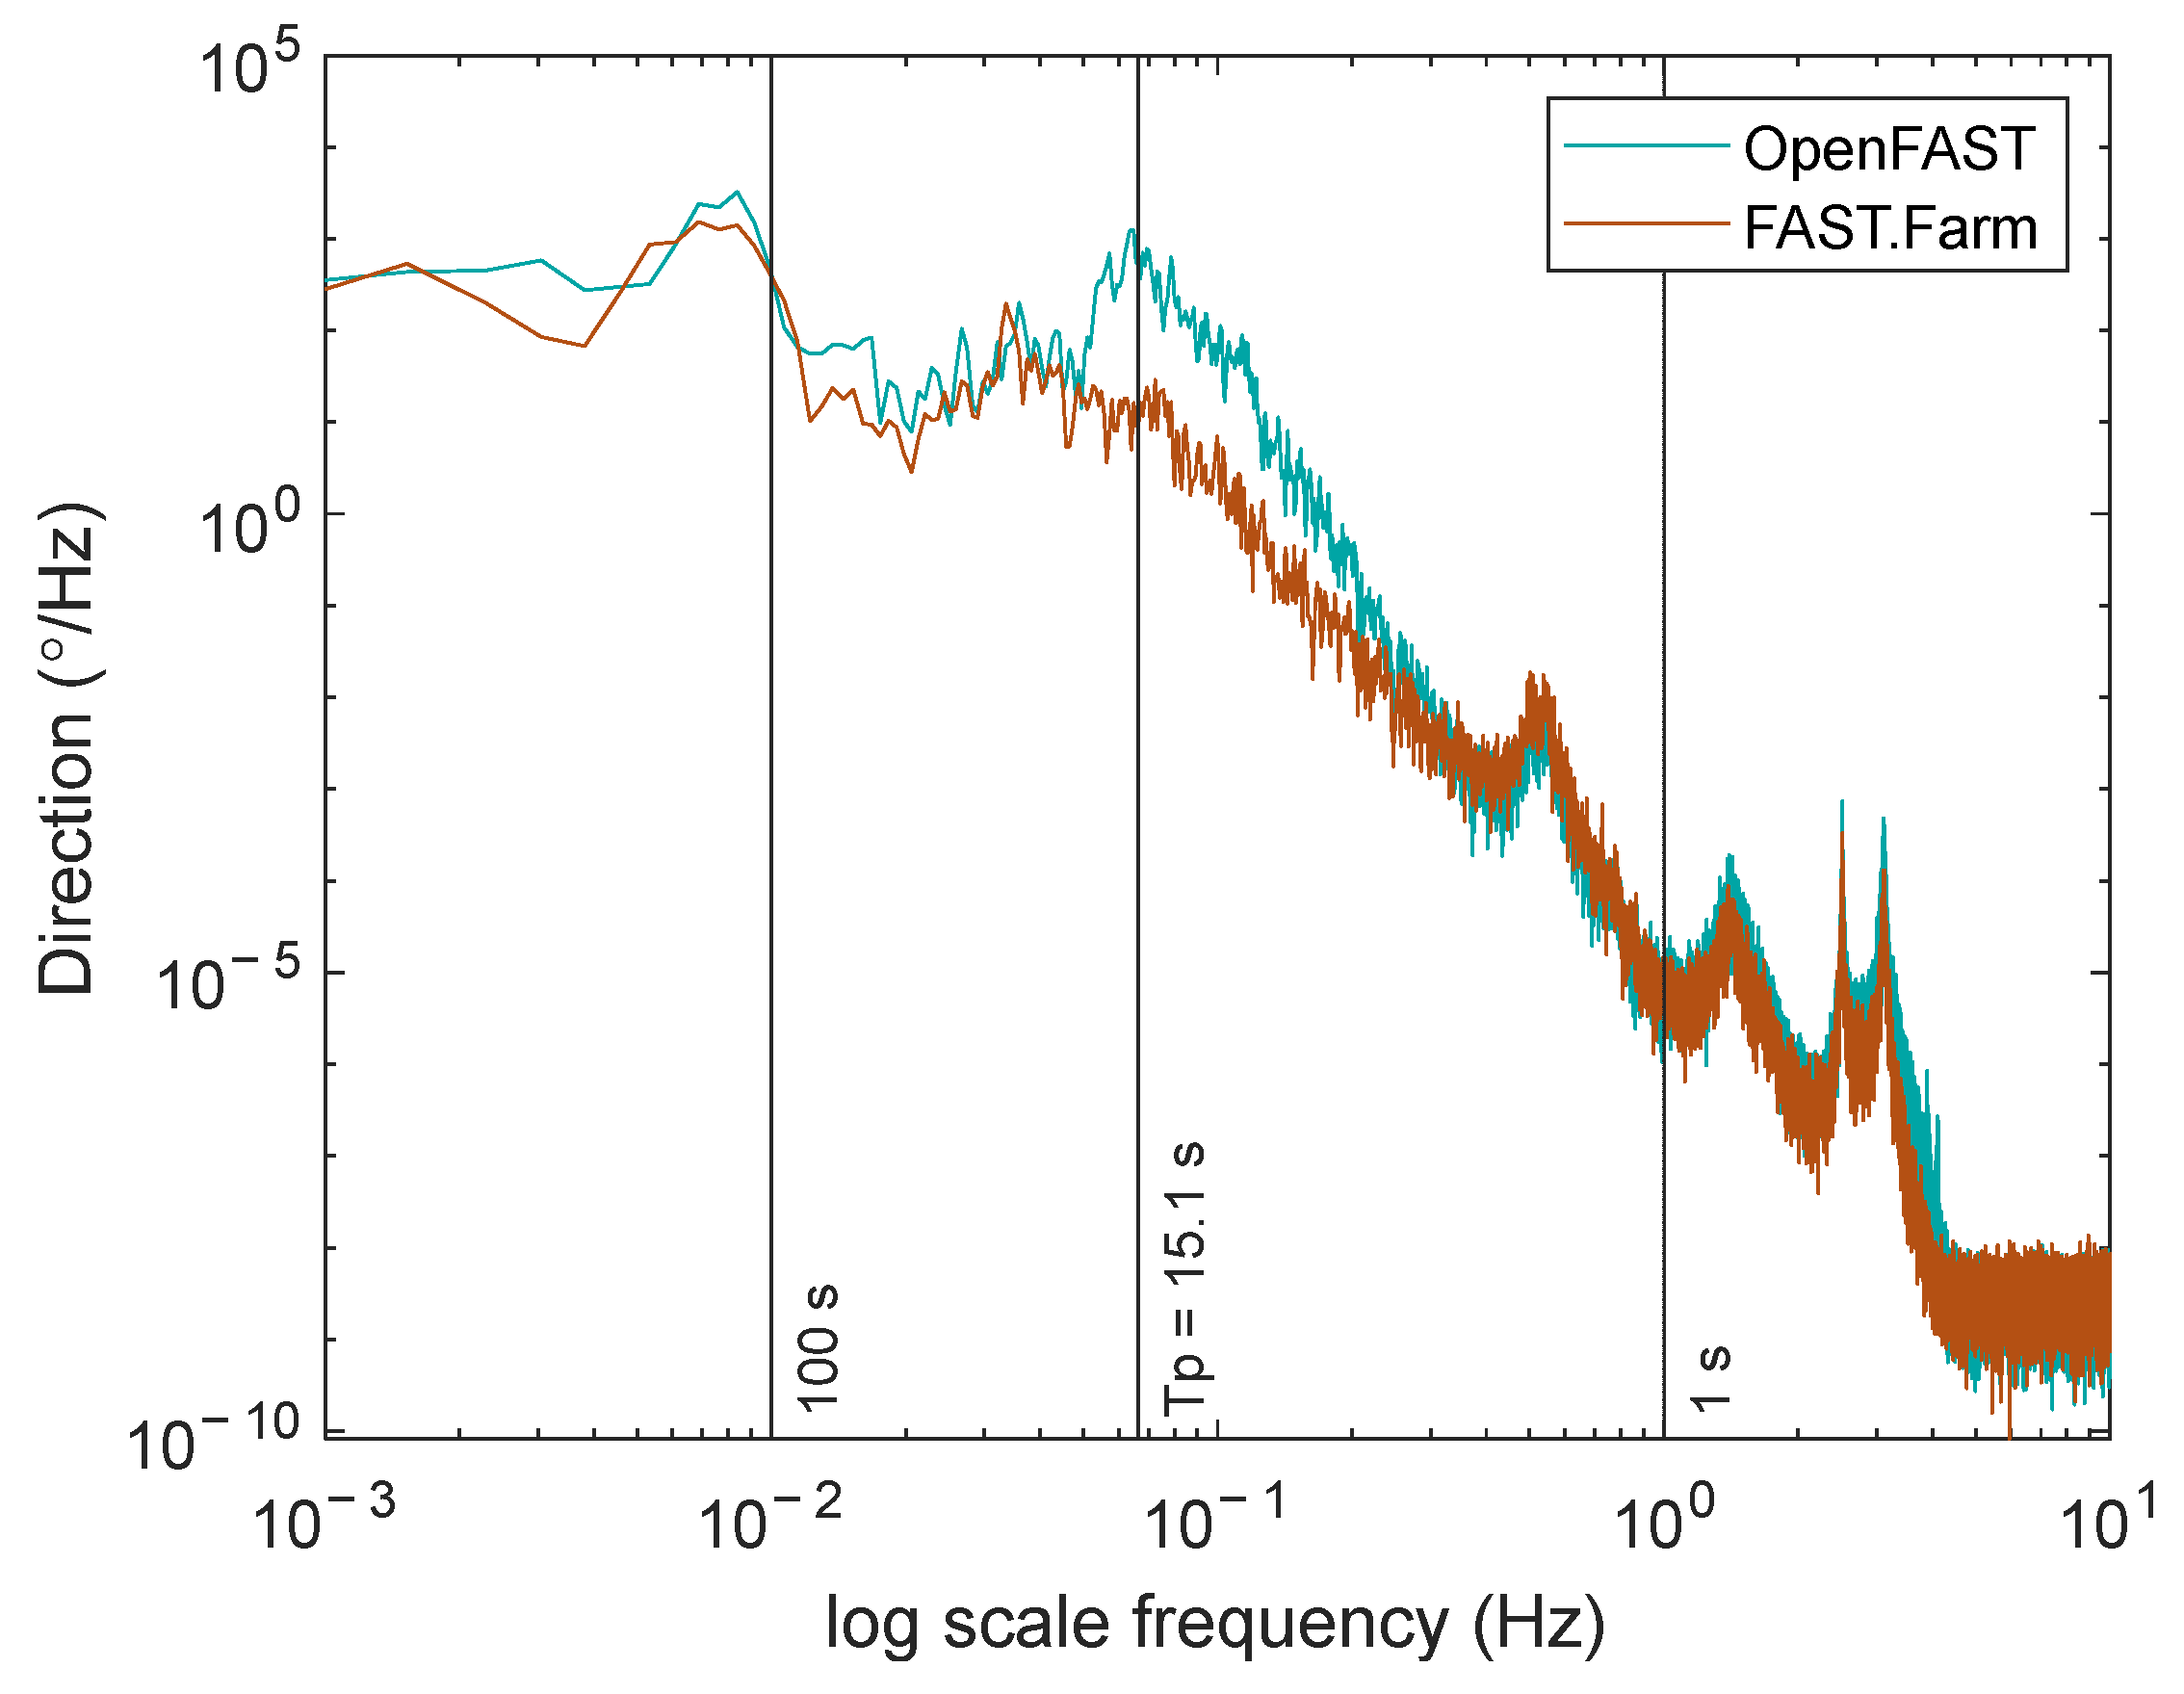
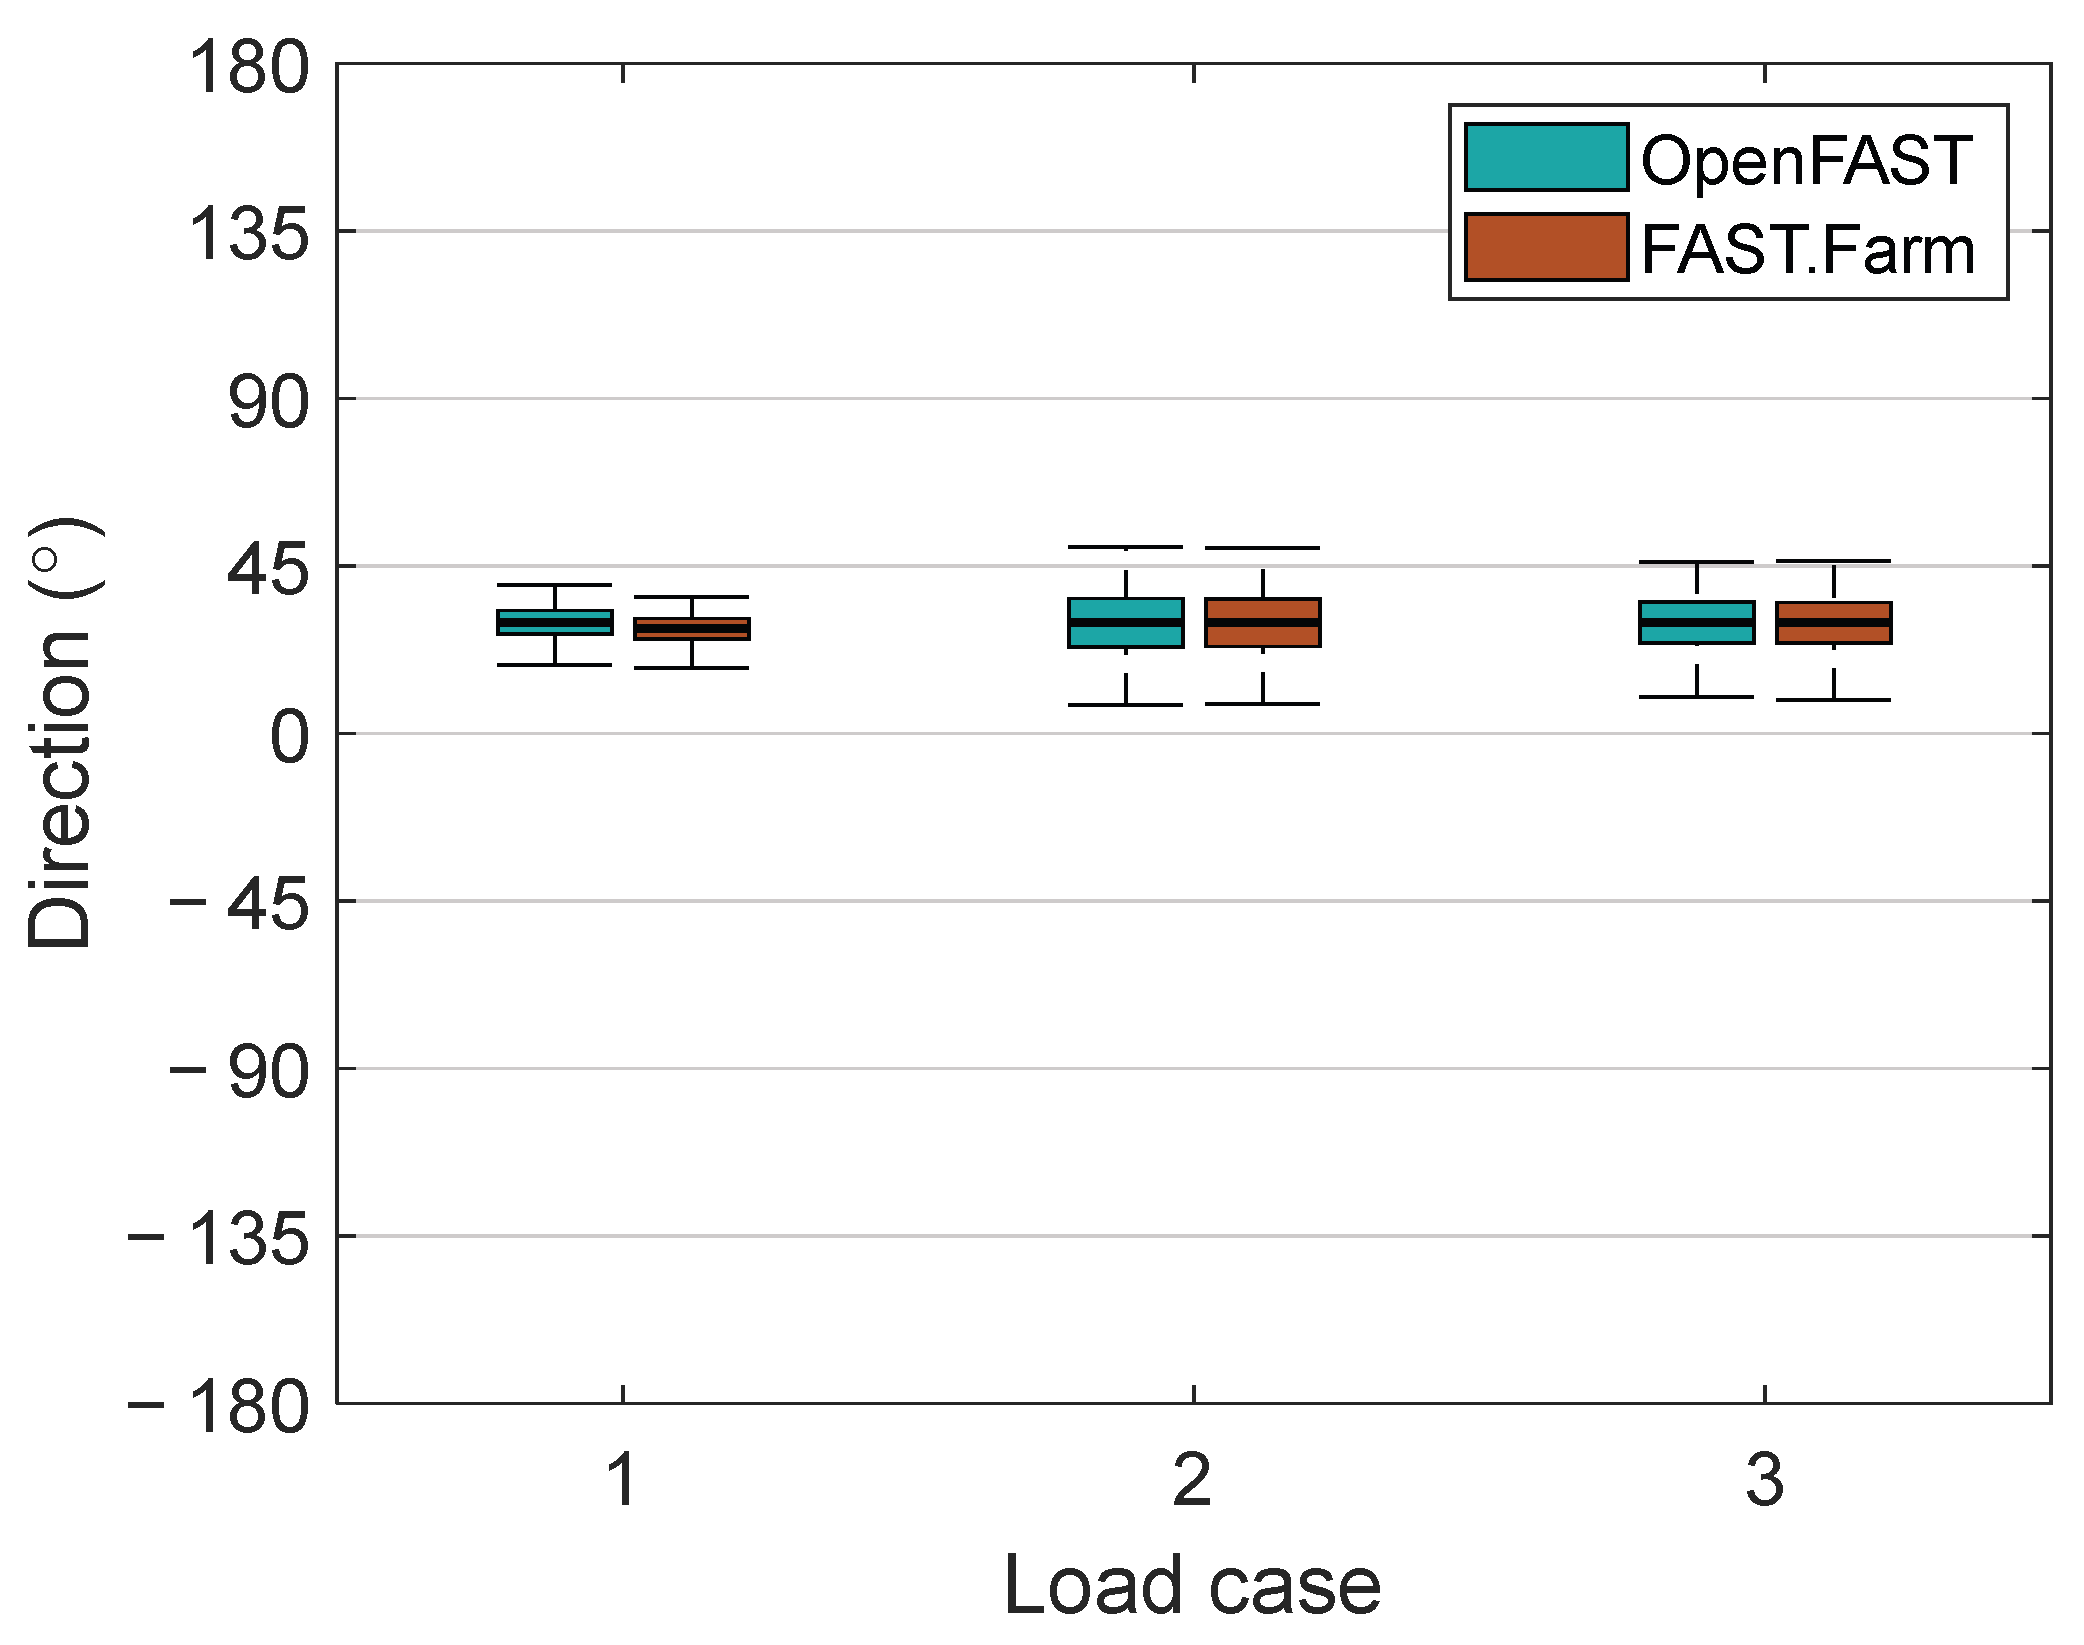
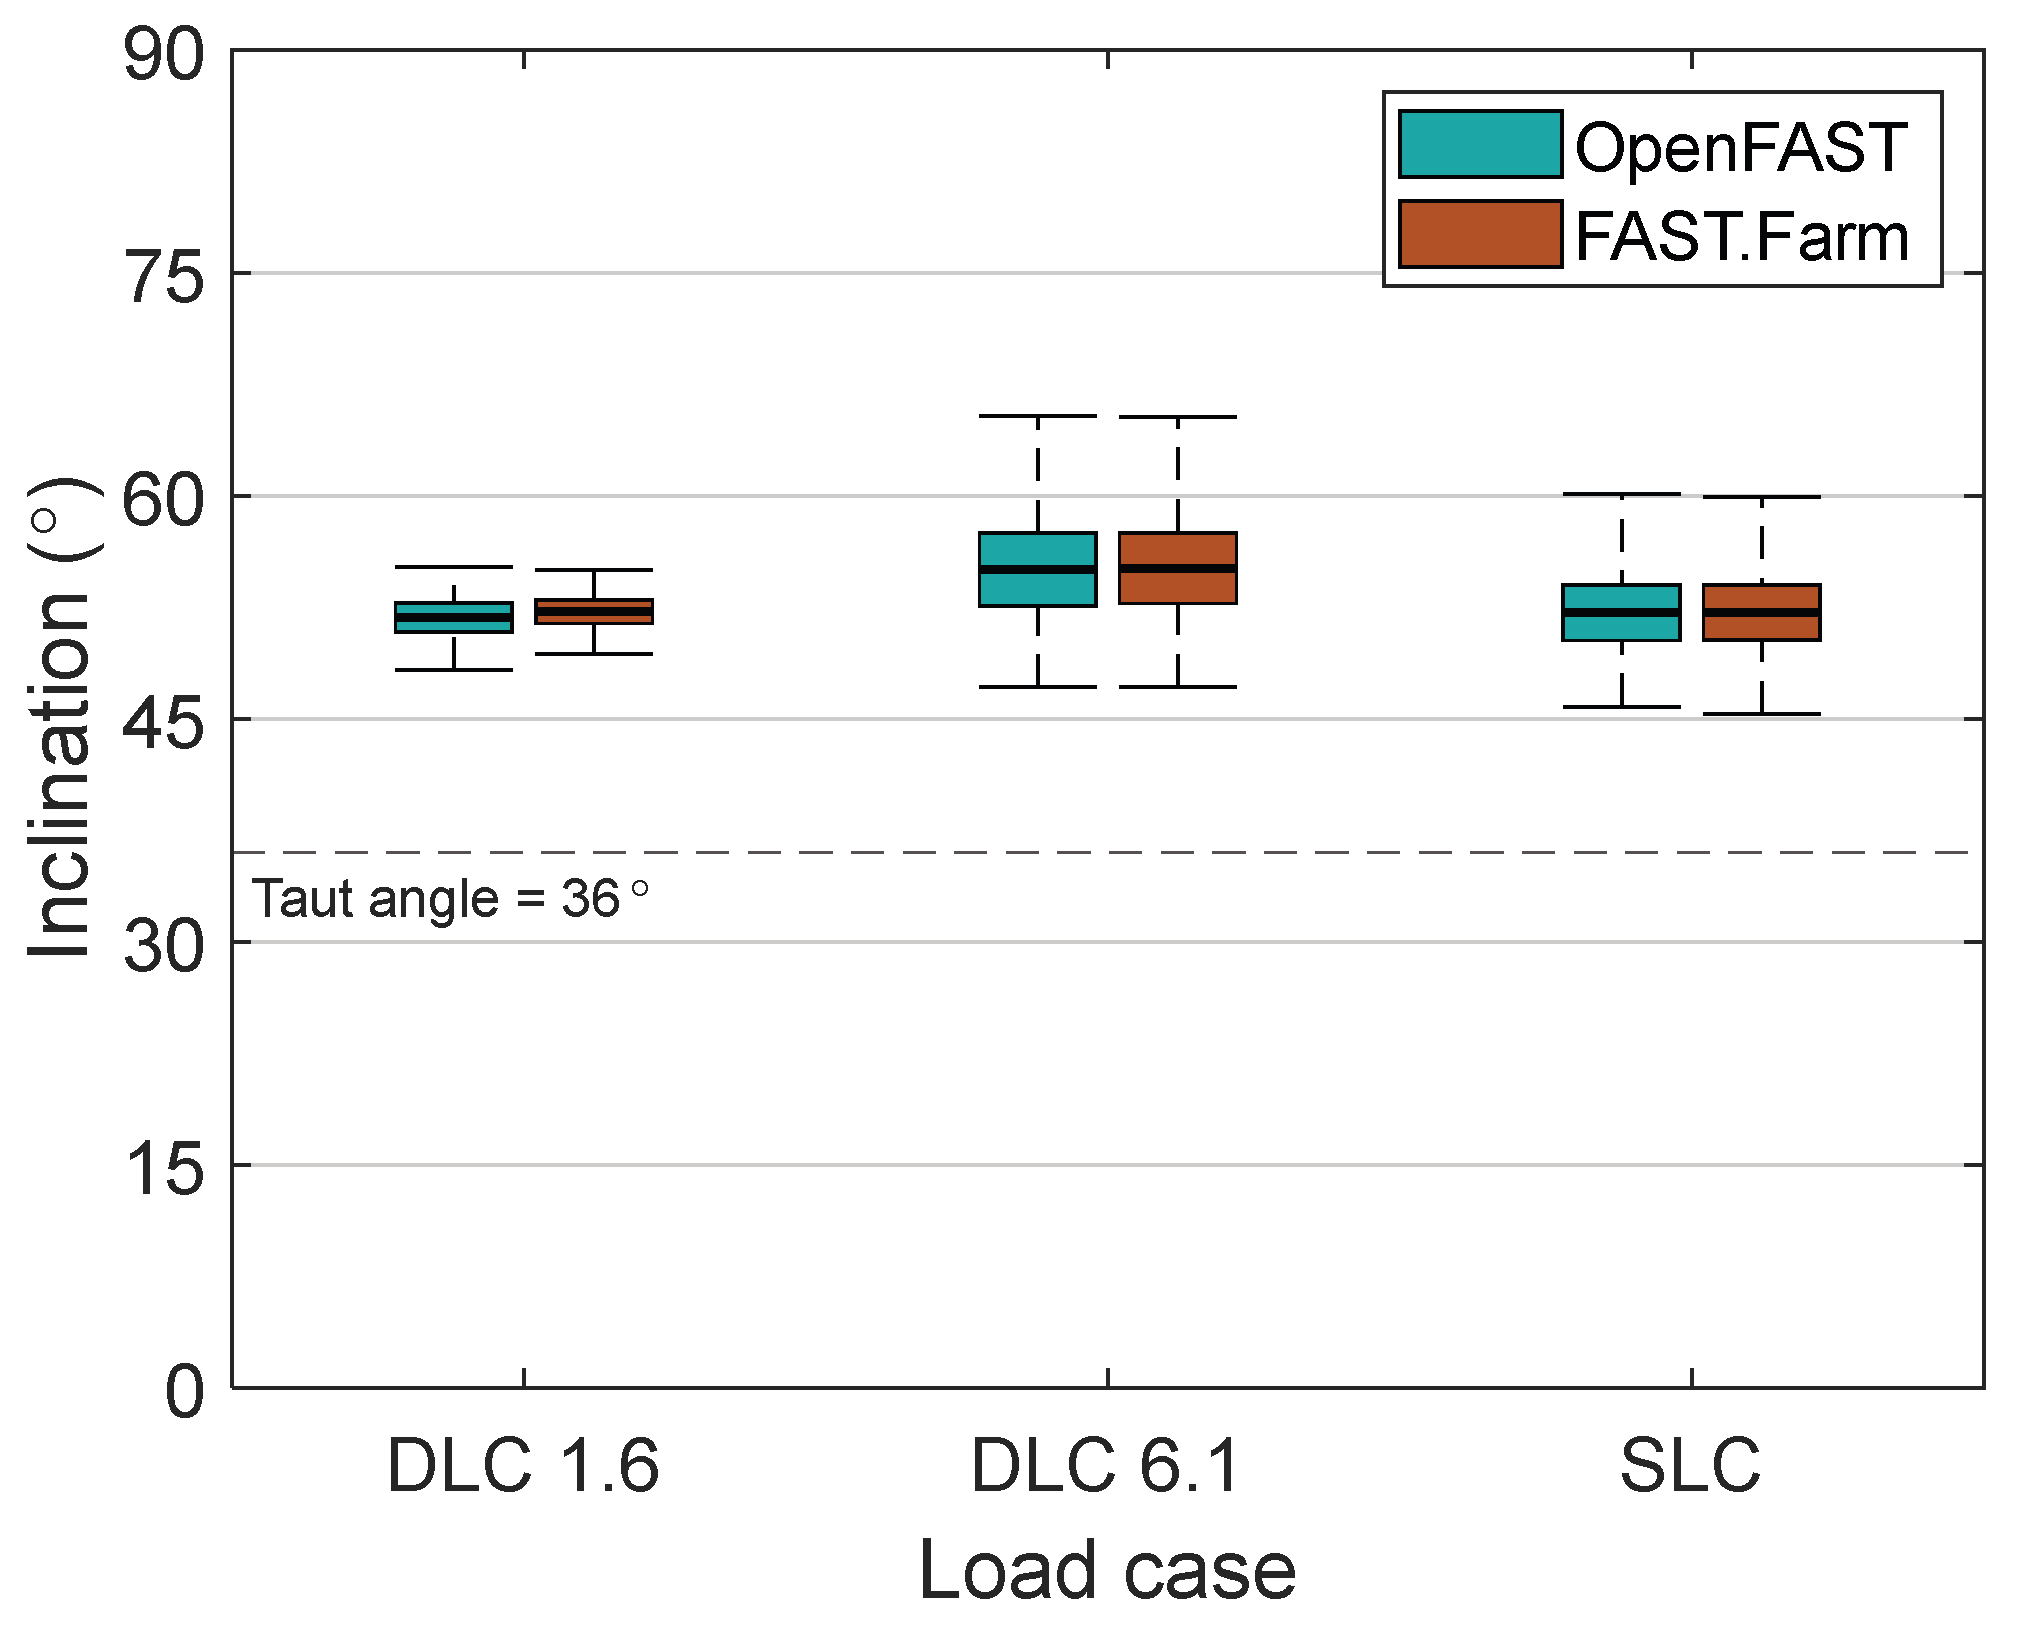
4.2.3. Multiline Force Directionality for 30° WWC
5. Discussion
6. Conclusions
- Including current loading on the mooring lines increased tension metrics on primary-loaded lines by up to 3.1%, while wave loading on the mooring lines had a minimal impact (less than 0.7%). However, it is worth noting that the influence of current and wave loading on mooring tensions could vary with mooring system types and environmental conditions, with systems exposed to higher currents or stronger waves potentially experiencing greater effects;
- For environmental load headings in which multiple platforms receive the same wave train, cross-wave force components from the mooring lines connected to the shared anchor cancel each other out, while in-wave force components compound, resulting in decreased multiline directional ranges and increased extreme multiline force values;
- For environmental load headings with downstream turbines, wake effects will decrease the loading on downwind turbines, leading to reductions in the multiline force magnitude (a 3% difference in the mean load for this study) and directional ranges (such as an 8% difference in maximum multiline force direction) that will not be captured if simulating turbines individually.
Author Contributions
Funding
Institutional Review Board Statement
Informed Consent Statement
Data Availability Statement
Acknowledgments
Conflicts of Interest
References
- Fontana, C.M.; Hallowell, S.T.; Arwade, S.R.; DeGroot, D.J.; Landon, M.E.; Aubeny, C.P.; Diaz, B.; Myers, A.T.; Ozmutlu, S. Multiline anchor force dynamics in floating offshore wind turbines. Wind Energy 2018, 21, 1177–1190. [Google Scholar] [CrossRef]
- Pillai, A.C.; Gordelier, T.J.; Thies, P.R.; Dormenval, C.; Wray, B.; Parkinson, R.; Johanning, L. Anchor loads for shallow water mooring of a 15 MW floating wind turbine—Part I: Chain catenary moorings for single and shared anchor scenarios. Ocean Eng. 2022, 266, 111816. [Google Scholar] [CrossRef]
- Hallowell, S.T.; Arwade, S.R.; Diaz, B.D.; Aubeny, C.P.; Fontana, C.M.; DeGroot, D.J.; Landon, M.E. Harmonizing the Mooring System Reliability of Multiline Anchor Wind Farms. ASCE-ASME J. Risk Uncertain. Eng. Syst. Part B Mech. Eng. 2021, 7, 044501. [Google Scholar] [CrossRef]
- Hall, M.; Housner, S.; Sirnivas, S.; Wilson, S. MoorPy (Quasi-Static Mooring Analysis in Python); USDOE Office of Energy Efficiency and Renewable Energy (EERE), Renewable Power Office: 2021. Available online: https://github.com/NREL/MoorPy (accessed on 4 March 2023).
- Xu, H.; Rui, S.; Shen, K.; Jiang, L.; Zhang, H.; Teng, L. Shared mooring systems for offshore floating wind farms: A review. Energy Rev. 2024, 3, 100063. [Google Scholar] [CrossRef]
- Lozon, E.; Hall, M. Coupled loads analysis of a novel shared-mooring floating wind farm. Appl. Energy 2023, 332, 120513. [Google Scholar] [CrossRef]
- Coughlan, K.; Mahfouz, M.Y.; Lozon, E.; Arwade, S. Assessing the impacts of wakes on floating wind farms with shared anchors. J. Phys. Conf. Ser. 2024, 2767, 062033. [Google Scholar] [CrossRef]
- Chen, Y.-H.; Yang, R.-Y. Study on array floating platform for wind energy and marine space optimization. Sustainability 2021, 13, 14014. [Google Scholar] [CrossRef]
- Diaz, B.D.; Rasulo, M.; Aubeny, C.P.; Fontana, C.M.; Arwade, S.R.; DeGroot, D.J.; Landon, M. Multiline anchors for floating offshore wind towers. In Proceedings of the IEEE OCEANS 2016 MTS/IEEE Monterey, Monterey, CA, USA, 19–23 September 2016; pp. 1–9. [Google Scholar] [CrossRef]
- Rui, S.; Zhou, Z.; Gao, Z.; Jostad, H.P.; Wang, L.; Xu, H.; Guo, Z. A review on mooring lines and anchors of floating marine structures. Renew. Sustain. Energy Rev. 2024, 199, 114547. [Google Scholar] [CrossRef]
- Devin, M.C.; DuPont, B.L.; Hallowell, S.T.; Arwade, S.R. Optimizing the Cost and Reliability of Shared Anchors in an Array of Floating Offshore Wind Turbines. ASCE-ASME J. Risk Uncertain. Eng. Syst. Part B Mech. Eng. 2021, 7, 040905. [Google Scholar] [CrossRef]
- Shimada, K.; Shiroeda, T.; Hotta, H.; van Phuc, P.; Kida, T. An empirical design formula of a shared pile anchor for a floating offshore wind turbine. Grand Renew. Energy Proc. 2018, 1. [Google Scholar] [CrossRef]
- van Koten, K.C. Design of a Suction Pile Multiline Anchor System for Floating Offshore wind Turbines. Master’s Thesis, Delft University of Technology, Delft, The Netherlands, 2021. [Google Scholar]
- Lee, J.; Aubeny, C.P. Multiline Ring Anchor system for floating offshore wind turbines. J. Phys. Conf. Ser. 2020, 1452, 012036. [Google Scholar] [CrossRef]
- Rui, S.; Wang, L.; Zhou, Z.; Jostad, H.P.; Guo, Z. Bearing performance of a novel caisson–plate gravity anchor. Géotechnique 2024, 1–12. [Google Scholar] [CrossRef]
- Strivens, S.; Evans, H.; Northridge, E.; Harvey, M.; Camp, T.; Nigel, T. Floating Wind Joint Industry Project—Phase III Summary Report; Carbon Trust, UK, 2021. Available online: https://www.carbontrust.com/our-work-and-impact/guides-reports-and-tools/floating-wind-joint-industry-project-phase-iii-summary-report (accessed on 5 January 2025).
- Hallowell, S.T.; Arwade, S.R.; Fontana, C.M.; DeGroot, D.J.; Aubeny, C.P.; Diaz, B.D.; Myers, A.T.; Landon, M.E. System reliability of floating offshore wind farms with multiline anchors. Ocean Eng. 2018, 160, 94–104. [Google Scholar] [CrossRef]
- Jonkman, B.; Platt, A.; Mudafort, R.M.; Branlard, E.; Sprague, M.; Ross, H.; Jjonkman; HaymanConsulting; Slaughter, D.; Hall, M.; et al. OpenFAST/Openfast: v3.5.2. 18 January 2024. Available online: https://zenodo.org/records/10530537 (accessed on 4 February 2023). [CrossRef]
- Jonkman, J.; Shaler, K. FAST.Farm User’s Guide and Theory Manual; National Renewable Energy Laboratory: Golden, CO, USA, 2021; NREL Technical Report NREL/TP-5000-78485. Available online: https://www.nrel.gov/docs/fy21osti/78485.pdf (accessed on 4 March 2023).
- Hall, M.; Goupee, A. Validation of a lumped-mass mooring line model with DeepCwind semisubmersible model test data. Ocean Eng. 2015, 104, 590–603. [Google Scholar] [CrossRef]
- Fontana, C.M.; Hallowell, S.T.; Arwade, S.R.; DeGroot, D.J.; Landon, M.E.; Aubeny, C.P.; Myers, A.T. Spatial coherence of ocean waves in multiline anchor systems for floating offshore wind turbines. Ocean Eng. 2019, 184, 59–73. [Google Scholar] [CrossRef]
- Balakrishnan, K.; Arwade, S.; DeGroot, D. Wake Effects on Multiline Anchor Loads for Floating Offshore Wind Turbines. In Proceedings of the IOWTC2023, ASME 2023 5th International Offshore Wind Technical Conference, Exeter, UK, 18–19 December 2023. [Google Scholar] [CrossRef]
- OrcaFlex Manual. Orcina Ltd. Available online: http://www.orcina.com/SoftwareProducts/OrcaFlex/Documentation/OrcaFlex_US_paper_size.pdf (accessed on 4 April 2023).
- Gozcu, O.; Kontos, S.; Bredmose, H.; Bailey, T.; Borisade, F. D1.4: Methods for Multiple Floaters and Dynamics Cables at Farm Level; DTU, Ramboll, 2021. Available online: https://corewind.eu/wp-content/uploads/files/publications/COREWIND-D1.4-Methods-for-multiple-floaters-and-dynamic-cables-at-farm-level.pdf (accessed on 4 July 2023).
- Chemineau, M.; Castillo, F.; Mechinaud, L.; Arramounet, V.; Gilloteaux, J.C. Design and costs benefits of shared anchors and shared mooring lines of floating wind turbines at farm level. J. Phys. Conf. Ser. 2023, 2626, 012048. [Google Scholar] [CrossRef]
- Larsen, T.J.; Hansen, A.M. “How 2 HAWC2 the User’s Manual”. Riso National Laboratory: 2007. Available online: https://backend.orbit.dtu.dk/ws/portalfiles/portal/7703110/ris_r_1597.pdf (accessed on 4 August 2023).
- Gözcü, O.; Kontos, S.; Bredmose, H. Dynamics of two floating wind turbines with shared anchor and mooring lines. J. Phys. Conf. Ser. 2022, 2265, 042026. [Google Scholar] [CrossRef]
- User Guide: SIMA Documentation. Available online: https://www.sima.sintef.no/doc/4.8.0/userguide/index.htmlhtml (accessed on 23 February 2024).
- Chow, M.N.C. Mooring System Design for a Floating Wind Farm in Very Deep Water. Master’s Thesis, Norwegian University of Science and Technology, Trondheim, Norway, 2019. [Google Scholar]
- Connolly, P.; Hall, M. Comparison of pilot-scale floating offshore wind farms with shared moorings. Ocean Eng. 2019, 171, 172–180. [Google Scholar] [CrossRef]
- Gaertner, E.; Rinker, J.; Sethuraman, L.; Zahle, F.; Anderson, B.; Barter, G.; Abbas, N.; Meng, F.; Bortolotti, P.; Skrzypinski, W.; et al. Definition of the IEA 15-Megawatt Offshore Reference Wind Turbine; Report; National Renewable Energy Laboratory (NREL): Golden, CO, USA, 2020.
- Allen, C.; Viscelli, A.; Dagher, H.; Goupee, A.; Gaertner, E.; Abbas, N.; Hall, M.; Barter, G. Definition of the UMaine VolturnUS-S Reference Platform Developed for the IEA Wind 15-Megawatt Offshore Reference Wind Turbine; National Renewable Energy Laboratory (NREL): Golden, CO, USA, 2020; Report No. NREL/TP-5000-76773, 1660012, MainId: 9434. [CrossRef]
- Cooperman, A.; Duffy, P.; Hall, M.; Lozon, E.; Shields, M.; Musial, W. Assessment of Offshore Wind Energy Leasing Areas for Humboldt and Morro Bay Wind Energy Areas, California; National Renewable Energy Laboratory (NREL): Golden, CO, USA, 2022; Report No. NREL/TP-5000-82341, 1865877, MainId: 83114. [CrossRef]
- IEC IEC 61400-3-1; Wind Turbines—Part 3-1: Design Requirements for Fixed Offshore Wind Turbines. ANSI: Washington, DC, USA, 2019.
- Machuca, I.; Dorian, B.; Martin, B. Load Case Methodology and Environmental Conditions Report; NYSERDA DeepFarm R&D Project; Principle Power, Inc.: Emeryville, CA, USA, 2021. [Google Scholar]
- Davis, M. Loads Analysis of Fixed-Bottom and Floating Offshore Wind Structures. Master’s Thesis, University of Massachusetts Amherst, Amherst, MA, USA, 2023. [Google Scholar]
- Ma, K.-T.; Luo, Y.; Kwan, C.-T.T.; Wu, Y. Mooring System Engineering for Offshore Structures, 1st ed.; Elsevier: Amsterdam, The Netherlands, 2019; ISBN 978-0-12-818552-0. [Google Scholar]
- Balakrishnan, K.; Arwade, S.; DeGroot, D. Parametric Study on Deep-Water Taut Mooring for Floating Offshore Turbines. In Proceedings of the IOWTC2023, ASME 2023 5th International Offshore Wind Technical Conference, Exeter, UK, 18–19 December 2023. [Google Scholar] [CrossRef]
- Jonkman, J.; Sprague, M. OpenFAST | NWTC Information Portal. Available online: https://nwtc.nrel.gov/openfast (accessed on 1 January 2020).
- Kelley NWTC Computer-Aided Engineering Tools (TurbSim by Neil Kelley, Bonnie Jonkman). Available online: http://wind.nrel.gov/designcodes/preprocessors/turbsim/ (accessed on 4 September 2023).
- Abbas, N.; Zalkind, D.; Pao, L.; Wright, A. A Reference Open-Source Controller for Fixed and Floating Offshore Wind Turbines. Wind. Energy Sci. Discuss. 2021. [Google Scholar] [CrossRef]
- Hall, M. MoorDyn V2: New Capabilities in Mooring System Components and Load Cases. In Proceedings of the ASME 39th International Conference on Ocean, Offshore and Arctic Engineering, Virtual Conference, 3–7 August 2020. [Google Scholar]
- Branlard, E.; Jonkman, J.; Platt, A.; Thedin, R.; Martínez-Tossas, L.A.; Kretschmer, M. Development and Verification of an Improved Wake-Added Turbulence Model in FAST.Farm. J. Phys. Conf. Ser. 2024, 2767, 092036. [Google Scholar] [CrossRef]
- Mann, J. Wind field simulation. Probabilistic Eng. Mech. 1998, 13, 269–282. [Google Scholar] [CrossRef]
- Balakrishnan, K.; Arwade, S.R.; DeGroot, D.J.; Fontana, C.; Landon, M.; Aubeny, C.P. Comparison of multiline anchors for offshore wind turbines with spar and with semisubmersible. J. Phys. Conf. Ser. 2020, 1452, 012032. [Google Scholar] [CrossRef]


| Load Case | Wind Speed (m/s) | Significant Wave Height (m) | Spectral Peak Wave Period (s) | Surface Current (m/s) |
|---|---|---|---|---|
| DLC 1.6 | 10.6 | 6.6 | 14.3 | 0.92 |
| DLC 6.1 | 34.5 | 9.3 | 14.9 | 1.28 |
| SLC | 36.5 | 10.8 | 15.1 | 1.49 |
| Line Type | Length Per Segment (m) | Diameter (mm) | Dry Mass Density (kg/m) | EA (MN) | Min. Breaking Load (kN) |
|---|---|---|---|---|---|
| Chain | 138 | 110 | 242 | 1071 | 13,629 |
| Polyester | 1097 | 193 | 23.6 | 276 | 12,184 |
| Variable | Units | Definition |
|---|---|---|
| T1 | kN | Mooring Line 1 tension, from Turbine 1 |
| T2 | kN | Mooring Line 2 tension (primary loaded line for 0° WWC), from Turbine 3 |
| T3 | kN | Mooring Line 3 tension, from Turbine 2 |
| θ | ° | Taut angle, the angle from the seafloor that the line is at in the undisplaced equilibrium position |
| Fx | kN | Summation of forces on anchor in x-direction |
| Fy | kN | Summation of forces on anchor in y-direction |
| Fz | kN | Summation of forces on anchor in z-direction |
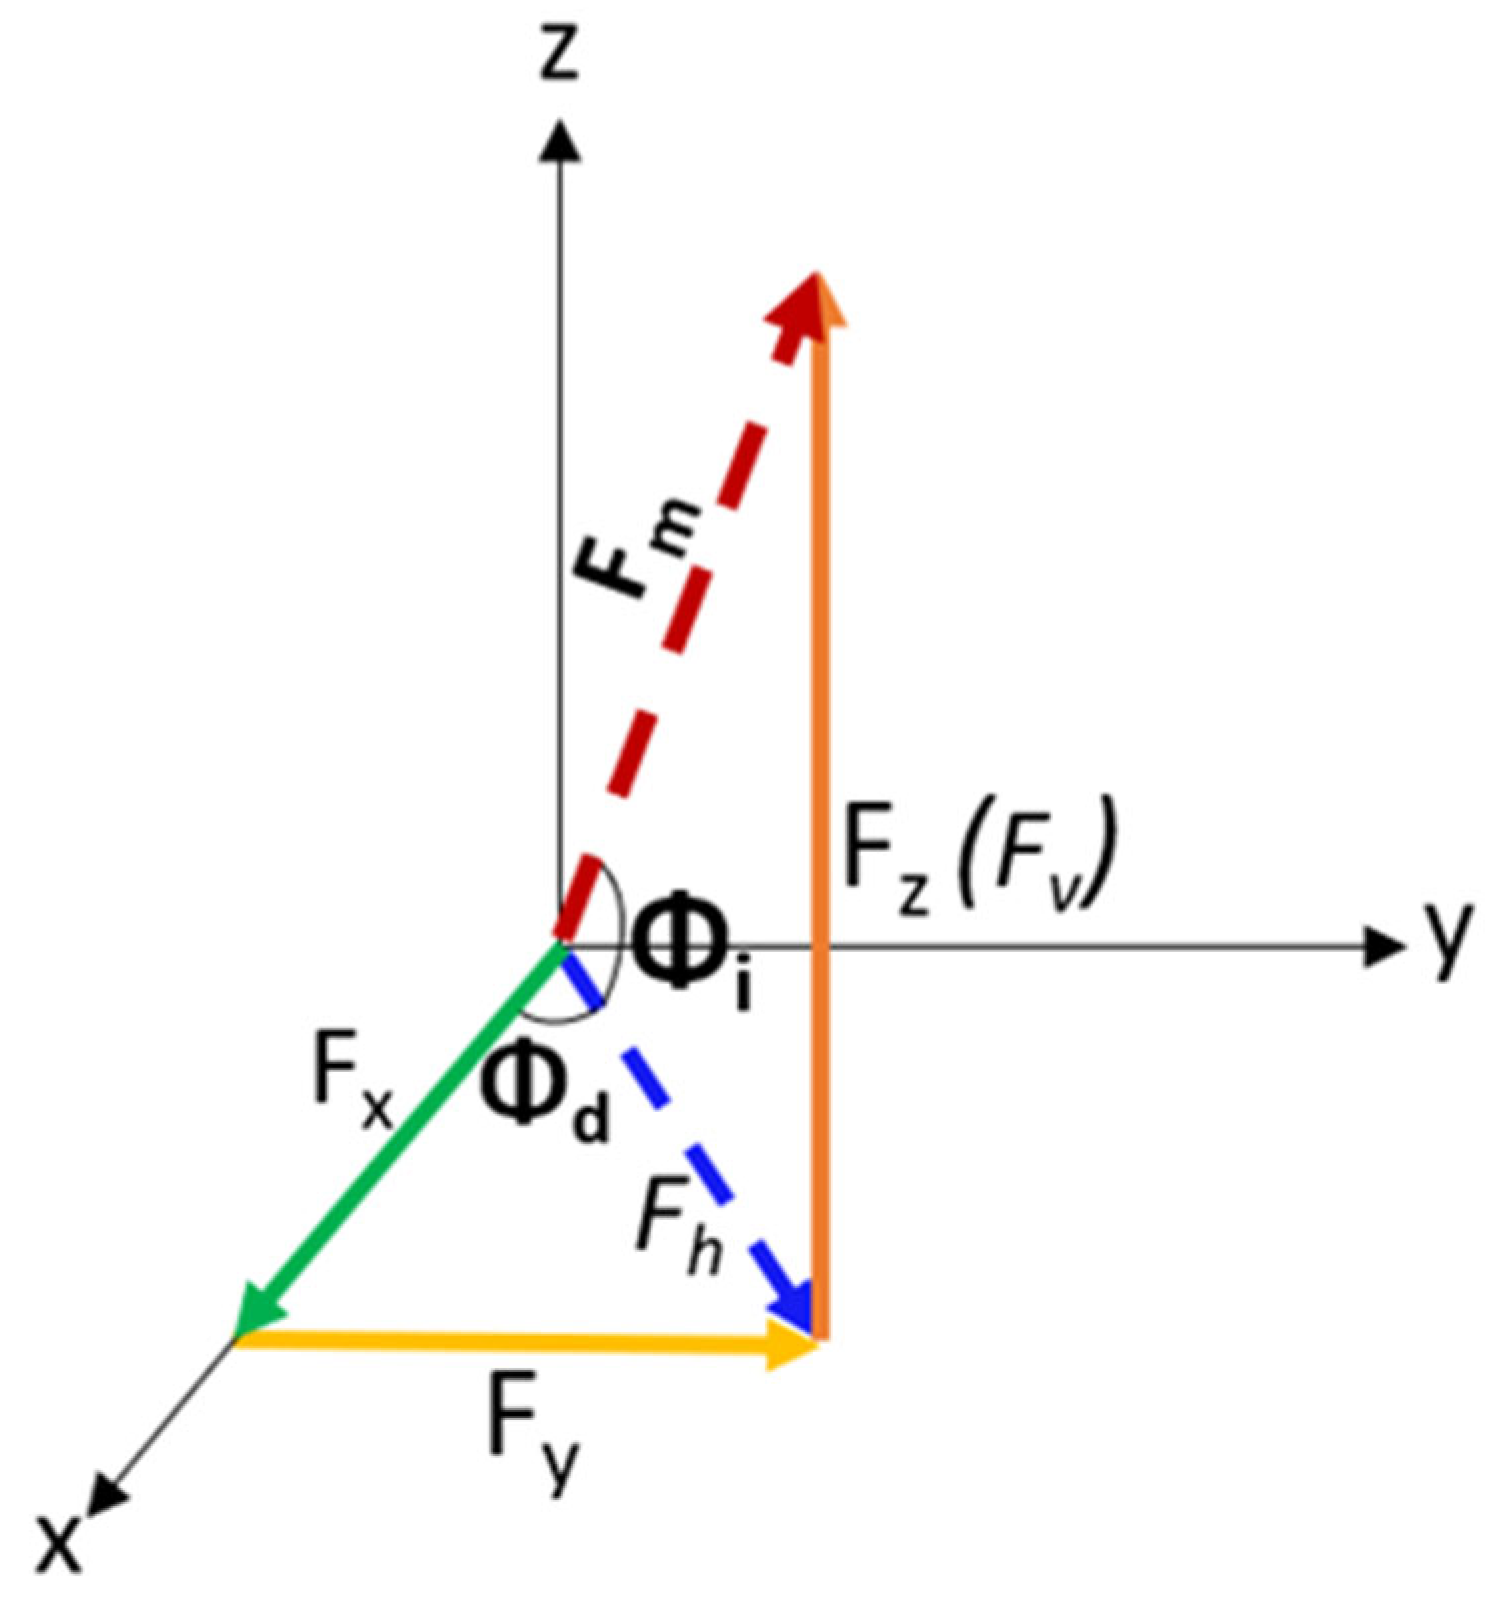
| Fm | kN | Multiline anchor net force, sum of all forces on shared anchor |
| Fh | kN | Horizontal component of the multiline force |
| Fv, Fz | kN | Vertical component of the multiline force |
| Φd | ° | Direction of the multiline force in the x-y plane, can range from 0° to 360° |
| Φi | ° | Inclination (from seafloor) of the multiline force, can range from 0° to 90° |
| With Current | Without Current | Percentage Difference | |||||||
|---|---|---|---|---|---|---|---|---|---|
| Metric | Max. | Mean | St. D. | Max. | Mean | St. D. | Max. | Mean | St. D. |
| T2 (kN) | 4962 | 3969 | 327 | 4919 | 3907 | 327 | 0.9% | 1.6% | 0.0% |
| Fm (kN) | 4876 | 3778 | 329 | 4809 | 3715 | 329 | 1.4% | 1.7% | 0.1% |
| Fh (kN) | 3488 | 2566 | 300 | 3421 | 2486 | 302 | 1.9% | 3.1% | −0.6% |
| Fv (kN) | 3924 | 2761 | 291 | 3925 | 2749 | 292 | 0.0% | 0.4% | −0.7% |
| Φd (°) | 11 | 0 | 3.4 | 12 | 0 | 3.5 | −4.7% | −3.0% | −5.2% |
| Φi (°) | 60 | 47 | 3.9 | 62 | 48 | 4.1 | −2.9% | −1.7% | −3.6% |
| With Wave Loading | Without Wave Loading | Percentage Difference | |||||||
|---|---|---|---|---|---|---|---|---|---|
| Metric | Max. | Mean | St. D. | Max. | Mean | St. D. | Max. | Mean | St. D. |
| T2 (kN) | 4960 | 3972 | 327 | 4962 | 3969 | 327 | 0.0% | 0.1% | 0.2% |
| Fm (kN) | 4866 | 3781 | 329 | 4876 | 3778 | 329 | −0.2% | 0.1% | −0.1% |
| Fh (kN) | 3499 | 2571 | 304 | 3488 | 2566 | 300 | 0.3% | 0.2% | 1.2% |
| Fv (kN) | 3904 | 2760 | 287 | 3924 | 2761 | 291 | −0.5% | 0.0% | −1.4% |
| Φd (°) | 11 | 0 | 3.3 | 11 | 0 | 3.4 | −0.6% | −0.5% | −1.3% |
| Φi (°) | 60 | 47 | 3.9 | 60 | 47 | 3.9 | −0.1% | −0.1% | 0.0% |
| OpenFAST | FAST.Farm | Percentage Difference (OpenFAST–FAST.Farm)/OpenFAST | ||||||||
|---|---|---|---|---|---|---|---|---|---|---|
| Metric | Load Case | Max. | Mean | St. D. | Max. | Mean | St. D. | Max. | Mean | St. D. |
| T2 (kN) | DLC 1.6 | 4923 | 4183 | 227 | 4892 | 4240 | 195 | 0.6% | −1.4% | 13.9% |
| DLC 6.1 | 4507 | 3363 | 290 | 4444 | 3350 | 275 | 1.4% | 0.4% | 5.2% | |
| SLC | 5182 | 3982 | 337 | 5380 | 3974 | 344 | −3.8% | 0.2% | −2.2% | |
| Fm (kN) | DLC 1.6 | 4688 | 3951 | 226 | 4668 | 4003 | 196 | 0.4% | −1.3% | 13.4% |
| DLC 6.1 | 4381 | 3236 | 289 | 4272 | 3223 | 277 | 2.5% | 0.4% | 3.9% | |
| SLC | 5021 | 3793 | 337 | 5173 | 3785 | 345 | −3.0% | 0.2% | −2.2% | |
| Fh (kN) | DLC 1.6 | 3392 | 2771 | 187 | 3379 | 2823 | 167 | 0.4% | −1.9% | 10.7% |
| DLC 6.1 | 2987 | 1983 | 262 | 2975 | 1964 | 264 | 0.4% | 1.0% | −1.0% | |
| SLC | 3566 | 2585 | 290 | 3800 | 2571 | 322 | −6.6% | 0.5% | −11.1% | |
| Fv (kN) | DLC 1.6 | 3339 | 2815 | 158 | 3378 | 2836 | 151 | −1.2% | −0.8% | 4.6% |
| DLC 6.1 | 3496 | 2548 | 250 | 3553 | 2543 | 267 | −1.6% | 0.2% | −6.7% | |
| SLC | 3801 | 2768 | 274 | 4003 | 2764 | 302 | −5.3% | 0.1% | −10.0% | |
| OpenFAST | FAST.Farm | Percent Difference (OpenFAST–FAST.Farm)/OpenFAST | ||||||||
|---|---|---|---|---|---|---|---|---|---|---|
| Metric | Load Case | Max. | Mean | St. D. | Max. | Mean | St. D. | Max. | Mean | St. D. |
| Φd (°) | DLC 1.6 | 7.6 | 0.1 | 2.0 | 1.5 | 0.1 | 0.4 | 80.4% | −12.0% | 80.9% |
| DLC 6.1 | 24.9 | −0.1 | 6.8 | 17.9 | −0.2 | 4.7 | 28.2% | −76.2% | 30.5% | |
| SLC | 21.4 | −0.2 | 5.6 | 15.3 | −0.2 | 3.6 | 28.8% | −43.9% | 35.0% | |
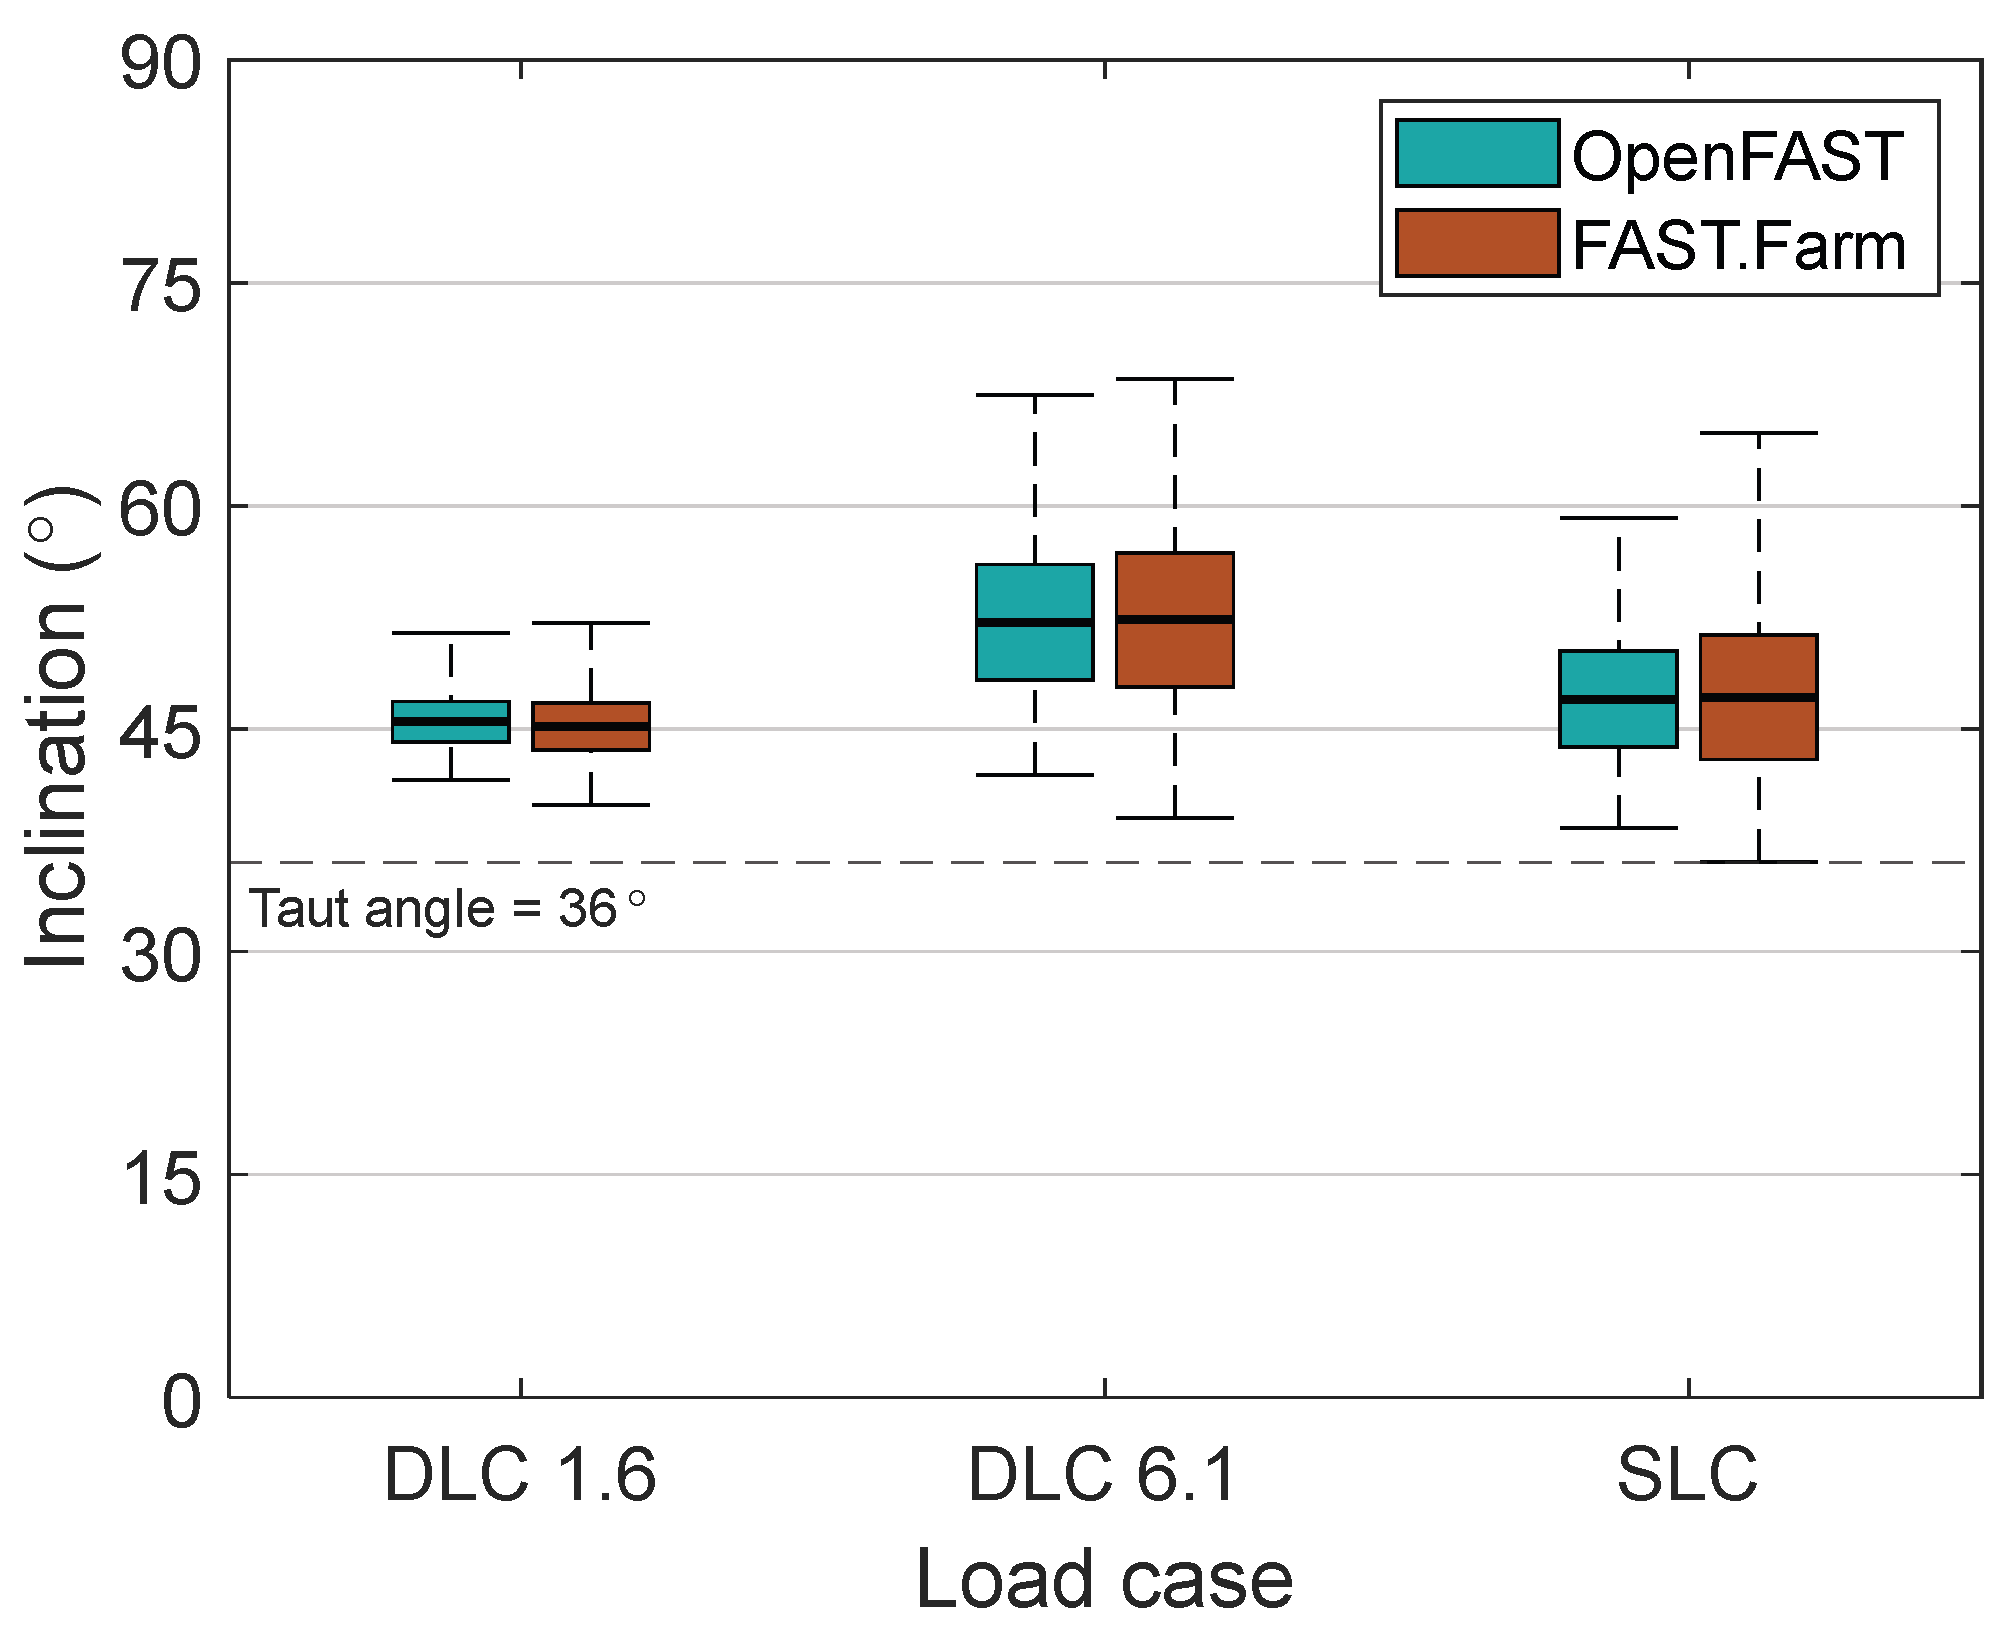
| Φi (°) | DLC 1.6 | 51.4 | 45.5 | 1.4 | 52.1 | 45.1 | 1.6 | −1.3% | 0.7% | −16.3% |
| DLC 6.1 | 67.4 | 52.1 | 3.9 | 68.5 | 52.3 | 4.5 | −1.5% | −0.3% | −16.3% | |
| SLC | 59.2 | 47.0 | 3.2 | 64.8 | 47.1 | 4.2 | −9.5% | −0.3% | −29.2% | |
| Energy Output over 6 h (kWh) | Mean Wind Velocity x (m/s) | |
|---|---|---|
| WT 1 | 13,773 | 10.6 |
| WT 2 | 13,774 | 10.6 |
| WT 3 | 9562 | 8.8 |
| OpenFAST | FAST.Farm | Percentage Difference (OpenFAST–FAST.Farm)/OpenFAST | ||||||||
|---|---|---|---|---|---|---|---|---|---|---|
| Metric | Load Case | Max. | Mean | St. D. | Max. | Mean | St. D. | Max. | Mean | St. D. |
| T2 (kN) | DLC 1.6 | 4815 | 4245 | 192 | 4664 | 4087 | 177 | 3.1% | 3.7% | 7.7% |
| DLC 6.1 | 3975 | 3267 | 217 | 3973 | 3256 | 211 | 0.1% | 0.3% | 2.6% | |
| SLC | 4801 | 3952 | 251 | 4752 | 3943 | 244 | 1.0% | 0.2% | 2.7% | |
| Fm (kN) | DLC 1.6 | 5062 | 4477 | 193 | 4949 | 4346 | 171 | 2.2% | 2.9% | 11.2% |
| DLC 6.1 | 4206 | 3428 | 226 | 4137 | 3417 | 217 | 1.7% | 0.3% | 4.0% | |
| SLC | 5066 | 4167 | 266 | 4991 | 4159 | 250 | 1.5% | 0.2% | 5.9% | |
| Fh (kN) | DLC 1.6 | 3174 | 2768 | 135 | 3100 | 2663 | 124 | 2.3% | 3.8% | 8.4% |
| DLC 6.1 | 2558 | 1961 | 176 | 2571 | 1952 | 174 | −0.5% | 0.4% | 1.2% | |
| SLC | 3221 | 2557 | 191 | 3200 | 2549 | 187 | 0.7% | 0.3% | 2.3% | |
| Fv (kN) | DLC 1.6 | 4012 | 3519 | 157 | 3879 | 3434 | 132 | 3.3% | 2.4% | 15.6% |
| DLC 6.1 | 3522 | 2808 | 204 | 3474 | 2801 | 192 | 1.4% | 0.2% | 5.9% | |
| SLC | 4062 | 3288 | 229 | 4011 | 3283 | 214 | 1.3% | 0.2% | 6.6% | |
| OpenFAST | FAST.Farm | Percentage Difference (OpenFAST–FAST.Farm)/OpenFAST | ||||||||
|---|---|---|---|---|---|---|---|---|---|---|
| Metric | Load Case | Max. | Mean | St. D. | Max. | Mean | St. D. | Max. | Mean | St. D. |
| Φd (°) | DLC 1.6 | 39.7 | 29.9 | 33.1 | 36.7 | 28.1 | 32.8 | 7.6% | 5.9% | 1.0% |
| DLC 6.1 | 49.9 | 29.8 | 36.5 | 49.6 | 29.8 | 36.4 | 0.7% | 0.1% | 0.3% | |
| SLC | 46.0 | 29.8 | 35.5 | 46.2 | 29.8 | 35.5 | −0.4% | 0.3% | −0.1% | |
| Φi (°) | DLC 1.6 | 55.3 | 51.8 | 1.0 | 55.0 | 52.2 | 0.8 | 0.4% | −0.8% | 18.4% |
| DLC 6.1 | 65.4 | 55.1 | 2.5 | 65.4 | 55.1 | 2.4 | 0.1% | −0.1% | 3.2% | |
| SLC | 60.1 | 52.1 | 1.9 | 60.0 | 52.2 | 1.8 | 0.3% | −0.1% | 0.8% | |
Disclaimer/Publisher’s Note: The statements, opinions and data contained in all publications are solely those of the individual author(s) and contributor(s) and not of MDPI and/or the editor(s). MDPI and/or the editor(s) disclaim responsibility for any injury to people or property resulting from any ideas, methods, instructions or products referred to in the content. |
© 2025 by the authors. Licensee MDPI, Basel, Switzerland. This article is an open access article distributed under the terms and conditions of the Creative Commons Attribution (CC BY) license (https://creativecommons.org/licenses/by/4.0/).
Share and Cite
Coughlan, K.; Lozon, E.; Hall, M.; Martin, B.; Arwade, S. Comparison of Coupled and Uncoupled Modeling of Floating Wind Farms with Shared Anchors. J. Mar. Sci. Eng. 2025, 13, 106. https://doi.org/10.3390/jmse13010106
Coughlan K, Lozon E, Hall M, Martin B, Arwade S. Comparison of Coupled and Uncoupled Modeling of Floating Wind Farms with Shared Anchors. Journal of Marine Science and Engineering. 2025; 13(1):106. https://doi.org/10.3390/jmse13010106
Chicago/Turabian StyleCoughlan, Katherine, Ericka Lozon, Matthew Hall, Bruce Martin, and Sanjay Arwade. 2025. "Comparison of Coupled and Uncoupled Modeling of Floating Wind Farms with Shared Anchors" Journal of Marine Science and Engineering 13, no. 1: 106. https://doi.org/10.3390/jmse13010106
APA StyleCoughlan, K., Lozon, E., Hall, M., Martin, B., & Arwade, S. (2025). Comparison of Coupled and Uncoupled Modeling of Floating Wind Farms with Shared Anchors. Journal of Marine Science and Engineering, 13(1), 106. https://doi.org/10.3390/jmse13010106