Article

Spatial Distribution and Abundance of a Pelagic Squid during the Evolution of Eddies in the Southeast Pacific Ocean

1
College of Marine Living Resource Science and Management, Shanghai Ocean University, Shanghai 201306, China
2
State Key Laboratory of Satellite Ocean Environment Dynamics, Second Institute of Oceanography, Ministry of Natural Resources, Hangzhou 310012, China
3
National Engineering Research Center for Oceanic Fisheries, Shanghai Ocean University, Shanghai 201306, China
4
Key Laboratory of Sustainable Exploitation of Oceanic Fisheries Resources, Ministry of Education, Shanghai Ocean University, Shanghai 201306, China
5
Key Laboratory of Oceanic Fisheries Exploration, Ministry of Agriculture and Rural Affairs, Shanghai 201306, China
*
Author to whom correspondence should be addressed.
J. Mar. Sci. Eng. 2024, 12(6), 1015; https://doi.org/10.3390/jmse12061015
Submission received: 28 April 2024 / Revised: 4 June 2024 / Accepted: 15 June 2024 / Published: 18 June 2024
(This article belongs to the Section Marine Ecology)

Abstract

:
The Humboldt squid (Dosidicus gigas), is a significant economic species off Peru. The abundance and distribution of the species are highly susceptible to fluctuations in marine environmental conditions. The evolution of mesoscale eddies represents one of the dynamic processes in the ocean, exerting varying degrees of influence on regional biogeochemical processes from generation to dissipation. However, the mechanisms governing the regulation of abundance and spatial distribution of D. gigas off Peru during this evolution remain unclear. Therefore, this study employed normalization techniques and the habitat suitability index (HSI) model, utilizing data from the D. gigas fishery, mesoscale eddies, and marine environmental factors (including sea surface temperature, temperature at 50 m depth, and chlorophyll-a concentration) to analyze the environmental changes and the abundance, spatial distribution, and habitat changes of D. gigas during the evolution of mesoscale eddies. The results indicate that eddies undergo four stages: formation, intensification, maturity, and decay. During eddy evolution, the abundance of D. gigas exhibited an initial increase and a subsequent decrease within cyclonic eddies (CEs), whereas, within anticyclonic eddies (AEs), abundance showed a gradual decline. The outcome of the HSI model revealed that, the habitat suitability and the proportion of suitable habitat areas within eddies were highly consistent with the abundance of D. gigas during all stages of the eddies other than the intensification stage of AEs. The study speculated that both CEs and AEs can create favorable environmental conditions during the maturity stage, thereby leading to an increase in suitable habitat and abundance of D. gigas. These findings emphasize the significant impact of mesoscale eddy evolution on the abundance and habitat distribution of D. gigas.

1. Introduction

Mesoscale eddies are oceanic eddies with spatial scales ranging from tens to hundreds of kilometers, and temporal scales spanning from days to months. They constitute a significant aspect of mesoscale dynamic processes within the ocean, and are ubiquitous across the world’s oceans [1]. The generation and dissipation of mesoscale eddies entail uncertainties, with dynamic characteristics present throughout their lifecycle, which can be distinctly delineated into four stages: ‘formation’, ‘intensification’, ‘maturity’, and ‘decay’ [2,3]. Mesoscale eddies can be categorized into two types based on their rotational direction [4]: cyclonic eddies (CEs), which rotate counterclockwise and clockwise in the Northern and Southern Hemisphere, respectively, and anticyclonic eddies (AEs), which rotate in the opposite direction. Mesoscale eddies have strong physical characteristics, with seawater flow velocities in their region several times the average seawater flow velocity and very high kinetic energy [5]. They play a pivotal role in modulating oceanic biogeochemical processes, exerting significant influences on oceanic environmental parameters such as temperature, salinity, dissolved oxygen concentration, and chlorophyll concentration [6,7,8].
In recent years, an increasing number of scholars have focused on evaluating the impacts of mesoscale eddies on marine organisms and fisheries activities [9,10,11,12]. Some studies have revealed that regions with eddy activity, such as in waters surrounding the Andaman and Nicobar Islands in the northern Indian Ocean, exhibit significantly higher catch per unit effort (CPUE) compared to areas without such activity [13]. Furthermore, research has shown that different fishing gear yields varying catch amounts in different eddy regions [14]. Mesoscale eddies act both horizontally and vertically in the water column through various mechanisms, such as trapping, stirring, and mixing [2,15], thereby regulating the biomass, community composition, and diversity of phytoplankton. This accumulation and redistribution of local primary productivity creates favorable habitats for certain marine organisms. Moreover, mesoscale eddies modulate the transfer and mixing of substances, energy, and heat to form ecological barriers [16], thereby impacting encounters between prey and predator species. For instance, Braun et al. [17] found that the core region of AEs in the Gulf of Mexico provides “thermal conduits” for blue sharks, enabling them to surpass their thermal limits and forage at deeper depths.
The Humboldt squid (Dosidicus gigas) is characterized by its large size, short lifespan, rapid growth rate, and high reproductive capacity [18,19,20]. It exclusively inhabits Pacific Ocean waters ranging from 45° N of the California Peninsula to 47° S of Chile, and east of 140° W [21]. The feeding strategy of D. gigas is remarkably versatile, as it preys on a diverse array of organisms, including small fish, crustaceans, and other invertebrates [22]. It also serves as a prey item for apex predators such as the blue shark, shortfin mako shark, and sperm whale [23,24]. Consequently, D. gigas plays a vital role in the marine food web. As a fishery resource that possesses high economic value, D. gigas serves as a crucial commercial resource exploited by several countries globally, including Peru, China, Mexico, South Korea, and Chile [25,26]. According to the Food and Agriculture Organization (FAO, 2023), the total global catch of D. gigas in 2021 was approximately 1 million tons.
The waters of Peru are relatively productive, harboring the Pacific Ocean’s most abundant sources of D. gigas [27]. Since the early 1990s, the D. gigas fishery has emerged as a significant industry in this maritime domain [28]. The complex oceanic currents, the instability of coastal flows, and the intricate seabed topography in Peruvian waters all contribute to the formation of mesoscale eddies [29,30]. These mesoscale eddies are widespread in Peruvian waters, primarily propagating westward and exhibiting seasonal variability. Moreover, compared to other areas, the offshore regions of Peru possess lower eddy kinetic energy [31]. The generation and dissipation of mesoscale eddies lead to significant alterations in local circulation patterns and water mass distribution. As a species with a short life cycle, D. gigas is highly sensitive to environmental changes [32]. Because mesoscale eddies regulate local marine environments, they can significantly influence the distribution and abundance of D. gigas. Previous studies have predominantly focused on the impacts of environmental factors, such as temperature, salinity, and dissolved oxygen concentration, as well as large-scale climatic events, like El Niño and La Niña, on the growth, reproduction, migration, and habitat distribution of D. gigas [33,34,35,36,37]. There has been limited research on how different stages of mesoscale eddies regulate the distribution and abundance of D. gigas [38].
To address this, we evaluated the impact of mesoscale eddies (and their respective stages) and oceanic changes (water temperature and chlorophyll-a concentration) on the abundance and spatial distribution of D. gigas off Peru. Additionally, we selected a specific long-lived mesoscale eddy as a typical case for validating the effect of mesoscale eddies on D. gigas during the evolution of the eddy, aiming at providing scientific evidence for the sustainable utilization and management of D. gigas resources.

2. Materials and Methods

2.1. Fisheries Data

The study utilized D. gigas fishing data from 1 September to 31 December 2019, provided by the China Distant-Water Fisheries Data Center of Shanghai Ocean University (Figure 1). The dataset included information on fishing operations (longline fishing), fishing locations (longitude and latitude, with a spatial resolution of 0.001° × 0.001°), fishing dates (year, month, day), fishing effort (unit: days), and catch (unit: tons). By aggregating the fishing duration and catch amount based on the location and date of fishing, the total fishing effort and catch amount for each fishing location per day were obtained, resulting in a total of 18,104 records. The fishing range spans from 75° W to 95° W longitude and from 8° S to 20° S latitude. The CPUE was used as an index of D. gigas abundance, calculated as the ratio of the catch per record to the fishing efforts.

2.2. Environmental Data

The absolute dynamic topography and sea surface current velocity data were obtained from the Copernicus Marine Environment Monitoring Service (CMEMS) multi-satellite altimetry merged product (https://data.marine.copernicus.eu/product/SEALEVEL_GLO_PHY_L4_MY_008_047/download?dataset=cmems_obs-sl_glo_phy-ssh_my_allsat-l4-duacs-0.25deg_P1D_202112, accessed on 13 July 2023), and sea surface temperature (SST) and temperature at 50 m depth (T50) were provided by CMEMS’s Global Ocean Ensemble Reanalysis Products (https://data.marine.copernicus.eu/product/GLOBAL_REANALYSIS_PHY_001_031/description, accessed on 13 July 2023). All these data were at a spatial and temporal resolution of 0.25° and daily. Sea surface chlorophyll-a concentration (Chl-a) data were sourced from CMEMS’s Global Ocean Satellite Observation product (https://data.marine.copernicus.eu/product/OCEANCOLOUR_GLO_BGC_L4_MY_009_104/download?dataset=cmems_obs-oc_glo_bgc-plankton_my_l4-gapfree-multi-4km_P1D_202207, accessed on 13 July 2023), with a spatial resolution of 4km and a temporal resolution of 1 day. All environmental data covered the required time and space range for the study. Based on the latitude and longitude of each fishing operation for each day and the corresponding latitude and longitude of the daily environmental data, we matched the environmental factors to each fisheries data point using the interp2 function in MATLAB.

2.3. Mesoscale Eddy Analysis

This study used the angular momentum eddy detection and tracking algorithm (AEDMA) to identify and track the eddies. AEDMA accurately detects the characteristic parameters of eddies (such as radius, amplitude, velocity, and shape) throughout their life cycles, requiring minimal parameter adjustments and adapting to various spatial resolutions of velocity fields [39]. In recent years, AEDMA has been successfully applied in multiple oceanic regions, including the northwest Pacific, the northwest Atlantic, and the Mediterranean [40,41,42].
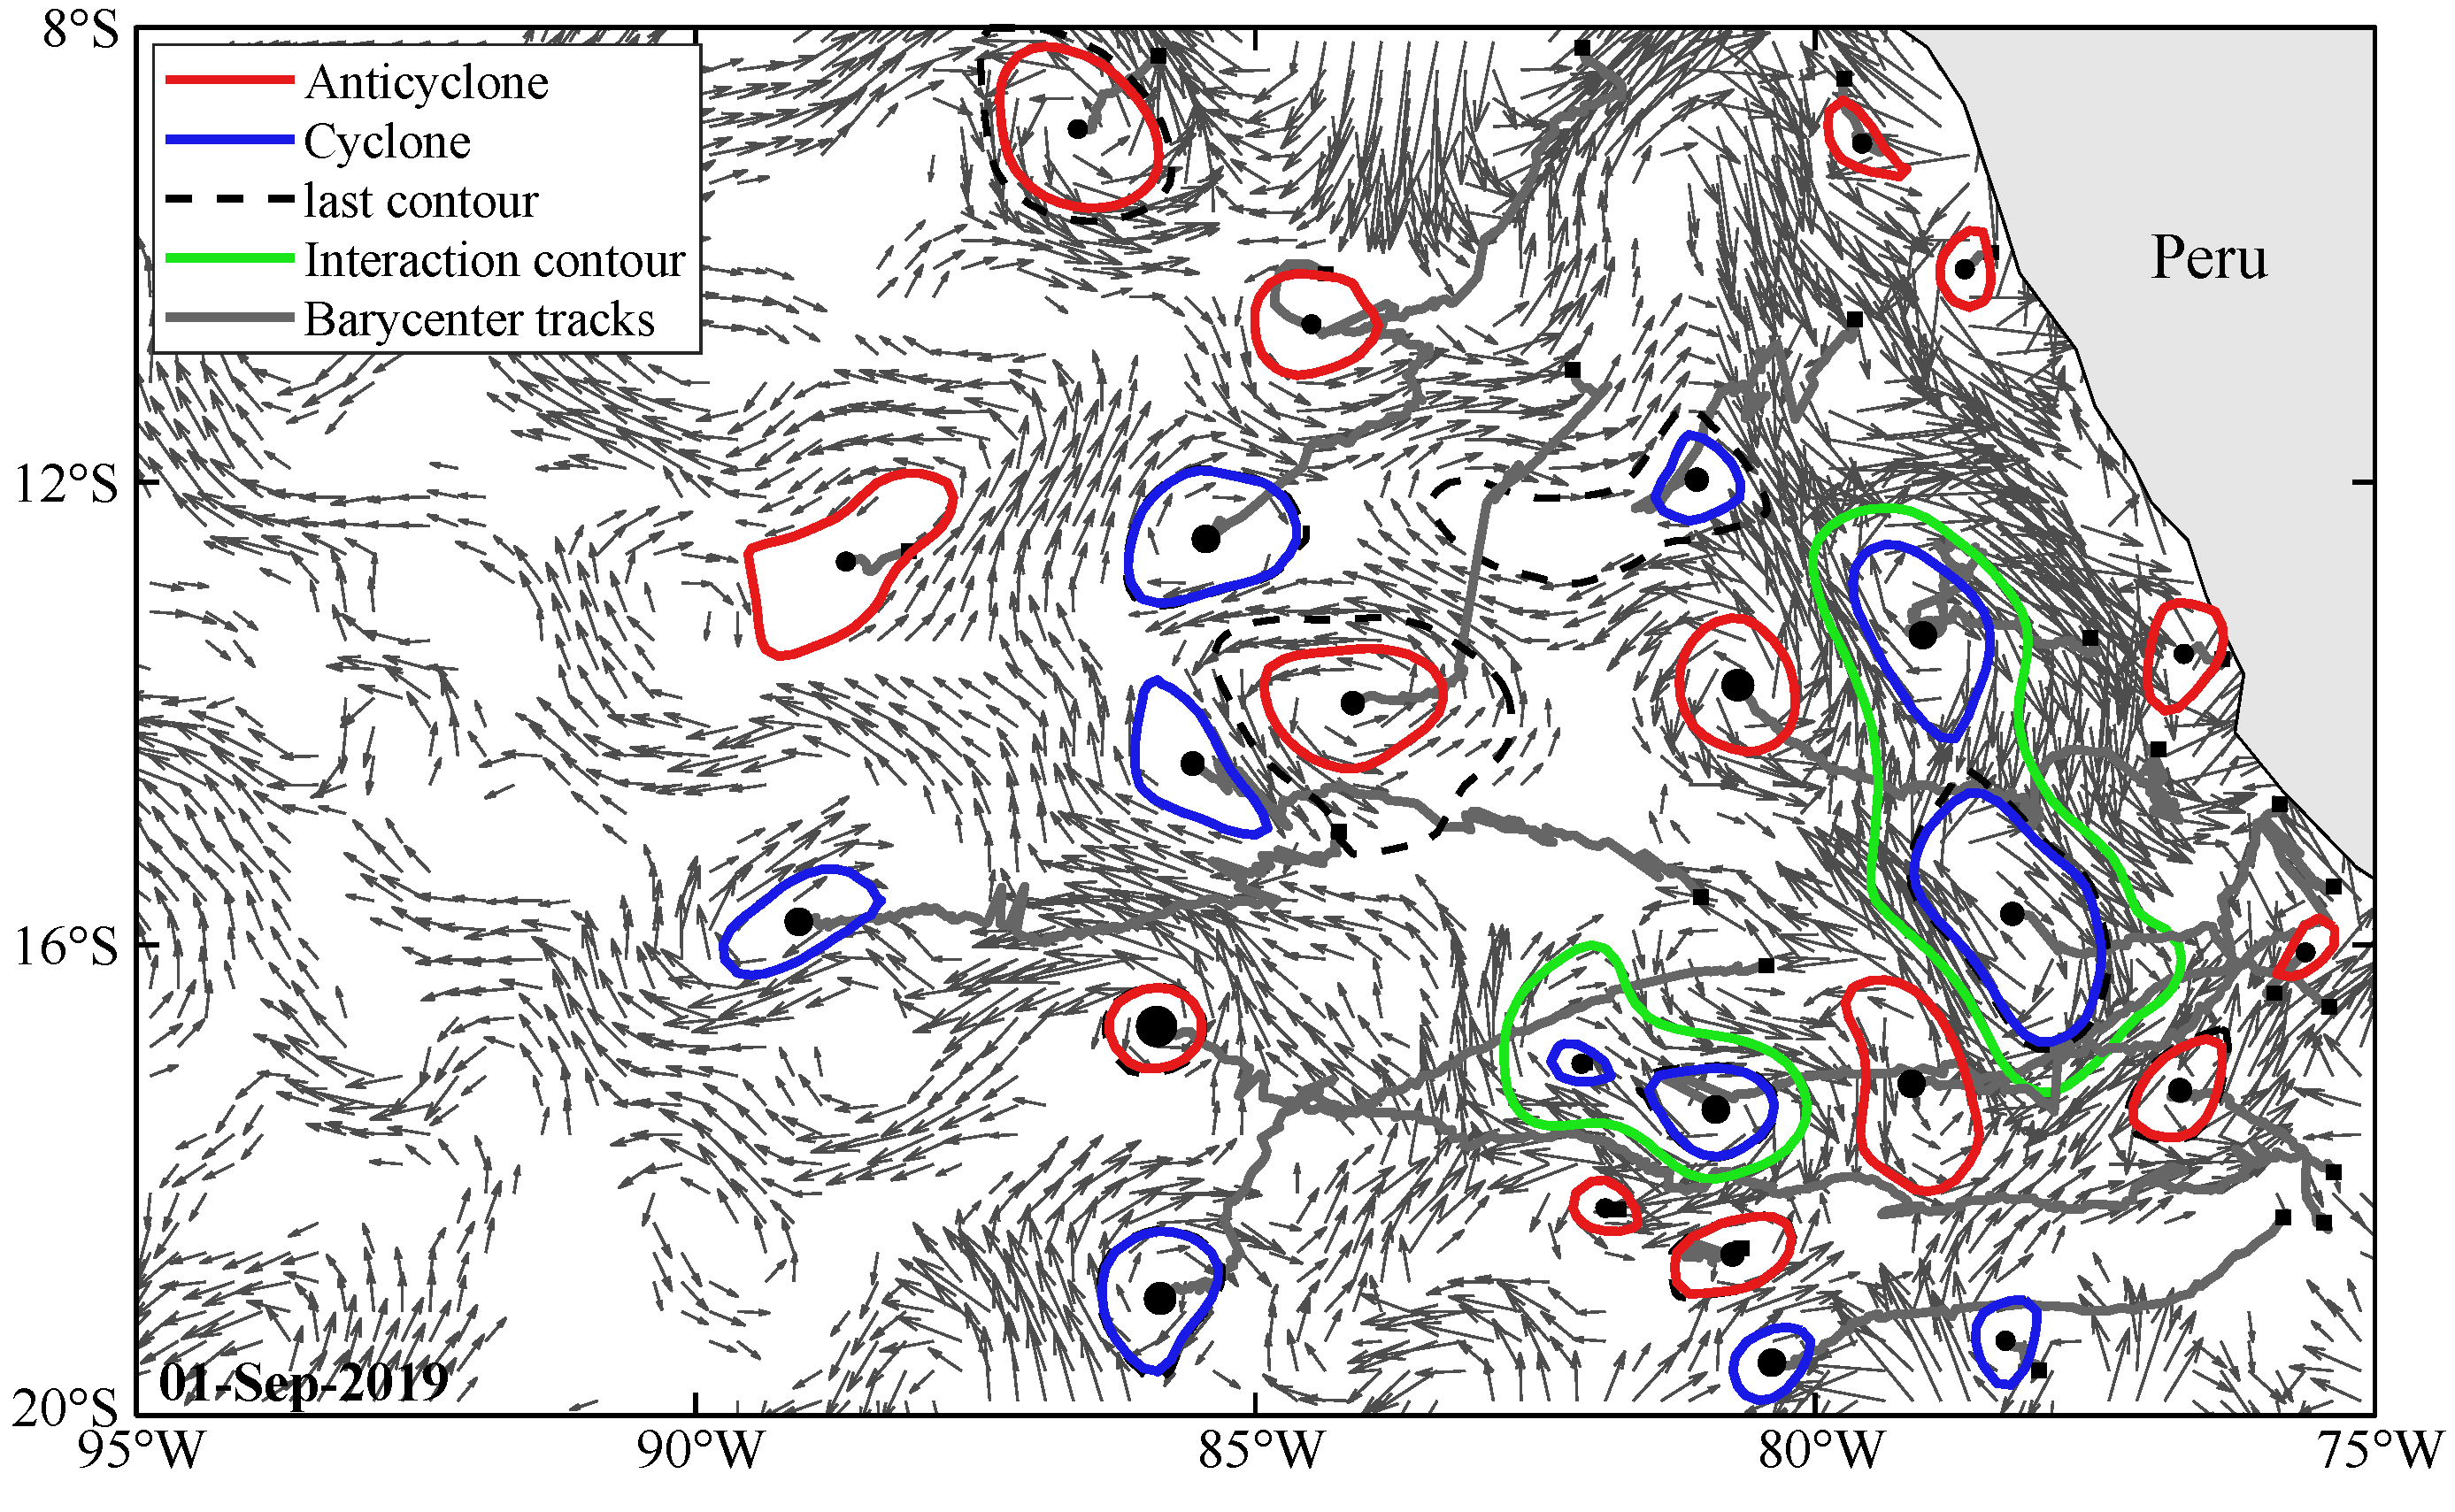
Absolute dynamic topography and sea surface current velocity data were integrated into AEDMA for eddy identification and tracking. In this study, a total of 4774 mesoscale eddies were detected from September to December 2019, comprising 2446 CEs and 2328 AEs. Various characteristic parameters of each eddy were recorded daily. Figure 2 illustrates the spatial distribution of the mesoscale eddies present in the study area on 1 September 2019.
The lifetime of mesoscale eddies was defined as the duration from their generation to dissipation. To facilitate the comparison of eddies with different lifetimes, the lifetime of each eddy was normalized, with its generation and dissipation considered as 0 and 1, respectfully. The entire lifetime of an eddy was further divided into four stages, namely formation (0~0.1), intensification (0.1~0.3), maturity (0.3~0.8), and decay (0.8~1) [43].
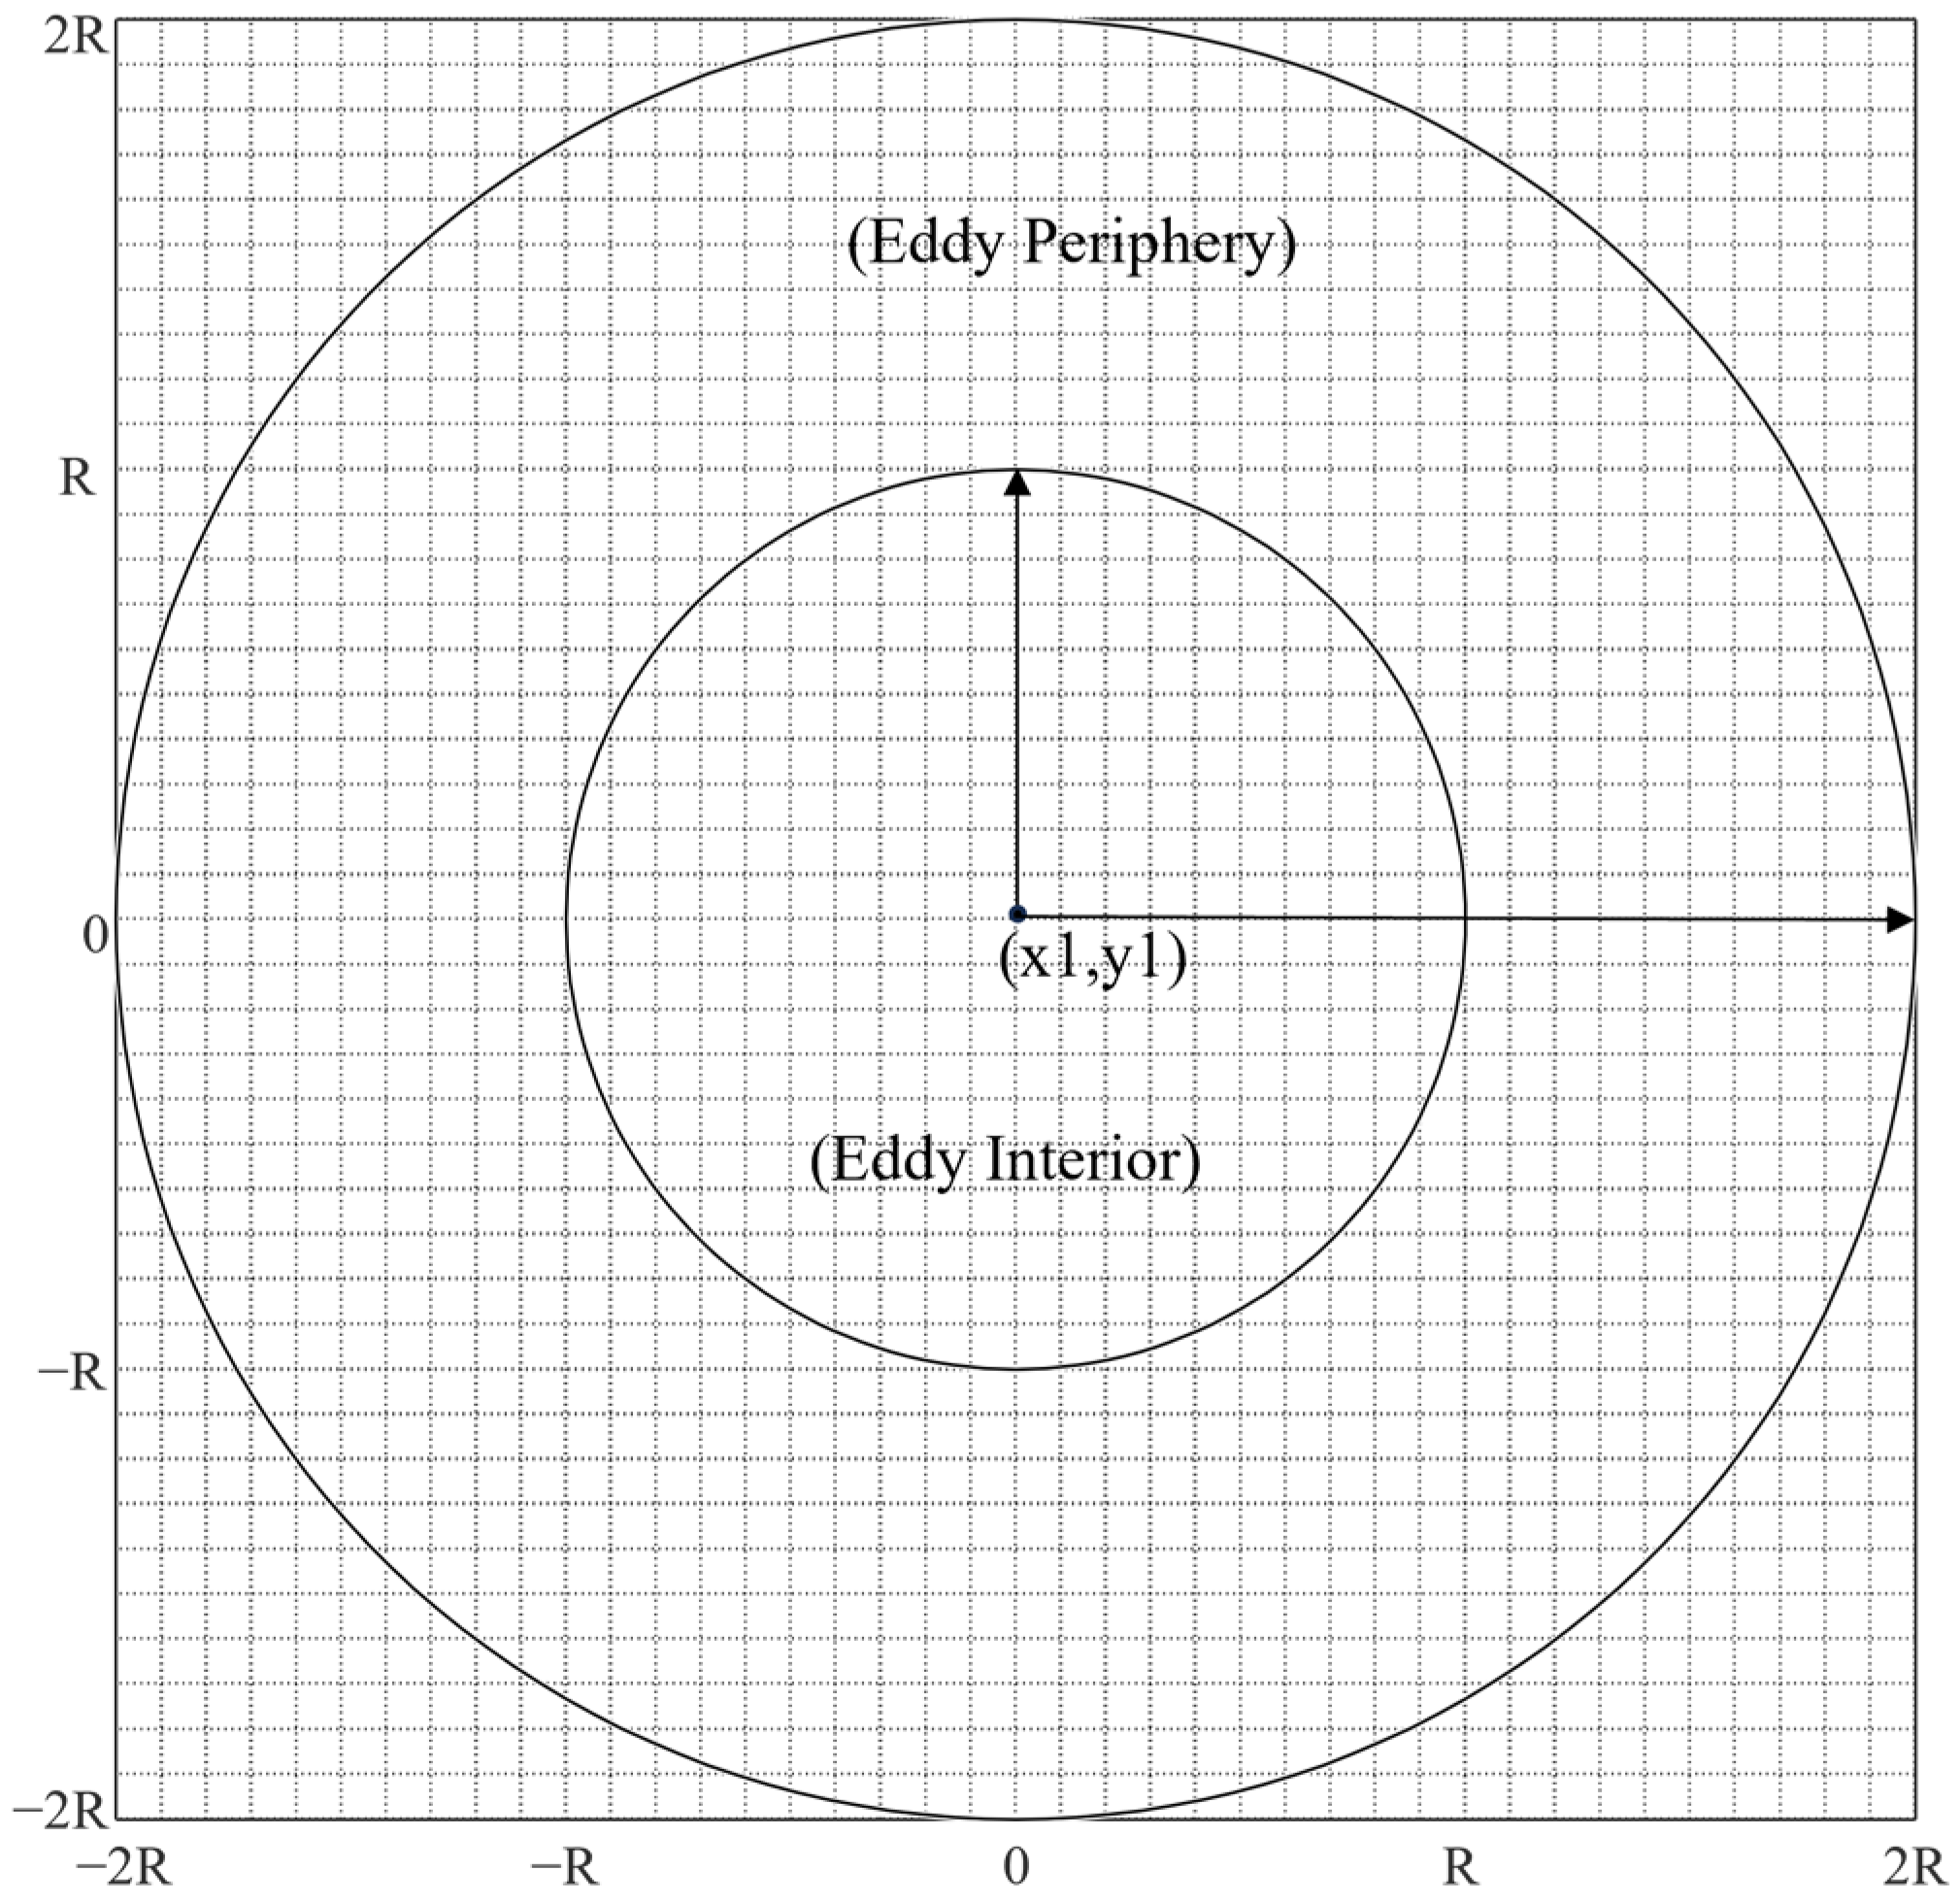
In this study, a normalized grid of radial distances to the eddy centers was established to characterize the daily influence area of the eddies (Figure 3). This grid was divided into two regions: the eddy interior (from 0 to R) and the eddy periphery (from R to 2R) [44,45], where R represents the radius of a circle with the same coverage area as the eddy. The daily influence area for each detected eddy is represented by this grid.

2.4. The Relationship between the Abundance and Distribution of D. gigas and Different Stages of Eddies

The random forest (RF) algorithm is a highly acclaimed machine learning algorithm recognized for its robust capability to fit both linear and nonlinear relationships between variables and make accurate predictions, a feature that has led to its extensive application in fisheries studies [46,47]. As a bagging ensemble method, RF enhances the regression tree algorithm by aggregating multiple uncorrelated regression trees to produce the final output [48]. By amalgamating predictions from numerous trees, RF demonstrates superior tolerance to noise and outliers, effectively mitigating overfitting and yielding regression results with heightened accuracy, all while fully accommodating data diversity [49]. RF relies on two critical hyperparameters: the number of variables considered at each split (mtry) and the number of trees (ntree) [50]. In this study, the input factors for the RF were the eddy velocity, fishing date, and fishing longitude and latitude, with the output factor being CPUE. The parameter ntree was set to 500, and the parameter mtry was set to 2.
To explore the variation in D. gigas abundance and distribution during different stages of eddies, this study utilized normalized relative distance analysis to investigate the spatial relationship between the fishing position of D. gigas and the centers of eddies. Additionally, an analysis of variance (ANOVA) was used to compare the differences in CPUE of D. gigas in the interior and periphery of various types of eddies at different stages. This research calculated the longitude and latitude centers of gravity the CPUE of D. gigas within the influence range of eddies during different stages and compared them with the centers of eddies using the following formulae:
LONG = i = 1 k ( X i × C i ) i = 1 k C i LATG = i = 1 k ( Y i × C i ) i = 1 k C i
where LONG is the longitude center of gravity of the CPUE; LATG is the latitude center of gravity of the CPUE; X i is the longitude of the fishing position; Y i is the latitude of the fishing position; C i is the CPUE of the fishing position, and k is the number of fishing positions in the different stages of the eddies.

2.5. Environmental Shifts and D. gigas Habitat Changes during Different Stages of Eddies

SST, T50, and Chl-a are known to significantly influence the growth, reproduction, and habitat distribution of D. gigas [32,38,51]. Therefore, these three environmental factors were interpolated into the daily normalized grid of each eddy. Subsequently, these normalized grids were categorized into different stages, and the normalized grids from multiple eddies in different stages were averaged to represent the distribution of environmental factors within eddies across the four stages. To better reflect the relationship between D. gigas distribution and environmental parameters, this study only considered normalized grids of eddies containing fishing positions.
This study employed a suitability index (SI) and a habitat suitability index (HSI) model to analyze the potential mechanisms influencing the distribution and abundance of D. gigas during eddy evolution. The environmental factors from the daily normalized grids of each eddy were incorporated into SI and HSI models. The calculation methods for both models are detailed in the study by Jin et al. [51]. Regions where SI ≥ 0.6 and HSI ≥ 0.6 were defined as suitable single-factor environmental conditions and suitable habitats, respectively, and the proportions of these regions within CEs and AEs were quantified.

2.6. Evolutionary Analysis of Eddy 284

To validate the influence of eddy evolution on the abundance and distribution of D. gigas, this study selected a specific eddy case (relatively long-lived and containing multiple fishing positions in all life stages) and tracked its entire lifetime. The chosen eddy case, labeled as 284 (the sequence number represents its detection order), was identified as a CE with a lifetime of 59 days. Eddy 284 encompassed D. gigas fishing positions in all stages, totaling 139 points. Statistical analysis was conducted on the environmental conditions throughout the different stages of this eddy, along with the corresponding SI and HSI distributions. The spatial distribution of D. gigas catch within the different stages of the eddy was assessed.

3. Results

3.1. D. gigas Abundance and Distribution in Different Eddy Stages

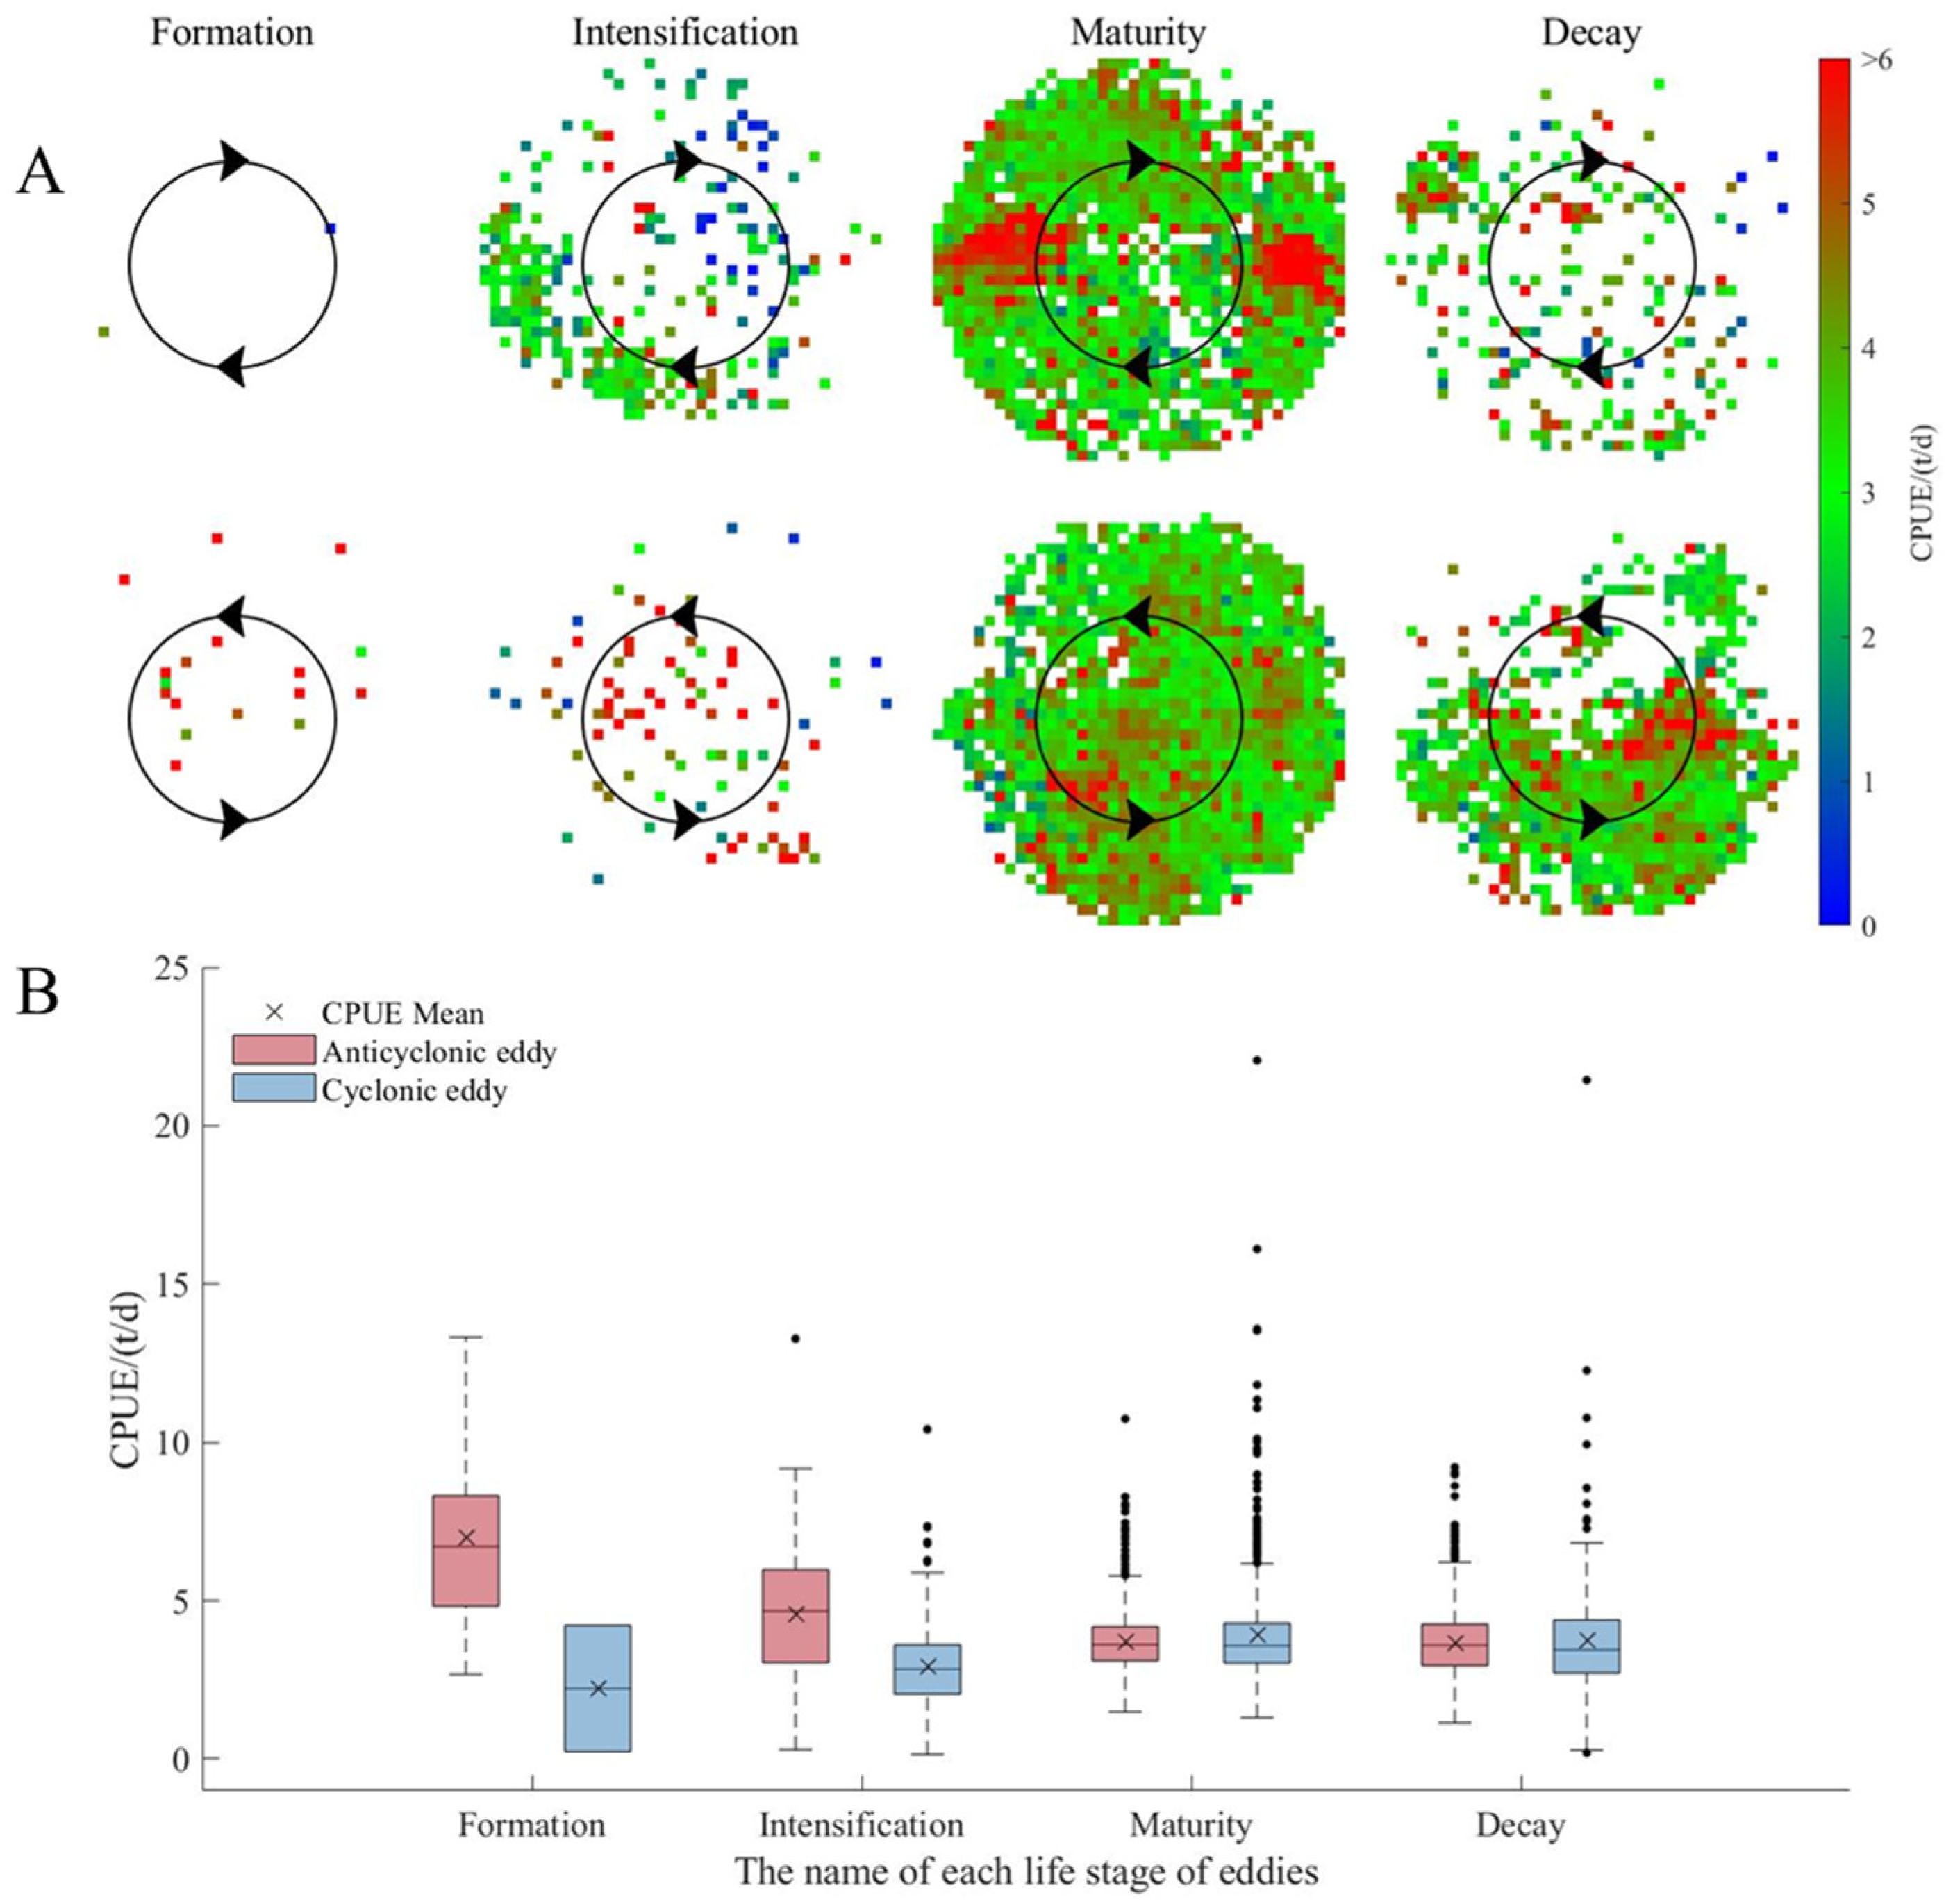
As the eddies evolved, the spatial distribution of D. gigas CPUE within both CEs and AEs followed a similar trend, characterized by an initial increase and a subsequent decrease in CPUE (Figure 4A). During the formation stage, there was minimal CPUE in both types of eddies. CPUE increased in the intensification stage and was mostly concentrated in the peripheral areas southwest of the eddy center in CEs, while in AEs, the CPUE was more dispersed, with higher values occurring predominantly in the eddy interior. In the maturity stage, the CPUE was maximum, and widely distributed in both types of eddies, with higher CPUE observed in the eddy interior of AEs compared to CEs. During the decay stage, the CPUE in CEs decreased notably, while in AEs, the CPUE was mostly concentrated south of the eddy center. The ANOVA results indicated significant differences in the CPUE of D. gigas between the internal and peripheral regions of both CEs and AEs at different stages (p < 0.05).
There were observed differences in the average levels of the CPUE within CEs and AEs across different stages (Figure 4B). The mean level of the CPUE was higher in AEs compared to CEs during both formation (AE = 7.00 t/d and CE = 2.22 t/d) and intensification (AE = 4.57 t/d and CE = 2.90 t/d) stages. High CPUE was observed within both types of eddies during the maturity and decay stages, with the maximum CPUE reaching 22.06 t/d in CEs and 10.74 t/d in AEs.
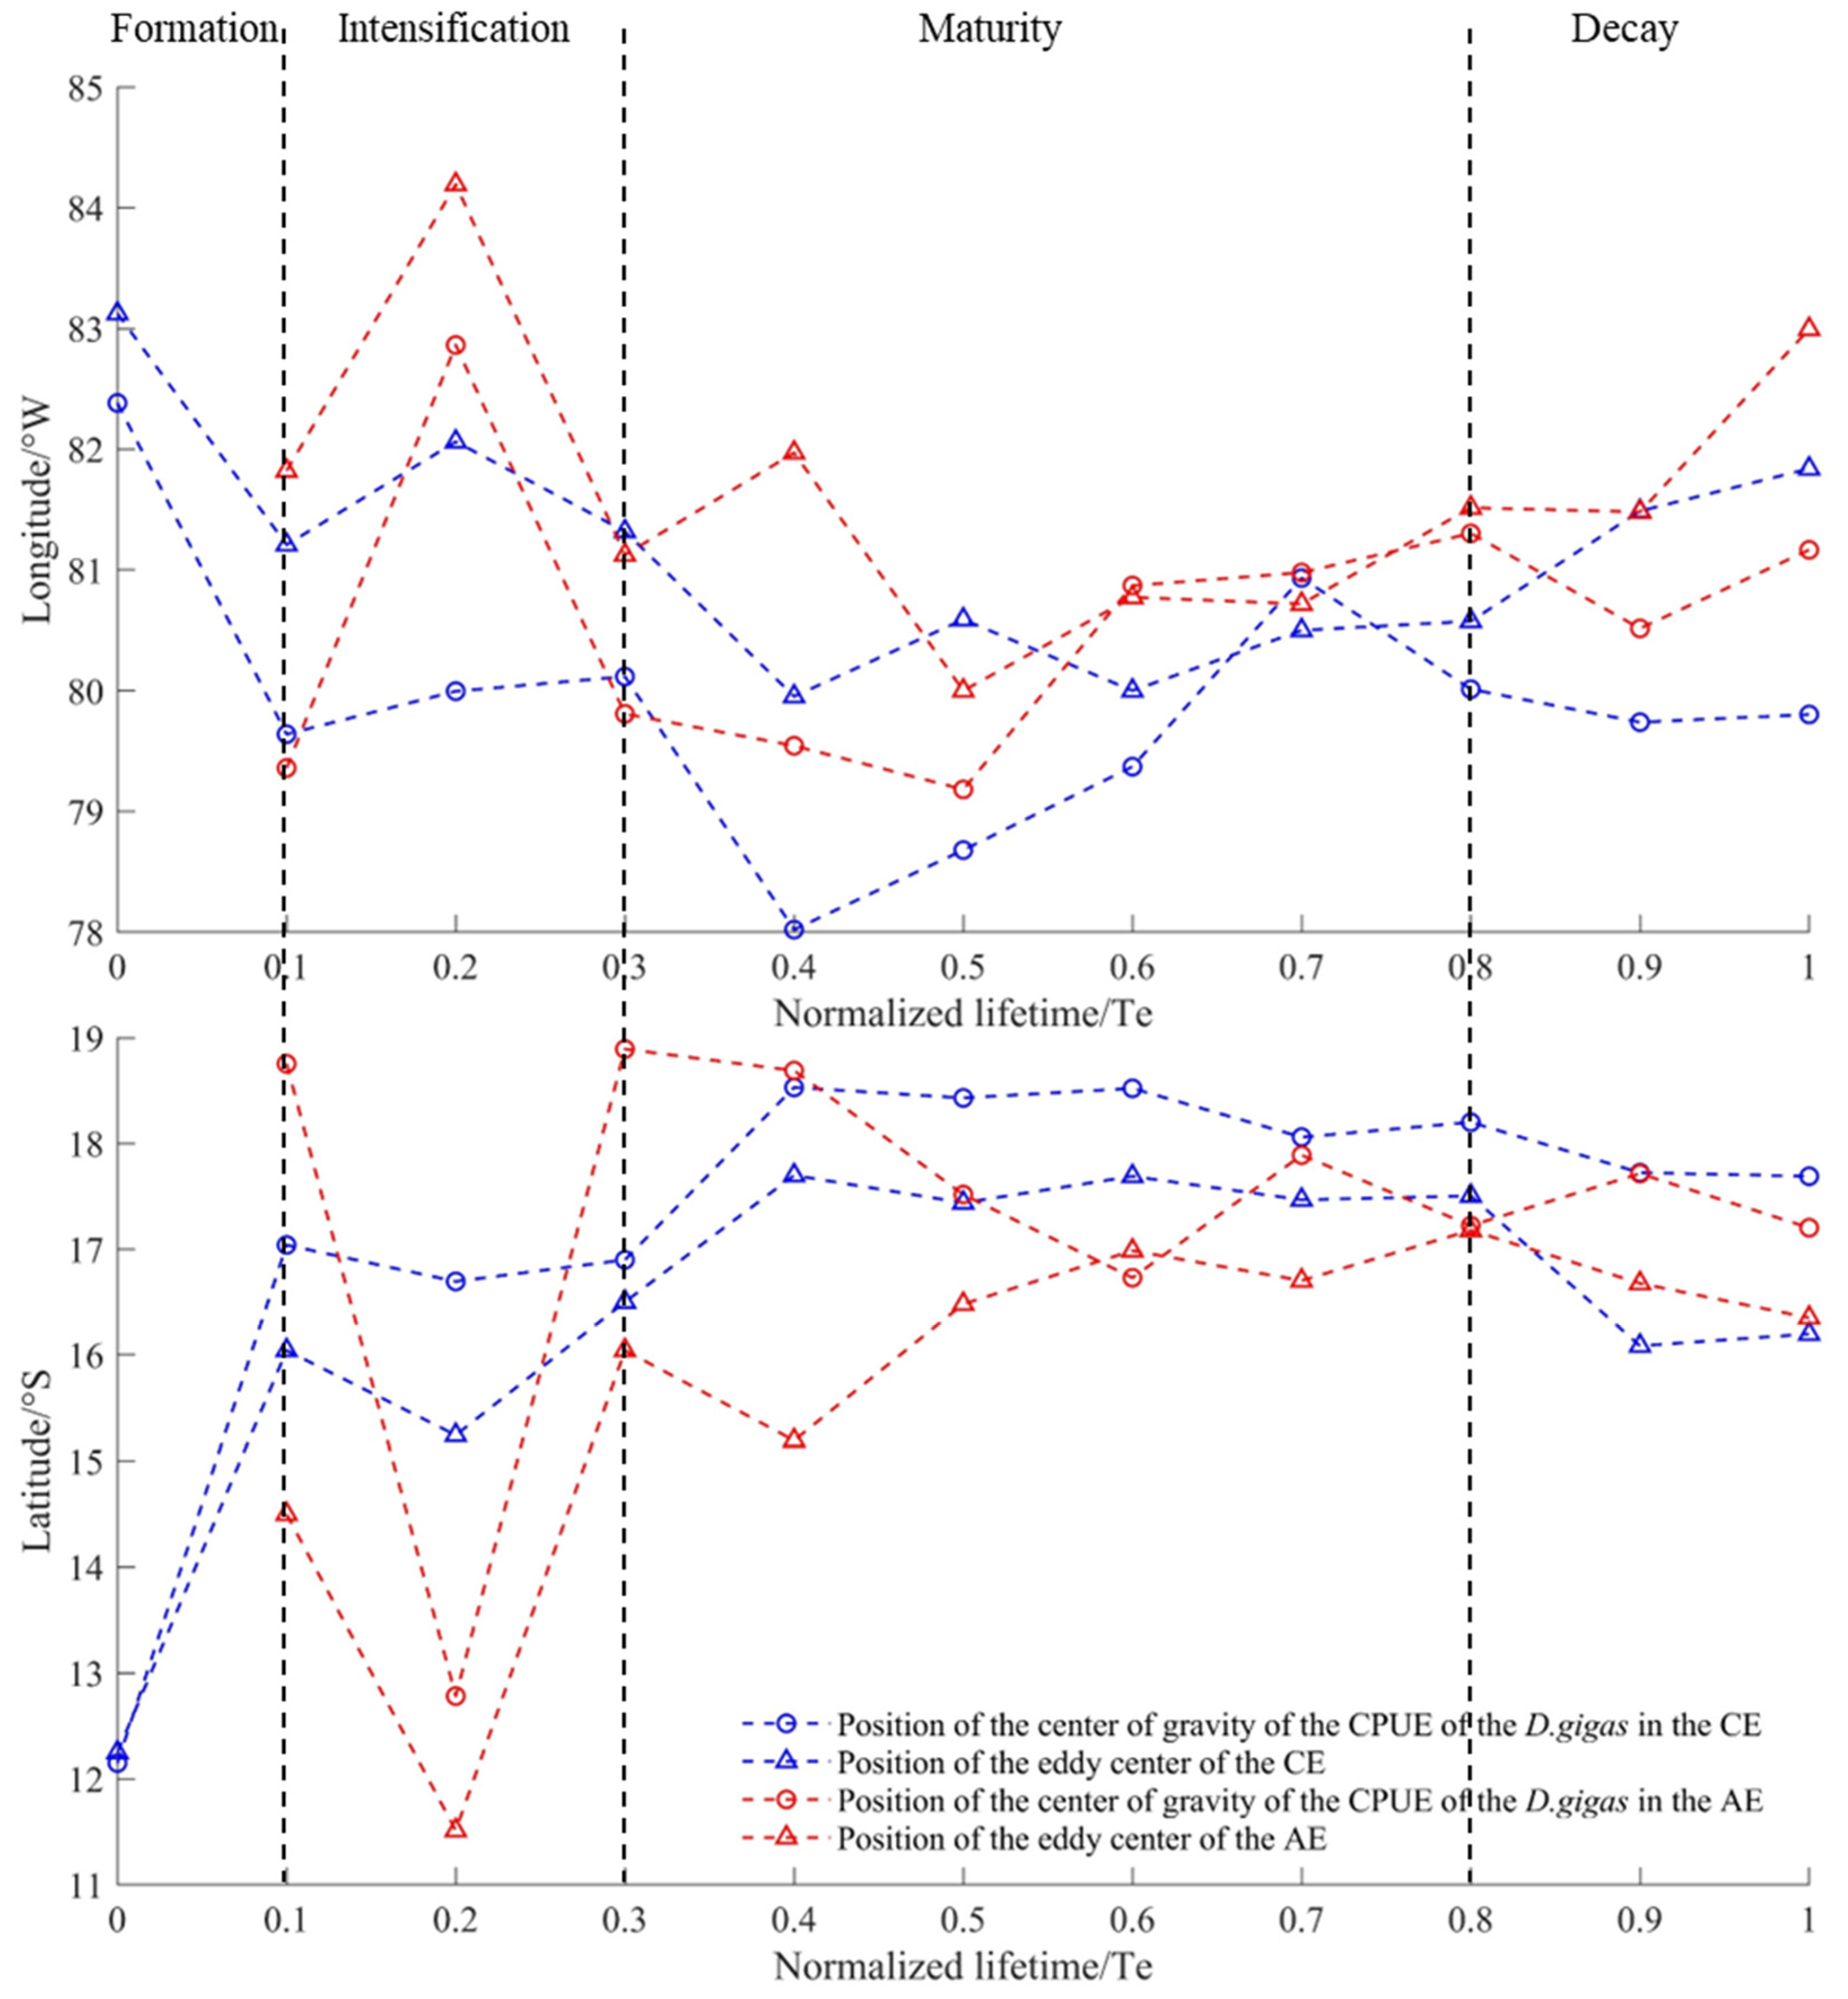
During the evolution of CEs and AEs, both the eddy center and the center of gravity of the CPUE within their influence regions exhibited similar movement trajectories (Figure 5). Longitudinally, the overall movement trajectory of the eddy center and the CPUE center of gravity in CEs was eastward, with a more pronounced eastward trend in the movement of the CPUE center of gravity. In contrast, the overall movement trajectory of the eddy center and the CPUE center of gravity in AEs was westward. Latitudinally, the overall movement trajectory of the eddy center and the CPUE center of gravity in CEs was southward, with a noticeable southward trend in both during the formation stage. In AEs, the overall movement trajectory of the eddy center was southward while that of the CPUE center of gravity was northward, both of which exhibited similar trends in the intensification stage.

3.2. Environmental Characteristics of Different Stages of Eddies

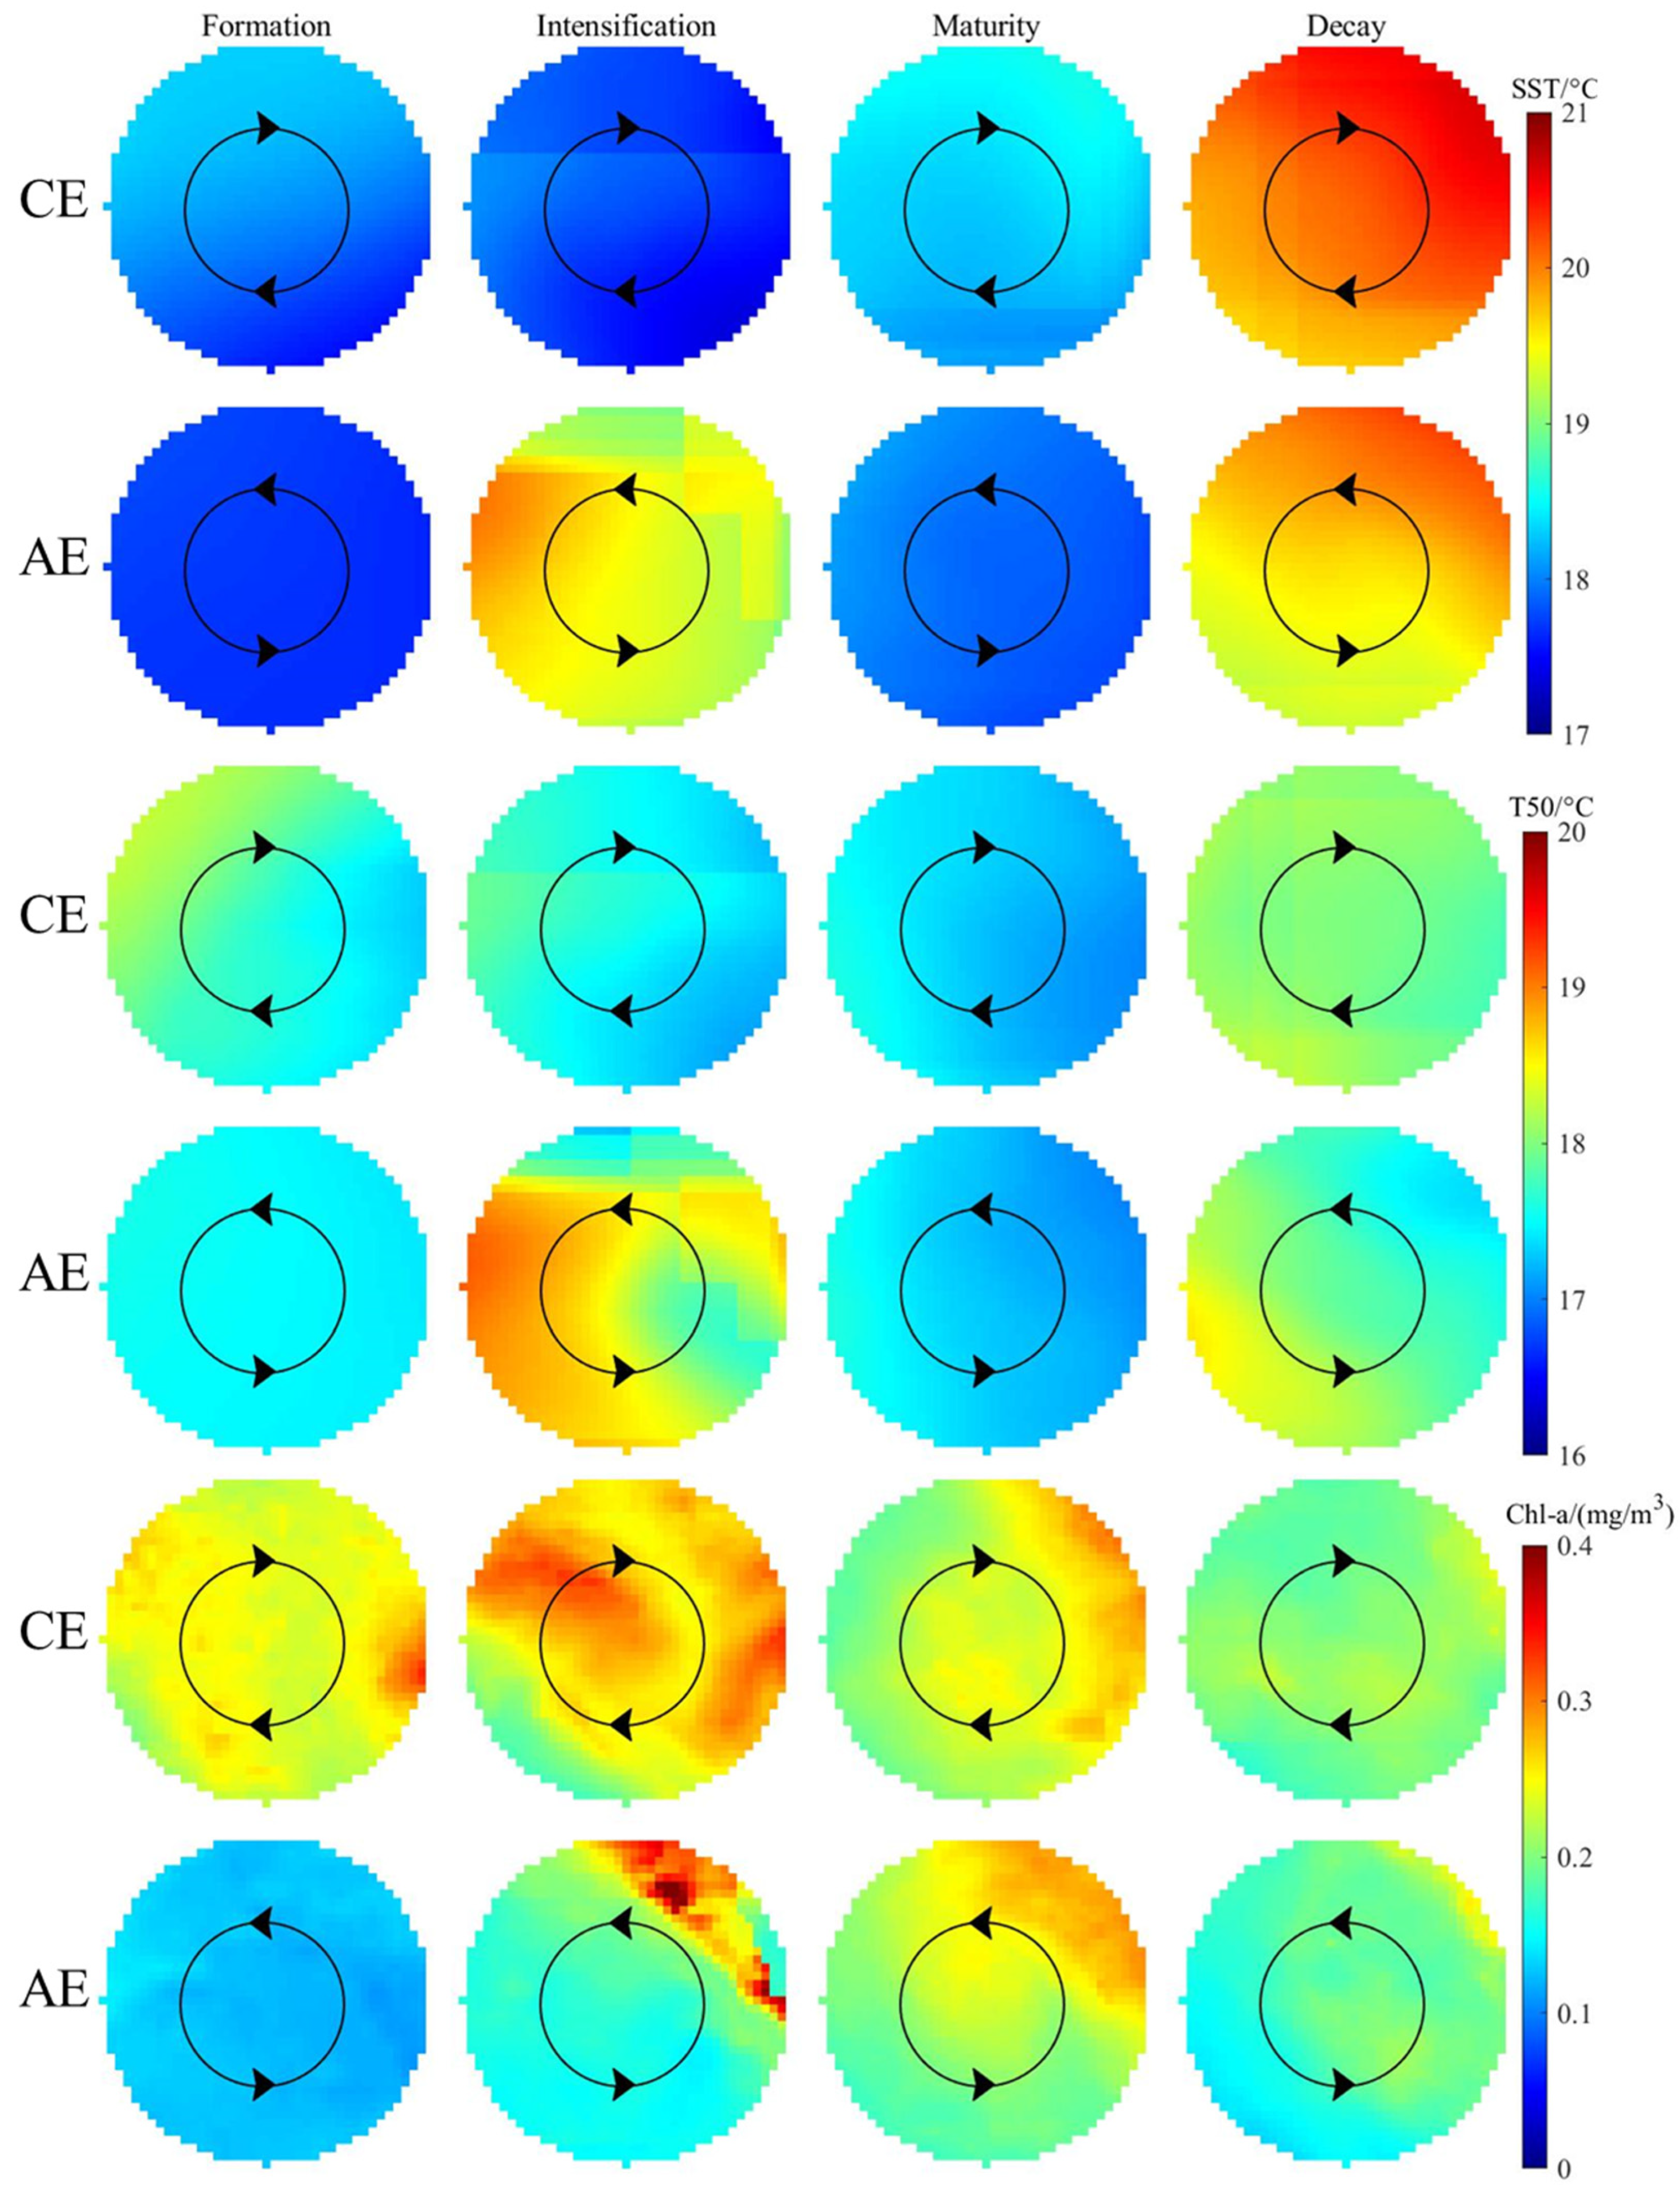
In different stages, there were certain disparities in the spatial distribution patterns of SST, T50, and Chl-a within CEs and AEs (Figure 6). In CEs, the SST and T50 were relatively higher during the decay stage compared to the other stages. There were no significant differences in the SST and T50 between the interior and peripheral areas of CEs during each stage, and Chl-a was relatively higher during the first three stages compared to the decay stage. Moreover, Chl-a values were relatively higher on the eastern side of the eddy center during the first three stages. In AEs, SST and T50 were relatively lower during the formation and maturity stages. However, during the intensification stage, there was a distinct area on the southeastern side of the eddy center with lower SST and T50. During the decay stage, the distribution patterns of SST and T50 in AEs showed opposite trends, with SST lower in the southwest and higher in the northeast and T50 higher in the southwest and lower in the northeast. Furthermore, Chl-a was significantly lowest during the formation stage, with the spatial distribution during the subsequent three stages characterized by higher values in the northeast and lower values in the southwest.

3.3. Changes in Habitat Suitability of D. gigas in Different Stages of Eddies

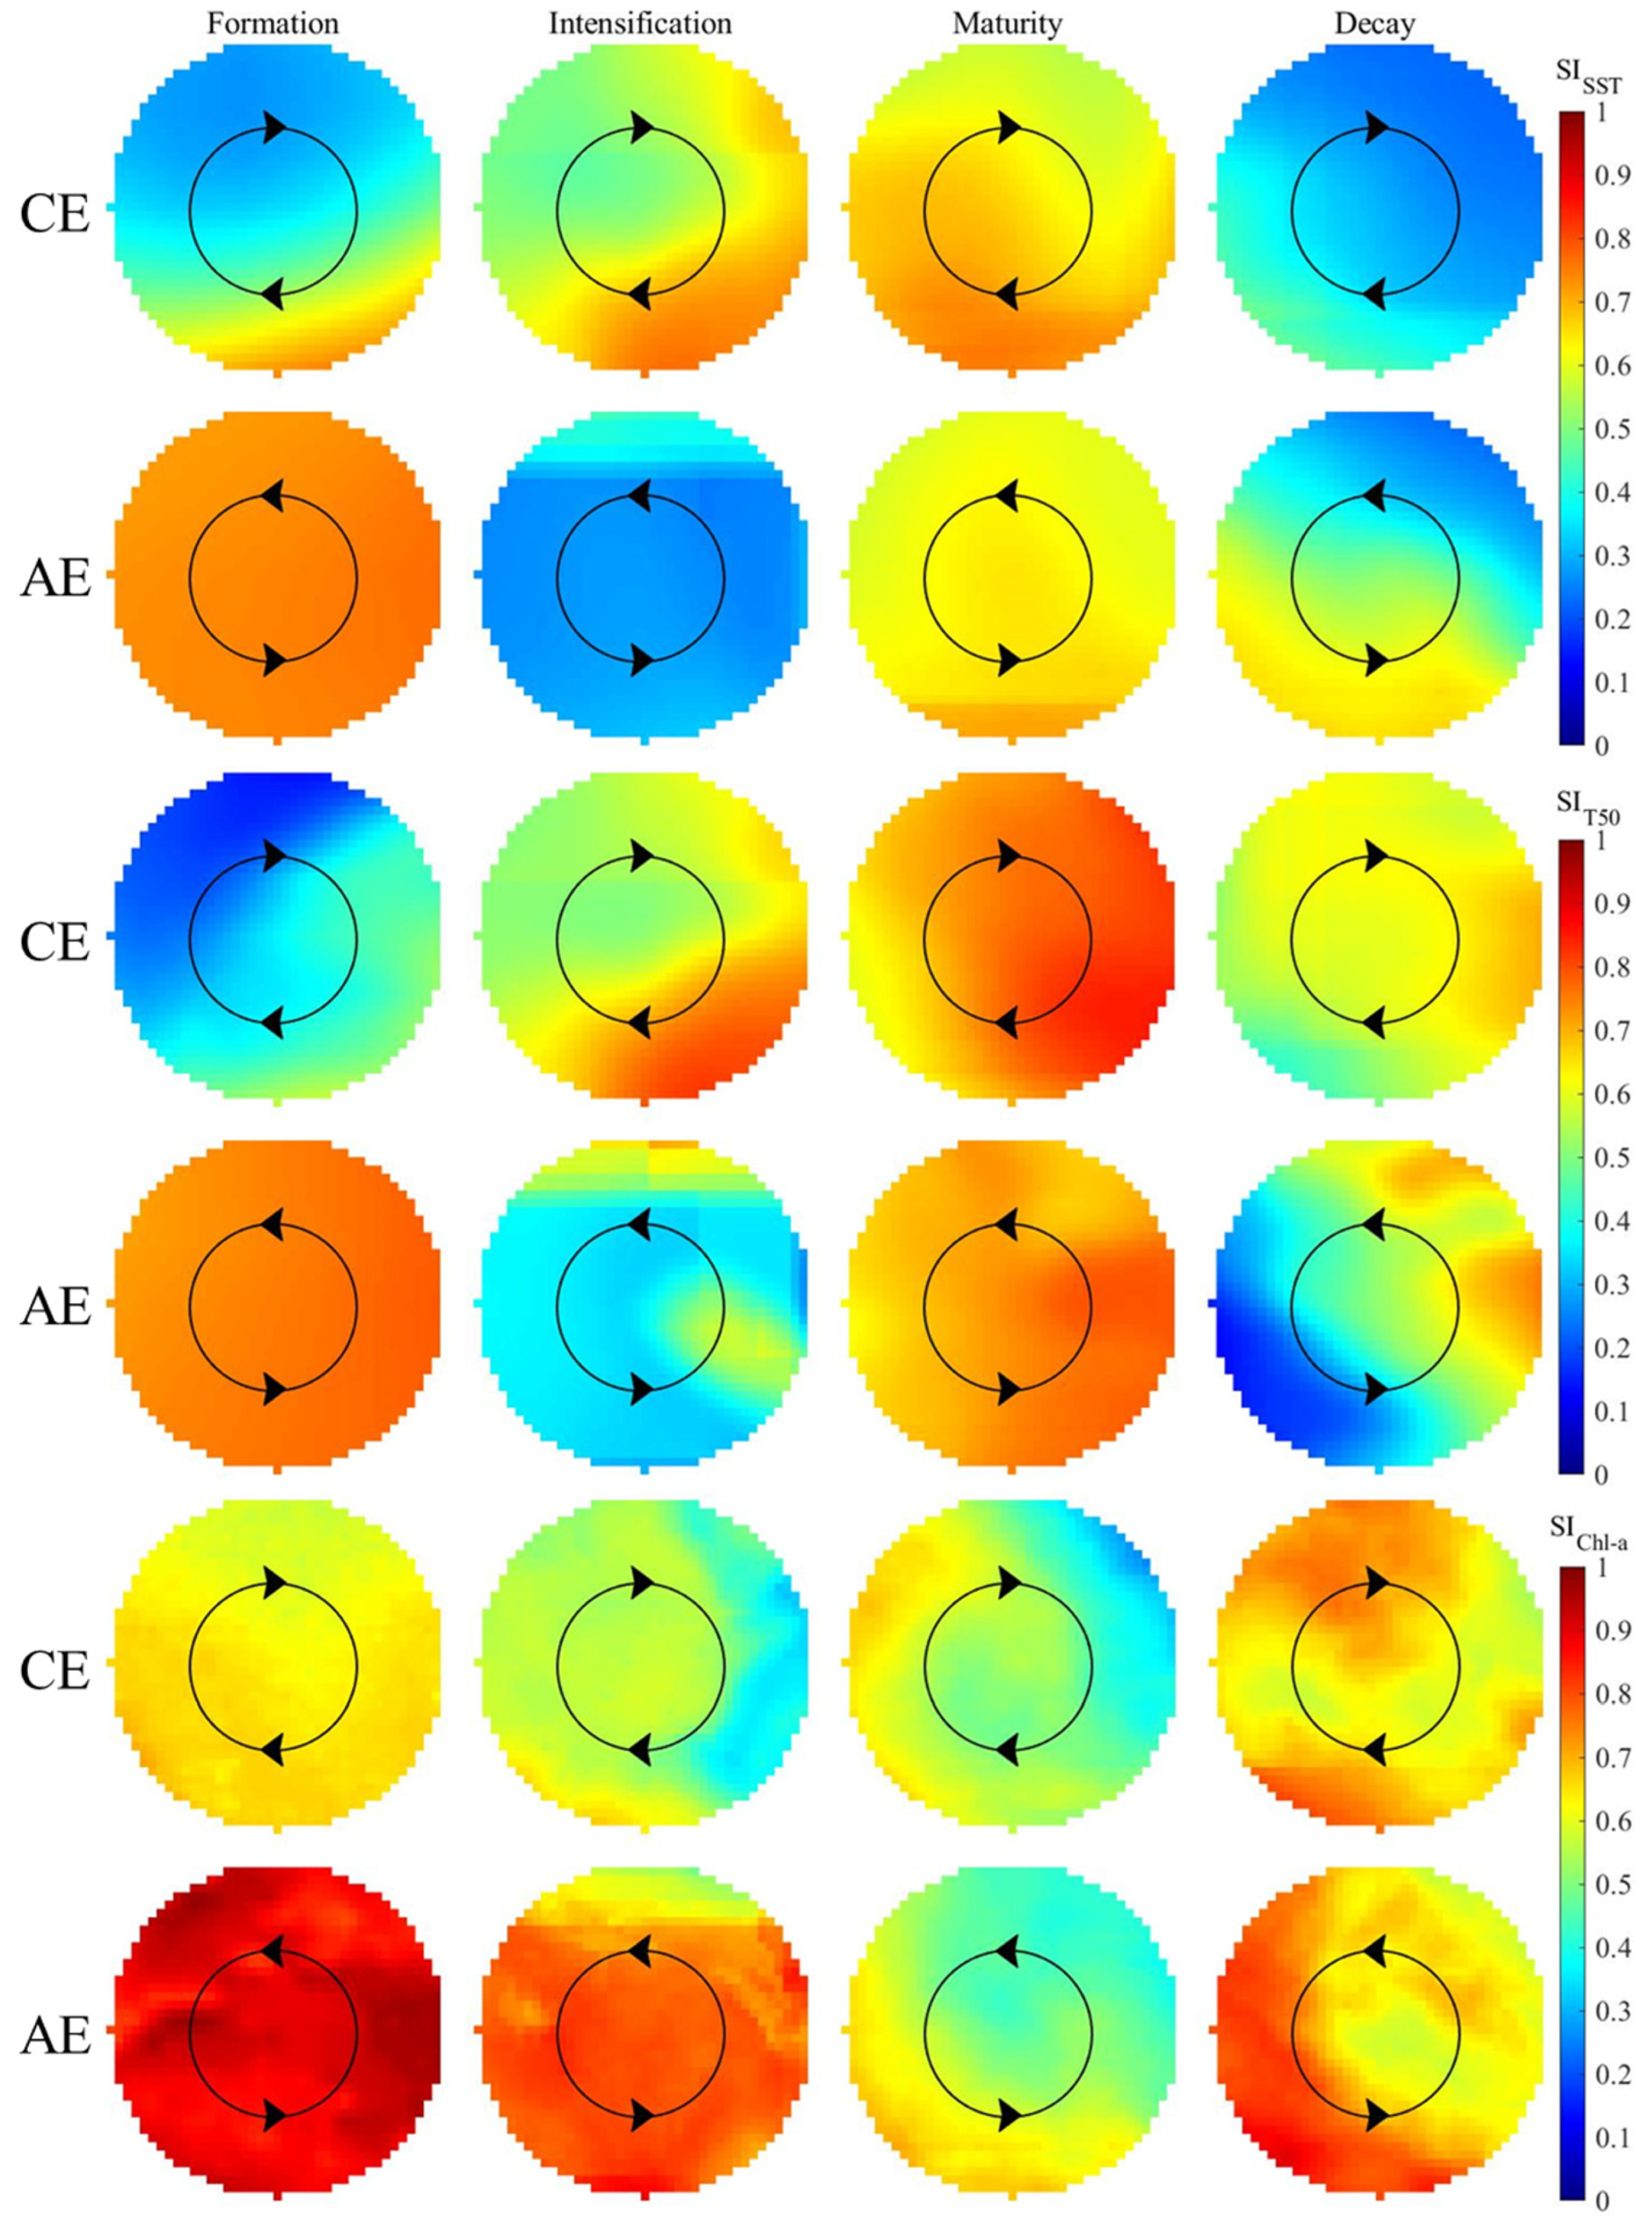
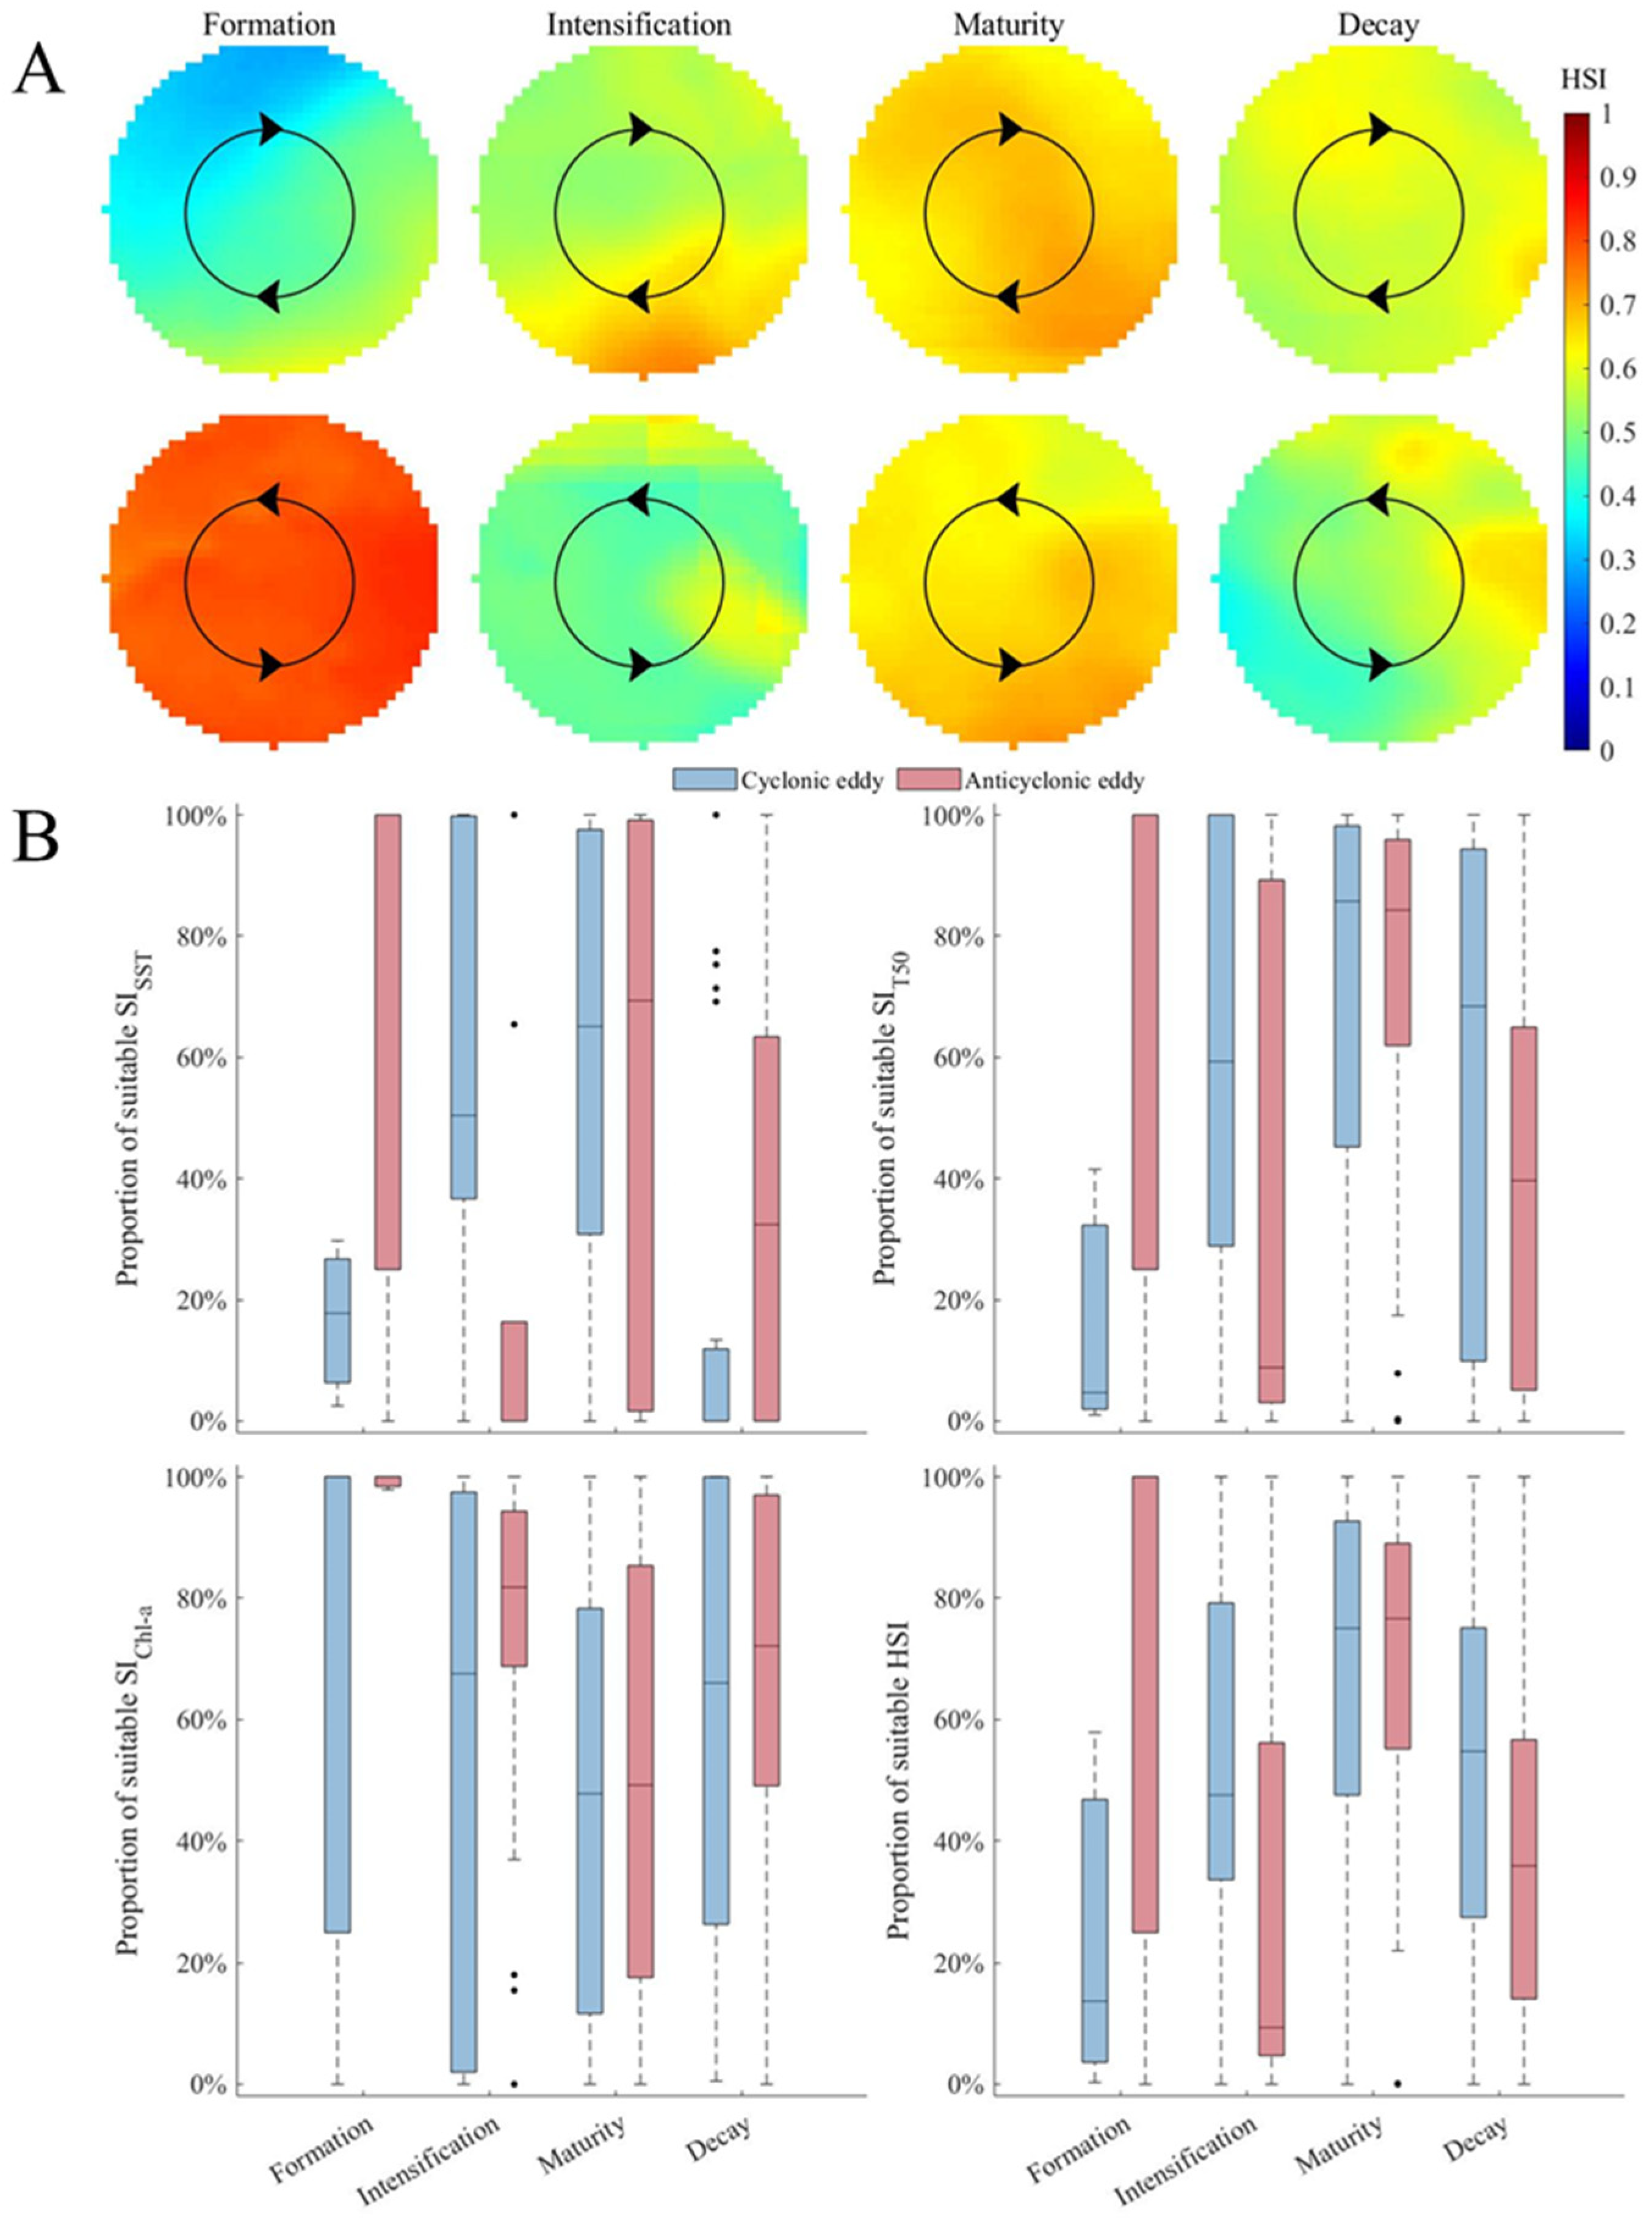
As the eddies evolved through the stages of formation, intensification, maturity, and decay, the average distribution patterns of SISST, SIT50, and SIChl-a within the eddies were illustrated in Figure 7. SISST and SIT50 exhibited similar trends during the evolution of both types of eddies: they initially increased and then decreased in CEs, reaching their peak during the formation stage in AEs, and then followed a pattern of initial increase and subsequent decrease in the remaining three stages. SIChl-a reached its optimum in the decay stage of CEs, followed by the formation stage. In AEs, SIChl-a was optimal during the formation stage, with the next highest values occurring during the intensification stage. The proportion of suitable SI values for each environmental factor was similar to these observed trends (Figure 8B).
The spatial distribution of HSI within different life stages of eddies and the variation in the proportion of suitable HSI values were illustrated in Figure 8. For CEs, during the formation and intensification stages, the HSI values were high in the southeast and low in the northwest, with fewer suitable HSI values. During the maturity stage, suitable HSI values were more widely distributed, while in the decay stage, suitable HSI values significantly decreased compared to the previous stage. In AEs, HSI values were very high during the formation stage, all exceeding 0.6. The intensification stage saw a significant reduction in suitable HSI values compared to the formation stage. During the maturity stage, suitable HSI values increased again, while in the decay stage, they decreased noticeably. The proportion of suitable HSI values for D. gigas in both types of eddies aligned with these observed trends.

3.4. Evolutionary Analysis of Eddy 284

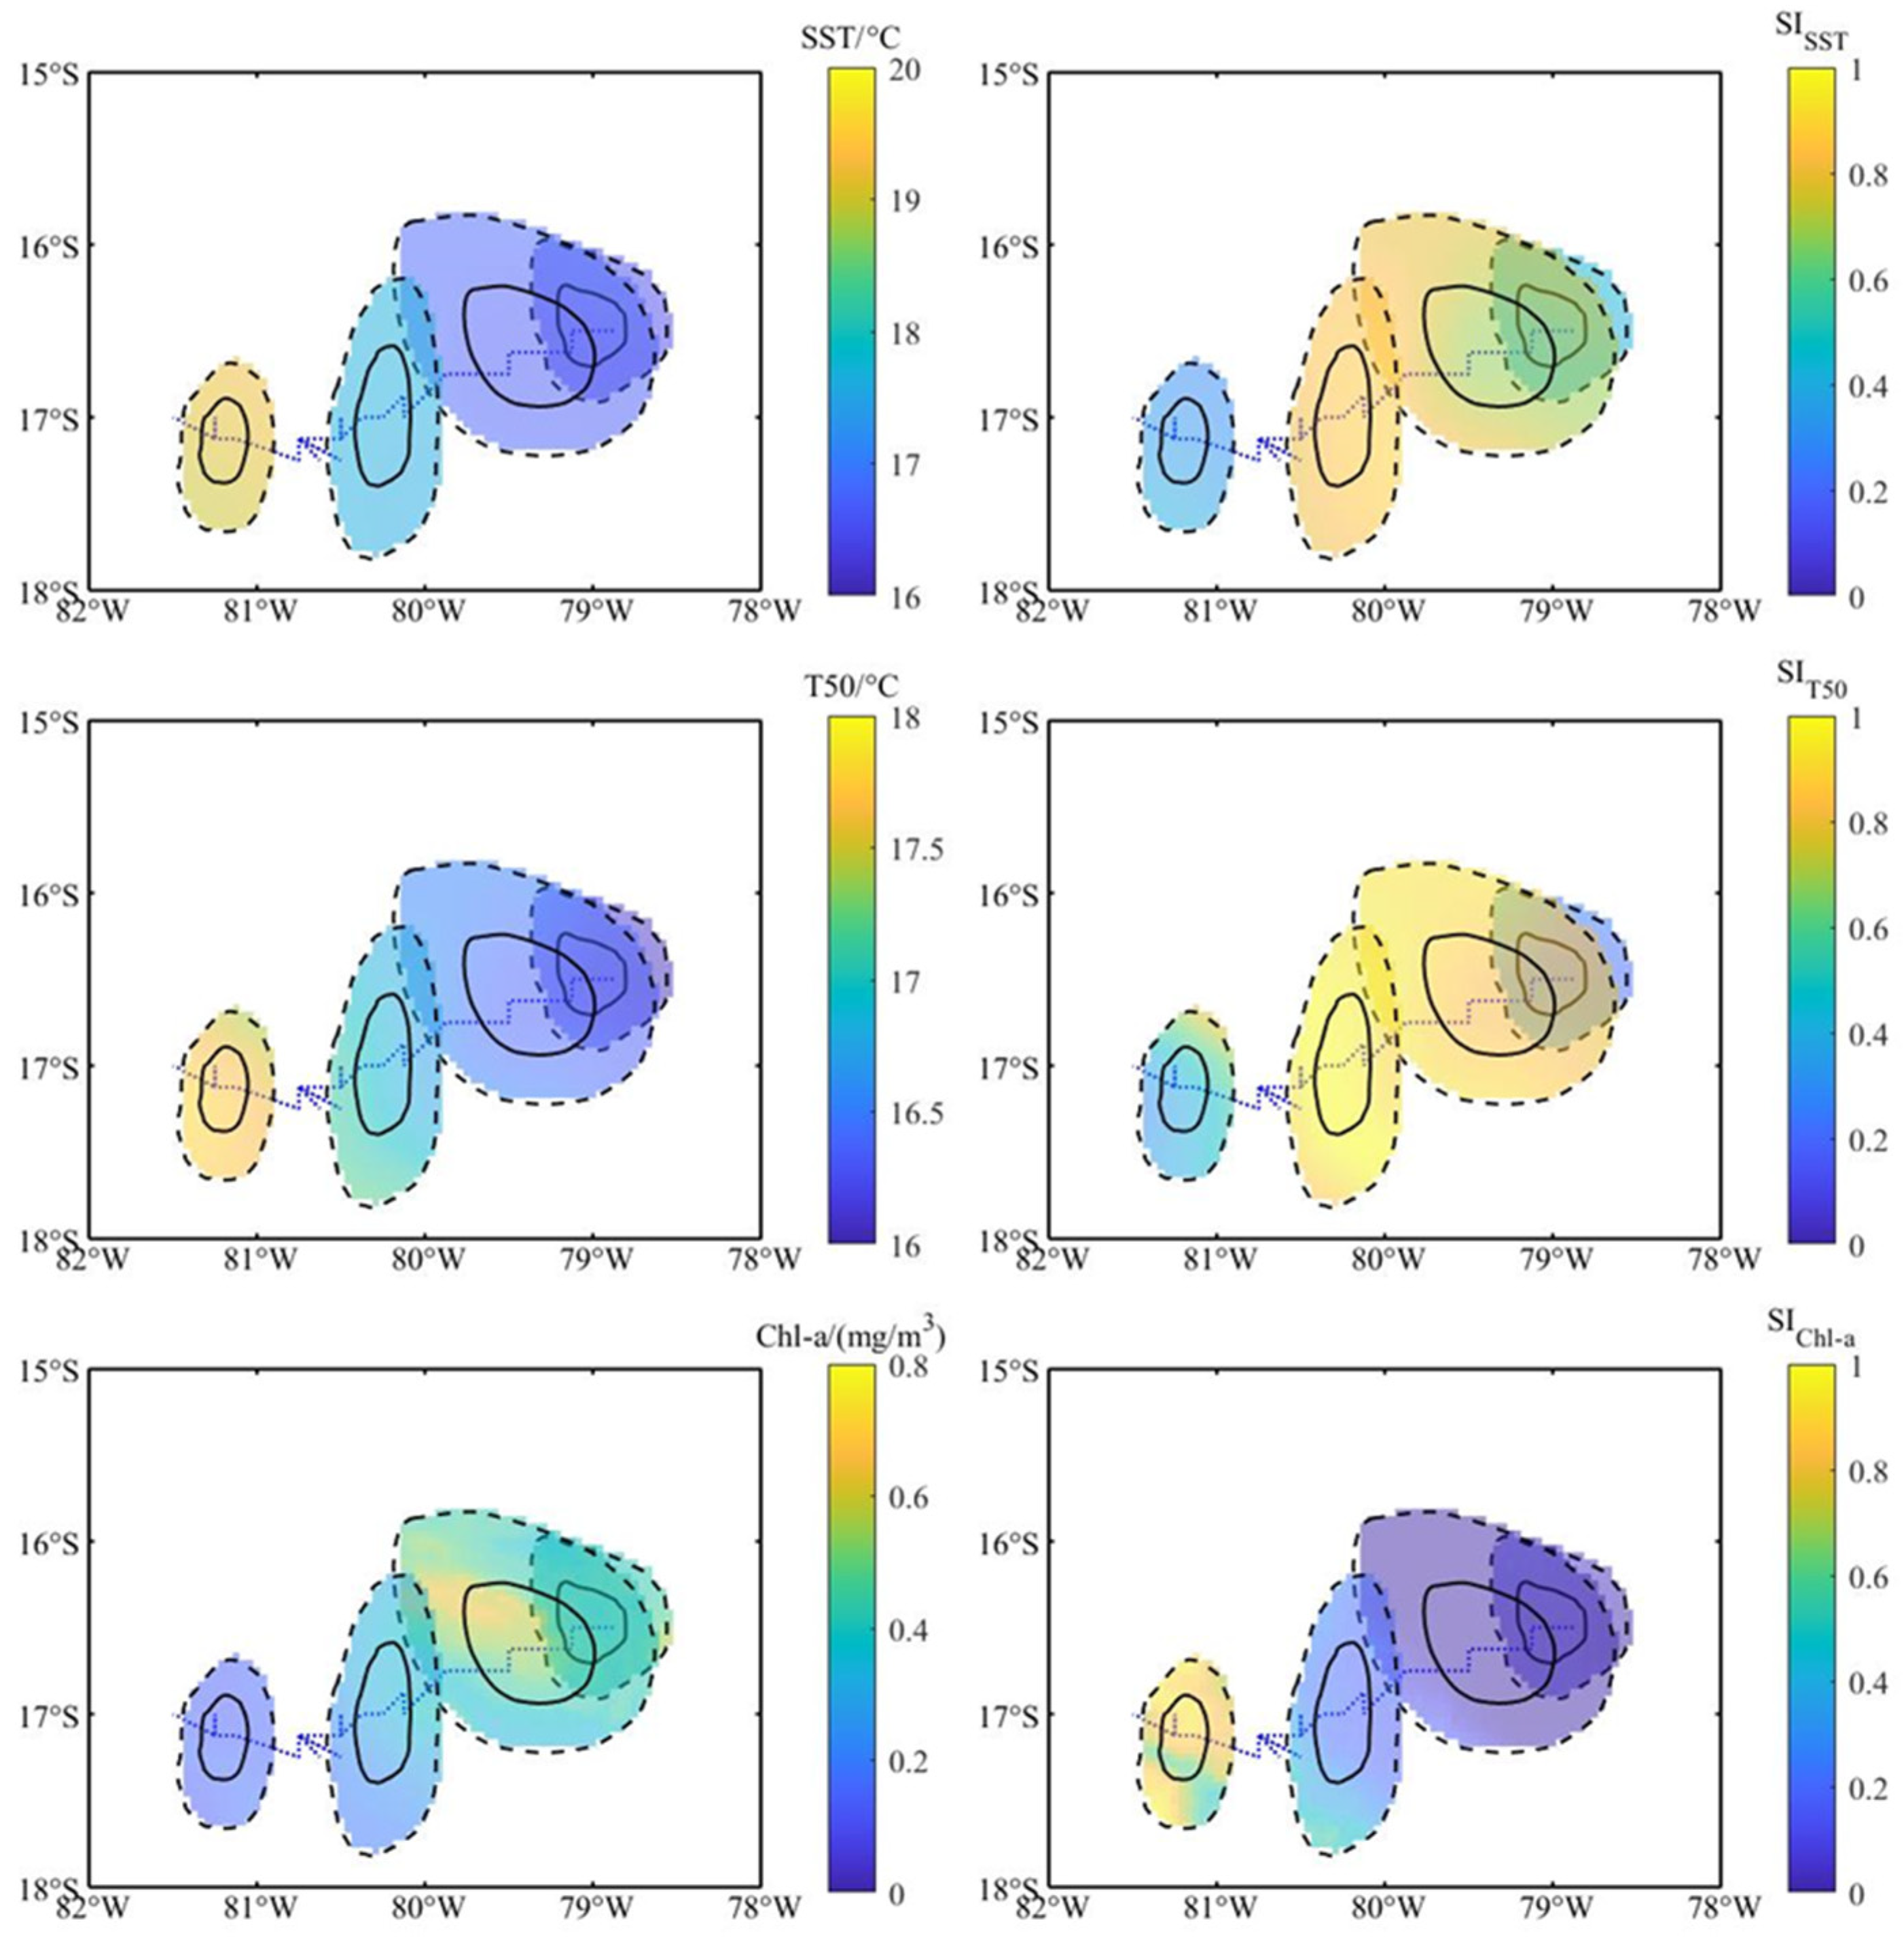
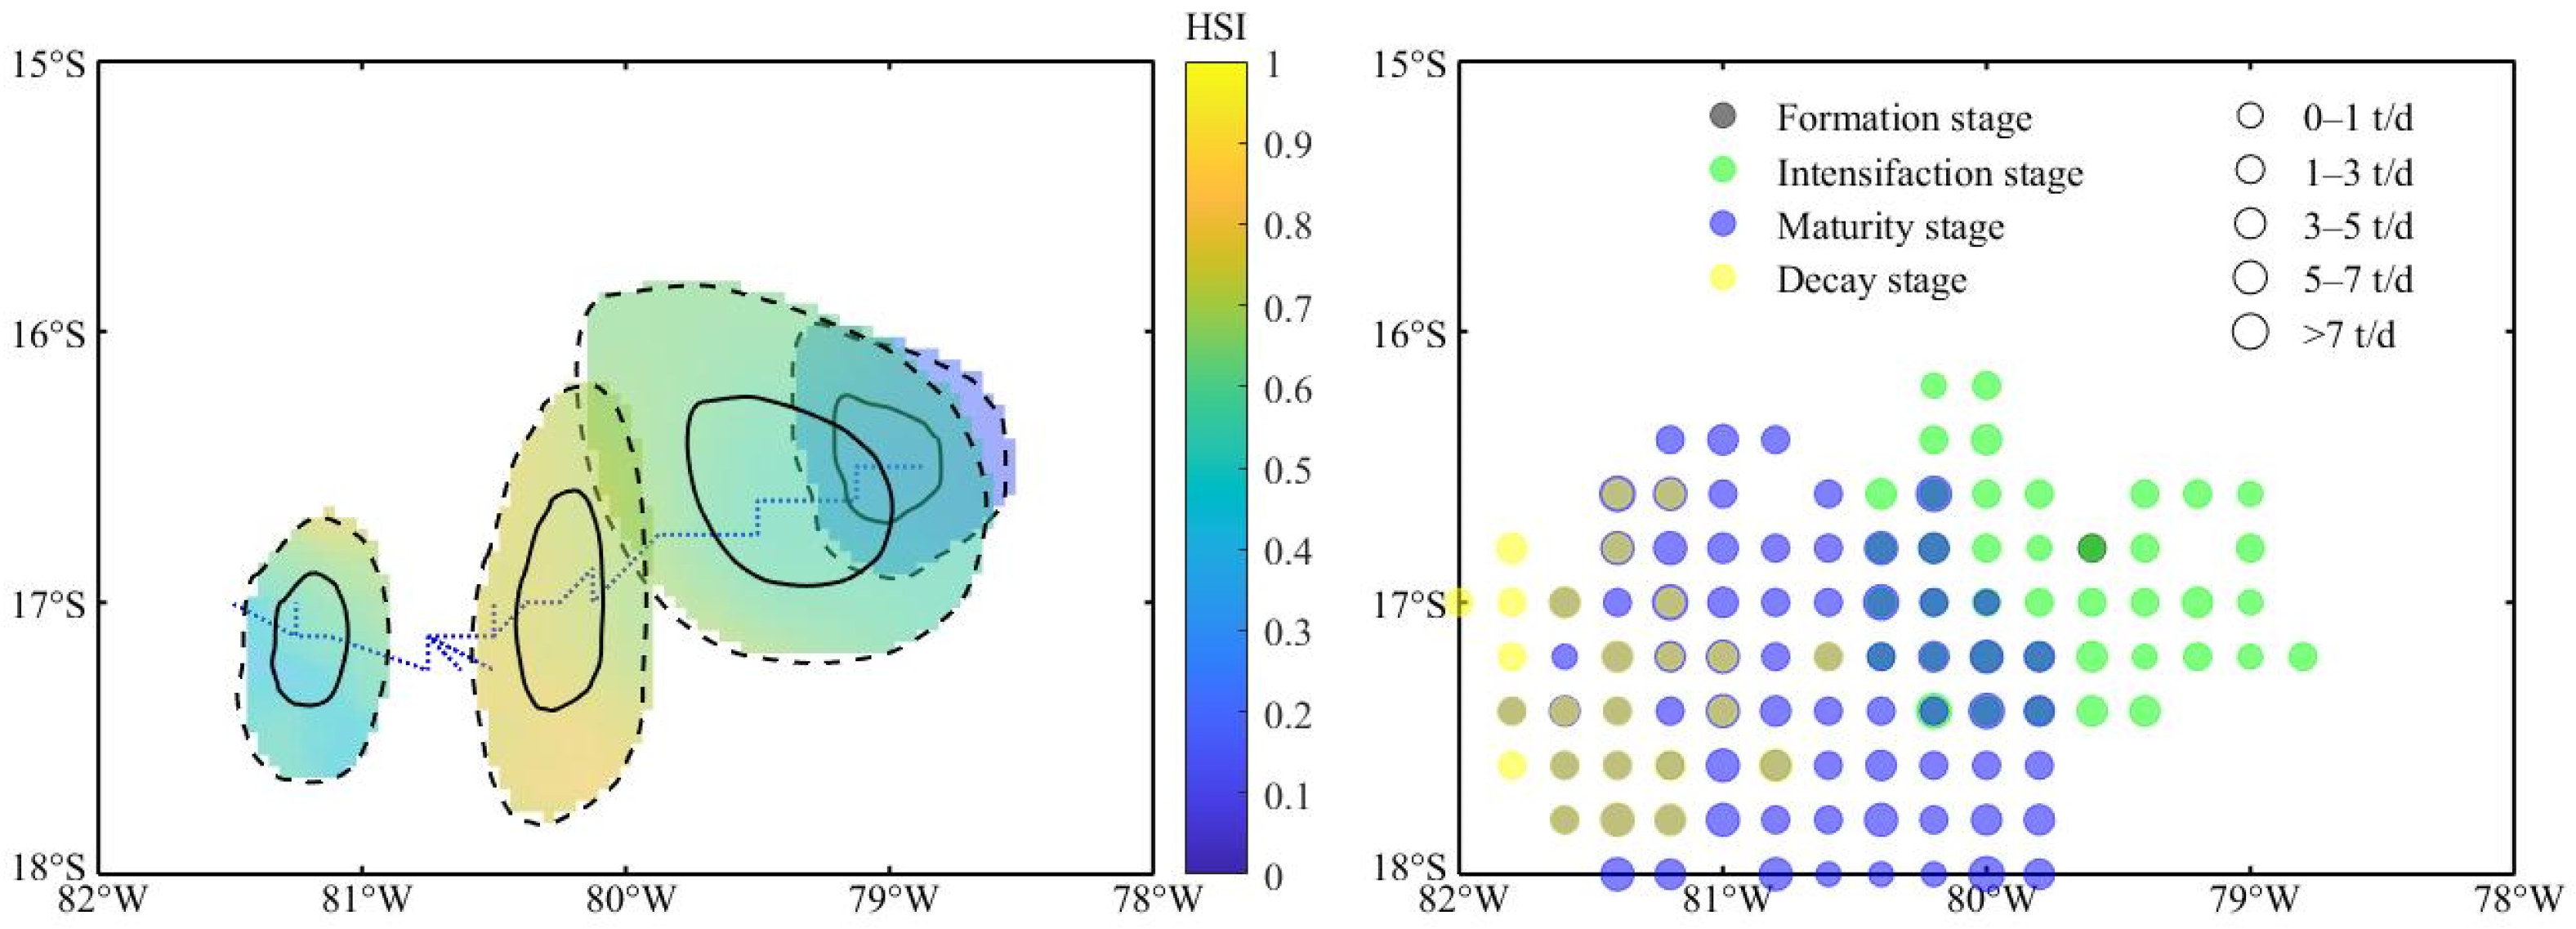
The complete trajectory of eddy number 284 (CE) throughout its lifetime, along with the mean SST, T50, and Chl-a, and their corresponding SI values, and the spatial distribution of HSI and CPUE are represented in Figure 9 and Figure 10. Throughout its lifetime, the eddy had traveled 279.87 km westward and 55.60 km southward. The trends of SST and T50 during this evolution showed a gradual increase, while Chl-a exhibited an initial increase followed by a decrease. As the eddy evolved, SISST, SIT50 m, HSI, and CPUE followed a trend of initially increasing and then decreasing, peaking during the maturity stage. In contrast, SIChl-a exhibited a trend of initially decreasing and then increasing.

4. Discussion

4.1. Eddy-Induced Environmental Change

Mesoscale eddies have a significant impact on the regional oceanic temperature structure. The temperature within CEs is usually lower than the temperature in the surrounding environment, while the temperature within AEs is usually higher [4]. In Peruvian waters, for the evolution of eddies from generation to dissipation, both CEs and AEs altered the structure of surrounding water masses, resulting in anomalies in sea surface and near-surface water temperatures [30]. However, this study found no evidence of these patterns through analyzing the SST and T50 at different stages of eddy evolution. This discrepancy may be due to the inclusion of eddies only containing fishing positions, which resulted in a time series of eddies at evolution that was not fully continuous. Mesoscale eddies can capture about half of the total global chlorophyll [52], where, in terms of polarity, CEs exhibit higher productivity [53] and AEs exhibit lower productivity [15]. The distribution of chlorophyll within mesoscale eddies is regulated by different mechanisms, whereby the distribution of surface chlorophyll in the interior regions of eddies is controlled by eddy pumping, eddy trapping, and eddy-Ekman pumping, and the distribution of chlorophyll in the peripheral regions of eddies is controlled by eddy advection [54]. Moreover, CEs and AEs at different stages have different impacts on chlorophyll. For example, chlorophyll rings in AEs appear more frequently in the maturity stage than in the intensification stage, in contrast to what is observed in CEs [43]. Coastal areas in Peruvian waters exhibit higher productivity due to coastal upwelling. Here, the westward propagation of eddies carries highly productive coastal water into the open sea [55], resulting in a spatial distribution of Chl-a with lower concentrations in the west and higher concentrations in the east. This study founded that, across most life stages, both CEs and AEs exhibited high Chl-a on the eastern side of the eddy center, consistent with the background distribution in the Peruvian waters.

4.2. Associations between D. gigas and Environmental Factors

The impact of oceanic environmental conditions on D. gigas is multifaceted, with each environmental factor exerting its own unique influence. SST is generally regarded as a key environmental factor regulating the abundance and distribution of D. gigas [56]. For instance, Yu et al. compared the habitat suitability of D. gigas under normal SST to scenarios with an SST increase of 0.5 °C off Peru, 1.0 °C, 2.0 °C, and 4.0 °C, revealing a significant decrease in habitat suitability with increasing SST across seasons [33]. Like many cephalopods, D. gigas exhibits diel vertical migrations [57], and variations in the vertical structure of water temperature have a pronounced impact on their activity. The water temperature at depths of 0 m, 50 m, 100 m, and 150 m significantly influenced the formation of fishing grounds and suitable habitats of D. gigas [58]. Although Chl-a is not a direct resource for D. gigas, large amounts of prey aggregate in areas of high Chl-a, indirectly affecting the abundance of the species. Studies have found a positive correlation between D. gigas CPUE during spawning periods and Chl-a in Peruvian waters [59], as D. gigas requires significant food intake to store energy for growth and reproductive activities.

4.3. Relationships between Abundance and Distribution of D. gigas and Different Eddy Stages

Mesoscale eddies are complex, dynamic oceanic processes closely associated with the formation of D. gigas fishing grounds. In equatorial regions, D. gigas prefers to inhabit areas with relatively low eddy kinetic energy [32], and the upwelling induced by the eddies provides favorable temperature and nutritional conditions for their survival [38]. Off Peru, AEs tend to harbor higher abundances and more suitable habitats for D. gigas compared to CEs, as the water temperature conditions in AEs were more conducive to their survival [51]. The lifetime of mesoscale eddies has been split into different stages for study purposes [3,43], and this eddy evolution has a complex impact on local marine environments. Marine organisms also exhibit different preferences for different stages of eddies, such as loggerhead turtles in the northeast Atlantic, which prefer to inhabit the decaying inner cores of AEs [60]. The results of this study showed that, as eddies evolved, the pattern of D. gigas abundance in CEs initially increased and subsequently decreased, with the highest abundance occurring during the maturity stage of the eddy, while the abundance of D. gigas in AEs decreased gradually from generation to dissipation. This contrasts with previous research findings [61], possibly due to fewer AEs being recorded during the early (formation and intensification) eddy stages of this study, where data sampling bias may have led to abnormally high resource abundance estimates. Additionally, this study also observed a wider distribution of D. gigas in the peripheral regions of CEs, suggesting that the interaction between eddies may generate sub-mesoscale frontal structures at the edges of CEs [62], providing high-quality foraging sites for D. gigas.

4.4. Mechanisms Affecting Habitat Suitability of D. gigas during Different Stages of Eddies

The HSI model is a method used to evaluate the suitability of habitats for wild organisms, and it has been widely applied to the habitat preference and associated environmental conditions of oceanic cephalopods [63]. For instance, Wen et al. utilized SST, sea surface salinity, and Chl-a to establish an HSI model to investigate the spatiotemporal distribution changes of the habitat of D. gigas associated with climate change [64]. They found that, compared to El Niño events, La Niña events increased the suitability of a habitat for D. gigas from December to May. In this study, the HSI model based on a weighted AMM established by previous researchers [51] was used to elucidate the potential mechanisms driving the variation in D. gigas resources during eddy evolution. The results indicated that the environmental changes driven by eddy evolution create habitats of varying suitability for D. gigas, thereby indirectly affecting their distribution. In CEs, these environmental shifts shape changes in D. gigas habitat suitability consistent with changes in D. gigas abundance, showing an initial increase at eddy generation, followed by a decrease, with the highest abundance observed in the maturity stage of the eddy. Conversely, in AEs, the proportions of suitable SISST, SIT50, and SIChl-a were extremely high in the formation stage, indicating a high habitat suitability and relatively large abundance of D. gigas early on in eddy evolution. In the intensification stage the proportion of suitable SISST and SIT50 decreased significantly but the proportion of suitable SIChl-a remained high. During the maturity stage of the eddy, the habitat suitability for D. gigas increased, leading to a high D. gigas abundance. In the decay stage, habitat suitability decreased, resulting in a decline in D. gigas abundance. Furthermore, D. gigas spawn in near-surface waters, with their reproductive peak in the Peruvian waters occurring from October to December [21]. During this period, their reproductive energy primarily derives from direct feeding [65], and the development of fertilized eggs is also influenced by temperature. Therefore, we hypothesize that, as the eddy evolves, it increasingly provides optimal temperature and food conditions for the reproduction and growth of D. gigas, reaching a peak during the maturity stage of the eddy and beginning to decline in the subsequent stage. Future research should incorporate more fishery-dependent and fishery-independent data to validate this hypothesis.
To validate the above points, this study selected a long-lived eddy containing multiple fishing points for analysis. In the formation stage of eddy 284, SISST, SIT50, and SIChl-a were low, indicating low habitat suitability, and the resultant abundance of D. gigas was low. In the intensification stage, the habitat suitability increased, resulting in a higher abundance of D. gigas. In the maturity stage, SIChl-a increased and SISST, SIT50, and habitat suitability reached a maximum, resulting in the maximum abundance of D. gigas within the eddy. In the decay stage, the spatial scale of the eddy decreased where SISST and SIT50 decreased (but SIChl-a continued to increase), habitat suitability decreased, and thus, the abundance of D. gigas also decreased. Furthermore, with the evolution of mesoscale eddies, the trend of changes in the CPUE center of gravity within the eddy’s influence range was almost identical to its movement trajectory. This also confirms that the distribution and abundance of D. gigas are regulated by the evolution of mesoscale eddies.

5. Conclusions

This study utilized D. gigas fishing data from September to December 2019, combined with a dataset of mesoscale eddies and oceanic environmental parameters (including sea surface temperature, temperature at 50 m depth, and chlorophyll-a concentration), to investigate the impact of different life stages of mesoscale eddies on the abundance and distribution of D. gigas using the HSI model approach. The results indicated that the environmental changes driven by the evolution of mesoscale eddies significantly influenced the abundance and distribution of D. gigas. Mesoscale eddies also alter various marine environments other than water temperature and Chl-a. For future consideration, it is essential to incorporate more environmental parameters to establish more holistic models to further elucidate the impact of mesoscale eddies on the abundance and distribution of D. gigas.

Author Contributions

Conceptualization, X.W. and W.Y.; methodology, X.W., P.J. and Y.Z.; software, X.W., P.J. and Y.Z.; writing—original draft preparation, X.W. and W.Y.; writing—review and editing, W.Y.; funding acquisition, Y.Z. and W.Y. All authors have read and agreed to the published version of the manuscript.

Funding

This study was financially supported by the National Key R&D Program of China (2023YFD2401303), the Shanghai talent development funding (2021078), Natural Science Foundation of Shanghai (23ZR1427100), and the open fund of State Key Laboratory of Satellite Ocean Environment Dynamics, Second Institute of Oceanography (QNHX2232).

Institutional Review Board Statement

Not applicable.

Informed Consent Statement

Not applicable.

Data Availability Statement

Data will be made available upon request from the corresponding author.

Conflicts of Interest

The authors declare that they have no known competing financial interests or personal relationships that could have appeared to influence the work reported in this paper.

References

  1. Chelton, D.B.; Schlax, M.G.; Samelson, R.M.; De Szoeke, R.A. Global Observations of Large Oceanic Eddies. Geophys. Res. Lett. 2007, 34, 2007GL030812. [Google Scholar] [CrossRef]
  2. Gaube, P.; McGillicuddy, D.J.; Chelton, D.B.; Behrenfeld, M.J.; Strutton, P.G. Regional Variations in the Influence of Mesoscale Eddies on Near-surface Chlorophyll. JGR Ocean. 2014, 119, 8195–8220. [Google Scholar] [CrossRef]
  3. Liu, Y.; Dong, C.; Guan, Y.; Chen, D.; McWilliams, J.; Nencioli, F. Eddy Analysis in the Subtropical Zonal Band of the North Pacific Ocean. Deep Sea Res. Part I Oceanogr. Res. Pap. 2012, 68, 54–67. [Google Scholar] [CrossRef]
  4. Bakun, A. Fronts and Eddies as Key Structures in the Habitat of Marine Fish Larvae: Opportunity, Adaptive Response and Competitive Advantage. Sci. Mar. 2006, 70, 105–122. [Google Scholar] [CrossRef]
  5. Garabato, A.C.N.; Yu, X.; Callies, J.; Barkan, R.; Polzin, K.L.; Frajka-Williams, E.E.; Buckingham, C.E.; Griffies, S.M. Kinetic Energy Transfers between Mesoscale and Submesoscale Motions in the Open Ocean’s Upper Layers. J. Phys. Oceanogr. 2022, 52, 75–97. [Google Scholar] [CrossRef]
  6. Lv, M.; Wang, F.; Li, Y.; Zhang, Z.; Zhu, Y. Structure of Sea Surface Temperature Anomaly Induced by Mesoscale Eddies in the North Pacific Ocean. JGR Ocean. 2022, 127, e2021JC017581. [Google Scholar] [CrossRef]
  7. Nukapothula, S.; Chen, C.; Yunus, A.P.; Wu, J. Satellite-Based Observations of Intense Chlorophyll-a Bloom in Response of Cold Core Eddy Formation: A Study in the Arabian Sea, Southwest Coast of India. Reg. Stud. Mar. Sci. 2018, 24, 303–310. [Google Scholar] [CrossRef]
  8. Martínez-Moreno, J.; Hogg, A.M.; England, M.H.; Constantinou, N.C.; Kiss, A.E.; Morrison, A.K. Global Changes in Oceanic Mesoscale Currents over the Satellite Altimetry Record. Nat. Clim. Change 2021, 11, 397–403. [Google Scholar] [CrossRef]
  9. Domokos, R.; Seki, M.P.; Polovina, J.J.; Hawn, D.R. Oceanographic Investigation of the American Samoa Albacore (Thunnus alalunga) Habitat and Longline Fishing Grounds. Fish. Oceanogr. 2007, 16, 555–572. [Google Scholar] [CrossRef]
  10. Xing, Q.; Yu, H.; Wang, H.; Ito, S.; Chai, F. Mesoscale Eddies Modulate the Dynamics of Human Fishing Activities in the Global Midlatitude Ocean. Fish Fish. 2023, 24, 527–543. [Google Scholar] [CrossRef]
  11. Lindo-Atichati, D.; Bringas, F.; Goni, G.; Muhling, B.; Muller-Karger, F.; Habtes, S. Varying Mesoscale Structures Influence Larval Fish Distribution in the Northern Gulf of Mexico. Mar. Ecol. Prog. Ser. 2012, 463, 245–257. [Google Scholar] [CrossRef]
  12. Durán Gómez, G.S.; Nagai, T.; Yokawa, K. Mesoscale Warm-Core Eddies Drive Interannual Modulations of Swordfish Catch in the Kuroshio Extension System. Front. Mar. Sci. 2020, 7, 680. [Google Scholar] [CrossRef]
  13. Arur, A.; Krishnan, P.; Kiruba-Sankar, R.; Suryavanshi, A.; Lohith Kumar, K.; Kantharajan, G.; Choudhury, S.B.; Manjulatha, C.; Babu, D.E. Feasibility of Targeted Fishing in Mesoscale Oceanic Eddies: A Study from Commercial Fishing Grounds of Andaman and Nicobar Islands, India. Int. J. Remote Sens. 2020, 41, 5011–5045. [Google Scholar] [CrossRef]
  14. Arur, A.; Krishnan, P.; George, G.; Goutham Bharathi, M.P.; Kaliyamoorthy, M.; Hareef Baba Shaeb, K.; Suryavanshi, A.S.; Kumar, T.S.; Joshi, A.K. The Influence of Mesoscale Eddies on a Commercial Fishery in the Coastal Waters of the Andaman and Nicobar Islands, India. Int. J. Remote Sens. 2014, 35, 6418–6443. [Google Scholar] [CrossRef]
  15. McGillicuddy, D.J. Mechanisms of Physical-Biological-Biogeochemical Interaction at the Oceanic Mesoscale. Annu. Rev. Mar. Sci. 2016, 8, 125–159. [Google Scholar] [CrossRef]
  16. Arostegui, M.C.; Gaube, P.; Woodworth-Jefcoats, P.A.; Kobayashi, D.R.; Braun, C.D. Anticyclonic Eddies Aggregate Pelagic Predators in a Subtropical Gyre. Nature 2022, 609, 535–540. [Google Scholar] [CrossRef]
  17. Braun, C.D.; Gaube, P.; Sinclair-Taylor, T.H.; Skomal, G.B.; Thorrold, S.R. Mesoscale Eddies Release Pelagic Sharks from Thermal Constraints to Foraging in the Ocean Twilight Zone. Proc. Natl. Acad. Sci. USA 2019, 116, 17187–17192. [Google Scholar] [CrossRef]
  18. Argüelles, J.; Rodhouse, P.G.; Villegas, P.; Castillo, G. Age, Growth and Population Structure of the Jumbo Flying Squid Dosidicus gigas in Peruvian Waters. Fish. Res. 2001, 54, 51–61. [Google Scholar] [CrossRef]
  19. Markaida, U.; Quiñónez-Velázquez, C.; Sosa-Nishizaki, O. Age, Growth and Maturation of Jumbo Squid Dosidicus gigas (Cephalopoda: Ommastrephidae) from the Gulf of California, Mexico. Fish. Res. 2004, 66, 31–47. [Google Scholar] [CrossRef]
  20. Stewart, J.; Hazen, E.; Foley, D.; Bograd, S.; Gilly, W. Marine Predator Migration during Range Expansion: Humboldt Squid Dosidicus gigas in the Northern California Current System. Mar. Ecol. Prog. Ser. 2012, 471, 135–150. [Google Scholar] [CrossRef]
  21. Nigmatullin, C. A Review of the Biology of the Jumbo Squid Dosidicus gigas (Cephalopoda: Ommastrephidae). Fish. Res. 2001, 54, 9–19. [Google Scholar] [CrossRef]
  22. Markaida, U. Food and Feeding of Jumbo Squid Dosidicus gigas in the Gulf of California and Adjacent Waters after the 1997–98 El Niño Event. Fish. Res. 2006, 79, 16–27. [Google Scholar] [CrossRef]
  23. Gonzalez-Pestana, A.; Alfaro-Shigueto, J.; Mangel, J.C. A Review of High Trophic Predator-Prey Relationships in the Pelagic Northern Humboldt System, with a Focus on Anchovetas. Fish. Res. 2022, 253, 106386. [Google Scholar] [CrossRef]
  24. Preti, A.; Soykan, C.U.; Dewar, H.; Wells, R.J.D.; Spear, N.; Kohin, S. Comparative Feeding Ecology of Shortfin Mako, Blue and Thresher Sharks in the California Current. Environ. Biol. Fish 2012, 95, 127–146. [Google Scholar] [CrossRef]
  25. Liu, B.; Chen, X.; Qian, W.; Jin, Y.; Li, J. δ13C and δ15N in Humboldt Squid Beaks: Understanding Potential Geographic Population Connectivity and Movement. Acta Oceanol. Sin. 2019, 38, 53–59. [Google Scholar] [CrossRef]
  26. Arkhipkin, A.I.; Rodhouse, P.G.K.; Pierce, G.J.; Sauer, W.; Sakai, M.; Allcock, L.; Arguelles, J.; Bower, J.R.; Castillo, G.; Ceriola, L.; et al. World Squid Fisheries. Rev. Fish. Sci. Aquac. 2015, 23, 92–252. [Google Scholar] [CrossRef]
  27. Liu, B.; Chen, X.; Chen, Y.; Tian, S.; Li, J.; Fang, Z.; Yang, M. Age, Maturation, and Population Structure of the Humboldt Squid Dosidicus gigas off the Peruvian Exclusive Economic Zones. Chin. J. Ocean. Limnol. 2013, 31, 81–91. [Google Scholar] [CrossRef]
  28. Rosas-Luis, R.; Tafur-Jimenez, R.; Alegre-Norza, A.R.; Castillo-Valderrama, P.R.; Cornejo-Urbina, R.M.; Salinas-Zavala, C.A.; Sánchez, P. Trophic Relationships between the Jumbo Squid (Dosidicus gigas) and the Lightfish (Vinciguerria lucetia) in the Humboldt Current System off Peru. Sci. Mar. 2011, 75, 549–557. [Google Scholar] [CrossRef]
  29. Pizarro, O.; Shaffer, G.; Dewitte, B.; Ramos, M. Dynamics of Seasonal and Interannual Variability of the Peru-Chile Undercurrent. Geophys. Res. Lett. 2002, 29, 22-1–22-4. [Google Scholar] [CrossRef]
  30. Chaigneau, A.; Le Texier, M.; Eldin, G.; Grados, C.; Pizarro, O. Vertical Structure of Mesoscale Eddies in the Eastern South Pacific Ocean: A Composite Analysis from Altimetry and Argo Profiling Floats. J. Geophys. Res. 2011, 116. [Google Scholar] [CrossRef]
  31. Chaigneau, A.; Gizolme, A.; Grados, C. Mesoscale Eddies off Peru in Altimeter Records: Identification Algorithms and Eddy Spatio-Temporal Patterns. Prog. Oceanogr. 2008, 79, 106–119. [Google Scholar] [CrossRef]
  32. Fang, X.; Zhang, Y.; Yu, W.; Chen, X. Geographical Distribution Variations of Humboldt Squid Habitat in the Eastern Pacific Ocean. Ecosyst. Health Sustain. 2023, 9, 0010. [Google Scholar] [CrossRef]
  33. Yu, W.; Chen, X. Ocean Warming-Induced Range-Shifting of Potential Habitat for Jumbo Flying Squid Dosidicus gigas in the Southeast Pacific Ocean off Peru. Fish. Res. 2018, 204, 137–146. [Google Scholar] [CrossRef]
  34. Ichii, T.; Mahapatra, K.; Watanabe, T.; Yatsu, A.; Inagake, D.; Okada, Y. Occurrence of Jumbo Flying Squid Dosidicus gigas Aggregations Associated with the Countercurrent Ridge off the Costa Rica Dome during 1997 El Niño and 1999 La Niña. Mar. Ecol. Prog. Ser. 2002, 231, 151–166. [Google Scholar] [CrossRef]
  35. Yu, W.; Yi, Q.; Chen, X.; Chen, Y. Climate-Driven Latitudinal Shift in Fishing Ground of Jumbo Flying Squid (Dosidicus gigas) in the Southeast Pacific Ocean off Peru. Int. J. Remote Sens. 2017, 38, 3531–3550. [Google Scholar] [CrossRef]
  36. Stewart, J.S.; Hazen, E.L.; Bograd, S.J.; Byrnes, J.E.K.; Foley, D.G.; Gilly, W.F.; Robison, B.H.; Field, J.C. Combined Climate- and Prey-Mediated Range Expansion of Humboldt Squid (Dosidicus gigas), a Large Marine Predator in the California Current System. Glob. Change Biol. 2014, 20, 1832–1843. [Google Scholar] [CrossRef] [PubMed]
  37. Staaf, D.; Zeidberg, L.; Gilly, W. Effects of Temperature on Embryonic Development of the Humboldt Squid Dosidicus gigas. Mar. Ecol. Prog. Ser. 2011, 441, 165–175. [Google Scholar] [CrossRef]
  38. Fang, X.; Yu, W.; Chen, X.; Zhang, Y. Response of Abundance and Distribution of Humboldt Squid (Dosidicus gigas) to Short-Lived Eddies in the Eastern Equatorial Pacific Ocean from April to June 2017. Front. Mar. Sci. 2021, 8, 721291. [Google Scholar] [CrossRef]
  39. Le Vu, B.; Stegner, A.; Arsouze, T. Angular Momentum Eddy Detection and Tracking Algorithm (AMEDA) and Its Application to Coastal Eddy Formation. J. Atmos. Ocean. Technol. 2018, 35, 739–762. [Google Scholar] [CrossRef]
  40. Aroucha, L.C.; Veleda, D.; Lopes, F.S.; Tyaquiçã, P.; Lefèvre, N.; Araujo, M. Intra- and Inter-Annual Variability of North Brazil Current Rings Using Angular Momentum Eddy Detection and Tracking Algorithm: Observations from 1993 to 2016. JGR Ocean. 2020, 125, e2019JC015921. [Google Scholar] [CrossRef]
  41. Garreau, P.; Dumas, F.; Louazel, S.; Stegner, A.; Le Vu, B. High-Resolution Observations and Tracking of a Dual-Core Anticyclonic Eddy in the Algerian Basin. JGR Ocean. 2018, 123, 9320–9339. [Google Scholar] [CrossRef]
  42. Zhang, Y.; Yu, W.; Chen, X.; Zhou, M.; Zhang, C. Evaluating the Impacts of Mesoscale Eddies on Abundance and Distribution of Neon Flying Squid in the Northwest Pacific Ocean. Front. Mar. Sci. 2022, 9, 862273. [Google Scholar] [CrossRef]
  43. Xu, G.; Dong, C.; Liu, Y.; Gaube, P.; Yang, J. Chlorophyll Rings around Ocean Eddies in the North Pacific. Sci. Rep. 2019, 9, 2056. [Google Scholar] [CrossRef] [PubMed]
  44. Gaube, P.; Barceló, C.; McGillicuddy, D.J.; Domingo, A.; Miller, P.; Giffoni, B.; Marcovaldi, N.; Swimmer, Y. The Use of Mesoscale Eddies by Juvenile Loggerhead Sea Turtles (Caretta caretta) in the Southwestern Atlantic. PLoS ONE 2017, 12, e0172839. [Google Scholar] [CrossRef] [PubMed]
  45. Zhou, K.; Benitez-Nelson, C.R.; Huang, J.; Xiu, P.; Sun, Z.; Dai, M. Cyclonic Eddies Modulate Temporal and Spatial Decoupling of Particulate Carbon, Nitrogen, and Biogenic Silica Export in the North Pacific Subtropical Gyre. Limnol. Oceanogr. 2021, 66, 3508–3522. [Google Scholar] [CrossRef]
  46. Han, H.; Yang, C.; Zhang, H.; Fang, Z.; Jiang, B.; Su, B.; Sui, J.; Yan, Y.; Xiang, D. Environment Variables Affect CPUE and Spatial Distribution of Fishing Grounds on the Light Falling Gear Fishery in the Northwest Indian Ocean at Different Time Scales. Front. Mar. Sci. 2022, 9, 939334. [Google Scholar] [CrossRef]
  47. Li, Z.; Ye, Z.; Wan, R.; Zhang, C. Model Selection between Traditional and Popular Methods for Standardizing Catch Rates of Target Species: A Case Study of Japanese Spanish Mackerel in the Gillnet Fishery. Fish. Res. 2015, 161, 312–319. [Google Scholar] [CrossRef]
  48. Rodriguez-Galiano, V.; Sanchez-Castillo, M.; Chica-Olmo, M.; Chica-Rivas, M. Machine Learning Predictive Models for Mineral Prospectivity: An Evaluation of Neural Networks, Random Forest, Regression Trees and Support Vector Machines. Ore Geol. Rev. 2015, 71, 804–818. [Google Scholar] [CrossRef]
  49. Hsu, C.-C.; Lee, Y.-C.; Lu, P.-E.; Lu, S.-S.; Lai, H.-T.; Huang, C.-C.; Wang, C.; Lin, Y.-J.; Su, W.-T. Social Media Prediction Based on Residual Learning and Random Forest. In Proceedings of the 25th ACM international Conference on Multimedia, Mountain View, CA, USA, 23 October 2017; ACM: New York, NY, USA, 2017; pp. 1865–1870. [Google Scholar]
  50. Díaz-Uriarte, R.; Alvarez De Andrés, S. Gene Selection and Classification of Microarray Data Using Random Forest. BMC Bioinform. 2006, 7, 3. [Google Scholar] [CrossRef]
  51. Jin, P.; Zhang, Y.; Du, Y.; Chen, X.; Kindong, R.; Xue, H.; Chai, F.; Yu, W. Eddy Impacts on Abundance and Habitat Distribution of a Large Predatory Squid off Peru. Mar. Environ. Res. 2024, 195, 106368. [Google Scholar] [CrossRef]
  52. Zhao, D.; Xu, Y.; Zhang, X.; Huang, C. Global Chlorophyll Distribution Induced by Mesoscale Eddies. Remote Sens. Environ. 2021, 254, 112245. [Google Scholar] [CrossRef]
  53. Falkowski, P.G.; Ziemann, D.; Kolber, Z.; Bienfang, P.K. Role of Eddy Pumping in Enhancing Primary Production in the Ocean. Nature 1991, 352, 55–58. [Google Scholar] [CrossRef]
  54. Wang, Y.; Zhang, H.-R.; Chai, F.; Yuan, Y. Impact of Mesoscale Eddies on Chlorophyll Variability off the Coast of Chile. PLoS ONE 2018, 13, e0203598. [Google Scholar] [CrossRef] [PubMed]
  55. Cprrea-Ramirez, M.A.; Hormazábal, S.; Yuras, G. Mesoscale Eddies and High Chlorophyll Concentrations off Central Chile (29°–39°S). Geophys. Res. Lett. 2007, 34, 2007GL029541. [Google Scholar] [CrossRef]
  56. Paulino, C.; Segura, M.; Chacón, G. Spatial Variability of Jumbo Flying Squid (Dosidicus gigas) Fishery Related to Remotely Sensed SST and Chlorophyll-a Concentration (2004–2012). Fish. Res. 2016, 173, 122–127. [Google Scholar] [CrossRef]
  57. Sakai, M.; Tsuchiya, K.; Mariategui, L.; Wakabayashi, T.; Yamashiro, C. Vertical Migratory Behavior of Jumbo Flying Squid (Dosidicus gigas) off Peru: Records of Acoustic and Pop-up Tags. JARQ 2017, 51, 171–179. [Google Scholar] [CrossRef]
  58. Yu, W.; Jin, P.; Zhu, G. Decadal variations in habitat suitability of jumbo flying squid Dosidicus gigas off Peru during spring and summer based on vertical water temperature. J. Fish. Sci. China 2023, 30, 1374–1386. [Google Scholar]
  59. Robinson, C.J.; Gómez-Gutiérrez, J.; De León, D.A.S. Jumbo Squid (Dosidicus gigas) Landings in the Gulf of California Related to Remotely Sensed SST and Concentrations of Chlorophyll a (1998–2012). Fish. Res. 2013, 137, 97–103. [Google Scholar] [CrossRef]
  60. Chambault, P.; Baudena, A.; Bjorndal, K.A.; Santos, M.A.R.; Bolten, A.B.; Vandeperre, F. Swirling in the Ocean: Immature Loggerhead Turtles Seasonally Target Old Anticyclonic Eddies at the Fringe of the North Atlantic Gyre. Prog. Oceanogr. 2019, 175, 345–358. [Google Scholar] [CrossRef]
  61. Wu, X.; Jin, P.; Zhang, Y.; Yu, W. Changing Humboldt Squid Abundance and Distribution at Different Stages of Oceanic Mesoscale Eddies. JMSE 2024, 12, 626. [Google Scholar] [CrossRef]
  62. Lima, I.D.; Olson, D.B.; Doney, S.C. Biological Response to Frontal Dynamics and Mesoscale Variability in Oligotrophic Environments: Biological Production and Community Structure. J. Geophys. Res. 2002, 107, 25-1–25-21. [Google Scholar] [CrossRef]
  63. Tian, S.; Chen, X.; Chen, Y.; Xu, L.; Dai, X. Evaluating Habitat Suitability Indices Derived from CPUE and Fishing Effort Data for Ommatrephes bratramii in the Northwestern Pacific Ocean. Fish. Res. 2009, 95, 181–188. [Google Scholar] [CrossRef]
  64. Wen, J.; Zhou, Z.; Zhang, Y.; Yu, W.; Chen, B.; Chen, X. Climate-Related Habitat Variations of Humboldt Squid in the Eastern Equatorial Pacific Ocean. J. Mar. Syst. 2024, 243, 103960. [Google Scholar] [CrossRef]
  65. Chen, X.; Han, F.; Zhu, K.; Punt, A.E.; Lin, D. The Breeding Strategy of Female Jumbo Squid Dosidicus gigas: Energy Acquisition and Allocation. Sci. Rep. 2020, 10, 9639. [Google Scholar] [CrossRef]
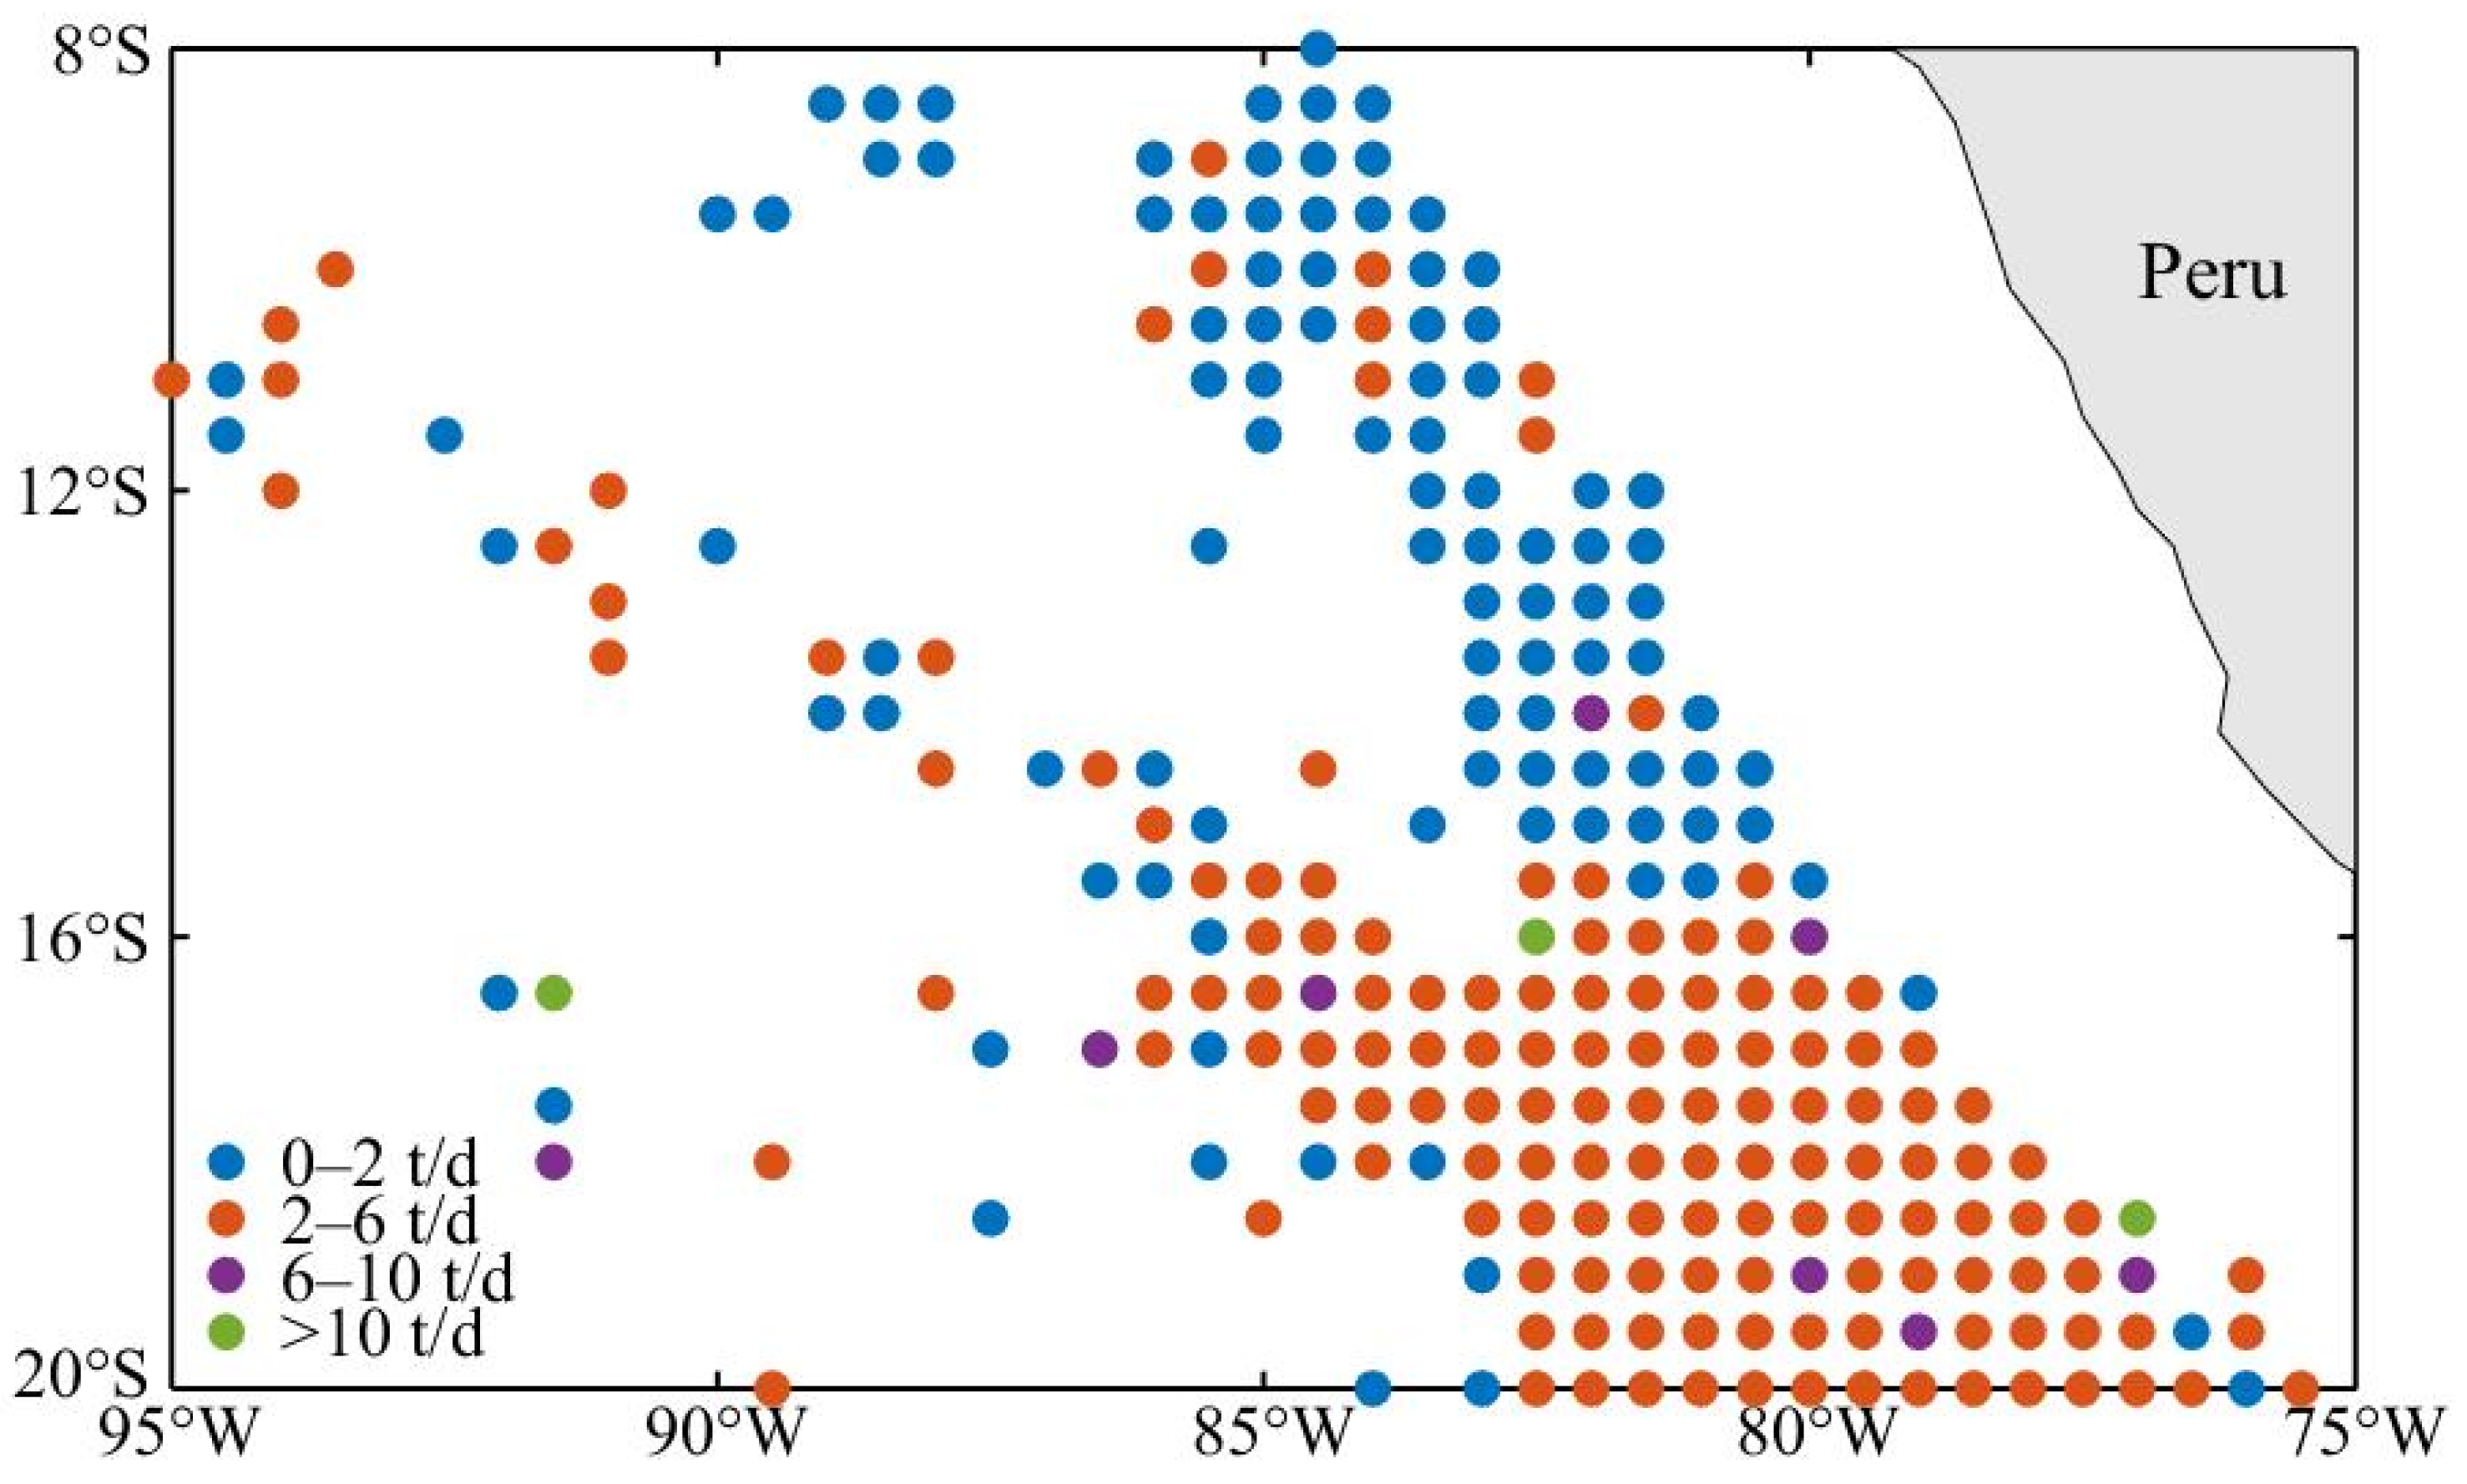
Figure 1. Spatial distribution of CPUE of D. gigas in each fishing area (0.5° × 0.5°) from September to December 2019.
Jmse 12 01015 g001
Figure 2. Mesoscale eddies and their tracks, tracked on 1 September 2019.
Jmse 12 01015 g002
Figure 3. Normalized radial distance grid based on eddy radius. (x1 denotes the longitude of the eddy center, and y1 denotes the latitude of the eddy center).
Jmse 12 01015 g003
Figure 4. (A) Spatial distribution of CPUE of D. gigas in different stages of the eddies (the solid lines are used to distinguish the interior and peripheral regions of the eddies, and the arrows indicate the direction of rotation of the eddies); (B) Variation of CPUE of D. gigas under different stages of the eddies.
Jmse 12 01015 g004
Figure 5. Changes in the centers of the eddy and centers of gravity of D. gigas CPUE at different stages of the eddies.
Jmse 12 01015 g005
Figure 6. Spatial distribution of SST, T50, and Chl-a mean states within different stages of the eddies (solid lines are used to distinguish the interior and peripheral regions of the eddies, and arrows indicate the direction of rotation of the eddies).
Jmse 12 01015 g006
Figure 7. Spatial distribution of SISST, SIT50, and SIChl-a mean states within different stages of the eddies (solid lines are used to distinguish the interior and peripheral regions of the eddies, and arrows indicate the direction of rotation of the eddies).
Jmse 12 01015 g007
Figure 8. (A) Spatial distribution of HSI mean states within different stages of the eddies (solid lines are used to distinguish the interior and peripheral regions of the eddies, and arrows indicate the direction of rotation of the eddies); (B) Percentage of suitable SISST, SIT50, SIChl-a, and HSI over different stages of the eddies.
Jmse 12 01015 g008
Figure 9. Spatial distribution of SST, T50, and Chl-a and corresponding SI-valued mean states over different stages of eddy 284.
Jmse 12 01015 g009
Figure 10. Spatial distribution of HSI mean states and CPUE of D. gigas over different stages of eddy 284.
Jmse 12 01015 g010
Disclaimer/Publisher’s Note: The statements, opinions and data contained in all publications are solely those of the individual author(s) and contributor(s) and not of MDPI and/or the editor(s). MDPI and/or the editor(s) disclaim responsibility for any injury to people or property resulting from any ideas, methods, instructions or products referred to in the content.