1. Introduction
Since the formulation of the Shields curve by Shields [
1], a large number of studies have investigated the entrainment thresholds of sediment particles in flume experiments [
2,
3,
4]. Changes in beach profiles under various hydrodynamic conditions have been extensively studied [
5,
6,
7]. For coral sandy shores, shells are an important component, providing shelter for organisms such as hermit crabs, and some of the shells in a stable state may also provide attachment surfaces for coral larvae. Shells are numerous and vary in size. The shape of a beach or bank profile can therefore be determined by the transport properties of shells in the water [
8], while shells can also protect the shoreline from excessive erosion [
9,
10]. Dey [
8] mentions that the left and right shells of living bivalves are basically in a mirror image relationship, joined by a tip known as the umbo, and then separated when the shells die, through the action of water currents. The bivalve shells and gastropod shells selected in this paper are more common and widely distributed in large numbers, and are distributed in both tropical and subtropical regions, which can be divided into shell species specific to coral sandy coasts or shell species specific (fishery by-products) to non-coral sandy coasts of two categories. Moreover, factors such as ocean acidification [
11], which is indirectly caused by rising CO
2 levels, and overfishing of shells have led to a decline in shellfish, interfering with the natural process of beach erosion and protection. Kumagai et al. [
12] mentioned that shells have been considered for activities such as beach protection and creation of tidal flats/shallow bottoms. Adding scallop shells (a fisheries by-product) to the sandy and rocky seabed at specific locations had increased richness and diversity of the local species [
13]. The direction of water flow can be obtained by observing the orientation of the top of the shell on the horizontal sand bed, and the convex upward and convex downward positions of the shell can indicate changes in the flow pattern [
14]. Therefore, linking the mode of movement of the shells with the movement threshold of the shells, which helps to establish the depositional pattern of the shells, provides an important reference for the subsequent conservation of coral sandy shores.
The locomotor properties of univalves, bivalves and gastropod shells are inextricably linked to beach changes. Under the action of water flow, convex downward, umbo upstream, and convex upward, umbo downstream conditions were taken as the incipient motion directions of the experimental bivalve shells, and a mathematical model for calculating the critical shear stress was obtained by measuring the incipient motion flow velocity of the bivalve shells [
8,
15]. At the same time, Dey [
16] used the measured threshold flow velocity data from shell motion to fit the equation. A strain gauge was used to experimentally measure the drag and lift of some shells and to infer the lift and drag coefficients for each type of shell, and then the model proposed by Dey [
8] was optimized and refined [
17]. Some studies have looked at factors involving shell shape and other factors to illustrate the effect these have on the movement threshold flow velocities [
14,
18]. In addition to those, Menard et al. [
19] measured the incipient motion flow velocity of cylindrical brachiopod shells and pebbles of the same size by flume experiments, and finally obtained that the incipient motion flow velocity required for cylindrical brachiopod shells was only one-tenth of that required for pebbles. Mollusk shells are inevitably fragmented by oceanic transport after death, and some scholars have attempted to link shell fragment settling velocities and motion initiation thresholds, providing important insights into the study of shell fragments [
20,
21,
22]. Due to the oblate nature of shell fragments, the effect of oblateness on the increase in the wave and current resistance was investigated by varying the oblate shape [
12]. These shell depositional studies can provide appropriate comparisons and references for future movements of shells with these different hydrodynamic characteristics.
In addition to investigating the motion characteristics of shells in currents, some research focused on the process of wave variability in shallow waters, with physical simulations of coastal environments carried out in the laboratory, three shell concentration dynamics were observed: reworking, winnowing, and dynamic bypassing, demonstrating the specific dynamics through which each wave controlled the shell concentrations during the transformation process [
23]. Fick et al. [
24] first investigated the motion thresholds of non-fragmented mollusk shells in oscillatory flow and determined that bivalve shells have higher motion thresholds than gastropod shells.
Numerous researchers in the study of intact shells have also expressed significant interest in issues concerning shell orientations during motion. For example, Brenchley et al. [
25] looked at the final orientations of shells in medium sand and mud and concluded that most shells take up a preferred final orientation of longest axes across the current. Because of the effect of shell shape, the direction of shell orientation summarized in different studies may vary. Shell orientation experiments carried out by Nagle [
26] under conditions with a current and wave action showed that more than two-thirds of the elongated conical or plate-shaped shells were oriented with or away from the orientation of the current, in shoaling, non-swash waves, the longest axes of the same form were aligned parallel to the crest or wave scar. Futterer [
27] observed stable orientations of two gastropod shells in flume experiments. At the same time, Futterer [
28] found that the occurrence of a second stable orientation of the shell involved higher current velocities. In addition to the orientation studies on shells, Kelling et al. [
29] compared the orientation of pebble clusters with two types of shells and found that the mean angular response of the reoriented pebbles and shells were related to the flow velocities. Therefore, the connection between the different final stable orientations and the incipient mean flow velocities under unidirectional flow, was examined in this study.
For irregular shell deposits, many of the theories from past studies may not be applicable, involving density, surface roughness, flattening, and having different final orientation directions under current. In this study, a two-part flume experiment was conducted using different species of shells placed on a bed of coral sand particles of an appropriate size, coral sand particles were used to simulate the surface roughness of the sand bed. In the first part, orientational motion experiments on selected sample shells were conducted, and the final orientational directions with the highest number of occurrences in repeated directional motion experiments were used as the initial orientations in the second part. In the second part, measurements of the flow velocities of the incipient motions for these shells were performed. The fitted shell motion threshold flow velocities equations differ from previous studies in that the present study takes into account the shell thickness, the basal projected area of the shell, and the frontal projected area of the shell in the direction of the water flow to obtain motion threshold flow velocities equations that are more applicable to various species of shells with different final orientation directions.
2. Experimental Setup and Shape Parameters of Shells
2.1. Experimental Setup
The experiments were conducted in a flume at Changsha University of Science and Technology, measuring 50.0 m in length, 0.5 m in width, and 0.8 m in height. The two sides of the flume were composed of toughened glass, which was convenient for observing the incipient motion of the shells. The experimental area was located in the middle section of the flume, the coral sand particles of an appropriate size was selected to be laid in the sand box at the bottom of the flume in order to simulate the roughness of the sand bed, with the surface of the sand bed and the bottom of the flume in the same horizontal plane. Before the shells start the initial motion on the sand bed, in order to ensure that the bed surface of coral sand in the experimental section does not produce deformation, after a number of experiments and comparisons, the median sieve diameter of the coral sand was finally selected to be 3.600 mm, and the required sand box dimensions were a length of 0.5 m, width of 0.38 m, and depth of 0.02 m. The measurement setup to threshold flow velocity is shown in
Figure 1, where the acoustic doppler velocimetry (ADV) was used to measure the velocity profile of the shell as it began to move. The resolution of this acoustic doppler velocimetry (ADV) was up to 1 mm, and the sampling frequency could reach a maximum of 100 Hz, which was able to measure the flow velocity of the profile within a range of 30 mm. This experiment was carried out with a sampling frequency of 25 Hz for the acquisition of flow velocity, and the quality of the currently acquired data can be judged according to the correlation (COR) and signal to noise ratio (SNR) during the acquisition process, in which the COR is not less than 80% and the SNR is not less than 20 dB. The saved data were outputted as a MATLAB format file, and the low-pass filtering method was utilized for the processing of the saved data. In order to better observe the shell motion process, a 150 W tri-color soft-light lamp was placed on the side of the flume to illuminate the experimental section. In the experiment observing the orientational motion of the shell, the ADV in
Figure 1a was replaced by a camera, which was used to record the shell motion process. The camera device used in this experiment was an iPhone 13 with iOS version 17.1.2, which has a resolution of 1920 × 1080 pixels, and the raw images were recorded at 30 frames per second.
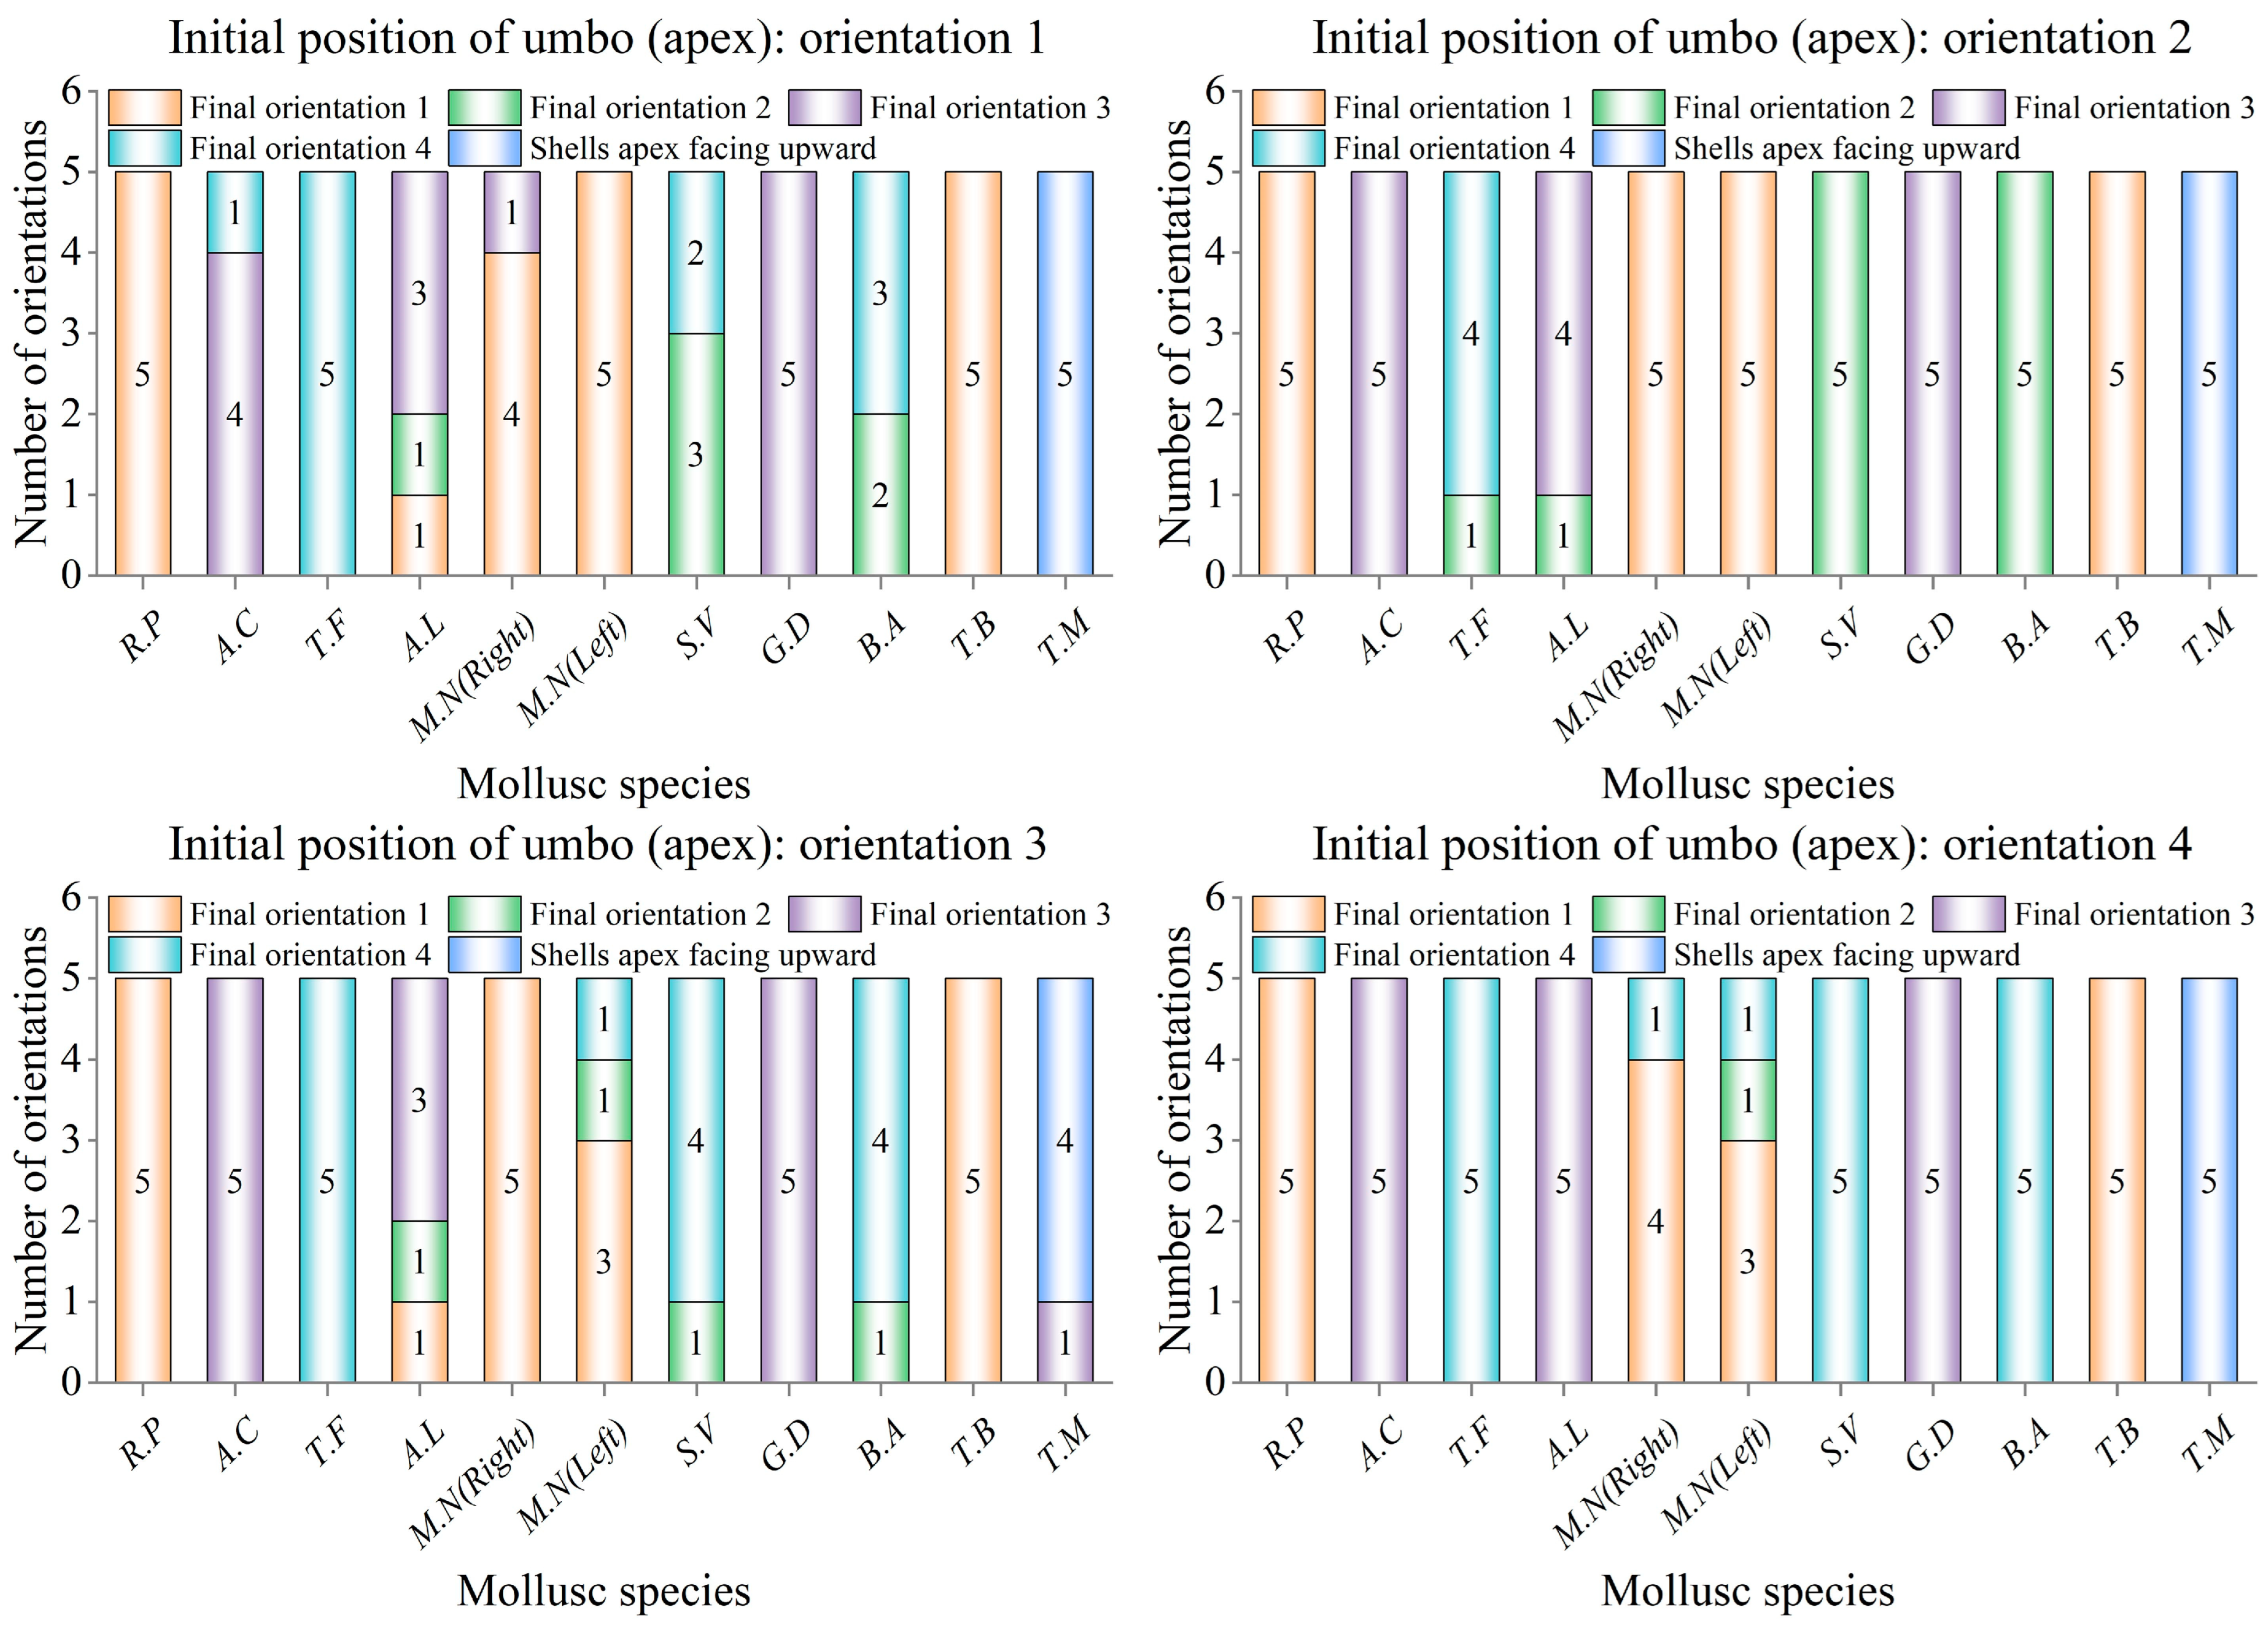
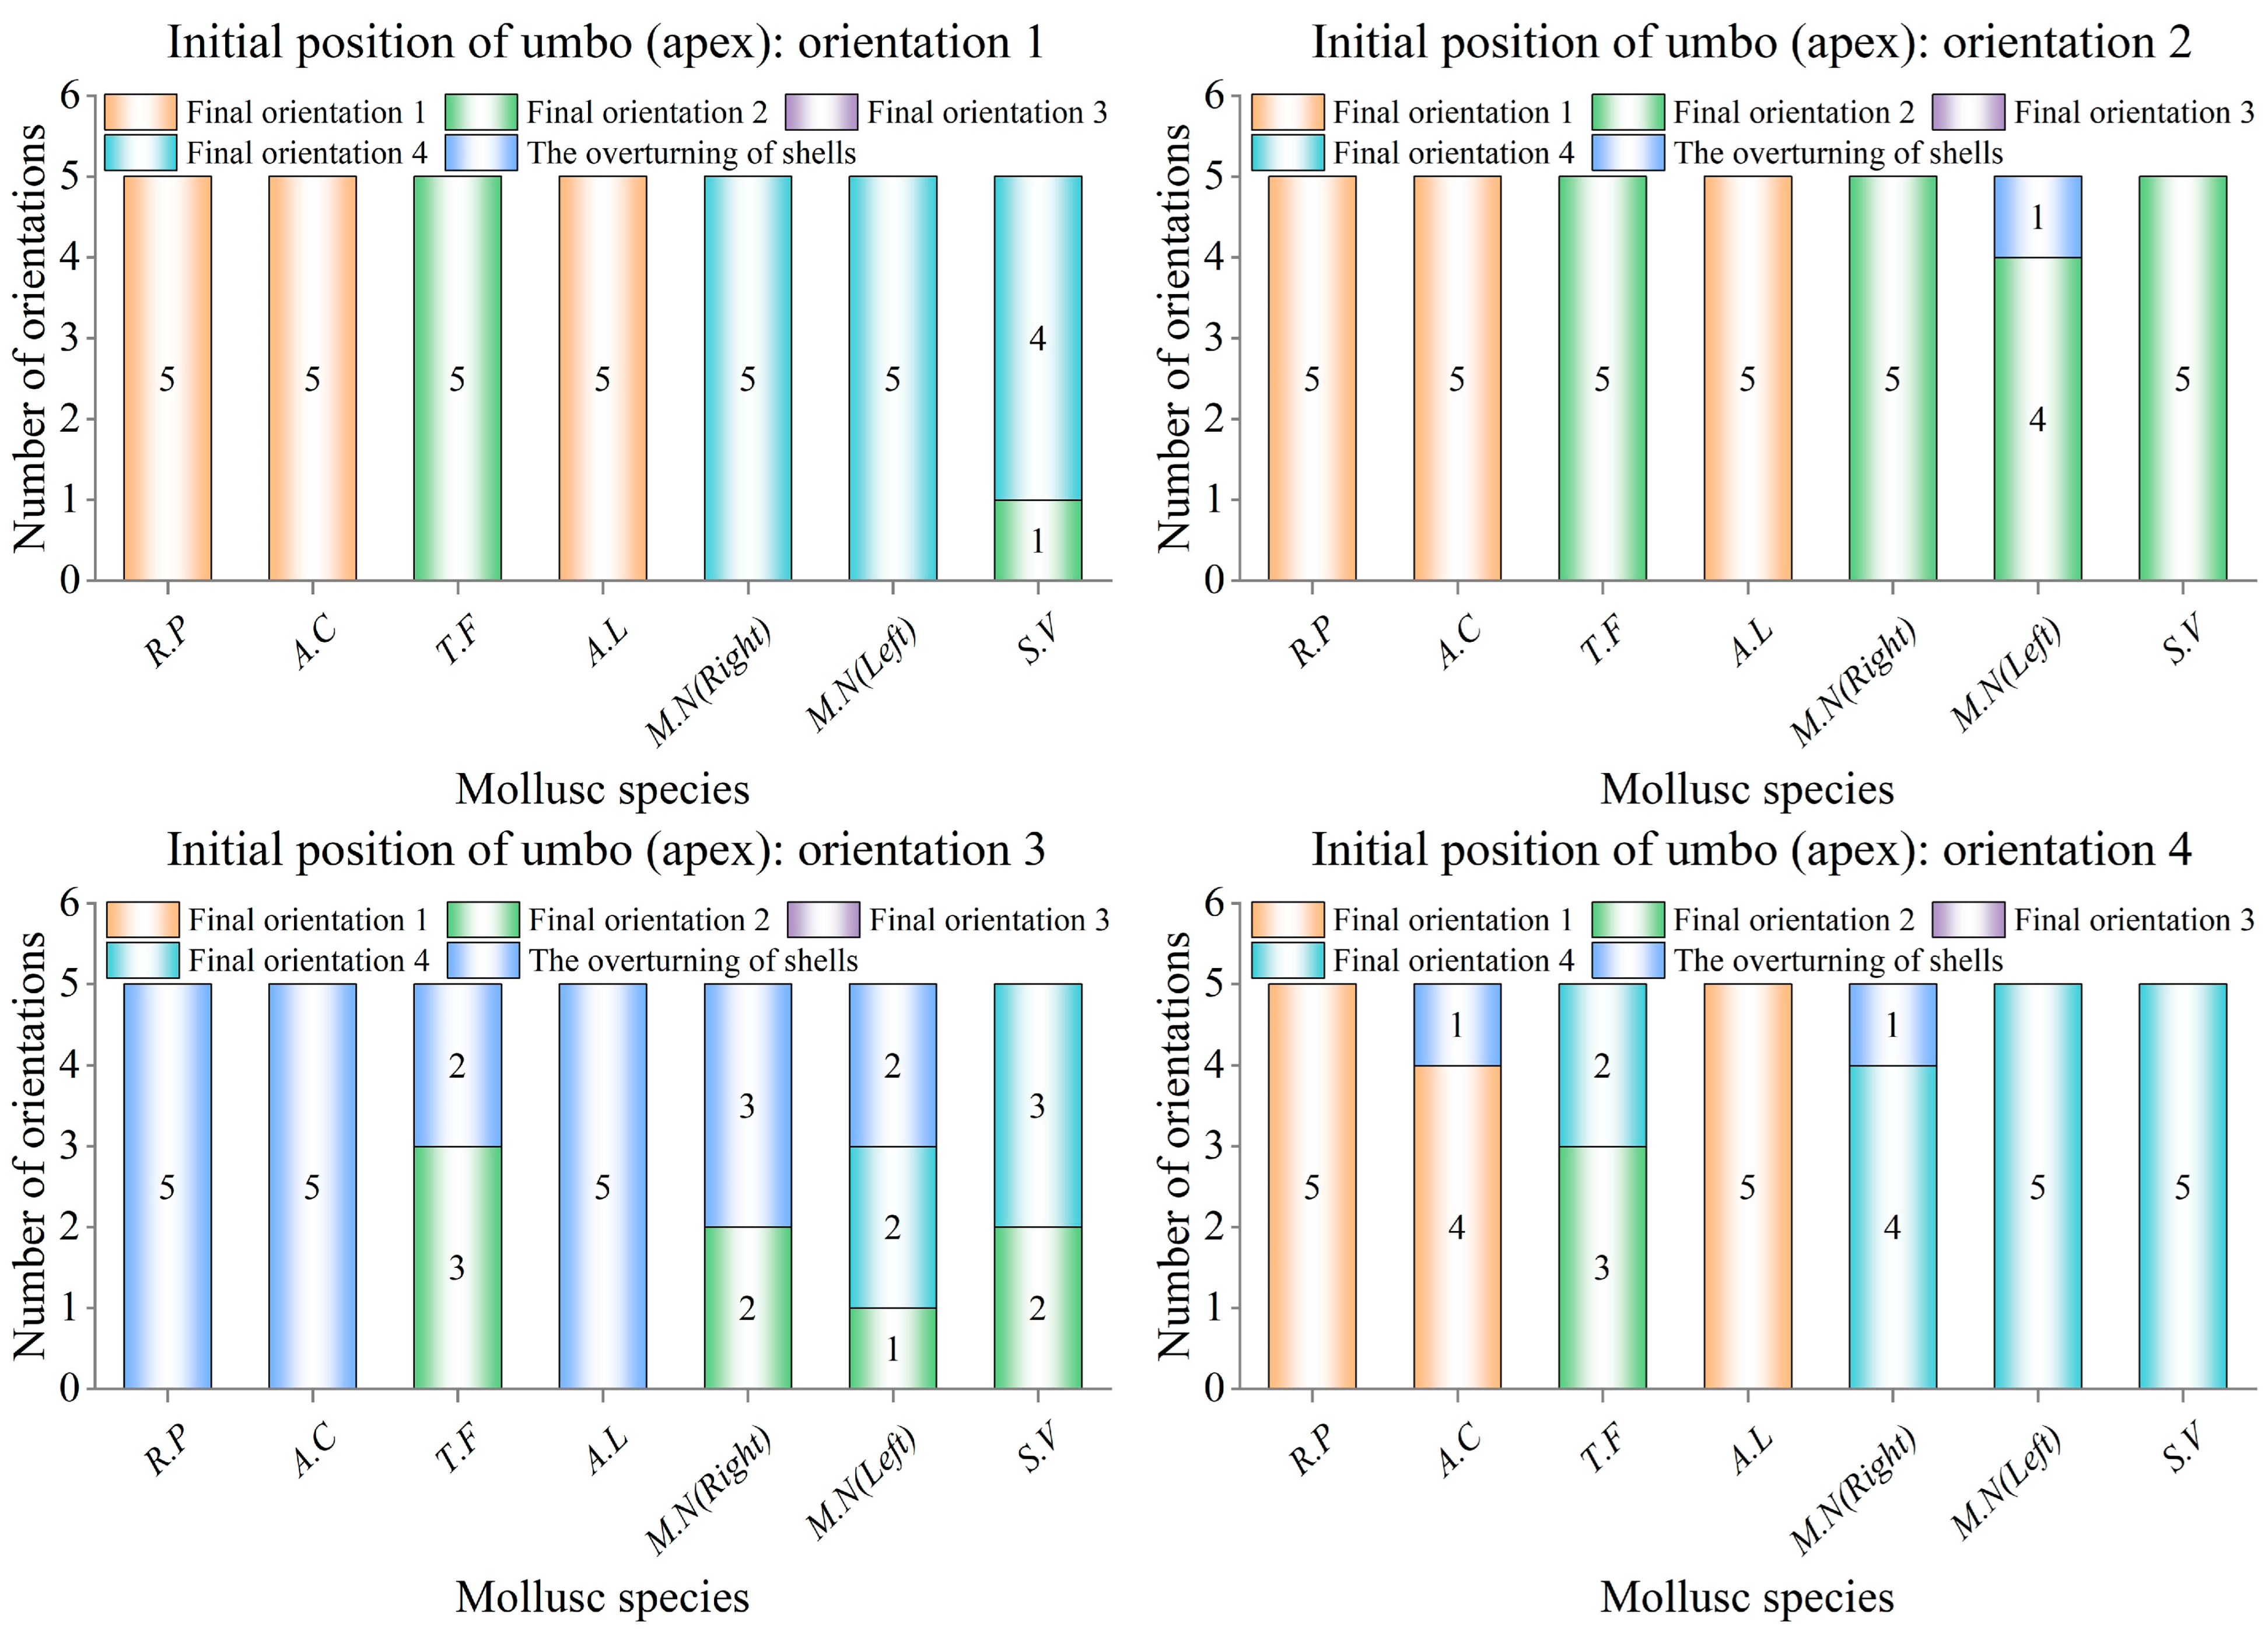
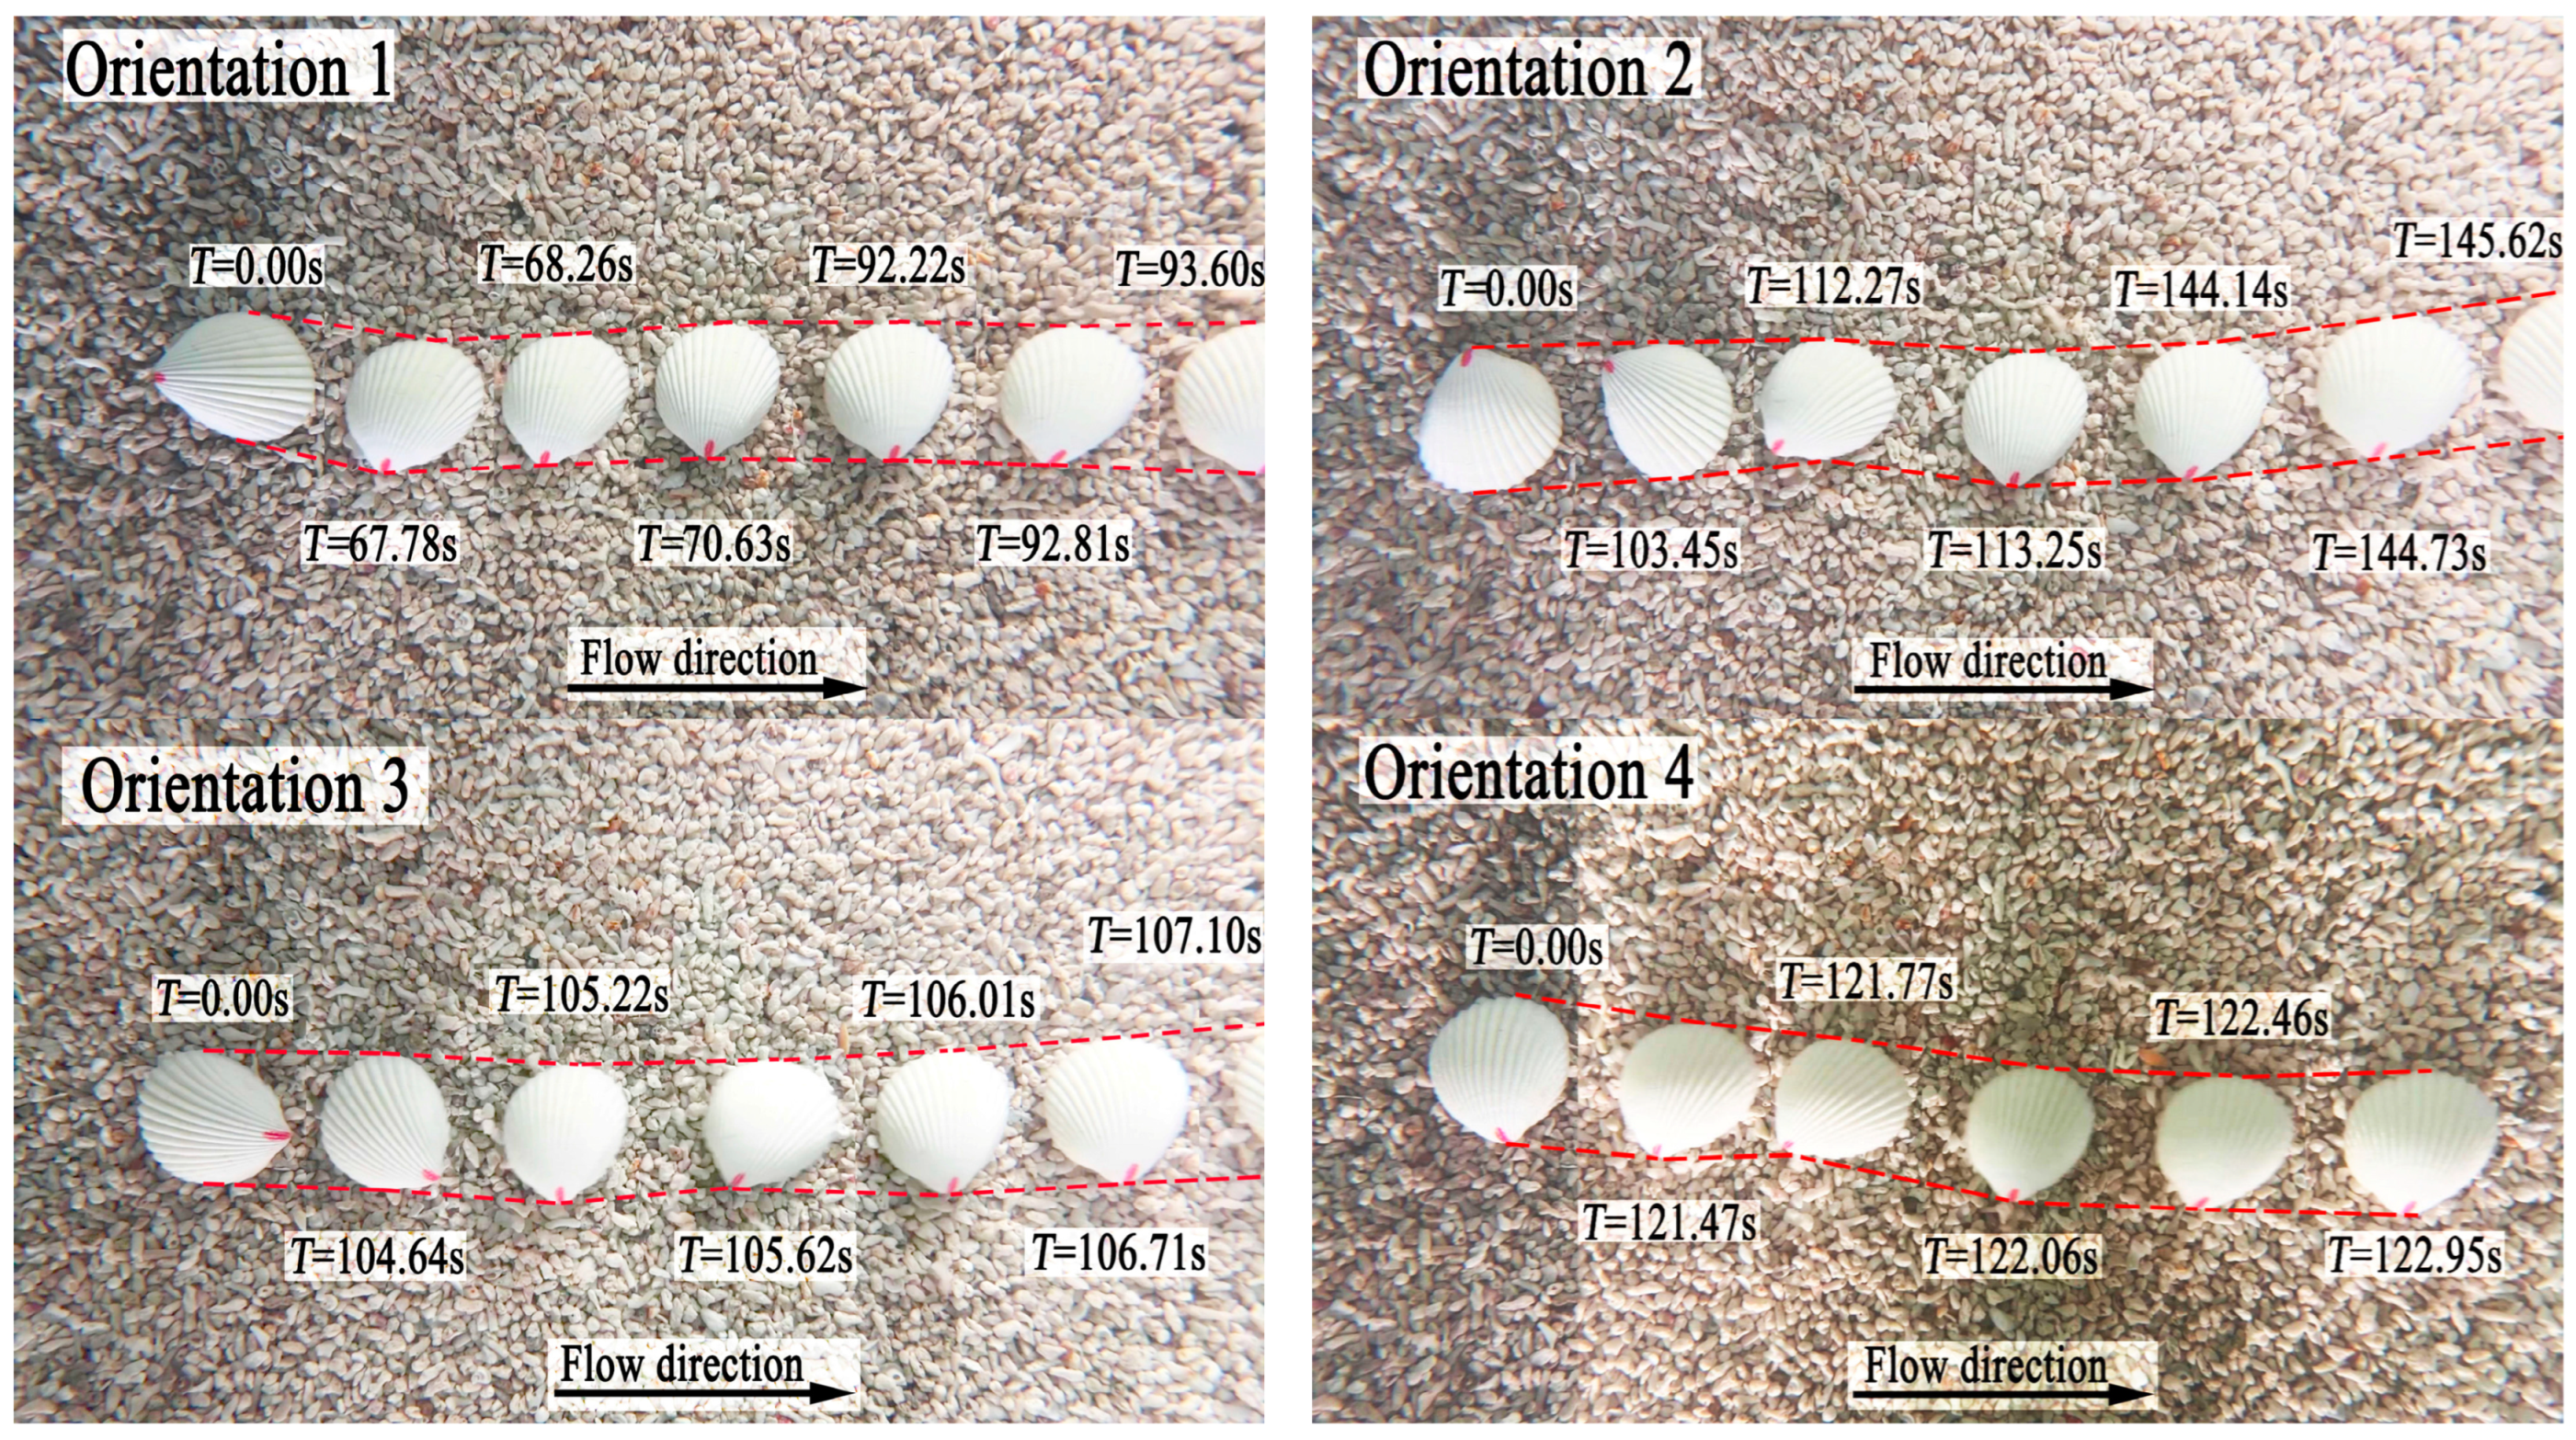
Prior to commencing the shell orientation motion experiments on a coral sand bed, the flume was filled to the predetermined water depth of 0.32 m, with the level of the coral sand bed consistently maintained for each trial. The bivalve shells were placed in four orientations: umbo upstream (orientation 1), umbo on the left (orientation 2), umbo downstream (orientation 3), and umbo on the right (orientation 4). The other orientations were regarded equivalently as one of the four orientations, and apexes of the shells for the gastropod shells were similarly placed according to the above four orientations. Umbo of bivalve shells and apexes of gastropod shells rotated or slid into one of the four orientations to become the shell’s final orientation. Care was taken to ensure that no air was trapped underneath or around the shells. The velocity of the flow in the flume was then increased by controlling the flow-making system, and the process of orientational motion of the shell was filmed for five repetitions.
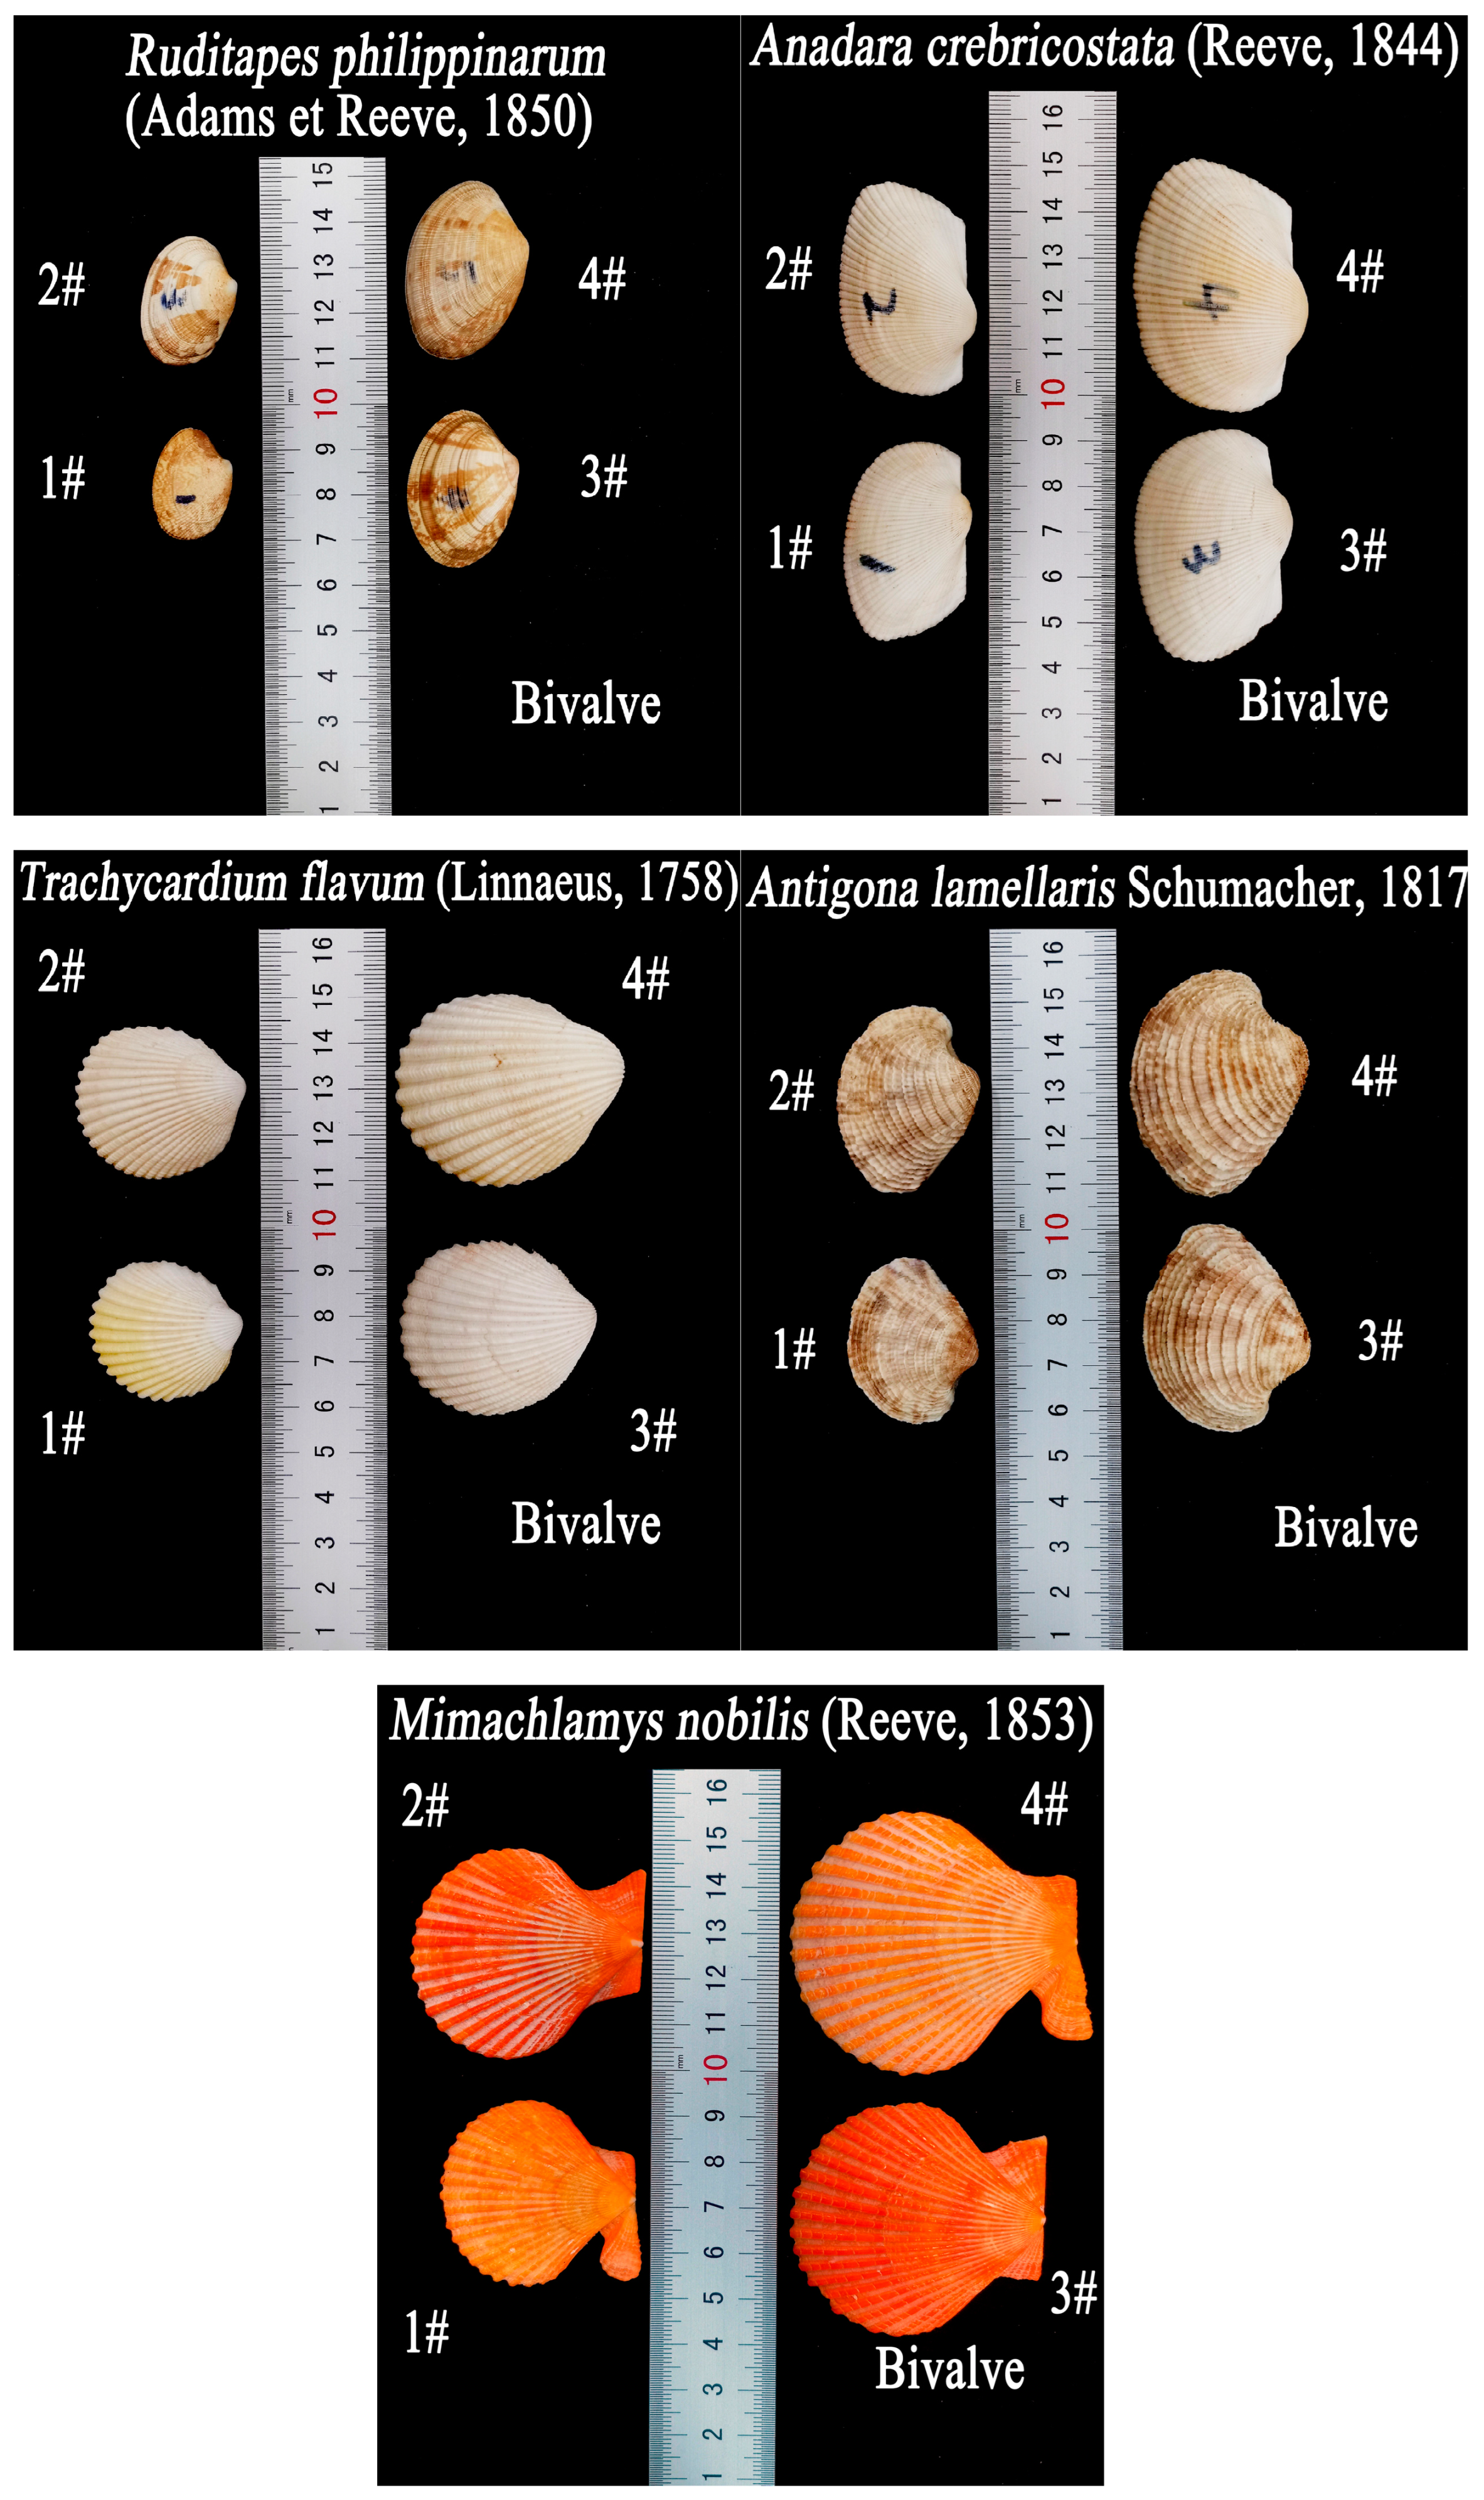
In this experiment, ten kinds of shells were used, including five kinds of bivalve shells:
Ruditapes philippinarum (Adams et Reeve, 1850),
Anadara crebricostata (Reeve, 1844),
Trachycardium flavum (Linnaeus, 1758),
Antigona lamellaris Schumacher, 1817, and
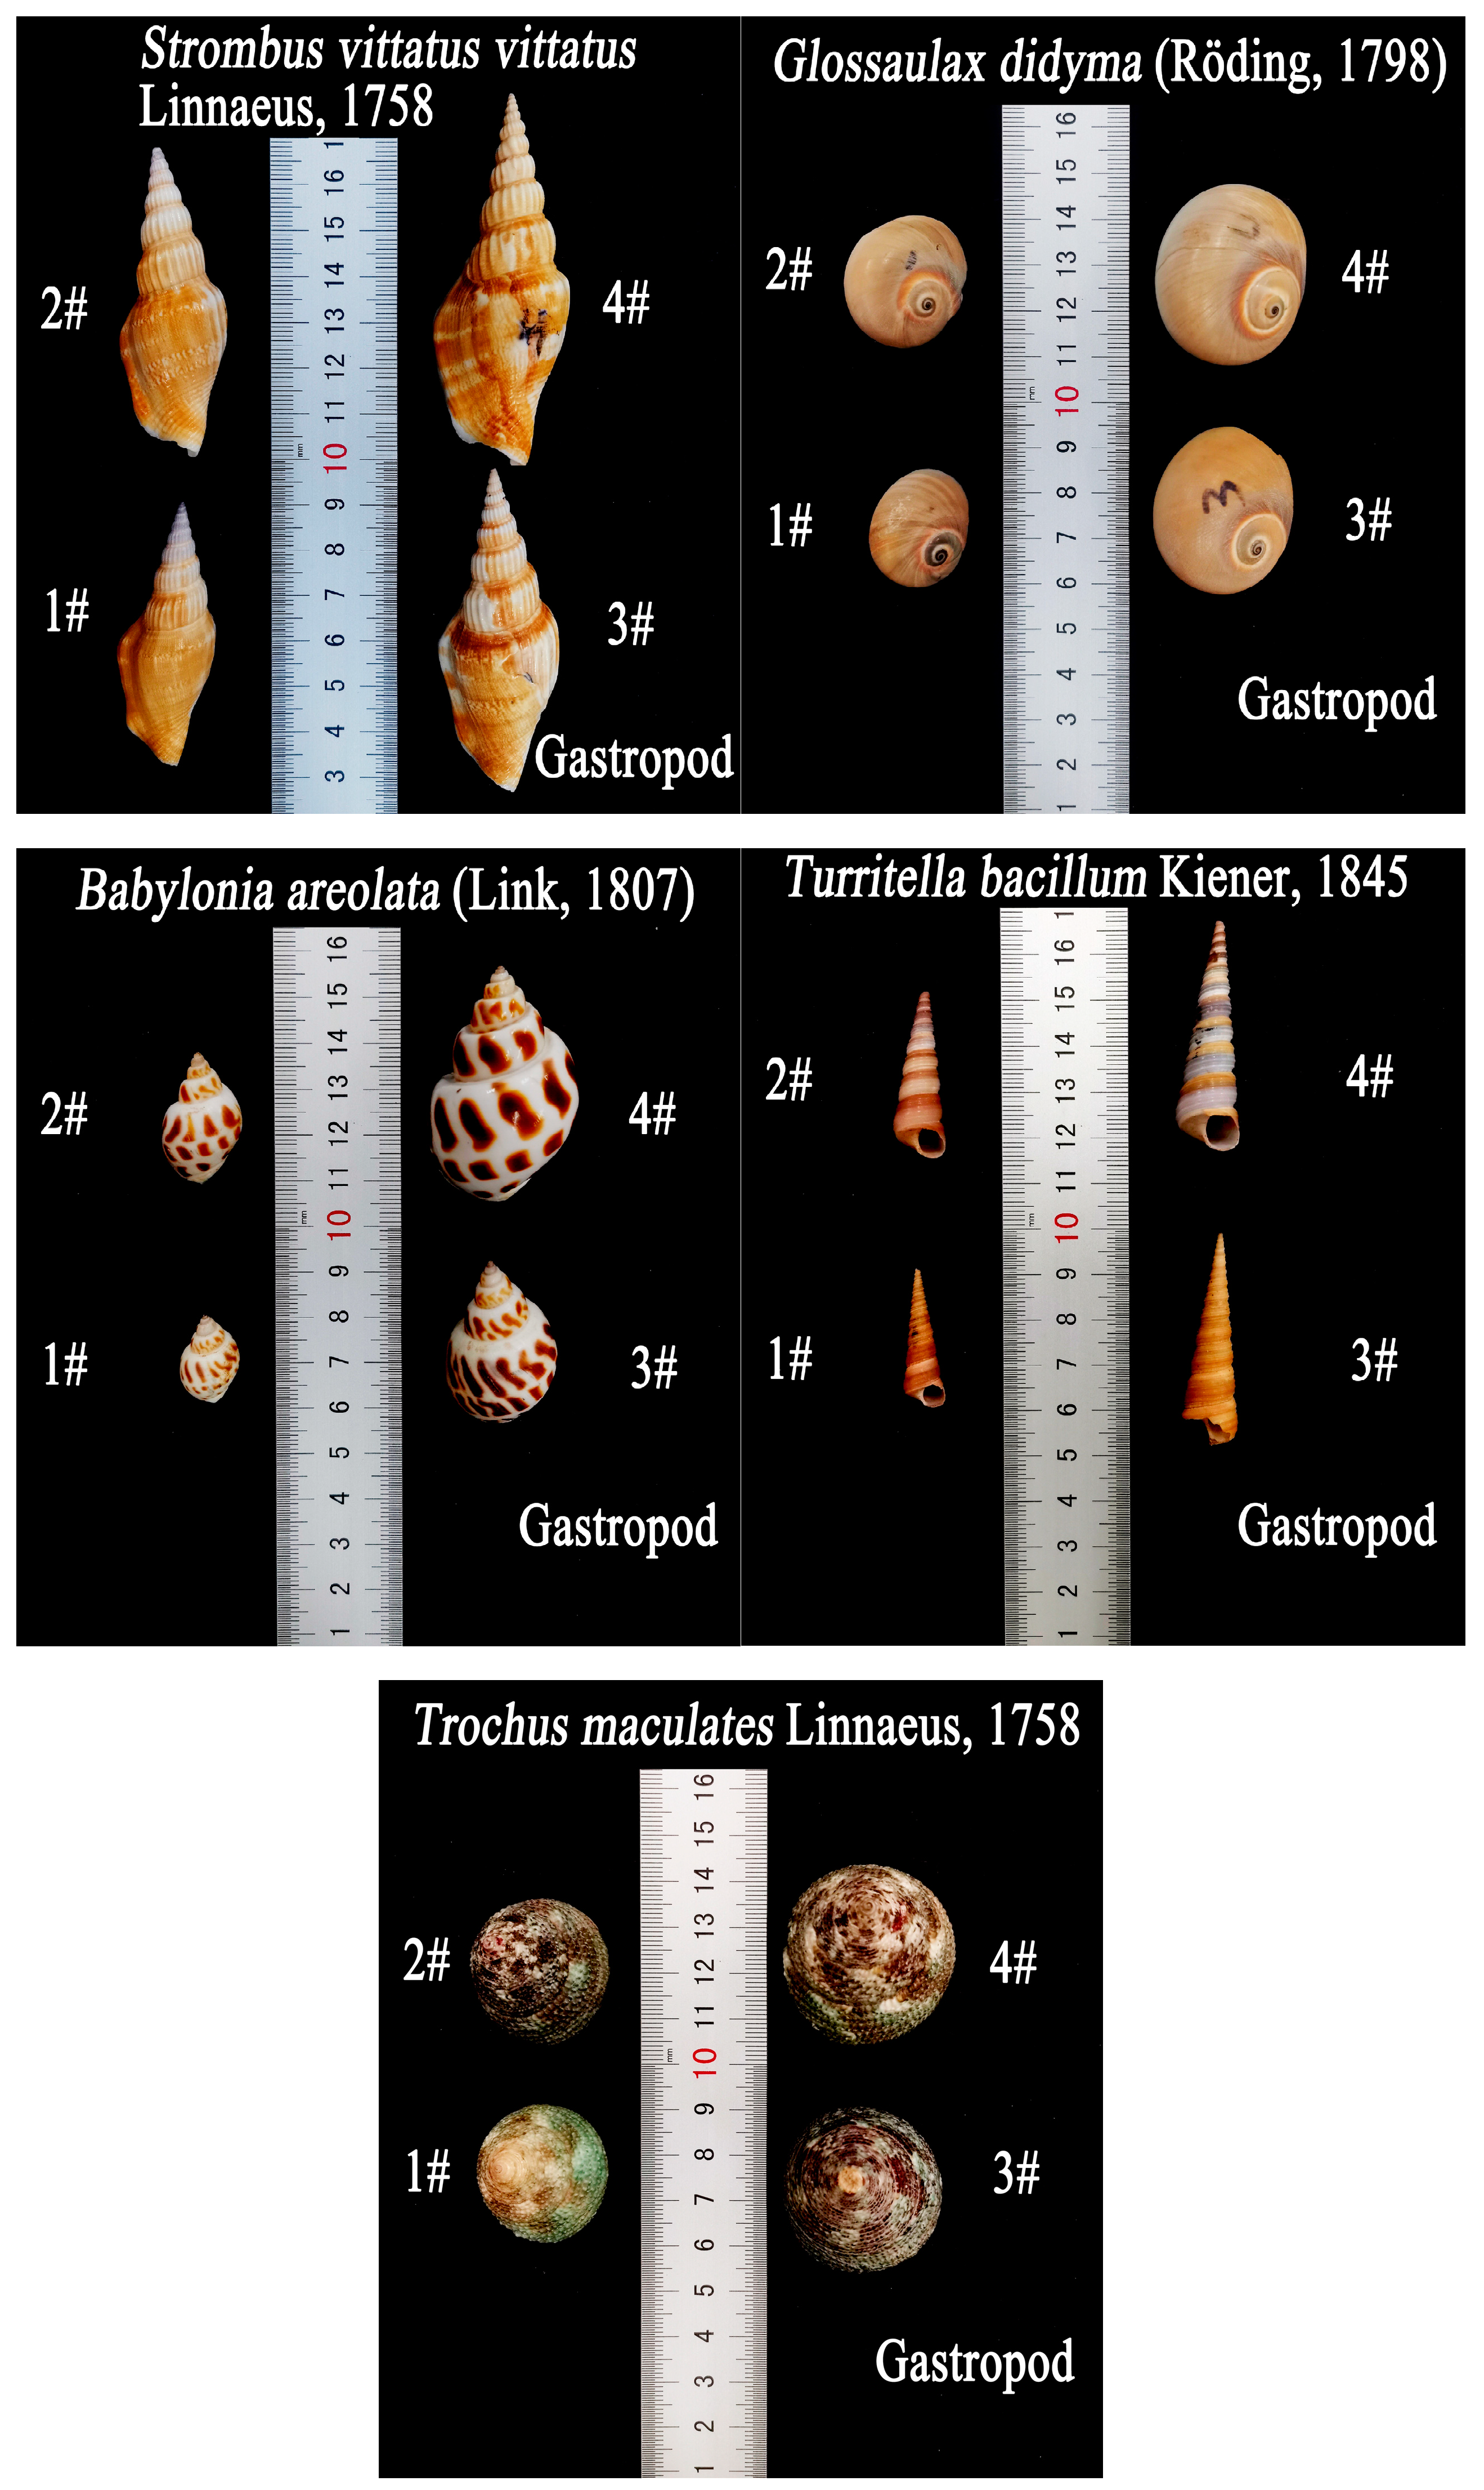
Mimachlamys nobilis (Reeve, 1853), and five kinds of gastropod shells:
Strombus vittatus vittatus Linnaeus, 1758,
Glossaulax didyma (Röding, 1798),
Babylonia areolata (Link, 1807),
Turritella bacillum Kiener, 1845, and
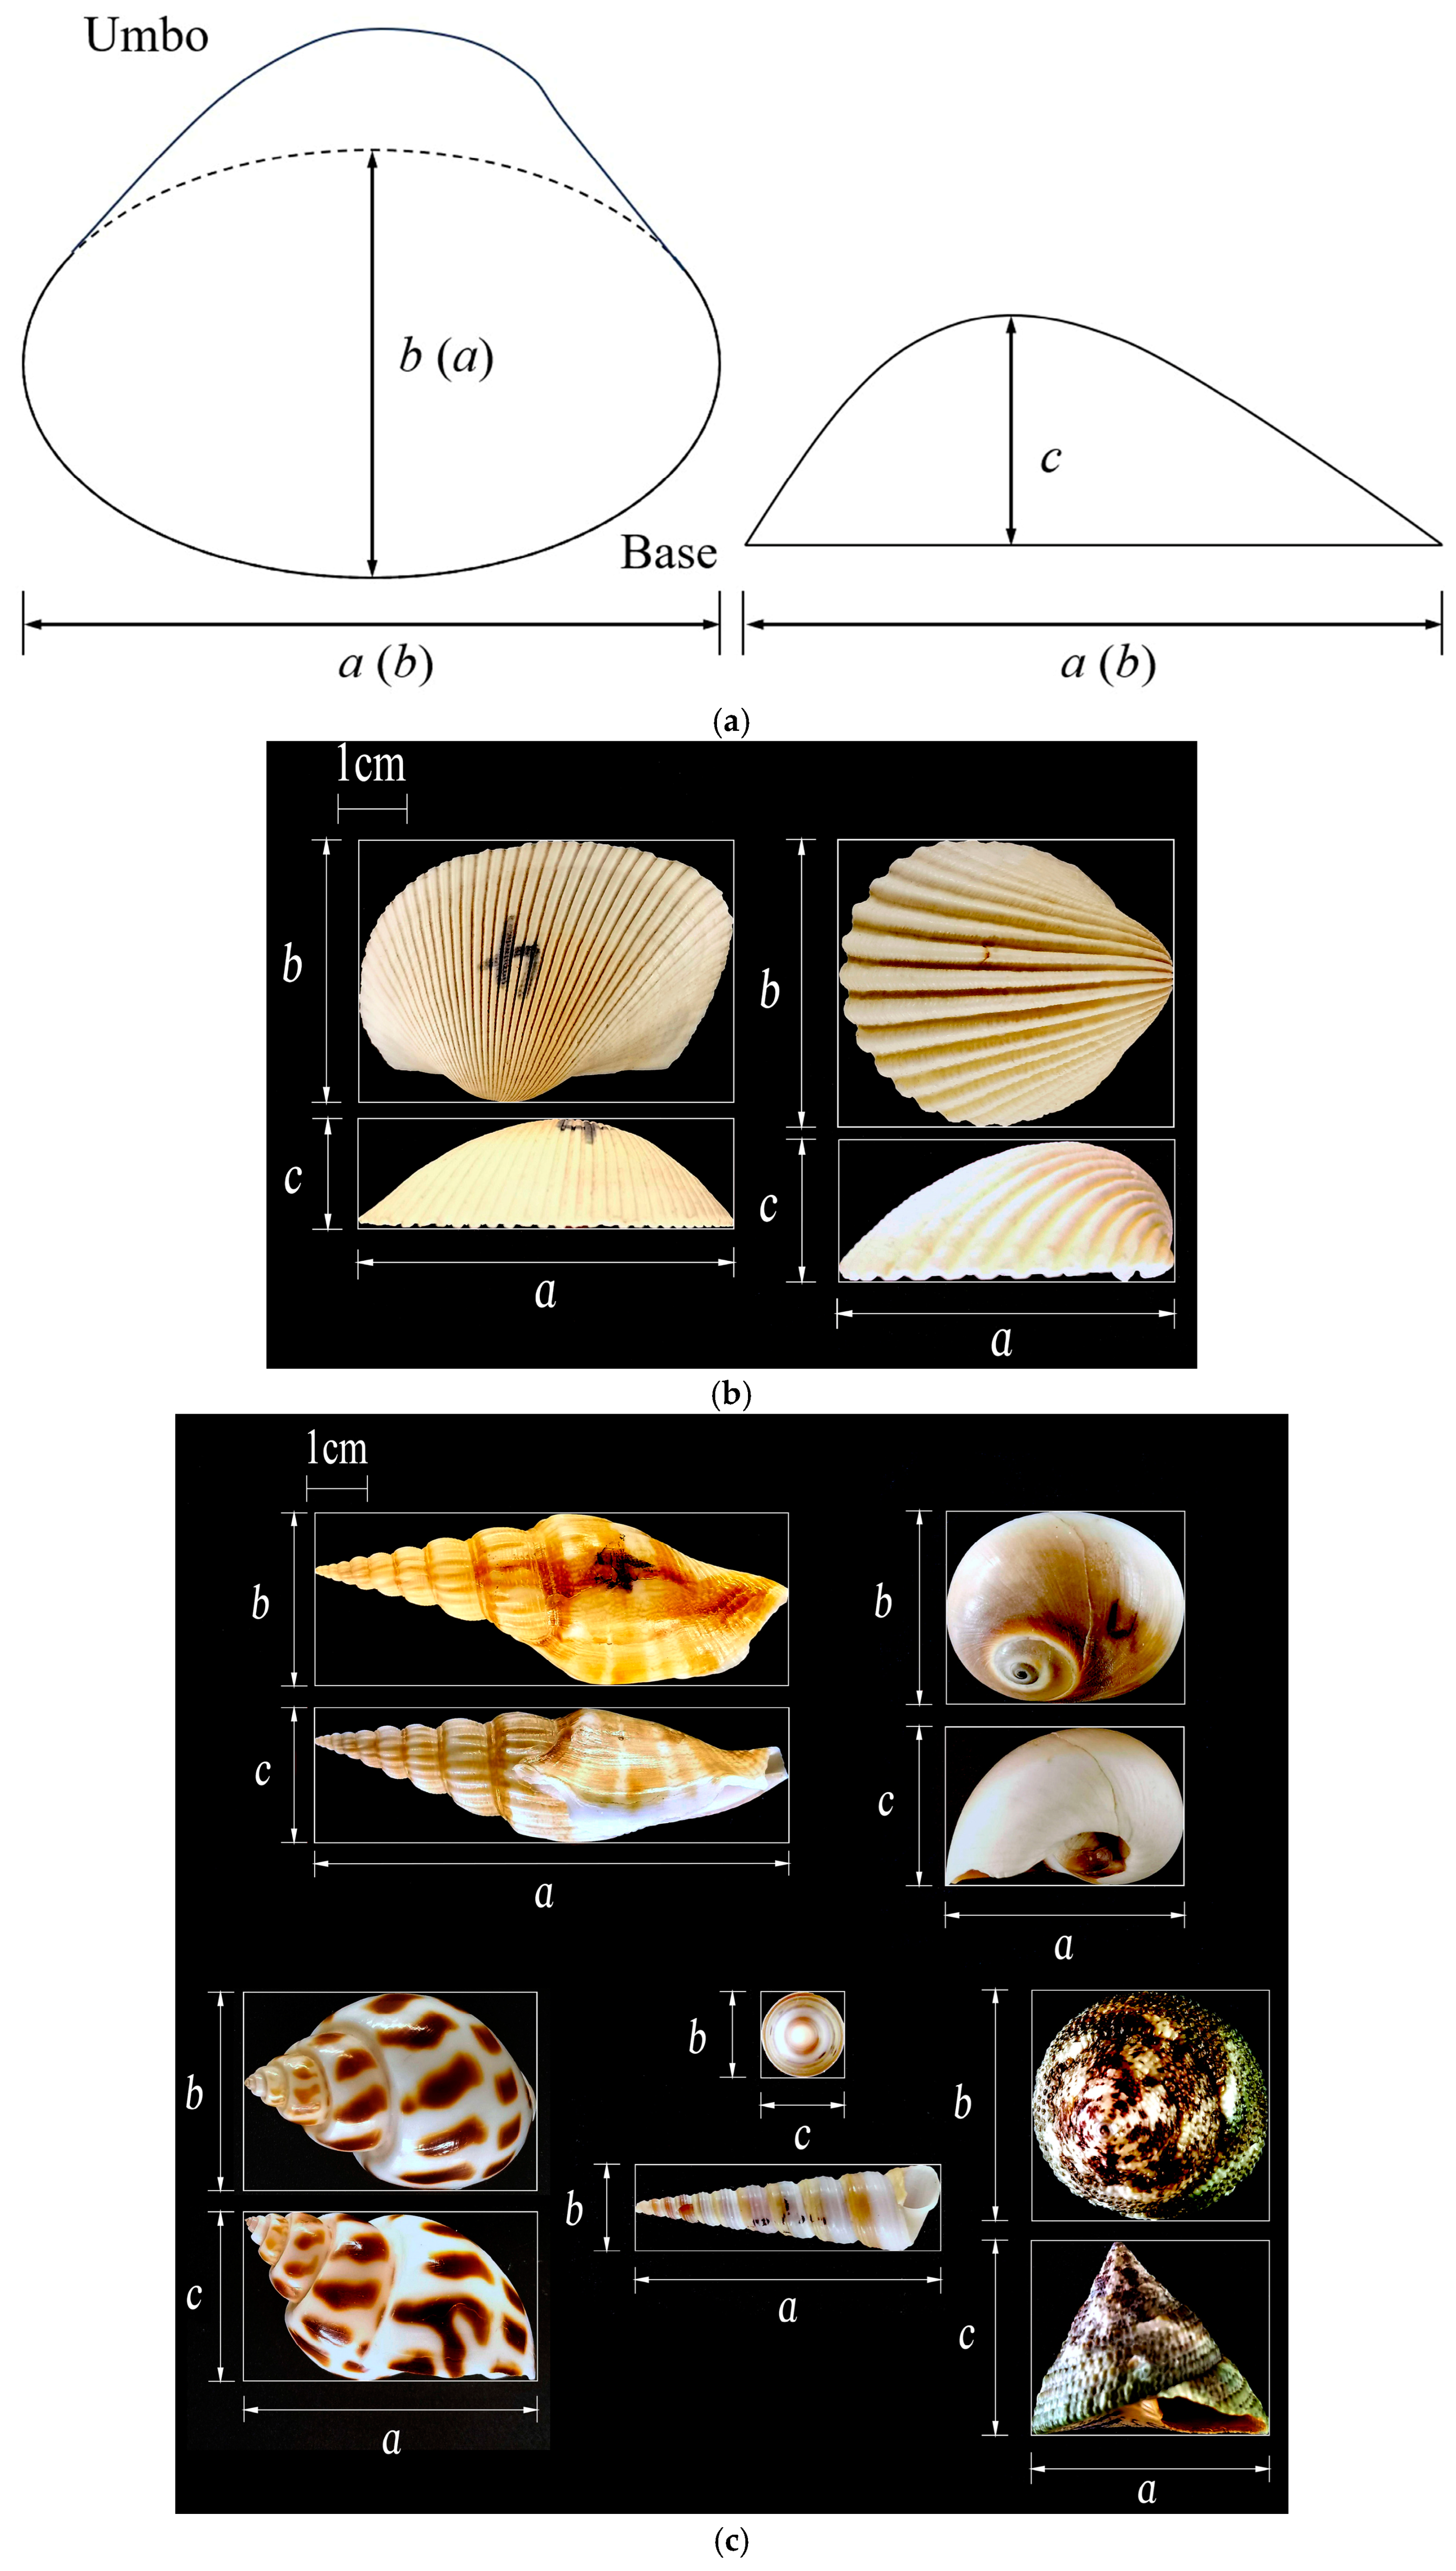
Trochus maculates Linnaeus, 1758. The shells of each type were divided was four size groups, and the front and top views of each experimental sample shell were photographed to obtain the longest, intermediate, and shortest axes lengths, which are denoted by
a,
b, and
c, respectively, taking into account factors such as shell surface roughness. The thickness of each shell was expressed through an average thickness value, using computer image recognition techniques (i.e., digital image pixels of each shell). The frontal projected area
Ap of the shells in the direction of the water flow under the final orientation and the basal projected area
As were calculated. The specific parameters are shown in
Figure 2 and
Figure 3, as well as in
Table 1 and
Table 2. The shell abbreviations in the tables and figures are indicated by the initial letters of the first two words of the shell name, defined as
R.P,
A.C,
T.F,
A.L,
M.N,
S.V,
G.D,
B.A,
T.B, and
T.M. The shells of each species were labelled 1#, 2#, 3#, or 4#, based on the size, from smallest to largest. The frontal projected areas of the convex upward (C.U) and convex downward (C.D) positions of
M.N varied based on the final shell orientation.
During repetitive experiments, a consistent trend was observed where the same shell tended to exhibit the same final orientation. In
Figure 2, it can be seen that the right shells (1# and 4#) and the left shells (2# and 3#) of
M.N were not mirror images from the perspective of their shapes, therefore, they needed to be oriented separately for observation, so 11 additional experimental samples of shells selected in the orientational motion experiment were counted. The parameters are shown in
Table 3.
For the shell incipient threshold flow velocity measurement experiments, the considerations were essentially the same as in the directional motion experiments, with the initial position of the shells placed according to the final direction observed in the orientational motion experiments. In order to improve the efficiency of the experiments, two shells of the same species were placed at the same time for measurement without affecting the flow velocity measurements, and the probe of the ADV was placed in the middle of the two shells, as shown in
Figure 1b. The probe was 65 mm from the bed.
The controller of the flow-making system slowly increased the flow velocity in the flume, and the flow velocity was recorded with the ADV until the shell began to move horizontally along the downstream orientation on the coral sand bed, whose motion was then considered to be the incipient motion. We recorded the time from when the ADV saved the flow velocity data to when the shell began its incipient motion, and used this time as a reference to obtain the flow velocity data corresponding to when the shell started incipient motion from the saved file. The experimental water depth was set to 0.20, 0.24, 0.28, 0.32, or 0.36 m, and three sets of replicates were conducted sequentially. The flow velocity data was subsequently processed to ensure the accuracy of the data by computing average cross-sectional flow velocity within 4 s after the incipient motion of the shell, which was taken as the threshold velocity of the incipient motion of the shell. i.e., the incipient mean velocity of the shell. The incipient mean velocity was defined here by calculating the distribution of mean flow velocity profiles over a 4 s period, then summing the flow velocity values for each cross-section on the flow velocity profile, dividing by the corresponding total number of sections, and taking the final average value obtained as the incipient mean velocity.
2.2. Shape Parameters of Shells
In order to better study the motion properties of shells, some of the studies used uniform sand as the bed surface in the experimental area [
8,
15,
16,
17,
30]. This paper also refers to this method to select uniform coral sand as the bed surface. Sieving classifies particles by intermediate diameter, which is the most used descriptor of particle size [
31,
32].
The formula for the median sieve diameter is:
where
D1 and
D2 are the opening diameters of the upper and lower sieves, respectively.
The shell sample size was measured on the longest, intermediate, and shortest axes. To quantify the shapes of irregular particles, the Corey shape factor
SF is commonly used [
33], which is defined as follows:
where
a,
b, and
c, are the dimensions of a particle in the longest, intermediate and shortest mutually perpendicular axes, respectively.
Alger et al. [
34] proposed a new shape parameter
β in order to take into account the surface and volume distributions of differently shaped particles, calculated as follows:
where
Ds is the area diameter, i.e., the diameter of a sphere with the same surface area, and
Dn is the nominal diameter, i.e., the diameter of a sphere with the same volume.
This paper describes gastropod shells with the opening facing upwards as opening upwards and those with the opening facing downwards as opening downwards. Notably,
G.D exhibited different frontal and basal projected areas for the opening upward (O.U) and opening downward (O.D) positions due to variations in the final orientation. Measurements of shell motion threshold flow velocities were made with the shells in a steady state, so the longest, intermediate, and shortest axes of gastropod shells were measured with shells placed in a steady state to ensure that the measured longest, intermediate, and shortest axes were practically significant for shell motion.
Figure 4a shows a simplified shape of bivalve shell, using the umbo as a reference point, where the longest axes
a, intermediate axes
b may be different for different bivalve shells (such as
A.C and
T.F). Because of the diverse shapes of gastropod shells, these shells cannot be represented uniformly by a simplified shape diagram.
Figure 4b,c shows the longest axes
a, intermediate axes
b, and shortest axes
c of two bivalves
A.C 4# and
T.F 4#, five gastropods
S.V 4#,
G.D 4#,
B.A 4#,
T.B 4#, and
T.M 4#. It is worth mentioning that
R.P and
A.L share the same method of measurement for the longest, intermediate, and shortest axes as
A.C, while
M.N shares the same method of measurement as
T.F.
The specific formulas for the area diameter
Ds, nominal diameter
Dn, surface area
S′ of bivalves, and surface area
S″ (
T.B and
T.M can be approximated as cones) of cones are given as follows:
where
S is total surface area of the shell,
V is the volume of the shell,
Dt is the thickness of the shell,
l is the length of the generatrix of the cone, and
r is the radius of the bottom circle of the cone.
The surface areas of gastropod shells T.B and T.M were calculated by treating them as cones, and Equation (7) was employed to compute the surface area S″. Conversely, the surface areas of the remaining three gastropod shells were determined using a method involving the application of small-sized stickers to the shell surface, followed by computer vision techniques to calculate the area of each sticker. These areas were then sequentially summed to obtain the total surface area.
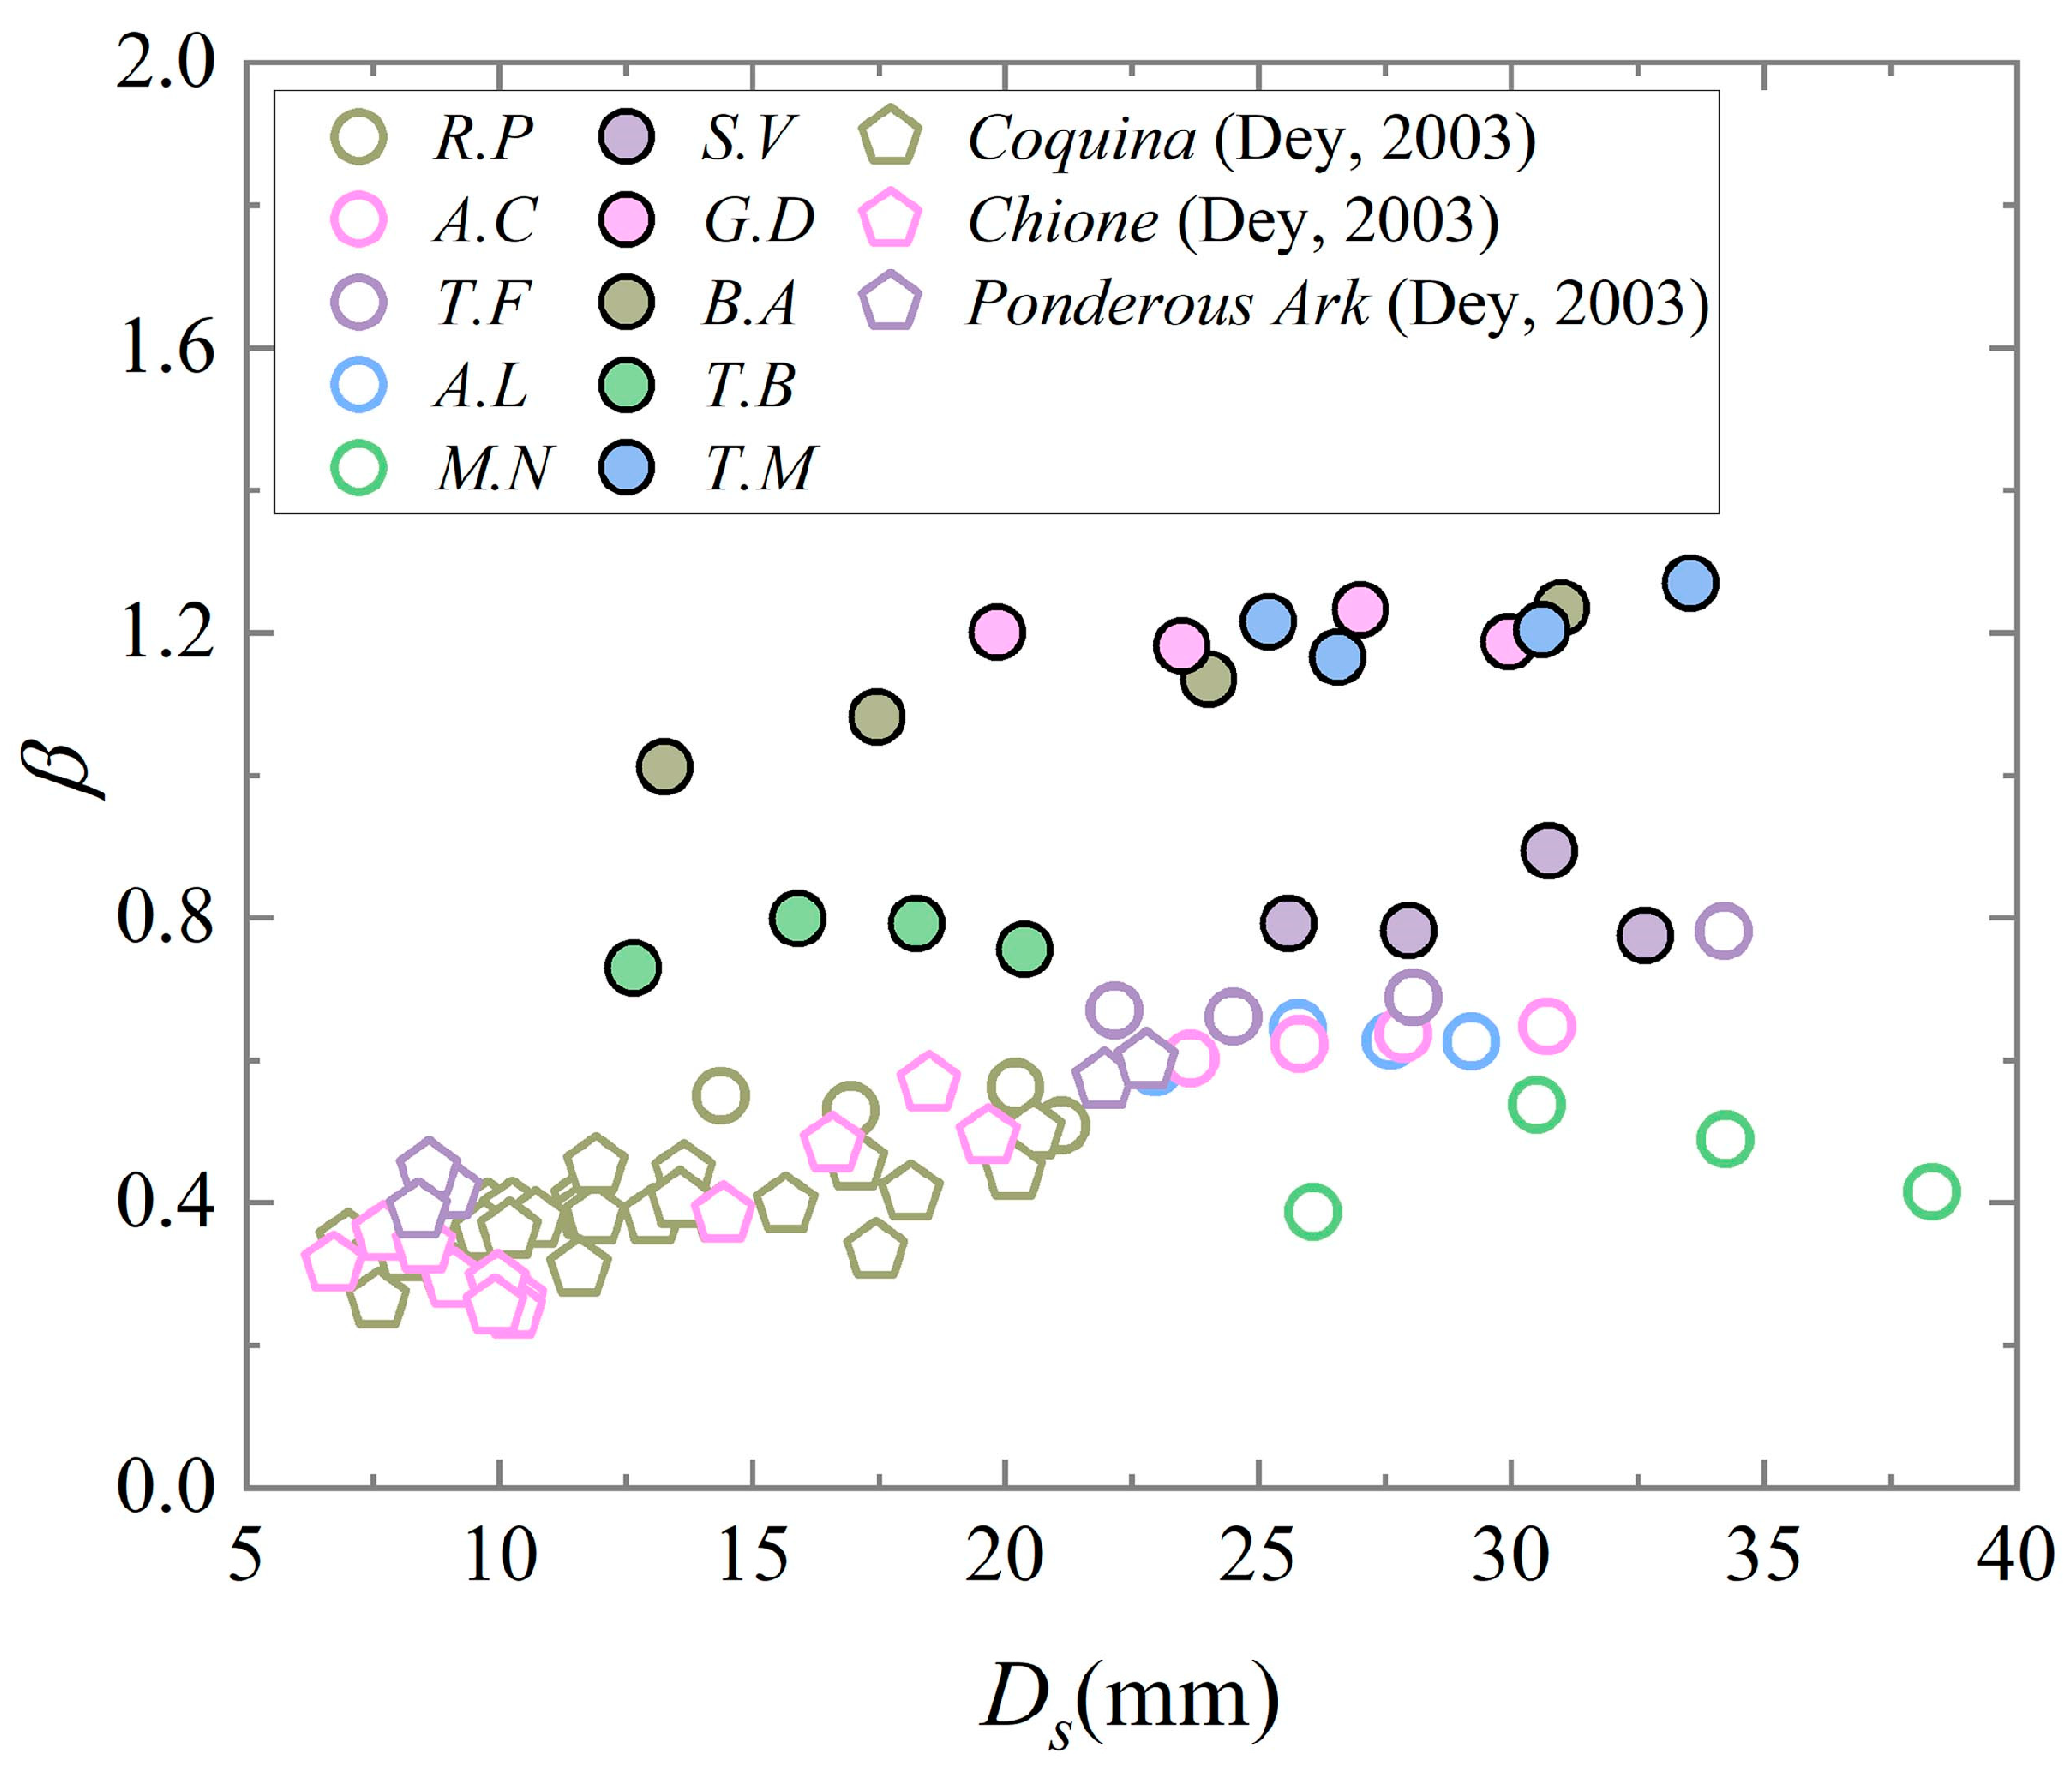
The value of
β for each shell was calculated using Equations (2)–(5). As can be seen in
Figure 5, the single mean values of
β for all the gastropod shells were larger than those of the bivalve shells due to the irregularity of the shapes of the gastropod shells, and there was little difference in the values of
β due to the similarity in the direct shapes of shells of the same species. The value of
β of
M.N was slightly smaller than those of the other four bivalve shells.
3. Analysis of Experimental Velocity Data
3.1. The Calculation of Critical Shields Parameter
Shells species and final orientation are important for threshold flow velocity analyses, at the same time, the critical Shields parameters also can provide a visual demonstration of how easy it is for each species of shell to reach the motion threshold. Smaller Shields parameters means smaller shear stresses and shells easily reach the motion threshold. Therefore, it is necessary to calculate the critical Shields parameters.
The incipient motions of the shells in the rectangular flume were subjected to sidewall friction, and the sidewall correction method of Vanoni [
35], which was used to eliminate the sidewall effect, was used in this experiment, as was done by Dey [
8] and Diedericks et al. [
17]. The specific formula for the bed friction coefficient is
and the Colebrook–White equation [
8] is
where
Rb is the Reynolds number and
fb is the friction factor associated with the bed, both of which can be solved for numerically using Equations (8) and (9).
υ is the kinematic viscosity of water, which was 0.865 × 10
−6 m
2/s in this experiment,
P is the wetted perimeter, and
ks is the roughness of the coral sand bed.
The bed shear stress equation is as follows:
where
U is the average flow velocity of the section,
ρw is the density of water, and
ρw = 1 × 10
3 kg/m
3 in this experiment. Furthermore,
U =
Uc, where
Uc is the incipient mean velocity.
The critical shear stress
τb is related to the fluid density
ρw and the shear velocity
u* as follows:
The theoretical velocity profile in the lowest part of the turbulent boundary layer had a logarithmic structure, because closer to the bottom of the sediment interface, the effect of friction was more pronounced. Therefore, the velocity above the sediment bed can be defined as:
where
κ is the von Kármán constant,
κ = 0.41 [
36], and
u(
z) is the velocity at height
z (m) above the bed. Experiments have shown that the horizontal height of zero velocity in flow with hydrodynamic roughness is 0.033 times the diameter of the sand grains. Thus,
z0 = 0.033
ks [
37]. In the tests conducted by Nikuradse [
38] using uniform sand, the roughness size
ks was equal to the sediment grain size. Similarly, Dey [
8] and Wiberg et al. [
39] assumed
ks to be the same as the mean sand diameter in their respective experiments. Because this study considers sieved coral sediment to be homogeneous sand, the bed roughness
ks is assumed to be equal to the median sieve diameter
Dsv.
ks =
Dsv = 3.600 mm.
Whether the sediment has reached the incipient motion threshold under hydrodynamic conditions is generally judged by the dimensionless parameter
θcr proposed by Shields [
1], which is related to the dimensionless particle Reynolds number,
. These parameters are calculated as follows:
where
ρs is the sediment density,
d is the sediment particle diameter,
D50 is the median diameter of the sediment. In this paper,
d =
Dt, and the dimensionless grain Reynolds number was calculated using
Dsv instead of
D50, as was done by Bian et al. [
5].
Using the above-mentioned method of calculating the critical Shields parameters, which is a further analysis of the incipient mean flow velocity, comparing the critical Shields parameters of different types of shells provides a deeper understanding of the motion properties of the shells.
3.2. Incipient Mean Velocity Data Fitting
Given the irregular shapes of both bivalve and gastropod shells, as well as the influence of initial steady state, it becomes imperative to derive an effective formula for calculating the incipient mean velocities of these shells. In this experiment, due to the permeability of an actual sediment environment, coral sand was directly laid at the bottom of the flume. In order to be able to calculate the flow velocity equations for the incipient motions of shells under different unidirectional flow conditions with simple shell-related parameters, the flow velocity equations presented by Dey et al. [
16] were used with some modifications. Ultimately, mean flow velocity equations suitable for the incipient motions of the various shells under with different final orientations were obtained. Subsequently, the measured threshold velocity was utilized to compute the critical bed shear stress of the shells using Equation (10). The critical bed shear stress equation was determined through fitting in a similar manner.
The incipient mean velocity equation for the convex downward position of bivalve shells is as follows:
The incipient mean velocity equation for the convex upward position of bivalve shells is as follows:
In these equations, , , , and . The R2 values for the incipient mean flow velocity measurements and the predicted values for the convex downward and convex upward positions of the bivalve shells were 0.420 and 0.431, respectively.
The critical shear stress equation for the convex downward position of the bivalve shells is as follows:
The critical shear stress equation for the convex upward position of bivalve shells is as follows:
In these equations, . The R2 values for the measured and predicted critical shear stresses for the convex downward and convex upward positions of the bivalve shells were 0.430 and 0.393, respectively.
By fitting the experimental data, it was found that the R2 values for the equations obtained with simple parameters for the bivalve shells were low, and that there were no results to perform data fitting for the gastropods using the same parameters (a, h, and SF) as those used for the bivalve shells. Therefore, the frontal projected and basal projected areas of the shells were taken into consideration, and the following dimensionless equations were obtained.
The incipient mean velocity equation for the convex downward position of the bivalve shells is as follows:
The incipient mean velocity equation for the convex upward position of the bivalve shells is as follows:
In these equations, , . The R2 for the incipient mean velocity measurements and the predicted values for the convex downward position of the bivalve shells was 0.729. Replacing the area diameter Ds with the longest axes a greatly improved the correlation coefficient (R2 = 0.867) for the equation of the incipient mean velocity for the convex upward positions.
The critical shear stress equation for the convex downward positions of the bivalve shells is as follows:
The critical stress equation for the convex upward positions of the bivalve shells is as follows:
where the
R2 values for the measured and predicted critical shear stresses for the convex downward and convex upward positions of the bivalve shells were 0.720 and 0.881, respectively.
Figure 6 shows the relationship between the measured and predicted values of the incipient mean velocity and critical shear stress for the convex downward and convex upward positions.
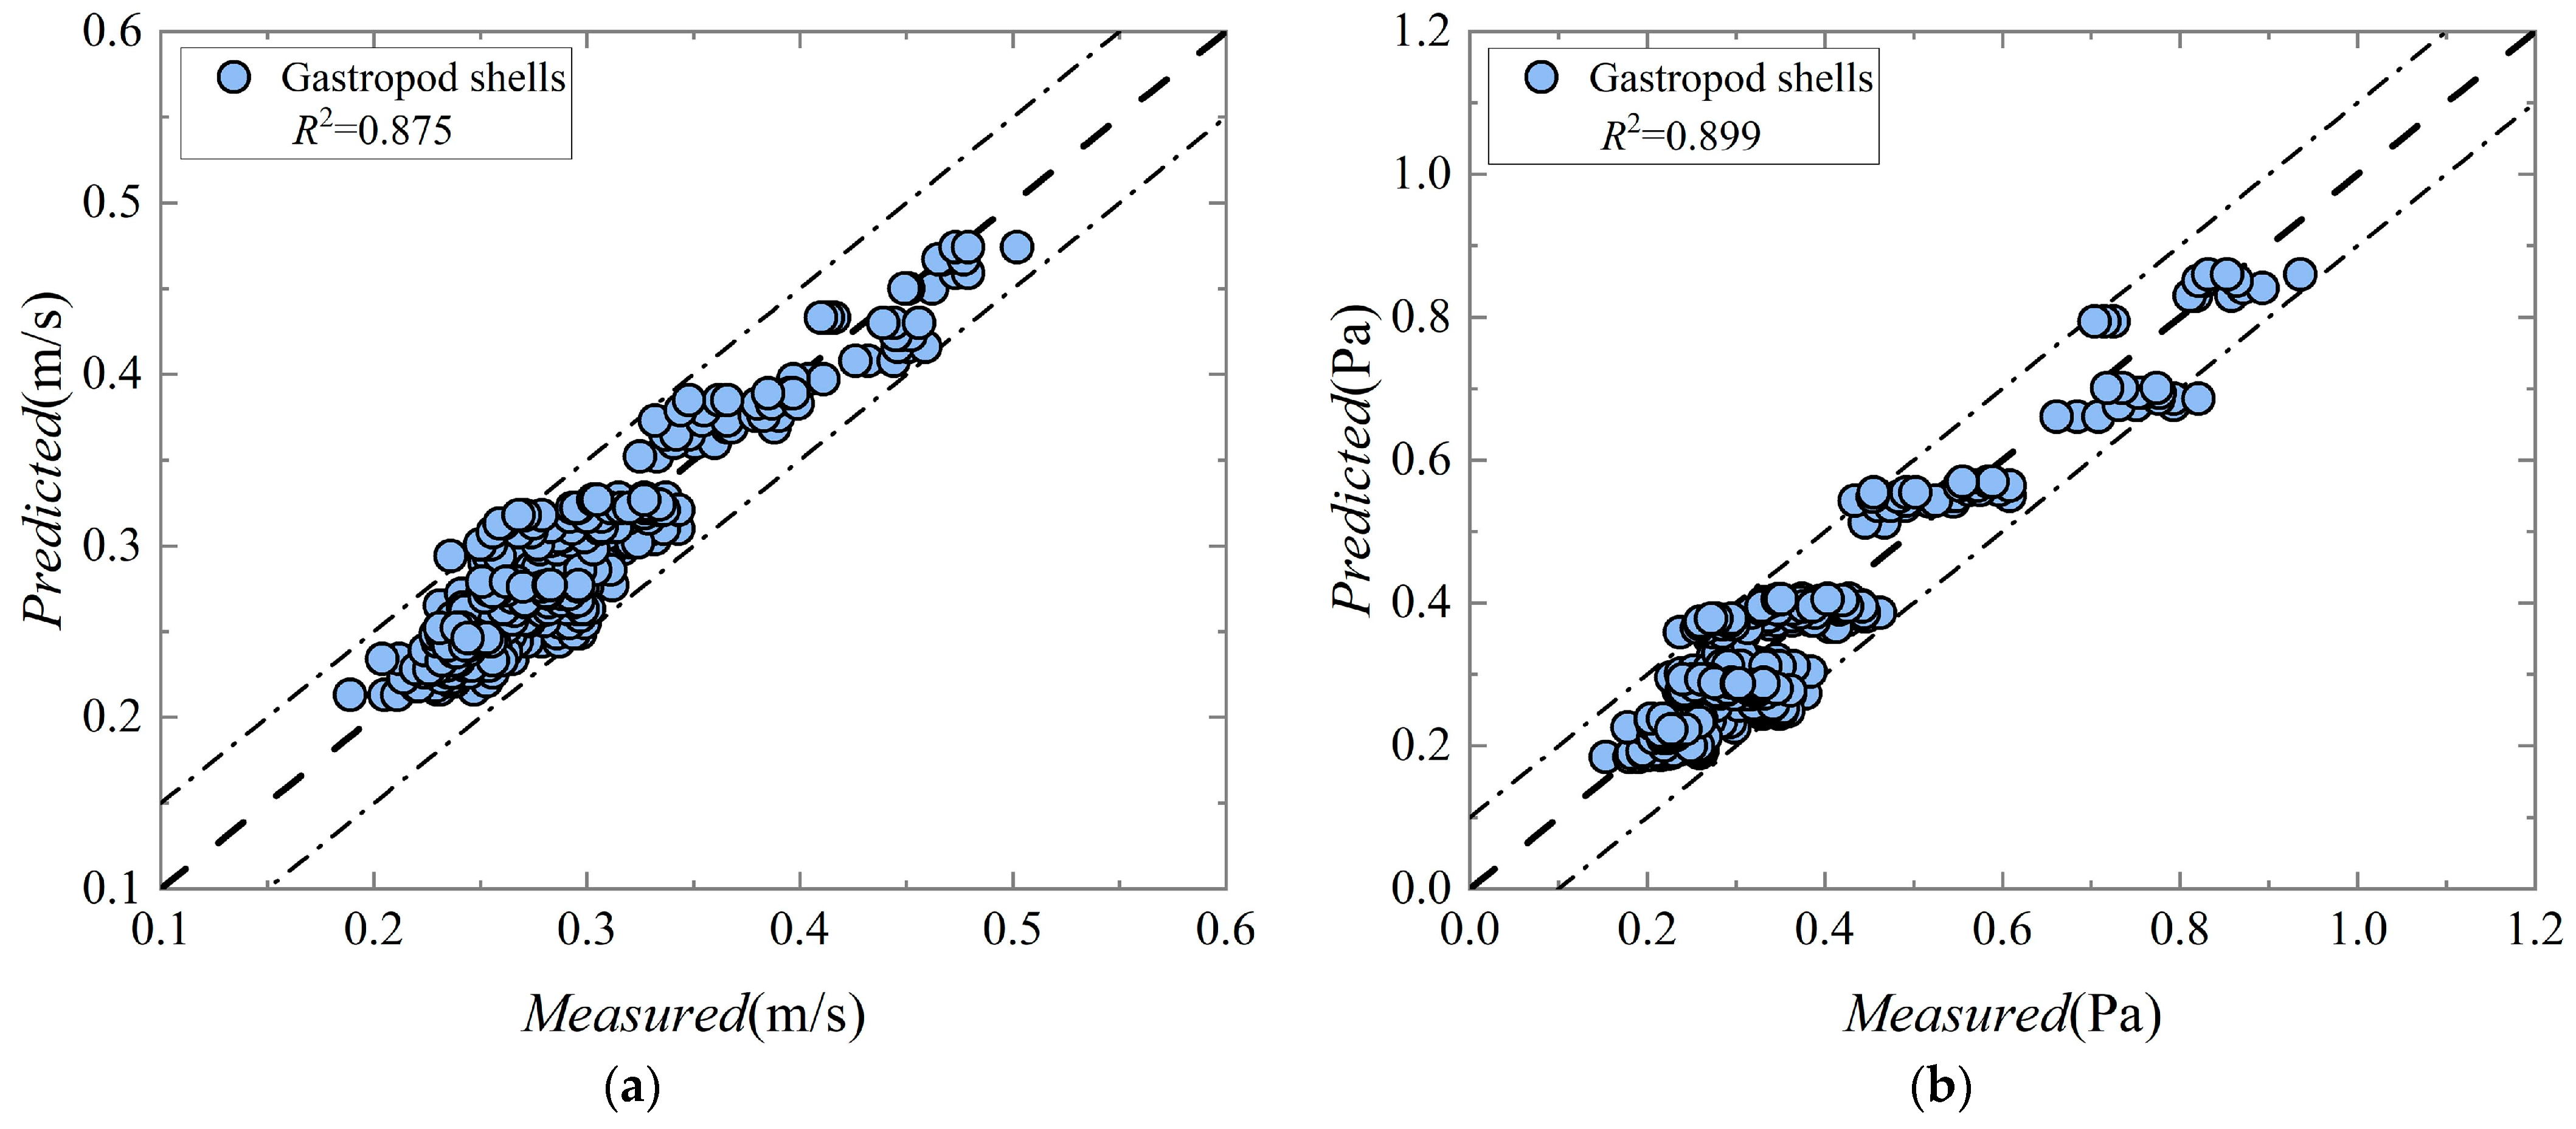
The incipient mean velocity equation for the gastropod shells is as follows:
The critical shear stress equation for the gastropod shells is as follows:
In these equations,
. The
R2 for the measured and predicted values of the incipient mean velocity and critical shear stress for gastropod shells were 0.875 and 0.899, respectively.
Figure 7 shows the relationship between the measured and predicted values of the incipient mean velocity and critical shear stress.
5. Discussion
The description of the shape of single-particle sediment generally uses the shape parameter
SF [
40,
41,
42], and in order to better take into account the different hydrodynamic characteristics due to the surface area and volume factors of the particles, a new shape parameter
β was proposed [
34] and has been applied to shell studies [
8,
15,
16,
17]. A total of 20 bivalve shells and 20 gastropod shells were measured and counted in this study. Comparisons with the shape parameters measured and calculated by Dey [
8] revealed that the values of
β for the same species with different sizes were predominantly consistent (
Figure 5), indicating insignificant shape differences. Conversely, unlike shells, research by Chen et al. [
43] observed that the shape of coral sand particles tends to approach a sphere as the particle size decreases. The final statistics unveiled that the values of
β for the experimental samples of gastropod shells surpassed those of bivalve shells overall.
Dey [
15], Dey [
8], and Diedericks et al. [
17] observed the motion process of bivalve shells and found that all these shells have two final orientations which were convex upward with umbo in the downstream position and convex downward with umbo in the upstream position. However, our observations in this study revealed that the final orientation of shells is not necessarily confined to these two stable orientations. Analysis of experimental statistics demonstrated that the final orientations of certain shells varied across repeated experiments, attributable to the shape factor of the shells. Consequently, the theoretical frameworks proposed for shell motion in prior studies may not be universally applicable to shells exhibiting different final orientations.
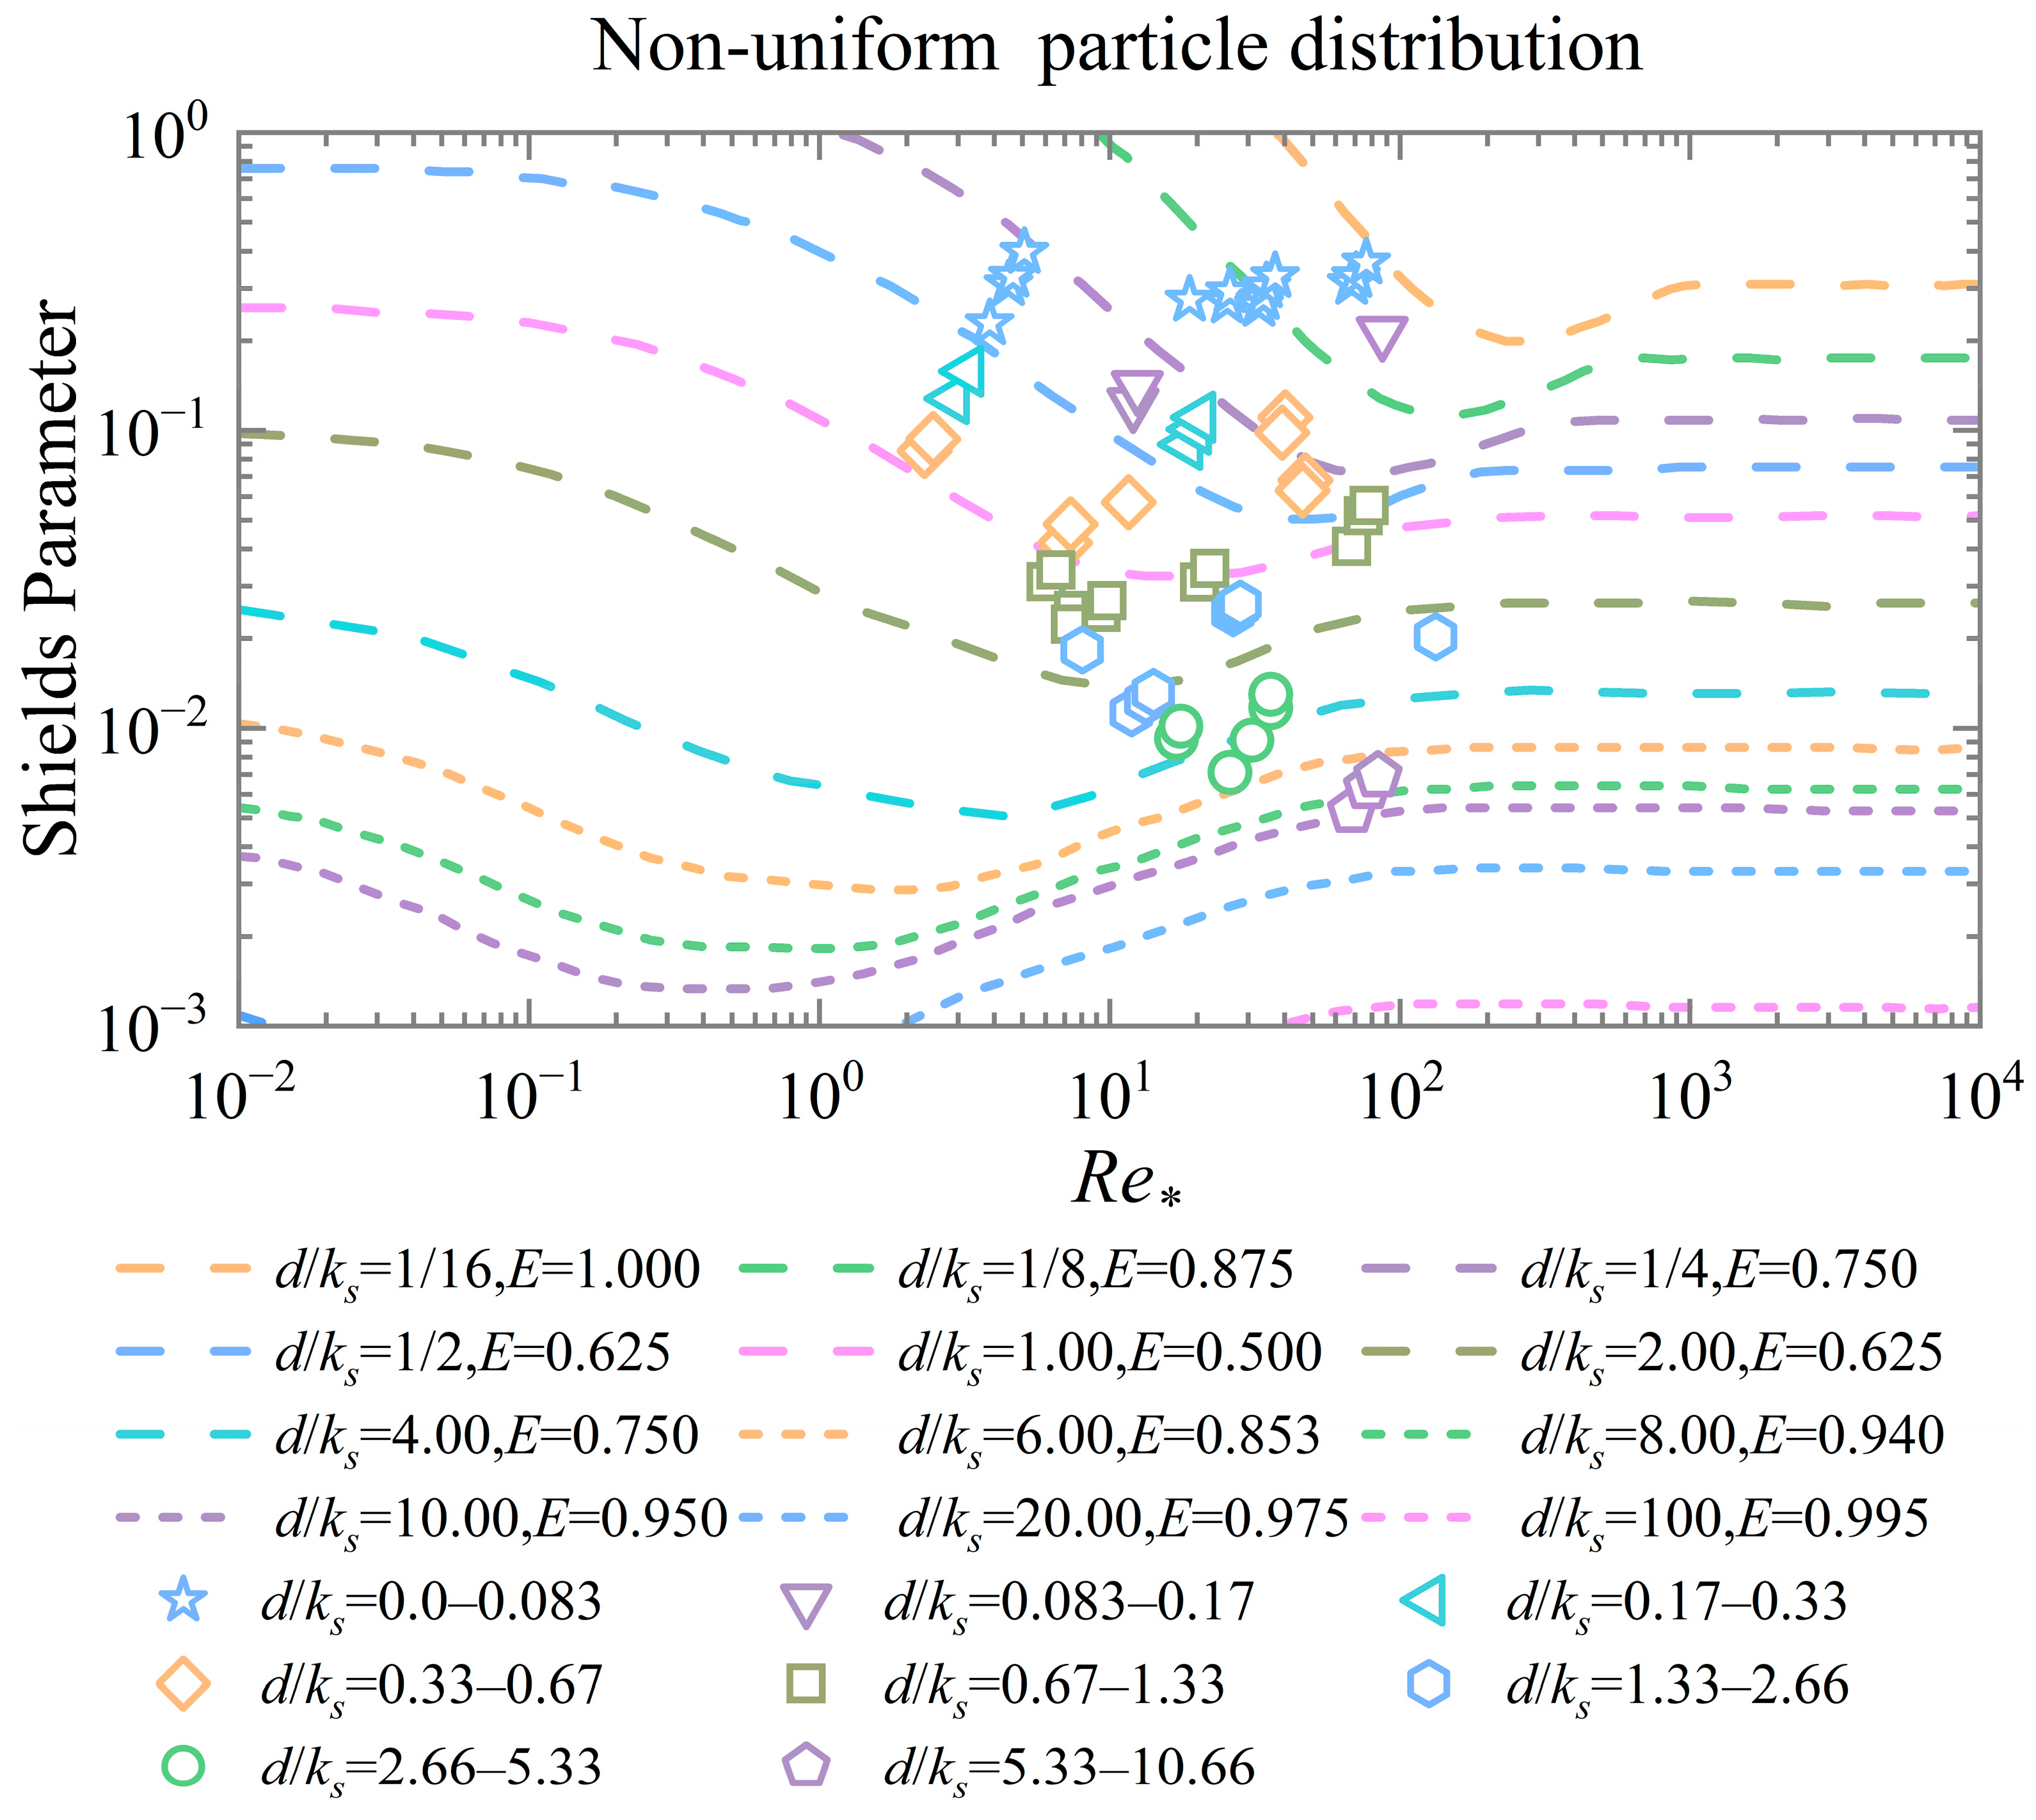
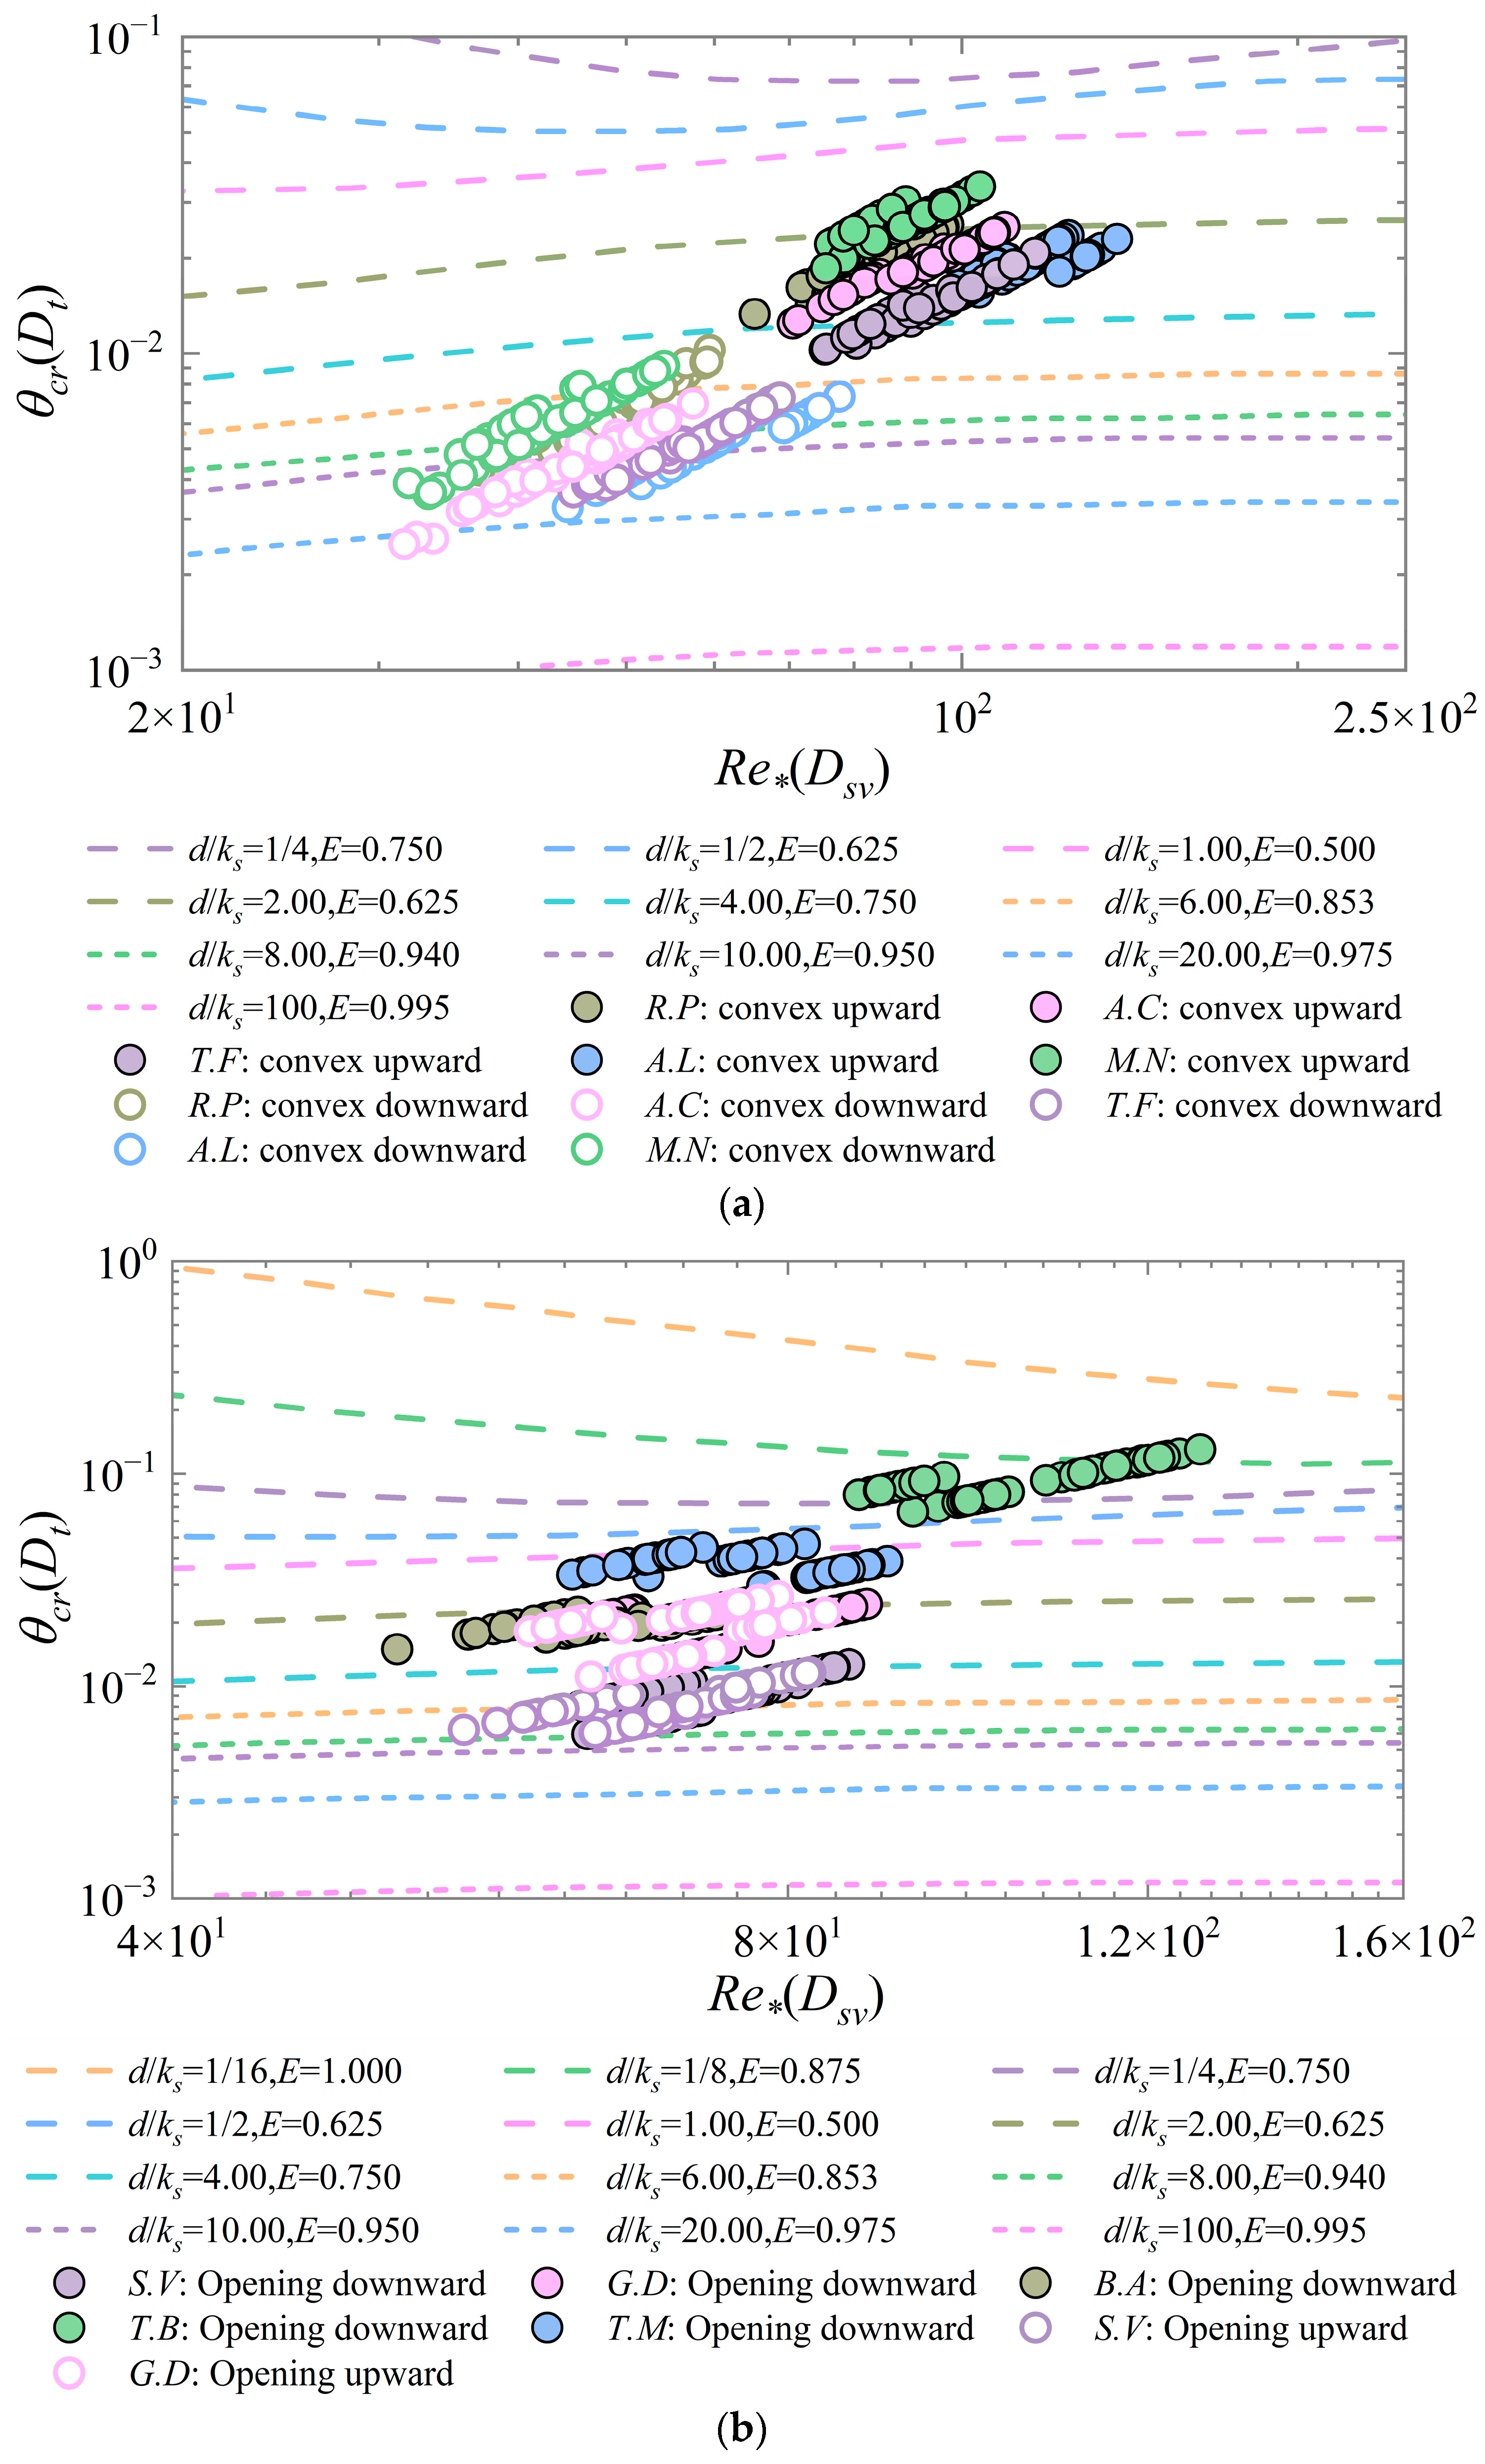
The Shields diagram obtained in this study was based on the Shields diagram used by Miedema et al. [
9] and Ramsdell et al. [
10], where individual bivalve shells had a higher threshold for motion in the convex upward position than in the convex downward position (
Figure 12a). Previous studies [
8,
14,
15,
17] have summarized the same conclusion by comparing the motion threshold flow velocities. By comparison, bivalve shells were found to have slightly higher overall Shields parameters in the convex upward position than the gastropod shells. For gastropod shells with an approximate conical shape (e.g.,
T.B and
T.M), the trend of the critical Shields parameters does not satisfy the rule of change of the Shields curve (
Figure 12b), so using the thickness as the characteristic diameter of this kind of gastropod shells to calculate the critical Shields parameters is not a desirable method, and it has certain limitations. In this paper, the use of direct velocity measurements to assess bed shear stress provided more accurate results. However, Dey [
15], Dey [
8], and Diedericks et al. [
17] estimated the critical flow velocities by utilizing equations relating flow to flow cross-section area, which may underestimate the critical value of bed shear stress.
For bivalves, Futterer [
27] provided generalized tables showing that the entrainment threshold velocities for bivalve shells in the convex upward positions were overall 2–3 times greater than those in the convex downward positions. However, factors such as the roughness of the shell surface and different final orientations could cause this ratio to vary. These influences were also taken into account in the selection of the experimental shells in this study, which ultimately yielded incipient mean velocities that were about 1.4–2.8 times larger in the convex upward position than in the convex downward position. Olivera et al. [
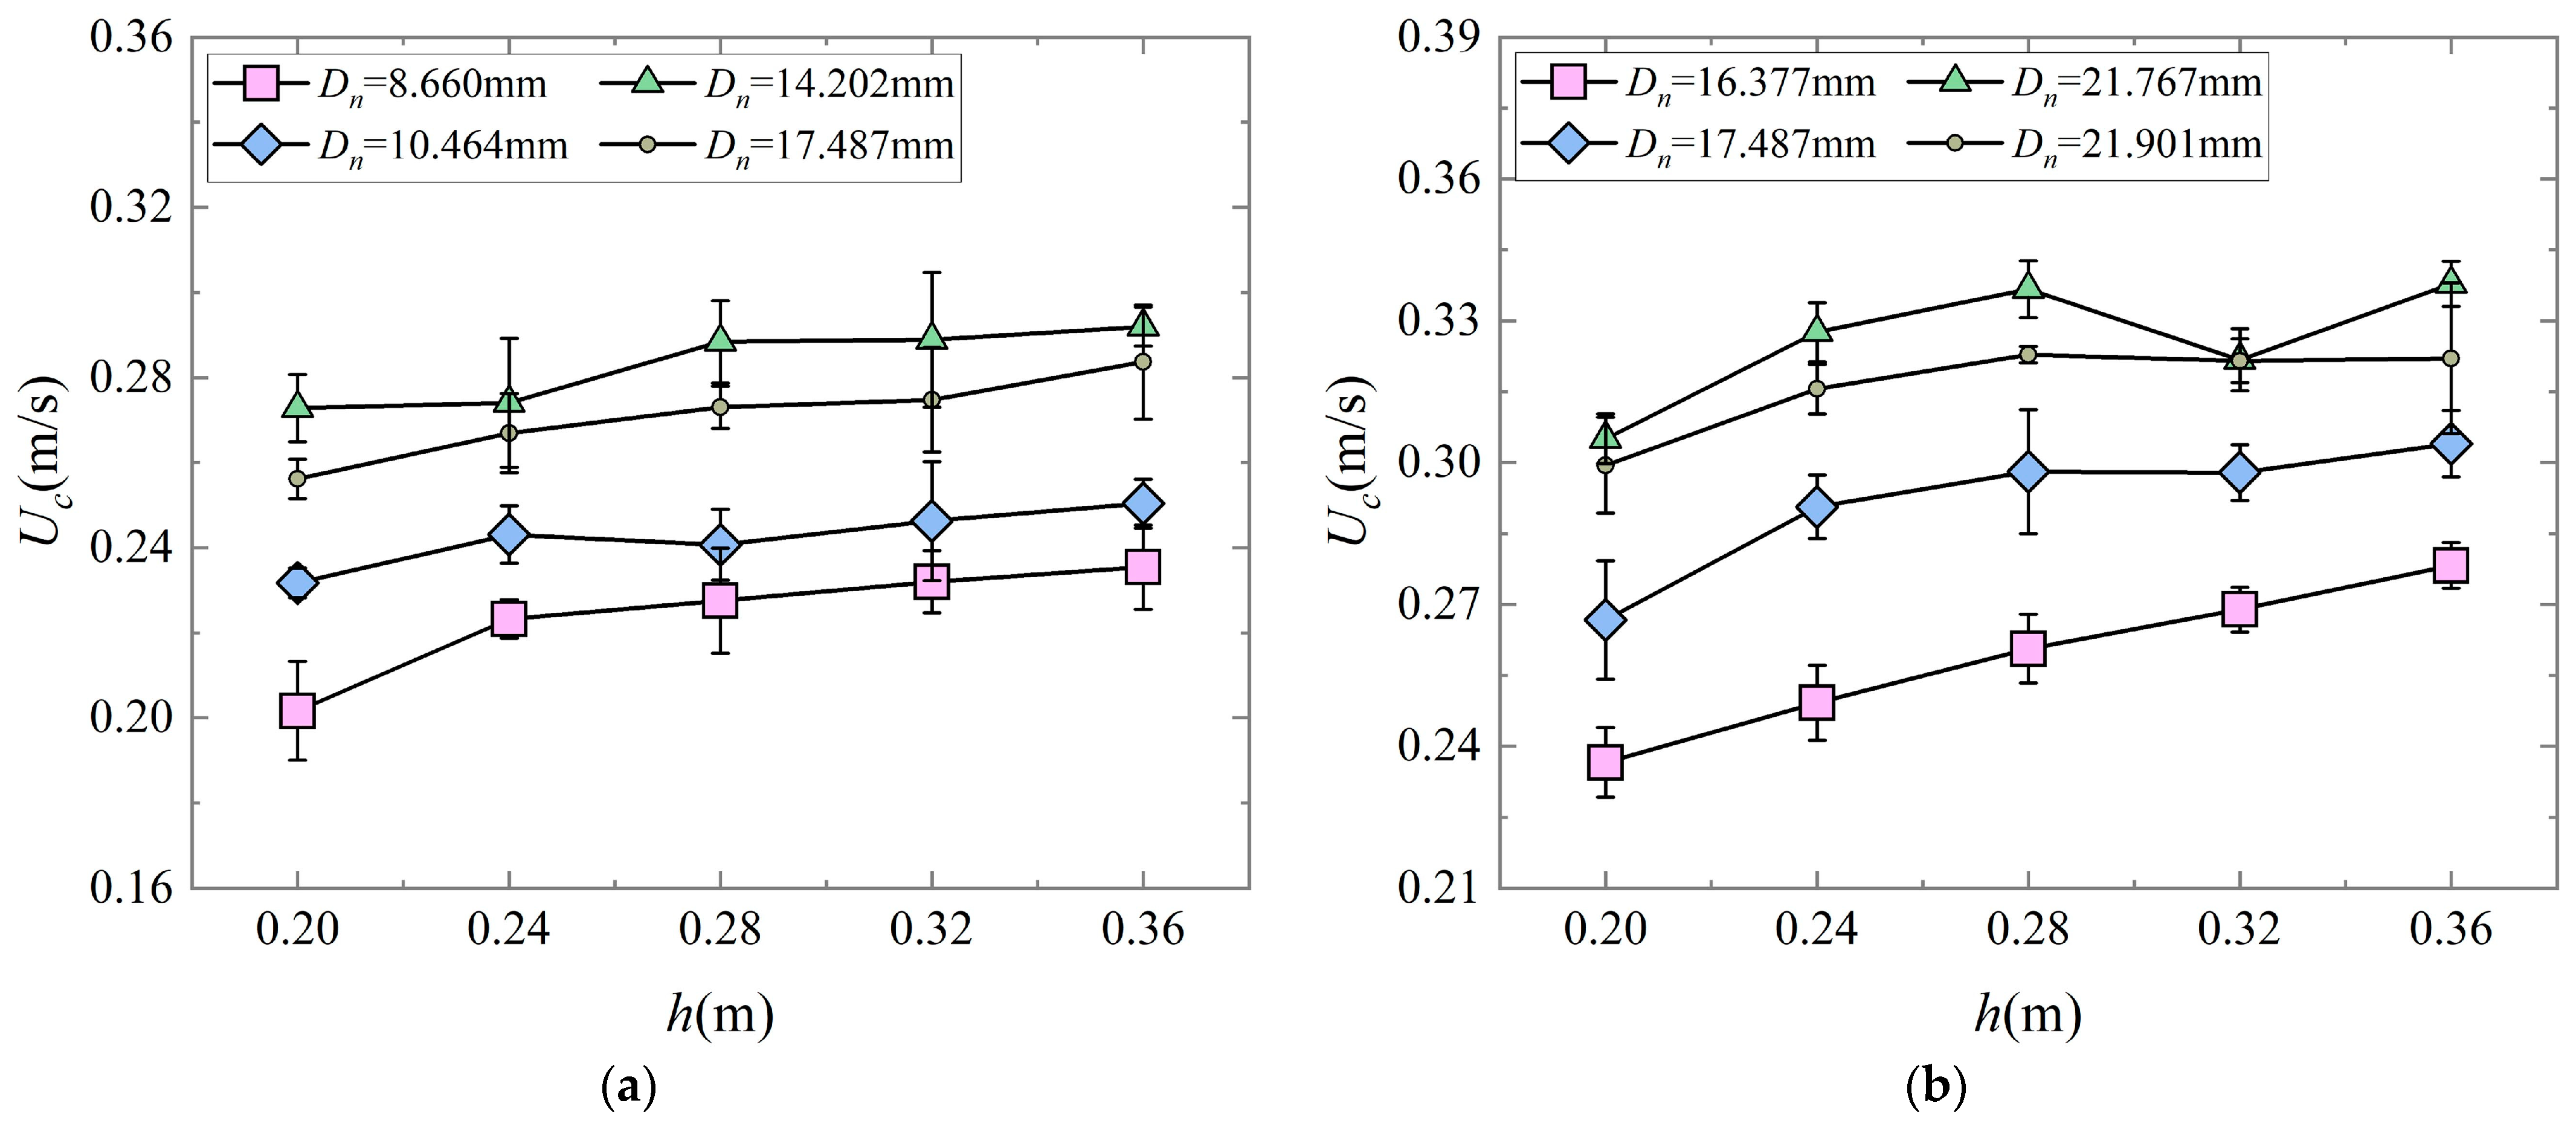
18] suggested that shells with large projected and frontal areas were more easily transported. In this study,
B.A 4# had lower incipient motion thresholds than 3#, but the overall incipient motion thresholds of 2# were still higher than those of 1# (
Figure 13a). Therefore, it is necessary to propose the conditions for shells to first reach the motion threshold, which are not only related to the projected area and frontal area but also the effect of the shell’s shape and mass. Due to the irregular shape of the shells, the transport mechanism of the shells was different from that of quartz and coral sands, and therefore the incipient mean velocities of the shells could not be calculated using the traditional sediment motion threshold flow velocities equations. However, previous studies [
8,
15,
16,
17] have only considered a single final orientation direction, and the relevant motion threshold equations obtained may not be applicable to shells with different final orientations. The application of the basal projected area as well as the frontal projected area as relevant parameters describing the final orientation direction to the motion threshold flow velocities equations will greatly improve the applicability to all types of shells. It provides important significance for the coral sand coastal protection and evolution studies as well as to the study of the motion of shell sediment. However, for some coastal areas, shells are the main sediment. The direction of subsequent experimental research can focus on the movement threshold pattern of multiple shells, and propose a parameter that can measure the surface roughness of shells (such as
T.F and
A.L), this parameter can be used to further improve the formula for calculating the incipient mean velocity.
In addition to these, the characterization of shell motion under current is only an early study in this field, whereas in coastal environments, waves and currents can occur simultaneously, which can lead to more complex current conditions. As Zhang et al. [
44] mentioned, the logarithmic mean velocity profile is altered when waves are superimposed onto a turbulent current. When waves are propagating with (against) the current, velocities increase (decrease) in the vicinity of the bed and decrease (increase) near the free surface, and these hydraulic conditions may lead to a larger change in the way shells move compared to the present study. In combination with the wave-current interactions mentioned in the paper by Marino et al. [
45], conditions such as waves following and opposing the current direction, in the presence of nonlinear waves and in the presence of rough beds or fixed bedforms can also occur. Placing shells under these conditions separately will yield more useful information, which provides an important reference for subsequent studies on the motion characteristics of shells under wave-current coexistence conditions.
6. Conclusions
In the first part of the experiment, four initial orientational motions were observed in six bivalve shells and five gastropod shells at a 0.32 m water depth, and five sets of repeated experiments were carried out for each shell’s initial orientational motion, for a total of 400 sets of experiments. In the second part of the experiment, 510 unidirectional constant-current tests were conducted on five bivalve shells, divided into four sizes, and five gastropod shells, divided into four sizes, under five experimental water depth conditions to obtain 1020 sets of experimental data. The following conclusions can be drawn from the analysis:
- (1)
During the repetitive orientation movements of the experimental shells, it was found that shells of the same species had the same final orientation as a high probability event, and the counting of the number of orientations yielded that not all species of shells had the same orientation.
- (2)
From the graph of the shape coefficient β versus the area diameter, it was determined that the range of variations of β between shells of the same species were not very large. It was also determined that the β values of the experimental samples of the gastropod shells were higher than those of the bivalve shells as a whole.
- (3)
The incipient mean velocities of the bivalve shells were about 1.4–2.8 times greater in the convex upward position than in the convex downward position. For gastropod shells with distinguishable opening orientations, the incipient mean velocities of the shells with opening downward positions were about 1.0–1.2 times greater than those with opening upward positions. At the same time, for some gastropod shells, it may not be a good method to calculate the Shields parameters by using the shell thickness as a measure of its size characteristics. The overall average Shields parameters of the bivalve shells in the convex upward positions were slightly larger than those of the gastropod shells.
- (4)
The final orientations observed in the first part of the experiment were taken as the initial orientations for the motions of the shells in the second part of the experiment. By considering the frontal projection area and the basal projection area in the process of fitting the velocity data, incipient mean velocity and critical shear stress equations were obtained, which were able to better describe the process of the incipient motion of the shells of both bivalves and gastropods.
In this paper, the motion thresholds of different types of shells under the action of water currents at different water depths were investigated. In the future, consideration should be given to the shell surface roughness factor in the motion velocity threshold equations, and an in-depth study should be conducted on the hydrodynamic mechanism of how the final orientation occurs in the motion of shells.

 ,
, 

