Article

Folate-Mediated One-Carbon Metabolism in the Crustacean Copepod Calanus finmarchicus: Identification of Transcripts and Relative Expression across Development

by
Daniela Ascione
1,†,
Ylenia Carotenuto
1,†,
Chiara Lauritano
2 and
Vittoria Roncalli
1,*
1
Integrative Marine Ecology Department, Stazione Zoologica Anton Dohrn, Villa Comunale, 80121 Napoli, Italy
2
Eco-Sustainable Marine Biotechnology Department, Stazione Zoologica Anton Dohrn, Via Acton 55, 80133 Naples, Italy
*
Author to whom correspondence should be addressed.
These authors contributed equally to this work.
J. Mar. Sci. Eng. 2024, 12(5), 786; https://doi.org/10.3390/jmse12050786
Submission received: 8 April 2024 / Revised: 2 May 2024 / Accepted: 5 May 2024 / Published: 8 May 2024
(This article belongs to the Section Marine Biology)

Abstract

:
Folate, also known as vitamin B9, plays a crucial role in the one-carbon (1C) metabolism, a conserved pathway from microbes to humans. The 1C metabolism, consisting of the folate and methionine cycles, is essential in many biological processes such as nucleotide and protein biosynthesis, cell proliferation, and embryonic development. Despite its functional role, little is known about the 1C metabolism in crustaceans. As part of an ongoing effort to characterize important pathways in Calanus finmarchicus, the biomass-dominant zooplankton in much of the North Atlantic Ocean, we identified transcripts encoding the 1C metabolism enzymes. Using an in silico workflow consisting of a transcriptome mining, reciprocal blasts, and structural analyses of the deduced proteins, we identified the entire set of enzymes in both cycles. The majority encoded for full-length proteins and clustered with homologs from other species. Stage-specific expression was reported, with several transcripts showing high expression in the naupliar stage (e.g., 10-FTHFD, SHMT2) while some methyltransferases (e.g., BHMT, SHMT, DNMT) were more expressed in adults. Overall, this study provides a set of genes which can be used as potential biomarkers of development and reproduction and can be tested in other zooplankters to assess ocean health status monitoring.

1. Introduction

Folates, also known as vitamins B9 in the most oxidized form, are a group of structurally related water-soluble nutrients composed of a pterin heterocyclic ring, a p-aminobenzoic (pABA) acid, and a chain of mono- or poly-glutamate moieties. Plants, several microorganisms, and few protozoans can synthesize folates de novo, whereas animals must acquire them through the diet [1,2]. Folates play a crucial role in the one-carbon (1C) metabolism, a conserved pathway from microbes to humans, essential for many biological processes and cellular functions such as nucleotide biosynthesis, protein synthesis, epigenetic modification of DNA, cell proliferation, and embryonic development [3,4,5]. The 1C metabolism consists of two interconnected enzymatic pathways: the folate cycle and the methionine cycle. The folate cycle starts with the interconversion of the derivatives of tetrahydrofolate (THF), the reduced active form of folate that acts as a cofactor in the transfer of 1C units from donors to acceptors, in a series of enzymatic steps involved in serine–glycine interconversion, purine and pyrimidine biosynthesis, and protein synthesis. The methionine cycle includes the biosynthesis of methionine and turnover of S-adenosyl-methionine (SAM), the universal methyl donor for most methyltransferases [5].
The 1C metabolic pathways and their enzymes have been thoroughly elucidated in eukaryotes over recent decades, mainly in plants and humans [2,5]. As shown in Figure 1, the folate cycle in metazoans consists of 12 enzymes. The first enzyme, serine hydroxymethyltransferase (SHMT), transfers a C1 unit to THF to produce 5,10-methylene-tetrahydrofolate (5,10-methylene-THF). This compound is the donor substrate of the 1C unit to the enzyme thymidylate synthase (TYMS) for the pyrimidine biosynthesis and consequent oxidation of 5,10-methylene-THF into dihydrofolate (DHF); this latter compound is regenerated in THF via the enzyme dihydrofolate reductase (DHFR). The enzyme C1-THF synthase (from now referred to as MTHFD1) controls the C1 unit interconversion between 5,10-methylene-THF,10-formyl-THF (precursor of purine synthesis) and THF. MTHFD1 is a tri-functional cytosolic enzyme that determines the activities of 10-formyl-tetrahydrofolate synthetase, NADP-dependent methenyl-THF cyclohydrolase, and methenyl-tetrahydrofolate cyclohydrolase. Mammals also have a bi-functional mitochondrial enzyme encoded by the nuclear gene MTHFD2, with NADPH-dependent methylene–tetrahydrofolate dehydrogenase and methenyl-tetrahydrofolate cyclohydrolase activities. Similar to MTHFD1, the enzyme formyl-THF dehydrogenase (10-FTHFDH) oxidizes 10-formyl-THF back into THF. Meanwhile, the 5,10-methylene-THF is reduced by the enzyme methylenetetrahydrofolate reductase (MTHFR) into 5-methyl-THF, which is then transformed in THF by the enzyme MTR, which links the folate and the methionine cycles. Other enzymes of the folate cycle include (1) methionyl-tRNA formyltransferase (MTF), which catalyzes the transfer of the C1 unit from 10-formyl-THF to methionil-tRNA and, thus, links the pathway to protein synthesis; (2) aminomethyltransferase (AMT) which catalyzes the reaction production to 5-formyl-THF, a regulator of C1 metabolism; (3) the bi-functional enzyme formimidoyltransferase-cyclodeaminase (FTCD) which regenerates THF from 5-formyl-THF, and, lastly, (4) 5-formyl-THF cycloligase (5FCL) which converts this intermediate back into the active form 5,10-methenyl-THF (Figure 1). The methionine cycle consists of fewer enzymes: (1) 5-methyl-THF homocysteine methyltransferase (MTR) which transfers the methyl group from 5-methyl-THF to homocysteine (Hyc), producing methionine (Met); (2) methionine adenosyltransferase (MAT), which produces the universal methyl group donor S-adenosylmethionine (SAM); (3) DNA methyltransferase (DNMT) which catalyzes the transfer of the methyl group to substrates, such as DNA, generating S-adenosylhomocysteine (SAH); (4) glycine N-methyltransferase (GNMT) which also converts SAM back into SAH, and, lastly (5) adenosylhomocysteine hydrolase (AHCY), which regenerates Hyc for the cycle. Alternatively, Met can be produced from Hcy through the enzymes betaine-homocysteine S-methyltransferase (BHMT) and homocysteine S-methyltransferase 3 (HMT) (Figure 1).
In vertebrates, alterations of the 1C metabolic network due to poor folate supply, enzymatic dysfunction, and/or the presence of single nucleotide polymorphisms (SNPs) in folate-coding genes have been unequivocally linked to reduced growth, neural tube defects (NTDs), and developmental abnormalities [5,6,7,8]. Conversely, little is known about the influence of folate-dependent metabolism in cellular and biological processes in arthropods. Exposure of the fruit fly Drosophila melanogaster to the drug methotrexate, a synthetic folate analog that inhibits DHFR, has been reported to induce leg and wing deformities in the surviving progeny [9,10]. Those findings agree with early observations in Artemia sp. brine shrimps, where blockage of the enzymes DHFR and TYMS resulted in larval teratogenesis and abnormal embryonic development [11]. More recently, altered expression of genes involved in the folate and methionine cycles has been associated with transgenerational developmental defects in the crustacean copepod Calanus helgolandicus exposed to the cytotoxic phytoplankton species Skeletonema marinoi [12]. To date, this study represents the most complete investigation of genes involved in folate metabolism in a crustacean however there are still open questions on the presence/absence, diversity, and role of the folate metabolic genes in other copepod species.
Thus, the aim of the present study was to characterize the enzymes involved in the 1C metabolism in the congener calanoid copepod C. finmarchicus, one of the most abundant calanoid copepods in the North Atlantic, representing a key grazer of phytoplankton and key prey for commercially important forage fish and shellfish, and for several critically endangered marine mammals in the Gulf of Maine [13,14]. In recent decades, the availability of high-quality molecular resources (e.g., mitochondrial genomes and transcriptomes) for this copepod has enabled the characterization of genes involved in key processes such as diapause, oogenesis, lipid metabolism, and detoxification pathways [15,16,17,18,19]. Furthermore, for genes involved in neurochemical signaling systems [20,21], photoreception [22], chemical communication (chemosensory related genes) [23], and detoxification [17,24,25], relative expression across different stages of development has also been characterized, allowing the prediction of their potential function in this copepod. Here, using a well-established in silico workflow, we mined the high-quality C. finmarchicus reference transcriptome [16] to identify transcripts encoding enzymes involved in the folate and methionine cycles. Additionally, RNA-Seq data available from six C. finmarchicus developmental stages (embryo, early nauplius, late nauplius, early copepodite, late copepodite, and adult female) were used to map the developmental expression of the enzymes in this species and to gain more insight on their functions.

2. Materials and Methods

2.1. In Silico Mining for Transcripts Encoding Enzymes Involved in the One-Carbon Metabolic Pathway

Searches for putative transcripts encoding enzymes involved in the folate and methionine cycles in C. finmarchicus were performed using a well-established vetting workflow that included a transcriptome mining step, a reciprocal BLAST step to confirm protein identity, and a protein structural domain step [25,26]. Based on the reference literature, we searched a total of 12 and six enzymes, respectively, in the folate and methionine cycles (see Figure 1). For each enzyme, query sequences of the copepod Eurytemora affinis (eaf), used as reference organism, were obtained from the Kyoto Encyclopedia of Genes and Genomes (KEGG) database. The E. affinis sequences were used to mine the transcriptome shotgun assembly (TSA) database from the National Center for Biotechnology Information (NCBI) limiting the searches to C. finmarchicus transcriptome (PRJNA236528) (search date October 2022). The resulting transcripts were fully translated using ExPASY (online version, search date October 2022) and reciprocally blasted against the NCBI non-redundant (nr) protein database (blastp algorithm). The presence of the expected protein structural domain (based on the query sequences) was examined using SMART software [27]. In cases where multiple transcripts were identified for the same query, amino acid sequences were aligned using MAFFT software [28] (online version, search date January 2023), and amino acid identity was calculated between pairs. Sequences with amino acid identity ≥95% were considered the same protein and the longest transcript from among them was kept.

2.2. Cladogram of Calanus finmarchicus Transcripts Encoding Enzymes Involved in the Folate and Methionine Cycles, with Other Marine Organisms

A phylogenetic analysis was performed for the C. finmarchicus transcripts identified in this study, to confirm their annotation and to establish their relationships with each other and other marine organisms. Unrooted phylogenetic trees were separately generated with amino acid sequences from the folate and the methionine cycles, including sequences from the branchiopod Daphnia pulex (water flea), the decapods Penaeus vannamei, P. chinensis, and Homarus americanus, the amphipod Hyalella azteca, and the copepods E. affinis and Lepeophtheirus salmonis. Sequences from D. melanogaster and Homo sapiens were included as outgroups. All sequences were downloaded from the KEGG database. All amino acid sequences were initially aligned using ClustalW software (Galaxy version 2.1, default settings) and then, a maximum-likelihood phylogenetic tree was built using the evolution model JTT+ CAT (FASTTREE, Galaxy version 2.3.2) with bootstrap values computing bootstrapping for 10,000 samples (RapidNJ Kimura evolution model, Galaxy version 2.3.2). Cladograms were visualized using the software FigTree (v. 1.4.4).

2.3. Expression of Calanus finmarchicus Transcripts Encoding Enzymes across Development

Relative expression of transcripts encoding for enzymes involved in the folate and methionine cycles across the development of C. finmarchicus was examined using a pre-existing RNA-Seq dataset [29]. The dataset included six different developmental stages: embryos, early nauplii (NII–NIII), early copepodites (CI), late copepodites (CIV and CV), and adult females, with three biological replicates each (except CI and CIV, with two replicates). Briefly, adult C. finmarchicus and pre-adult CV copepodites were collected from the Gulf of Maine (Mount Desert Rock, 2012); wild-caught females were maintained in the laboratory to obtain the target stages: embryos, early nauplii (NII–NIII), early copepodites (CI), and late copepodites (CIV). All samples contained multiple individuals ranging in number from three (e.g., adult females, CVs) to 500 (e.g., embryos). For each stage, total RNA was extracted from three biological replicates (two for CI and CIV), and cDNA libraries were multiplexed and sequenced on an Illumina HiSeq 2000 platform (PE 100 bp) [29]. The expression rate was quantified by mapping each RNA-Seq library against the C. finmarchicus reference transcriptome (NCBI: PRJNA236528) using BOWTIE software (v.2.0.6) [30]. For all transcripts, expression was then normalized using the reads per kilobase per million mapped reads (RPKM) method [31]. Statistical significance for each transcript was tested using one-way ANOVA (p < 0.05) followed by a post hoc Tukey’s test with multiple comparisons correction (Graph Pad Prism v. 10.2).

3. Results

3.1. Identification of Calanus finmarchicus Transcripts Encoding Enzymes in the Folate Cycle

All twelve enzymes involved in the folate cycle were found in the C. finmarchicus reference transcriptome, using E. affinis as a reference organism. A single C. finmarchicus transcript was identified for each enzyme (Table 1). Reciprocal BLAST confirmed the annotation for all transcripts, with the majority returning their initial query as a top-hit reciprocal BLAST. The other transcripts were highly similar to homologs from the Asian lady beetle Harmonia axyridis, the barnacle Amphibalanus amphitrite, and the Chinese white shrimp Penaeus chinensis (Table 1). All C. finmarchicus putative enzymes included the expected structural domains, suggesting that these transcripts encoded for full-length proteins (Table 1 and Table S1). The only exception was the transcript encoding for the enzyme methionyl-tRNA formyltransferase (MTF), which was identified as a partial sequence for the presence of the formyl_trans_N terminal domain (PF00551) (Table S1).
All six methionine cycle enzymes were found in the C. finmarchicus transcriptome. The enzyme glycine N-methyltransferase (GNMT) resulted in a single transcript (Table 2). Two transcripts were identified encoding the enzymes adenosylhomocysteine hydrolase (AHCY), S-adenosylmethionine synthetase (MAT), and DNA (cytosine-5)-methyltransferase 1 (DNMT), and three transcripts encoding the enzyme betaine–homocysteine S-methyltransferase (BHMT) (Table 2). Reciprocal BLAST for all transcripts confirmed their annotation, with the majority returning their initial query as the top reciprocal BLAST hit. Two transcripts encoding the enzyme DNMT were highly similar to those of P. chinensis and the echinoderm Anneissia japonica and one transcript encoding MAT was highly similar to the enzyme from the isopod Armadillidium nasatum. The expected structural domains, hallmarks of each enzyme, were found in all translated proteins (Table 2 and Table S1).

3.2. Comparison of C. finmarchicus Enzymes in the 1C Metabolism with Other Marine Organisms

To validate the annotation and to examine the relationship with other marine organisms, two phylogenetic analyses were generated for the enzymes involved in the folate and the methionine cycles. Both analyses included C. finmarchicus transcripts encoding enzymes identified in this study and sequences from decapods (P. vannamei, P. chinensis, H. americanus), an amphipod (H. azteca), copepods (E. affinis, L. salmonis), a branchipod (D. pulex), and from the outgroups D. melanogaster and H. sapiens. The unrooted radial tree generated for the sequences involved in the folate cycle resulted in seven clades that were mostly supported by high bootstrap values (bootstrap value > 70), except for one clade for which the bootstrap value was 52 (Figure 2). For each enzymatic class, all predicted C. finmarchicus transcripts clustered with the homologs from the other species corresponding to their annotation. Three clades grouped only sequences belonging to a single enzymatic class: DHFR (bootstrap value 76), FTCD (bootstrap value 90), and MTHFR (bootstrap value 96). The D. melanogaster MTHFR was excluded from this cluster. The other clades grouped sequences from two enzymatic classes: MTF and 10-FTHFDH (bootstrap value 98), MTHFD and AMT (bootstrap value 52). Two other clades divided from a single branch (bootstrap value 79) and separated into two groups: 5FCL and MTR, and SHMT and TYMS. Within the clades that included two enzymatic classes, the separation between the two groups was highly supported, with bootstrap values > 66 (Figure 2).
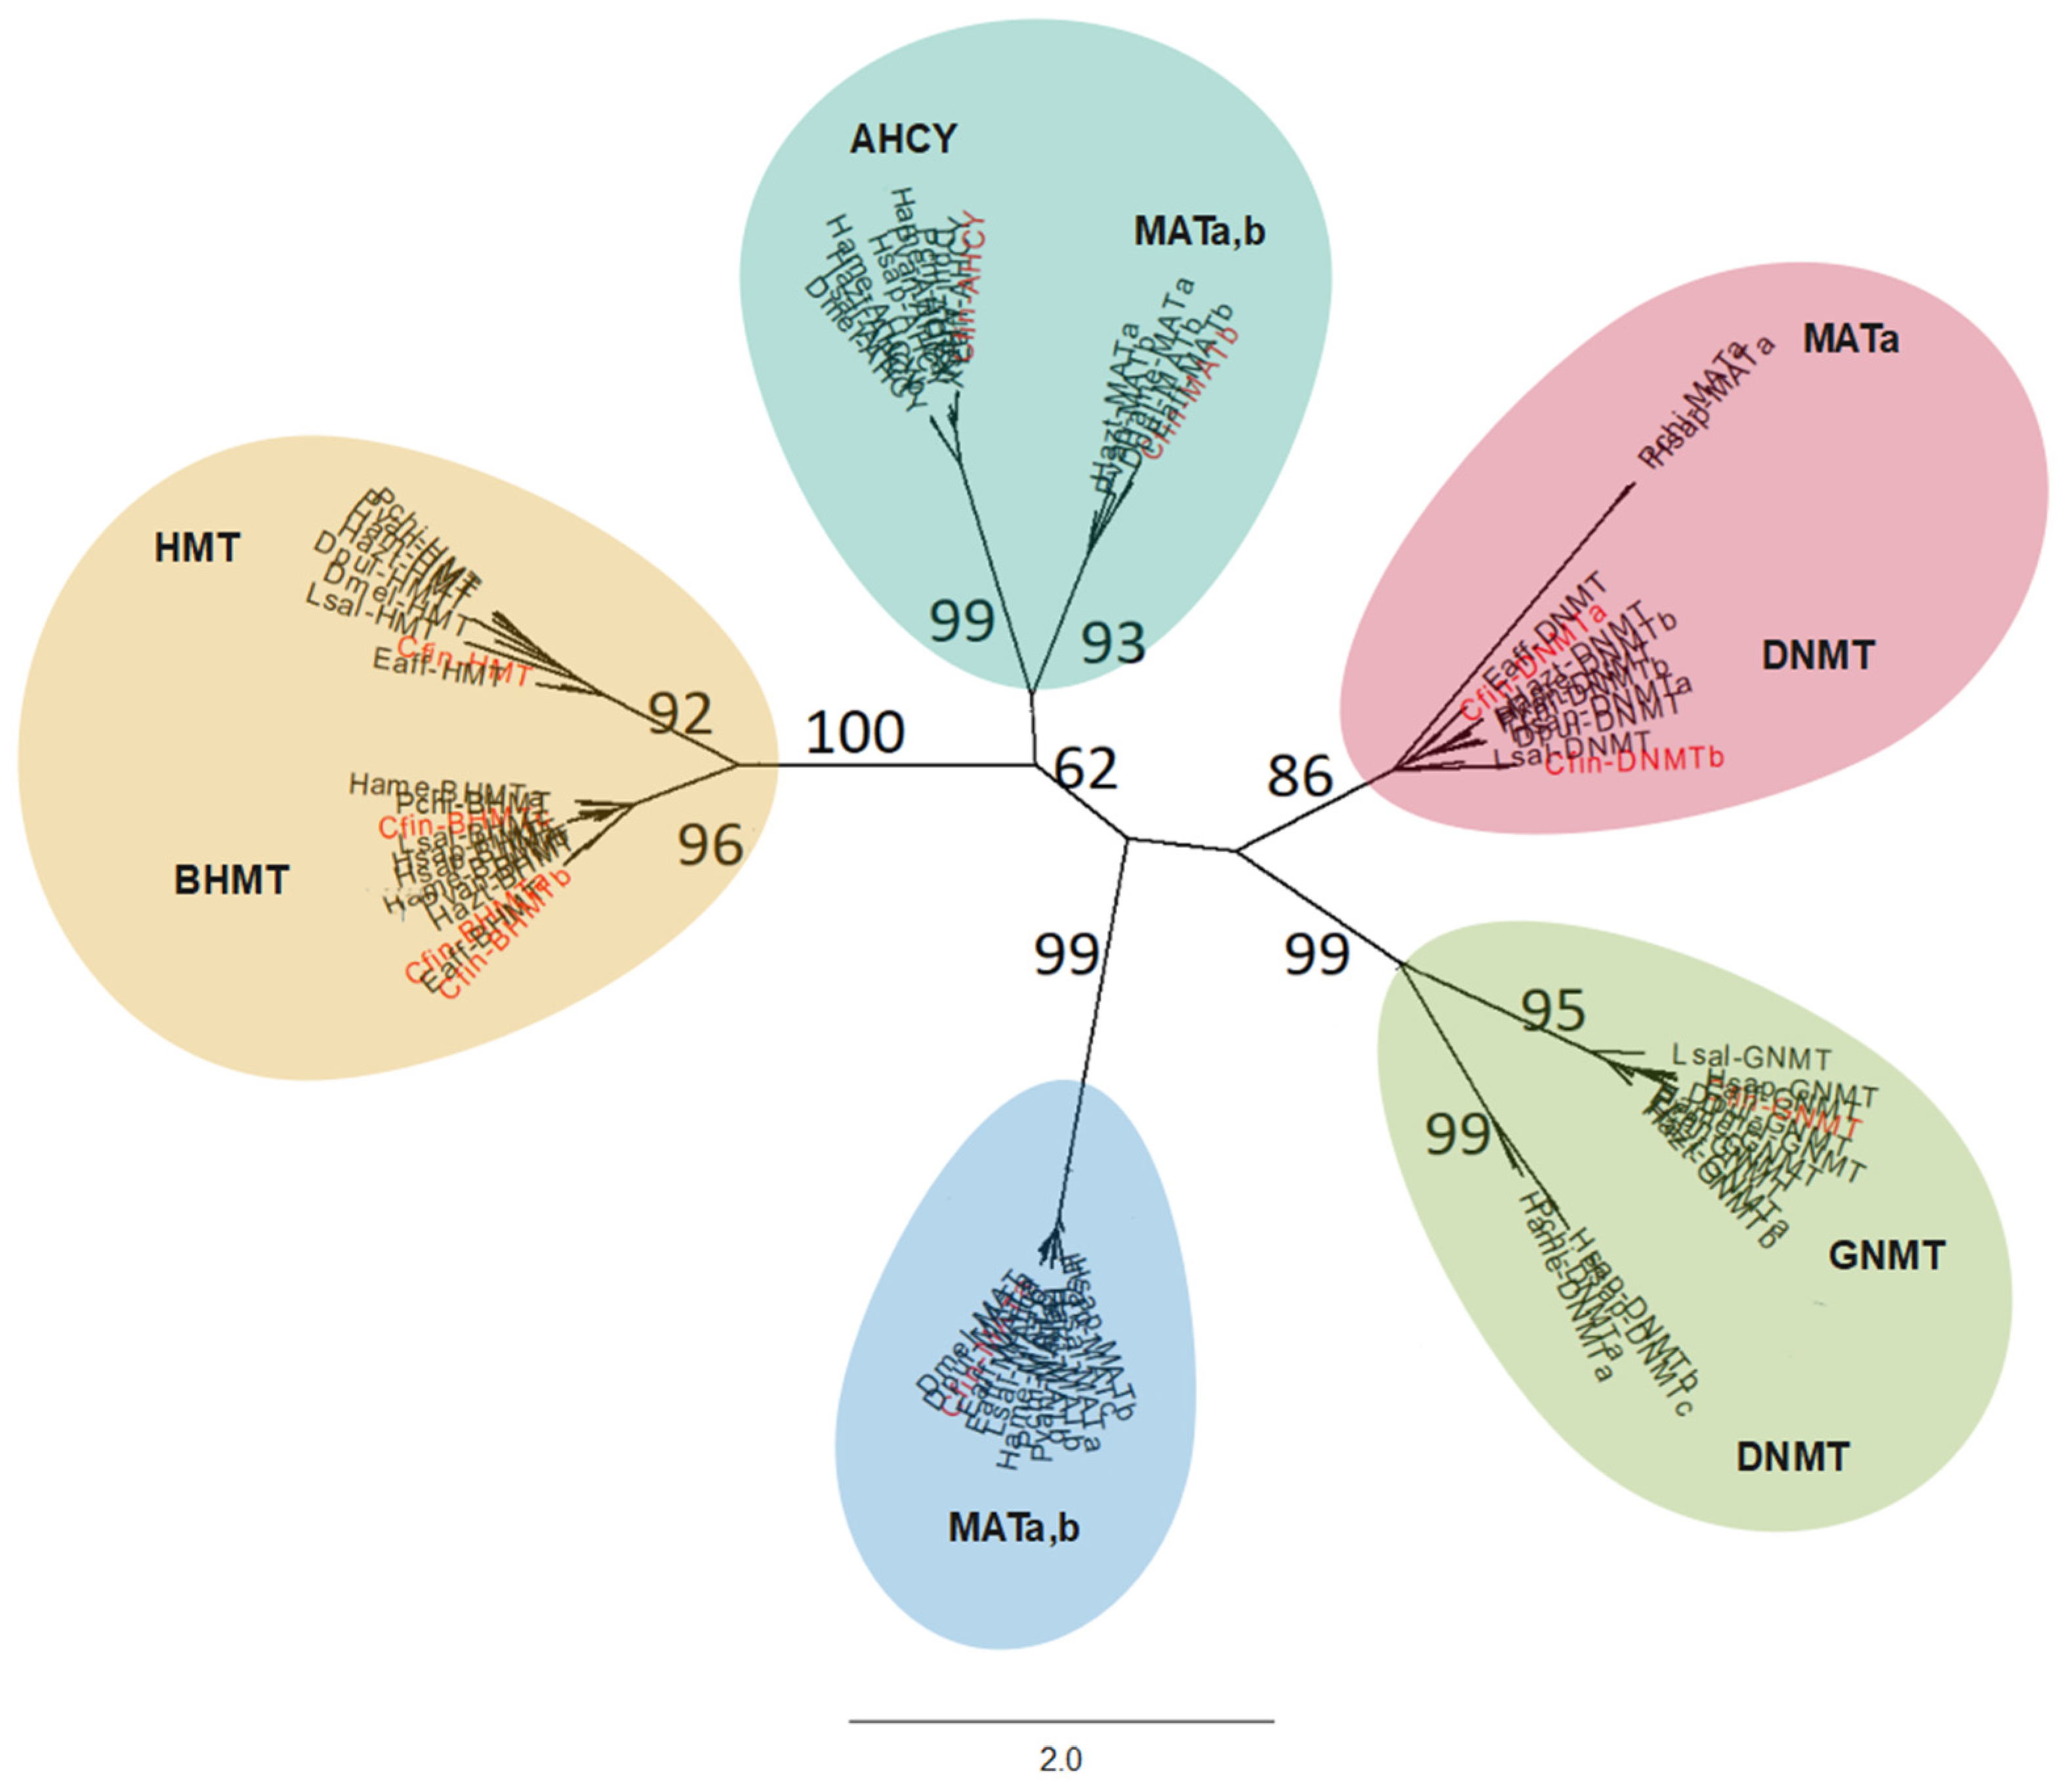
The unrooted radial tree generated for the sequences involved in the methionine cycle consisted of five major clades (Figure 3). All predicted C. finmarchicus sequences clustered with the homologs from other species corresponding to their annotation. Bootstrap values were >86 for all clades except for the clade including AHCY enzymes (bootstrap value 62) (Figure 3). Except for one clade that grouped only sequences encoding the enzyme MAT (bootstrap value 99), the other clades included transcripts encoding for multiple enzymes. However, that MAT clade did not include all MAT sequences (14 out of 22), which were grouped in two other clusters: two MAT sequences from H. sapiens and P. chinensis aggregated with the group DNMT and five MAT sequences (including one of C. finmarchicus transcript) with the group AHCY (Figure 3). In the latter cluster, the separation of the MAT sequences from the AHCY sequences was also highly supported (bootstrap values 93 and 99, respectively) (Figure 3). Also, the sequences encoding the enzyme DNMT were not grouped together; while most of the DNMT sequences (including the C. finmarchicus transcripts) were grouped in one clade, there were others in the clade with the enzyme GNMT (bootstrap value 99) (Figure 3). The separation between the DNMT sequences and the GNMT sequences was highly supported, with bootstrap values 99 and 95 (Figure 3). Lastly, transcripts encoding for the enzyme BHMT clustered in a single group (bootstrap value 100) but its separation was highly supported (bootstrap value 96) (Figure 3).

3.3. Relative Expression of Enzymes across Development

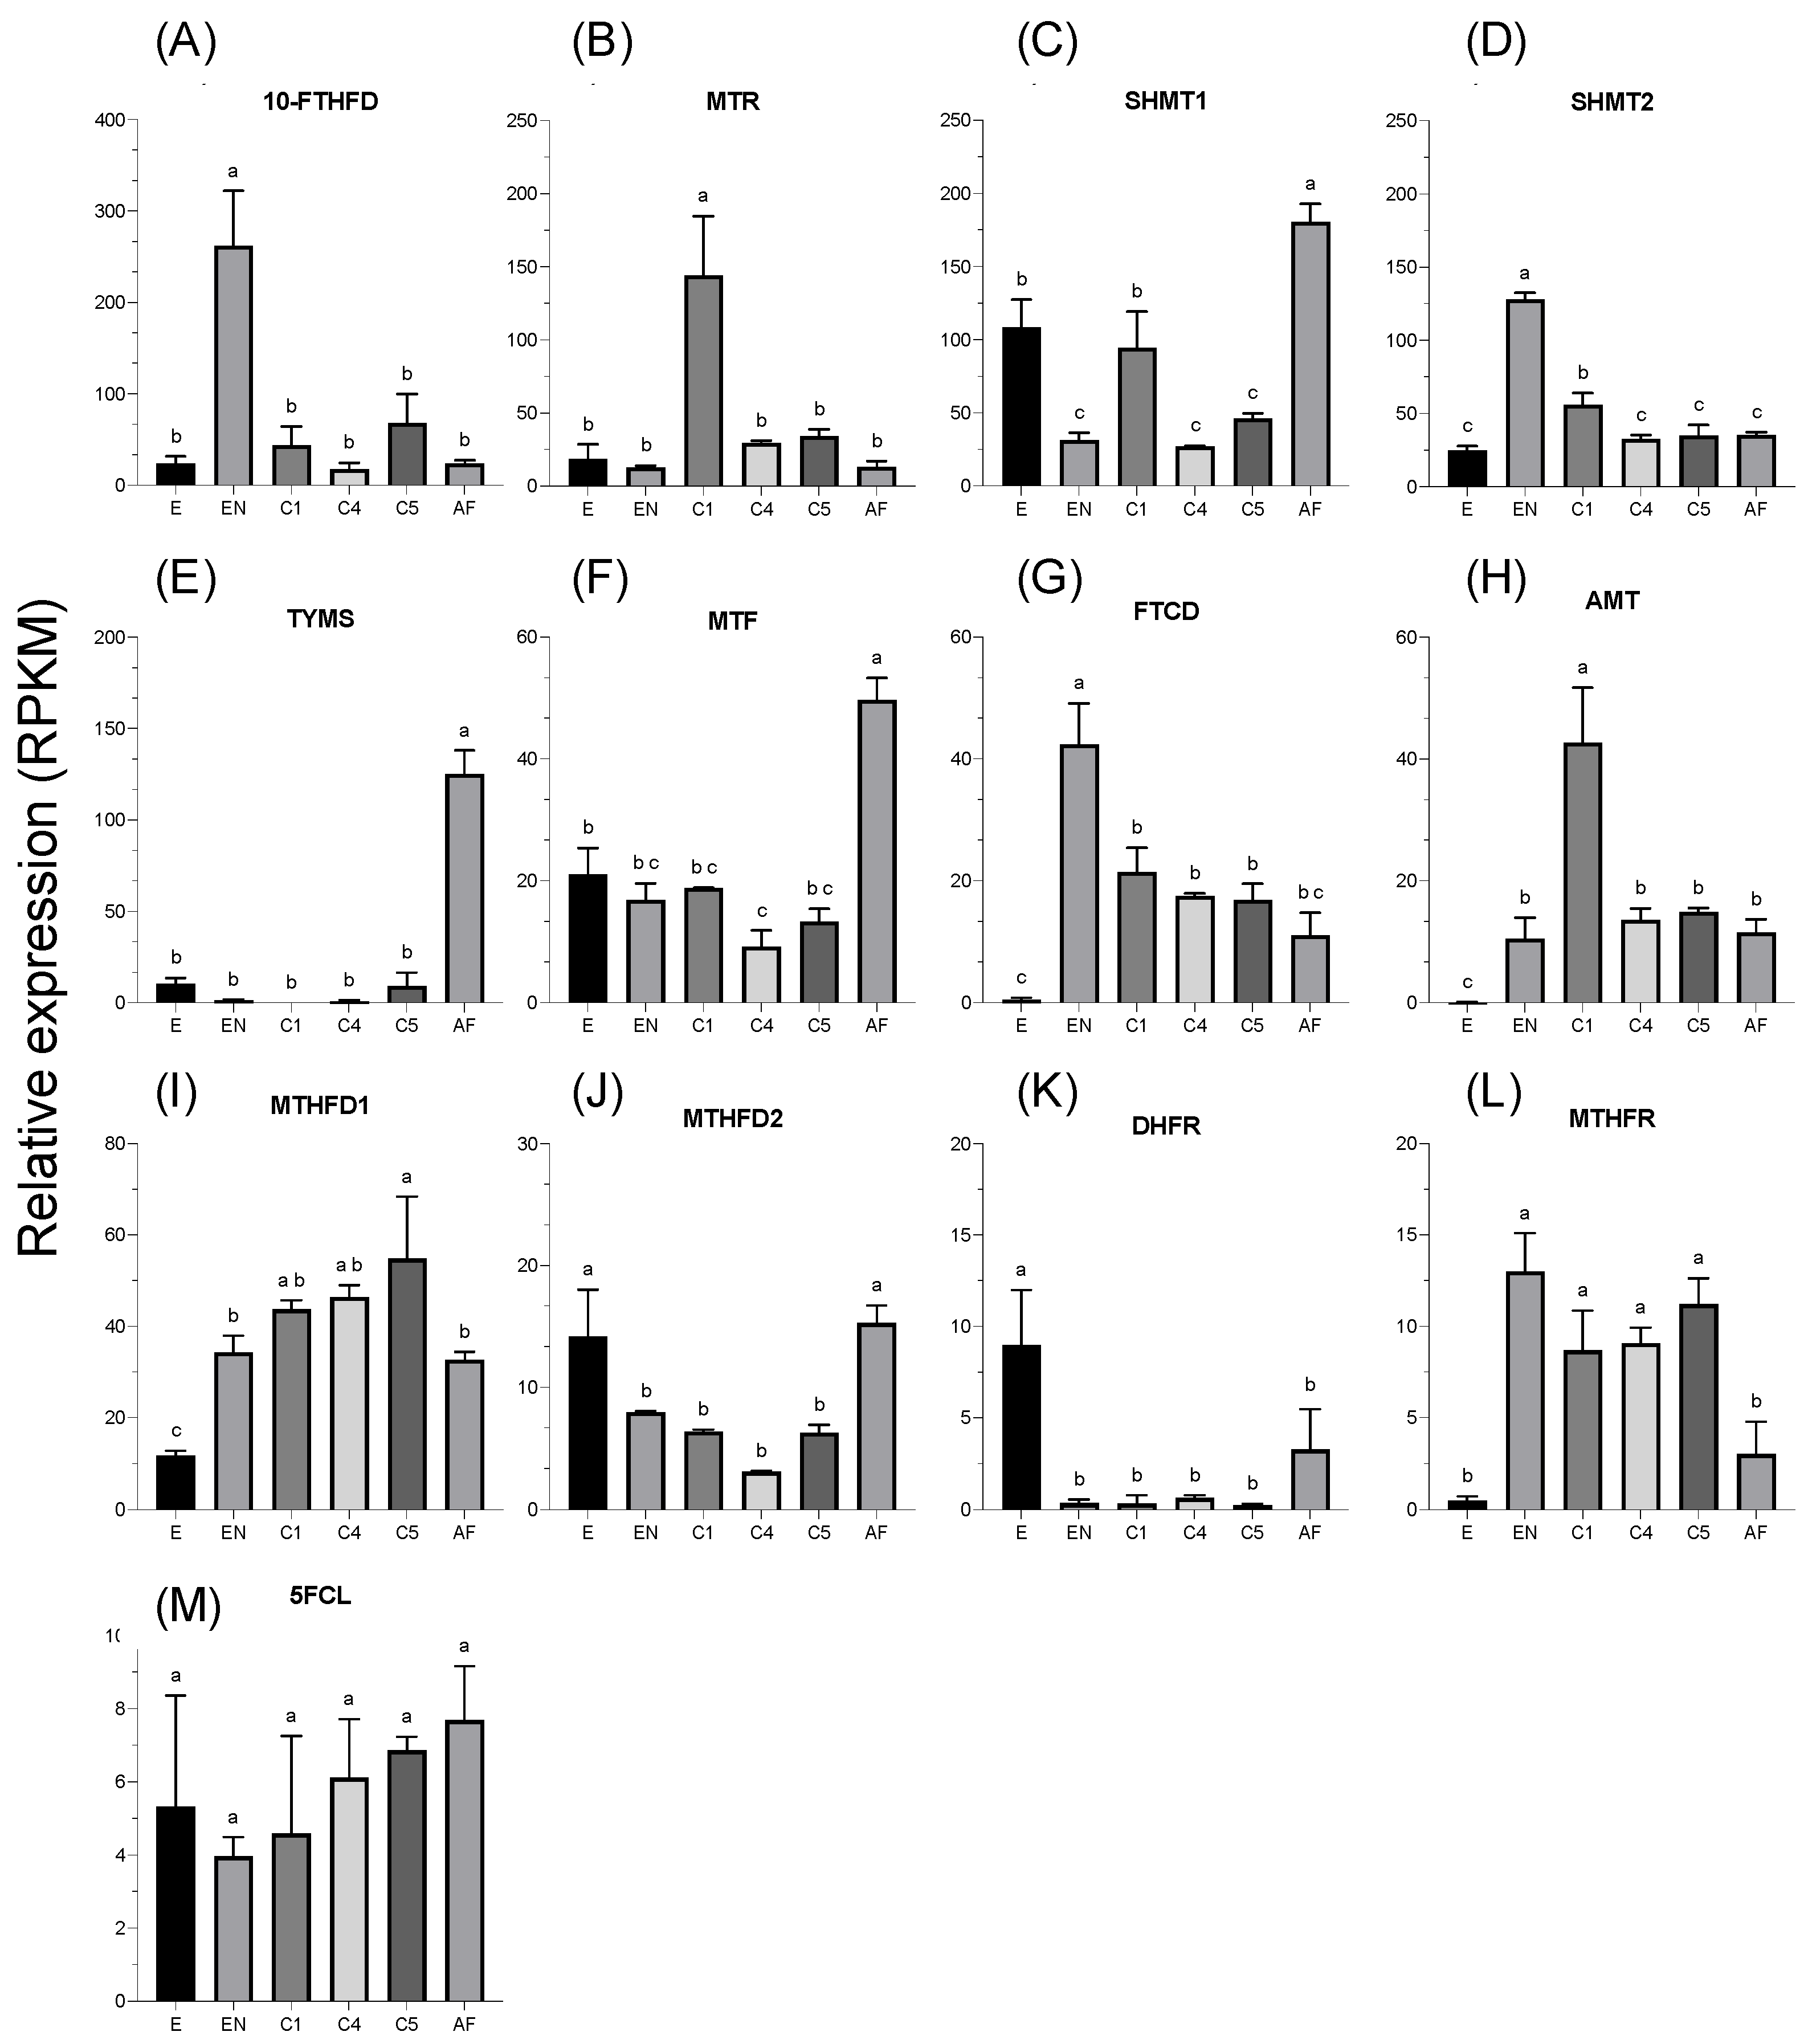
Expression of C. finmarchicus transcripts encoding enzymes involved in folate and methionine cycles was enzyme-specific and changed significantly across the different developmental stages, except in the 5FCL transcript (ANOVA, p > 0.05) (Figure 4). Most of the transcripts in the folate cycle showed relative expression ≤ 50 RPKM at all stages; exceptions were transcripts encoding for 10-FTHFDH (260 RPKM in early nauplius [EN]), MTR (140 RPKM in copepodite 1 [C1]), SHMT1 and SHMT2 (from 95 to180 RPKM in embryo [E], early nauplius, copepodite 1, adult female [AF]), and TYMS (125 RPKM in adult female) (Figure 4). The less expressed transcripts (<15 RPKM) in all stages were those encoding for MTHFD2, DHFR, MTHFR, and 5FCL (Figure 4). The enzymes showed markedly different inter-stage expression patterns; MTHFD2 and DHFR had significantly higher expression in the embryos compared with all other stages. In contrast, in MTHFR and 5FCL, the expression in the embryos was lower compared with the other stages (ANOVA, p < 0.05) (Figure 4J–M). Relative expression of the transcripts encoding for 10-FTHFD, SHMT2, and FTCD was significantly higher in the naupliar stage compared with the other developmental stages (ANOVA, p < 0.01) (Figure 4A,D,G). In contrast, a significantly higher peak of expression was found in the copepodite 1 stage for transcripts encoding for MTR and AMT (ANOVA, p < 0.0001) (Figure 4B,H); copepodite stages 1, 4 [C4], and 5 [C5] together with early nauplius also showed significantly higher expression of the transcripts encoding for MTHFR and MTHFD1 (ANOVA, p < 0.05) (Figure 4I,L). Lastly, the relative expression of transcripts encoding for SHMT1, TYMS and MTF was significantly higher in adult females compared with the other stages (ANOVA, p < 0.0001) (Figure 4). Interestingly, the embryo stage showed relative expression of many transcripts comparatively more similar to the female than to the naupliar stage (e.g., 10-FTHFD, SHMT1 and 2, FTCD, MTHFD2, DHFR, and MTHFR). Meanwhile, early nauplius and copepodite stages (C1, C4 and C5) showed, at times, similar intra-transcript relative expressions (e.g., TYMS, MTF, MTHFD1 and 2, DHFR, and MTHFR) (Figure 4).
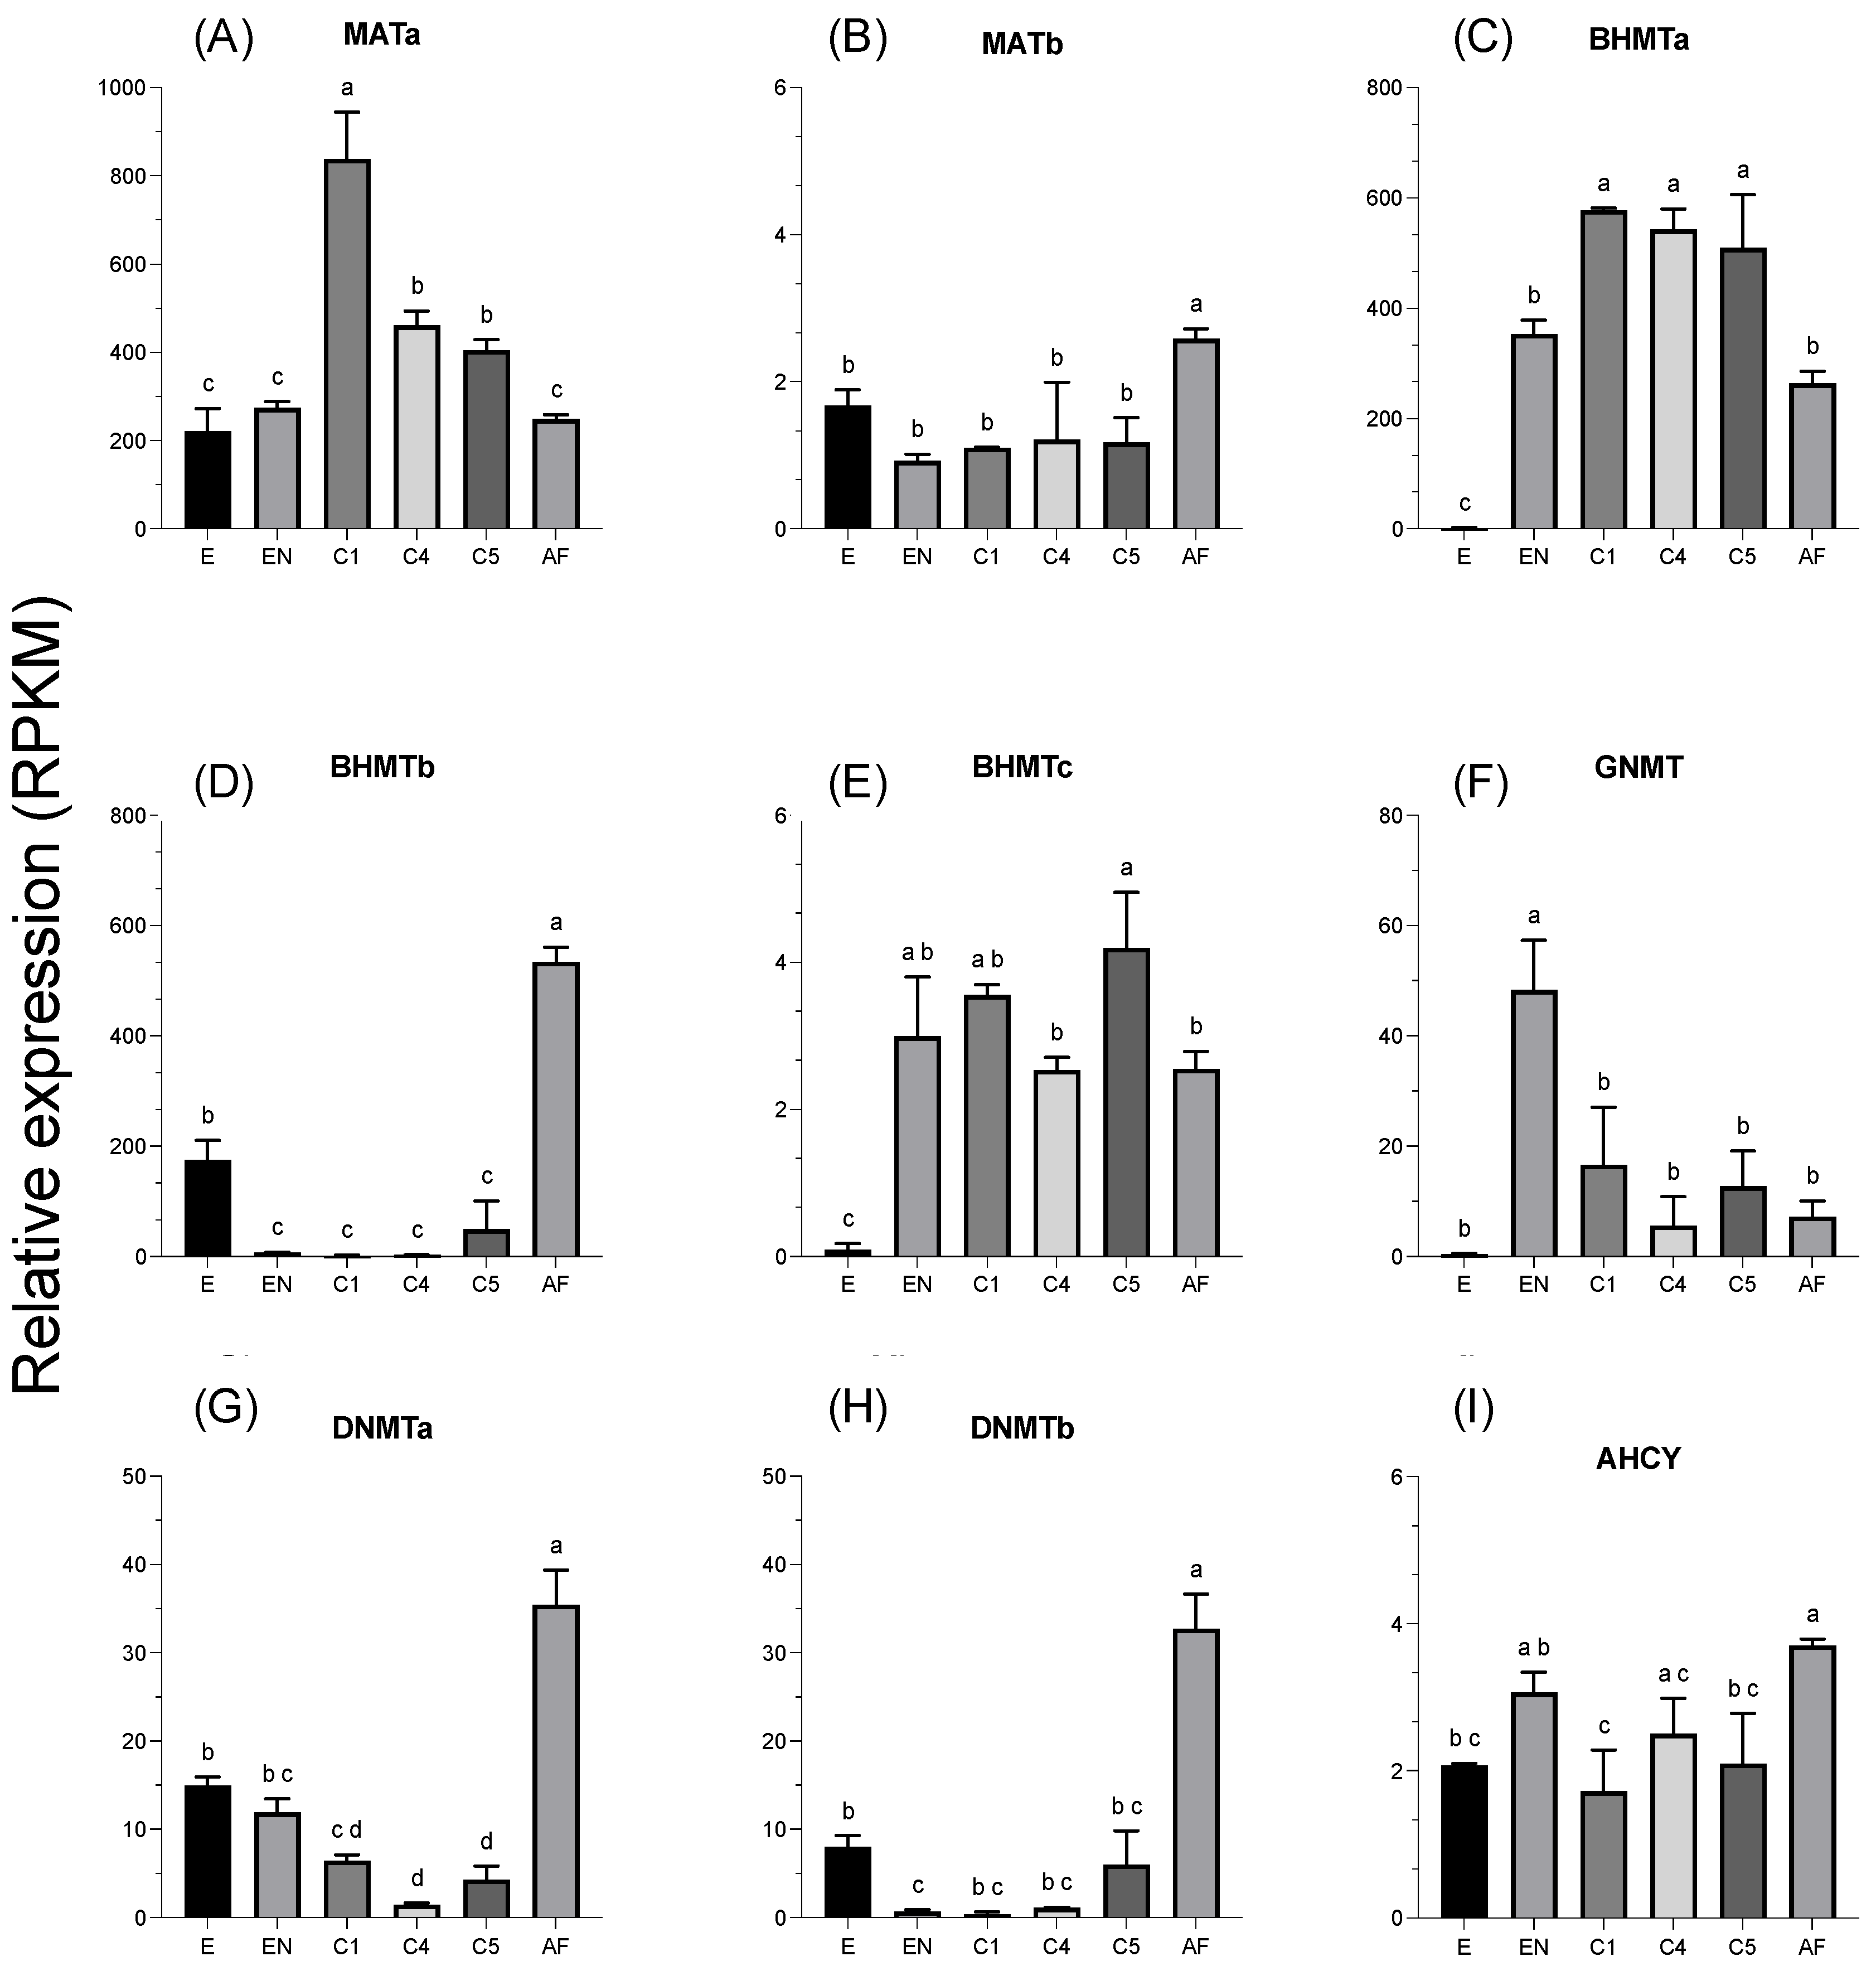
Transcripts encoding enzymes involved in the methionine cycle had comparatively higher relative expression with respect to those of the folate cycle, with MATa (GAXK01168224) being by far the most expressed transcript (200–800 RPKM), followed by BHMTa (GAXK01169231), and BHMTb (GAXK01101229) (260–570 RPKM). The remaining isoforms of both transcripts had very low expression levels at all stages (≤4 RPKM) (Figure 5). The other methyltransferase-encoding transcripts, GNMT and DNMT, showed relative expression ≤ 50 RPKM at all stages; lastly, the transcript for AHCY had a very low expression level (<4 RPKM) (Figure 5). Significant changes in expression across development were found for all enzymes of the cycle. The transcript encoding for MATa showed increased expression from embryos to copepodite 1 and then a steady decrease toward the female (ANOVA, p < 0.0001) (Figure 5A). A somewhat similar trend was observed for transcripts encoding BHMTa and BHMTc, although this latter isoform was poorly expressed; both transcripts showed very low expression in embryos, higher in all copepodite stages and with a reduction in females (ANOVA, p < 0.0001) (Figure 5C,E). Interestingly, an opposite pattern was observed for BHMTb, with maximum expression in the female, very high in the embryo, and minimum in the naupliar–copepodite stages (ANOVA, p < 0.0001) (Figure 5D). Lastly, significantly higher expression in early nauplius was observed for GNMT (ANOVA, p < 0.01), and in females for DNMTa and b (ANOVA, p < 0.0001), with respect to the other stages (Figure 5).

4. Discussion

Folate-mediated 1C metabolism has been well characterized in mammals, including humans, where functional deficiency related to dietary conditions, drugs, or germline genetic mutations has been reported to induce pathological conditions such as neural tube defects (NTDs), hyperhomocysteinemia, cardiovascular diseases, and cancer [4,5]. Despite its fundamental role in the proper functioning and development of an organism, to date, little is known about how vitamin B9 is used by aquatic organisms. Earlier studies reported that in several fish species [32,33,34] and in the crustaceans Peanaeus monodon [35] and Eriocheir sinensis, the dietary addition of folic acid led to enhanced immunity responses, antioxidant capacity, growth, and survival. In contrast, another study suggested that aquatic animals do not need folate supplementation to support high growth and a healthy condition, due to a bacterial-associated synthesis of folate in the gut of several fish and macrocrustacean species [36]. In a more recent study, Asai and coauthors [12] suggested that folate-metabolism in the calanoid copepod Calanus helgolandicus could be associated with reproduction and maternal-mediated embryonic development. These conclusions were based on the differential regulation of genes involved in the folate and methionine cycles reported in females in response to a natural toxin that impaired egg production, embryogenesis, and hatching success. However, the study did not characterize all the transcripts involved in the 1C metabolism and did not provide any data on other developmental stages.
Planktonic copepods play an important role in regulating global biogeochemical cycles [37] and serve as the key link between the lower and higher trophic levels, supporting fishery production in the early stages of life [38]. In recent years, efforts have been made to identify genes that could be potential indicators of the physiological state of copepods [23,25]. The use of these biomarkers to assess the “health” of a marine organism is useful to understand environmental adaptations (e.g., responses to starvation and stress) that can be used on a broader scale to assess changes and make predictions at population and community levels. Despite their global importance, there is only one published whole-genome assembly for a calanoid copepod Eurytemora carolleeae (formerly E. affinis) [39] and five mitochondrial genomes within the genus Calanus (National Center for Biotechnology). In recent years, the availability of several Calanus transcriptomes has improved the characterization of many gene families, expanding the potential to better understand copepod physiology [15,17,18,19,20,21,23,25,26]. Here, following this ongoing effort, we have focused on the identification of the transcripts encoding proteins involved in the folate and methionine cycles in Calanus finmarchicus, the biomass-dominant zooplankton in much of the North Atlantic. These genes could serve as potential physiological biomarkers within the reproductive and developmental processes in copepods. To the best of our knowledge, our study is the first in silico identification of all transcripts involved in folate-mediated 1C metabolism and the first report of the developmental expression of those genes in a marine crustacean.
Using a well-vetted in silico workflow, we identified all expected Calanus transcripts encoding homologs in both cycles. Within the methionine cycle, we confirmed for the enzymes BHMT, MAT, and DNMT the same gene duplication found in E. affinis, confirming the completeness and the high coverage of the C. finmarchicus transcriptome.
The roles of the enzymes involved in the folate and methionine cycles in C. finmarchicus are currently unknown. Our investigation of relative expression of transcripts across six developmental stages (embryo, early nauplius [NII–NIII], early copepodite [C1], mid copepodite [C4], pre-adult [C5], and adult [CVI]) suggests that, regardless of the functions of the enzymes, there is stage-specific regulation in this species. Significant expression differences across development were found for eleven out of twelve transcripts encoding enzymes involved in the folic cycle and for all transcripts in the methionine cycle. Within its life cycle, C. finmarchicus undergoes multiple molts characterized by intense cellular and tissue proliferation, signaling, and lipid synthesis [15,16,20,40,41,42]. Thus, since folate is an essential requirement for growth and development, it is therefore not surprising that high expression was reported for many of the transcripts in the early nauplius and the early copepodite (C1) stages. In this study, we found that C. finmarchicus transcript encoding for 10-FTHFDH, SHMT2, FTCD, and GNMT had significantly high expression in the early nauplius (NII–NIII) compared with the other stages. In zebrafish embryos, knock-out of the gene 10-FTHFDH, which is involved in the replenishment of the active form of folate THF, induces a delay in development that is probably due to the obstruction of morphogenetic movements [43]. In mouse embryos, knock-out of the gene SHMT2, which transfers a C1 unit to THF in the mitochondrial pathway, induced signs of mitochondrial respiration defects and growth retardation [44]. Taken together, our results suggest that these genes may play an important role in copepod development. As for the other larval stages, copepodite 1 represents a key transition in the copepod body plan and the switch from a naupliar morphotype to the final copepod-like shape. Higher expression of chemosensory-related genes in copepodite stage 1 compared with the other stages was recently reported [23], confirming the occurrence of elevated transcriptional activity in this developmental stage. In our study, we found significantly high expression in the early copepodite stage for transcripts encoding the enzymes MAT, MTR, and AMT involved, respectively, in the folate and methionine cycles. To date, the specific functional role of these three enzymes in copepods is unknown. MAT catalyzes the synthesis of S-adenosylmethionine (SAM), the universal donor for epigenetic methylation of DNA and histones; for this reason, the activity of MAT can influence the epigenetic regulation of gene expression, which is a determinant factor during development.
The other stage showing comparatively higher expression in many transcripts was the adult female. Specifically, almost all those encoding for the methyltransferase enzymes (BHMT, SHMT, DNMT), along with the TYMS and MTF coding transcripts, were among the most expressed. This could be related to the high investment in protein and nucleotide synthesis, as well as transcriptional regulation of maternal genes, required by the reproductive program of the female stage (germline development, oogenesis, egg maturation) [45]. In addition to that, a few female-specific transcripts also showed similar relative expression in the embryo (SHMT1, MTHFD2, DHFR, MTHFR, BHMTb), suggesting a maternal influence on the embryonic expression of these genes. This finding confirms the early observation by Asai et al. [12], who reported altered expression of several folate and methionine genes in C. helgolandicus females exposed to the harmful diatom S. marinoi. Specifically, those authors proposed that the dysregulation of MTHFR, DHFR, and BHMT gene expression in females could be responsible for the observed malformation and low viability of the developing embryo. In agreement with that, mouse embryos with increased expression of MTHFR showed congenital malformations [46]; also, polymorphic variants of this gene are associated with NTD in humans [8].
In conclusion, we provide the first in-depth description of the enzymatic pathways centered on folate interconversion and the methionine metabolism in a marine arthropod. We do not know whether the folate substrates that sustain the cycle are acquired through the diet or via direct synthesis. In the literature, it is reported that few insects can synthesize folates and many require it from the diet. In Drosophila melanogaster, folate can be synthesized by bacterial symbiont(s) to support growth and development [47]. Similarly, in the tsetse fly (Diptera: Glossinidae), the ancient and obligate mutualism with the gammaproteobacterium Wigglesworthia morsitans supports folate biosynthesis that contributes to the fly host fitness [48]. Considering that marine copepods can be mass-cultivated in high-volume systems [49], if they are able to synthesize folates de novo, they may represent a future important sustainable folate resource both for aquaculture and human nutrition. Clearly, at present, this is all speculation on the potential roles of the identified C. finmarchicus transcripts. The genes presented here can be used as biomarkers for future studies evaluating ecosystem health and organism–environment interactions and can be tested not only in other copepods but also other zooplankters. In the future, ad hoc gene-knock-out studies should be carried out to confirm the role played by female-, larval-, and embryo-specific genes in the reproductive physiology and differentiation of C. finmarchicus and in copepods in general.

Supplementary Materials

The following supporting information can be downloaded at https://www.mdpi.com/article/10.3390/jmse12050786/s1, Table S1: Summary of the in silico workflow results for C. finmarchicus transcripts encoding genes involved in the folate and methionine cycles. Using E. affinis query transcripts were first searched in the C. finmarchicus transcriptome (tblastn), then translated into amino acids and blasted against the nr database (NCBI) (blastp). The resulting sequences were examined for the presence of structural domains. For each transcript, the Enzyme Commission number (EC), NCBI accession number, tblast e-value (1st step), blasp e-value, top hit species, its accession number (second step), and structural domains (Pfam accession numbers) (third step) are provided. For the Pfam domain, red indicates domains that were present only in E. affinis query sequences, and green the ones that were present also in C. finmarchicus.

Author Contributions

Conceptualization, V.R. and Y.C.; methodology, D.A., V.R. and Y.C.; formal analysis, D.A. and V.R.; writing—original draft preparation, V.R., D.A. and Y.C.; writing—review and editing, V.R., Y.C. and C.L.; supervision, V.R. and Y.C. All authors have read and agreed to the published version of the manuscript.

Funding

This research received no external funding.

Institutional Review Board Statement

Not applicable.

Informed Consent Statement

Not applicable.

Data Availability Statement

The Calanus finmarhcius transcriptome mined for this analysis is available at the National Center for Biotechnology Information (NCBI) under the Bioproject number PRJNA236528, TSA: GAXK00000000.

Acknowledgments

We would like to thank Chiara Motta from University of Naples Federico II for the intellectual contribution.

Conflicts of Interest

The authors declare no conflicts of interest. The funders had no role in the design of the study; in the collection, analyses, or interpretation of data; in the writing of the manuscript; or in the decision to publish the results.

References

  1. Rébeillé, F.; Ravanel, S.; Jabrin, S.; Douce, R.; Storozhenko, S.; Van Der Straeten, D. Folates in plants: Biosynthesis, distribution, and enhancement. Physiol. Plant. 2006, 126, 330–342. [Google Scholar] [CrossRef]
  2. Ravanel, S.; Douce, R.; Rébeillé, F. Metabolism of folates in plants. In Advances in Botanical Research; Elsevier: Amsterdam, The Netherlands, 2011; Volume 59, pp. 67–106. [Google Scholar]
  3. Fox, J.T.; Stover, P.J. Folate-mediated one-carbon metabolism. Vitam. Horm. 2008, 79, 1–44. [Google Scholar] [PubMed]
  4. Zheng, Y.; Cantley, L.C. Toward a better understanding of folate metabolism in health and disease. J. Exp. Med. 2019, 216, 253–266. [Google Scholar] [CrossRef] [PubMed]
  5. Korsmo, H.W.; Jiang, X. One carbon metabolism and early development: A diet-dependent destiny. Trends Endocrinol. Metab. 2021, 32, 579–593. [Google Scholar] [CrossRef] [PubMed]
  6. Lee, M.S.; Bonner, J.R.; Bernard, D.J.; Sanchez, E.L.; Sause, E.T.; Prentice, R.R.; Burgess, S.M.; Brody, L.C. Disruption of the folate pathway in zebrafish causes developmental defects. BMC Dev. Biol. 2012, 12, 12. [Google Scholar] [CrossRef] [PubMed]
  7. Padmanabhan, N.; Jia, D.; Geary-Joo, C.; Wu, X.; Ferguson-Smith, A.C.; Fung, E.; Bieda, M.C.; Snyder, F.F.; Gravel, R.A.; Cross, J.C. Mutation in folate metabolism causes epigenetic instability and transgenerational effects on development. Cell 2013, 155, 81–93. [Google Scholar] [CrossRef] [PubMed]
  8. Greene, N.D.; Stanier, P.; Copp, A.J. Genetics of human neural tube defects. Hum. Mol. Genet. 2009, 18, R113–R129. [Google Scholar] [CrossRef] [PubMed]
  9. Affleck, J.G.; Neumann, K.; Wong, L.; Walker, V.K. The effects of methotrexate on Drosophila development, female fecundity, and gene expression. Toxicol. Sci. 2006, 89, 495–503. [Google Scholar] [CrossRef] [PubMed]
  10. Affleck, J.G.; Walker, V.K. Transgenic rescue of methotrexate-induced teratogenicity in Drosophila melanogaster. Toxicol. Sci. 2007, 99, 522–531. [Google Scholar] [CrossRef]
  11. Hernandorena, A. The patterning function of purines in the brine shrimp Artemia. Comptes Rendus L’académie Sci. Ser. III-Sci. Vie 1999, 322, 289–301. [Google Scholar] [CrossRef]
  12. Asai, S.; Sanges, R.; Lauritano, C.; Lindeque, P.K.; Esposito, F.; Ianora, A.; Carotenuto, Y. De novo transcriptome assembly and gene expression profiling of the copepod Calanus helgolandicus feeding on the PUA-producing diatom Skeletonema marinoi. Mar. Drugs 2020, 18, 392. [Google Scholar] [CrossRef] [PubMed]
  13. Hansen, B.H.; Tarrant, A.M.; Lenz, P.H.; Roncalli, V.; Almeda, R.; Broch, O.J.; Altin, D.; Tollefsen, K.E. Effects of petrogenic pollutants on North Atlantic and Arctic Calanus copepods: From molecular mechanisms to population impacts. Aquat. Toxicol. 2023, 267, 106825. [Google Scholar] [CrossRef] [PubMed]
  14. Melle, W.; Runge, J.; Head, E.; Plourde, S.; Castellani, C.; Licandro, P.; Pierson, J.; Jonasdottir, S.; Johnson, C.; Broms, C. The North Atlantic Ocean as habitat for Calanus finmarchicus: Environmental factors and life history traits. Prog. Oceanogr. 2014, 129, 244–284. [Google Scholar] [CrossRef]
  15. Christie, A.E.; Fontanilla, T.M.; Nesbit, K.T.; Lenz, P.H. Prediction of the protein components of a putative Calanus finmarchicus (Crustacea, Copepoda) circadian signaling system using a de novo assembled transcriptome. Comp. Biochem. Physiol. Part D Genom. Proteom. 2013, 8, 165–193. [Google Scholar] [CrossRef] [PubMed]
  16. Lenz, P.H.; Roncalli, V.; Hassett, R.P.; Wu, L.-S.; Cieslak, M.C.; Hartline, D.K.; Christie, A.E. De novo assembly of a transcriptome for Calanus finmarchicus (Crustacea, Copepoda)–the dominant zooplankter of the North Atlantic Ocean. PLoS ONE 2014, 9, e88589. [Google Scholar] [CrossRef] [PubMed]
  17. Roncalli, V.; Cieslak, M.C.; Passamaneck, Y.; Christie, A.E.; Lenz, P.H. Glutathione S-transferase (GST) gene diversity in the crustacean Calanus finmarchicus–contributors to cellular detoxification. PLoS ONE 2015, 10, e0123322. [Google Scholar]
  18. Tarrant, A.M.; Baumgartner, M.F.; Hansen, B.H.; Altin, D.; Nordtug, T.; Olsen, A.J. Transcriptional profiling of reproductive development, lipid storage and molting throughout the last juvenile stage of the marine copepod Calanus finmarchicus. Front. Zool. 2014, 11, 91. [Google Scholar] [CrossRef] [PubMed]
  19. Tarrant, A.M.; Baumgartner, M.F.; Lysiak, N.S.; Altin, D.; Størseth, T.R.; Hansen, B.H. Transcriptional profiling of metabolic transitions during development and diapause preparation in the copepod Calanus finmarchicus. Integr. Comp. Biol. 2016, 56, 1157–1169. [Google Scholar] [CrossRef]
  20. Christie, A.E.; Fontanilla, T.M.; Roncalli, V.; Cieslak, M.C.; Lenz, P.H. Identification and developmental expression of the enzymes responsible for dopamine, histamine, octopamine and serotonin biosynthesis in the copepod crustacean Calanus finmarchicus. Gen. Comp. Endocrinol. 2014, 195, 28–39. [Google Scholar] [CrossRef] [PubMed]
  21. Christie, A.E.; Fontanilla, T.M.; Roncalli, V.; Cieslak, M.C.; Lenz, P.H. Diffusible gas transmitter signaling in the copepod crustacean Calanus finmarchicus: Identification of the biosynthetic enzymes of nitric oxide (NO), carbon monoxide (CO) and hydrogen sulfide (H2S) using a de novo assembled transcriptome. Gen. Comp. Endocrinol. 2014, 202, 76–86. [Google Scholar] [CrossRef]
  22. Porter, M.L.; Steck, M.; Roncalli, V.; Lenz, P.H. Molecular characterization of copepod photoreception. Biol. Bull. 2017, 233, 96–110. [Google Scholar] [CrossRef] [PubMed]
  23. Roncalli, V.; Uttieri, M.; Capua, I.D.; Lauritano, C.; Carotenuto, Y. Chemosensory-Related Genes in Marine Copepods. Mar. Drugs 2022, 20, 681. [Google Scholar] [CrossRef]
  24. Roncalli, V.; Lauritano, C.; Carotenuto, Y. First report of OvoA gene in marine arthropods: A new candidate stress biomarker in copepods. Mar. Drugs 2021, 19, 647. [Google Scholar] [CrossRef] [PubMed]
  25. Roncalli, V.; Uttieri, M.; Carotenuto, Y. The distribution of ferritins in marine copepods. J. Mar. Sci. Eng. 2023, 11, 1187. [Google Scholar] [CrossRef]
  26. Roncalli, V.; Christie, A.E.; Sommer, S.A.; Cieslak, M.C.; Hartline, D.K.; Lenz, P.H. A deep transcriptomic resource for the copepod crustacean Labidocera madurae: A potential indicator species for assessing near shore ecosystem health. PLoS ONE 2017, 12, e0186794. [Google Scholar] [CrossRef] [PubMed]
  27. Letunic, I.; Khedkar, S.; Bork, P. SMART: Recent updates, new developments and status in 2020. Nucleic Acids Res. 2021, 49, D458–D460. [Google Scholar] [CrossRef] [PubMed]
  28. Katoh, K.; Standley, D.M. MAFFT multiple sequence alignment software version 7: Improvements in performance and usability. Mol. Biol. Evol. 2013, 30, 772–780. [Google Scholar] [CrossRef] [PubMed]
  29. Cieslak, M.C.; Castelfranco, A.M.; Roncalli, V.; Lenz, P.H.; Hartline, D.K. t-Distributed Stochastic Neighbor Embedding (t-SNE): A tool for eco-physiological transcriptomic analysis. Mar. Genom. 2020, 51, 100723. [Google Scholar] [CrossRef] [PubMed]
  30. Langmead, B.; Salzberg, S.L. Fast gapped-read alignment with Bowtie 2. Nat. Methods 2012, 9, 357–359. [Google Scholar] [CrossRef]
  31. Mortazavi, A.; Williams, B.A.; McCue, K.; Schaeffer, L.; Wold, B. Mapping and quantifying mammalian transcriptomes by RNA-Seq. Nat. Methods 2008, 5, 621–628. [Google Scholar] [CrossRef]
  32. Hien, D.; Doolgindachbaporn, S. Effect of niacin and folic acid in feed rations on growth and live weights of green catfish (Mystus nemurus Valenciennes 1840). Pak. J. Biol. Sci. 2011, 14, 64–68. [Google Scholar] [CrossRef]
  33. Lin, Y.-H.; Lin, H.-Y.; Shiau, S.-Y. Dietary folic acid requirement of grouper, Epinephelus malabaricus, and its effects on non-specific immune responses. Aquaculture 2011, 317, 133–137. [Google Scholar] [CrossRef]
  34. Badran, M.F.; Ali, M.A. Effects of folic acid on growth performance and blood parameters of flathead grey mullet, Mugil cephalus. Aquaculture 2021, 536, 736459. [Google Scholar] [CrossRef]
  35. Shiau, S.-Y.; Huang, S.-Y. Dietary folic acid requirement determined for grass shrimp, Penaeus monodon. Aquaculture 2001, 200, 339–347. [Google Scholar] [CrossRef]
  36. National Research Council, Division on Earth, Life Studies, Committee on the Nutrient Requirements of Fish, & Shrimp. Nutrient Requirements of Fish and Shrimp; National Academies Press: Washington, DC, USA, 2011. [Google Scholar]
  37. Cripps, G.; Lindeque, P.; Flynn, K.J. Have we been underestimating the effects of ocean acidification in zooplankton? Glob. Chang. Biol. 2014, 20, 3377–3385. [Google Scholar] [CrossRef]
  38. Turner, J.T. The importance of small planktonic copepods and their roles in pelagic marine food webs. Zool. Stud 2004, 43, 255–266. [Google Scholar]
  39. Choi, B.-S.; Kim, D.-H.; Kim, M.-S.; Park, J.C.; Lee, Y.H.; Kim, H.-J.; Jeong, C.-B.; Hagiwara, A.; Souissi, S.; Lee, J.-S. The genome of the European estuarine calanoid copepod Eurytemora affinis: Potential use in molecular ecotoxicology. Mar. Pollut. Bull. 2021, 166, 112190. [Google Scholar] [CrossRef]
  40. Miller, C.B.; Cowles, T.J.; Wiebe, P.H.; Copley, N.J.; Grigg, H. Phenology in Calanus finmarchicus; hypotheses about control mechanisms. Mar. Ecol. Prog. Ser. 1991, 72, 79–91. [Google Scholar] [CrossRef]
  41. Mauchline, J. The Biology of Calanoid Copepods; Advances in Marine Biology Book Series Volume 33; Academic Press: Cambridge, MA, USA, 1998. [Google Scholar]
  42. Marshall, S.M.; Orr, A.P. The Biology of a Marine Copepod: Calanus finmarchicus (Gunnerus); Springer Science & Business Media: Berlin/Heidelberg, Germany, 2013; ISBN 3662131382/9783662131381. [Google Scholar]
  43. Chang, W.-N.; Lee, G.-H.; Kao, T.-T.; Lin, C.-Y.; Hsiao, T.-H.; Tsai, J.-N.; Chen, B.-H.; Chen, Y.-H.; Wu, H.-R.; Tsai, H.-J. Knocking down 10-Formyltetrahydrofolate dehydrogenase increased oxidati ve stress and impeded zebrafish embryogenesis by obstructing morphogenetic movement. Biochim. Biophys. Acta (BBA)-Gen. Subj. 2014, 1840, 2340–2350. [Google Scholar] [CrossRef]
  44. Tani, H.; Mito, T.; Velagapudi, V.; Ishikawa, K.; Umehara, M.; Nakada, K.; Suomalainen, A.; Hayashi, J.-I. Disruption of the mouse Shmt2 gene confers embryonic anaemia via foetal liver-specific metabolomic disorders. Sci. Rep. 2019, 9, 16054. [Google Scholar] [CrossRef]
  45. Roncalli, V.; Sommer, S.A.; Cieslak, M.C.; Clarke, C.; Hopcroft, R.R.; Lenz, P.H. Physiological characterization of the emergence from diapause: A transcriptomics approach. Sci. Rep. 2018, 8, 12577. [Google Scholar] [CrossRef]
  46. Roy, M.; Leclerc, D.; Wu, Q.; Gupta, S.; Kruger, W.D.; Rozen, R. Valproic acid increases expression of methylenetetrahydrofolate reductase (MTHFR) and induces lower teratogenicity in MTHFR deficiency. J. Cell. Biochem. 2008, 105, 467–476. [Google Scholar] [CrossRef]
  47. Blatch, S.; Meyer, K.W.; Harrison, J.F. Effects of dietary folic acid level and symbiotic folate production on fitness and development in the fruit fly Drosophila melanogaster. Fly 2010, 4, 312–319. [Google Scholar] [CrossRef]
  48. Snyder, A.K.; Rio, R.V. “Wigglesworthia morsitans” folate (vitamin B9) biosynthesis contributes to tsetse host fitness. Appl. Environ. Microbiol. 2015, 81, 5375–5386. [Google Scholar] [CrossRef]
  49. Carotenuto, Y.; Esposito, F.; Pisano, F.; Lauritano, C.; Perna, M.; Miralto, A.; Ianora, A. Multi-generation cultivation of the copepod Calanus helgolandicus in a re-circulating system. J. Exp. Mar. Biol. Ecol. 2012, 418, 46–58. [Google Scholar] [CrossRef]
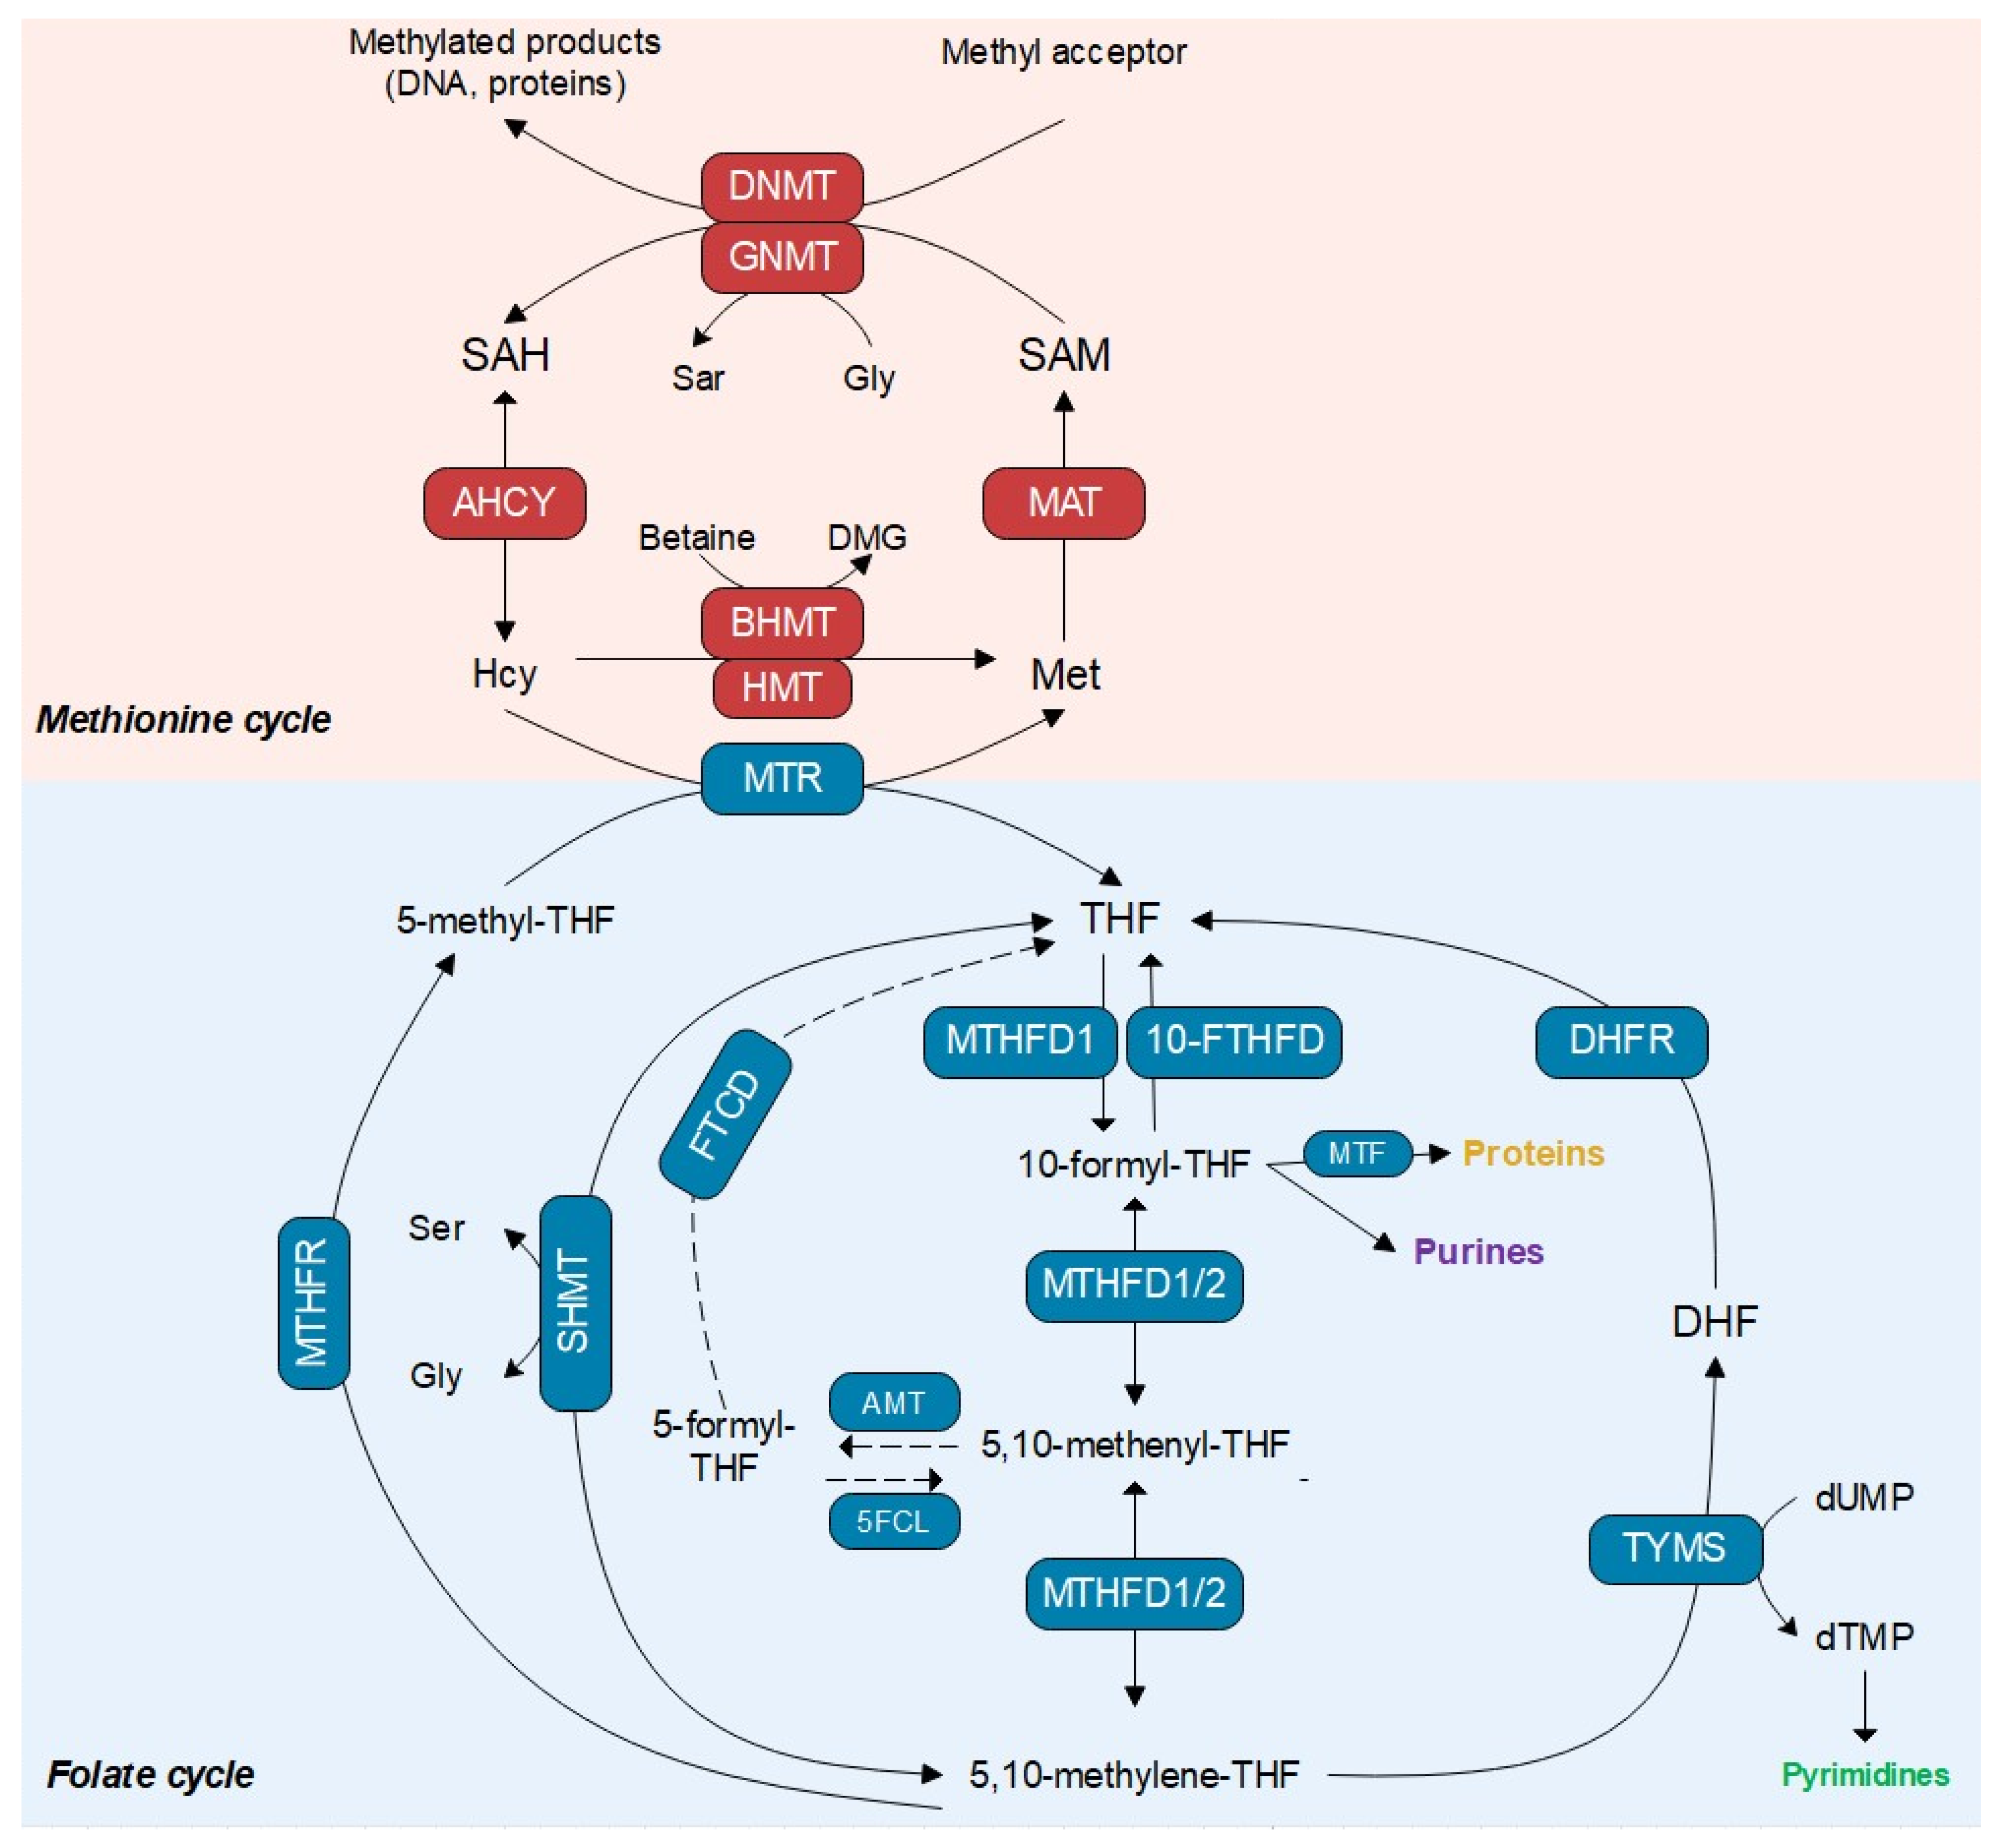
Figure 1. Schematic representation of 1C metabolism in metazoans. The top cycle represents the methionine cycle (red) connected with the folate cycle (blue, lower panel). Enzymes are represented in boxes and metabolites are listed by name. Abbreviations: AHCY, S-adenosyl-L-homocysteine hydrolase; BHMT, betaine-homocysteine S-methyltransferase; GNMT, glycine N-methyltransferase; DNMT, DNA (cytosine-5)-methyltransferase; MAT, methionine adenosyltransferase; HMT, homocysteine S-methyltransferase 3; Met, methionine; Hcy, homocysteine; SAH, S-adenosylhomocysteine; SAM, S-adenosylmethionine; Sar, sarcosine; MTR, 5-methyl-THF homocysteine methyltransferase; MTHFD1/2, methylenetetrahydrofolate dehydrogenase; 10-FTHFD, formyl-THF dehydrogenase; MTF, methionyl-tRNA formyltransferase; AMT, aminomethyltransferase; 5FCL, 5-formyl-THF cycloligase; FTCD, formimidoyltransferase–cyclodeaminase; MTHFR, 5,10-methylenetetrahydrofolate reductase; Ser, serine; Gly, glycine; SHMT, serine hydroxymethyltransferase; DHFR, dihydrofolate reductase; TYMS, thymidylate synthase; dTMP, thymidine monophosphate; dUMP, deoxyuridine monophosphate.
Jmse 12 00786 g001
Figure 2. Cladogram of genes involved in the folate cycle in marine organisms. The analysis includes amino acid sequences from the branchiopod Daphnia pulex (water flea), the decapods Penaeus vannamei, P. chinensis, and Homarus americanus, the amphipod Hyalella azteca, the copepods Eurytemora affinis, Lepeophtheirus salmonis, and C. finmarchicus (in red) (this study). Sequences from Homo sapiens and Drosophila melanogaster were considered as outgroups. Except for C. finmarchicus, all sequences were downloaded from the Kyoto Encyclopedia of Genes and Genomes (KEGG) database, selecting the one-carbon pool by folate (map00670) and the organism of interest as reference. For this analysis, amino acid sequences were aligned using ClustalW and then, a maximum-likelihood phylogenetic tree was built using the evolution model JTT + CAT (FASTTREE, Galaxy version 2.3.2) with bootstrap values computing bootstrapping for 10,000 samples (Rapid NJ Kimura evolution model, Galaxy version 2.3.2). Bootstrap values are indicated for only the major clades. Scale bars 2.0 represent estimated substitutions per site. Enzyme abbreviations refer to Figure 1.
Jmse 12 00786 g002
Figure 3. Cladogram of genes involved in the methionine cycle in marine organisms. The analysis includes amino acid sequences from the branchiopod Daphnia pulex (water flea), the decapods Penaeus vannamei, P. chinensis, and Homarus americanus, the amphipod Hyalella azteca, the copepods Eurytemora affinis, Lepeophtheirus salmonis, and C. finmarchicus (in red) (this study). Sequences from Homo sapiens and Drosophila melanogaster were considered as outgroups. Except for C. finmarchicus, all sequences were obtained from the Kyoto Encyclopedia of Genes and Genomes (KEGG). For the analysis, amino acid sequences were aligned using ClustalW and then, a maximum-likelihood phylogenetic tree was built using the evolution model JTT + CAT (FASTTREE, Galaxy version 2.3.2) with bootstrap values computing bootstrapping for 10,000 samples (Rapid NJ Kimura evolution model, Galaxy version 2.3.2). Bootstrap values are indicated for only the major clades. Scale bars 2.0 represent estimated substitutions per site. Enzyme abbreviations refer to Figure 1.
Jmse 12 00786 g003
Figure 4. Relative expression of Calanus finmarchicus transcripts encoding for enzymes involved in the folate cycle (AM) across development. Relative expression normalized by length (RPKM) across six developmental stages: embryos (E), early nauplii (EN), copepodites 1, 4, and 5 (C1, C4 and C5), and adult females (AF). Bars are mean standard deviation (n = 3 replicates, n = 2 C1 and C4). Letters on top of the bars indicate statistical significance obtained using one-way ANOVA (p < 0.05) followed by a post hoc Tukey’s test with multiple comparisons correction (Graph Pad Prism version 10.2). Enzyme abbreviations refer to Figure 1.
Jmse 12 00786 g004
Figure 5. Relative expression of Calanus finmarchicus transcripts encoding for enzymes involved in the methionine cycle across development (AI). Relative expression normalized by length (RPKM) across six developmental stages: embryos (E), early nauplii (EN), copepodites 1, 4, and 5 (C1, C4 and C5), and adult females (AF). Bars are mean standard deviation (n = 3 replicates, n = 2 C1 and C4). Letters on top of the bars indicate statistical significance obtained using one-way ANOVA (p < 0.05) followed by a post hoc Tukey’s test with multiple comparisons correction (Graph Pad Prism version 10.2). Enzymes abbreviations refer to Figure 1.
Jmse 12 00786 g005
Table 1. Folate cycle transcripts. Summary of searches of C. finmarchicus transcripts encoding enzymes. For each enzyme (name and enzyme commission number EC), the resulting C. finmarchicus transcript (NCBI commission n.), e-value of Blast-p searches (NCBI nr database), top hit species and deduced protein length are listed. F = full length (all structural domains) and P = partial length. See Table S1 for detailed information.
Enzyme NameE.C.NCBI Transcript #Blast-p
E-Value
Top Hit SpeciesDeduced Protein Length
dihydrofolate reductase (DHFR)1.5.1.3GAXK010999501.55 × 10−33Eurytemora affinisF
methylenetetrahydrofolate dehydrogenase (MTHFD)6.3.4.3 (I)/3.5.4.9 (II)/1.5.1.5 (III)GAXK011614130Eurytemora affinisF
methylenetetrahydrofolate dehydrogenase (MTHFD2)1.5.1.15GAXK011517924.04 × 10−131Eurytemora affinisF
thymidylate synthase (TYMS)2.1.1.45GAXK011882811.47 × 10−92Eurytemora affinisF
methylene-THF reductase (MTHFR)1.5.1.53
1.5.1.20
GAXK010561820Penaeus chinensisF
serine hydroxymethyltransferase (SHMT1)2.1.2.1GAXK01188425-cit0Eurytemora affinisF
serine hydroxymethyltransferase (SHMT2)2.1.2.1GAXK01186194-mit0Eurytemora affinisF
5-methyl-THF homocysteine methyltransferase (MTR)2.1.1.13GAXK011885270Eurytemora affinisF
methionyl-tRNA formyltransferase (MTF)2.1.2.9GAXK011584711.06 × 10−68Harmonia axyridisP
formimidoyltransferase-cyclodeaminase (FTCD)2.1.2.5
4.3.1.4
GAXK011133060Eurytemora affinisF
Aminomethyltransferase (AMT)2.1.2.10GAXK010440230Eurytemora affinisF
5-formyl-THF cycloligase (5FCL)6.3.3.2GAXK010243251.98 × 10−61Amphibalanus amphitriteF
formyl-THF dehydrogenase (10-FTHFDH)1.5.1.6GAXK011713030Eurytemora affinisF
Table 2. Methionine cycle transcripts. Summary of searches of C. finmarchicus transcripts encoding enzymes. For each enzyme (name and enzyme commission number EC), the resulting C. finmarchicus transcript (NCBI commission n.), e-value of Blast-p searches (NCBI nr database), top hit species, and deduced protein length are listed. F = full length (all structural domains) and P = partial length. See Table S1 for detailed information.
Enzyme NameE.C.NCBI Transcript #Blasp
E-Value
Top Hit SpeciesDeduced Protein Length
betaine–homocysteine S-methyltransferase (BHMT)2.1.1.5GAXK01169231 (a)
GAXK01064100 (b)
GAXK01101229 (c)
0
0
0
Eurytemora affinis
Eurytemora affinis
Eurytemora affinis
F
F
F
glycine N-methyltransferase (GNMT)2.1.1.20GAXK010967111.44 × 10−166Eurytemora affinisF
S-adenosylmethionine synthetase (MAT)2.5.1.6GAXK01168224 (a)
GAXK01150749 (b)
GAXK01026996 (c)
0
1.65 × 10−89
0
Eurytemora affinis
Armadillidium nasatum
Eurytemora affinis
F
F
F
homocysteine S-methyltransferase 3 (HMT)2.1.1.10GAXK011605280Eurytemora affinisF
DNA (cytosine-5)-methyltransferase 1 (DNMT)2.1.1.37GAXK01011690(a)
GAXK01002418(b)
0Penaeus chinensis
Anneissia japonica
F
F
Adenosylhomocysteinase (AHCY)3.13.2.1GAXK01026996 (a)
GAXK01168201 (b)
0
0
Eurytemora affinis
Eurytemora affinis
F
F
Disclaimer/Publisher’s Note: The statements, opinions and data contained in all publications are solely those of the individual author(s) and contributor(s) and not of MDPI and/or the editor(s). MDPI and/or the editor(s) disclaim responsibility for any injury to people or property resulting from any ideas, methods, instructions or products referred to in the content.