Article

Dynamic Analysis of a Barge-Type Floating Wind Turbine Subjected to Failure of the Mooring System

1
Key Laboratory of High Performance Ship Technology (Wuhan University of Technology), Ministry of Education, Wuhan 430063, China
2
School of Naval Architecture, Ocean and Energy Power Engineering, Wuhan University of Technology, Wuhan 430063, China
3
Powerchina (Xi’an) Port Navigation Shipbuliding Technology Co., Ltd., Xi’an 710089, China
4
China Ship Scientific Research Center, Wuxi 214000, China
5
Shanghai Investigation, Design & Research Institute Co., Ltd., Shanghai 200335, China
6
China Three Gorges Corporation, Beijing 100038, China
*
Author to whom correspondence should be addressed.
J. Mar. Sci. Eng. 2024, 12(4), 617; https://doi.org/10.3390/jmse12040617
Submission received: 28 February 2024 / Revised: 29 March 2024 / Accepted: 31 March 2024 / Published: 3 April 2024
(This article belongs to the Special Issue Hydrodynamic Research of Marine Structures)

Abstract

:
Evidence points to increasing the development of floating wind turbines to unlock the full potential of worldwide wind-energy generation. Barge-type floating wind turbines are of interest because of their shallow draft, structural simplicity, and moonpool-damping effect. Based on the BEM potential flow method, this study uses ANSYS-AQWA software to create a floating-barge moonpool platform model equipped with an OC5 NREL 5 MW wind turbine, to study the effect of the damping lid method on the resonance of the moonpool gap water, the wind–wave coupling effect, and the dynamic response of the FOWT and mooring system after single-line and double-line failure. The results show that the damping lid method, based on the potential flow theory, can effectively correct the effect caused by the lack of viscosity; the effect of a single breakage of upwind mooring lines on the motion is mainly in the sway and yaw modes, and after mooring line 8 breaks, the maximum tension of the adjacent mooring line increases by 2.91 times compared to the intact condition, which is 58.9% of the minimum breaking strength; and the breakage of two mooring lines located at one corner leads to a surge drift of up to 436.7 m and a cascading failure phenomenon.

1. Introduction

Offshore wind energy has been commercially utilized for more than 30 years, mainly relying on fixed offshore wind-turbine technology. Offshore wind power has gained great success in shallow waters, with total accumulated installations being up to 64.3 GW by the end of 2022 [1,2], and has further entered the era of floating wind technology [3]. The development in European countries and China is the main contributor to the great achievement of offshore wind energy. In recent years, China’s offshore wind industry has experienced rapid development, and its accumulated offshore wind power installation has become the largest since 2021. Starting from 1 January 2022, China’s offshore wind market has entered the era of “grid parity,” with the end of the national feed-in tariff at the end of 2021. Against the background of the rush to install offshore wind turbines by the end of 2021, the market growth rate slowed down significantly in 2022, with the new installations in 2022 being 70% lower than that of 2021. Even so, the new installations in 2022 still exceeded 5 GW, demonstrating the robust resilience of China’s offshore wind industry [1,4]. In addition, China has completed several full-scale floating wind-turbine demonstration projects and started the construction of its first offshore floating wind farm in 2023 [5]. In this regard, European countries have been leading the commercialization of floating wind technology and have completed several floating wind farms, such as Hywind Scotland, WindFloat Atlantic, and Kincardine Scotland.
There are generally four types of foundations for the floating wind turbine: SPAR, semi-submersible, TLP, and barge. The first three types draw on the basic type of traditional offshore oil and gas platforms and use them for floating wind turbines. The concept of a barge-type platform is derived from the semi-submersible platform. The hull of a barge-type platform is built with either concrete or steel, the structure is relatively simple, the manufacturing difficulty and cost are low, and the installation and offshore floating tow are convenient [6]. The barge platform is characterized by the moonpool in the center of the square shell, also called the moonpool, which absorbs part of the wave load and reduces the global motion of the floating foundation. The National Renewable Energy Laboratory (NREL) and MIT collaborated on the design of this barge-type platform concept [7]. The platform utilizes a large, weighted water plane area and distributed buoyancy for stability. The wind turbines are designed to be installed in the center of the barge, using a catenary mooring system to prevent drifting [7].
One of the features of the barge-type platform is the moonpool in the center of the square shell, which absorbs part of the wave load and reduces the motion of the whole platform. The fluid in the moonpool may resonate under the action of incident waves, and the resonance forms are classified into piston mode and sloshing mode. Piston-mode resonance means that the fluid in the moonpool undulates up and down like a rigid body, and the whole water surface is kept as a plane, and sloshing-mode resonance means that the water body flows back and forth between the walls [8]. Piston- and sloshing-mode resonance frequencies can be predicted using empirical formulas [8,9,10,11,12], and frequency-domain models based on potential flow theory are also widely used prediction methods [13,14,15]. The neglect of viscosity in the potential flow theory can lead to the overprediction of the gap-resonance response amplitude [16,17]. Scholars have proposed some methods to solve this problem [16,18,19], which have been continuously developed, and the existing hydrodynamic computational software, such as ANSYS-AQWA version 2023 [20], WAMIT v73 [21], and WADAM version 2014 [22], can better deal with the moonpool gap-resonance problem.
Barge-type FOWTs rely on a mooring system to provide positioning capability, and during the operational cycle, mooring lines are subject to harsh environments in the ocean and may break due to corrosion, extreme wind gusts, fatigue damage, and ship collision accidents [23,24]. Sudden breakage of the mooring lines will lead to a rapid increase in the dynamic response of the FOWT, and at the same time, the FOWT will lose the displacement limitation in one direction and drift, which in serious cases can lead to accidents such as the damage of power transmission cables, successive breakage of the remaining mooring lines, and collision with other FOWTs in the wind farms, resulting in human casualties and significant economic losses [25,26]. Although there have been few reports of mooring lines breaking in current FOWT demonstration or commercial projects, the risk of mooring lines failure will increase accordingly given the prospect of a significant increase in the number of installed FOWTs in the future [1,27]. Therefore, the study of mooring-line failure is necessary. Mooring-line failure has been studied on offshore oil and gas floating structures [28,29,30], and in recent years, with the rise of FOWTs, scholars have also become interested in their mooring-line failure problems [31,32,33,34,35]. Bae et al. [25] studied the effects of mooring-line failure on the steady and dynamic responses of the OC4 DeepCwind semi-submersible FOWT, as well as the tension in the remaining mooring lines and turbine performance, by disconnecting one of the three mooring lines. They found that the drift distance after the disconnection could exceed 700 m, potentially leading to collision accidents with nearby FOWTs. Li et al. [36] investigated the failure of a single mooring line of the OC3 Hywind SPAR-type FOWT and found that the drift distance reached 700 m. They also found that the braking of the blades can effectively reduce the aerodynamic loads, but it also has an effect on the drift distance. In addition, this paper also evaluated the collision risk of neighboring FOWTs after mooring-line failure. Wu et al. [37] investigated the failure of one mooring line of the WindStar TLP floating turbine and found that the transient response of this FOWT under operational conditions may be higher than the extreme value under the 1-in-50-year environmental condition.
Barge-type FOWTs typically have eight or more mooring lines [7,38], thus exhibiting more mooring-line redundancy compared to SPAR and semi-submersible FOWTs, which have only three mooring lines. Yang et al. [39] investigated the failure of a single mooring line on the ITI barge-type FOWT and found that upwind mooring-line breakage has a greater effect on the drift distance and the amount of increase in mooring-line tension. The failure of two mooring lines brings more damage than a single mooring line, and even in this case, the FOWT should maintain self-sustainability [40]. Jia et al. [41,42] investigated the effect of failure of two mooring lines at different intervals on the ITI barge-type FOWT and found that the shorter the interval, the more unstable the state of the FOWT. It was also found that the failure of the two mooring lines upwind increases the tension of all the remaining mooring lines under extreme conditions, and the simultaneous failure of two mooring lines at the same corner causes the chain breakage of other mooring lines. The above studies on the mooring breakage of barge-type FOWTs are all based on the same ITI barge-type FOWTs with water depths of 150 m. There are fewer studies on medium and shallow water depths, and changes in water depth affect the motion of the FOWTs and the mooring-line tension, especially under extreme conditions [43]. In addition, the barge-type platforms in these studies did not have moonpools or they did not take into account the fluid resonance in the moonpool, and the presence of the moonpool and the fluid resonance effects therein have an impact on the hydrodynamic performance of barge-type FOWTs [44,45,46].
Chuang et al. [47] proposed a 60 × 60 m barge-type FOWT with a 20 × 20 m moonpool adapted to the water depth of 50 m. In this paper, the model is created using ANSYS-AQWA, to analyze the effect of the damping factor on the FOWT-motion response amplitude operator (RAO), wave elevation, and impulse response function. In addition, the wind–wave coupling effect is also analyzed under operating and extreme conditions, and then the effects of single- and double-mooring-line failures on the motion of the barge-type FOWT and the tension of the remaining mooring lines are analyzed under extreme conditions.

2. Theoretical Background

2.1. Frequency-Domain Analysis of Barge-Type FOWT

Potential flow theory assumes that the velocity potential function of the fluid domain is Φ ( x , y , z , t ) , which is found to satisfy the Laplace equation:
2 Φ ( x , y , z , t ) = 2 Φ x 2 i + 2 Φ y 2 j + 2 Φ z 2 k = 0
The total velocity potential can be decomposed into:
φ ( X ) e i ω t = φ I + φ d + 6 j = 1 φ r j X j e i ω t
where φ I , φ d , and φ r represent incident velocity potential, diffraction velocity potential and radiation velocity potential, respectively; X j is the motion amplitude of the j t h degree of freedom.
Because of the lack of viscosity, the water surface in the moonpool produces an unrealistic elevation at the resonance frequency. To correct for this effect, an additional free surface boundary is adopted by expanding the wave-absorbing beach method, which is widely used in full nonlinear hydrodynamic analysis in time-domain analysis. It can be expressed as [20]:
ω 2 g ( a d 2 f 1 1 ) φ 2 i ω 2 g α d f 1 φ + φ Z = 0   where   Z = 0
where α d is a damping factor, which should be mainly determined by model tests or trial measurements; it is recommended that damping factor be set between 0.0 and 0.2 [48]; d g a p is the width of the moonpool; ω is the wave frequency; φ is the velocity potential; and Z represents the relative height to the sea floor as a reference surface. f 1 is a function that relates to the moonpool size, which is defined as follows:
f 1 = sin 2 π 2 ω ω 0   where   ω < ω 0 ω ω 0 2   where   ω ω 0
where ω 0 can be expressed as:
ω 0 = max 0.1 , π g d g a p
The frequency-domain motion equation used in this paper is as follows:
ω 2 M + A ω i ω B ω + C X i ω = F i ω
where M denotes the FOWT mass matrix; C denotes the hydrostatic restoring stiffness matrix of the FOWT; and X i ω denotes the response amplitude operator (RAO); and F i ω denotes the wave excitation force. A ω and B ω denote the added mass and radiation damping matrices, respectively, which can be obtained from the following equation:
A i j ( ω ) = 1 ω Im i ρ ω S M B n i φ r j d S B i j ( ω ) = Re i ρ ω S M B n i φ r j d S ( i , j = 1 , , 6 )
where S M B is the mean wetted surface of the FOWT.

2.2. Time-Domain Model Based on Cummins Equation

Based on the Cummins equation [49], the time-domain motion equation used in this paper is as follows:
[ M + A ( ) ] x ¨ ( t ) + 0 t K ( t τ ) x ˙ ( τ ) d τ + C x ( t ) = F e x c ( t ) + F w i n d ( t ) + F m o o r i n g ( t )
where A ( ) denotes the added mass matrix in infinite-frequency; K ( t ) denotes the matrix of the impulse response functions, which represents the retardation memory effect of fluid; x ( t ) denotes the responses of FOWT under six degrees; F e x c ( t ) denotes the wave excitation forces acting on FOWT; F w i n d ( t ) denotes the wind forces; and F m o o r i n g ( t ) denotes the mooring system forces.
The K ( t ) can be expressed as a function of B ω [50]:
K ( t ) = 2 π 0 B ω cos ω t d ω
The F w i n d ( t ) can be expressed as follows:
F w i n d ( t ) = C d u u C d = 1 2 ρ C z C s A cos β
where C d denotes the wind drag coefficient; u is the vector of relative wind velocity; ρ denotes the air density; C z denotes the height coefficient; C s denotes the shape coefficient; A denotes the windward area; and β is the angle of the windward area relative to the wind direction.
The Norwegian Petroleum Directorate (NPD) wind profiles, gust factors, and spectra are used in this study, as recommended by the API [51]. The 1-h average wind velocity at Z meters above sea level can be expressed as follows:
V ¯ Z = V ¯ 10 1 + C ln Z 10 C = 0.0573 1 + 0.15 V ¯ 10
where V ¯ 10 denotes the 1-h average wind velocity at 10 m above sea level.
The dimensional NPD wind-energy density spectrum (in m2/s) of the longitudinal wind speed fluctuations at the Z height is given by:
S ( f ) = 320 V ¯ 10 10 2 Z 10 0.45 1 + f ˜ 0.468 3.561 f ˜ = 172 f ( Z 10 ) 2 / 3 ( V ¯ 10 ) 3 / 4
where f denotes the frequency.
The dynamic cable method is used to model catenary mooring lines; the effects of buoyant force, structural inertia force, hydrodynamic force, bending moment, and seabed friction force acting on mooring lines are considered; and the platform motion and mooring line tension at each time step are coupled. Each dynamic mooring line is modeled as a chain of Morison-type elements subjected to various external forces. The mass and applied/internal forces of the mooring line are discretized along the length into multiple cable elements, and the motion equation of this cable element is [20]:
T S e + V S e + w + F h = m 2 R t 2 M S e + R S e × V = q
where m represents the mass of the cable per unit length; R is the position vector of a single cable at the first connection point; q is the bending moment load per unit length, w is the weight of a single cable, F h is the hydrodynamic load on a single cable; D e And Δ S e the diameter and length of a single cable, respectively; M is the bending moment vector of the first connection point of a single cable; V is the shear force vector of the first connection point of the unit; and T is the tension vector of the first connection point of a single cable.
The tension and bending moment of the cable element are related to the axial stiffness and bending stiffness of the cable, respectively:
M = E I R S e × 2 R S e 2 T = E A ε
where ε is the axial strain of the mooring line.

3. Numerical Simulation

3.1. Simulation Model

The simulation model in this study uses the barge-type floating wind turbine and the OC5 NREL 5MW wind turbine. The properties of the barge-type foundation, NREL 5 MW wind turbine, and mooring system are shown in Table 1, Table 2 and Table 3, which were used in the work by Chuang et al. [47]. The simulation model global and plan views in ANSYS-AQWA are shown in Figure 1; mooring lines 1 and 2 are located in the first quadrant, and the rest of the mooring lines are distributed sequentially. The mesh size is 0.6 m and the number of diffract elements is 18,104.

3.2. Wave Environment Condition

The design environmental conditions of the FOWT mooring system can refer to the offshore oil and gas platform, and the environmental condition of a 50-year return period is generally selected [40,52]. The sea condition is selected from Guangdong Province, China, and the environmental conditions are shown in Table 4 [43]. The Jonswap spectrum is used for the irregular waves, and the spectral peak factor is taken as in Section 3.3.

3.3. ANSYS-AQWA Setup

This study uses the BEM potential flow solver ANSYS-AQWA. In AQWA, the fluid is defined as an ideal fluid that is non-rotational, non-viscous, and incompressible. In the case of non-negligible viscosity, it can be solved by adding additional damping to the floating body. There are two main steps in the simulation using AQWA: frequency-domain analysis and time-domain analysis. In frequency-domain analysis, AQWA will add regular waves of unit amplitude to calculate the incident wave force, diffraction wave force, additional mass coefficient, and radiation damping coefficient acting on the floating body support structure under different wave angles and periods. After the data are inverse, the Fourier transform method is employed in the time-domain calculation, and the linear superposition theory is applied to obtain the dynamic motion of the floating body.
In frequency-domain analysis, the wave direction range is −180° to 180°, with an interval of 30°, and the wave frequency is set from 0.1 rad/s to 2.0 rad/s. In order to consider the second-order wave drift force, the near-field method is used to calculate the wave drift Quadratic Transfer Function (QTF). To prevent standing waves, an external damping lid is added to the free water surface of the moonpool. Cable dynamics are set to account for the hydrodynamics of the mooring lines. In order to maximize the power generation, the FOWT is made to face the incident wind and wave direction, considering that the wind and wave are in the same direction (both oriented at 0° in AQWA and represented by the positive X-axis; see Figure 1b). The duration of the calculation is 5000 s with a time step of 0.1 s.

4. Results and Discussions

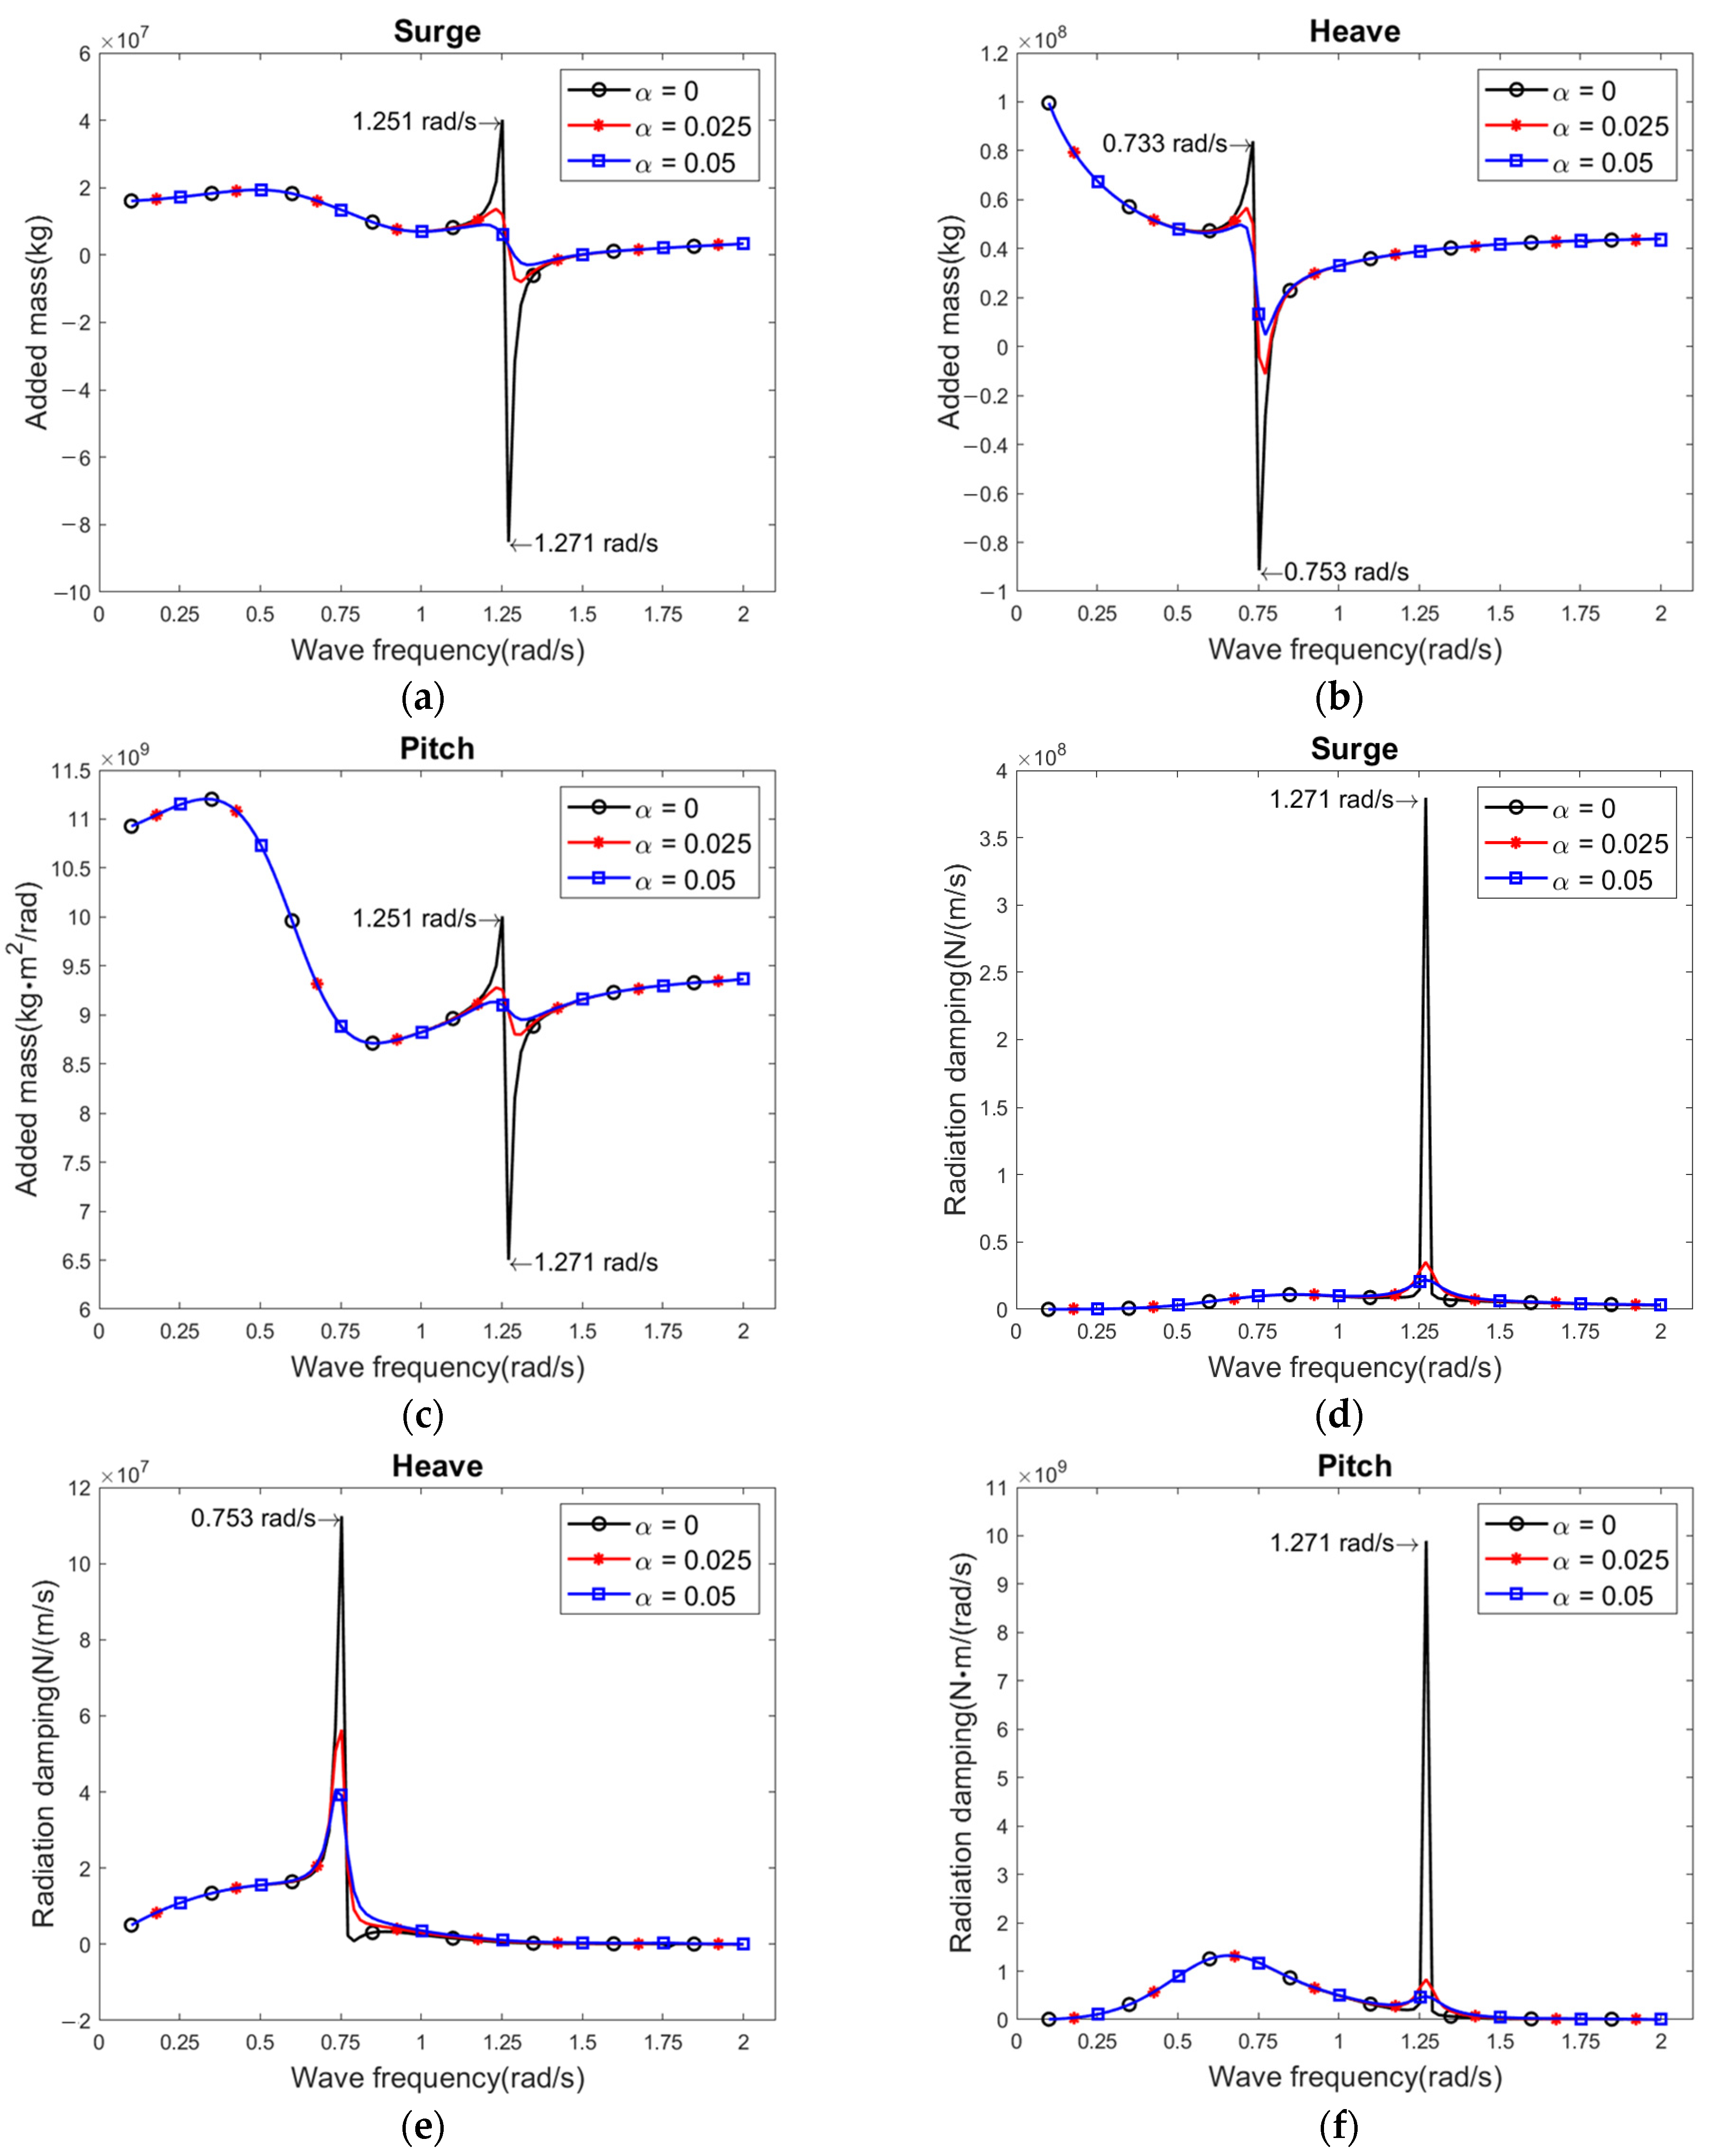
4.1. Hydrodynamics of the Barge-Type Floating Wind Turbine

The use of the damping lid method to correct the over-predicted dynamic response of the floating body in the frequency domain of AQWA has been demonstrated in previous papers to prove its feasibility [14,15,53,54]. The damping factor is taken as 0, 0.025 and 0.05. As shown in Figure 2, the variation of hydrodynamic coefficients of the barge-type FOWT are compared with different damping factors. When the damping factor = 0, the added mass and radiation damping of the surge, heave, and pitch modes all have unrealistic estimates at their corresponding peak frequencies. The added mass coefficients show first a maximum and then a minimum (sometimes negative) at the frequencies, and the radiation damping exhibits delta function-like behavior. The peak frequency of the hydrodynamic coefficients is 0.753 rad/s for the heave mode and 1.271 rad/s for the surge and pitch modes. The use of the damping lid method allows the unrealistic values of the hydrodynamic coefficients at the peak frequencies to be corrected efficiently with little effect on the other frequencies.
Figure 3a shows the plan view of the platform, and nine measurement points are taken in the X direction at the free water surface in the moonpool to obtain the wave-elevation RAOs at these points under different wave frequencies (see Figure 3b–d). Based on the water surface elevation results in the moonpool, the piston- and sloshing-resonance frequencies and modes can be predicted accurately [55,56]. When the damping factor = 0, a significant piston-mode resonance is observed at 0.810 rad/s; second- and fourth-order sloshing-mode resonances are observed at 1.290 rad/s and 1.770 rad/s; and the wave-elevation RAOs for the three resonant modes are shown in Figure 4. The maximum wave elevation in the piston and second-order sloshing modes is 6.80 m and 9.28 m, respectively, when the damping factor = 0, which is much larger than the incident wave amplitude with a value of 1 m. In the fourth-order sloshing mode, the maximum value is 2.45 m, and the effect of the overestimation of the wave elevation is weakened. The damping lid method can effectively correct the unrealistic value of wave elevation, but the increase in the damping factor to 0.05 seems to suppress the wave elevation excessively. It is noted that the piston and second-order sloshing-resonance frequencies do not exactly coincide with the peak frequencies of the heave and surge hydrodynamic coefficients; they are delayed by a small amount, which may be due to the fact that the FOWT is fixed when calculating the hydrodynamic coefficients, while the wave elevation is calculated under the free-floating state, the moonpool resonance frequency will be greater in the free-floating state than in the fixed state [57]. In addition, the effect of the fourth-order sloshing-mode resonance on the hydrodynamic coefficients may not be significant.
Figure 5 shows the heave and pitch RAOs of the barge-type FOWTs with different damping lid factors. Compared with the experiments and simulations of Chuang et al. [47], it can be seen that the heave RAO is overestimated at a resonance period of 7.75 s (0.810 rad/s) when the damping factor = 0. The damping lid method can effectively reduce the motion of the heave mode at the resonant frequency, but it has almost no effect at other frequencies. Unlike the heave mode of motion, the damping lid method has less effect on the pitch RAO. It is noted that a damping factor of 0.05 is appropriate for the RAO but may excessively suppress the wave elevation in the moonpool at the resonance frequency, and this phenomenon is consistent with the conclusions of Pauw et al. [58] and Zou et al. [54]: that a unique value for the damping lid factor might not be sufficient to fully cover the different measurements in the model tests.
Figure 6 shows the impulse response function K(t) for the heave-heave mode with different damping factors, which is calculated from 0.1 rad/s to 2 rad/s in steps of 0.03 rad/s. The impulse response function has a repeat period of 2π/Δω in steps of 0.03 rad/s. The repeat period is about 200 s, so it is sufficient to take 100 s for the calculation of K(t). As can be seen in Figure 6, the damping lid method can effectively reduce the oscillation amplitude of the impulse response function, and the longer the time, the larger the reduction amplitude, which in turn shortens the decay time; when the damping factor = 0, obvious oscillations are observed at 100 s, which may lead to energy feed-in effects and unstable results of the time-domain motion calculations; when the damping factor is raised to 0.05, the impulse response function has almost decayed to 0 at 100 s, which may be beneficial for the accuracy of the time-domain calculation results. After comprehensive consideration, the damping factor is taken as 0.05 in the subsequent calculations.

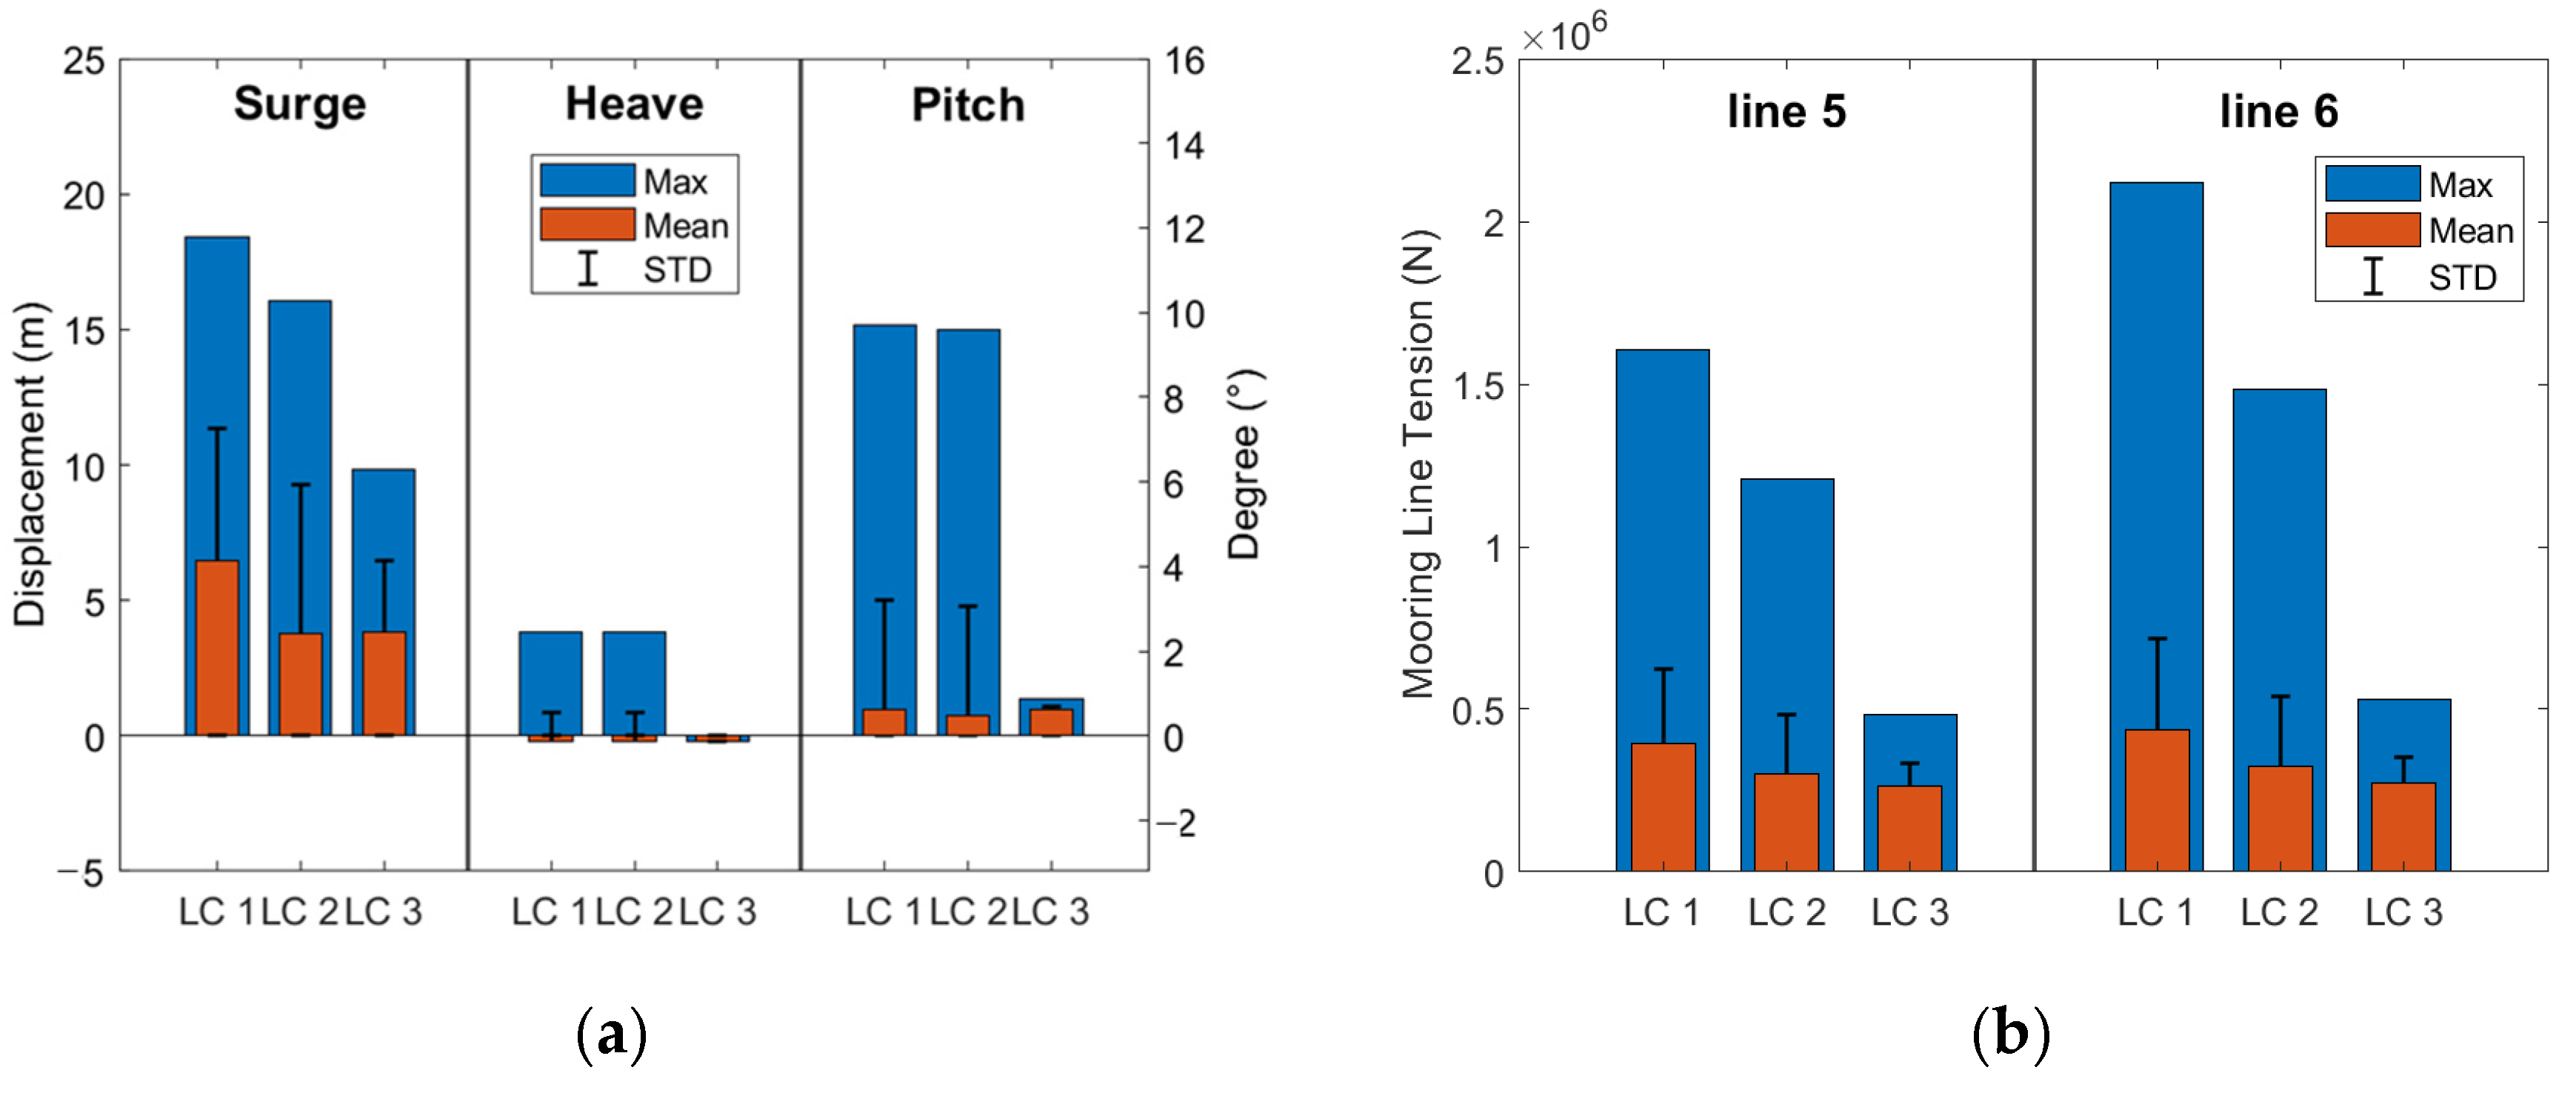
4.2. Barge-Type FOWT Motion and Mooring Tension Dynamic Responses under Operating Condition

The statistical values of the dynamic response of the barge-type FOWT motion and mooring-line tension under operating conditions for LC 1: wind–wave coupled, LC 2: wave-only, and LC 3: wind-only cases are shown in Figure 7. Since the direction of the wind and wave is along the X-positive direction and the whole system is symmetric along the X-axis, the motion of the sway, roll, and yaw modes is very small, and only the motion of surge, heave, and pitch modes are shown here. Among the eight mooring lines, the tension of the mooring lines along the opposite direction of wind and wave is much higher, and according to the symmetry principle, only the tension statistics of line 5 and line 6 are shown here.
From Figure 7a, it can be seen that the maximum values of the motion of surge, heave, and pitch modes are 18.42 m, 3.84 m, and 9.70°, respectively, and in all three modes, the contribution of the wave to the maximum values of the motion is dominant, and the effect of the wind has a certain influence on the motion of surge, while it has little effect on the motion of heave and pitch. Similarly, for the standard deviation of the motions of the three modes, the wave is also the dominant factor, i.e., the wave is the main factor impacting the STD of the motions. From Figure 7b, it can be seen that the tension maximum of line 5 and line 6 are 1.60 × 10⁶ N and 2.12 × 10⁶ N, respectively; line 6 has a larger angle with the wind and wave direction, so its tension maximum is slightly larger. For the tension maximum and standard deviations, the wave is the main factor impacting the mooring tension maximum—the second-order low-frequency wave forces play a significant role, while the wind has a smaller effect. The maximum and standard deviation for the wind–wave coupled case are not the sum of the wind-only and wave-only cases, so it is not possible to calculate wind and wave separately and add the results to predict the motion in the wind–wave coupled case. Neglecting the effect of wind will underestimate the motions and mooring tensions to some extent, especially for the surge mode maximum motion and line 5 and line 6 mooring maximum tensions.

4.3. Barge-Type FOWT Motion and Mooring Tension Dynamic Responses under Extreme Condition
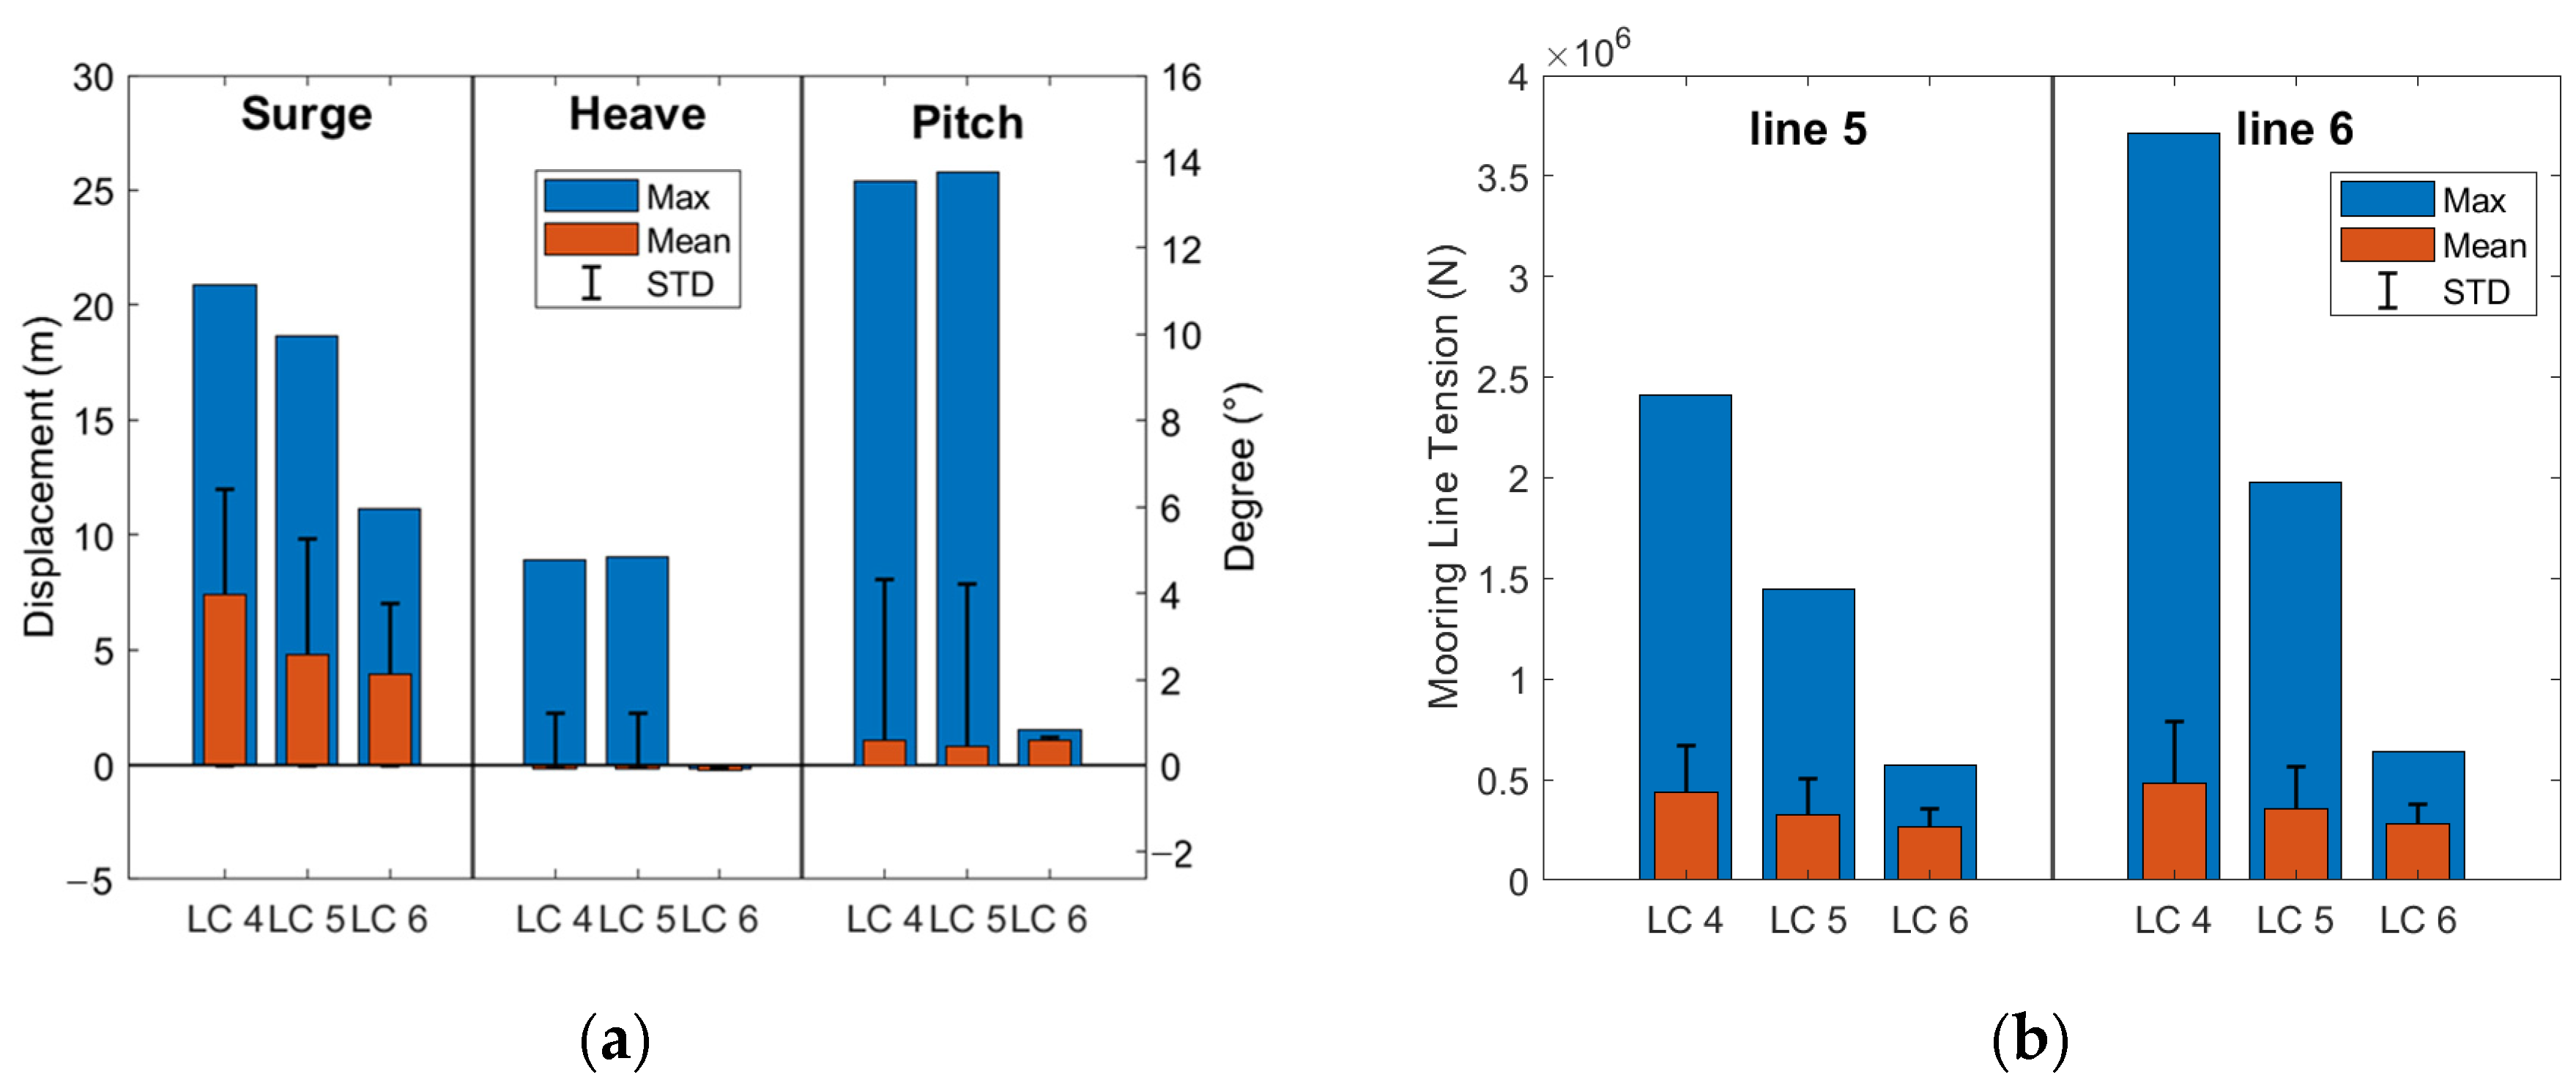
Under extreme environmental conditions, the mooring system must provide reliable stability to prevent floating FOWTs from drifting away or being destroyed. According to the API RP 2SK [51], the strength factor of safety (SFOS) of a mooring line is defined as the ratio of the minimum breaking strength (MBS) to the maximum mooring line tension, which must be greater than the specification requirement for all intact and single-line failure cases under extreme conditions (see Table 5). In this study, a mooring line is considered unsafe if the maximum tension is greater than the MBS. The rotation angle of the FOWT is an important consideration in safety and energy production efficiency. According to DNV-RP-0286 [40], the mean angle of FOWT roll and pitch under operating conditions should be less than 5°; the maximum angle should be less than 10° and it should not exceed 15° under extreme conditions. Drift offset limits for FOWTs are generally based on the conditions of the arrangement of FOWTs in the wind farm, e.g., the risks of collision that may arise from the close proximity of neighboring offshore structures or other FOWTs must be taken into account, as well as risks such as breakage of power cables, which are not explicitly limited in this study.

4.3.1. All Intact

The statistical values of the dynamic response of the barge-type FOWT motion and mooring line tension under extreme conditions for the LC 4: wind–wave coupled, LC 5: wave-only, and LC 6: wind-only cases are shown in Figure 8. From Figure 8a, it can be seen that the maximum of the surge-, heave-, and pitch-mode motions are 20.89 m, 9.02 m, and 13.76°, respectively, with an increase of 13.4%, 134.9%, and 41.9% compared with the operating conditions. Compared with the wind–wave coupled case, there is only a small increase in the maximum values of heave and pitch in the wave case, with proportions of 1.3% and 1.6%, respectively. In the wind–wave coupled case, the mean pitch and maximum pitch are 0.57° and 13.54°, which are less than 5° and 15°, respectively, and can satisfy the motion requirements under extreme conditions. From Figure 8b, it can be seen that the maximum values of tension for line 5 and line 6 are 2.41 E6 N and 3.71 E6 N, respectively, which are 50.6% and 75.0% higher than the operating conditions. The maximum tension ratios for wave-only and wind–wave coupled cases are 60.2% and 53.3%, respectively, for the extreme condition, while the ratios are 75.2% and 69.8% for the operating condition, which indicates that the coupling effect of wind and wave is greater in the extreme condition than in the operating condition. The SFOS of line 6 is 4.98, which is much larger than the 1.67 required by the specification, indicating that the strength of the mooring line meets the safety requirements under extreme conditions.

4.3.2. One Line Broken

In this section, the simulation of single-mooring-line failure at 1500 s is carried out to analyze the effect on the barge-type FOWT motion and mooring-line tension dynamics under extreme conditions. The four upwind mooring lines are in a tensile state, while the downwind mooring lines are in a more relaxed state, so the upwind mooring lines are subjected to much higher tensions than the downwind mooring lines, and since the mooring system are symmetric about the X-axis, the failure conditions of line 7 and line 8 are selected here. The failure of the upwind mooring line leads to more serious consequences than that of the downwind mooring line [39].
Figure 9 shows the maximum barge-type FOWT motion and mooring-line tension after 1500 s. Figure 10 shows the six-degree-of-freedom motion of the barge-type FOWT, and Figure 11 shows the mooring-line tension of line 7 and line 8. Compared with the intact case, the failure of line 7 or line 8 has almost no effect on the heave and pitch motions, and the effect on the surge motion is very small; the maximum surge motion only increases by 1.33 m and 0.41 m. The failure of line 7 or line 8 mainly impacts the motions of the sway, roll, and yaw modes, which are almost zero in the intact case. Compared with the intact case, the maximum motion amplitudes of the sway, roll, and yaw modes increase by 5.64 m, 1.03°, and 4.82°, respectively, after line 7 failure, while they increase by 6.78 m, 1.62°, and 7.04°, respectively, after line 8 failure, which are 1.20, 1.57 and 1.46 times more than those of the line 7 failure case. Also, the increased motion caused by line 8 failure is more severe than line 7 failure.
The failure of either line 7 or line 8 has little effect on the maximum tension in line 1 to line 6. Line 7 has a maximum tension of 1.07 E7 N after line 8 failure, which is 2.91 times that of the intact case, while line 8 has a maximum tension of 7.83 E6 N after line 7 failure, which is 3.26 times that of the intact case, and the maximum tension in the line 8 failure case is 1.37 times that of the line 7 failure case. Overall, the consequences of the failure of line 8, which has the second-highest tension in the intact case, on the barge-type FOWT motion and mooring-line tension are more severe than the failure of line 7, which has the first-highest tension in the intact case. Figure 12 shows the in-plane drift trajectories after the failure of line 7 and line 8. The trajectories show a significant elliptical spiral shape and irregularities.

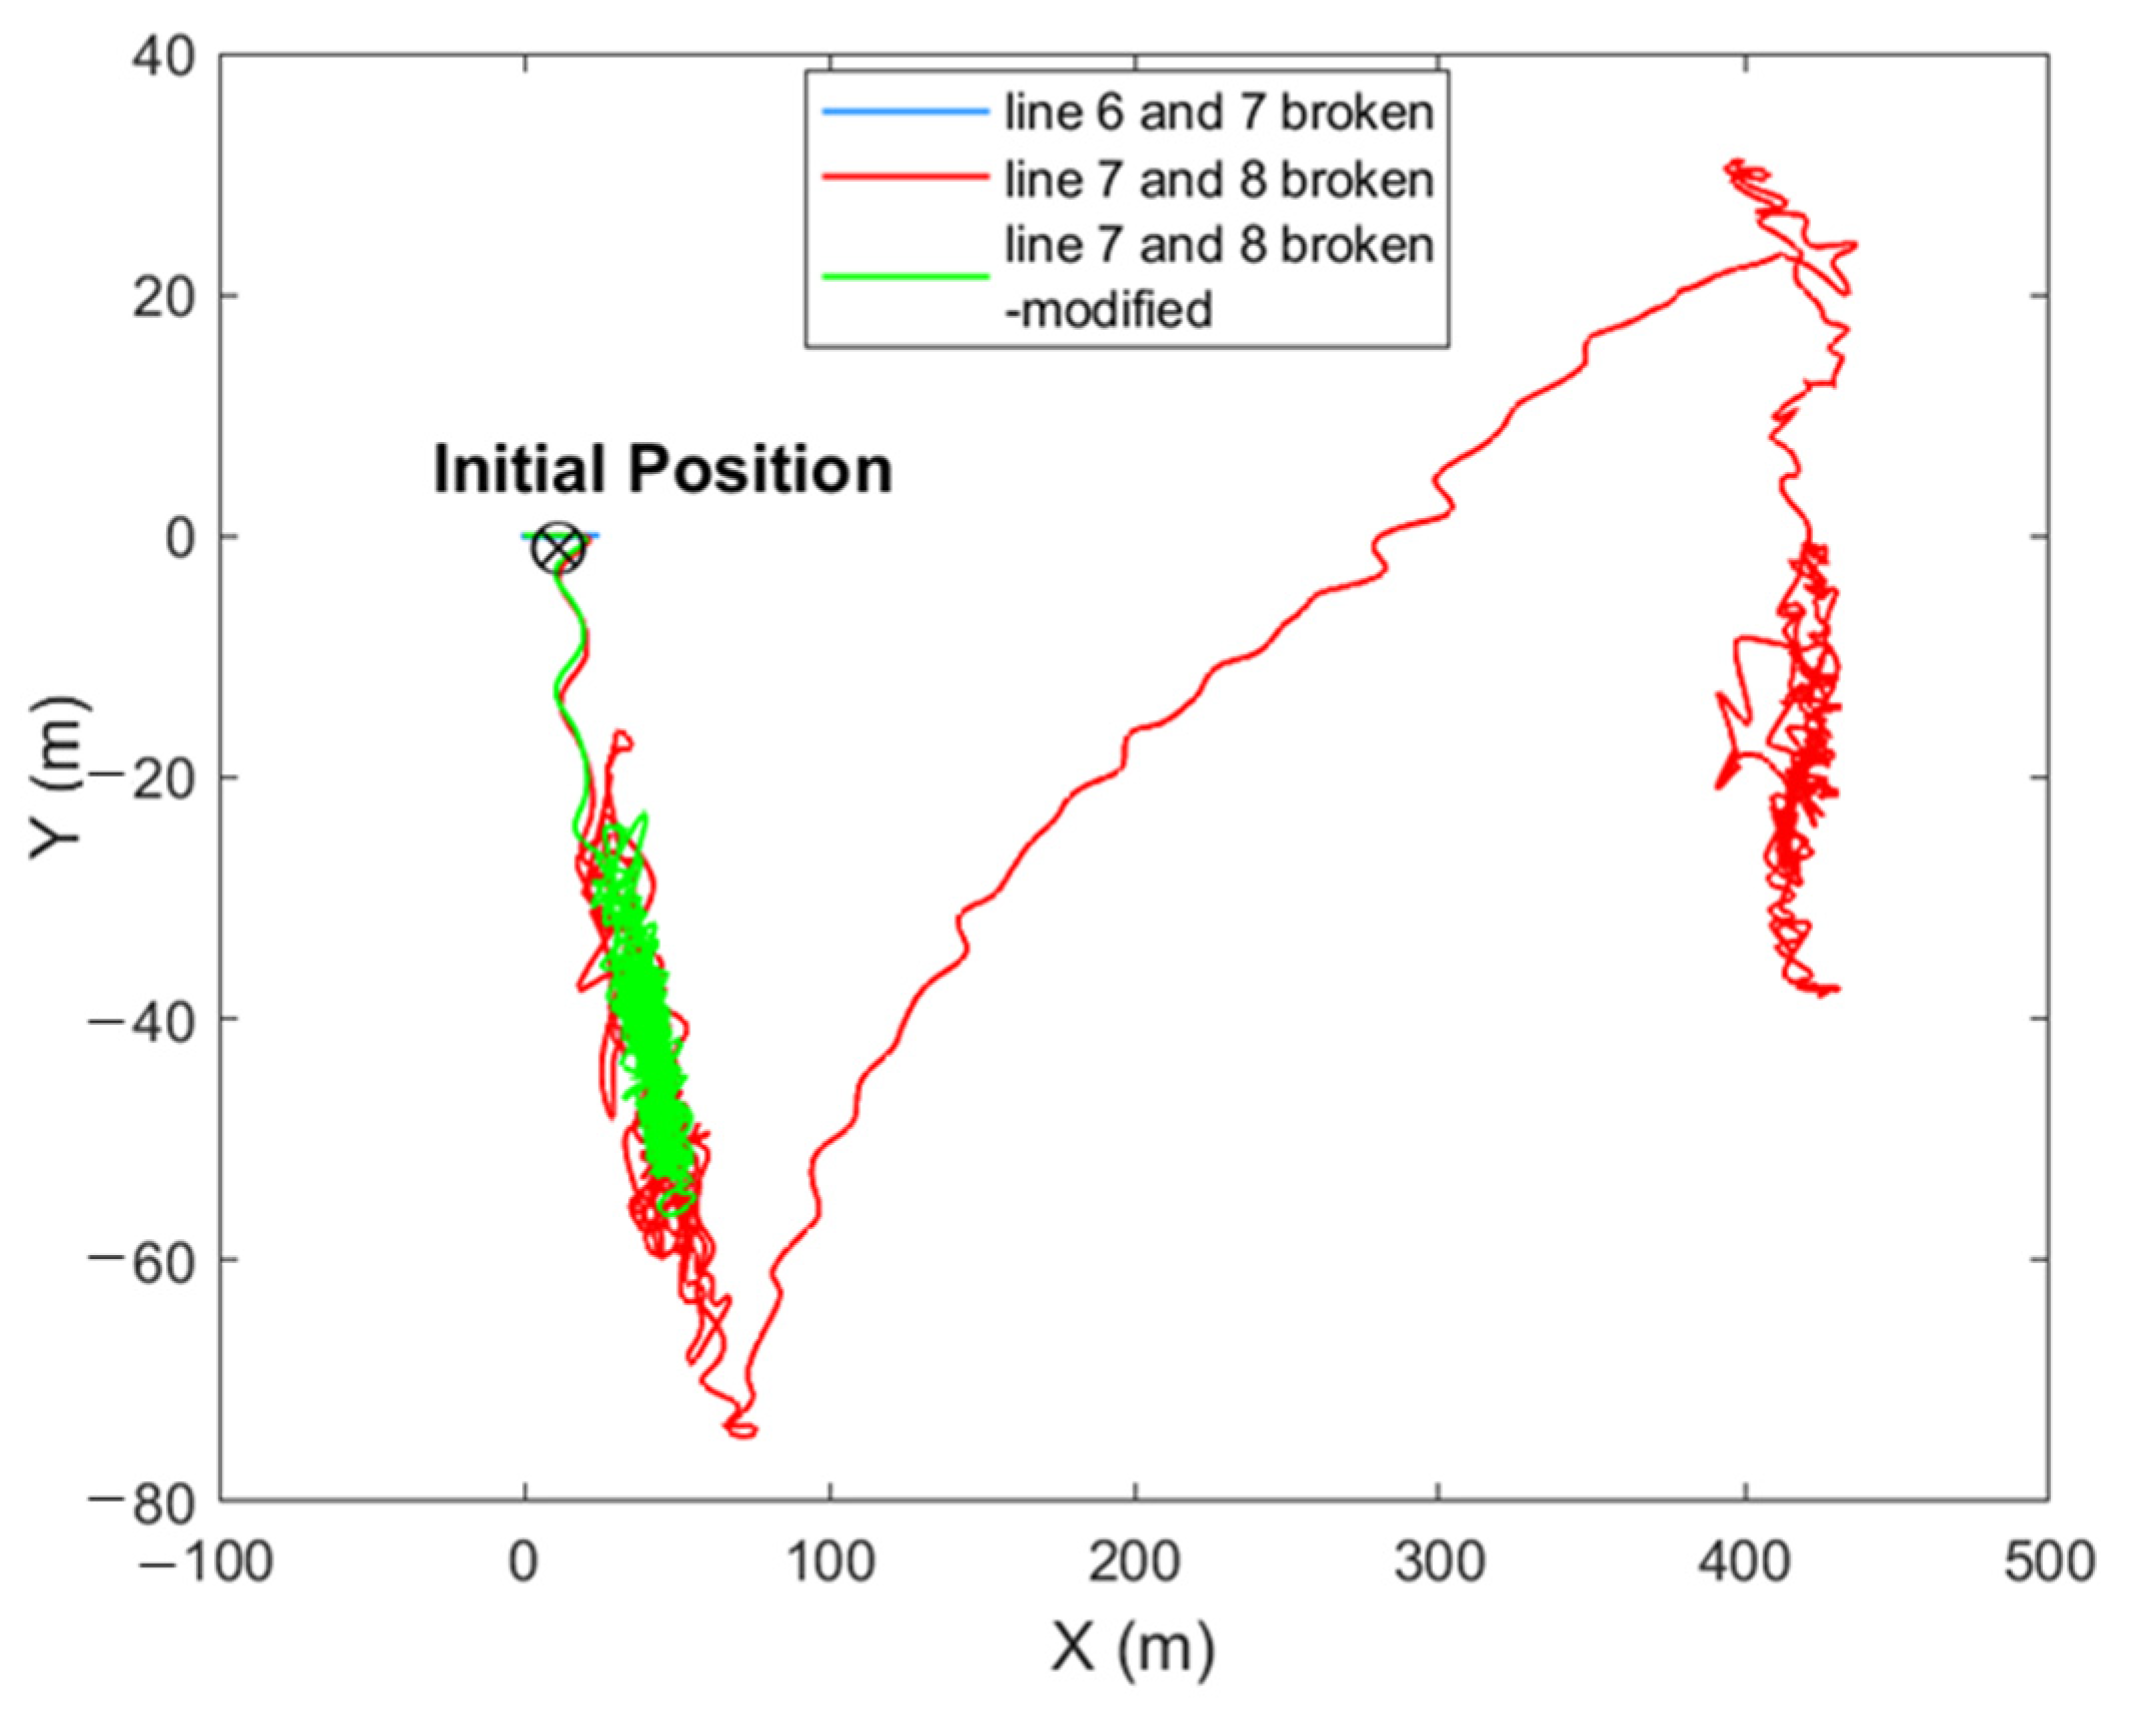
4.3.3. Double Lines Broken

In this section, simulations are carried out for the case of simultaneous failure of two mooring lines at 1500 s to analyze the effect on the barge-type FOWT motion and mooring tension under extreme conditions. The two cases of line 6 and 7 failure and line 7 and 8 failure are selected to correspond to the two highest tension line failures and the tension of first- and second-line failure, respectively. After line 6 and line 7 break, there will still be one mooring line in the second and one in the third quadrant to provide the restoring force, whereas, after lines 7 and 8 break, the FOWT will lose the mooring restoring force limitation in the entire second quadrant, resulting in large planar motions and rotations, and possibly chain effects. In AQWA, a cable failure function is added to all mooring lines except for artificial breakage, i.e., each mooring line will fail immediately if its tension exceeds the MBS throughout the calculation process.
Figure 13 shows the maximum motion of the barge-type FOWT and the maximum tension of the mooring line after 1500 s for line 6 and 7 failure, line 7 and 8 failure, line 7 and 8 failure—modification, and intact cases. Figure 14 shows the six-degree-of-freedom motion of the barge-type FOWT, and Figure 15 shows the tension of all mooring lines. The failure of lines 7 and 8 under extreme conditions will result in the successive failure of line 1, line 6, and line 5, so the mooring system is modified with the same layout, and the modified mooring system properties are shown in Table 6. The failure of lines 6 and 7 has only a small effect on the surge-mode motion, and almost no effect on the other mode motions, with a maximum surge motion of 24.63 m, which is an increase of 3.77 m compared with the intact case. The mooring lines upwind after line 6 and 7 failure are much slacker, with the maximum tension for lines 3 and 4 reduced by 38% and 35% compared to the intact case, while downwind lines 5 and 8 increase dramatically to 9.3 E6 N and 9.2 E6 N, which are 3.86 and 3.83 times higher than the intact case, even though the safety factors are 1.95 and 1.97, respectively, which are still sufficiently safe and redundant to reach the MBS.
The failure of lines 7 and 8 results in very serious consequences. As the mooring system is designed to be redundant, the FOWT reached its maximum transient position after 131.5 s; after reaching the new equilibrium position, line 3 and line 4, which are located diagonally to lines 7 and 8, are already completely slack, and the FOWT position is mainly controlled by line 1, line 2, line 5 and line 6. Line 1 fails at 1857 s, then line 2 takes its place to support the larger tension, and after maintaining this for some time, line 6 fails at 2588 s. At this time, only line 2 and line 5 provide position support to the FOWT, and finally, line 5 fails at 3054 s. Then, the upwind mooring lines all fail, and after that, the FOWT generates a very large offset subjected to wind and drift forces. From Figure 13, it can be seen that the maximum values of the surge, sway, roll, and yaw modal motions are 436.72 m, 74.54 m, 8.21°, and 46.46°, respectively, and the maximum values of heave and pitch motions are less different from those of the intact case. Overall, after the failure of lines 7 and 8, other mooring lines break in a chain effect, and the final consequences are not only the damage of the mooring lines but also the risk of transmission line failure and collision with the adjacent FOWT due to the excessive offset.
In the modified mooring system, the FOWT reaches the maximum transient position after 133.5 s after line 7 and 8 failure, and after that, it is kept at the new equilibrium position without any other mooring-line failure. From Figure 13, it can be seen that the maximum values of the surge, sway, roll, and yaw motions are 55.68 m, 56.22 m, 5.92° and 23.46°, which are 2.61, 8.29, 3.65, and 3.33 times those of the line 8 failure case, respectively, and the difference in heave and pitch maximum motions from the intact case is relatively small. After the failure of lines 7 and 8, lines 3 and line 4 are completely relaxed and the tension is almost zero; the maximum tensions of line 1, line 2, line 5, and line 6 are 1.44 E7 N, 1.87 E6 N, 2.79 E6 N, and 1.80 E7 N, respectively, which are 44.58, 5.63, 1.16 and 5.04 times higher than those of the intact case; however, the SFOS of line 1 and line 7 are 1.89 and 1.51, which are still sufficiently redundant to failure, indicating that the modified mooring system is still in a safe state after line 7 and 8 failure under extreme conditions.
Figure 16 shows the in-plane drift trajectories of the barge-type FOWT after 1500 s for the line 6 and 7 failure, line 7 and 8 failure, and line 7 and 8 failure—modification cases. The drift equilibrium point is only shifted by a small distance in the positive direction of the X-axis after line 6 and 7 failure; after the failure of lines 7 and 8 of the original mooring system, the FOWT undergoes several different phases of motion, eventually producing a relatively large offset, and the modified mooring system is maintained near the new equilibrium point after the failure of lines 7 and 8.

5. Conclusions

In this study, dynamic analyses of barge-type FOWT and mooring system are carried out in AQWA; the damping lid method is added to the free water surface in a moonpool to suppress the overestimation of wave elevation and FOWT motion at the resonance frequency; and a mooring line is modeled by using the lumped mass method and taking into consideration hydrodynamic forces. The effect of different damping factors on the correction of RAO, the wave elevation, and the impulse response function is analyzed. The wind–wave coupled effects are also analyzed under operating and extreme conditions, and then the effects of single- and double-mooring-line failures on the barge-type FOWT motions and the mooring-line tensions are analyzed under extreme conditions. The results of this study are briefly listed as follows:
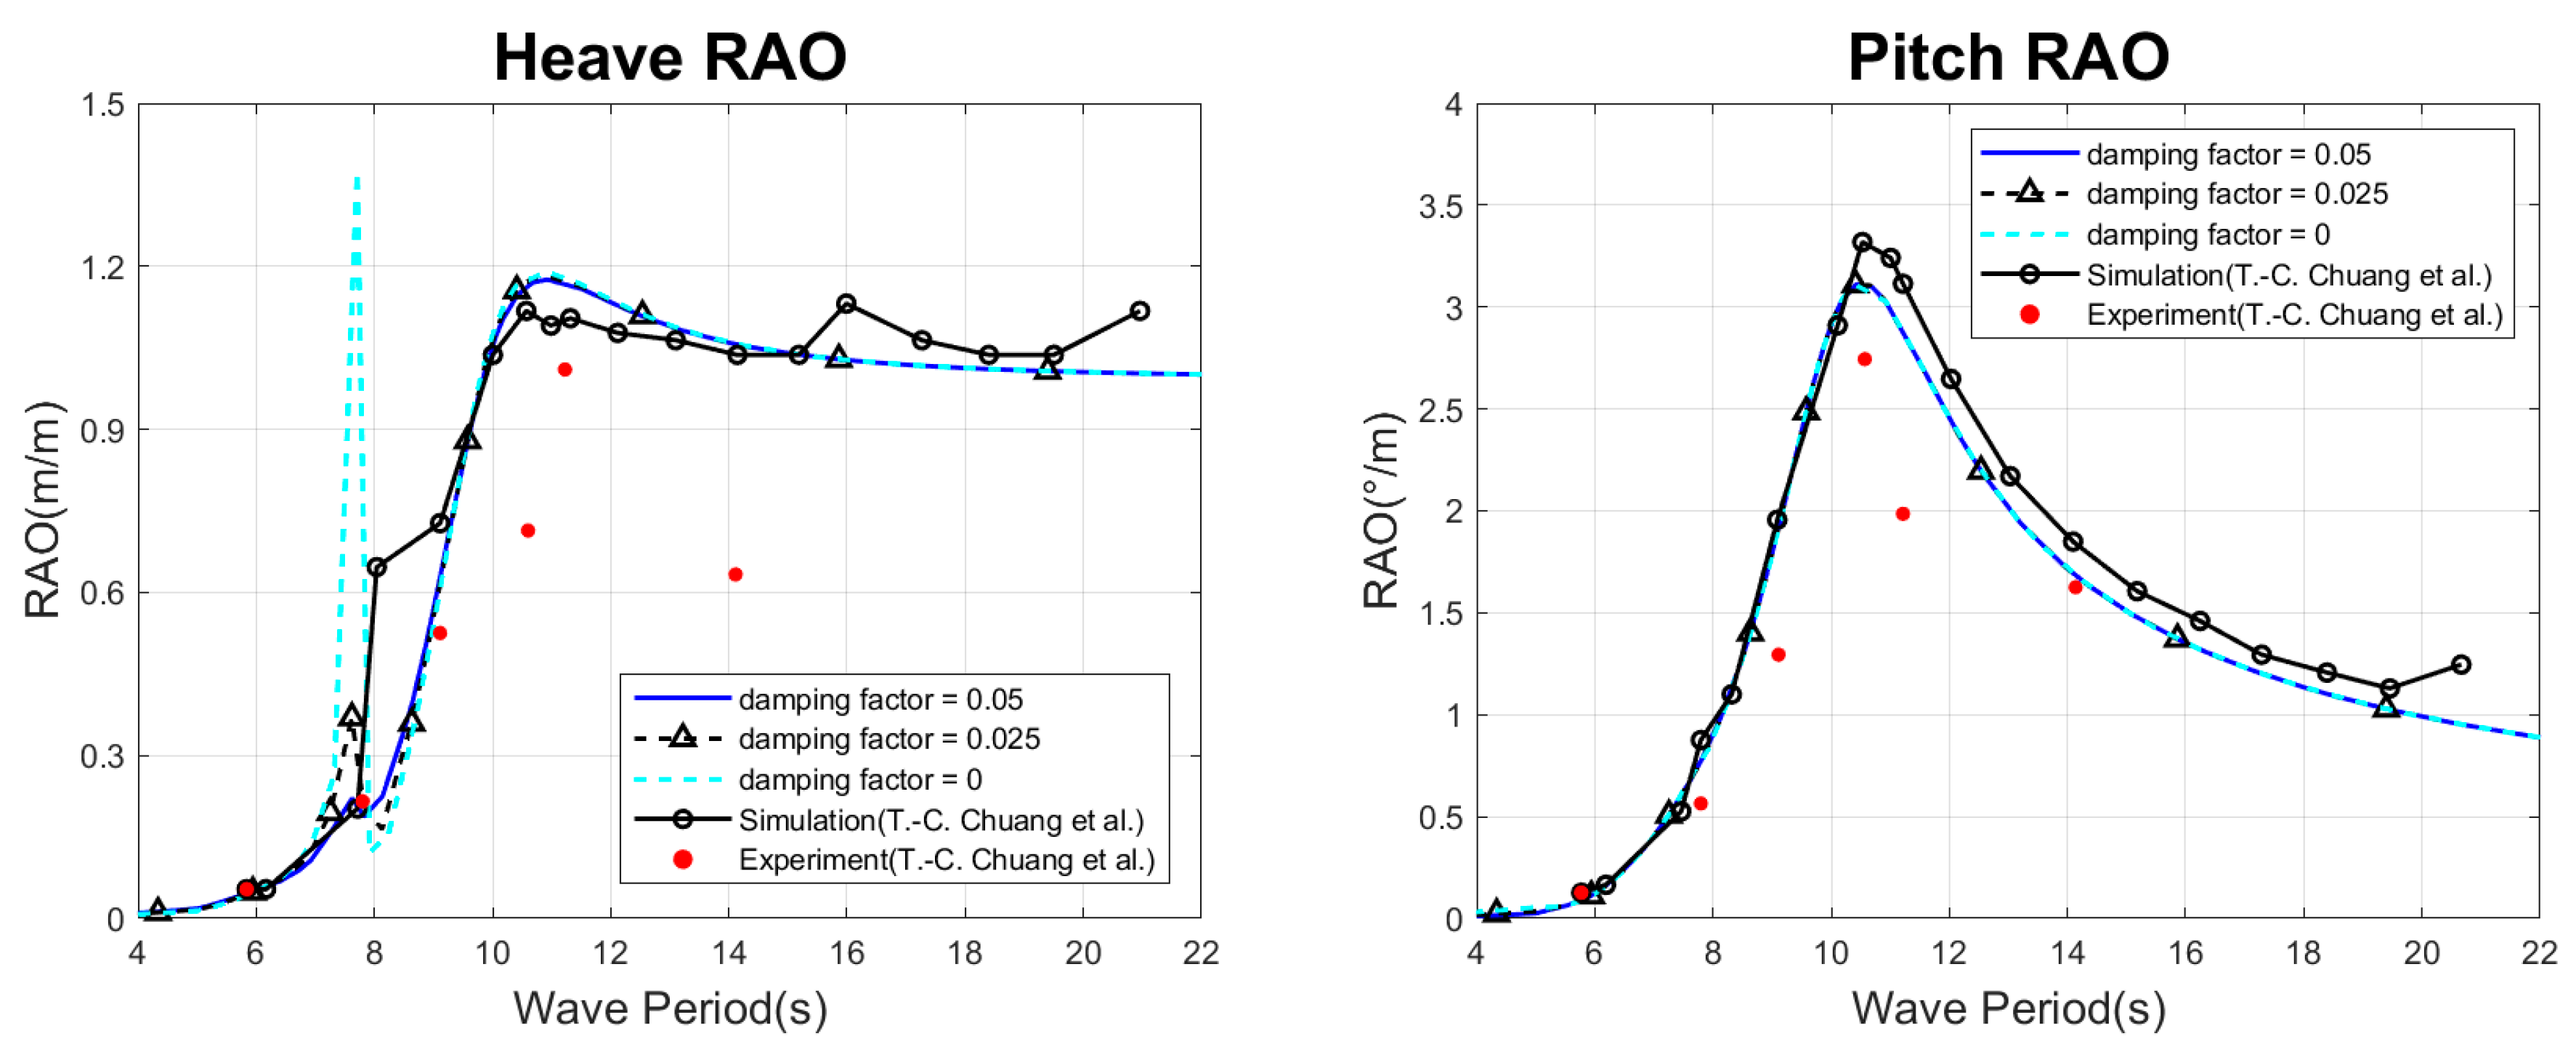
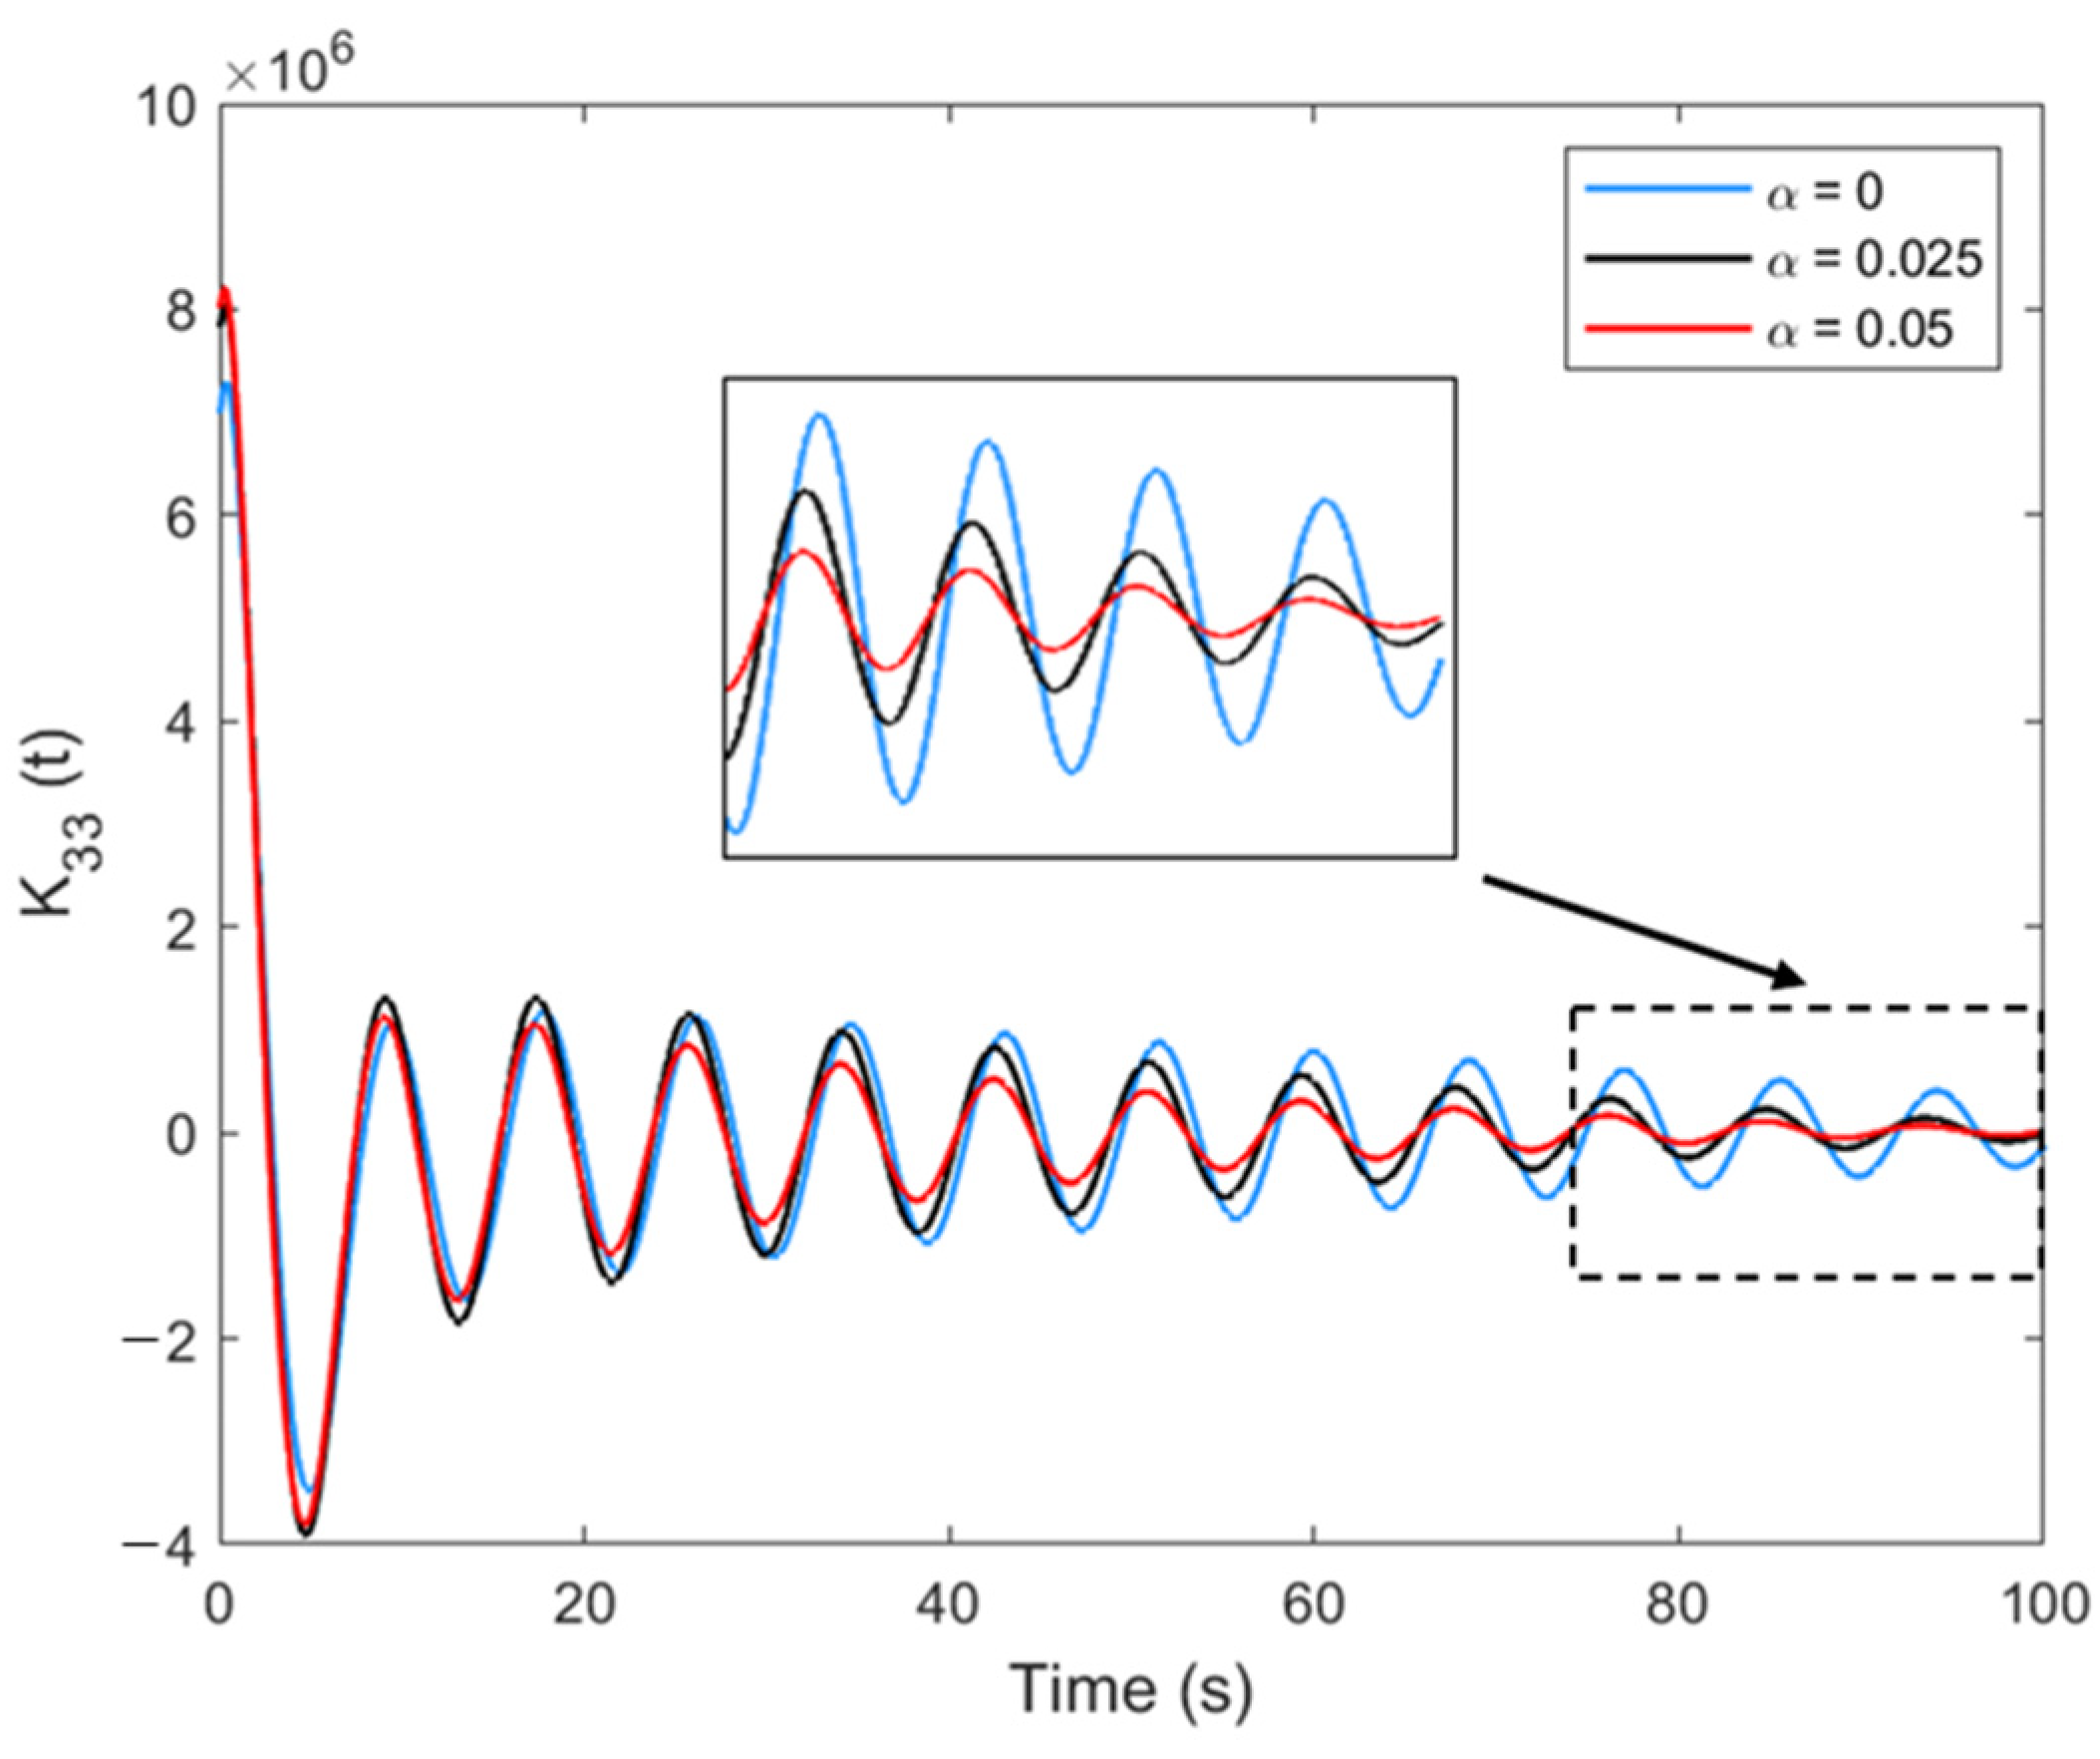
  • Because of the lack of viscosity, the wave elevation at the free water surface in the moonpool and the heave RAO of the barge-type FOWT are overestimated at the resonance frequency, and their effects can be effectively corrected by using the damping lid method in AQWA. In addition, the damping lid method can effectively reduce the oscillation amplitude of the impulse response function K33(t), and the longer the time, the greater the reduction amplitude, thus shortening the decay time. In this study, when the damping factor is taken as 0.05, the heave and pitch RAOs obtained from the simulation are in good agreement with the previous experimental results, and the overestimation of wave elevation can be suitably suppressed, and at the same time, K33(t) is allowed to almost decay to 0 at 100 s, which may be beneficial for the accuracy of the time-domain calculation results.
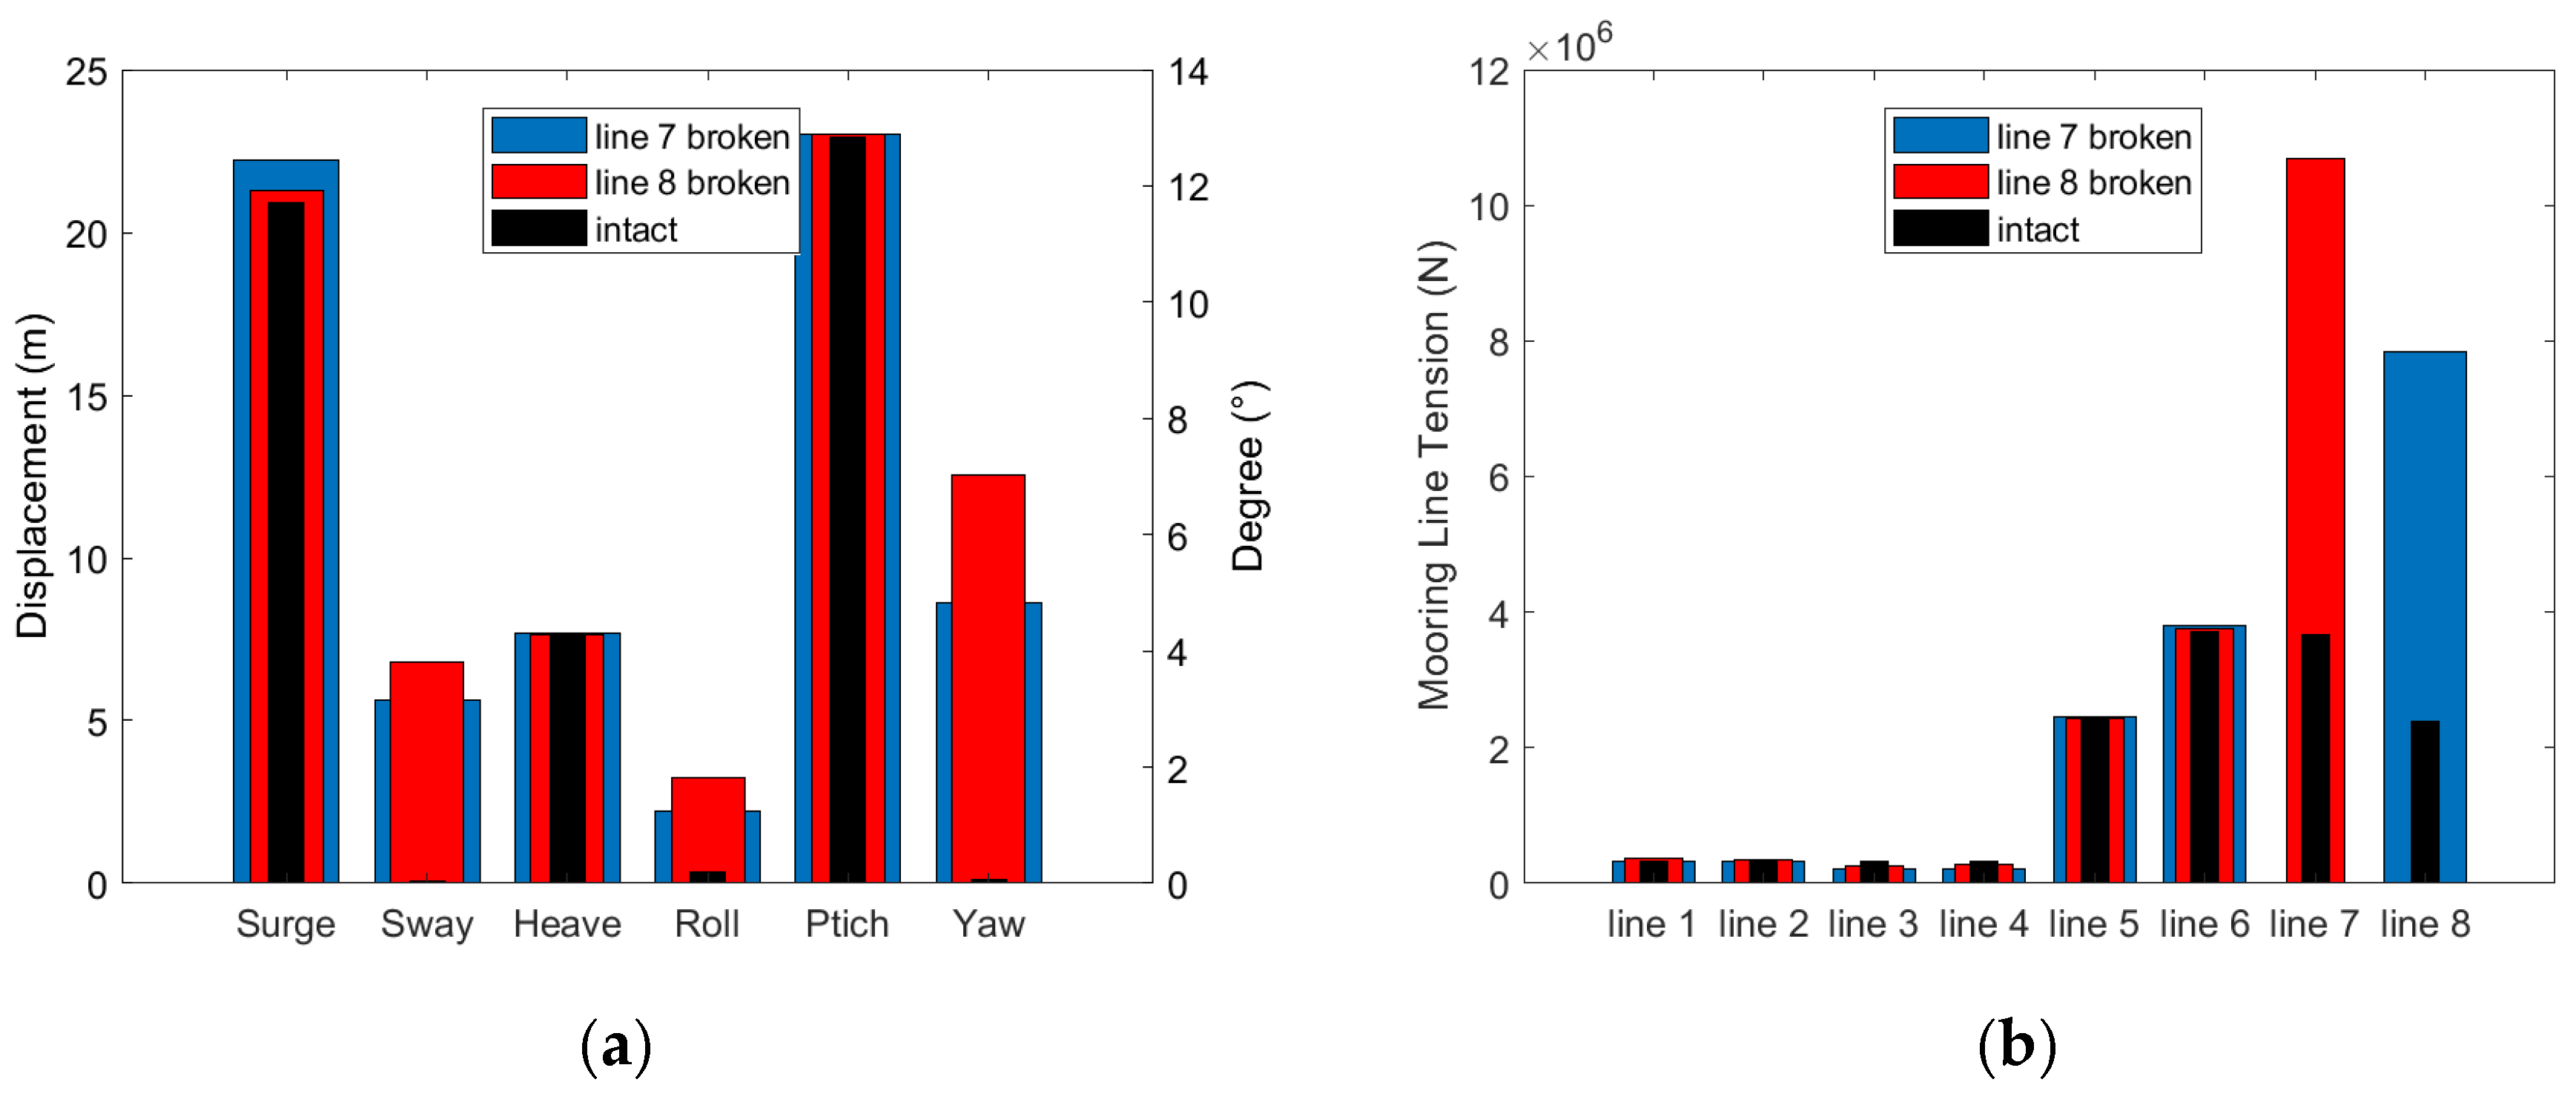
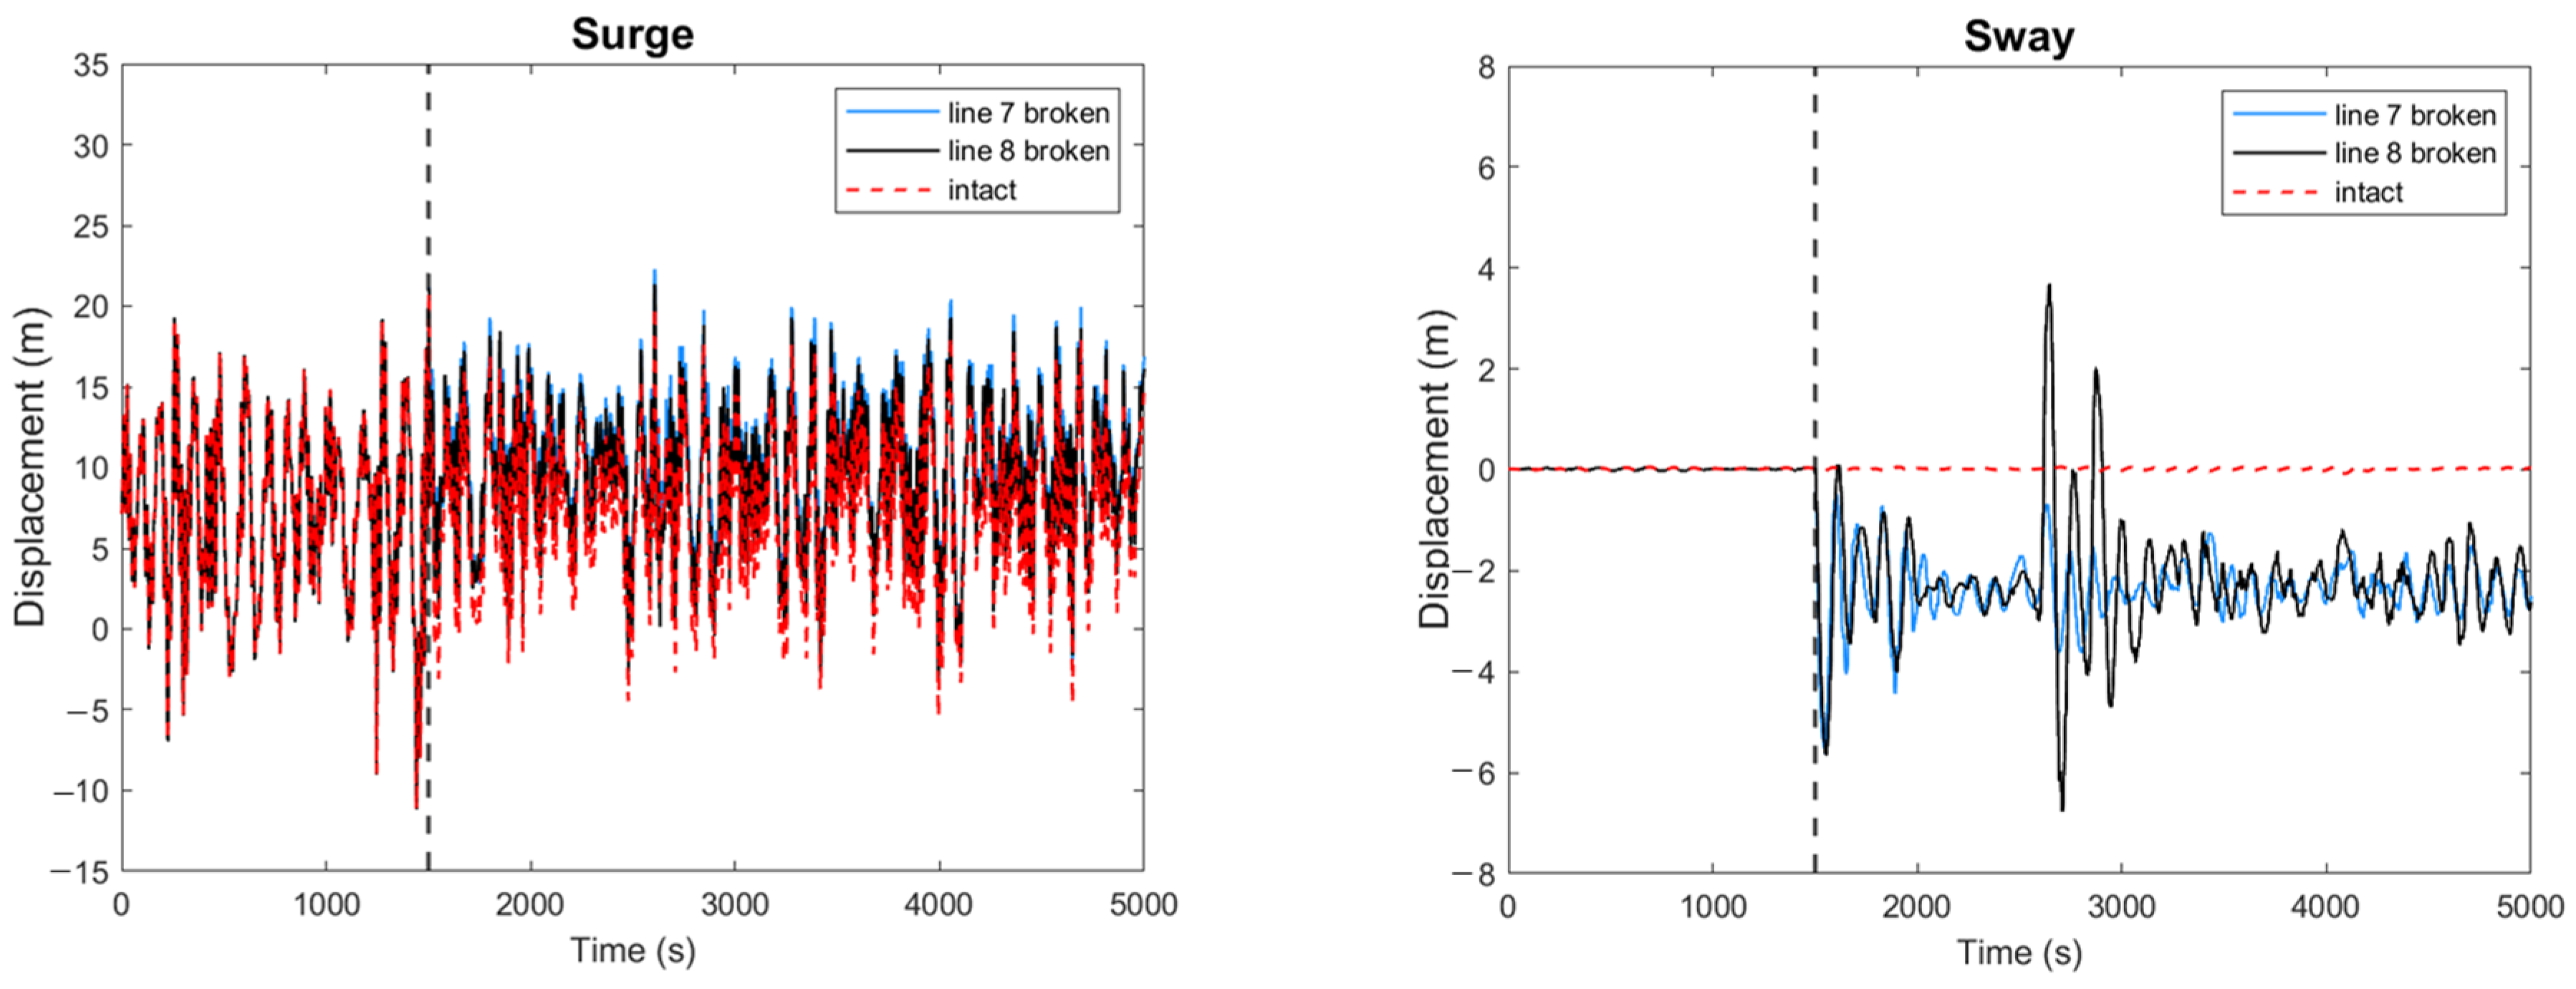
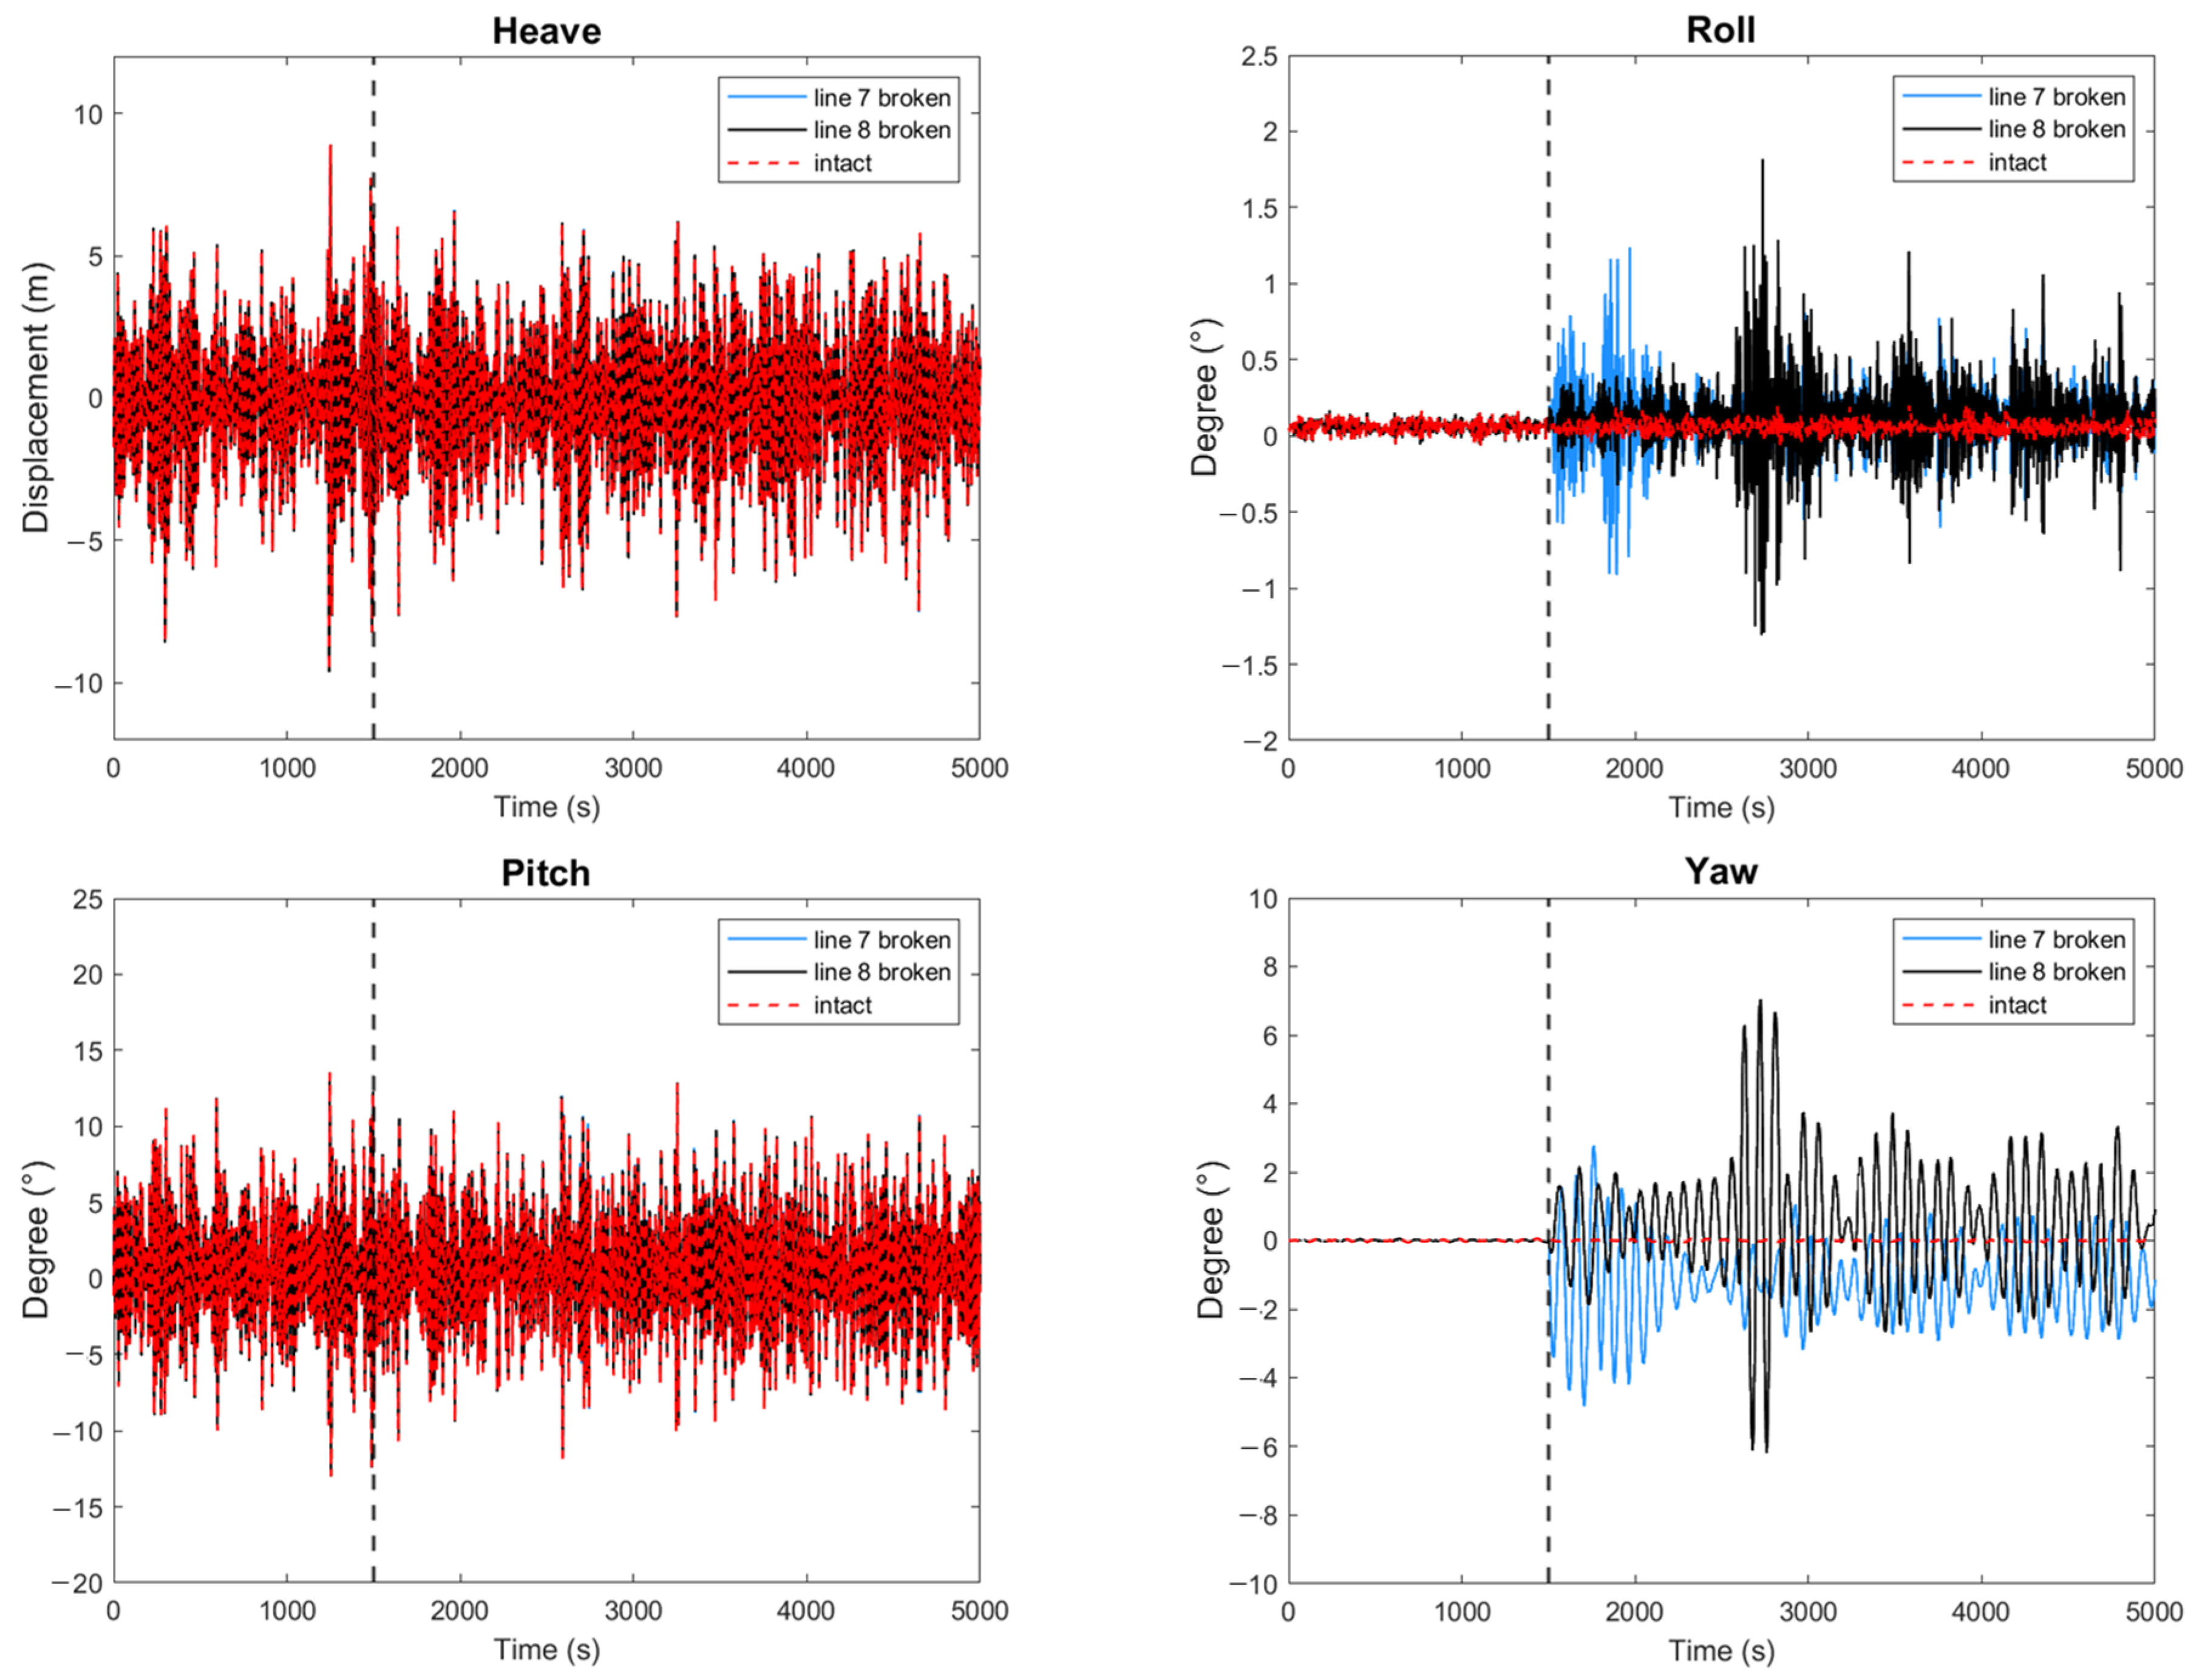
  • After one of the upwind mooring-line breaks, the mooring system still maintains good positioning capabilities. The failure has almost no impact on the heave- and pitch-mode motions. The sway and yaw motions increase to 5.64 m and 4.82° after failure, and the other modal motions increase marginally. Line 8 breakage has a greater effect on motions and mooring tensions than line 7 breakage. After the failure of line 8, the maximum tension of the adjacent mooring line increases by 2.91 times compared to the intact condition, which is 58.9% of the minimum breaking strength.
  • The simultaneous breakage of line 6 and line 7 has a small effect on the motions but significantly increases the maximum tension of the remaining upwind mooring lines by a factor of 3.9 relative to the intact condition, reaching 51.2% of the minimum breaking strength. The simultaneous breakage of line 7 and line 8, mooring lines located at one corner, has a significant impact on the surge, sway, roll, and yaw modes, with the surge drift reaching a maximum of 436.7 m. It also leads to a cascading failure phenomenon in the mooring system, which may be avoided by appropriately increasing the diameter and grade of the mooring chain.

Author Contributions

M.C.: investigation, methodology, software, writing—original draft, funding acquisition, resources. L.Y.: investigation, methodology, software, data curation, writing—original draft. X.S.: methodology, software, data curation, writing—original draft. J.P.: conceptualization, supervision, methodology, writing—review and editing. K.Z.: conceptualization, investigation, data curation, validation. L.L.: investigation, methodology, data curation, software, formal analysis. Q.Y.: data curation, software, validation, writing—original draft. Z.C.: data curation, software, funding acquisition, resources, writing—review and editing. All authors have read and agreed to the published version of the manuscript.

Funding

This research was supported by the Research Project of China Three Gorges Corporation, grant number WWKY-2020-0403, and the National Natural Science Foundation of China, grant number 52171275.

Institutional Review Board Statement

Not applicable.

Informed Consent Statement

Not applicable.

Data Availability Statement

Data are contained within the article.

Conflicts of Interest

Author Xinghan Sun was employed by the company Powerchina (Xi’an) Port Navigation Shipbuliding Technology Co., Ltd.; Author Lin Lin was employed by the company Shanghai Investigation, Design & Research Institute Co., Ltd.; Author Ziwen Chen was employed by the company China Three Gorges Corporation. The remaining authors declare that the research was conducted in the absence of any commercial or financial relationships that could be construed as a potential conflict of interest.

References

  1. Global Wind Report 2023. Available online: https://gwec.net/globalwindreport2023/ (accessed on 5 October 2023).
  2. Hong, L.; Möller, B. Offshore wind energy potential in China: Under technical, spatial and economic constraints. Energy 2011, 36, 4482–4491. [Google Scholar] [CrossRef]
  3. Chen, M.; Jiang, J.; Zhang, W.; Li, C.B.; Zhou, H.; Jiang, Y.; Sun, X. Study on Mooring Design of 15 MW Floating Wind Turbines in South China Sea. J. Mar. Sci. Eng. 2024, 12, 33. [Google Scholar] [CrossRef]
  4. Da, Z.; Xiliang, Z.; Jiankun, H.; Qimin, C. Offshore wind energy development in China: Current status and future perspective. Renew. Sustain. Energy Rev. 2011, 15, 4673–4684. [Google Scholar] [CrossRef]
  5. Chen, M.; Deng, J.; Yang, Y.; Zhou, H.; Tao, T.; Liu, S.; Sun, L.; Hua, L. Performance Analysis of a Floating Wind–Wave Power Generation Platform Based on the Frequency Domain Model. J. Mar. Sci. Eng. 2024, 12, 206. [Google Scholar] [CrossRef]
  6. Jonkman, J.M.; Matha, D. Dynamics of offshore floating wind turbines—Analysis of three concepts. Wind. Energy 2011, 14, 557–569. [Google Scholar] [CrossRef]
  7. Jonkman, J.M. Loads Analysis of a Floating Offshore Wind Turbine Using Fully Coupled Simulation; National Renewable Energy Lab. (NREL): Golden, CO, USA, 2007. [Google Scholar]
  8. Molin, B. On the piston and sloshing modes in moonpools. J. Fluid Mech. 2001, 430, 27–50. [Google Scholar] [CrossRef]
  9. Newman, J.N. Wave effects on multiple bodies. Hydrodyn. Ship Ocean Eng. 2001, 3, 3–26. [Google Scholar]
  10. Molin, B.; Zhang, X.; Huang, H.; Remy, F. On natural modes in moonpools and gaps in finite depth. J. Fluid Mech. 2018, 840, 530–554. [Google Scholar] [CrossRef]
  11. Moradi, N.; Zhou, T.; Cheng, L. Effect of inlet configuration on wave resonance in the narrow gap of two fixed bodies in close proximity. Ocean Eng. 2015, 103, 88–102. [Google Scholar] [CrossRef]
  12. Chen, M.; Zou, M.; Zhu, L.; Ouyang, M.; Liang, Q.; Zhao, W. A fully coupled time domain model capturing nonlinear dynamics of float-over deck installation. Ocean Eng. 2024, 293, 116721. [Google Scholar] [CrossRef]
  13. Zhao, W.; Pan, Z.; Lin, F.; Li, B.; Taylor, P.H.; Efthymiou, M. Estimation of gap resonance relevant to side-by-side offloading. Ocean Eng. 2018, 153, 1–9. [Google Scholar] [CrossRef]
  14. Zou, M.; Chen, M.; Zhu, L.; Yun, Q.; Zhao, W.; Liang, Q.; Zhao, Y. Experimental and numerical investigation of gap resonances between side-by-side fixed barges under beam sea excitation. Ocean Eng. 2024, 297, 117150. [Google Scholar] [CrossRef]
  15. Malta, E.B.; Ruggeri, F.; Cardozo de Mello, P.; Vilameá, E.M.; de Oliveira, A.C.; Nishimoto, K. Semi-Submersible Hub Platform with an Internal Dock Model Testing. In Proceedings of the International Conference on Offshore Mechanics and Arctic Engineering, San Francisco, CA, USA, 8–13 June 2014; p. V01BT01A037. [Google Scholar]
  16. Chen, X.-B. Hydrodynamic analysis for offshore LNG terminals. In Proceedings of the 2nd International Workshop on Applied Offshore Hydrodynamics, Rio de Janeiro, Brazil, 14–15 April 2005. [Google Scholar]
  17. Taylor Eatock, R. Gap resonances in focused wave groups. In Proceedings of the 23rd International Workshop on Water Waves and Floating Bodies, Jeju, Republic of Korea, 13–16 April 2008. [Google Scholar]
  18. Huijsmans, R.; Pinkster, J.; De Wilde, J. Diffraction and radiation of waves around side-by-side moored vessels. In Proceedings of the ISOPE International Ocean and Polar Engineering Conference, Kitakyushu, Japan, 25–31 May 2001; p. ISOPE–I-01-061. [Google Scholar]
  19. Newman, J. Progress in wave load computations on offshore structures. In Proceedings of the 23rd OMAE Conference, Vancouver, BC, Canada, 20–25 June 2004. [Google Scholar]
  20. Ansys, A. AQWA Theory Manual; AQWA: Canonsburg, PA, USA, 2023. [Google Scholar]
  21. WAMIT. User Manual (v73). Available online: https://www.wamit.com/manualupdate/v73_manual.pdf (accessed on 21 March 2024).
  22. DNV. Wadam—Wave Analysis by Diffraction and Morison Theory; SESAM User Manual: Oslo, Norway, 2014. [Google Scholar]
  23. Trubat, P.; Molins, C.; Alarcon, D.; Arramounet, V.; Mahfouz, M.Y. Mooring fatigue verification of the WindCrete for a 15 MW wind turbine. In Proceedings of the International Conference on Offshore Mechanics and Arctic Engineering, Online, 5–6 April 2021; p. V001T001A017. [Google Scholar]
  24. Yang, C.K.; Kim, M. The structural safety assessment of a tie-down system on a tension leg platform during hurricane events. Ocean Syst. Eng. 2011, 1, 263–283. [Google Scholar] [CrossRef]
  25. Bae, Y.H.; Kim, M.H.; Kim, H.C. Performance changes of a floating offshore wind turbine with broken mooring line. Renew. Energy 2017, 101, 364–375. [Google Scholar] [CrossRef]
  26. Prislin, I.; Maroju, S. Mooring integrity and machine learning. In Proceedings of the Offshore Technology Conference, Houston, TX, USA, 1–4 May 2017; p. D031S034R007. [Google Scholar]
  27. Chen, M.; Chen, Y.; Li, T.; Tang, Y.; Ye, J.; Zhou, H.; Ouyang, M.; Zhang, X.; Shi, W.; Sun, X. Analysis of the wet-towing operation of a semi-submersible floating wind turbine using a single tugboat. Ocean Eng. 2024, 299, 117354. [Google Scholar] [CrossRef]
  28. Yang, C.K.; Padmanabhan, B.; Murray, J.; Kim, M. The transient effect of tendon disconnection on the global motion of ETLP. In Proceedings of the International Conference on Offshore Mechanics and Arctic Engineering, Estoril, Portugal, 15–20 June 2008; pp. 497–507. [Google Scholar]
  29. Yu, J.; Hao, S.; Yu, Y.; Chen, B.; Cheng, S.; Wu, J. Mooring analysis for a whole TLP with TTRs under tendon one-time failure and progressive failure. Ocean Eng. 2019, 182, 360–385. [Google Scholar] [CrossRef]
  30. Han, J.S.; Son, Y.-J.; Choi, H.S.; Rho, J.B. The transient behavior of mooring systems in line-broken condition. In Proceedings of the ISOPE International Ocean and Polar Engineering Conference, Maui, HI, USA, 19–24 June 2011; p. ISOPE–I-11-434. [Google Scholar]
  31. Le, C.; Li, Y.; Ding, H. Study on the coupled dynamic responses of a submerged floating wind turbine under different mooring conditions. Energies 2019, 12, 418. [Google Scholar] [CrossRef]
  32. Ren, Y.; Venugopal, V.; Shi, W. Dynamic analysis of a multi-column TLP floating offshore wind turbine with tendon failure scenarios. Ocean Eng. 2022, 245, 110472. [Google Scholar] [CrossRef]
  33. Ren, Y.; Shi, W.; Venugopal, V.; Zhang, L.; Li, X. Experimental study of tendon failure analysis for a TLP floating offshore wind turbine. Appl. Energy 2024, 358, 122633. [Google Scholar] [CrossRef]
  34. Zhang, C.; Wang, S.; Xie, S.; He, J.; Gao, J.; Tian, C. Effects of mooring line failure on the dynamic responses of a semisubmersible floating offshore wind turbine including gearbox dynamics analysis. Ocean Eng. 2022, 245, 110478. [Google Scholar] [CrossRef]
  35. Zhang, X.; He, L.; Ma, G.; Ma, Q. Mechanism of mooring line breakage and shutdown opportunity analysis of a semi-submersible offshore wind turbine in extreme operating gust. Ocean Eng. 2023, 268, 113399. [Google Scholar] [CrossRef]
  36. Li, Y.; Zhu, Q.; Liu, L.; Tang, Y. Transient response of a SPAR-type floating offshore wind turbine with fractured mooring lines. Renew. Energy 2018, 122, 576–588. [Google Scholar] [CrossRef]
  37. Wu, H.; Zhao, Y.; He, Y.; Shao, Y.; Mao, W.; Han, Z.; Huang, C.; Gu, X.; Jiang, Z. Transient response of a TLP-type floating offshore wind turbine under tendon failure conditions. Ocean Eng. 2021, 220, 108486. [Google Scholar] [CrossRef]
  38. Zhou, Y.; Feng, S.; Guo, X.; Tian, F.; Han, X.; Shi, W.; Li, X. Initial Design of a Novel Barge-Type Floating Offshore Wind Turbine in Shallow Water. J. Mar. Sci. Eng. 2023, 11, 464. [Google Scholar] [CrossRef]
  39. Yang, Y.; Bashir, M.; Li, C.; Wang, J. Investigation on mooring breakage effects of a 5 MW barge-type floating offshore wind turbine using F2A. Ocean Eng. 2021, 233, 108887. [Google Scholar] [CrossRef]
  40. DNVGL. DNVGL-RP-0286 Coupled Analysis of Floating Wind Turbines; DNVGL: Bærum, Norway, 2019. [Google Scholar]
  41. Jia, W.; Yue, M.; Miao, W.; Yang, Y.; Li, C. Dynamic analysis of a 5 MW Barge-type FOWT with two-mooring failure of wind-wave misalignment scenarios. Ocean Eng. 2023, 285, 115456. [Google Scholar] [CrossRef]
  42. Jia, W.; Liu, Q.; Miao, W.; Yue, M.; Yang, Y.; Li, C. Investigation of barge-type FOWT in the context of concurrent and cascading failures within the mooring systems. Renew. Energy 2024, 224, 120119. [Google Scholar] [CrossRef]
  43. Shi, W.; Zhang, L.; Karimirad, M.; Michailides, C.; Jiang, Z.; Li, X. Combined effects of aerodynamic and second-order hydrodynamic loads for floating wind turbines at different water depths. Appl. Ocean Res. 2023, 130, 103416. [Google Scholar] [CrossRef]
  44. Vijay, K.; Karmakar, D.; Uzunoglu, E.; Soares, C.G. Performance of barge-type floaters for floating wind turbine. In Proceedings of the 2nd International Conference of Renewable Energies Offshore (Renew 2016), Lisbon, Portugal, 24–26 October 2016; pp. 24–26. [Google Scholar]
  45. Ikoma, T.; Nakamura, M.; Moritsu, S.; Aida, Y.; Masuda, K.; Eto, H. Effects of four moon pools on a floating system installed with twin-VAWTs. In Proceedings of the International Conference on Offshore Mechanics and Arctic Engineering, Glasgow, Scotland, 9–14 June 2019; p. V001T001A016. [Google Scholar]
  46. Ikoma, T.; Tan, L.; Moritsu, S.; Aida, Y.; Masuda, K. Motion characteristics of a barge-type floating vertical-axis wind turbine with moonpools. Ocean Eng. 2021, 230, 109006. [Google Scholar] [CrossRef]
  47. Chuang, T.-C.; Yang, W.-H.; Yang, R.-Y. Experimental and numerical study of a barge-type FOWT platform under wind and wave load. Ocean Eng. 2021, 230, 109015. [Google Scholar] [CrossRef]
  48. Cheetham, P.; Du, S.; May, R.; Smith, S. Hydrodynamic analysis of ships side by side in waves. In Proceedings of the International Aerospace CFD Conference, Paris, France, 18–19 June 2007. [Google Scholar]
  49. Cummins, W. The Impulse Response Function and Ship Motions; David W. Taylor Model Basin: Washington DC, USA, 1962. [Google Scholar]
  50. Ogilvie, T.F. Recent progress toward the understanding and prediction of ship motions. In Proceedings of the 5th Symposium on Naval Hydrodynamics, Bergen, Norway, 10–12 September 1964; pp. 3–80. [Google Scholar]
  51. API. Design and Analysis of Stationkeeping Systems for Floating Offshore Structures; American Petroleum Institute: Singapore, 2005. [Google Scholar]
  52. Ma, K.-T.; Luo, Y.; Kwan, C.-T.T.; Wu, Y. Mooring System Engineering for Offshore Structures; Gulf Professional Publishing: Houston, TX, USA, 2019. [Google Scholar]
  53. Xu, X.; Yang, J.-M.; Li, X.; Xu, L. Hydrodynamic performance study of two side-by-side barges. Ships Offshore Struct. 2014, 9, 475–488. [Google Scholar] [CrossRef]
  54. Zou, M.; Chen, M.; Zhu, L.; Li, L.; Zhao, W. A constant parameter time domain model for dynamic modelling of multi-body system with strong hydrodynamic interactions. Ocean Eng. 2023, 268, 113376. [Google Scholar] [CrossRef]
  55. Molin, B.; Remy, F.; Camhi, A.; Ledoux, A. Experimental and numerical study of the gap resonances in-between two rectangular barges. In Proceedings of the 13th Congress of the International Maritime Association of the Mediterranean IMAM 2009, Istanbul, Turkey, 12–15 October 2009. [Google Scholar]
  56. Malta, E.B.; Cueva, M.; Nishimoto, K.; Gonçalves, R.; Masetti, I.a. Numerical moonpool modeling. In Proceedings of the International Conference on Offshore Mechanics and Arctic Engineering, Hamburg, Germany, 4–9 June 2006; pp. 493–500. [Google Scholar]
  57. Xu, X.; Zhang, X.; Chu, B.; Huang, H. On natural frequencies of three-dimensional moonpool of vessels in the fixed and free-floating conditions. Ocean Eng. 2020, 195, 106656. [Google Scholar] [CrossRef]
  58. Pauw, W.H.; Huijsmans, R.H.; Voogt, A. Advances in the hydrodynamics of side-by-side moored vessels. In Proceedings of the International Conference on Offshore Mechanics and Arctic Engineering, San Diego, CA, USA, 10–15 June 2007; pp. 597–603. [Google Scholar]
Figure 1. Floating-barge platform with the NREL 5 MW wind turbine. (a) Global view, (b) Plan view.
Jmse 12 00617 g001
Figure 2. Hydrodynamic coefficients of barge-type FOWT, (a) Surge added mass, (b) Heave added mass, (c) Pitch added mass, (d) Surge radiation damping, (e) Heave radiation damping, (f) Pitch radiation damping.
Jmse 12 00617 g002
Figure 3. Plan view and free-surface wave-elevation RAO, (a) Plan view, (b) Damping factor = 0, (c) Damping factor = 0.025, (d) Damping factor = 0.05.
Jmse 12 00617 g003
Figure 4. Wave-elevation RAO in resonance frequency with different damping factors, (a) Wave-elevation RAO in 0.810 rad/s, (b) Wave-elevation RAO in 1.290 rad/s, (c) Wave-elevation RAO in 1.770 rad/s.
Jmse 12 00617 g004
Figure 5. RAOs for heave and pitch [47].
Jmse 12 00617 g005
Figure 6. Impulse response function K(t) of heave-heave.
Jmse 12 00617 g006
Figure 7. Barge-type FOWT motion and mooring-line tension statistics under operating conditions, (a) Surge-, heave- and pitch-mode motion, (b) line 5 and line 6 tension.
Jmse 12 00617 g007
Figure 8. Barge-type FOWT motion and mooring line tension statistics under extreme conditions, (a) Surge-, heave- and pitch-mode motion, (b) line 5 and line 6 tension.
Jmse 12 00617 g008
Figure 9. Barge-type FOWT motion and mooring line tension statistics of single-line failure and intact cases, (a) Six-degrees-of-freedom motion maximum, (b) Maximum mooring-line tension.
Jmse 12 00617 g009
Figure 10. Barge-type FOWT motion of single-mooring-line failure and intact cases under extreme conditions.
Jmse 12 00617 g010aJmse 12 00617 g010b
Figure 11. Mooring-line tension of single-mooring-line failure and intact cases under extreme conditions.
Jmse 12 00617 g011
Figure 12. Drift of barge-type FOWT after single-mooring-line failure.
Jmse 12 00617 g012
Figure 13. Barge-type FOWT motion and mooring-line tension statistics of double-line failure and intact cases, (a) Six-degrees-of-freedom motion maximum, (b) Maximum mooring-line tension.
Jmse 12 00617 g013
Figure 14. Barge-type FOWT motion of double-mooring-line failure and intact cases under extreme conditions.
Jmse 12 00617 g014
Figure 15. Mooring-line tension of double-mooring-line failure and intact cases under extreme conditions.
Jmse 12 00617 g015
Figure 16. Drift of barge-type FOWT after double-mooring-line failure.
Jmse 12 00617 g016
Table 1. Properties of the barge-type platform.
Barge-Type Platform Properties
Size (W × L × H) (m)60 × 60 × 15
Moonpool (W × L × H) (m)20 × 20 × 15
Draft (m)10
Displacement (m3)32,000
Mass, including the ballast (kg)32,200,282
XCG (m)−0.37
YCG (m)0.00
ZCG below sea level (m)−4.86
Roll inertia (kg·m2)9.66 × 10⁹
Pitch inertia (kg·m2)9.66 × 10⁹
Yaw inertia (kg·m2)1.93 × 10¹⁰
Table 2. Properties of the NREL 5 MW wind turbine.
OC5 NREL 5 MW Turbine Properties
Rotor mass, including blade (kg)674,000
Nacelle mass (kg)477,900
Tower mass, including instrumentation (kg)493,500
COG tower (m)43.85
Hub height (m)90
Sum mass (rotor + nacelle + tower) (kg)1,038,400
XCG (m)20.00
YCG (m)0.00
ZCG (m)70.60
Roll inertia (kg·m2)2.4 × 10⁸
Pitch inertia (kg·m2)2.4 × 10⁸
Yaw inertia (kg·m2)4.8 × 10⁸
Table 3. Properties of the mooring system.
Properties of the Mooring System
Number of mooring lines4 × 2
Anchor (Water) depth (m)50
Depth to fairleads below SWL (m)5
Separation between opposing anchors (m)424.3
Unstretched line length (m)300
Line diameter (m)0.162
Line mass density (kg/m)522.25
Grade of chainR3 (stud less)
Minimum breaking strength (N)1.816 × 10⁷
Table 4. Definition of load cases.
Load CaseWaveWindNote
Hs (m)Tp (s)Wind Speed (m/s)
LC 14.511.8114.8Operating condition
LC 24.511.81-
LC 3--14.8
LC 49.517.2837.4Extreme condition
LC 59.517.28-
LC 6--37.4
Table 5. Mooring line strength safety factor under extreme environmental conditions.
Mooring System ConditionStrength Factor of Safety (Dynamic Analysis)
Mobile Mooring and Permanent MooringAll Intact1.67
One Broken Line 1.25
Table 6. Properties of the initial and modified mooring system.
Mooring Lines ParametersInitialModified
Line diameter (m)0.1620.184
Line mass density (kg/m)522.25673.73
Grade of chain R3 (stud less)R4 (stud less)
Minimum breaking strength (N)1.816 × 1072.716 × 107
Disclaimer/Publisher’s Note: The statements, opinions and data contained in all publications are solely those of the individual author(s) and contributor(s) and not of MDPI and/or the editor(s). MDPI and/or the editor(s) disclaim responsibility for any injury to people or property resulting from any ideas, methods, instructions or products referred to in the content.

