Article

Digital Image Correlation Structural Strain Analysis of S235 Fillet-Welded Joints under Low-Cycle Fatigue Loadings

by
Pasqualino Corigliano
1,* and
Pingsha Dong
2
1
Department of Engineering, University of Messina, Contrada di Dio, Sant’Agata, 98166 Messina, Italy
2
Department of Naval Architecture and Marine Engineering, University of Michigan, Ann Arbor, MI 48109, USA
*
Author to whom correspondence should be addressed.
J. Mar. Sci. Eng. 2024, 12(4), 531; https://doi.org/10.3390/jmse12040531
Submission received: 22 February 2024 / Revised: 19 March 2024 / Accepted: 20 March 2024 / Published: 23 March 2024
(This article belongs to the Section Ocean Engineering)

Abstract

:
The main objectives of the present study were the application and validation of the newly proposed Digital Image Correlation equivalent structural strain approach for assessing the low-cycle fatigue life of S235 welded joints. Low-cycle fatigue tests were performed at a displacement ratio of minus one. Experimental tests were performed using two different ways of controlling the displacement amplitude: applying traditional low-cycle fatigue tests at a constant amplitude and stepwise succession tests at increasing amplitudes. A comprehensive, independent experimental procedure, proposed by the authors and not yet validated for steel welded joints, was applied to assess the equivalent structural strain range using the Digital Image Correlation technique for the traditional low-cycle fatigue tests and stepwise succession tests at increasing amplitudes. It is noteworthy that the values of the DIC equivalent structural strain (ΔEs from the DIC), calculated on the external sides of the samples, were utilized to predict fatigue life in correlation with the ASME mean curve and fall within the ±3σ scatter bands (external bands). In particular, most of the tests lie within the ±2σ boundary of the design curves except for some tests at low applied displacements. Moreover, it was shown that this method is applicable to stepwise succession tests with increasing displacement amplitudes, leading to significant time savings compared to conventional experimental tests.

1. Introduction

Fatigue-induced fractures are a common occurrence in ship structures [1]. Typically, these structures comprise plate details coupled to longitudinal and transverse members through welded joints [2]. These joints, known for being sites of high stress concentrations, face substantial environmental loading from wave pressure, ship movements, and loading/unloading maneuvers, resulting in considerable fatigue loads. The combination of stress concentrations and fatigue loads leads to cyclic stress, surpassing the local yield stress and often resulting in low-cycle fatigue (LCF) cracks [3] which are detectable within a few years of the start of a ship’s service life.
Furthermore, the welding process induces material property changes in the base material (BM), the heat-affected zone (HAZ), and the welded zone (WZ) [4], directly impacting structural integrity. Fatigue strength closely correlates with the precise geometrical discontinuity of welded joints, including the weld toe radius, flank angle, and weld size, producing stress concentration effects [5].
Various factors, such as the welding method, filler material, weld geometry, and post-weld heat treatment, influence the fatigue strength of welded joints [6].
Post-weld heat treatments, such as stress relief annealing, can enhance the fatigue life of titanium welds by relieving residual stresses and improving the microstructure of the welded joint. Several methods of measuring residual stresses as hardness or nanoindentations exist in the literature [7,8].
The fatigue assessment of welded joints has been extensively reviewed by several authors in recent years [9,10,11]. Various numerical approaches have been employed which are broadly categorized into global and local methods.
The nominal stress approach [12,13] assumes completely elastic behavior and assigns a fatigue class (FAT) based on S-N curves for welded joints with different geometries, representing fatigue strength at 2 × 10⁶ cycles. This approach does not consider local stress increments arising from structural discontinuities, such as the end of a stiffener or the specific local weld profile.
The structural stress approach [5,9,14,15], often thought of as the “hot spot” stress approach, multiplies the nominal stress range by an appropriate stress concentration factor. This method, derived through finite element analyses (FEAs), identifies critical locations with localized stress concentrations, providing insights into potential fatigue failure areas. However, it assumes idealized, perfectly aligned welded joints and may oversimplify real-world stress distributions, leading to uncertainties.
Advances in the structural stress approach include the development of an equivalent structural stress method by Dong and the extension of structural strain for low-cycle fatigue (LCF) assessments [16,17]. One of the key advantages is that the structural strain method’s results are insensitive to mesh variations. Additionally, fatigue data can be compared to a single master S-N/E-N curve valid for both high- and low-cycle fatigue regimes without the need for weld classification methods.
The notch stress approach [5,9] assumes elastic–linear material behavior and involves deriving stress at the weld toe or root by multiplying the stress concentration factor related to the notch by the nominal stress. With respect to structural stress, it considers the effect of nonlinear stress increases due to the presence of the weld and introduces a fictitious radius to simplify the geometry, especially for joints with a thickness equal to or less than 5 mm. The notch stress intensity factor (N-SIF) approach [18,19] offers advantages in capturing sensitivity to stress concentrations, making it suitable for analyzing situations in which failure occurs at notches or weld regions. However, the approach involves complex calculations, assumes elastic–linear material behavior, and is most applicable to joints with specific thicknesses, limiting its general applicability. Peak stress approaches [20,21] are finite element-oriented techniques designed for the efficient estimation of notch stress intensity factors. They involve calculating singular linear elastic peak stresses at V-notches or crack tips using a coarse finite element mesh. Fracture mechanics methods [22,23] are crucial for predicting how materials respond to loading conditions in the context of pre-existing defects. the equivalent strain energy density (ESED) and averaged strain energy density (SED) approaches [24,25,26,27] are based on the measure of the average strain energy density across specific regions of interest, i.e., sharp notches or welded joints. Critical distance methods (CDMs) [28,29] involve determining a critical distance from a stress concentration beyond which the influence on crack initiation and growth diminishes; thus, the effective stress that causes failure can be observed at a certain distance from the hot spot using the point method (PM) or the average along a line (LM), an area (AM), or a specific volume (VM). Notch strain approaches [30,31] provide a comprehensive assessment of stress concentrations in welded joints, offering advantages such as the incorporation of nonlinear stress effects and the consideration of geometric complexities.
Some of them were also enhanced to account for a multiaxial stress state [22,32,33,34,35,36,37].
In a comparative study, to evaluate a pad detail on the coaming of a Panamax container ship, Fricke et al. [38] applied fatigue assessment procedures from classification societies, i.e., the American Bureau of Shipping (ABS), Bureau Veritas/Registro Italiano Navale (BV/RINA), Det Norske Veritas (DNV), Germanischer Lloyd (GL), and others. Most classification societies support the nominal and hot-spot stress approaches, while few of them support the notch stress approach. Considerable variations in estimated fatigue lifespans were identified ranging from 1.8 to 20.7 years. The divergence in outcomes was attributed to assumptions concerning loads, the determination of local stress, and S–N curves.
Digital Image Correlation (DIC) is a powerful technique used to measure displacements and strains on the surface of an object subjected to deformation, and very interesting applications are reported in [39,40,41,42,43].
In prior investigations conducted by the authors of [8,44], comprehensive, full-field procedures, including Digital Image Correlation (DIC) and Infrared Thermography (IRT), were utilized in low-cycle fatigue (LCF) tests. The LCF tests were performed on a T-welded joint, and a tailored procedure was developed to examine the response of the studied welded joint subjected to LCF loading.
In this study, the ARAMIS 6.3 software and DIC were utilized to examine the local behavior near a welded fillet. Additionally, an entirely autonomous experimental methodology was applied to assess an equivalent structural strain range (Δεs-DIC) by means of the DIC method, which had never been applied in prior studies to S235 fillet-welded joints. The objective was to prove that the values of the equivalent structural strain, experimentally detected on the plate surface, and the corresponding number of cycles to failure can be correlated to the master E-N curve of the ASME Div 2 [16].

2. Low-Cycle Fatigue Tests

The examined specimens were made of mild steel S235JR, which is regularly used in shipbuilding, and welded through the MAG process, employing a 1.2 mm thick wire in accordance with DIN ISO 14341-A-G4Si1 regulations. Small-scale samples were built to replicate the realistic loading and boundary conditions of the large-scale model [45] observed in real service scenarios and realized at the Hamburg University of Technology. Figure 1b reports the small-scale specimen, showing a detail of the circle portion of Figure 1a that was obtained by welding a lower plate to a continuous upper plate, as illustrated in Figure 1a. Figure 1c reports the tested small-scale specimen.
Low-cycle fatigue tests were conducted under displacement control with a displacement ratio (Ru) of −1, utilizing a sinusoidal waveform for all tests. The experimental tests were performed in two different ways: applying traditional low-cycle fatigue tests at a constant amplitude and stepwise succession tests at increasing amplitudes. Servo-hydraulic universal testing machines were employed for the tests. During the tests, images of the specimens were acquired and processed using the ARAMIS system and Digital Image Correlation (DIC) technique. Digital Image Correlation is an optical measurement technique used to analyze the deformation, strain, and motion of objects or materials by tracking the displacement of surface points in a sequence of digital images. It is a non-contact, full-field measurement method that has applications in various fields, including materials science and engineering. This full-field technique is based on a set of fundamental steps.
  • Image acquisition: high-resolution digital images are captured before and after deformation or motion using cameras.
  • Image preprocessing: the acquired images undergo preprocessing to enhance contrast, remove noise, or improve quality based on specific application requirements.
  • Image correlation: DIC relies on pixel intensity or a pattern comparison between reference and deformed images. Algorithms analyze subsets of pixels in both images to determine displacement and deformation.
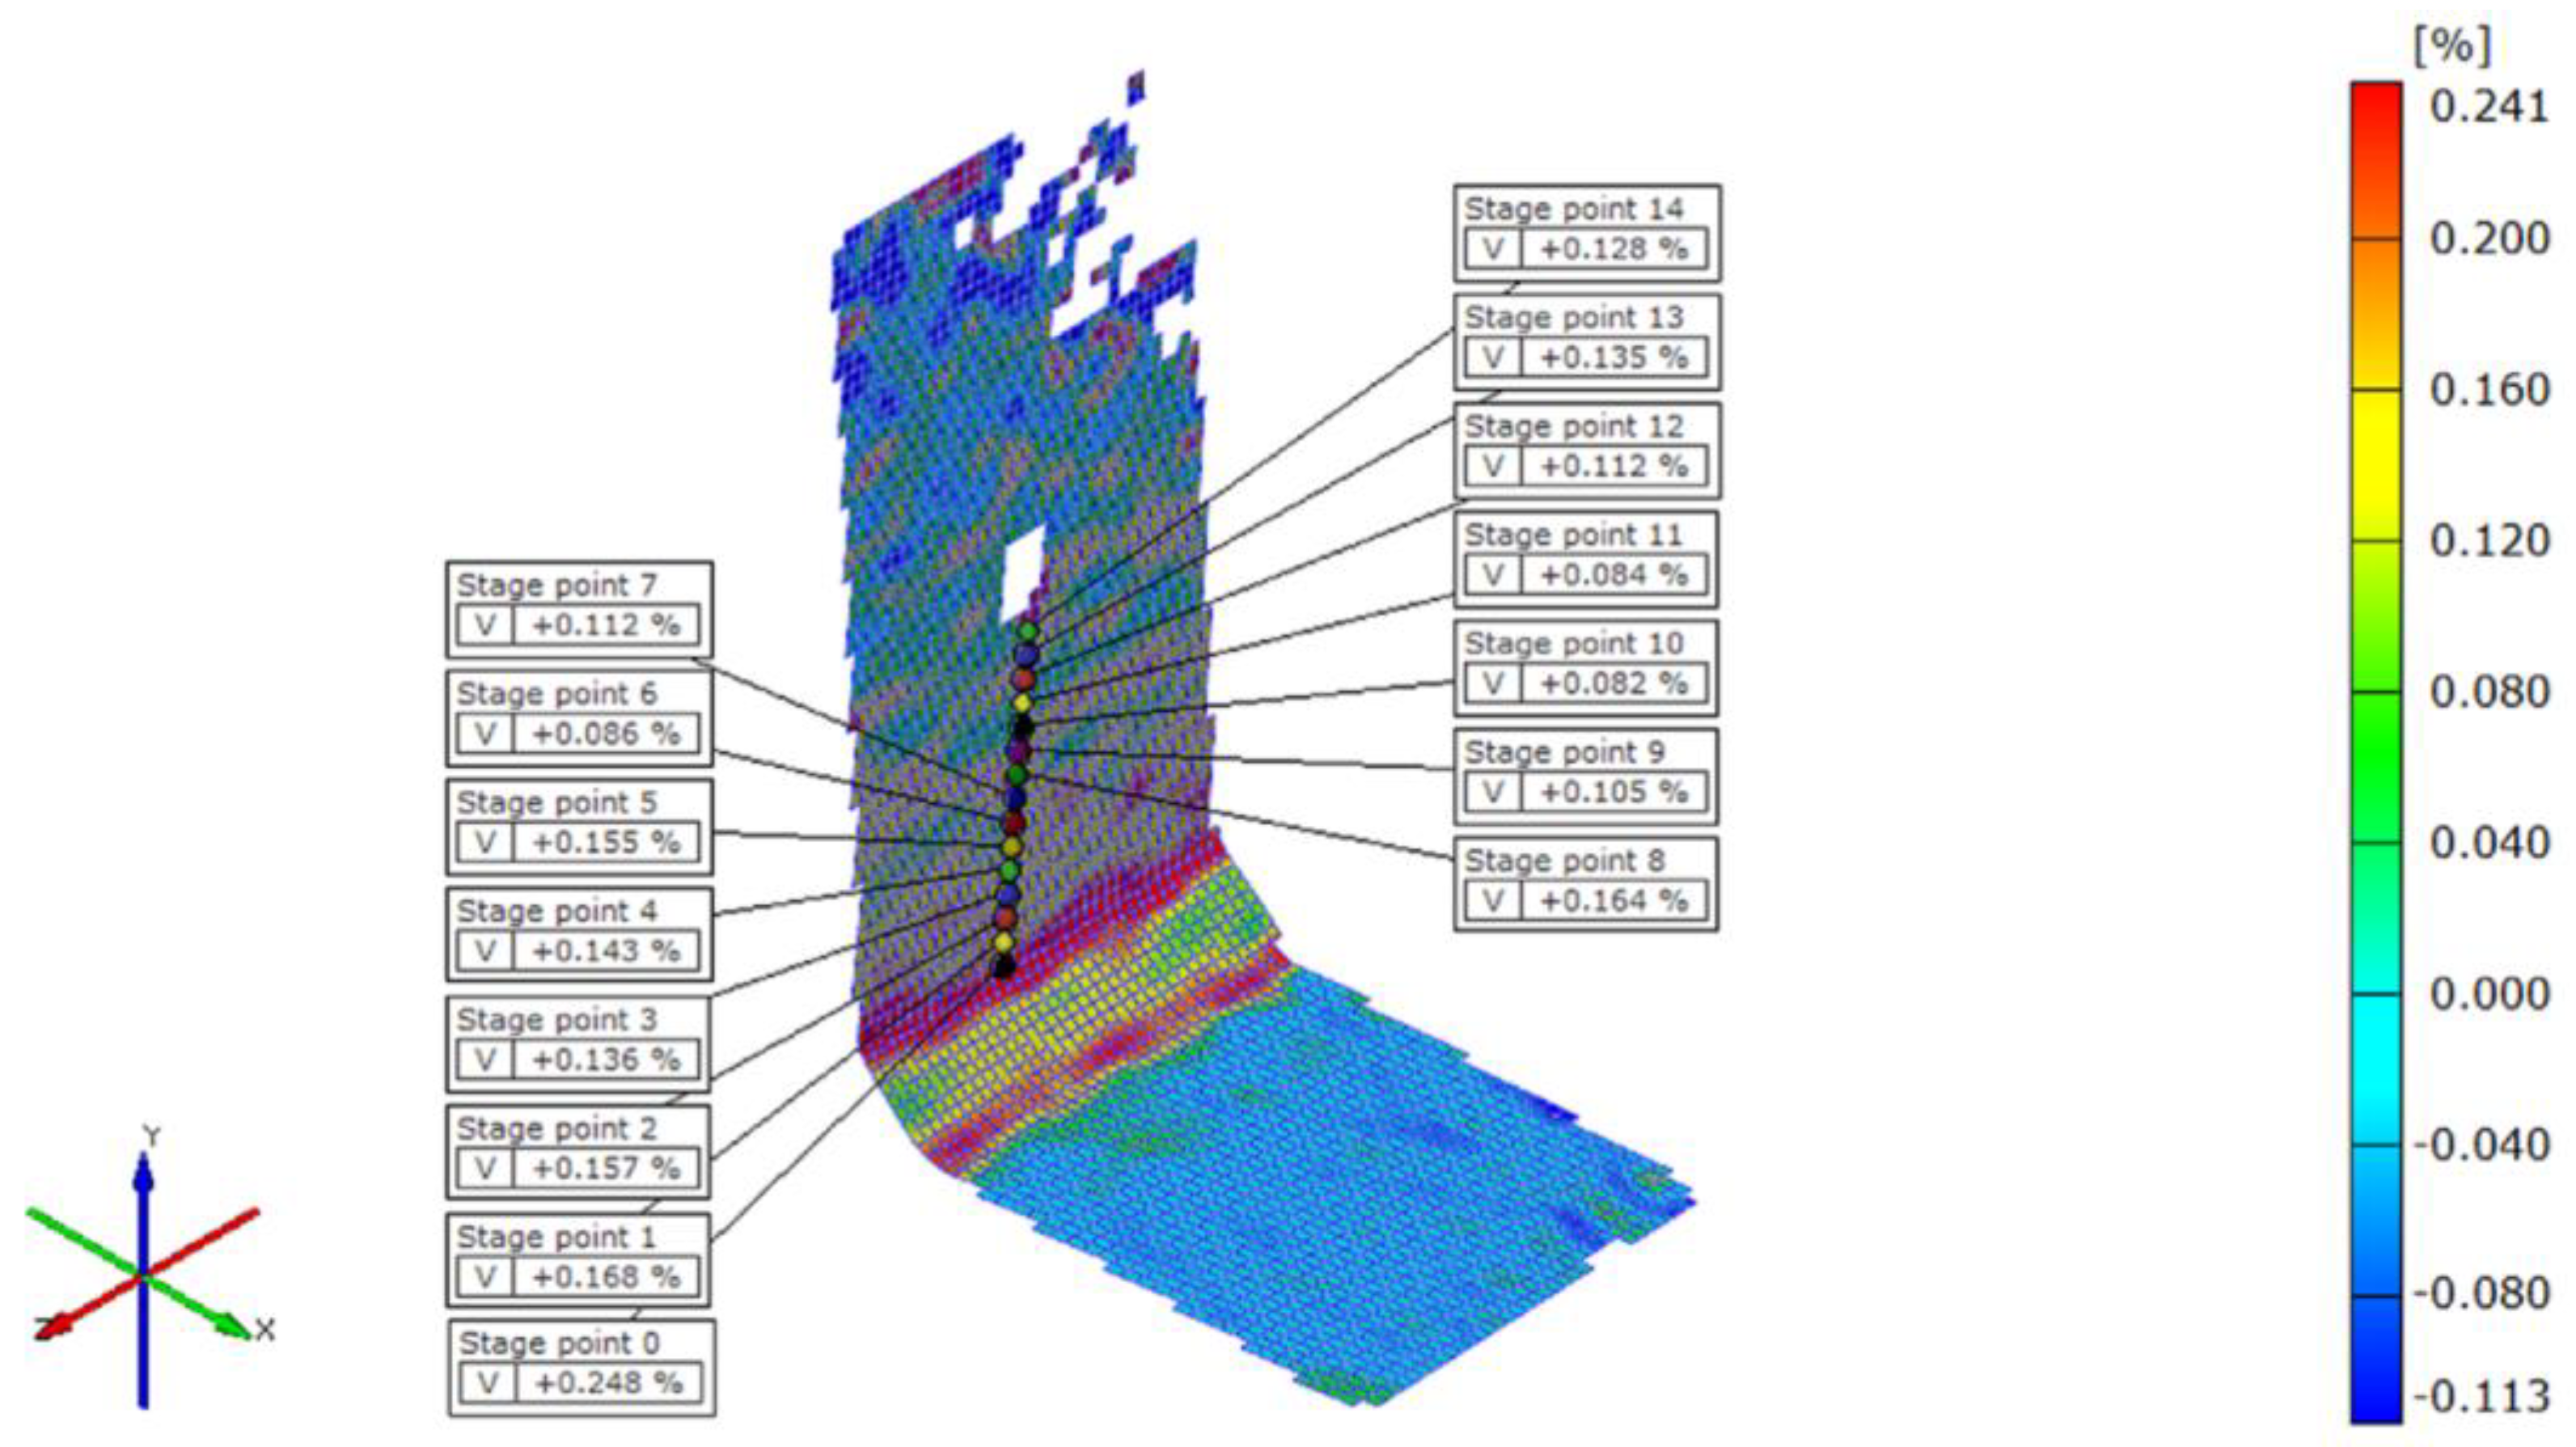
  • Deformation analysis: calculated displacements quantify deformation and strain on an object’s surface, often represented as a color-coded strain map.
  • Full-field results: DIC excels at providing full-field measurements, offering deformation information for every point on the analyzed surface, unlike traditional point-wise techniques. DIC boasts several advantages: it is a non-contact and optical technique, making it suitable for delicate or sensitive materials, it provides a high spatial resolution for detailed surface deformation analysis, and it is applicable to a broad spectrum of materials and structures.
Table 1 provides the parameters and outcomes of the tests, including the test frequency (f), the displacement amplitude (ua) applied at the upper plate, and the number of cycles to failure detected by the experimental tests (Nf_exp).
The DIC analysis allowed us to obtain, for a given point on the specimen’s surface, the local displacement and strain field during the LCF test.
The results in [8] indicate that the strain values at maximum and minimum loads do not have comparable magnitudes, especially for points close to the weld toe, due to residual stresses caused by the welding process. Additionally, the upper portion of the specimen is more loaded than the lower one due to the intricate mechanical response of the sample; some of the principal explanations can be directly ascribed to the weld geometry, welding-induced residual stresses, and the difference in the thickness of the two plates of 0.4 mm.
Further tests applying a succession of cyclic loadings on the specimen using a universal servo-hydraulic load machine at increasing displacement amplitudes were performed to determine hysteresis cycles. ARAMIS 3D 12M equipment was used to analyze the strain distribution on the surface of the specimen. Two cameras, each with a resolution of 4000 × 3000 pixels and a focal length of 50 mm, were used. The accuracy of the used system for the strain measurements is as high as 0.01%. The maximum acquisition frequency, at the highest resolution, is 58 Hz.
The tests were executed, controlling the displacement using a displacement ratio Ru = −1. Figure 2 reports the imposed displacement vs. the number of cycle curves of a stepwise test. To correlate displacement and strain values, the surface of the specimen was painted with a black-white speckle pattern, as displayed in Figure 3a. Figure 3b displays the first principal strain corresponding to the max load, and Figure 3c shows the third principal strain at the min load with an imposed displacement amplitude ua = 2 mm. The strain contour along the longitudinal direction of the upper plate is illustrated in Figure 4, while hysteresis cycles, in which the εy strain is measured at the weld toe, are plotted in Figure 5. The accumulation of cyclic deformation, also called the “ratcheting effect”, can explain the slope change denoted at an imposed displacement amplitude of 2 mm.
Some points (namely stage points, SPs) were inserted as shown in Figure 6 (which also shows the 3D map of the longitudinal strain with respect to the upper plate). The distance concerning two sequential SPs is 2 mm.
The evolution of the strain after 100, 2010, and 2505 cycles for the three stage points (SP0, SP3, and SP6) located, respectively, at distances of 0 mm, 6 mm, and 12 mm from the welded toe of the upper plate, is illustrated in Figure 7, Figure 8 and Figure 9.
The measured longitudinal strains corresponding to the maximum load are higher (in value) compared to the minimum load value because of the presence of residual stresses, though the strain range does not show significant changes. Unlike traditional experimental techniques such as strain gages, the 3D DIC system and the ARAMIS software 6.3 allow for the assessment of the deformation field near stress concentration zones. This approach made it possible to evaluate the structural strain range in terms of equivalent strains at the welding point through a DIC analysis.

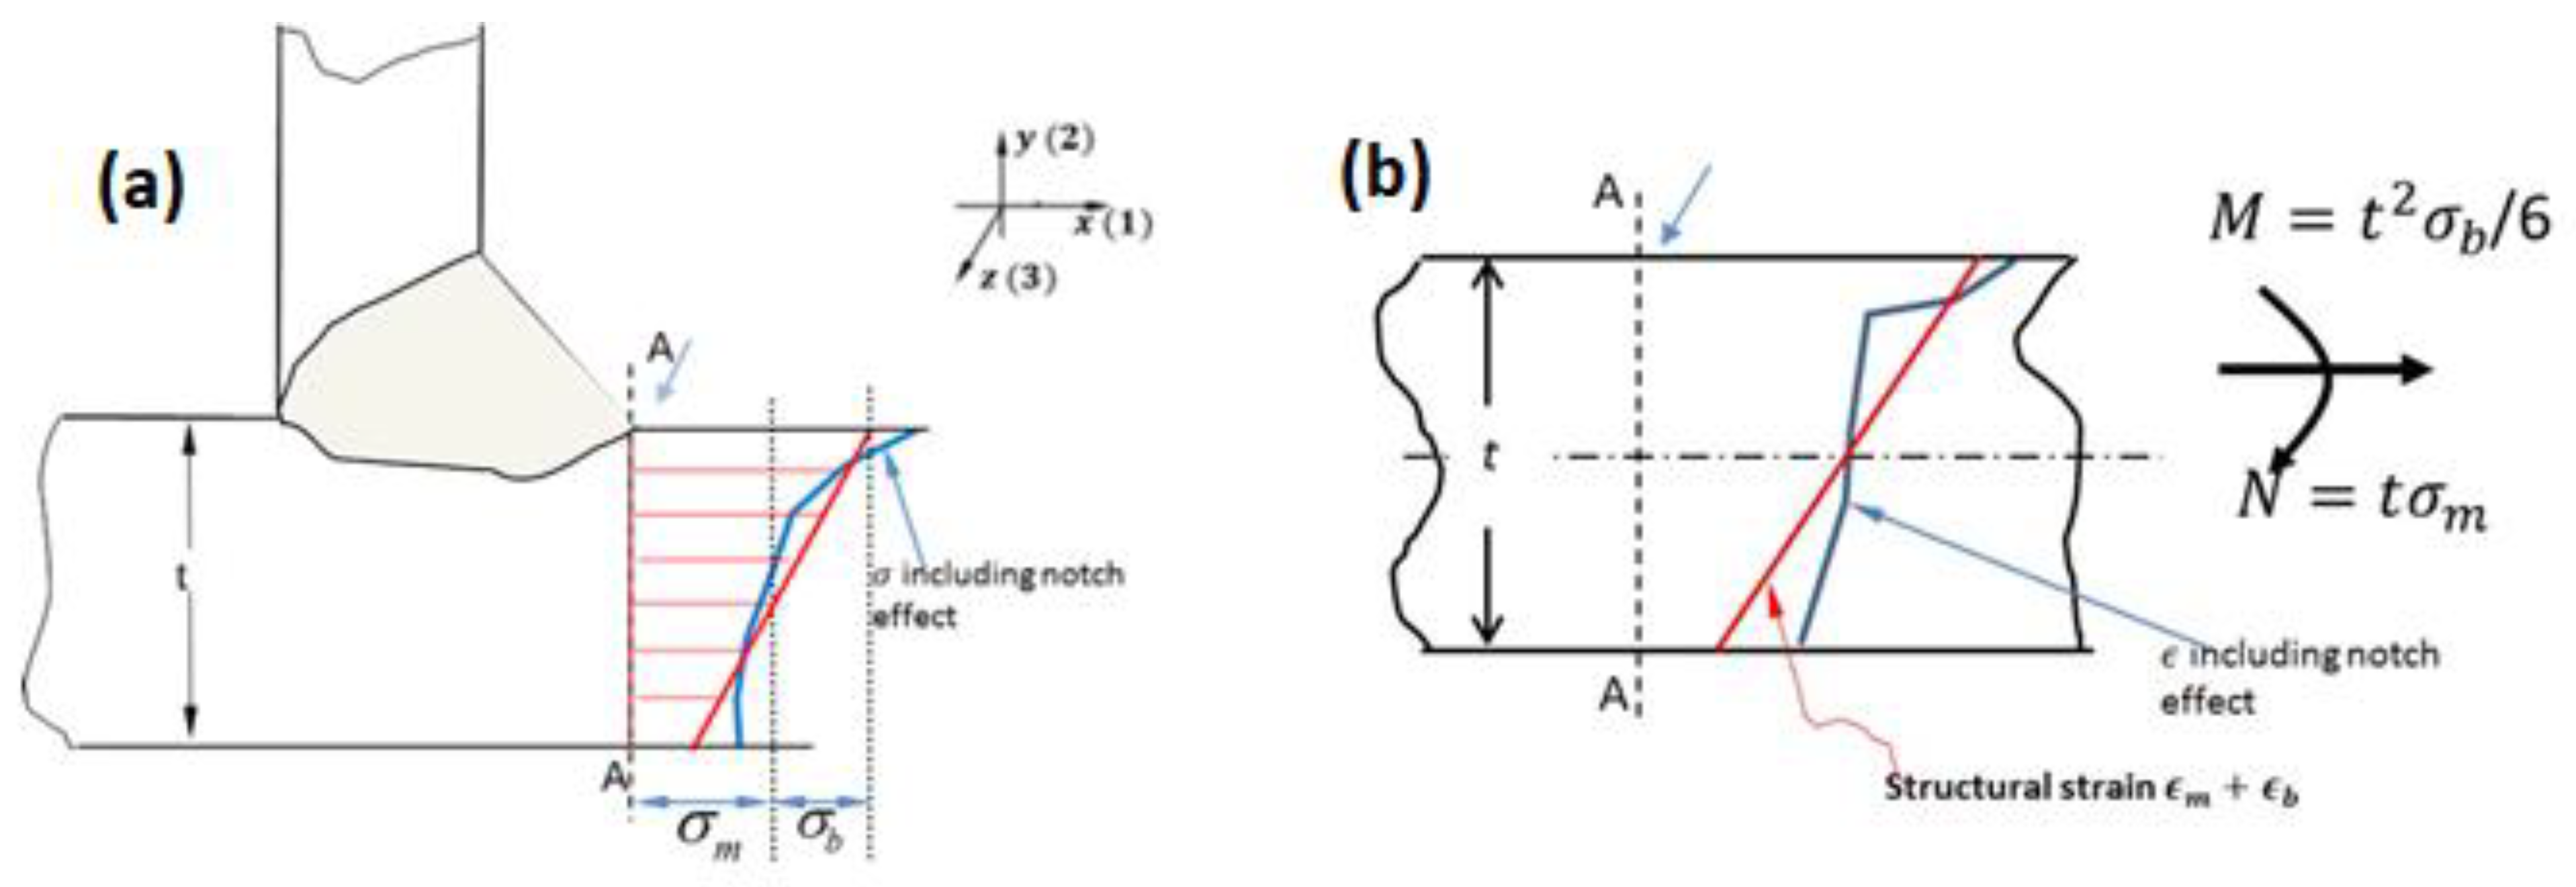
3. Structural Strain Approach

3.1. Structural Strain Approach Definition for FEA

The structural strain, as previously mentioned, considers the effect of the weld’s presence but does not consider the effect of the local weld toe (the opposite of the notch strain approach) and can be considered experimentally from the plate’s external surface and from the plate thickness, as defined in [44] and shown in Figure 10.
A structural strain parameter that addresses singularity in terms of strains at the weld toe was recently introduced. This parameter characterizes the distribution of strain in terms of through-thickness and has demonstrated the ability to effectively correlate both the low-cycle fatigue (LCF) life and high-cycle fatigue (HCF) life for welded constructions [17].
The calculation of the structural strain parameter involves analyzing finite element (FE) results. The definition of structural strain aligns with the explanation of traction structural stress specified in the ASME code [16].
The structural stress and structural strain methods were explicitly designed for analyzing the fatigue behavior of welded elements with notch radii that are ill defined, particularly at recognized weld sites, i.e., the weld toe [13,16,17,46]. The structural strain approach serves as an expansion of the traction structural stress, carrying the main advantage of being mesh-insensitive.
In this method, the structural strain, encompassing membrane and bending components, is assessed using related traction stress values.
Figure 11 schematically depicts the definition of structural strain.
Figure 11a illustrates a cross-section of a fillet-welded joint, with fatigue cracking occurring at the weld toe that penetrates the thickness of the plate, specifically alongside plane A-A.
Even if the local stress trend at the theoretical crack plane (plane A-A) exhibits high nonlinearity, the associated traction structural stress value, specifically the opening stress value concerning the crack plane A-A, can be determined through the use of a finite element analysis (FEA) of clearly defined loading conditions. This traction stress is considered mesh-independent [16] and is represented by the means of the normal membrane portion ( σ m )  and normal bending portion ( σ b ) . Subsequently, it is possible to address an equivalent 2D problem of the section of the plate. More details on the FE model definition can be found in [16].
The membrane and bending stresses are calculated from the nodal forces along the weld using the following equations:
σ m = i = 1 n n o d e F i t
σ b = 6 i = 1 n n o d e F i ( y i t / 2 ) t 2
Fi denotes the nodal force, and yi denotes the y-position of the i-th node in Equations (1) and (2), correspondingly; t represents the plate thickness. The calculated structural strain can thus be straightforwardly linked to the traction structural stresses according to the method reported in [17].
The computation of traction structural stresses is performed under the specified fatigue loading conditions. If these stresses surpass the values of the yielding characteristics, the structural strain needs to be considered by post-processing the nonlinear finite element (FE) model to initially achieve the traction stress. An iterative approach, as recently outlined in [17], is then employed to determine the related structural strain values, particularly for materials that exhibit a hardening phenomenon, i.e., a Ramberg–Osgood power law.
However, it is noteworthy to highlight that as indicated in [17], when an experimental test campaign is conducted under displacement control conditions, the structural strain values can be computed through a linear–elastic analysis employing Equations (3) and (4); thus, the structural strain values can be directly linked to the traction structural stress values evaluated using the typical equations for plane strain.
ϵ m = σ m ( 1 ν 2 ) E ,
ϵ b = σ b ( 1 ν 2 ) E ,
where  ϵ m  and  ϵ b  are the membrane strain and bending strain, respectively. Then, the structural strain  ϵ s  is calculated as the sum of the two strains as reported in Equation (5).
ϵ s = ϵ m + ϵ b ,
After obtaining the structural strain (Δϵ_s), the values of the equivalent structural strain ( Δ E s ) can be computed for fatigue assessment.
The expression for the equivalent structural strain determination is provided in Equation (6) and depends on the values of the following parameters reported in Equations (7) and (8): the life integral, I(r), which is a dimensionless function of the bending ratio, r, and m (m = 3.6), which is a constant determined in prior studies based on fracture mechanics analyses [16].
Δ E s = Δ ϵ s t * 2 m 2 m     I r 1 / m ,
r = ϵ b ϵ m + ϵ b ,
t * = t / t r e f , t r e f = 1   m m .
I ( r ) 1 m = 2.1549 r 6 5.0422 r 5 + 4.8002 r 4 2.0694 r 3 + 0.561 r 2 + 0.0097 r + 1.5426 .
Subsequently, the experimental fatigue life values can be correlated to the equivalent structural strain range ( Δ E s )    values and linked with the master E-N curve. The latter master curve is derived considering the ASME Div 2 master S-N curve, which encompasses more than 1000 fatigue tests performed on large-scale structures. Large scale, in this context, indicates values of the ratio of width to thickness (W/t) that are higher than or equal to 10 [16], and the number of cycles to failure extends from 102 to 108 cycles.

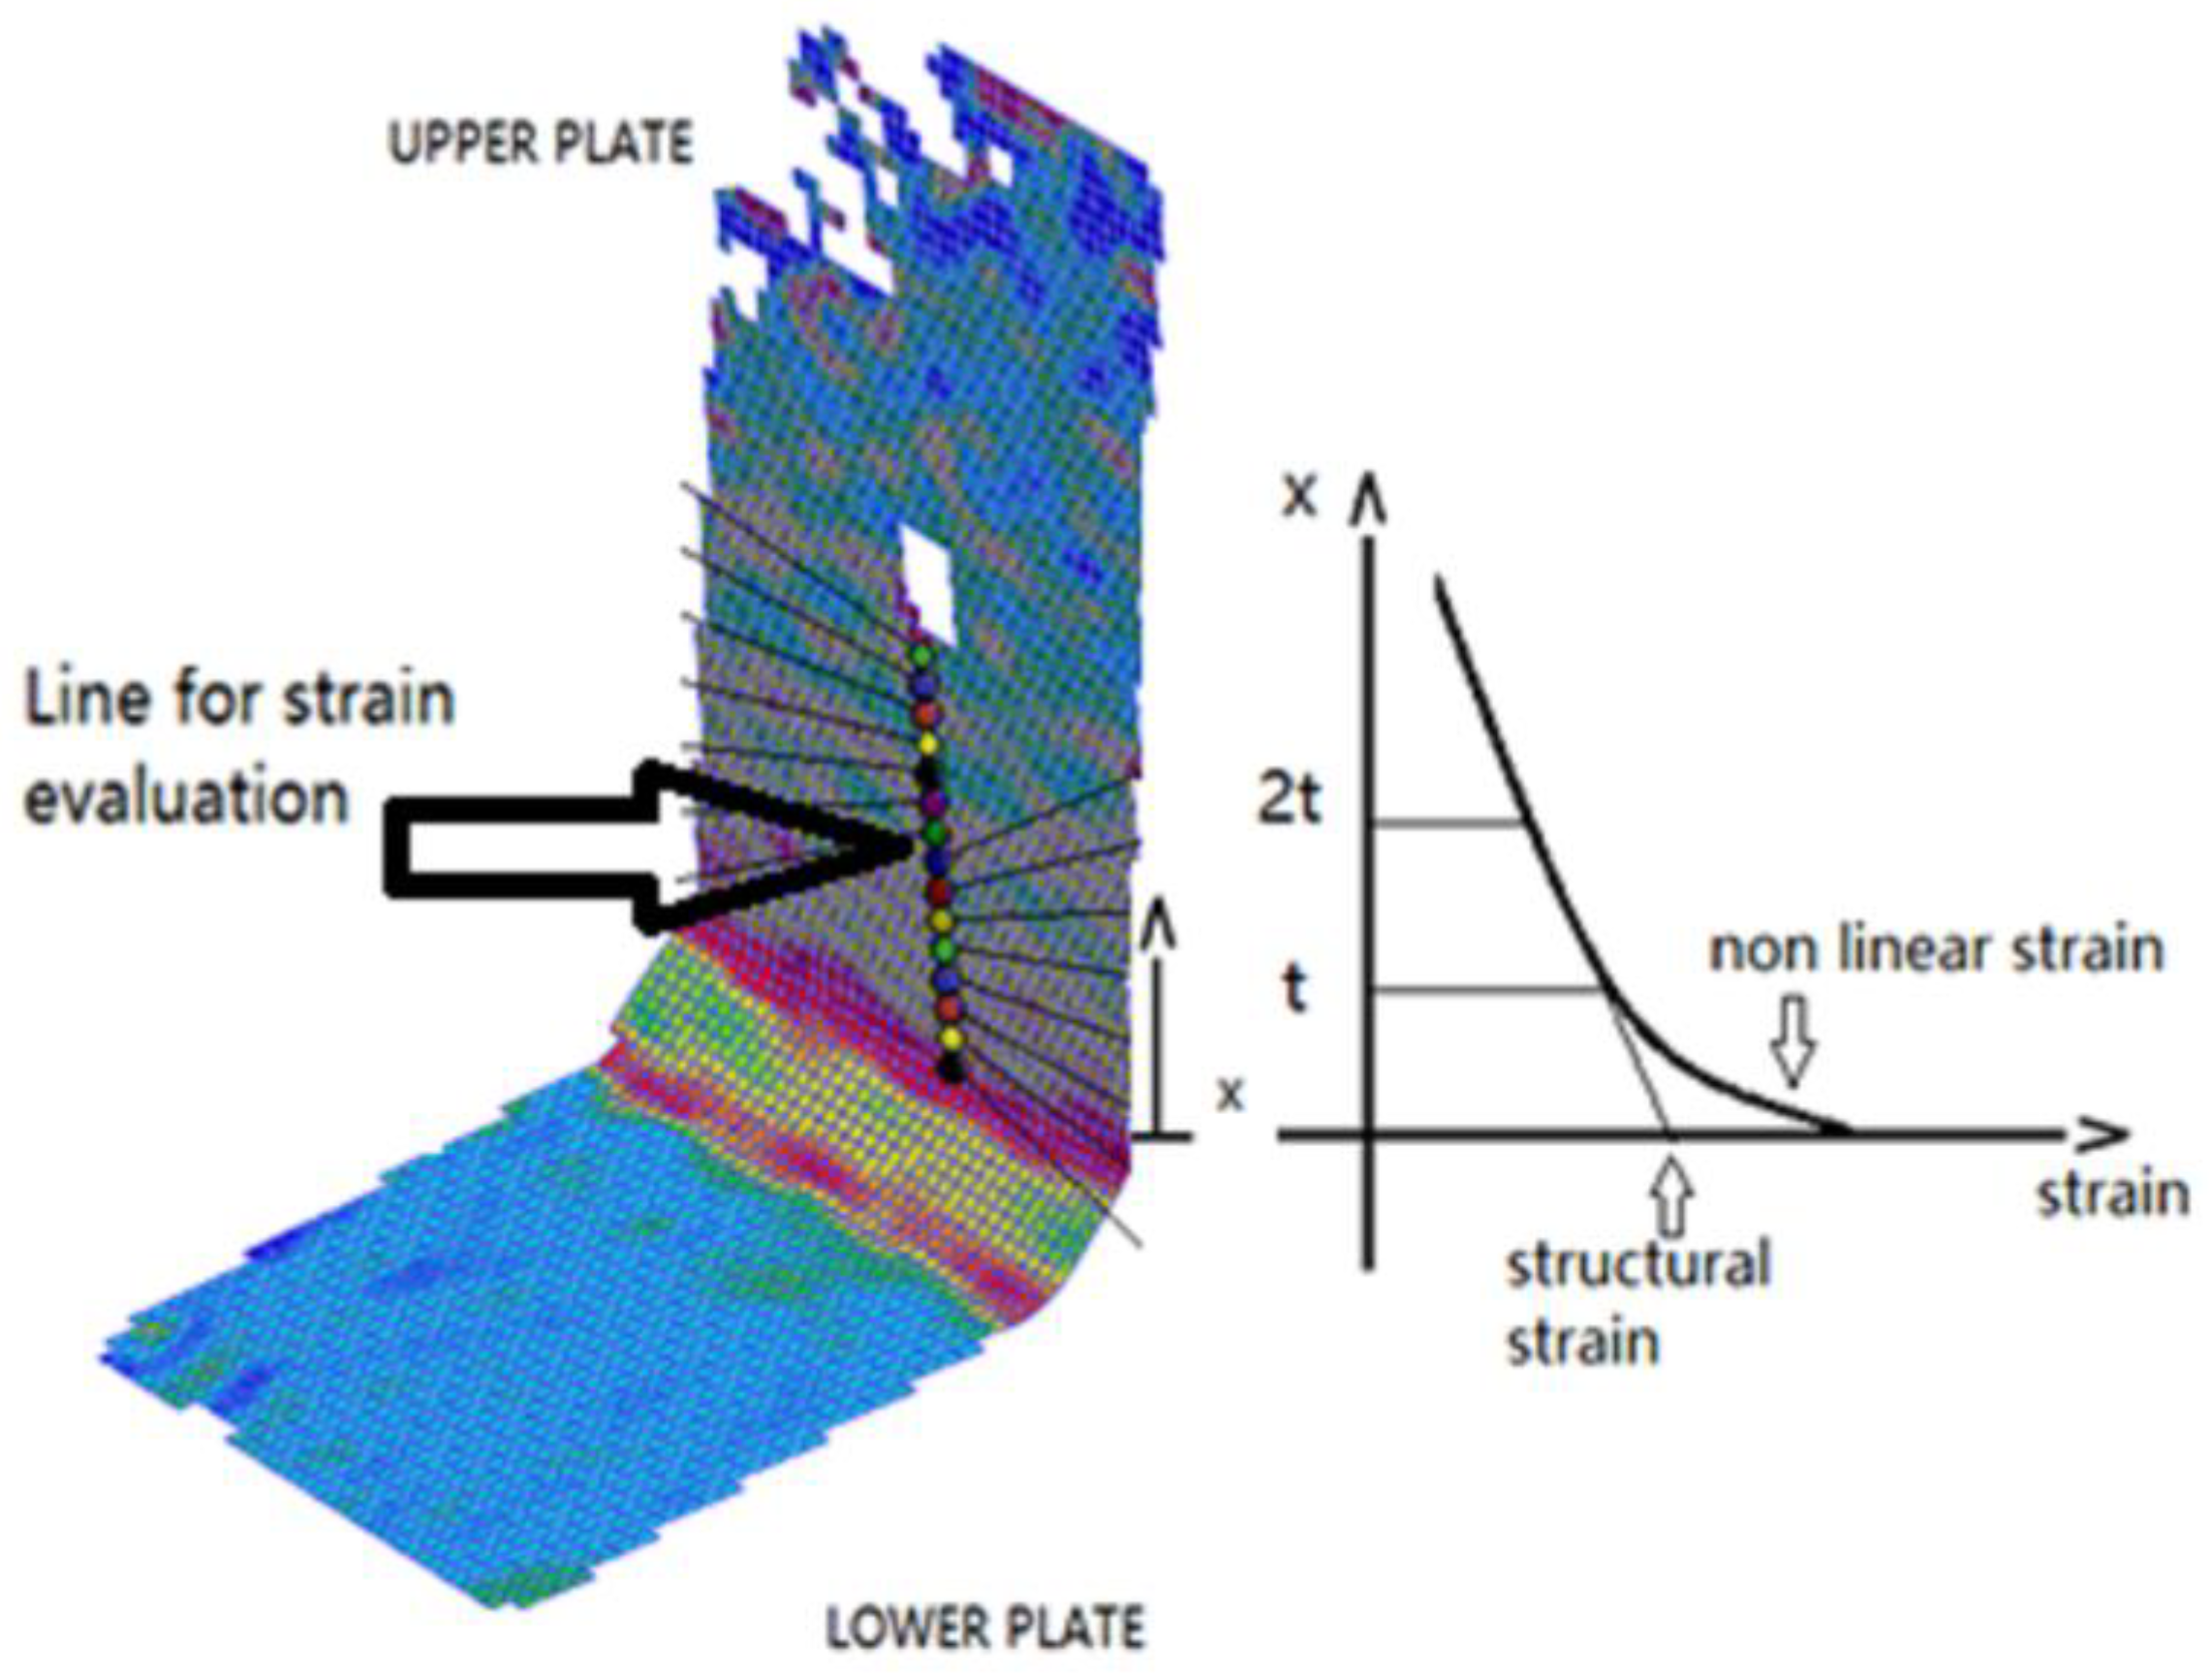
3.2. DIC—Equivalent Structural Strain

The structural strain range ( Δ ϵ s D I C ) obtained by the DIC analysis was estimated for a line path (see Figure 12) on the specimen surface. The same figure also indicates the longitudinal strain map.
The structural strain values ( ϵ s m a x  and  ϵ s m i n ) at the midlife of each traditional LCF test were assessed at the weld toe (at a distance x = 0) by conducting a linear fitting of the strains between 0.5 t and 1 t (respectively, 6 mm and 12 mm), while they were calculated corresponding to the stabilized hysteresis loop in the stepwise succession test at increasing amplitudes. The structural strain values ( ϵ s m a x  and  ϵ s m i n ) were thus evaluated with respect to the maximum and the minimum displacements employed (respectively, dmax and dmin), as indicated in Figure 13.
Therefore, the strain distributions for stepwise succession tests at different displacement amplitudes are shown in Figure 14, Figure 15 and Figure 16, which correspond to applied displacement amplitude values of 1 mm, 1.5 mm, and 2 mm, respectively.
The structural strain range  s  is expressed as follows:
s   =   s m a x s m i n
Table 2 reports the values of the applied displacement amplitude (da), structural strain (ϵsmax and ϵsmin), and structural strain range (Δϵs).
As described previously, the parameter m was calculated based on experimental fracture mechanics analyses (m = 3.6); t* is the dimensionless thickness, while the life integral I(r) is dimensionless and depends on the parameter r, which is reliant on the membrane strain and bending strain. The membrane strain is calculated considering the component of the displacement measured in the longitudinal direction acting on the upper plate (dax) relative to the length of the plate. The membrane strain can thus be computed as reported in Equation (8):
m = d a x L
The results of the calculated parameters are presented in Table 3 and Table 4.
Following Equations (6)–(8), the values reported in Table 4 are obtained:
Using the DIC strain approach, a comparison of the low-cycle fatigue (LCF) test records to the master E-N curve of ASME Div 2, which represents more than 1000 large-scale fatigue tests with numbers of cycles to failure ranging from 102 to 108, can be made.
Table 5 and Figure 17 show the results obtained from traditional LCF tests and from stepwise tests at increasing amplitude displacements. Although there is a difference between the traditional LCF testing method, which involves constant-amplitude loads, and variable-amplitude loads, stepwise tests were conducted with increasing amplitudes, ensuring that the displacement amplitude remained constant at three levels. This approach aimed to minimize the accumulation of strains, with only a few cycles performed at the same amplitude to achieve a stabilized hysteresis loop condition. Strain amplitude was measured once the stabilized condition was reached, and then the next amplitude was applied. This is the reason for which only three displacement amplitude values were chosen, with the objective of neglecting cumulative damage that requires dedicated studies, which should concern the future developments of these research activities.
The numbers of cycles to failure of the stepwise tests were taken from traditional LCF tests to compare the results to the AMSE curve. Regarding the adoption of such tests and the use of the ASME curve, the authors recommend measuring the equivalent structural strain as proposed and then using the ASME mean curve to predict fatigue life (and thus the expected number of cycles to failure).
The whole procedure can be easily carried out as follows:
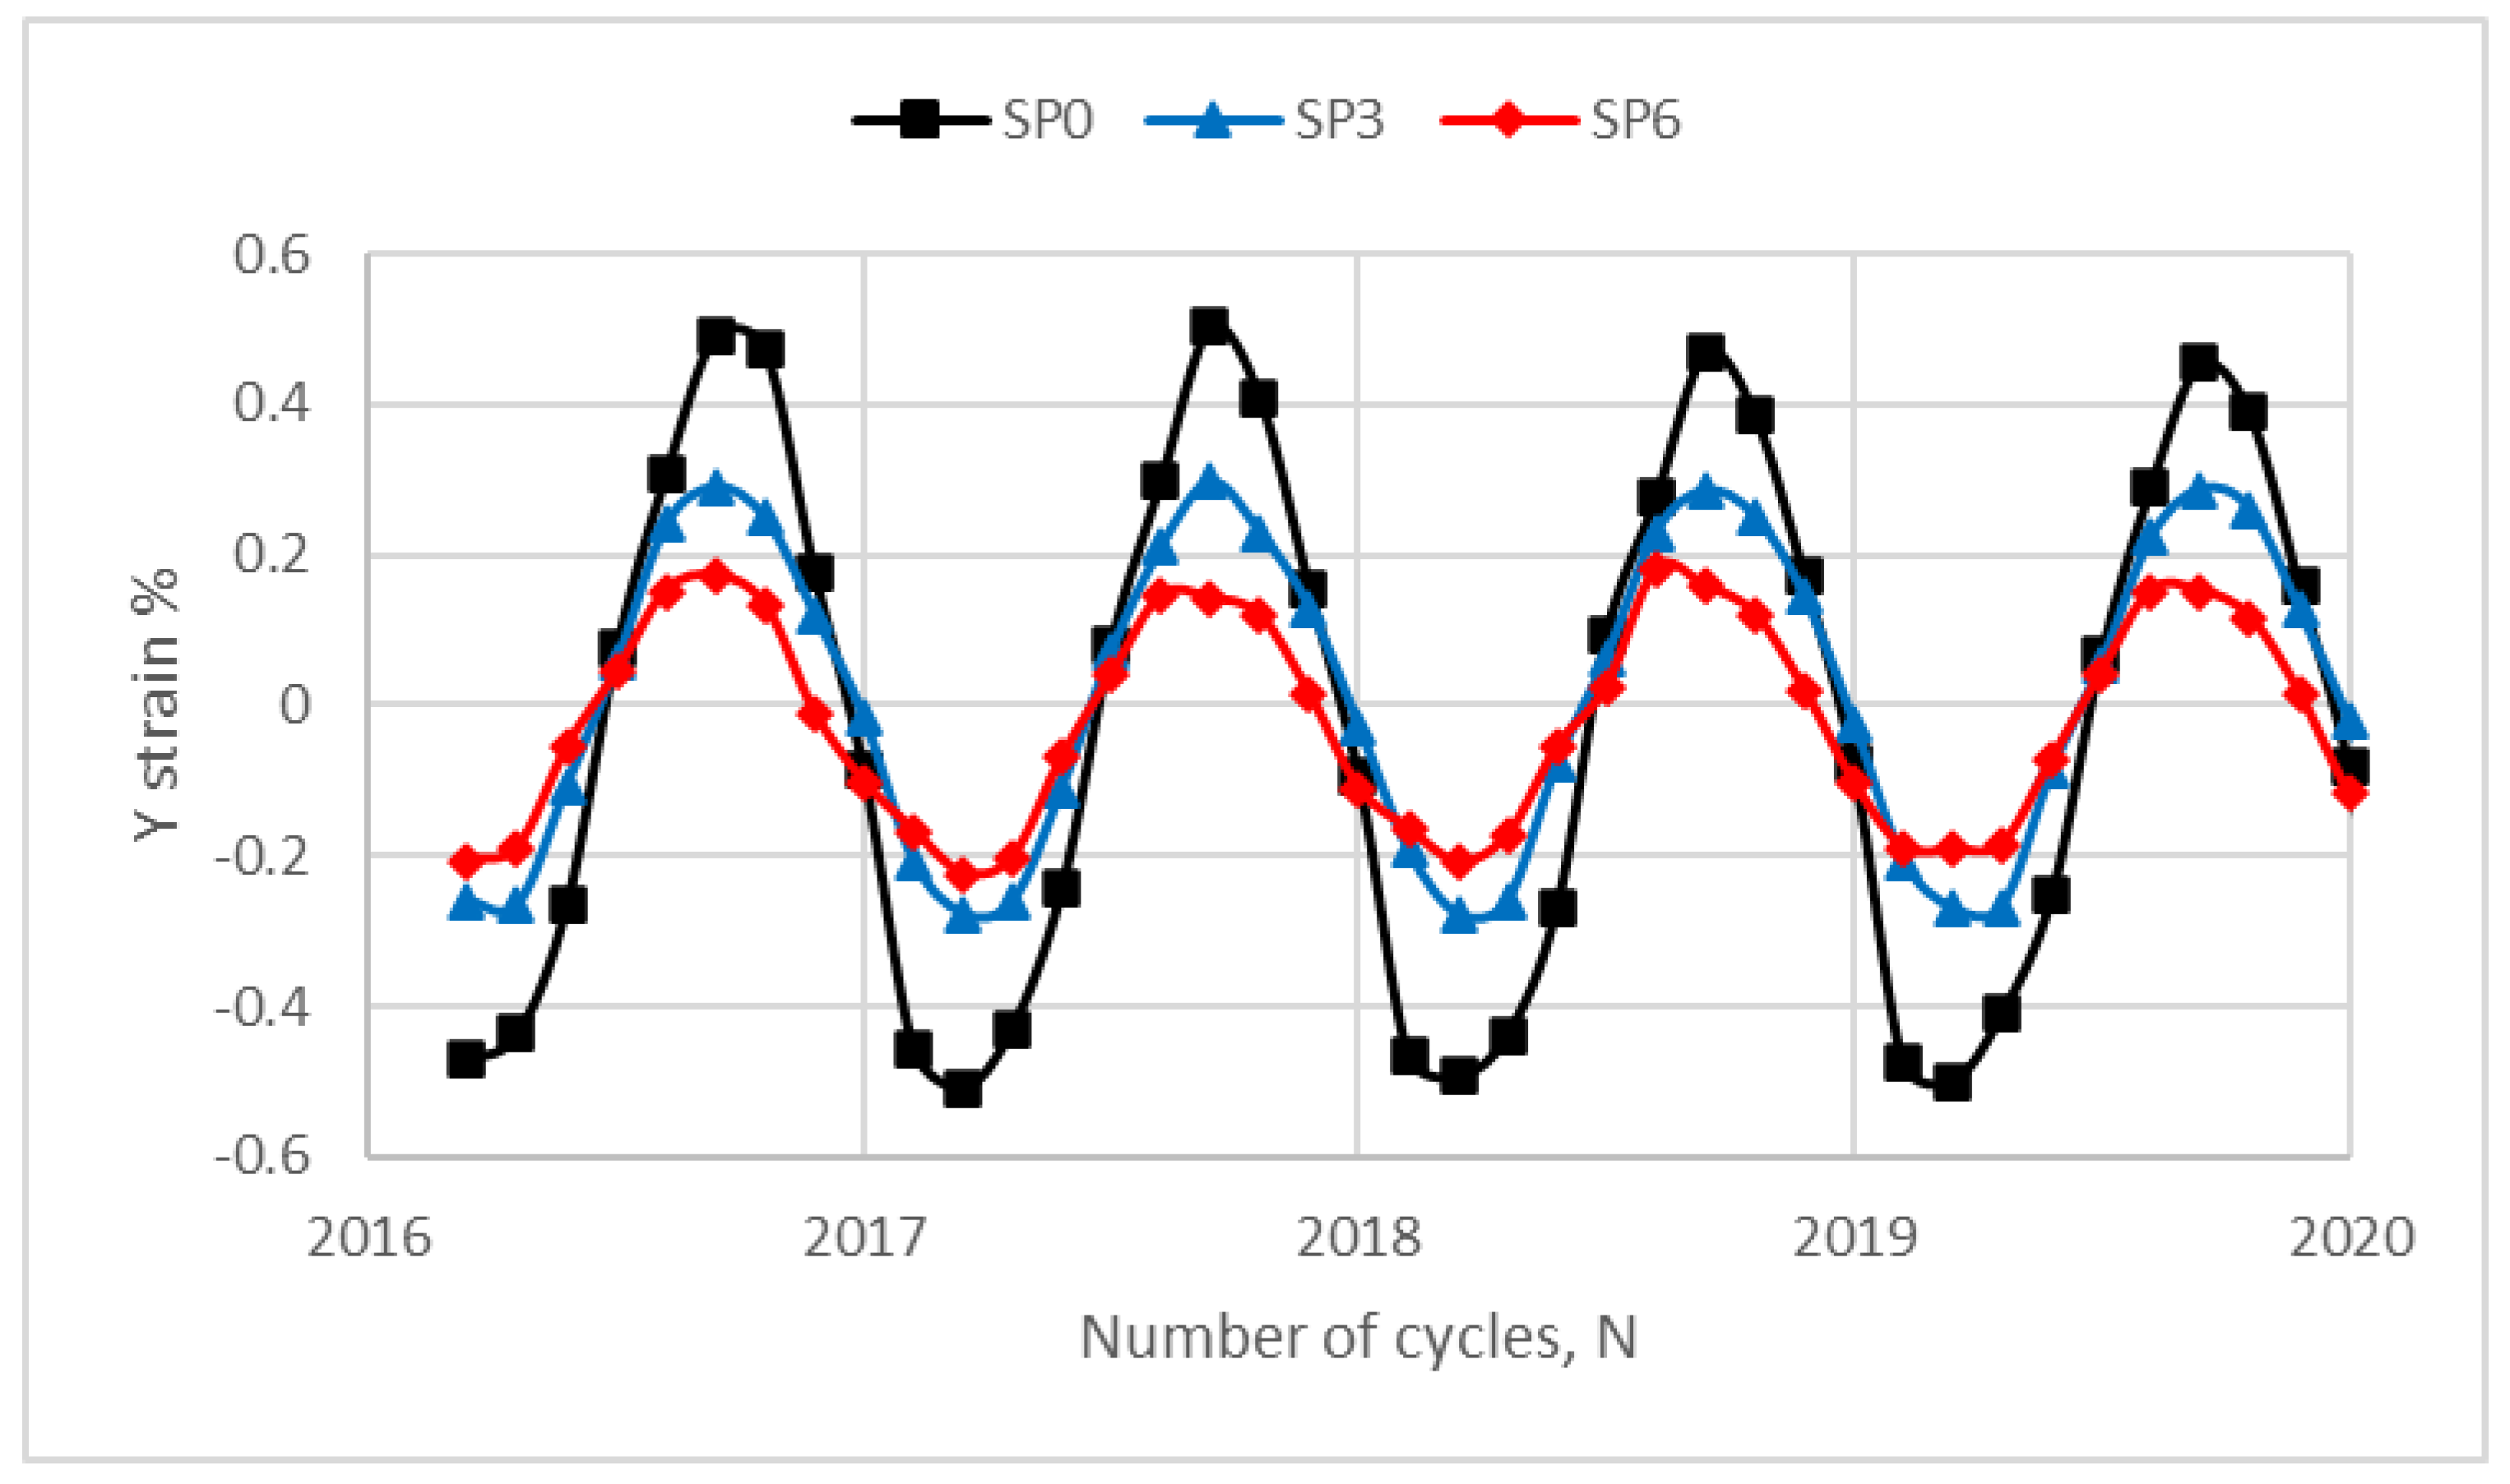
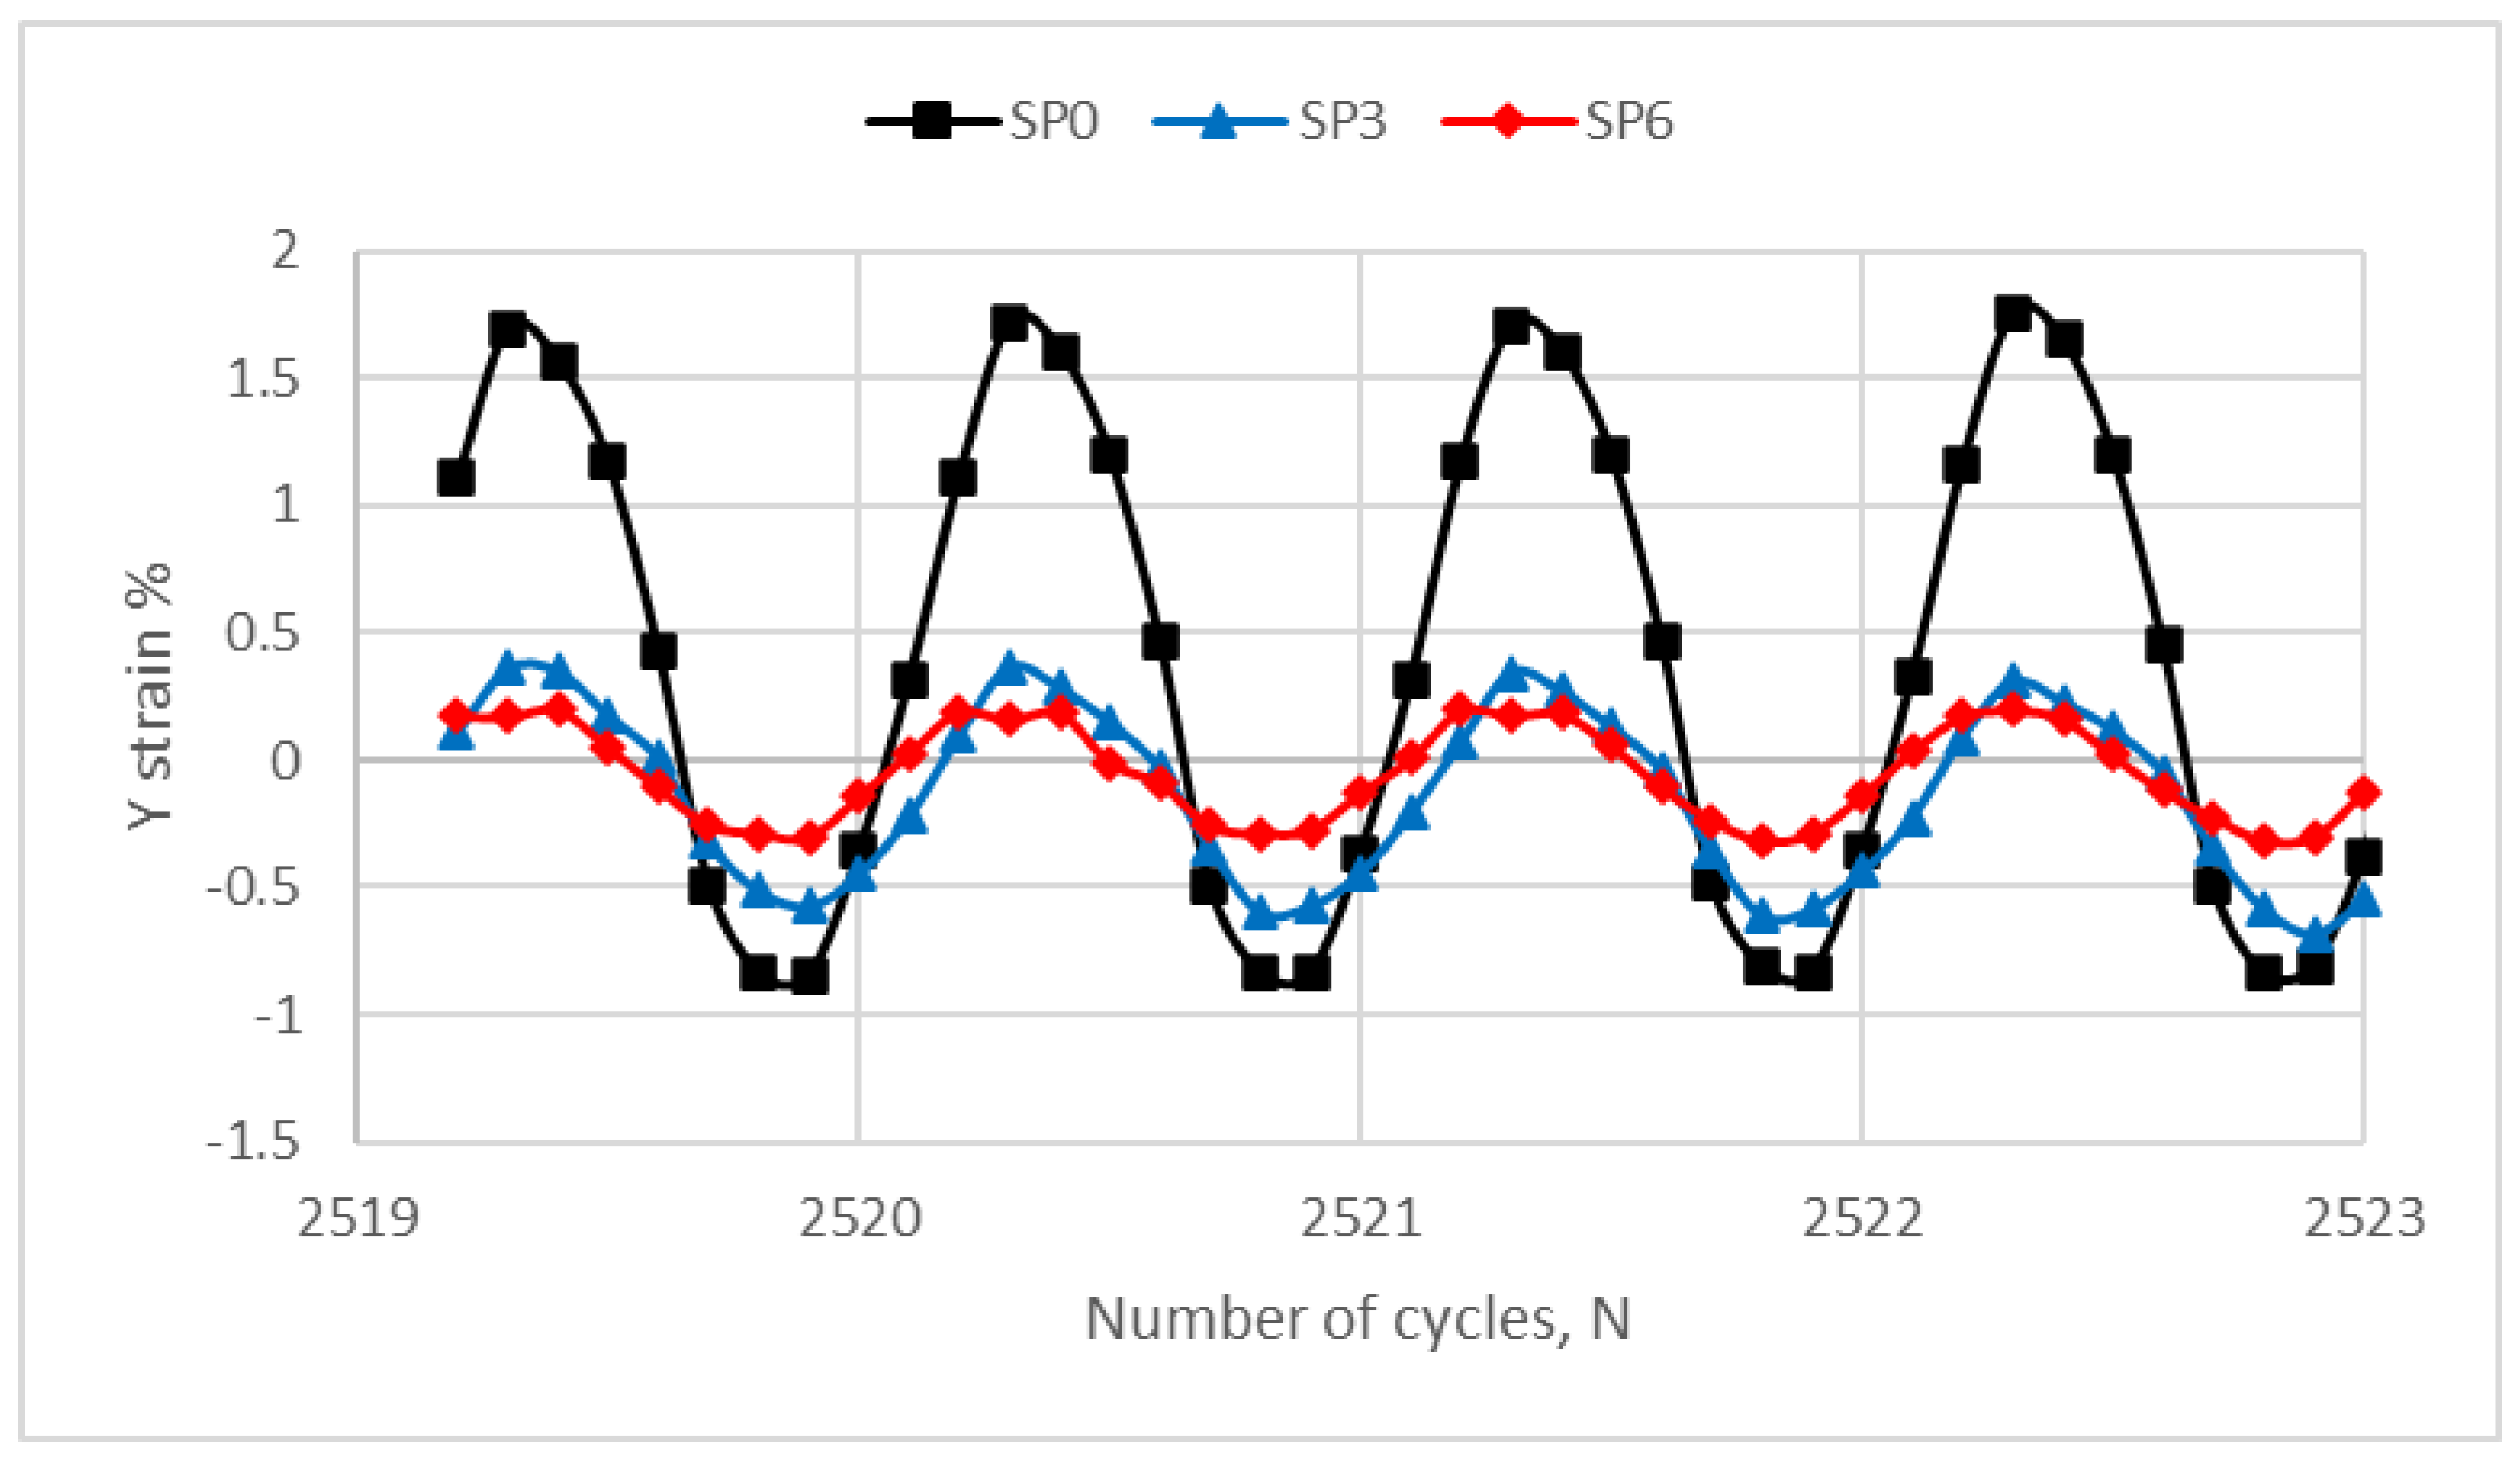
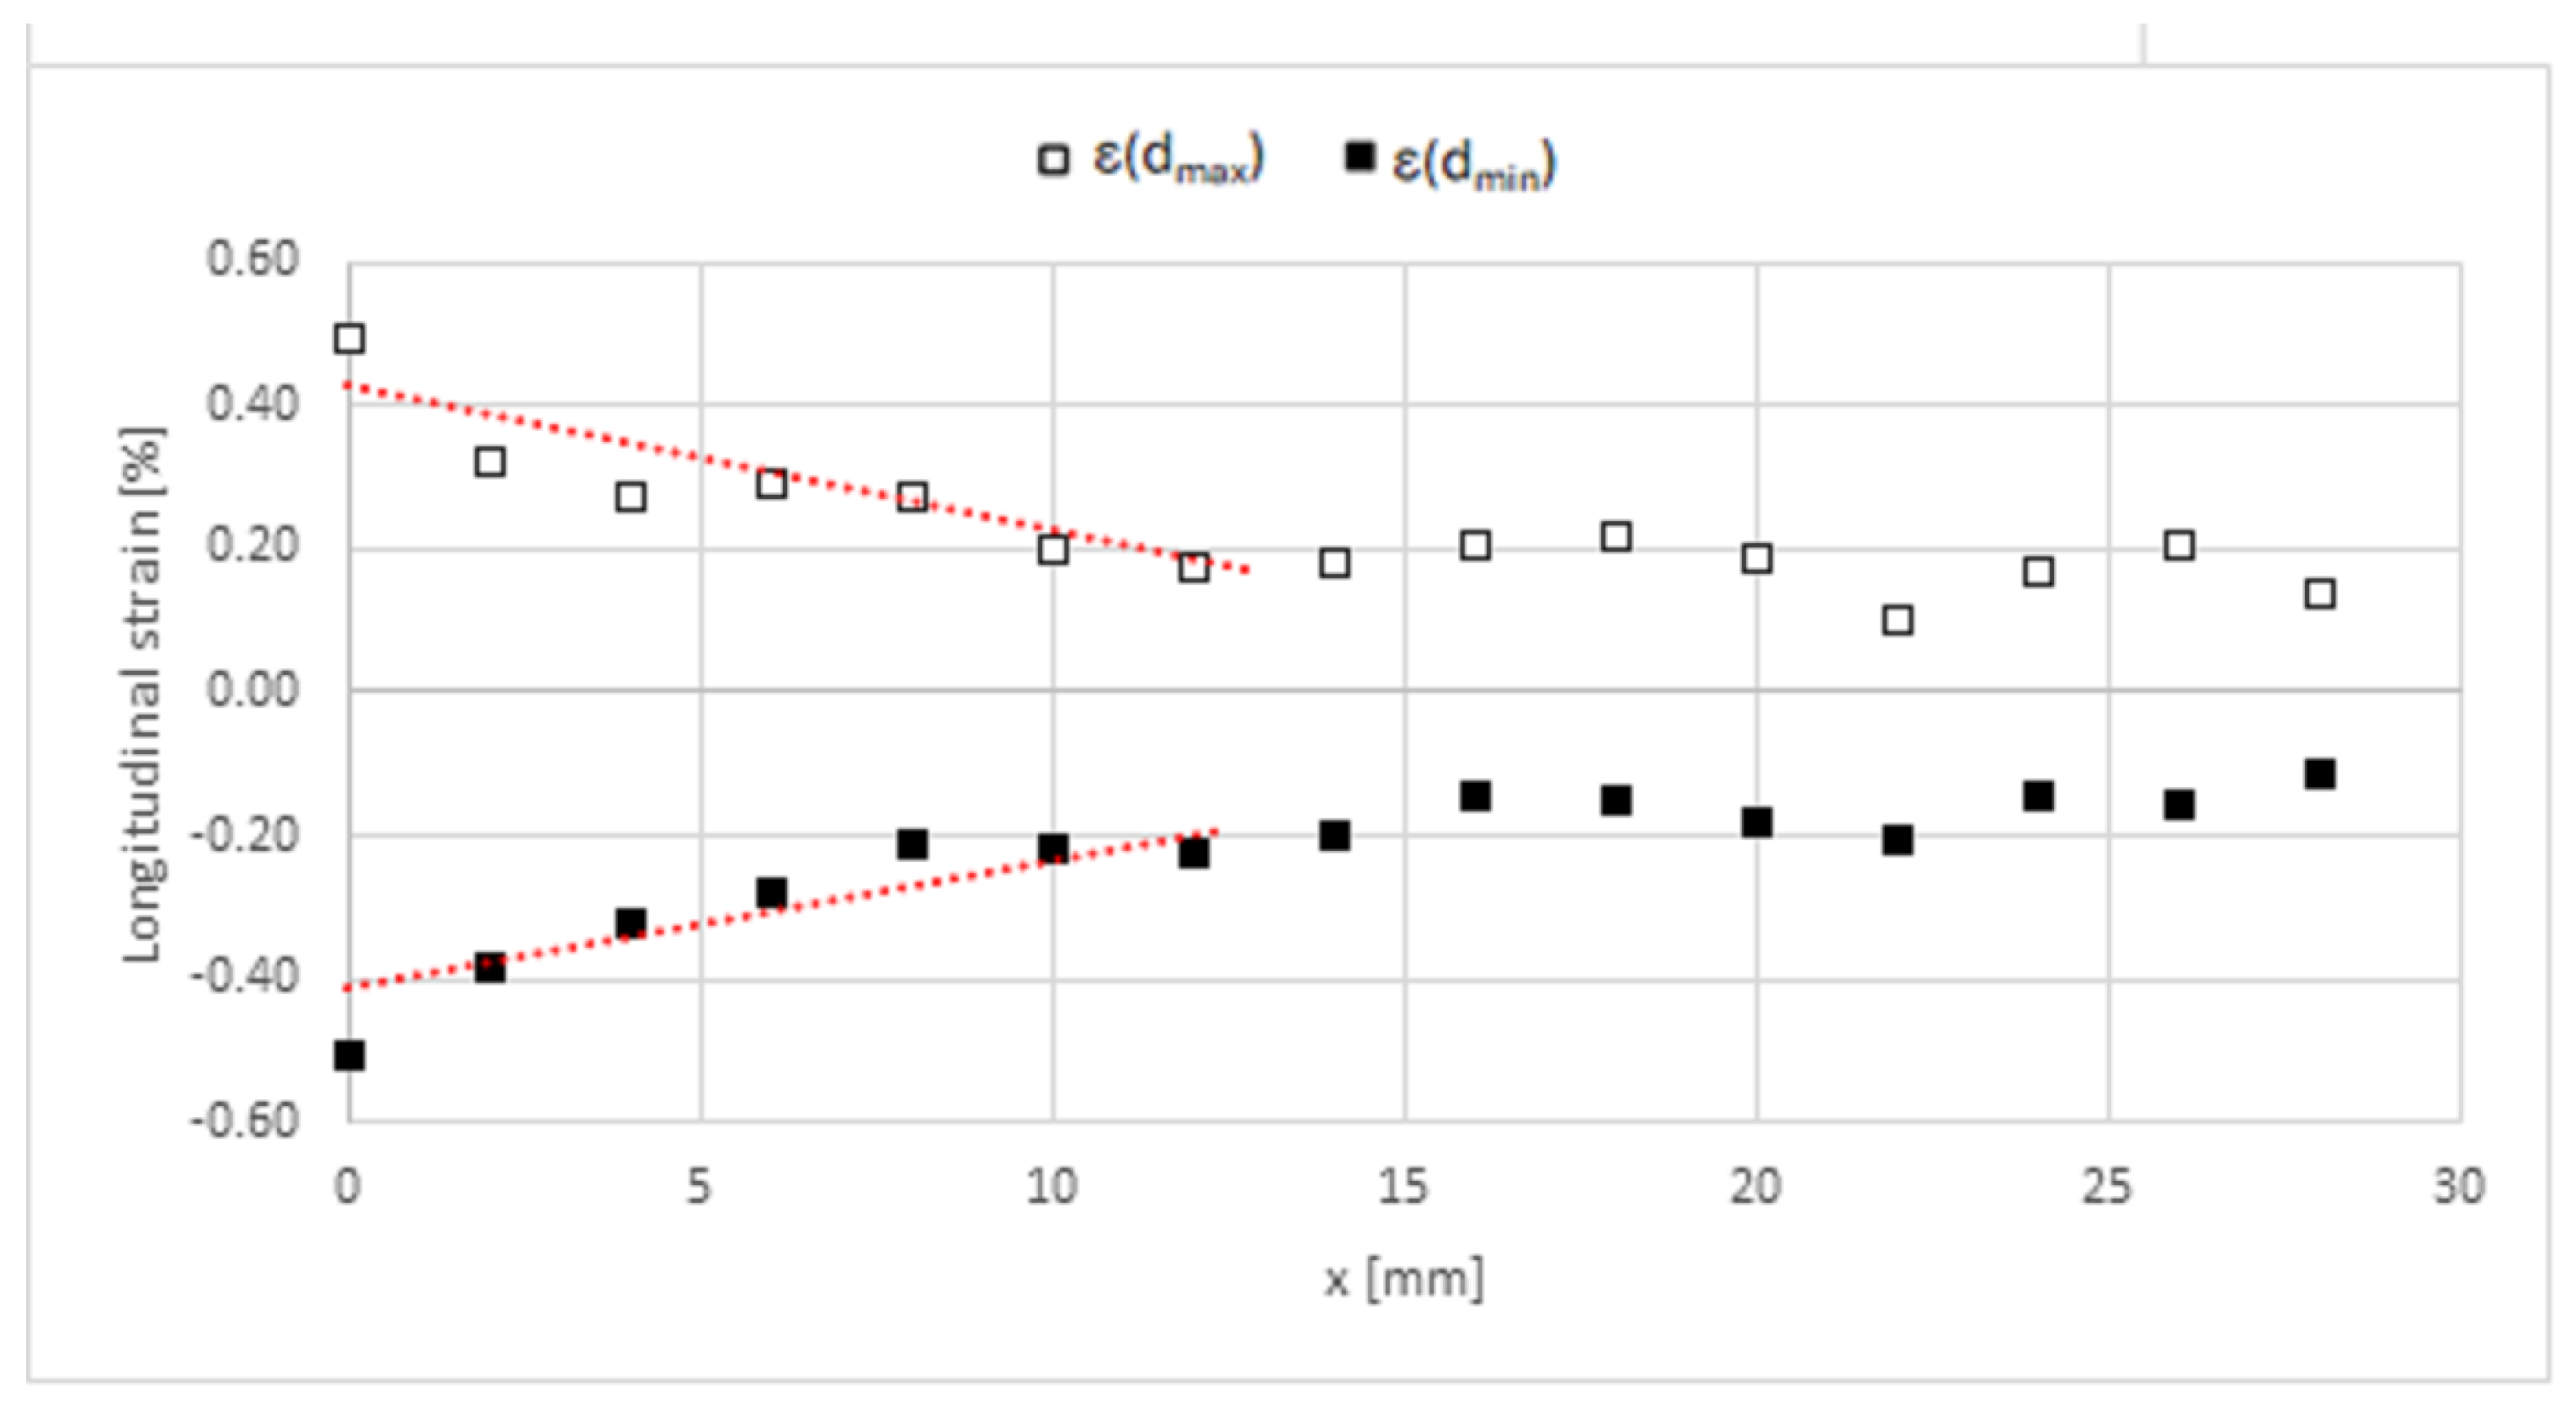
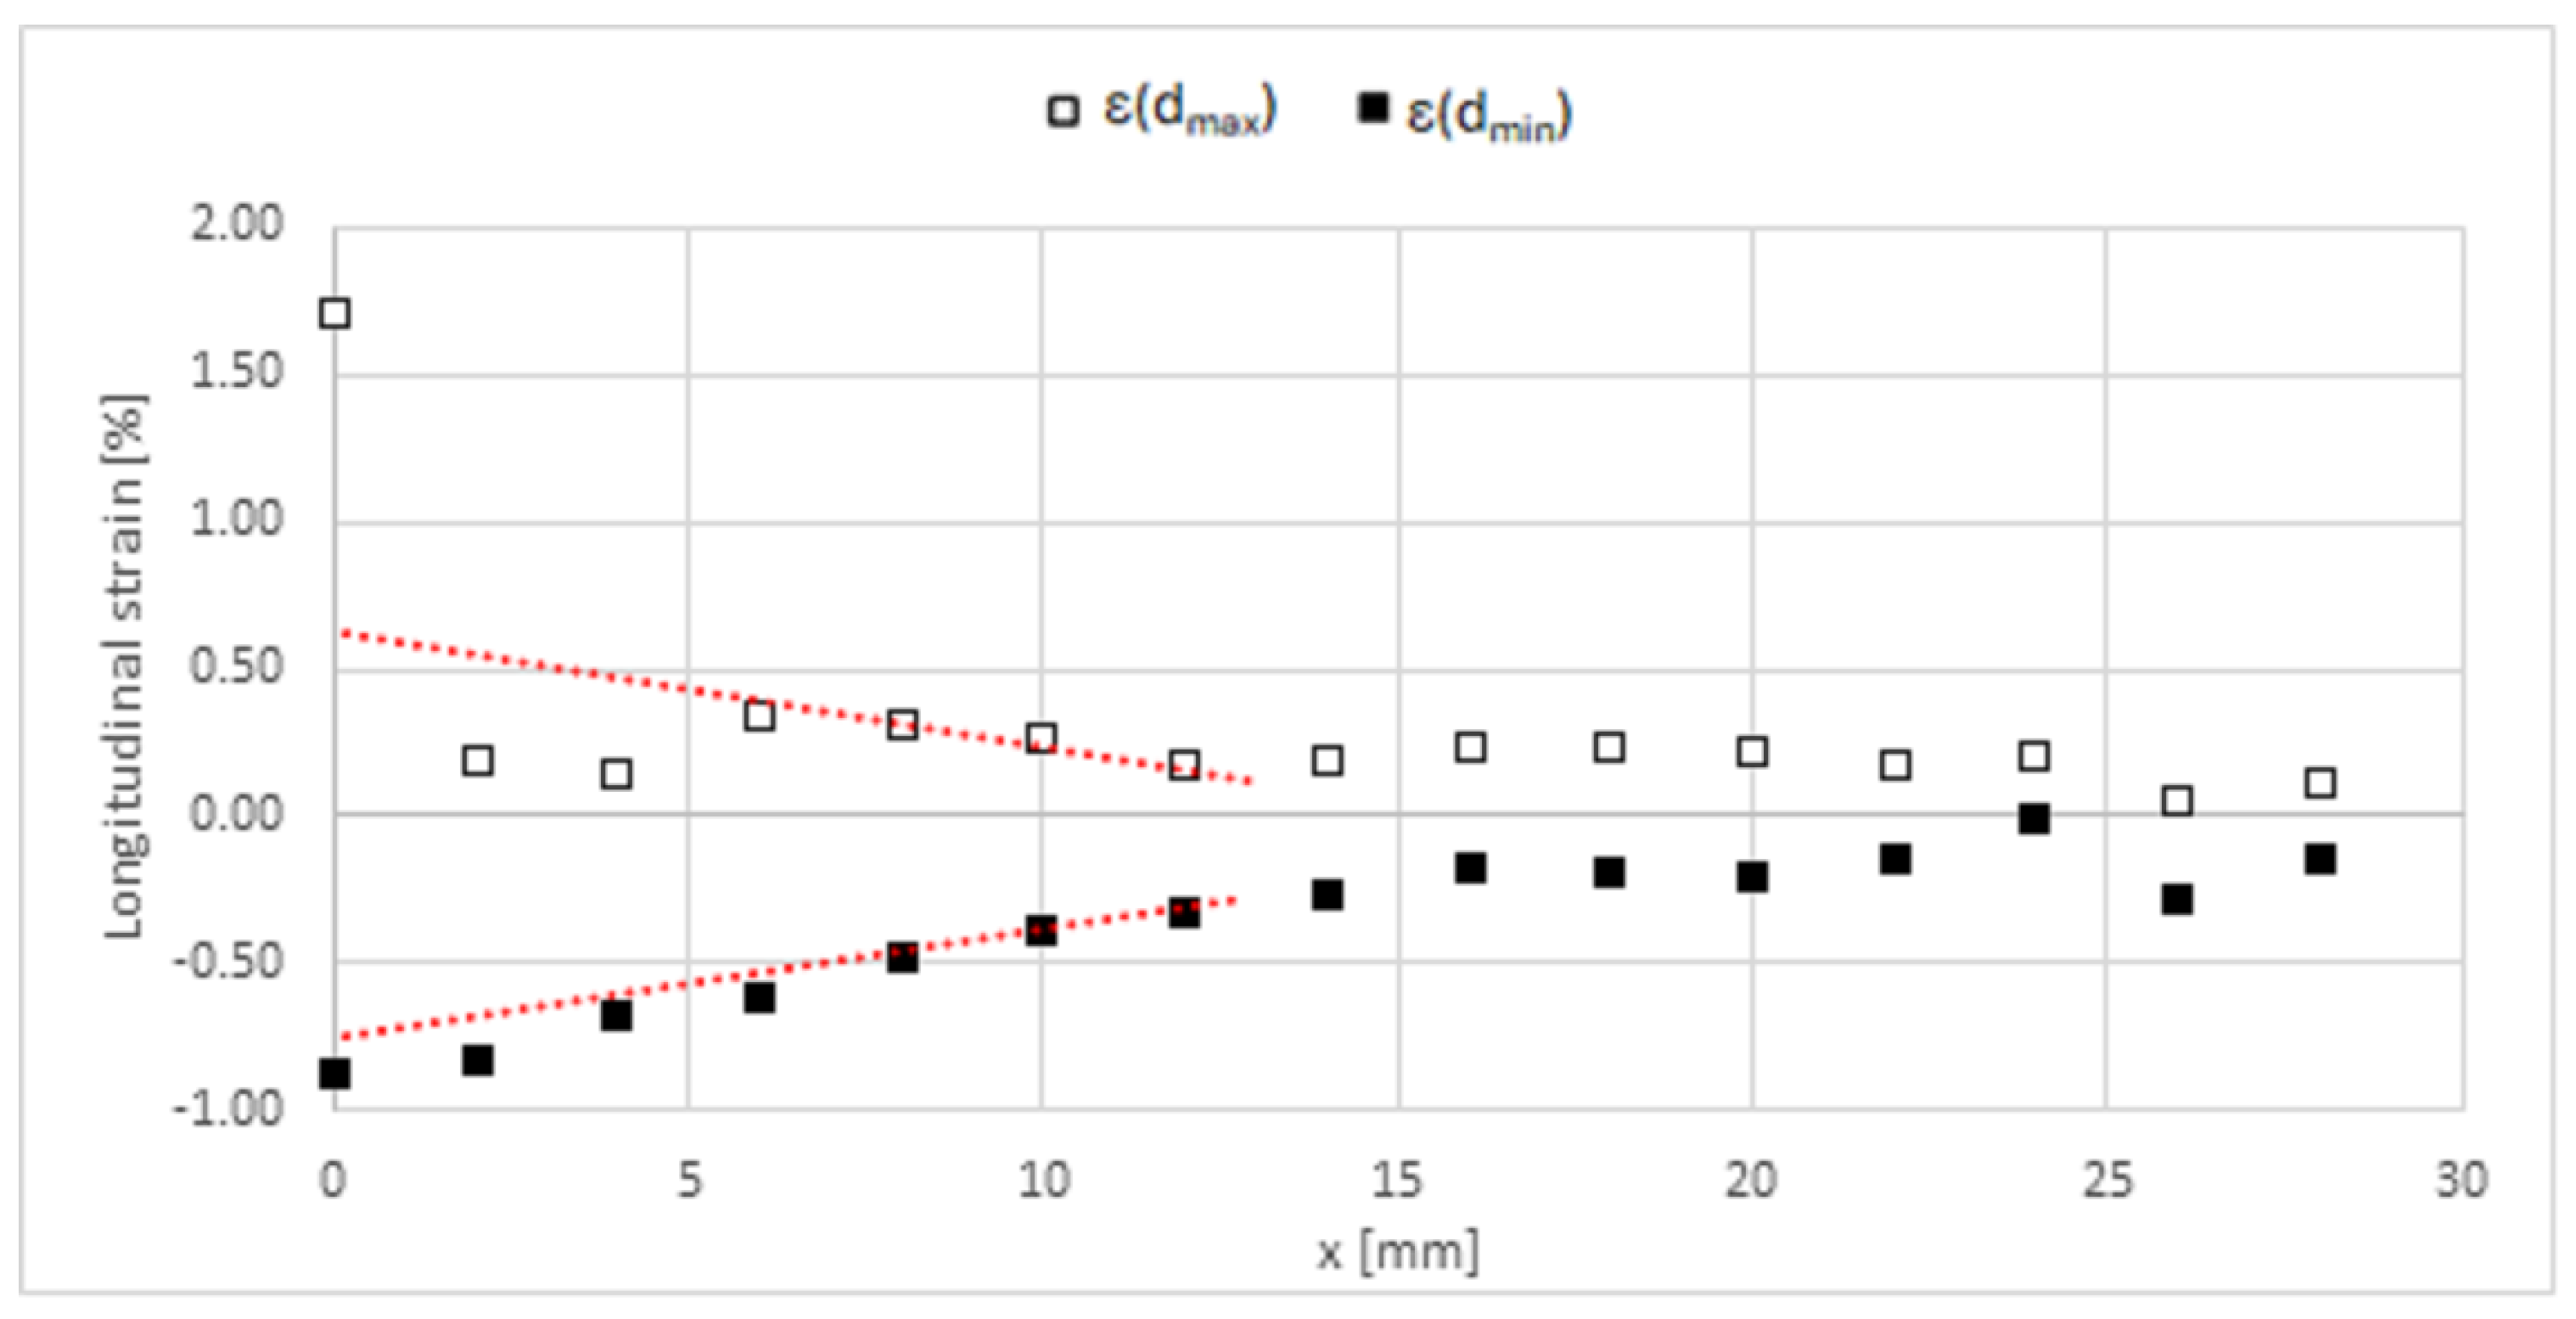
  • Measure the longitudinal strains on the specimen surface.
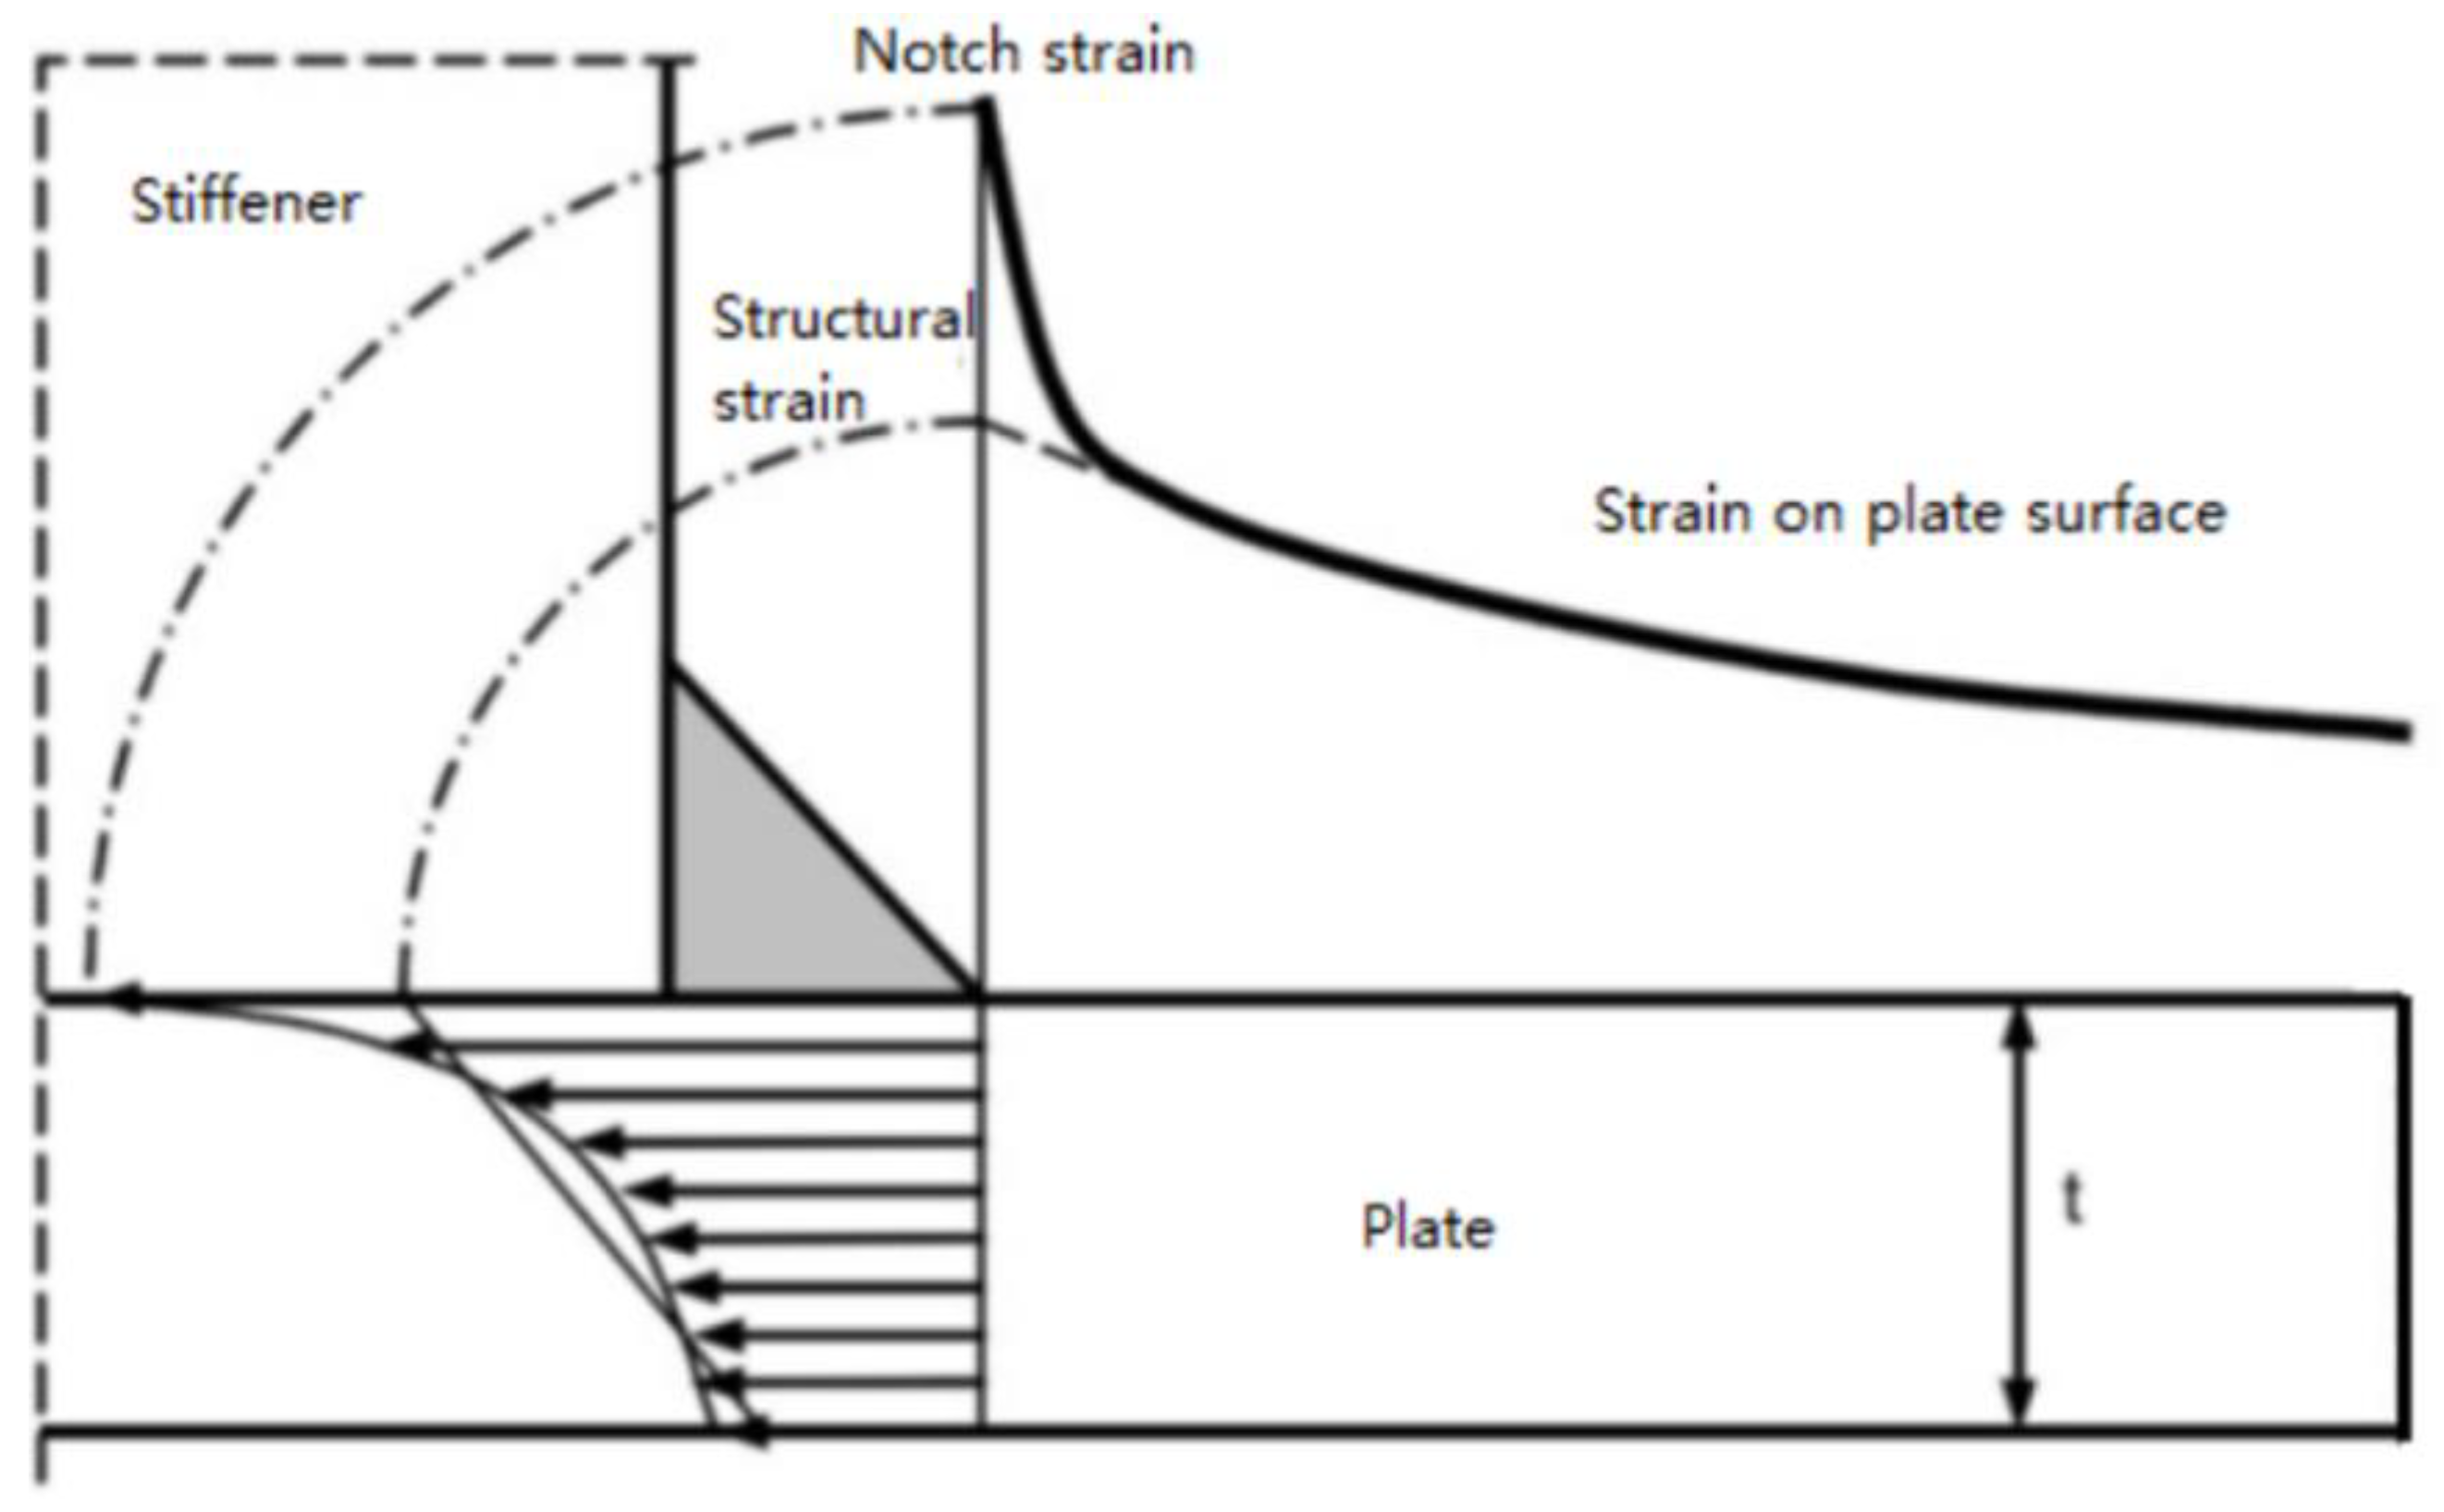
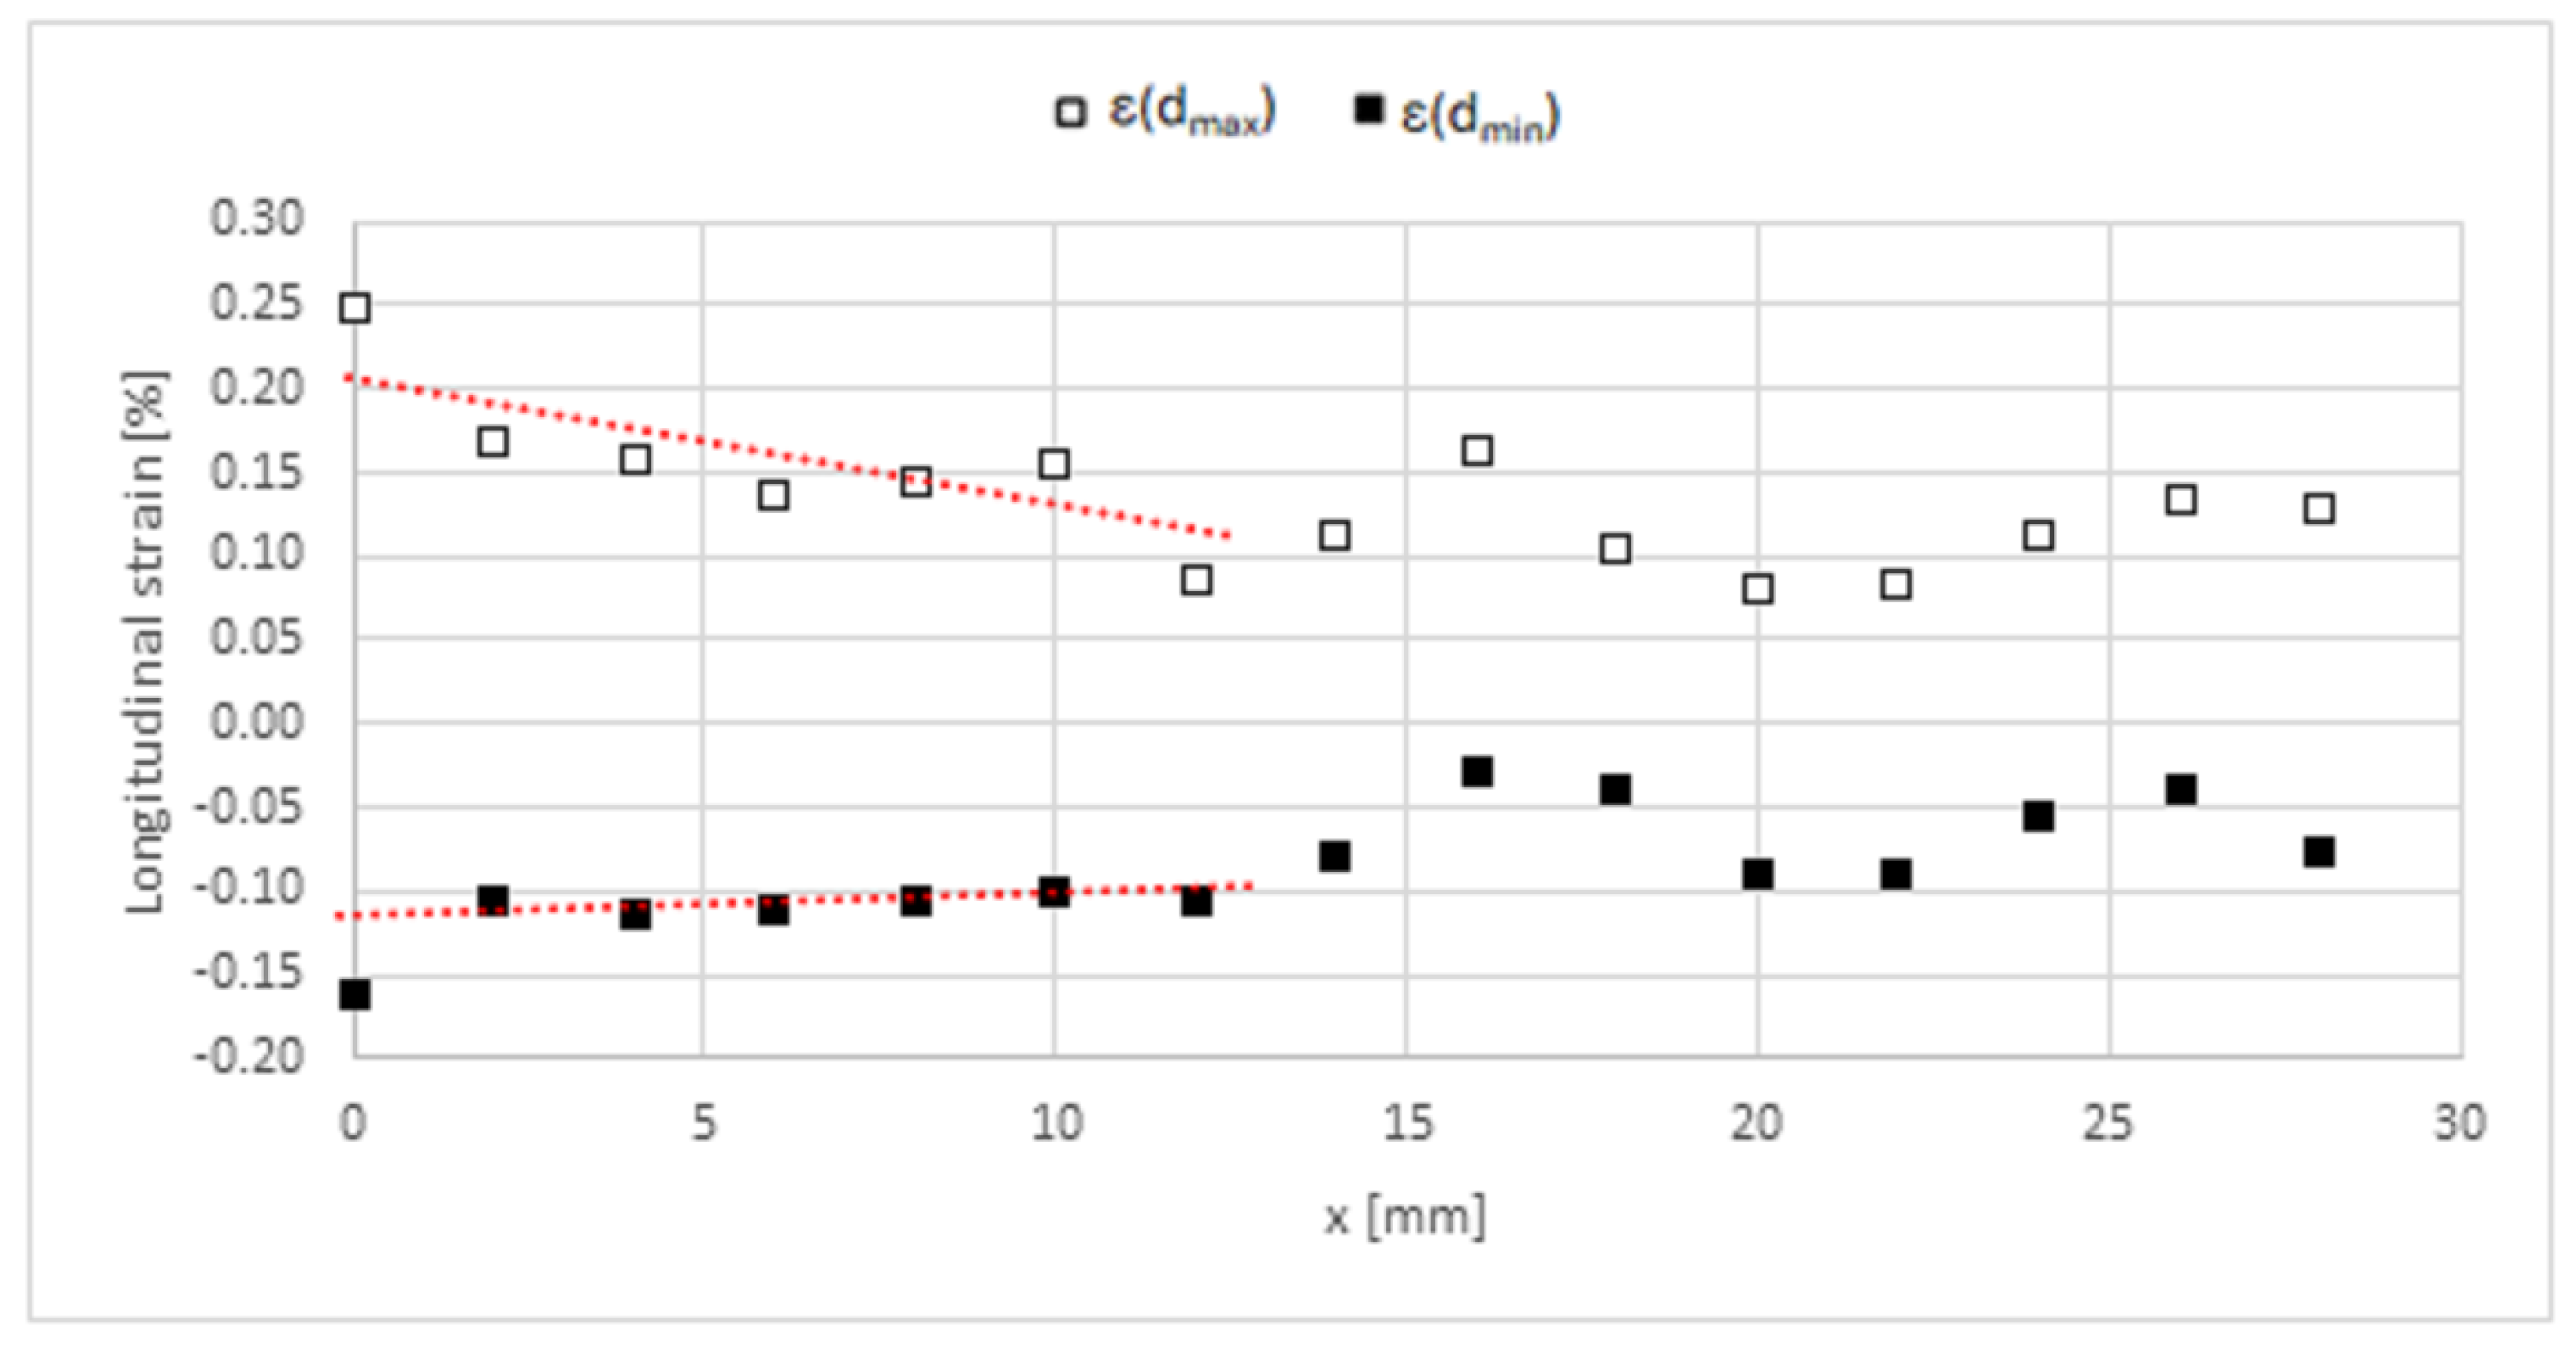
  • Perform a linear fitting of the previous longitudinal strains between x/t = 0.4 and x/t = 1.
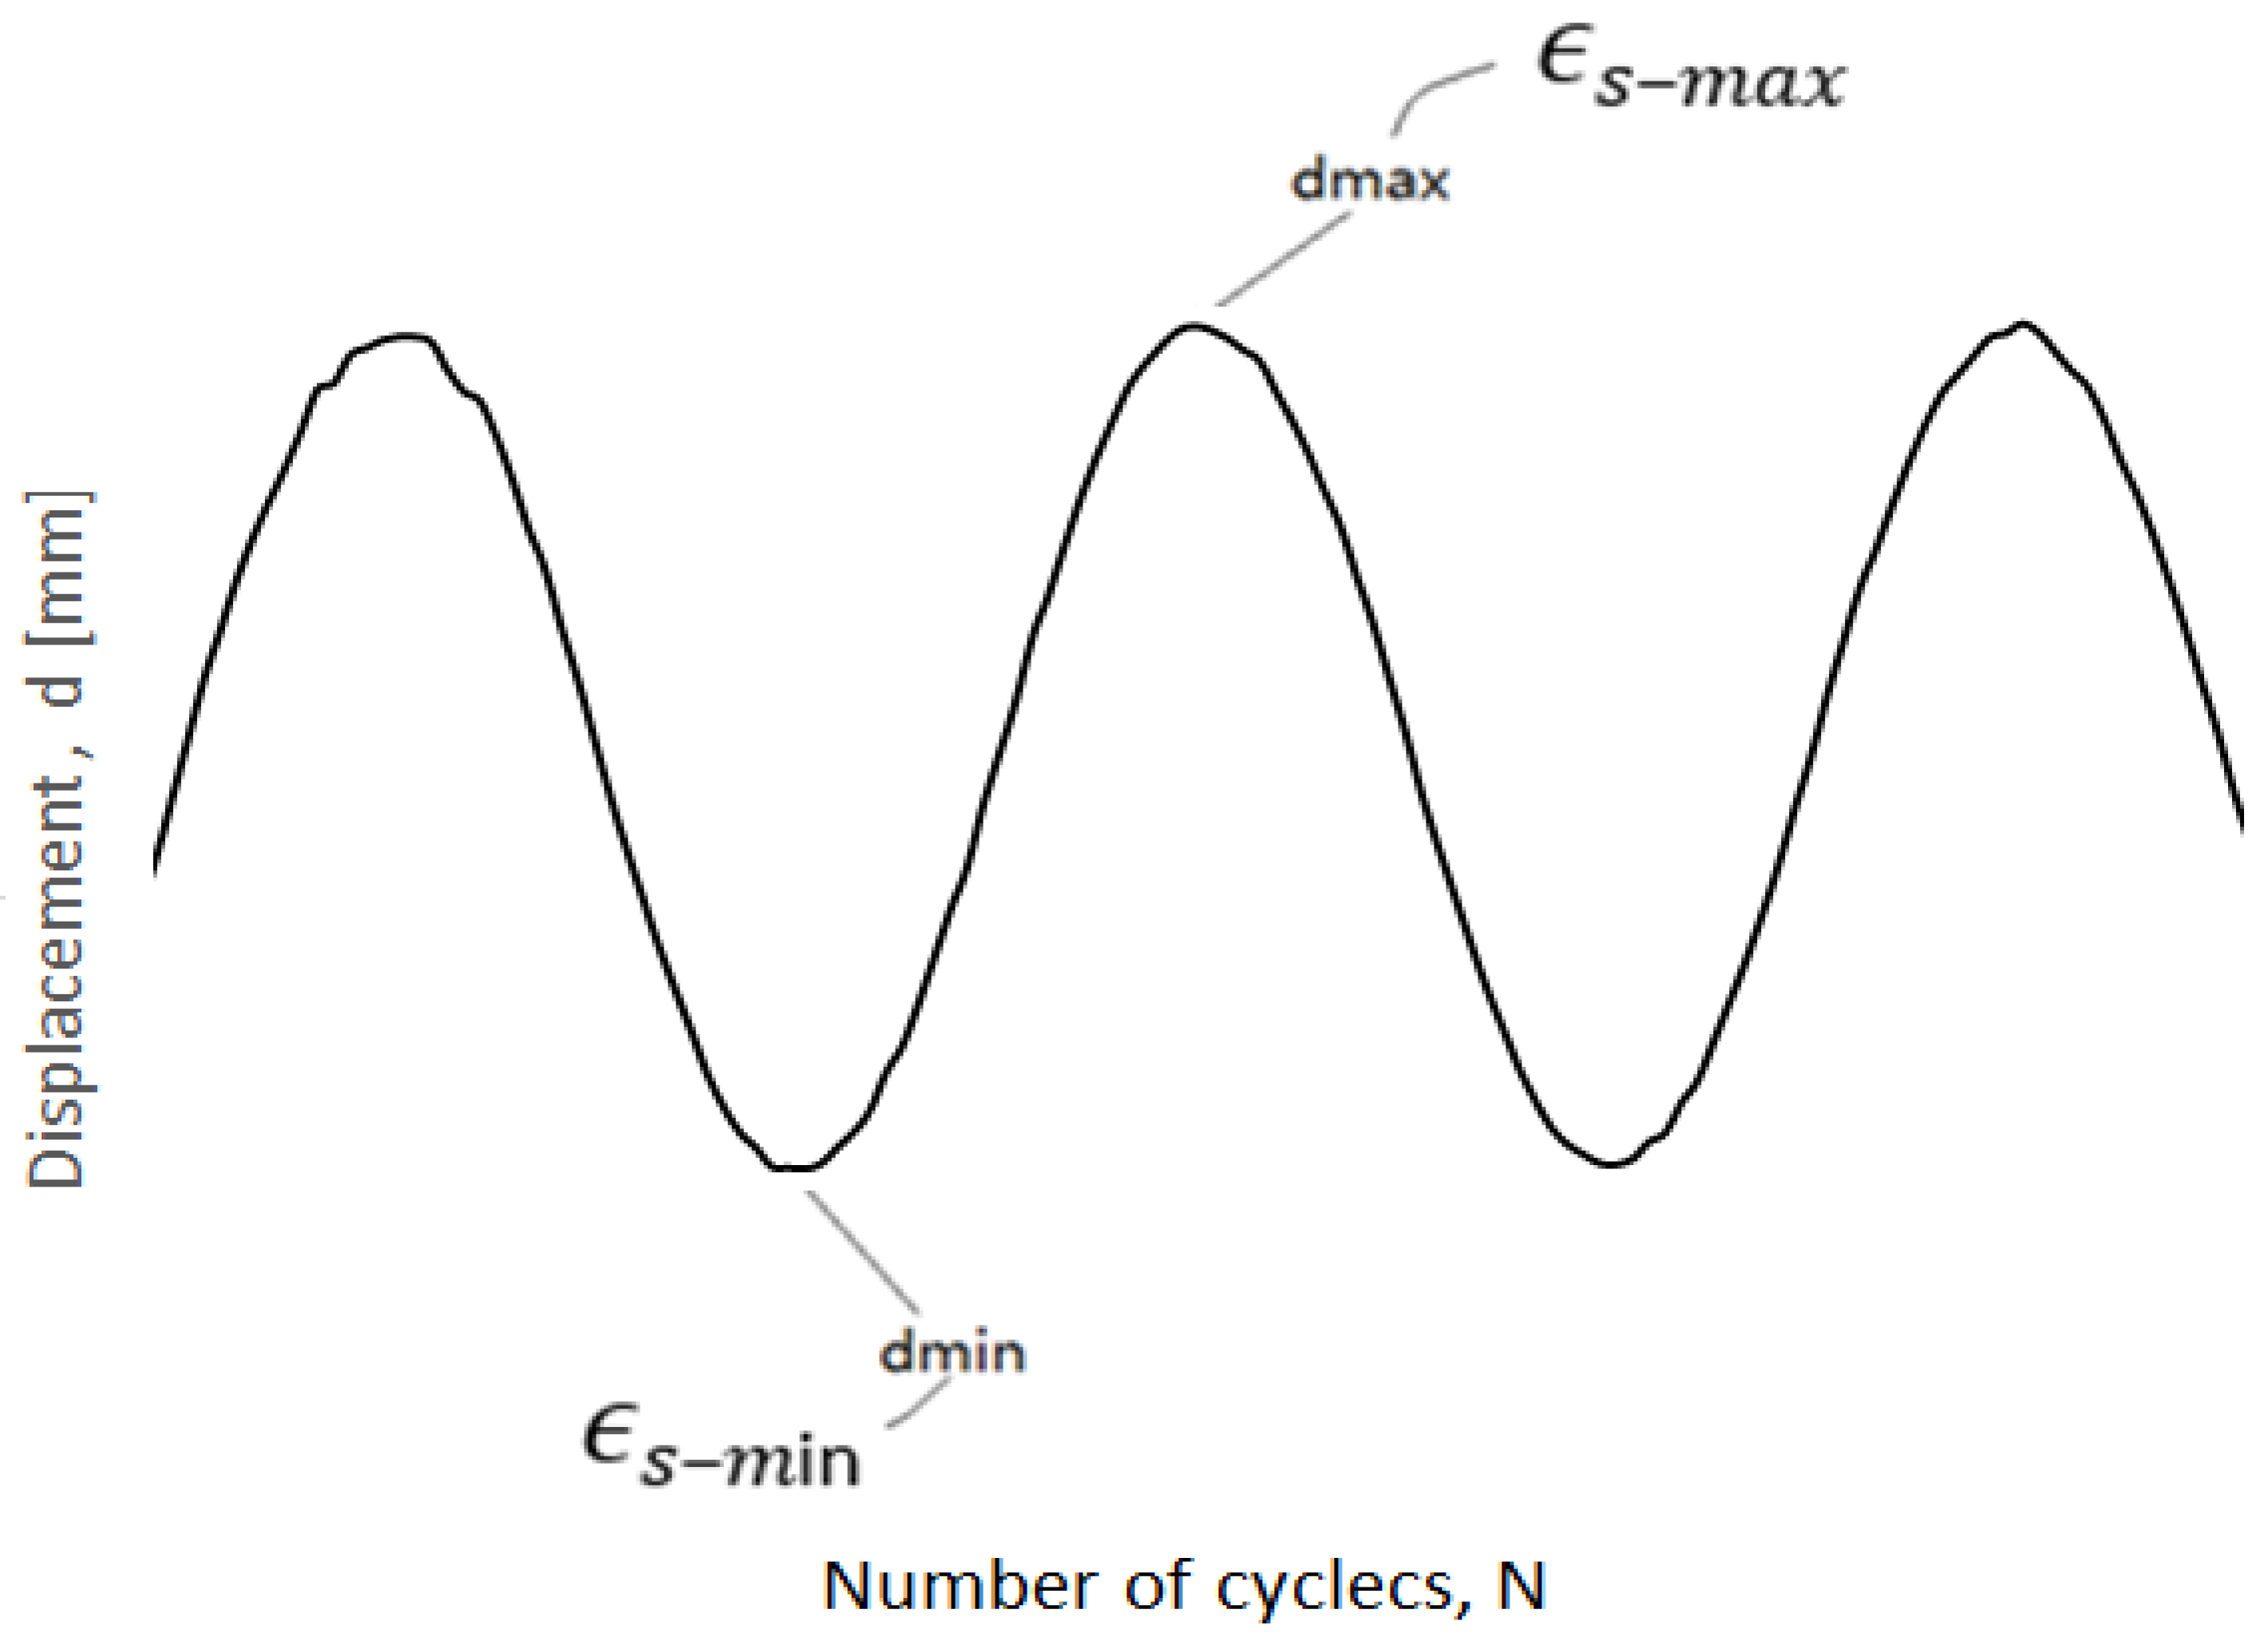
  • Evaluate the structural strains ( ϵ s m a x  and  ϵ s m i n ) at the max and min loads by intersecting the previous linear fit with the x-axis.
  • Evaluate  s  from Equation (10).
  • Considering that the membrane strain is given by Equation (8), the bending strain can be calculated using Equation (5):  ϵ s = ϵ m + ϵ b   .
  • Calculate r and I(r) from Equations (7) and (8).
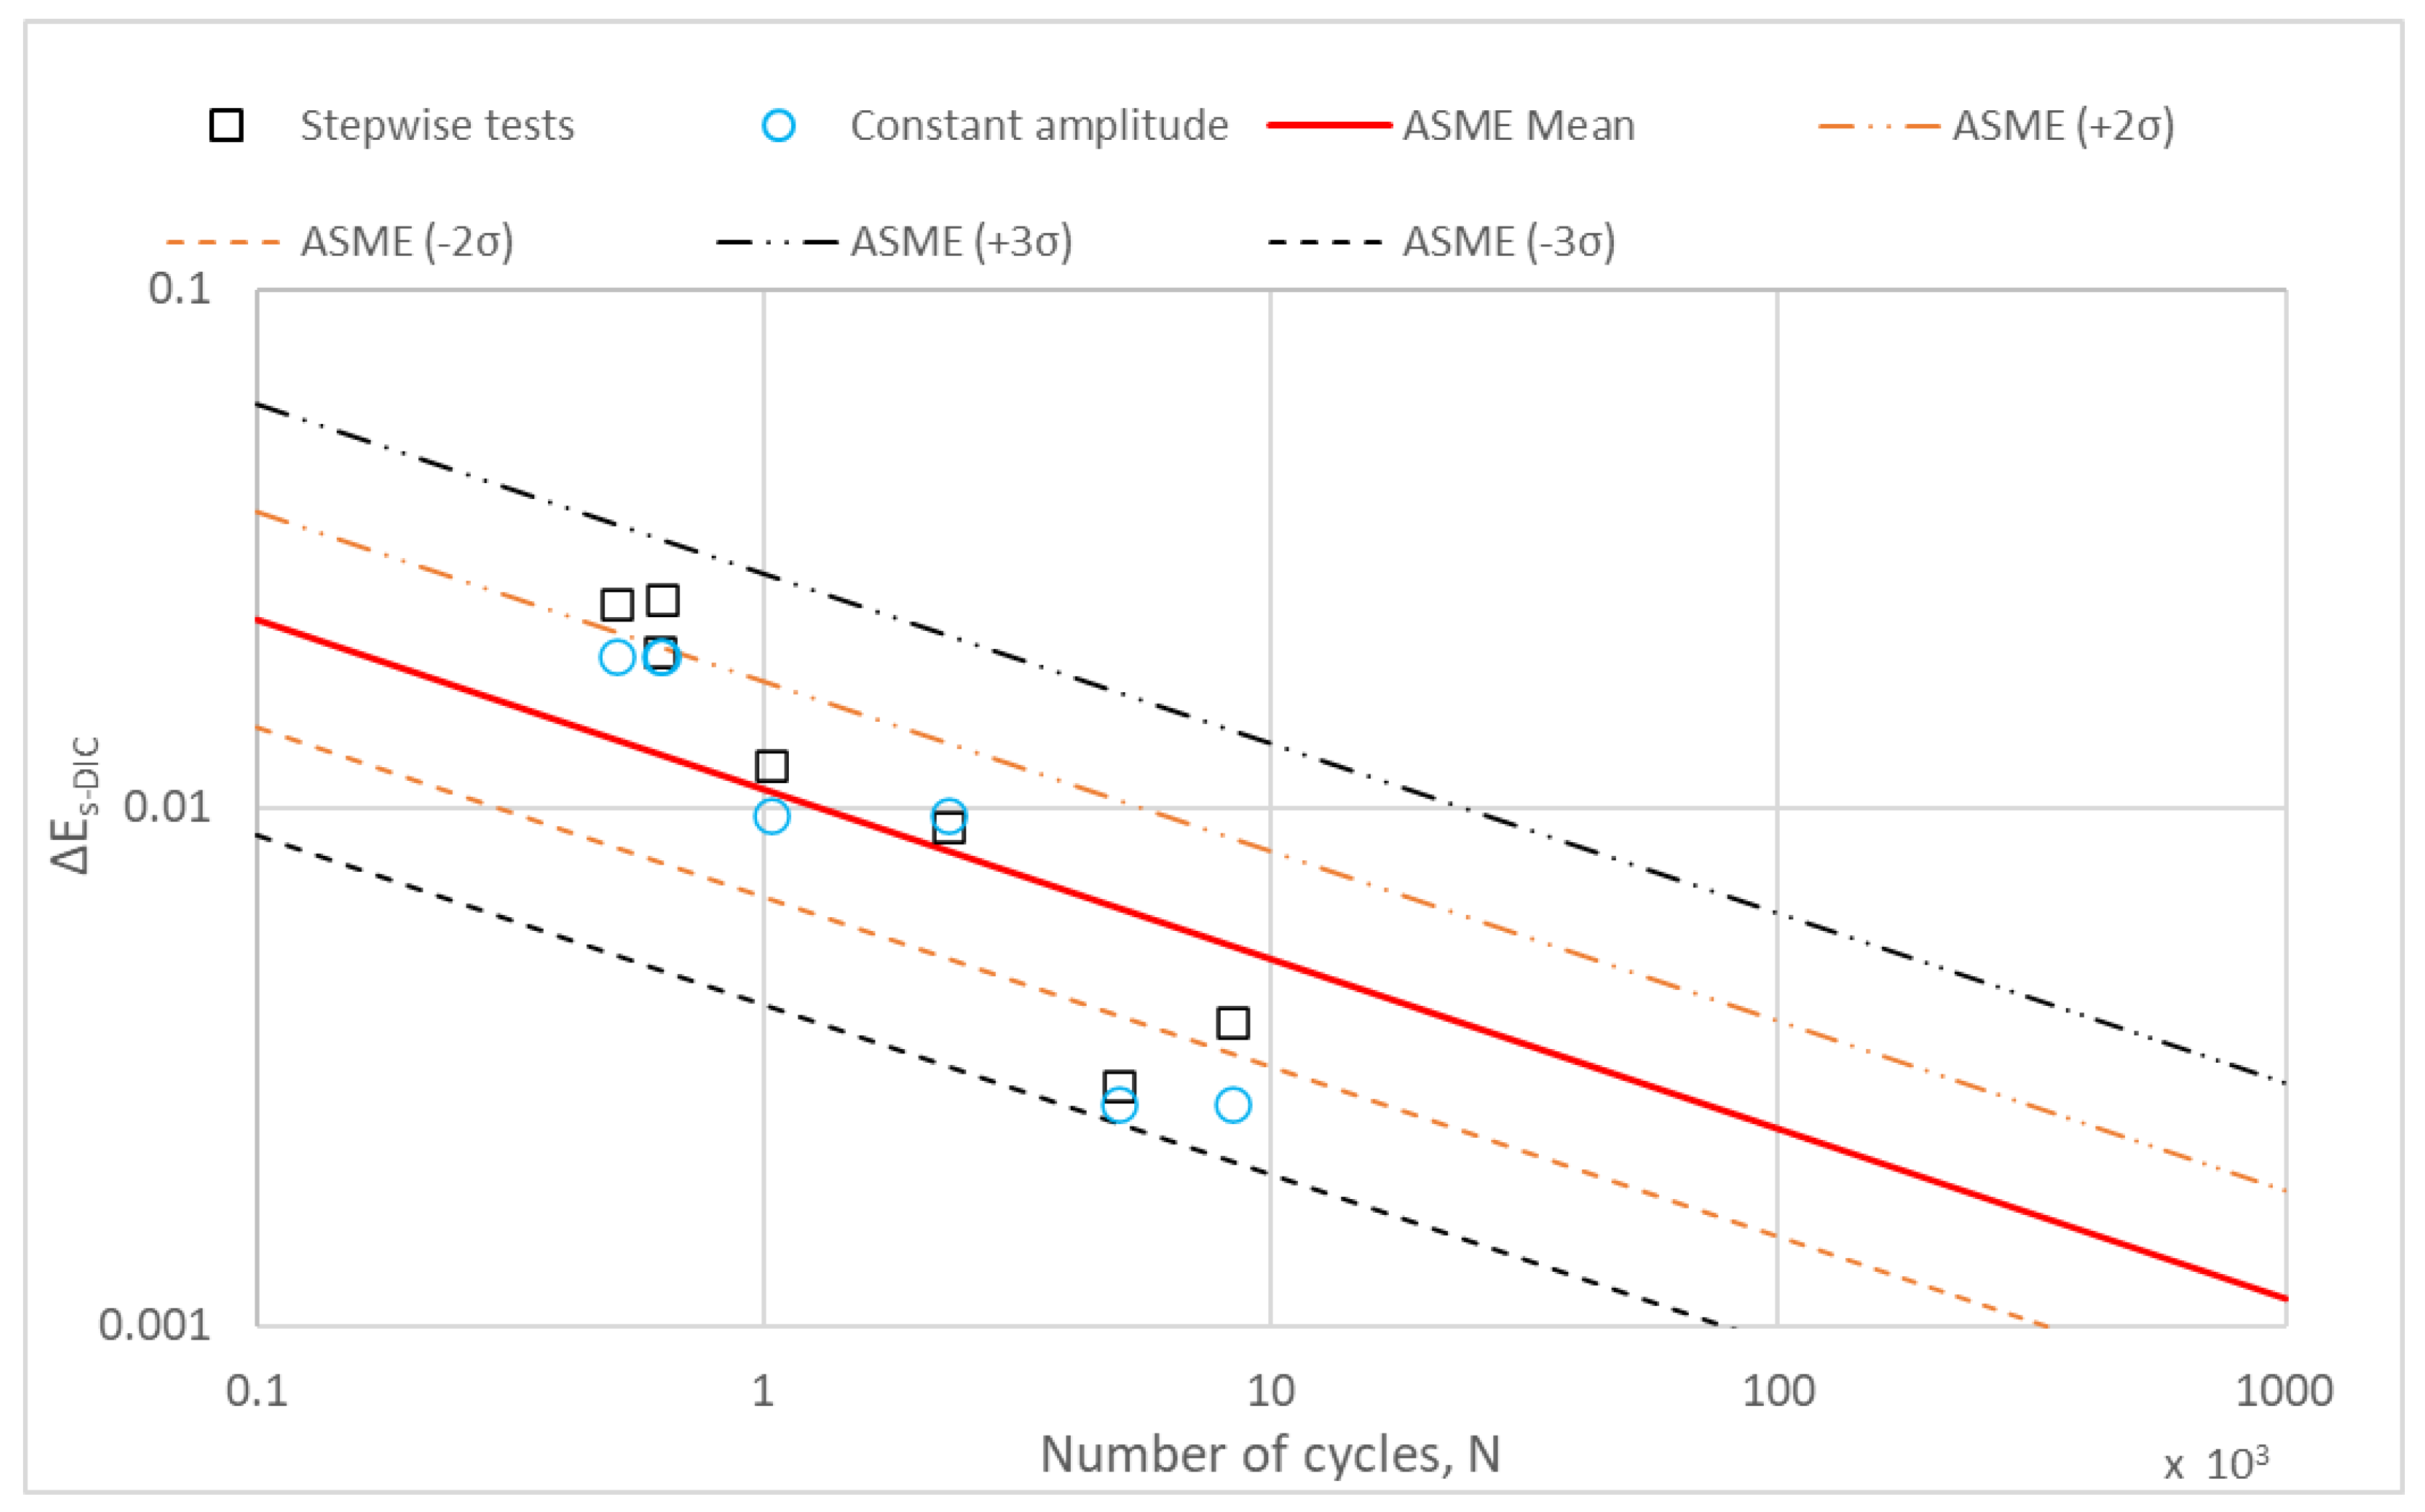
  • Evaluate  Δ E s  from Equation (6) and match it with the number of cycles to failure.
  • Compare the result to the ASME curve.
It is noteworthy that the equivalent structural strain values obtained from the DIC analysis (ΔEs from DIC), determined on the surface of the specimen, lie within the ±3σ scatter bands (external bands). In particular, most of the test results lie within the ±2σ boundary of the design curves except for some tests at low applied displacements. In addition, it has been demonstrated that this approach can be used also with stepwise succession tests at increasing amplitude displacements, which allows for considerable time savings in performing traditional experimental tests.

4. Conclusions

LCF tests were performed under displacement control: the tests were performed using traditional procedures and stepwise succession tests at increasing amplitudes.
The Digital Image Correlation (DIC) measurements permitted the assessment of the deformation field, which exhibited asymmetry in terms of the absolute values of the measured strains due to the sample geometry and residual stresses generated by welding. The same experimental technique permitted the assessment of the stabilized hysteresis loops at the notch.
The evaluation of the “equivalent structural strain parameter” by means of the DIC technique, as proposed by the authors, has never before been applied to S235 welded joints to the best of the authors’ knowledge, and it allows for a comparison of low-cycle fatigue (LCF) test data with the ASME Div 2 master E-N curve, which represents over 1000 large-scale fatigue tests with numbers of cycles to failure ranging from 102 to 108.
It is noteworthy that the equivalent structural strain values computed by means of the DIC (ΔEs from the DIC), on the external surface of the specimen, fall within the ±3σ scatter bands (external bands). In particular, most of the test results lie within the ±2σ boundary of the design curves except for some tests at low applied displacements. Moreover, it has been shown that this method is applicable to stepwise succession tests with increasing displacement amplitudes, leading to significant time savings compared to conventional experimental tests. Despite the considerable time savings, a limitation of applying the DIC–structural strain approach to stepwise tests is that it cannot experimentally predict fatigue life. The latter can be evaluated by referring to the ASME curve, thus entering into the diagram with the evaluated equivalent structural strain and calculating the expected number of cycles to failure. Future improvements in the DIC–structural strain method would be its application in the thickness direction of the specimen as well, rather than only on the external surface.

Author Contributions

Conceptualization, P.C. and P.D.; methodology, P.C. and P.D.; formal analysis, P.C.; investigation, P.C.; data curation, P.C.; writing—original draft, P.C.; writing—review and editing, P.C. and P.D.; visualization, P.D.; supervision, P.C. All authors have read and agreed to the published version of the manuscript.

Funding

This research received no external funding.

Institutional Review Board Statement

Not applicable.

Informed Consent Statement

Not applicable.

Data Availability Statement

Data are contained within the article.

Conflicts of Interest

The authors declare no conflicts of interest.

References

  1. Dong, Y.; Garbatov, Y.; Soares, C.G. Recent Developments in Fatigue Assessment of Ships and Offshore Structures. J. Mar. Sci. Appl. 2022, 21, 3–25. [Google Scholar] [CrossRef]
  2. Garbatov, Y.; Guedes Soares, C. Uncertainty Assessment of Fatigue Damage of Welded Ship Structural Joints. Eng. Struct. 2012, 44, 322–333. [Google Scholar] [CrossRef]
  3. Dong, Y.; Garbatov, Y.; Guedes Soares, C. Improved Effective Notch Strain Approach for Fatigue Reliability Assessment of Load-Carrying Fillet Welded Cruciform Joints in Low and High Cycle Fatigue. Mar. Struct. 2021, 75, 102849. [Google Scholar] [CrossRef]
  4. Corigliano, P. On the Compression Instability during Static and Low-Cycle Fatigue Loadings of AA 5083 Welded Joints: Full-Field and Numerical Analyses. J. Mar. Sci. Eng. 2022, 10, 212. [Google Scholar] [CrossRef]
  5. Hobbacher, A.F. The New IIW Recommendations for Fatigue Assessment of Welded Joints and Components—A Comprehensive Code Recently Updated. Int. J. Fatigue 2009, 31, 50–58. [Google Scholar] [CrossRef]
  6. Corigliano, P.; Cucinotta, F.; Guglielmino, E.; Risitano, G.; Santonocito, D. Thermographic Analysis during Tensile Tests and Fatigue Assessment of S355 Steel. Procedia Struct. Integr. 2019, 18, 280–286. [Google Scholar] [CrossRef]
  7. Greco, A.; Sgambitterra, E.; Furgiuele, F. A New Methodology for Measuring Residual Stress Using a Modified Berkovich Nano-Indenter. Int. J. Mech. Sci. 2021, 207, 106662. [Google Scholar] [CrossRef]
  8. Corigliano, P.; Crupi, V.; Fricke, W.; Friedrich, N.; Guglielmino, E. Experimental and Numerical Analysis of Fillet-Welded Joints under Low-Cycle Fatigue Loading by Means of Full-Field Techniques. Proc. Inst. Mech. Eng. C J. Mech. Eng. Sci. 2015, 229, 1327–1338. [Google Scholar] [CrossRef]
  9. Fricke, W. Recent Developments and Future Challenges in Fatigue Strength Assessment of Welded Joints. Proc. Inst. Mech. Eng. C J. Mech. Eng. Sci. 2015, 229, 1224–1239. [Google Scholar] [CrossRef]
  10. Baumgartner, J. Review and Considerations on the Fatigue Assessment of Welded Joints Using Reference Radii. Int. J. Fatigue 2017, 101, 459–468. [Google Scholar] [CrossRef]
  11. Braun, M.; Ehlers, S. Review of Methods for the High-Cycle Fatigue Strength Assessment of Steel Structures Subjected to Sub-Zero Temperature. Mar. Struct. 2022, 82, 103153. [Google Scholar] [CrossRef]
  12. Hobbacher, A. Fatigue Design of Welded Joints and Components; Woodhead Publishing: Cambridge, UK, 1996; ISBN 1855733153. [Google Scholar]
  13. Hobbacher, A. Recommendations for Fatigue Design of Welded Joints and Components. IIW document IIW-1823-07 ex XIII-2151r4-07/XV-1254r4-07 2008. Paris, France, October 2008. Available online: https://community.ptc.com/sejnu66972/attachments/sejnu66972/cpanalysis/5465/1/XIII-1823-07%20IIW%20Recommendations%20for%20fatigue%20design%20of%20welded%20joints%20and%20components%202008.pdf (accessed on 21 February 2024).
  14. Radaj, D.; Sonsino, C.M.; Fricke, W. Recent Developments in Local Concepts of Fatigue Assessment of Welded Joints. Int. J. Fatigue 2009, 31, 2–11. [Google Scholar] [CrossRef]
  15. Han, Q.; Wang, P.; Lu, Y. Path-dependent Multiaxial Fatigue Prediction of Welded Joints Using Structural Strain Method. Fatigue Fract. Eng. Mater. Struct. 2021, 44, 2800–2826. [Google Scholar] [CrossRef]
  16. Dong, P. American Society of Mechanical Engineers. In The Master S-N Curve Method: An Implementation for Fatigue Evaluation of Welded Components in the ASME B & PV Code, Section VIII, Division 2 and API 579-1/ASME FFS-1; Welding Research Council: Shaker Heights, OH, USA, 2010; ISBN 9781581455304. [Google Scholar]
  17. Pei, X.; Dong, P. An Analytically Formulated Structural Strain Method for Fatigue Evaluation of Welded Components Incorporating Nonlinear Hardening Effects. Fatigue Fract. Eng. Mater. Struct. 2019, 42, 239–255. [Google Scholar] [CrossRef]
  18. Lazzarin, P.; Tovo, R. A Notch Intensity Factor Approach to the Stress Analysis of Welds. Fatigue Fract. Eng. Mater. Struct. 1998, 21, 1089–1103. [Google Scholar] [CrossRef]
  19. Atzori, B.; Lazzarin, P.; Meneghetti, G.; Ricotta, M. Fatigue Design of Complex Welded Structures. Int. J. Fatigue 2009, 31, 59–69. [Google Scholar] [CrossRef]
  20. Meneghetti, G.; Lazzarin, P. Significance of the Elastic Peak Stress Evaluated by FE Analyses at the Point of Singularity of Sharp V-Notched Components. Fatigue Fract. Eng. Mater. Struct. 2007, 30, 95–106. [Google Scholar] [CrossRef]
  21. Meneghetti, G.; Guzzella, C. The Peak Stress Method to Estimate the Mode I Notch Stress Intensity Factor in Welded Joints Using Three-Dimensional Finite Element Models. Eng. Fract. Mech. 2014, 115, 154–171. [Google Scholar] [CrossRef]
  22. Chapetti, M.D.; Jaureguizahar, L.F. Fatigue Behavior Prediction of Welded Joints by Using an Integrated Fracture Mechanics Approach. Int. J. Fatigue 2012, 43, 43–53. [Google Scholar] [CrossRef]
  23. Zerbst, U.; Madia, M. Fracture Mechanics Based Assessment of the Fatigue Strength: Approach for the Determination of the Initial Crack Size. Fatigue Fract. Eng. Mater. Struct. 2015, 38, 1066–1075. [Google Scholar] [CrossRef]
  24. Lazzarin, P.; Zambardi, R. A Finite-Volume-Energy Based Approach to Predict the Static and Fatigue Behavior of Components with Sharp V-Shaped Notches. Int. J. Fract. 2001, 112, 275–298. [Google Scholar] [CrossRef]
  25. Foti, P.; Crisafulli, D.; Santonocito, D.; Risitano, G.; Berto, F. Effect of Misalignments and Welding Penetration on the Fatigue Strength of a Common Welded Detail: SED Method Predictions and Comparisons with Codes. Int. J. Fatigue 2022, 164, 107135. [Google Scholar] [CrossRef]
  26. Milone, A.; Foti, P.; Filippi, S.; Landolfo, R.; Berto, F. Evaluation of the Influence of Mean Stress on the Fatigue Behavior of Notched and Smooth Medium Carbon Steel Components through an Energetic Local Approach. Fatigue Fract. Eng. Mater. Struct. 2023, 46, 4315–4332. [Google Scholar] [CrossRef]
  27. Foti, P.; Razavi, N.; Ayatollahi, M.R.; Marsavina, L.; Berto, F. On the Application of the Volume Free Strain Energy Density Method to Blunt V-Notches under Mixed Mode Condition. Eng. Struct. 2021, 230, 111716. [Google Scholar] [CrossRef]
  28. Taylor, D.; Barrett, N.; Lucano, G. Some New Methods for Predicting Fatigue in Welded Joints. Int. J. Fatigue 2002, 24, 509–518. [Google Scholar] [CrossRef]
  29. Taylor, D. The Theory of Critical Distances: A New Perspective in Fracture Mechanics; Elsevier: Amsterdam, The Netherlands, 2007; ISBN 9780080554723. [Google Scholar]
  30. Saiprasertkit, K. Fatigue Strength Assessment of Load-Carrying Cruciform Joints in Low- and High-Cycle Fatigue Region Based on Effective Notch Strain Concept. Weld. World 2014, 58, 455–467. [Google Scholar] [CrossRef]
  31. Saiprasertkit, K.; Hanji, T.; Miki, C. Local Strain Estimation Method for Low- and High-Cycle Fatigue Strength Evaluation. Int. J. Fatigue 2012, 40, 1–6. [Google Scholar] [CrossRef]
  32. Al Zamzami, I.; Davison, B.; Susmel, L. Nominal and Local Stress Quantities to Design Aluminium-to-Steel Thin Welded Joints against Fatigue. Int. J. Fatigue 2019, 123, 279–295. [Google Scholar] [CrossRef]
  33. Al Zamzami, I.; Di Cocco, V.; Davison, J.B.; Iacoviello, F.; Susmel, L. Static Strength and Design of Aluminium-to-Steel Thin Welded Joints. Weld. World 2018, 62, 1255–1272. [Google Scholar] [CrossRef]
  34. Shen, W.; Yan, R.; He, F.; Wang, S. Multiaxial Fatigue Analysis of Complex Welded Joints in Notch Stress Approach. Eng. Fract. Mech. 2018, 204, 344–360. [Google Scholar] [CrossRef]
  35. Sonsino, C.M.; Radaj, D.; Brandt, U.; Lehrke, H.P. Fatigue Assessment of Welded Joints in AlMg 4.5Mn Aluminum Alloy (AA 5083) by Local Approaches. Int. J. Fatigue 1999, 21, 985–999. [Google Scholar] [CrossRef]
  36. Susmel, L. Multiaxial Notch Fatigue. Aircr. Eng. Aerosp. Technol. 2009, 81, 24–31. [Google Scholar] [CrossRef]
  37. Al Zamzami, I.; Susmel, L. On the Use of Hot-Spot Stresses, Effective Notch Stresses and the Point Method to Estimate Lifetime of Inclined Welds Subjected to Uniaxial Fatigue Loading. Int. J. Fatigue 2018, 117, 432–449. [Google Scholar] [CrossRef]
  38. Fricke, W.; Cui, W.; Kierkegaard, H.; Kihl, D.; Koval, M.; Mikkola, T.; Parmentier, G.; Toyosada, M.; Yoon, J.H. Comparative Fatigue Strength Assessment of a Structural Detail in a Containership Using Various Approaches of Classification Societies. Mar. Struct. 2002, 15, 1–13. [Google Scholar] [CrossRef]
  39. Chen, J.; Feng, Z. Strain and Distortion Monitoring during Arc Welding by 3D Digital Image Correlation. Sci. Technol. Weld. Join. 2018, 23, 536–542. [Google Scholar] [CrossRef]
  40. Dannemann, K.A.; Bigger, R.P.; Scott, N.L.; Weiss, C.E.; Carpenter, A.J. Application of Digital Image Correlation for Comparison of Deformation Response in Fusion and Friction Stir Welds. J. Dyn. Behav. Mater. 2016, 2, 347–364. [Google Scholar] [CrossRef]
  41. Reynolds, A.; Duvall, F.J. Digital Image Correlation for Determination of Weld and Base Metal Constitutive Behavior. Weld. J. 1999, 78, 355–360. [Google Scholar]
  42. Ono, Y.; Yokoyama, T. Determination of Local Constitutive Behavior of AA6061–T6 Friction Stir Welds Using Digital Image Correlation. Proc. Inst. Mech. Eng. Part L J. Mater. Des. Appl. 2022, 236, 1574–1589. [Google Scholar] [CrossRef]
  43. Shahmirzaloo, A.; Farahani, M.; Farhang, M. Evaluation of Local Constitutive Properties of Al2024 Friction Stir-Welded Joints Using Digital Image Correlation Method. J. Strain Anal. Eng. Des. 2020, 56, 419–429. [Google Scholar] [CrossRef]
  44. Corigliano, P.; Crupi, V.; Pei, X.; Dong, P. DIC-Based Structural Strain Approach for Low-Cycle Fatigue Assessment of AA 5083 Welded Joints. Theor. Appl. Fract. Mech. 2021, 116, 103090. [Google Scholar] [CrossRef]
  45. Fricke, W.; Friedrich, N.; Musumeci, L.; Paetzold, H. Low-Cycle Fatigue Analysis of a Web Frame Corner in Ship Structures. Weld. World 2014, 58, 319–327. [Google Scholar] [CrossRef]
  46. Dong, P. A Structural Stress Definition and Numerical Implementation for Fatigue Analysis of Welded Joints. Int. J. Fatigue 2001, 23, 865–876. [Google Scholar] [CrossRef]
Figure 1. (a) Large-scale model, (b) small-scale specimen [8], and (c) real specimen; units in mm.
Jmse 12 00531 g001
Figure 2. Imposed displacement versus the number of cycles in tests no. 10 and 11.
Jmse 12 00531 g002
Figure 3. (a) Specimen during test, (b) first principal strain at max load, u = +2 mm; (c) third principal strain at min load, u = 2 mm.
Jmse 12 00531 g003
Figure 4. Longitudinal strain during the stepwise test at increasing displacement amplitudes.
Jmse 12 00531 g004
Figure 5. Hysteresis cycles at different displacement amplitudes (u), measured by DIC.
Jmse 12 00531 g005
Figure 6. Three-dimensional map of the longitudinal strain with respect to the upper plate and stage points (SPs) defined by means of DIC.
Jmse 12 00531 g006
Figure 7. Longitudinal strain vs. number of cycles after 100 cycles for SP0, SP3, and SP6. Test 10, ua = 1 mm.
Jmse 12 00531 g007
Figure 8. Longitudinal strain vs. number of cycles after 2000 cycles for SP0, SP3, and SP6. Test 10, ua = 1.5 mm.
Jmse 12 00531 g008
Figure 9. Longitudinal strain vs. number of cycles after 2500 cycles for SP0, SP3, and SP6. Test 10, ua = 2 mm.
Jmse 12 00531 g009
Figure 10. Structural strain and notch strain distribution [44].
Jmse 12 00531 g010
Figure 11. Explanation of structural strain: (a) Traction structural stress ( σ m + σ b ) defined on the cross-section A-A of a plate, applying the mesh-insensitive scheme [16]; (b) an illustration of the structural strain ( ϵ m , ϵ b ) in section A-A.
Jmse 12 00531 g011
Figure 12. A three-dimensional map of the longitudinal strains and a central path for structural strain analyses.
Jmse 12 00531 g012
Figure 13. Structural strain values calculated at the max and min displacements.
Jmse 12 00531 g013
Figure 14. Structural strain at da = 1 mm.
Jmse 12 00531 g014
Figure 15. Structural strain at da = 1.5 mm.
Jmse 12 00531 g015
Figure 16. Structural strain at da = 2 mm.
Jmse 12 00531 g016
Figure 17. Equivalent structural strain by means of DIC and comparison to ASME curve.
Jmse 12 00531 g017
Table 1. Values used and results of experimental LCF tests (Ru = −1); part of data from [8].
TestDisplacement Amplitude
ua [mm]
Test Frequency
f [Hz]
Cycles to Failure
Nf_exp
12.50.1375
22.50.1430
321620
421628
520.1510
61.511028
71.512312
8115000
9118400
101–1.5–21Stepwise test
111–1.5–21Stepwise test
Table 2. Values of structural strains.
da [mm]ϵs−max %ϵs−min %Δϵs %
10.2124−0.13520.003476
1.50.4177−0.4460.008637
20.9082−0.89020.017984
Table 3. Displacement on the upper plate and membrane and bending strain values.
da [mm]dax [mm]ϵmϵb
10.367319370.00510166−0.0016257
1.50.5509790520.0076524870.000984513
20.7346387350.0102033160.007780684
Table 4. Life integral I(r); bending ratio r.
ua [mm]rI(r)1/m
1−0.46768061.21102561
1.50.1139878631.222712058
20.4326448081.231805941
Table 5. Equivalent structural strain ΔEs.
uaNfStepwise Tests
ΔEs
Constant-Amplitude Tests
ΔEs
150000.00290.0027
84000.00380.0027
1.510280.01210.0097
23120.00920.0097
26200.02000.0196
6280.02540.0196
5100.02480.0196
Disclaimer/Publisher’s Note: The statements, opinions and data contained in all publications are solely those of the individual author(s) and contributor(s) and not of MDPI and/or the editor(s). MDPI and/or the editor(s) disclaim responsibility for any injury to people or property resulting from any ideas, methods, instructions or products referred to in the content.

