Abstract
Multi-scale coherent structures have been observed in ocean currents, which are induced by the interaction of shear flows with different velocities. Understanding the spatial configuration and scale characteristics of coherent structures will promote the explanation of physical ocean phenomena. Considering the self-similarity, we propose a spatial correlation identification model for coherent structure extraction and three-dimensional visualization based on the wavelet transform and time-dependent intrinsic correlation method. The spatial and scale distributions of coherent structures are related to the dissipation rate variation. Most large-scale coherent structures, with the largest length scale of 13 m, are found to exist in stable fluid, such as the water column below 50 m. However, small-scale structures are found in chaotic fluids, such as the upper layer. Furthermore, we found that coherent structures of different scales coexist simultaneously in the same depth range, indicating a simultaneous multi-scale structure pattern for turbulent flow investigations.
1. Introduction
Ocean currents consist of multiple scales of coherent structures, recognized as interconnected fluid parcels with concentrated vorticity over spatial regions [1]. Understanding the structures is a critical task for ocean engineering, such as tidal power generation and voyage friction reduction. Meanwhile, the coherent structure is a critical contributor to fluid entrainment, mass transfer, momentum exchange, and heat mixing across scales [2,3,4,5,6]. Therefore, it is important for turbulence research to identify the coherent structure at different scales and to study its spatial characteristics and scale properties in ocean flows.
Coherent structures are typically classified as large-scale or small-scale according to their size in space [7,8]. The large-scale coherent structure is the skeleton of fluid flows [9]. It has relatively slow dynamics and is responsible for current evolution trends. The small-scale event has a faster evolution time scale, driving energy dissipation [10]. They coexist in the water column [11,12], but extracting these structures and analyzing their properties are not trivial. Previous research has developed several approaches to detect these structures, including the proper orthogonal decomposition method [13,14,15], wavelet approach [16,17,18], Fourier analysis [19,20], Eulerian methods [21,22], and Lagrangian method [23,24,25]. The main limitation of these methods is the relatively arbitrary selection of a threshold. The cut-off frequency must be manually adjusted to separate the coherent structure and noncoherent residue from the raw signal [26,27,28], which is not completely objective. Eulerian methods, such as the Q criterion [29], criterion [30], and Δ criterion [31,32], provide a perspective for identifying coherent structures in the Eulerian velocity field. Similarly, an appropriate threshold is required in advance, and the choice of Eulerian reference frame would additionally affect detection results. Lagrangian methods detect coherent structures by tracking the fluid trajectory. However, only the coherent structures at the ocean surface can be detected, and the coherent events in deep ocean currents are ignored. Moreover, most of these data-driven approaches rely on single-point measurements [33,34,35], PIV [36,37,38,39], and direct numerical simulations [40,41]. The single-point measurements can provide a one-dimensional signal according to Taylor’s frozen hypothesis. Coherent events are three-dimensional structures, and the narrow information hinders spatial scale investigation, which is a critical task for chaotic turbulence interaction. PIV provides detailed particle movement trajectory for structure detection, but it is not practical for flexible observations due to deployment limitations. Meanwhile, in addition to simulation data, the practical signals measured from oceans and lakes are significant for turbulence analysis. In addition, a large array of instruments can be used to sample spatial signals over a long period. However, this deployment would result in a heavy financial burden [42,43,44].
Considering the above limitation, we propose a spatial correlation identification (SCI) model for a pair of shear data measured in an orthogonal pattern to identify coherent structures and provide a three-dimensional visualization based on the wavelet transform and time-dependent intrinsic correlation (TDIC) method. The wavelet transform provides the advantage of decomposing turbulence shear signal scale by scale since the turbulent fluid is composed of multi-scale coherent structures and because energy and other quantities tend to cascade from large to smaller events [17,45,46,47]. Extensive research has been conducted to evaluate the local energy density, such as studies by Lucia and Gassmann [46], Gong et al. [17], and Protzko et al. [47], providing a potential for the extraction and characterization of multi-scale structures. Meanwhile, TDIC offers a major advance in evaluating the spatial correlation variation between a pair of turbulence shear signals since the spatial information is highly self-similar in a coherent structure. It was first proposed in the study by Chen [48] and has been applied in various nonlinear research [49,50,51]. Furthermore, the adaptive sliding window size makes it applicable to detect correlation information from nonlinear turbulence shear signals.
In the proposed method, characteristic fluctuations with energy peaks are extracted to identify the coherent structures. The self-similarity is evaluated according to the spatial correlation between a pair of shear data collected in an orthogonal pattern, and coherent structures are detected by the highly correlated region. Unlike conventional methods, we do not rely on the prior information of structure scale. We investigate the length scale characteristics based on identification results, which provide practical scale knowledge for turbulence research. Furthermore, the data orthogonally measured in the vertical water column drives a three-dimensional structure identification way for coherent eddy visualization.
In this paper, a pair of shear data is measured from the South China Sea (SCS) using a MicroRider equipped with a pair of orthogonal shear probes. To identify coherent structures in the fluid field, we propose the SCI model to extract the coherent structures and investigate their spatial properties. In Section 2, the experimental measurements and identification methodology are presented in detail. In Section 3, the extraction results and physical properties of coherent structures are investigated. The conclusions are given in Section 4.
2. Materials and Methods
2.1. Measurements
In this section, we give a brief introduction to experimental measurement in the South China Sea (SCS). The experimental observation was conducted at the station (19°39′ N, 115°27′ E) using the MicroRider on 21 December 2020 (Figure 1). The total depth of this station is nearly 2000 m, but only the water column from 0 to 285 m was observed due to some experimental limitations. In this observation, the high-resolution MicroRider freely fell through the water column at an average speed of 0.6 m/s, and it provided a pair of shear data collected by the orthogonal shear probes installed at the head of the MicroRider at a sampling rate of 512 Hz.
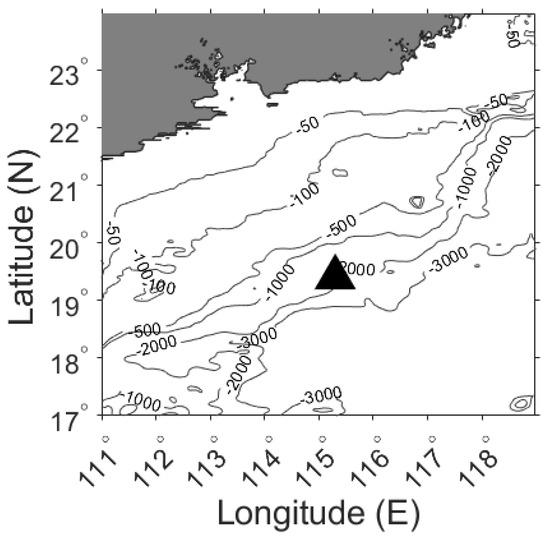
Figure 1.
The bathymetric map of experimental observations. The location of the measurement station is marked with a black triangle.
2.2. Methods
It is assumed that a coherent structure is composed of self-similar particles with extremely close evolution characteristics, and it is generally surrounded by incoherence regions with different evolution tendencies [25,52]. To extract coherent structures, it is necessary to evaluate the spatial correlation in the fluid field. In this section, a spatial correlation identification (SCI) model is introduced to extract coherent events from a pair of shear data collected in an orthogonal pattern and to visualize a three-dimensional framework for these structures based on the wavelet transform method and the time-dependent intrinsic correlation (TDIC) method. An overview of the proposed SCI model is shown in Figure 2.
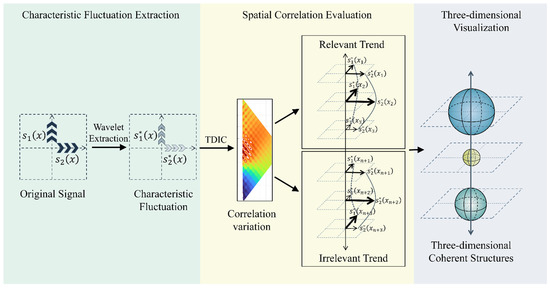
Figure 2.
The flow chart of the SCI model.
Before detecting coherent structures, it is necessary to define a pair of shear data and collected along the orthogonal direction,
where is the depth of the sampling point. Shear data collected at the same depth allow the instantaneous horizontal characteristic of the flow structure to be evaluated based on the sectional slice. As this pair of signals varies with depth , the instantaneous horizontal characteristics in a slice can be tracked along the vertical column, providing a three-dimensional fluid field for coherent structure extraction.
It is assumed that the dominating turbulent energy is preserved in coherent structures. Characteristic fluctuations that contain dominant energy and drive turbulent flow evolution must be extracted to identify the spatial coherent structure. Here, the wavelet transform is introduced to decompose shear into wavelet coefficients scale by scale, which are given by
where is scale dilation, represents space translating, and denotes the complex conjugate of the mother wavelet function. denotes space parameter, and the wavelet coefficient represents an -scaled vortex structure generated at location .
In addition, the wavelet energy variation of each wavelet coefficient is obtained by
where represents turbulent energy at scale , and is the reconstruction coefficient. is the value of scale parameter for which the energy of the corresponding wavelet coefficient reaches a peak. The characteristic fluctuation containing dominant energy is reconstructed [53] based on the selected wavelet coefficients at scale .
The three-dimensional coherent structure is a self-similar block, and each particle in this block has extremely close evolution properties. The classical global correlation expression applicable to nonlinear series may give confusing cross-correlation results between two series. Therefore, the TDIC method is introduced to evaluate the correlation between these characteristic fluctuations, e.g., and , and to detect coherent events from the vertical fluid field. The TDIC between and at depth is given by
where represents the local correlation calculation of two series and in a sliding window , and is any positive number. The sliding window size is given as , and the minimum window size is . Here, is the instantaneous depth cycle of and is obtained using the zero-crossing method. The adaptive criterion ensures that at least one depth cycle is covered in the local correlation computation. In addition, a student’s t-test is introduced to ensure validation of the correlation coefficient.
If is above 0.8, these two characteristic fluctuations in the sliding window follow a correlated trend, and this continuous depth region with a correlated trend implies the presence of coherent structures. On the contrary, if , it represents an uncorrelated trend in this continuous depth range, indicating a disorganized fluid field and the absence of coherent structures. According to the correlation characteristics, the three-dimensional spatial framework of coherent structures in fluid flow is constructed. In the three-dimensional visualization procedure, a coherent structure is constructed as a three-dimensional spheroid covering a continuous correlated depth region. Meanwhile, its vertical length scale is given as the length of this continuous region. To visualize the three-dimensional framework, the horizontal length scale of a spheroid is set equal to the vertical length scale, and the true horizontal scale will be investigated in future research.
3. Results
We have applied the SCI model to a practical marine fluid, namely the SCS. The observation configuration is described in Section 2. Based on the free-fall observation, turbulence data and fluid field characteristics of marine water column are measured and investigated. Prominent peaks can be observed in the surface depth range due to inevitable wave beating. Therefore, only turbulence records below 5 m are used to investigate the microstructure properties. Pitch variation and fall velocity variation in the effective depth range indicate a steady descent of the instrument without any violent disturbances (Figure 3a,b). Figure 3c shows a sharp temperature drop indicating a pycnocline at 105 m, and the water temperature dropped from 26 °C to 11 °C. To improve data quality, the Goodman coherence noise reduction method [54] is applied to suppress noisy contamination contained in the raw shear signals. From the wavenumber spectrum, the corrected shear spectrum agrees with the Nasmyth spectrum [55], indicating a compelling data set for the following investigation (Figure 3e). Meanwhile, turbulence mixing signatures are evaluated by the dissipation rate (Figure 3d) [56,57]. The average magnitude of dissipation rate is nearly 10−7 in the surface layer between 5 m and 90 m. Relatively weak mixing intensity is detected below 90 m, and the average magnitude order decreases to 10−9. At a depth of 85 m, a sharp increase is detected, which may be caused by the undesired release and drag during operation. This can also be observed by the rise and subsequent decrease in fall velocity within the same depth range.
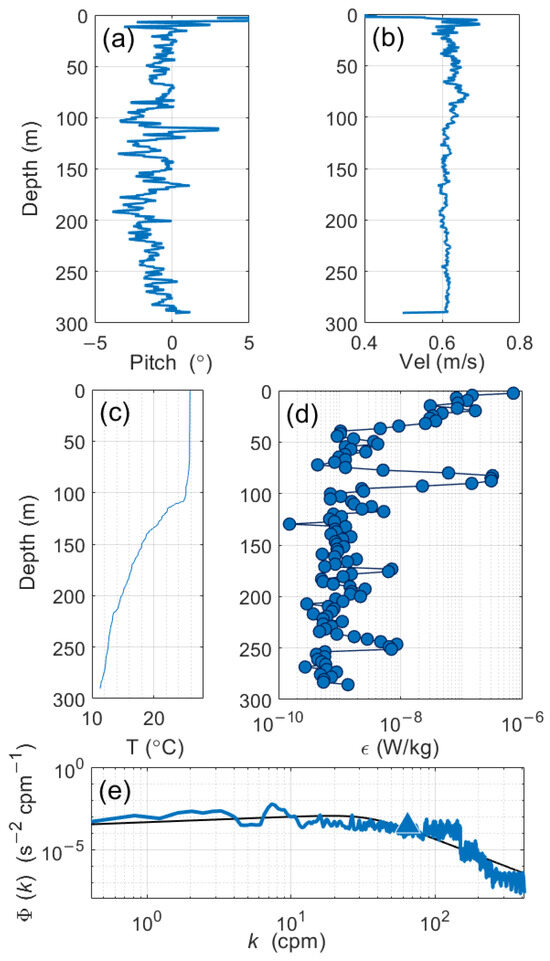
Figure 3.
Vertical variations obtained by the MicroRider. (a) Pitch profile. (b) Fall velocity variation. (c) Temperature variation. (d) Dissipation rates. (e) Wavenumber spectrum.
The entire effective depth range is divided into 14 depth segments with an average length of 20 m. At each depth segment, the shear signal is decomposed into multi-frequency wavelet coefficients using the wavelet transform method, and their energy variations are evaluated. The wavelet spectrum between 165 m and 185 m is shown in Figure 4 as an example. Multi-frequency energy blocks are detected; so, energy contributions of each wavelet coefficient are evaluated to extract the characteristic fluctuations and with maximum energy (Figure 5).
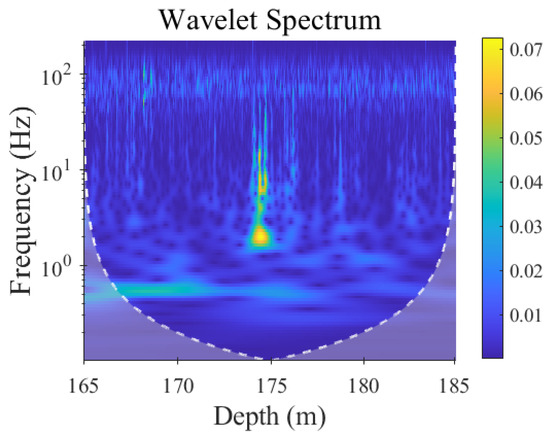
Figure 4.
Wavelet spectrum obtained from the shear signal between 165 m and 185 m.

Figure 5.
Energy normalization at each depth segment. Colors represent energy variations in different depth segments.
The spatial correlation of characteristic fluctuations is evaluated. To present cross-correlation results in more detail, only the graphic trapezoid part of the correlation triangle is shown in Figure 6. Figure 6 shows a trapezoid: the vertical axis represents the observation depth, and the horizontal axis indicates the sliding window size. Highly correlated regions in the vertical fluid field can be seen from the graphic results. Correspondingly, coherent structures are marked by these continuous highly correlated regions (R ≥ 0.8), which are shown in red. Meanwhile, the left voids in Figure 6 represent local correlation regions that do not satisfy the student’s t-test. The leftmost vertical curve indicates the minimum size of the sliding window, such as 0.2 m in Figure 6a and 0.6 m in Figure 6h. Assuming Taylor’s frozen field, with a mean fall velocity of 0.6 m/s in this profile, the length of the high correlation region along the minimum window size curve gives a length scale of coherence events. Figure 6f shows three significant regions, indicating three coherent events at 107 m, 112 m, and 115 m, with length scales of 1.3 m, 1.9 m, and 2 m, respectively. There are eight highly correlated regions in Figure 6h, showing coherent structures at 146 m, 151 m, 155.5 m, 157.3 m, 157.6 m, 159.1 m, 161 m, and 163.2 m, with length scales of 0.5 m, 2.6 m, 1 m, 0.07 m, 0.07 m, 0.2 m, 0.7 m, and 0.7 m, respectively.
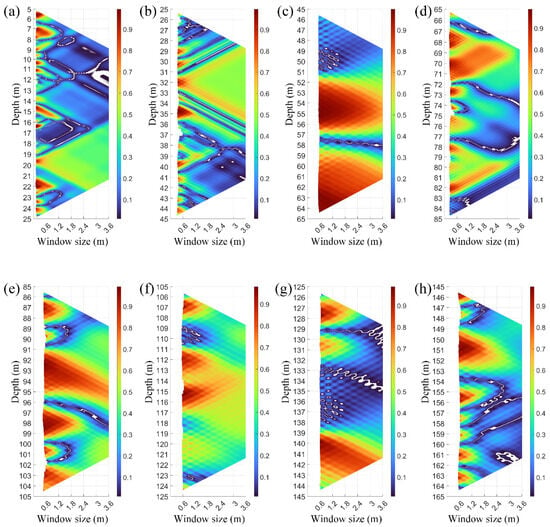
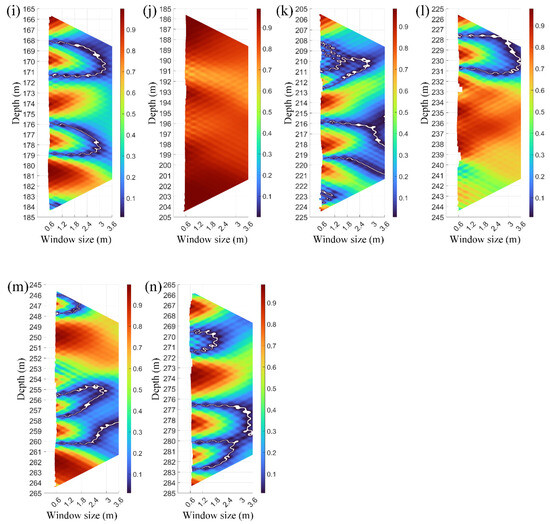
Figure 6.
Graphic trapezoids of spatial correlation. High correlation is denoted by the red color and the uncorrelated region is depicted with the blue color. (a) Spatial correlation trapezoid from 5 m to 25 m. (b) Spatial correlation trapezoid from 25 m to 45 m. (c) Spatial correlation trapezoid from 45 m to 65 m. (d) Spatial correlation trapezoid from 65 m to 85 m. (e) Spatial correlation trapezoid from 85 m to 105 m. (f) Spatial correlation trapezoid from 105 m to 125 m. (g) Spatial correlation trapezoid from 125 m to 145 m. (h) Spatial correlation trapezoid from 145 m to 165 m. (i) Spatial correlation trapezoid from 165 m to 185 m. (j) Spatial correlation trapezoid from 185 m to 205 m. (k) Spatial correlation trapezoid from 205 m to 225 m. (l) Spatial correlation trapezoid from 225 m to 245 m. (m) Spatial correlation trapezoid from 245 m to 265 m. (n) Spatial correlation trapezoid from 265 m to 285 m.
Subsequently, three-dimensional coherent structure spheroids are constructed (Figure 7) according to these graphic trapezoids. Each coherent structure is isolated by uncorrelated regions (white surround space in Figure 7). Meanwhile, these three-dimensional spheroids give the possible barriers between coherent and noncoherent structures, which are represented as spheroid edges.
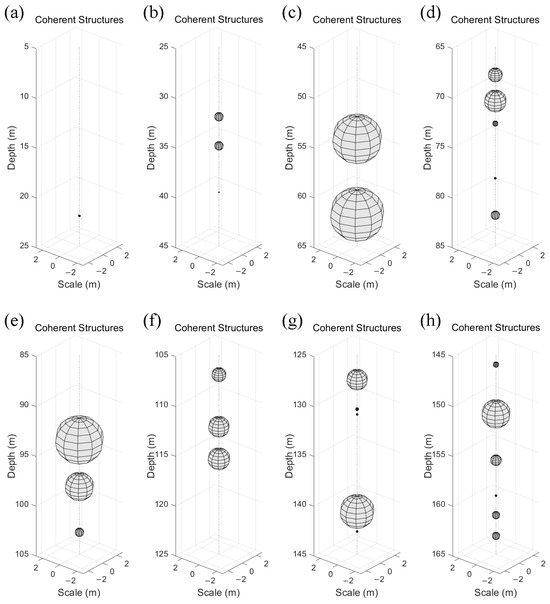
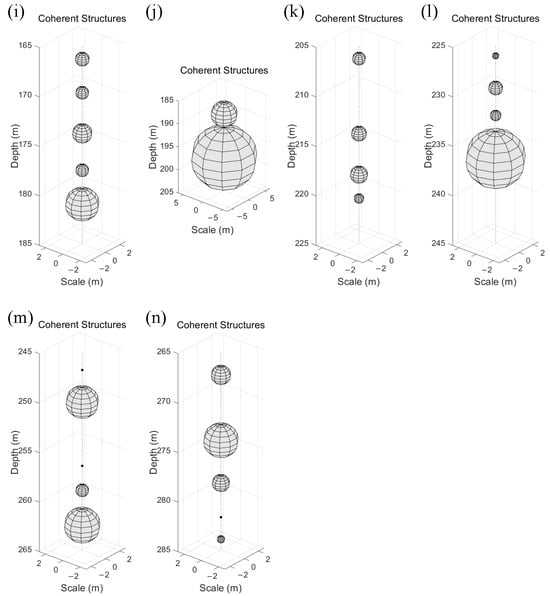
Figure 7.
Three-dimensional visualization of coherent structures. Their vertical length scale is defined as the length of continuous highly correlated regions in graphic trapezoids. Their horizontal length scale is ideally assumed to be equal to the vertical length scale. (a) Three-dimensional framework between 5 m and 25 m. (b) Three-dimensional framework between 25 m and 45 m. (c) Three-dimensional framework between 45 m and 65 m. (d) Three-dimensional framework between 65 m and 85 m. (e) Three-dimensional framework between 85 m and 105 m. (f) Three-dimensional framework between 105 m and 125 m. (g) Three-dimensional framework between 125 m and 145 m. (h) Three-dimensional framework between 145 m and 165 m. (i) Three-dimensional framework between 165 m and 185 m. (j) Three-dimensional framework between 185 m and 205 m. (k) Three-dimensional framework between 205 m and 225 m. (l) Three-dimensional framework between 225 m and 245 m. (m) Three-dimensional framework between 245 m and 265 m. (n) Three-dimensional framework between 265 m and 285 m.
For detailed illustration, structures with a vertical length scale below 0.1 m are ignored. Above 50 m, most of the small-scale coherent structures are detected, with an average length scale of 0.47 m (Figure 7a,b). Only two relatively large coherent structures are found at depths of 32 m and 34.9 m, with vertical length scales of 0.8 m. On the contrary, most large-scale coherent structures are found below the depth of 50 m. Figure 7c shows two apparent large-scale coherent structures. The upper one is located at a depth of 54.3 m, with a vertical scale of 4.5 m. The lower one covers a depth range from 59.4 m to 64.3 m, with a vertical scale of 4.9 m. Figure 7i shows several large-scale coherent structures with vertical scales of 1.3 m, 1.2 m, 1.8 m, 1.2 m, and 3.1 m, respectively. Similarly, two large-scale coherent structures are observed in Figure 7j. The upper one is located at a depth of 188.3 m, with a length scale of 5.2 m. Meanwhile, the lower one is located from 191.3 m to 204.3 m, with the largest vertical scale of 13 m.
According to the three-dimensional visualization (Figure 7) and the dissipation rate profile (Figure 3d), we can see that there are few large-scale coherent structures in the strong mixing depth range. However, as the intensity of turbulent mixing decreases and the water column becomes relatively stable, coherent structures appear, some of which have particularly large-scale structures. Thus, large-scale coherent structures with dominating turbulence energy (Figure 5) maintain the skeleton of flow [10], and small-scale coherent structures are responsible for turbulence energy dissipation [12].
Except for the most energetic peaks at 0.5 Hz, other weaker energy peaks are observed at 1.8 Hz, 7.4 Hz, and 68 Hz (Figure 8). Characteristic fluctuations at these frequencies are extracted to evaluate spatial correlations. For a detailed presentation, Figure 9 shows the correlation results in a refined depth range between 175 m and 185 m. The three-dimensional frameworks are constructed in Figure 10. As can be seen from these trapezoids, the size of coherent structures decreases sharply with frequency. There are two significant events in the 0.5 Hz trapezoids (Figure 10a), with the dominant structure at 181 m having a maximum vertical length scale of 3.1 m and the weaker event at 177.5 m having a length scale of 1.3 m. Ten significant high correlation regions are extracted in 1.8 Hz trapezoids (Figure 9b), one of which is <0.1 m. The length scale for these nine effective structures is smaller than that in 0.5 Hz detection, with an average vertical length scale of 0.7 m. Meanwhile, the most significant event is detected at 182.9 m, with a length scale of 0.9 m. There are 13 high correlation regions in minimum sliding window detection at 7.4 Hz (Figure 9c). Coherent structures extracted at 7.4 Hz are extremely tiny, four being <0.1 m length scale, with the most powerful at 177.7 m and 180.9 m having vertical length scales of 0.4 m. Meanwhile, the average vertical length scale for these nine tiny events in Figure 10c is nearly 0.2 m. Furthermore, almost no apparent correlation region can be found in the 68 Hz graphic trapezoid (Figure 9d), and the most significant structure here is still smaller than 0.1 m (Figure 10d). Compared to coherent structures extracted from the characteristic fluctuation at 0.5 Hz, detection results obtained at slightly higher frequencies (1.8 Hz or 7.4 Hz) are much denser and smaller, indicating simultaneous multi-scale coherent structures at the same depth range (Figure 11). Furthermore, these shear data at 68 Hz are considered noisy fluctuations and chaotic disturbances in fluid flow.
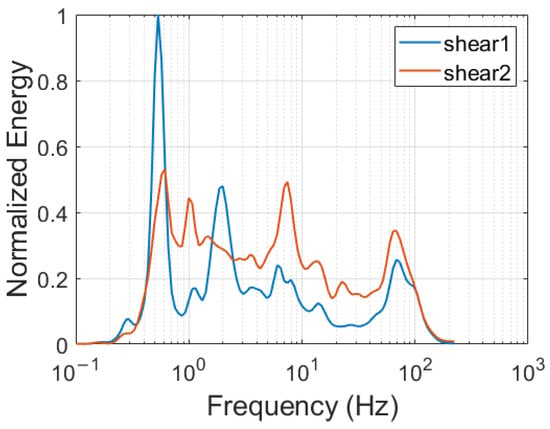
Figure 8.
The normalized wavelet energy variation.
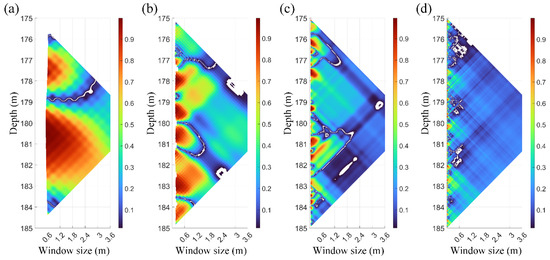
Figure 9.
Spatial correlation results between 175 m and 185 m. (a) Fluctuations at 0.5 Hz. (b) Fluctuations at 1.8 Hz. (c) Fluctuations at 7.4 Hz. (d) Fluctuations at 68 Hz.
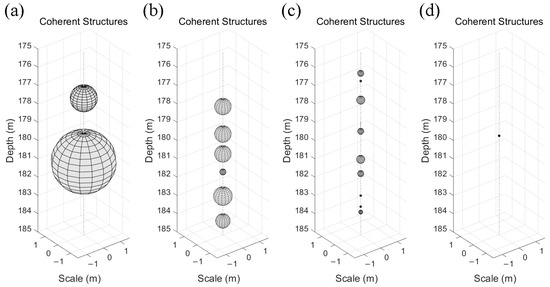
Figure 10.
The three-dimensional framework at different frequencies. (a) Structures obtained at 0.5 Hz. (b) Structures obtained at 1.8 Hz. (c) Structures obtained at 7.4 Hz. (d) Structures obtained at 68 Hz.
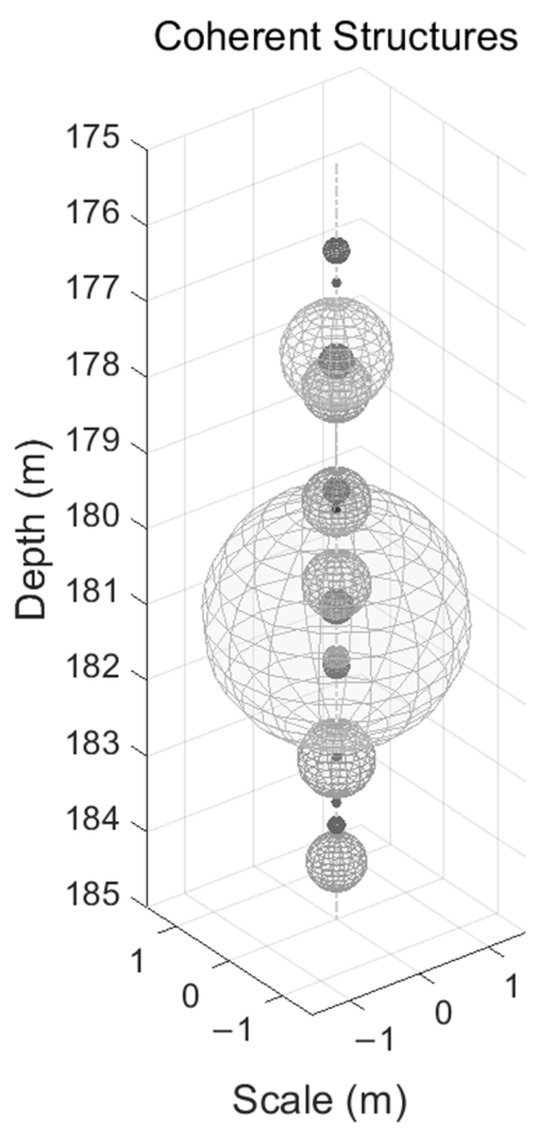
Figure 11.
The simultaneous multi-scale pattern of coherent structure. Spheroids of different sizes represent coherent structures of various spatial scales. The overlapping distribution of spheroids indicates that multi-scale coherent structures coexist simultaneously in the water column.
In addition to the length scale, the fluctuation frequency indicates the speed of motion and the time scale. Large structures at lower frequencies change slowly and stay longer [1]. Meanwhile, small events at higher frequencies have a faster time scale [58] and dissipate more intensely. Thus, large coherent structures in Figure 10a preserve more energy (Figure 5) and stay longer than smaller ones in Figure 10b,c. In addition, structures in Figure 10c have very little energy and would dissipate instantly. It indicates a simultaneous multi-scale pattern of coherent structures in the fluid field (Figure 11). Meanwhile, multiple time-scale coherent structures occur according to the peaks at different frequencies, covering both energetic, inertial, and dispersive ranges.
The wavelet cross-correlation method introduced in the study by Li [59] is applied to the same dataset and examines the validity of the proposed model. Figure 12 indicates that the coherent structures of 0.5 Hz, 1.8 Hz, and 7.4 Hz pass through the shear probes because the local core fluctuation has unusually large positive and negative peaks when an organized eddy moves close to the center line [60]. Multi-scale periodic oscillations in wavelet cross-correlation spectrum support the identification results and the simultaneous multi-scale pattern of coherent structures. Moreover, the spatial configuration and length scale characteristics of coherent structures can be investigated in a three-dimensional framework, but it cannot be obtained in Figure 12, which proves the validity and the advantage of the identification model in this paper.
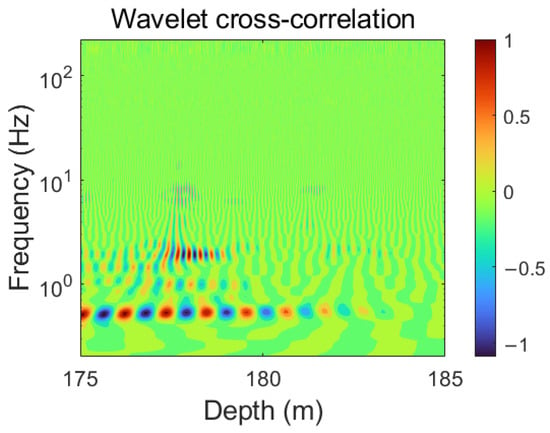
Figure 12.
Wavelet cross-correlation analysis.
4. Conclusions
In this paper, we introduced a spatial correlation identification model for coherent structures based on the wavelet transform and TDIC method. Our method is based on two shear signals measured by a pair of orthogonal probes. Characteristic fluctuations with energetic peaks are extracted to evaluate the spatial correlation. According to these correlation results, we detect coherent structures in the practical fluid column and construct a three-dimensional framework for coherent structure visualization. Based on identification results, the spatial configuration and scale characteristics are found to be associated with the dissipation rate variation. Large-scale structures are concentrated in the stable column, but most structures with smaller size are found in chaotic depths where turbulence mixing is very intensive. Furthermore, the visualization framework also suggests the coexistence of multi-scale structures in the same region and a simultaneous multi-scale coherent structure pattern, which improves the physical understanding of turbulence microstructure. Our results show that the three-dimensional coherent framework is an effective approach to extracting coherent structures, and it provides a potential way for spatial characteristic investigation.
Although our study detects multi-scale coherent structures in the fluid flow and investigates their spatial configuration and scale properties, there are still some limitations we need to improve in future research. The wavelet energy is determined according to the sum amplitude of the wavelet coefficients at the selected depth segment. Relatively weak structures may be ignored due to the strong coherent event at the same depth segment. To circumvent this limitation, we examine the wavelet spectrum at the whole depth, detect the scale and location information of each energetic block, and finally determine the applicable length of the depth segment, which is not suitable for extensive dataset analysis and needs to be optimized in future research. Meanwhile, for three-dimensional visualization, the horizontal length scale of a coherent structure is ideally defined as the vertical length scale. In the practical column, the horizontal length scale is variable in different column depths and marine areas. Therefore, multiple points are needed to complete the horizontal spatial information of coherent structures and provide thorough data for structure extraction.
Author Contributions
Conceptualization, methodology, software, validation, formal analysis, investigation, resources, writing—original draft preparation, writing—review and editing, and visualization, B.M.; supervision, project administration, funding acquisition, and methodology, H.Y.; formal analysis, F.S.; resources and visualization, Y.Z.; resources and visualization, X.Z. All authors have read and agreed to the published version of the manuscript.
Funding
This work was supported by the National Natural Science Foundation of China [Grant numbers 61871354 and 6172780176].
Institutional Review Board Statement
Not applicable.
Informed Consent Statement
Not applicable.
Data Availability Statement
Data available upon request due to restrictions. The data presented in this study are available upon request from the corresponding author. The data are not publicly available due to data security management regulations of the Ocean University of China.
Conflicts of Interest
The authors declare no conflicts of interest.
References
- Nguyen, D.B.; Wu, P.R.; Monico, R.O.; Chen, G.N. Dynamic mode decomposition for large-scale coherent structure extraction in shear flows. IEEE Trans. Vis. Comput. Graph. 2023, 29, 1531–1544. [Google Scholar] [CrossRef] [PubMed]
- Cheng, Z.Y.; Koken, M.; Constantinescu, G. Approximate methodology to account for effects of coherent structures on sediment entrainment in rans simulations with a movable bed and applications to pier scour. Adv. Water Resour. 2018, 120, 65–82. [Google Scholar] [CrossRef]
- Nolan, P.J.; Foroutan, H.; Ross, S.D. Pollution transport patterns obtained through generalized lagrangian coherent structures. Atmosphere 2020, 11, 168. [Google Scholar] [CrossRef]
- Sandeepan, B.S.; Rakesh, P.T.; Venkatesan, R. Observation and simulation of boundary layer coherent roll structures and their effect on pollution dispersion. Atmos. Res. 2013, 120, 181–191. [Google Scholar] [CrossRef]
- Shi, Y.; Zeng, Q.C.; Liu, L.; Cheng, X.L.; Hu, F. Important role of turbulent wind gust and its coherent structure in the rapid removal of urban air pollution. Environ. Res. Commun. 2022, 4, 075001. [Google Scholar] [CrossRef]
- Talke, S.A.; Horner-Devine, A.R.; Chickadel, C.C.; Jessup, A.T. Turbulent kinetic energy and coherent structures in a tidal river. J. Geophys. Res.-Ocean. 2013, 118, 6965–6981. [Google Scholar] [CrossRef]
- Farooq, S.; Huarte-Espinosa, M.; Ostilla-Mónico, R. Large-scale structures in high-Reynolds-number rotating Waleffe flow. J. Fluid Mech. 2020, 884, A26. [Google Scholar] [CrossRef]
- Li, X.; Hu, F.; Pu, Y.F.; Al-Jiboori, M.H.; Hu, Z.X.; Hong, Z.X. Identification of coherent structures of turbulence at the atmospheric surface layer. Adv. Atmos. Sci. 2002, 19, 687–698. [Google Scholar]
- Peacock, T.; Haller, G. Lagrangian coherent structures the hidden skeleton of fluid flows. Phys. Today 2013, 66, 41–47. [Google Scholar] [CrossRef]
- Saddoughi, S.G.; Veeravalli, S.V. Local isotropy in turbulent boundary layers at high Reynolds number. J. Fluid Mech. 2006, 348, 201–245. [Google Scholar] [CrossRef]
- Khurshid, S.; Donzis, D.A.; Sreenivasan, K.R. Slow spectral transfer and energy cascades in isotropic turbulence. J. Fluid Mech. 2021, 908, A21. [Google Scholar] [CrossRef]
- Siddiqui, M.; Loewen, M.R.; Asher, W.E.; Jessup, A.T. Coherent structures beneath wind waves and their influence on air-water gas transfer. J. Geophys. Res. Ocean. 2004, 109, C03024. [Google Scholar] [CrossRef]
- Gurka, R.; Liberzon, A.; Hetsroni, G. Pod of vorticity fields: A method for spatial characterization of coherent structures. Int. J. Heat Fluid Flow 2006, 27, 416–423. [Google Scholar] [CrossRef]
- Li, D.D.; Zhao, B.D.; Wang, J.W. Data-driven identification of coherent structures in gas-solid system using proper orthogonal decomposition and dynamic mode decomposition. Phys. Fluids 2023, 35, 013321. [Google Scholar] [CrossRef]
- Yin, S.; Fan, Y.F.; Sandberg, M.; Li, Y.G. PIV based POD analysis of coherent structures in flow patterns generated by triple interacting buoyant plumes. Build. Environ. 2019, 158, 165–181. [Google Scholar] [CrossRef]
- Bulusu, K.V.; Plesniak, M.W. Shannon entropy-based wavelet transform method for autonomous coherent structure identification in fluid flow field data. Entropy 2015, 17, 6617–6642. [Google Scholar] [CrossRef]
- Gong, X.; Ma, X.Y.; Fan, Z.Y.; Zhang, X.; Jiang, N. Wavelet analysis of the coherent structures in airfoil leading-edge separation control by bionic coverts. Proc. Inst. Mech. Eng. Part C-J. Eng. Mech. Eng. Sci. 2023, 237, 2076–2089. [Google Scholar] [CrossRef]
- Lucia, C.; Gassmann, M.I. Wavelet analysis of coherent structures above maize and soybean crops. Bound.-Layer Meteor. 2022, 184, 231–249. [Google Scholar]
- Lotfy, E.R.; Zaki, S.A.; Harun, Z. Modulation of the atmospheric turbulence coherent structures by mesoscale motions. J. Braz. Soc. Mech. Sci. Eng. 2018, 40, 178. [Google Scholar] [CrossRef]
- Ostilla-Mónico, R.; Verzicco, R.; Grossmann, S.; Lohse, D. The near-wall region of highly turbulent Taylor-Couette flow. J. Fluid Mech. 2016, 788, 95–117. [Google Scholar] [CrossRef]
- Hunt, J.C.R.; Wray, A.A.; Moin, P. Eddies, streams, and convergence zones in turbulent flows. In Studying Turbulence Using Numerical Simulation Databases, 2; NASA: Washington, DC, USA, 1988. [Google Scholar]
- Perry, A.E.; Chong, M.S. A description of eddying motions and flow patterns using critical-point concepts. Ann. Rev. Fluid Mech. 2003, 19, 125–155. [Google Scholar] [CrossRef]
- Haller, G. Lagrangian Coherent Structures. Annu. Rev. Fluid Mech. 2015, 47, 137–162. [Google Scholar] [CrossRef]
- Martins, F.; Sciacchitano, A.; Rival, D.E. Detection of vortical structures in sparse Lagrangian data using coherent-structure colouring. Exp. Fluids 2021, 62, 69. [Google Scholar] [CrossRef]
- Schlueter-Kuck, K.L.; Dabiri, J.O. Coherent structure colouring: Identification of coherent structures from sparse data using graph theory. J. Fluid Mech. 2017, 811, 468–486. [Google Scholar] [CrossRef]
- Acevedo, O.C.; Costa, F.D.; Oliveira, P.; Puhales, F.S.; Degrazia, G.A.; Roberti, D.R. The influence of submeso processes on stable boundary layer similarity relationships. J. Atmos. Sci. 2014, 71, 207–225. [Google Scholar] [CrossRef]
- Basu, S.; Porte-Agel, F.; Foufoula-Georgiou, E.; Vinuesa, J.F.; Pahlow, M. Revisiting the local scaling hypothesis in stably stratified atmospheric boundary-layer turbulence: An integration of field and laboratory measurements with large-eddy simulations. Bound.-Layer Meteor. 2006, 119, 473–500. [Google Scholar] [CrossRef]
- Conangla, L.; Cuxart, J.; Soler, M.R. Characterisation of the nocturnal boundary layer at a site in northern Spain. Bound.-Layer Meteor. 2008, 128, 255–276. [Google Scholar] [CrossRef]
- Diabil, H.A.; Li, X.K.; Abdalla, I.E. Numerical study of a separated boundary layer transition over two and three dimensional geometrical shapes. World Sci. Eng. Acad. Soc. 2017, 16, 45–72. [Google Scholar]
- Jeong, J.; Hussain, F. On the identification of a vortex. J. Fluid Mech. Digit. Arch. 1995, 285, 69–94. [Google Scholar] [CrossRef]
- Jiang, X.Y. Revisiting coherent structures in low-speed turbulent boundary layers. Appl. Math. Mech.-Engl. Ed. 2019, 40, 261–272. [Google Scholar] [CrossRef]
- Zhou, J.; Adrian, R.J.; Balachandar, S.; Kendall, T.M. Mechanisms for generating coherent packets of hairpin vortices in channel flow. J. Fluid Mech. 1999, 387, 353–396. [Google Scholar] [CrossRef]
- Hu, H.B.; Du, P.; Huang, S.H.; Wang, Y. Extraction and verification of coherent structures in near-wall turbulence. Chin. Phys. B 2013, 22, 74703. [Google Scholar] [CrossRef]
- Wu, J.Y.; Nichols, A.; Krynkin, A.; Croft, M. Objective phase-space identification of coherent turbulent structures in 1d time series data. J. Hydraul. Res. 2022, 60, 811–825. [Google Scholar] [CrossRef]
- Zheng, D.; Zhang, T.; Xing, J.; Mei, J.Q. Improvement of the HHT method and application in weak vortex signal detection. Meas. Sci. Technol. 2007, 18, 2769–2776. [Google Scholar] [CrossRef]
- Abraham, A.; Hong, J.R. Characterization of atmospheric coherent structures and their impact on a utility-scale wind turbine. Flow 2022, 2, E5. [Google Scholar] [CrossRef]
- Alekseenko, S.V.; Abdurakipov, S.S.; Hrebtov, M.Y.; Tokarev, M.P.; Dulin, V.M.; Markovich, D.M. Coherent structures in the near-field of swirling turbulent jets: A tomographic PIV study. Int. J. Heat Fluid Flow 2018, 70, 363–379. [Google Scholar] [CrossRef]
- Sun, J.; Gao, T.D.; Fan, Y.; Chen, W.Y.; Xuan, R.X. The modulation of particles on coherent structure of turbulent boundary layer in dilute liquid-solid two-phase flow with PIV. Powder Technol. 2019, 344, 883–896. [Google Scholar] [CrossRef]
- Tang, Z.Q.; Jiang, N.; Schröder, A.; Geisler, R. Tomographic PIV investigation of coherent structures in a turbulent boundary layer flow. Acta Mech. Sin. 2012, 28, 572–582. [Google Scholar] [CrossRef]
- Liu, C.Q.; Wang, Y.Q.; Yang, Y.; Duan, Z.W. New omega vortex identification method. Sci. China-Phys. Mech. Astron. 2016, 59, 684711. [Google Scholar] [CrossRef]
- Sakurai, T.; Yoshimatsu, K.; Schneider, K.; Farge, M.; Morishita, K.; Ishihara, T. Coherent structure extraction in turbulent channel flow using boundary adapted wavelets. J. Turbul. 2017, 18, 352–372. [Google Scholar] [CrossRef]
- Bolado-Penagos, M.; Sala, I.; Gomiz-Pascual, J.J.; González, C.J.; Izquierdo, A.; Alvarez, O.; Vázquez, A.; Bruno, M.; van Haren, H. Analysis of internal soliton signals and their eastward propagation in the Alboran sea: Exploring the effect of subinertial forcing and fortnightly variability. Prog. Oceanogr. 2023, 217, 103077. [Google Scholar] [CrossRef]
- van Haren, H.; Bakker, R.; Witte, Y.; Laan, M.; van Heerwaarden, J. Half a cubic hectometer mooring array of 3000 temperature sensors in the deep sea. J. Atmos. Ocean. Technol. 2021, 38, 1585–1597. [Google Scholar] [CrossRef]
- Yang, C.F.; Chi, W.C.; van Haren, H.; Lin, C.R.; Kuo, B.Y. Tracking deep-sea internal wave propagation with a differential pressure gauge array. Sci. Rep. 2021, 11, 23311. [Google Scholar] [CrossRef]
- Bulusu, K.V.; Plesniak, M.W. Secondary flow morphologies due to model stent-induced perturbations in a 180° curved tube during systolic deceleration. Exp. Fluids 2013, 54, 1493. [Google Scholar] [CrossRef]
- Fang, R.Z.; Wang, Y.; Lan, C.X.; Zhang, Z.J.; Zheng, D.; Lan, G.D.; Wang, B.M. Detecting near-surface coherent structure characteristics using wavelet transform with different meteorological elements. J. Trop. Meteorol. 2020, 26, 453–460. [Google Scholar]
- Protzko, D.E.; Guimond, S.R.; Jackson, C.R.; Sapp, J.W.; Jelenak, Z.; Chang, P.S. Documenting coherent turbulent structures in the boundary layer of intense hurricanes through wavelet analysis on IWRAP and SAR data. IEEE Trans. Geosci. Remote Sens. 2023, 61, 4105316. [Google Scholar] [CrossRef]
- Chen, X.; Wu, Z.; Huang, N.E. The time-dependent intrinsic correlation based on the empirical mode decomposition. Adv. Adapt. Data Anal. 2010, 2, 1000047. [Google Scholar] [CrossRef]
- Johny, K.; Pai, M.L.; Adarsh, S. A multivariate EMD-LSTM model aided with time dependent intrinsic cross-correlation for monthly rainfall prediction. Appl. Soft. Comput. 2022, 123, 108941. [Google Scholar] [CrossRef]
- Luo, J.; Wang, N.A.; Zheng, Z.C.; Li, T.X.; He, S.Q.; Tarolli, P. Tillage-induced microtopography alters time-dependent intrinsic correlation of runoff and sediment yield. Soil Tillage Res. 2022, 221, 105423. [Google Scholar] [CrossRef]
- Medina, O.D.; Schmitt, F.G.; Calif, R.; Germain, G.; Gaurier, B. Turbulence analysis and multiscale correlations between synchronized flow velocity and marine turbine power production. Renew. Energy 2017, 112, 314–327. [Google Scholar] [CrossRef]
- Hadjighasem, A.; Karrasch, D.; Teramoto, H.; Haller, G. A spectral clustering approach to Lagrangian vortex detection. APS Meet. Abstr. 2015, 93, 063107. [Google Scholar] [CrossRef]
- Derian, P.; Heas, P.; Memin, E. Wavelets to reconstruct turbulence multifractals from experimental image sequences, TSFP7. In Proceedings of the 7th International Symposium on Turbulence and Shear Flow Phenomena, Ottawa, ON, Canada, 28–31 July 2011; Begel House Inc.: New York, NY, USA, 2011. [Google Scholar]
- Goodman, L.; Levine, E.R.; Lueck, R.G. On measuring the terms of the turbulent kinetic energy budget from an AUV. J. Atmos. Ocean. Technol. 2006, 23, 977–990. [Google Scholar] [CrossRef]
- Nasmyth, P.W. Oceanic Turbulence; University of British Columbia: Vancouver, BC, USA, 1970. [Google Scholar]
- Vassilicos, J.C. Dissipation in Turbulent Flows. Annu. Rev. Fluid Mech. 2015, 47, 95–114. [Google Scholar] [CrossRef]
- Wolk, F.; Yamazaki, H.; Seuront, L.; Lueck, R.G. A new free-fall profiler for measuring biophysical microstructure. J. Atmos. Ocean. Technol. 2002, 19, 780–793. [Google Scholar] [CrossRef]
- Luan, X.; Mao, B.B.; Ren, X.M.; Yang, H.; Teng, Y.R.; Song, D.L. Turbulent cascade in the multi-layered network. In Proceedings of the OCEANS 2019—Marseille, Marseille, France, 17–20 June 2019. [Google Scholar]
- Li, H. Identification of coherent structure in turbulent shear flow with wavelet correlation analysis. J. Fluids Eng.-Trans. ASME 1998, 120, 778–785. [Google Scholar] [CrossRef]
- Yule, A.J. Large-scale structure in the mixing layer of a round jet. J. Fluid Mech. 1978, 89, 413–432. [Google Scholar] [CrossRef]
Disclaimer/Publisher’s Note: The statements, opinions and data contained in all publications are solely those of the individual author(s) and contributor(s) and not of MDPI and/or the editor(s). MDPI and/or the editor(s) disclaim responsibility for any injury to people or property resulting from any ideas, methods, instructions or products referred to in the content. |
© 2024 by the authors. Licensee MDPI, Basel, Switzerland. This article is an open access article distributed under the terms and conditions of the Creative Commons Attribution (CC BY) license (https://creativecommons.org/licenses/by/4.0/).