
Development of a Key Method for the Optimization of Port Vessel Detection Based on an Improved Multi-Structural Morphology Approach

 , , and
Abstract
1. Introduction
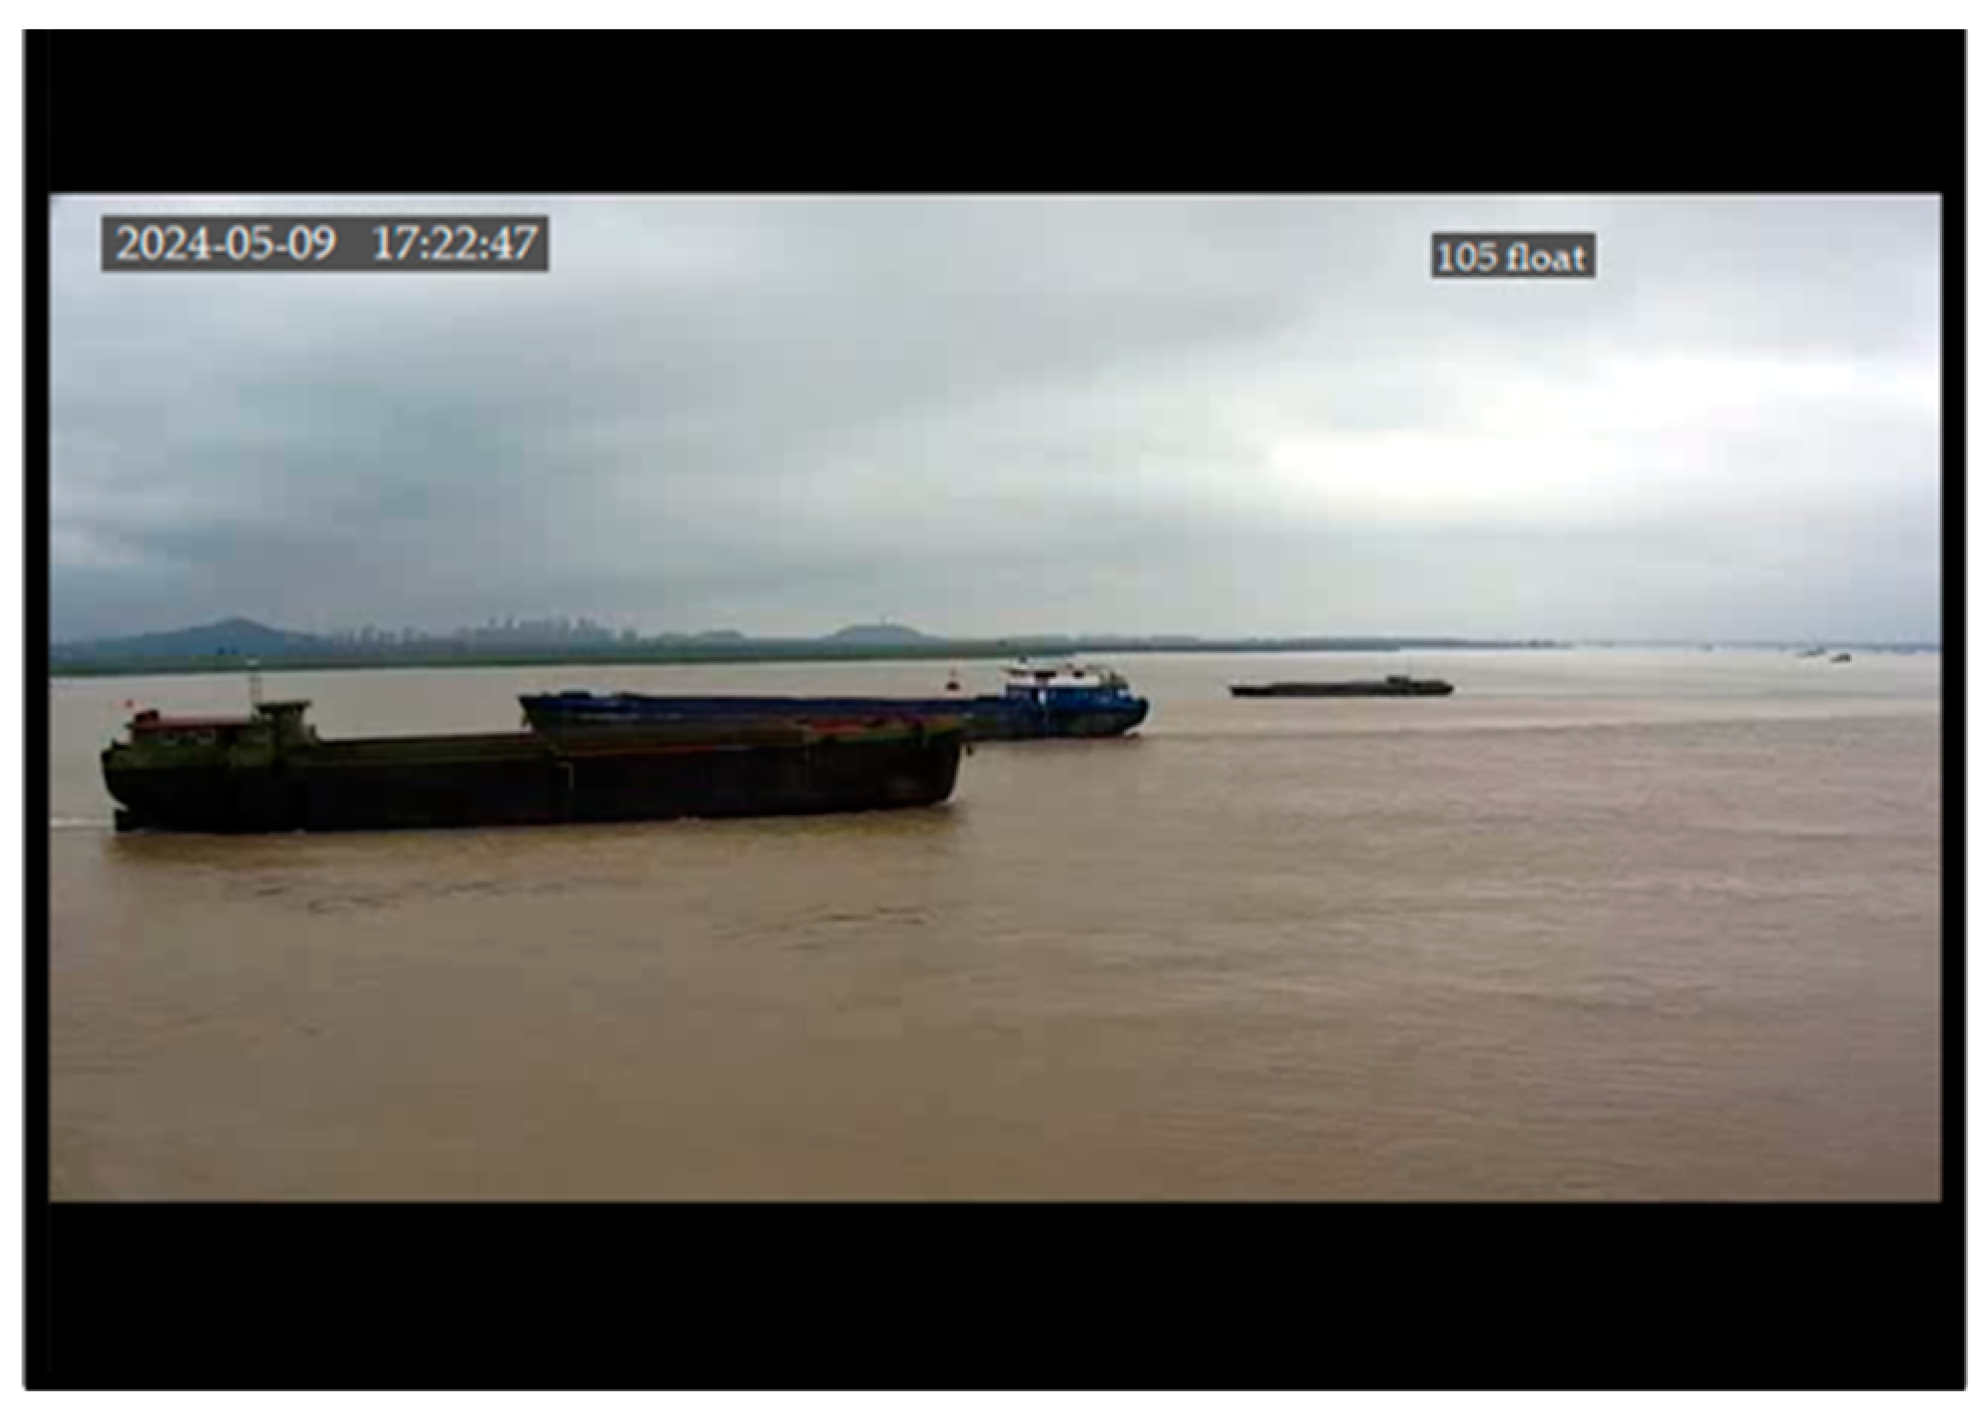
- The target vessel has low contrast: In most cases, the surveillance camera is far away from the target vessel, owing to the relatively vast sea surface. The target vessel only occupies a few pixels in the video image, and its color is relatively close to that of the sea surface background. When the visibility of the sea surface is poor, it is difficult to spot the target in the image [2].
- The noise interference is high, and the sea environment is complex: Regional changes caused by waves on the sea surface are similar to the shape and size of the target vessel, which easily leads to the false detection of vessels. Large areas of sea surface ripples are difficult to remove using common filtering methods. Changes in lighting and the movement of clouds cause background changes over large areas in port video images [3].
- The vessel moves slowly: Under long-distance observation, the position of the target vessel in an image changes slowly and the difference between two images is only a few pixels. This easily leads to the void phenomenon in the central area of the target vessel when using detection methods for moving targets [4].
- The real-time processing of video: Vessel detection methods based on surveillance videos not only ensure the accuracy of system detection but also require real-time video processing. In order to facilitate real-time observation of the test results by maritime regulators, the algorithm needs to be robust [5].
- The proposed improved multi-structural morphology approach is designed based on physics and intensive mathematical contexts that result in the accurate detection of target vessels.
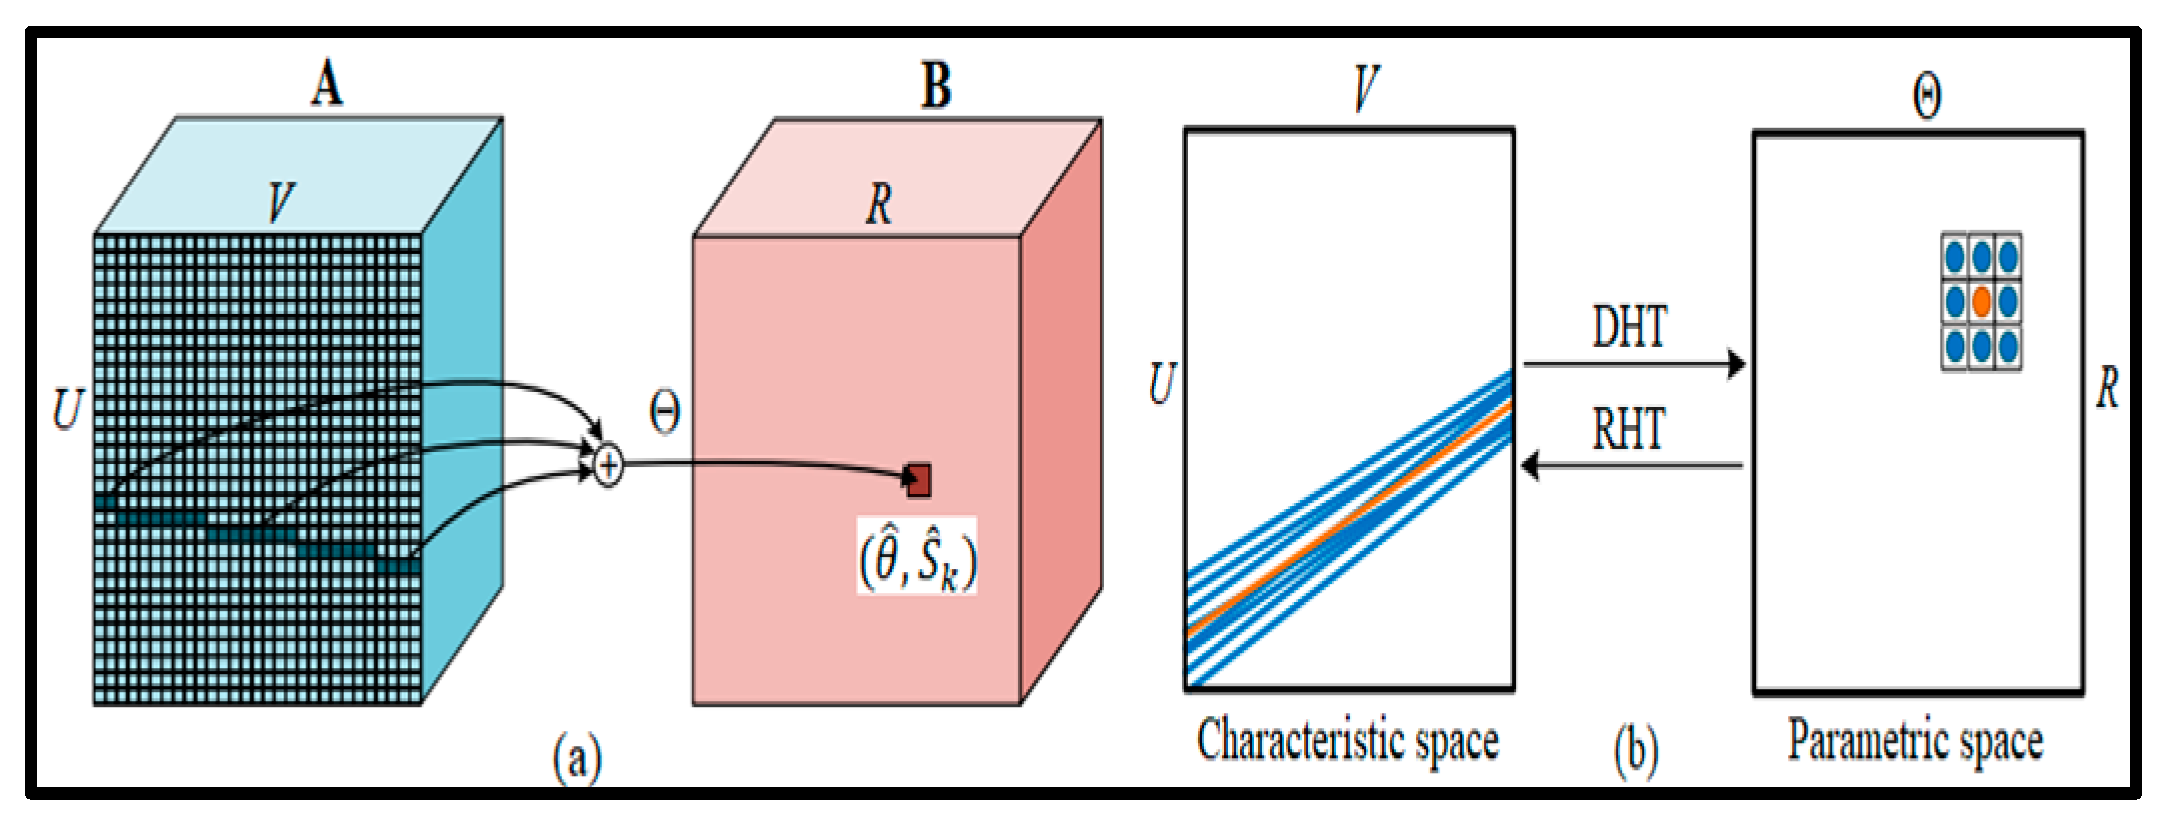
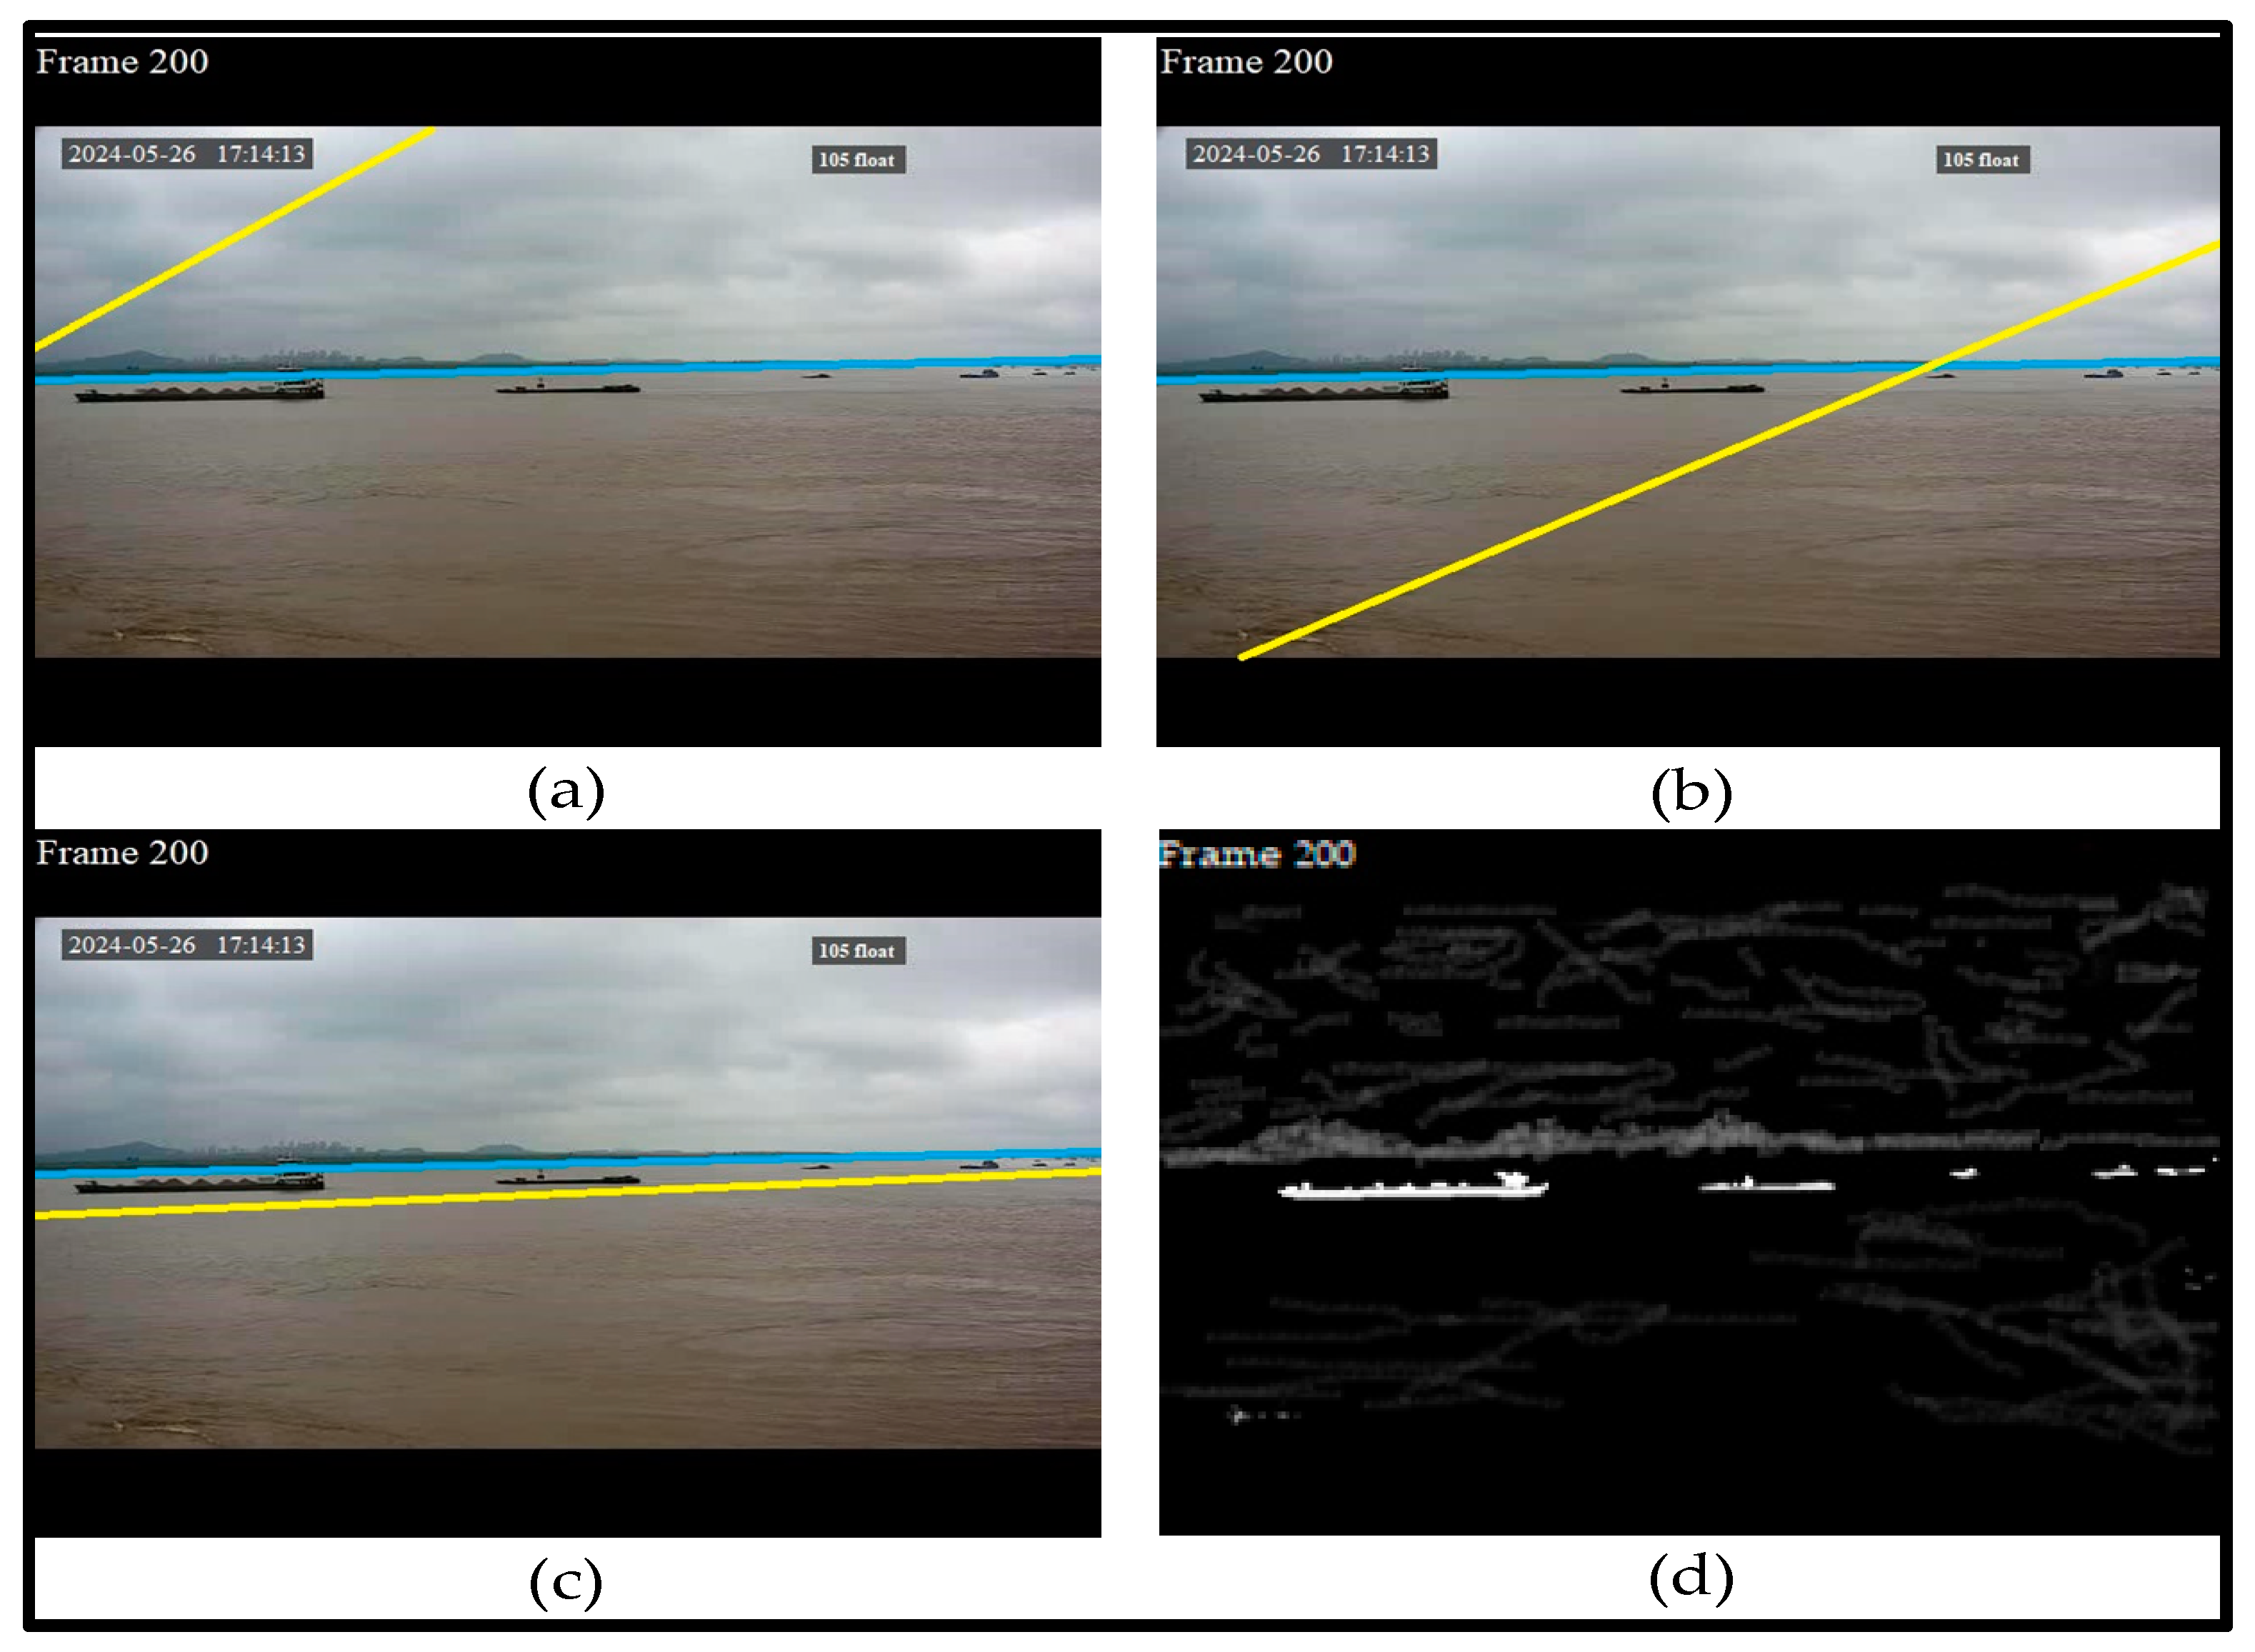
- Deep Hough transform (DHT), together with OSTU-based adaptive threshold segmentation, enables the removal of the irrelevant lines/occlusions on images and converts them into binary maps.
- The combination of weighted morphological filtering with neighborhood-based adaptive fast median filtering using the associated domain makes it possible to clearly locate and monitor vessel movements in real time.
2. Port Vessel Detection System
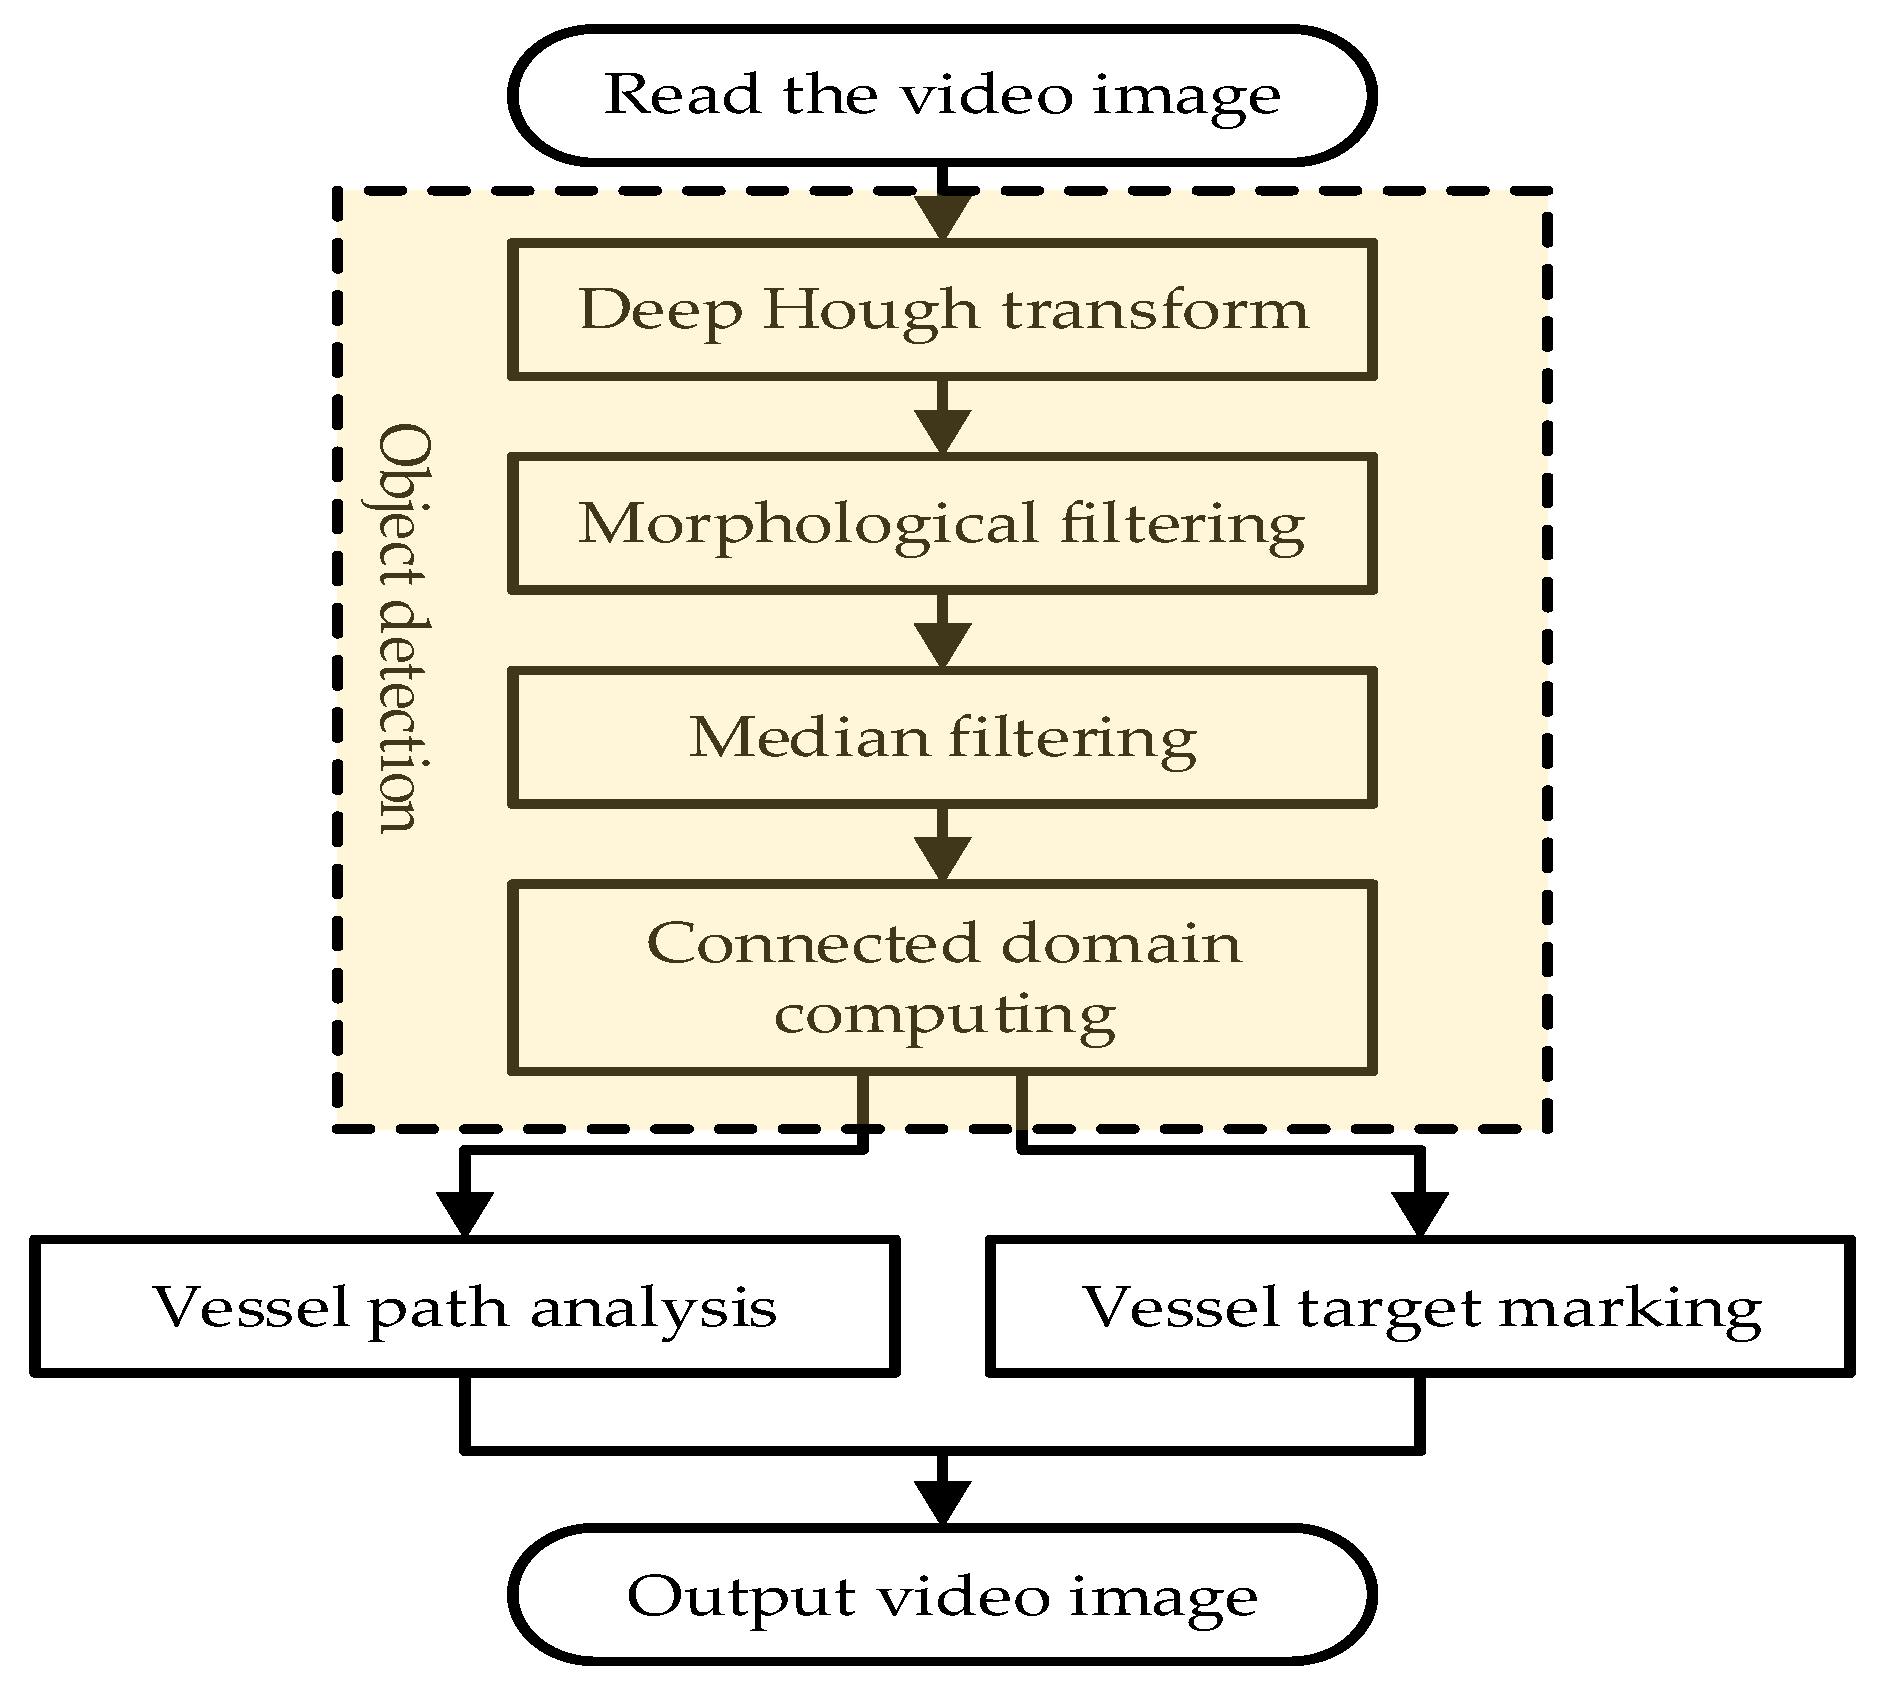
2.1. Detection Process
2.2. Tracking Path Analysis
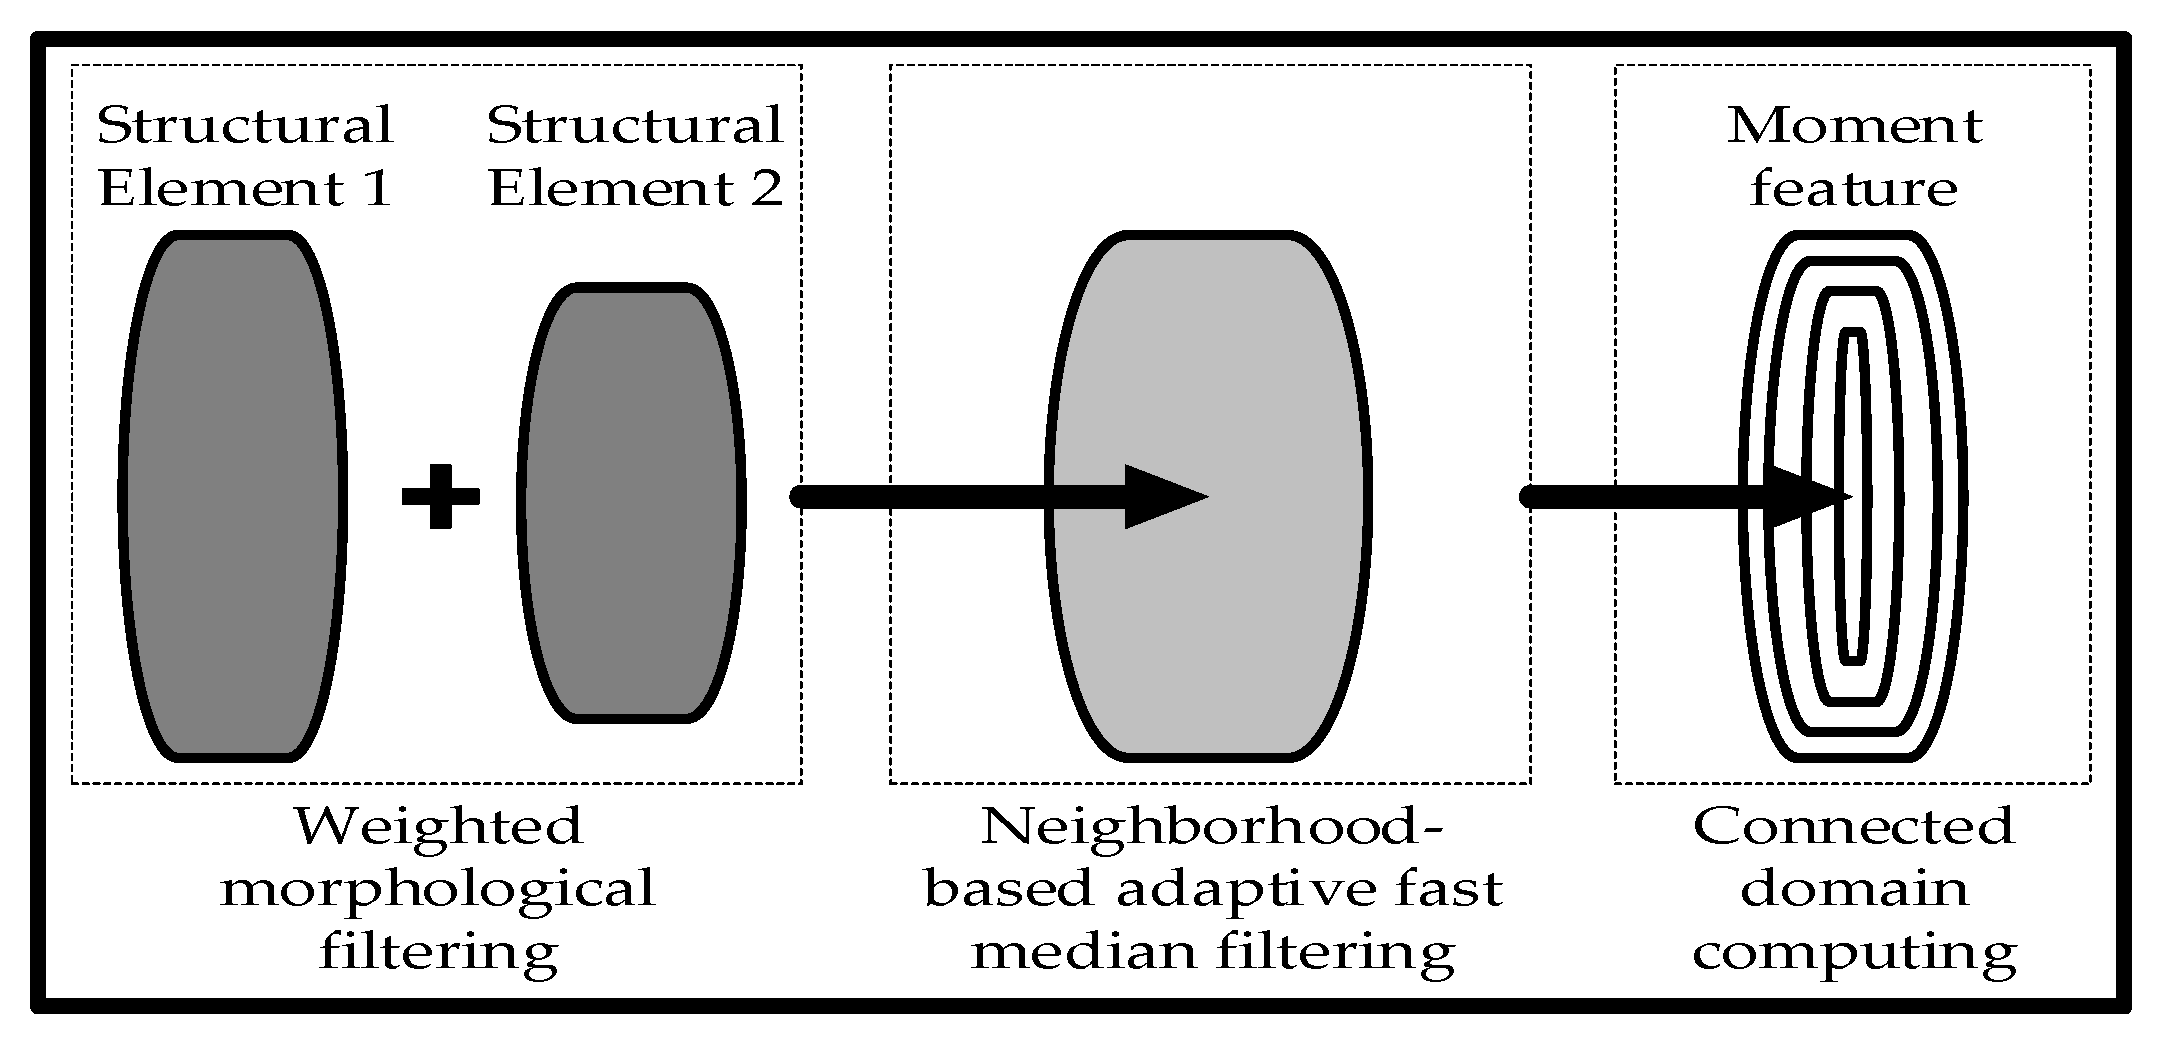
3. Design of Improved Multi-Structural Morphology Filtering Approach
3.1. Target Vessel Detection Process
3.2. Deep Hough Transform
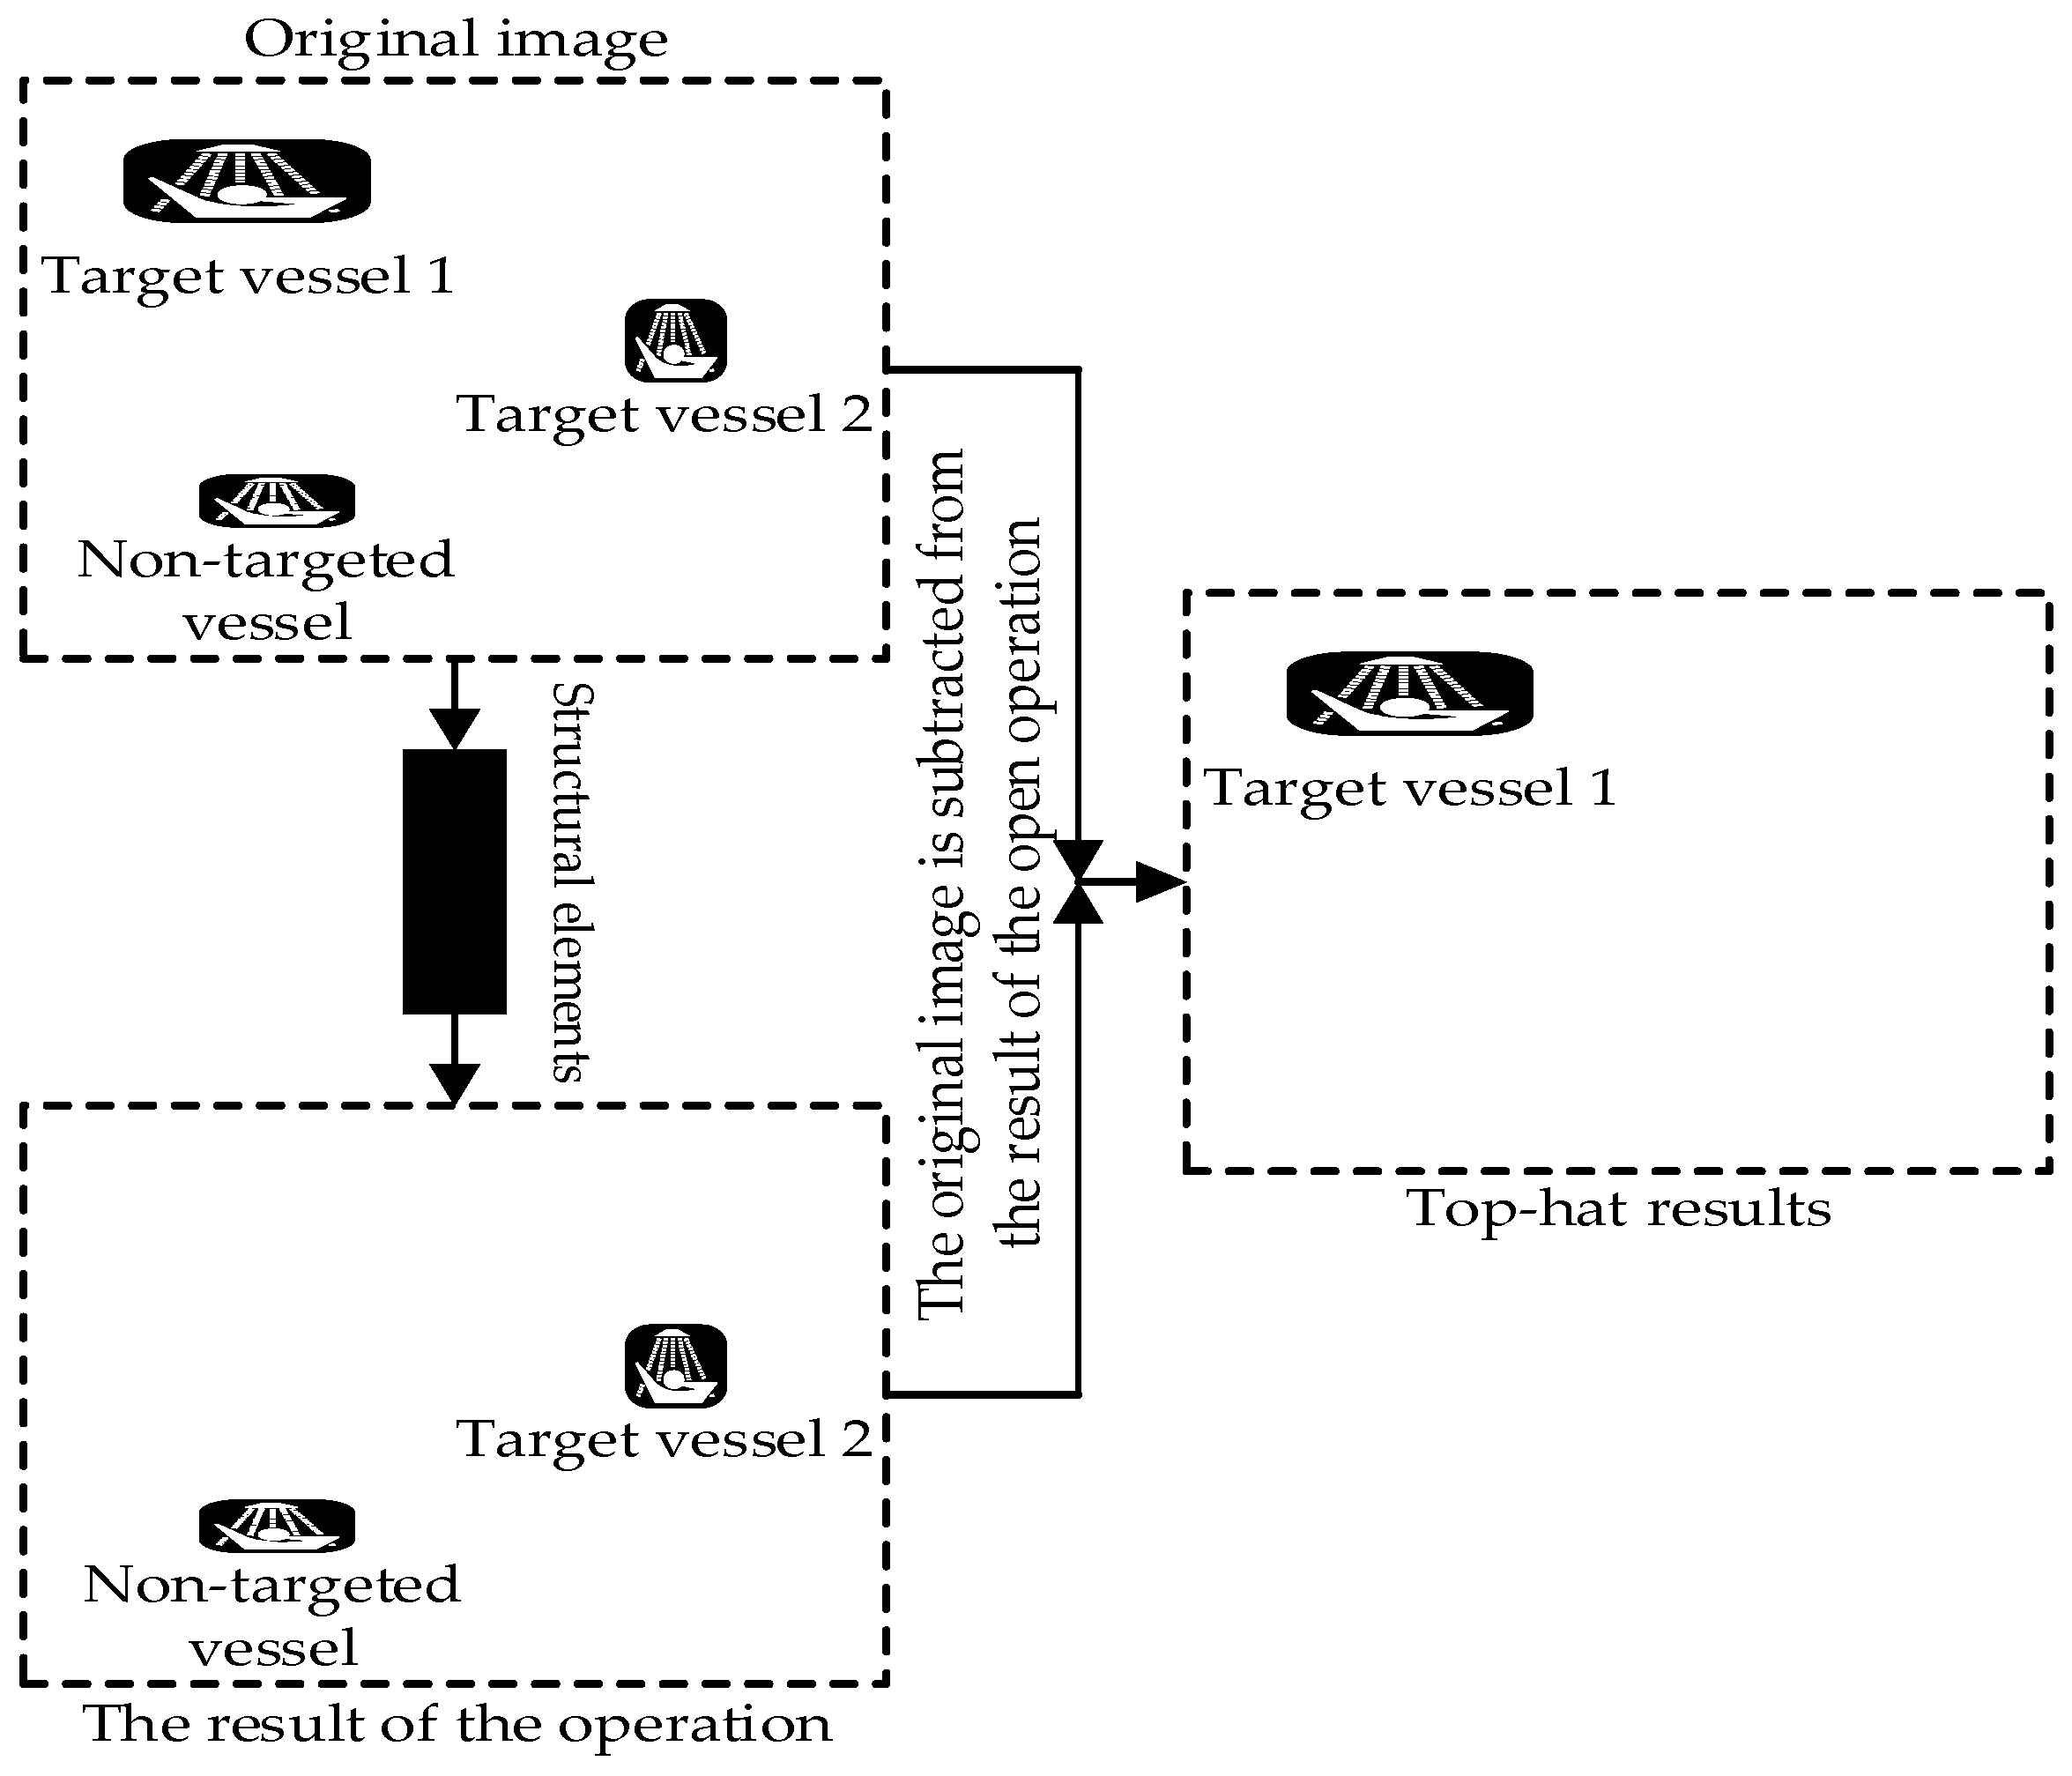
3.3. Weighted Morphological Filtering
3.4. Neighbor-Based Adaptive Fast Median Filtering
- If where T is the threshold, then jumps to step 2; otherwise, increase the window . Then, quickly sort the median values for the new window until the above conditions are met; then the output is .
- If , , then the output is ; otherwise, determine whether is true.
- If it is true, then the output is ;
- If it is not true, then the output is .
3.5. Connected Domain Calculation Based on Moment Features
4. Engineering Application Case
4.1. Simulation Environment and Data Acquisition
4.2. Program Verification
4.2.1. First Step
4.2.2. Second Step
4.2.3. Third Step
4.2.4. Fourth Step
4.2.5. Fifth Step
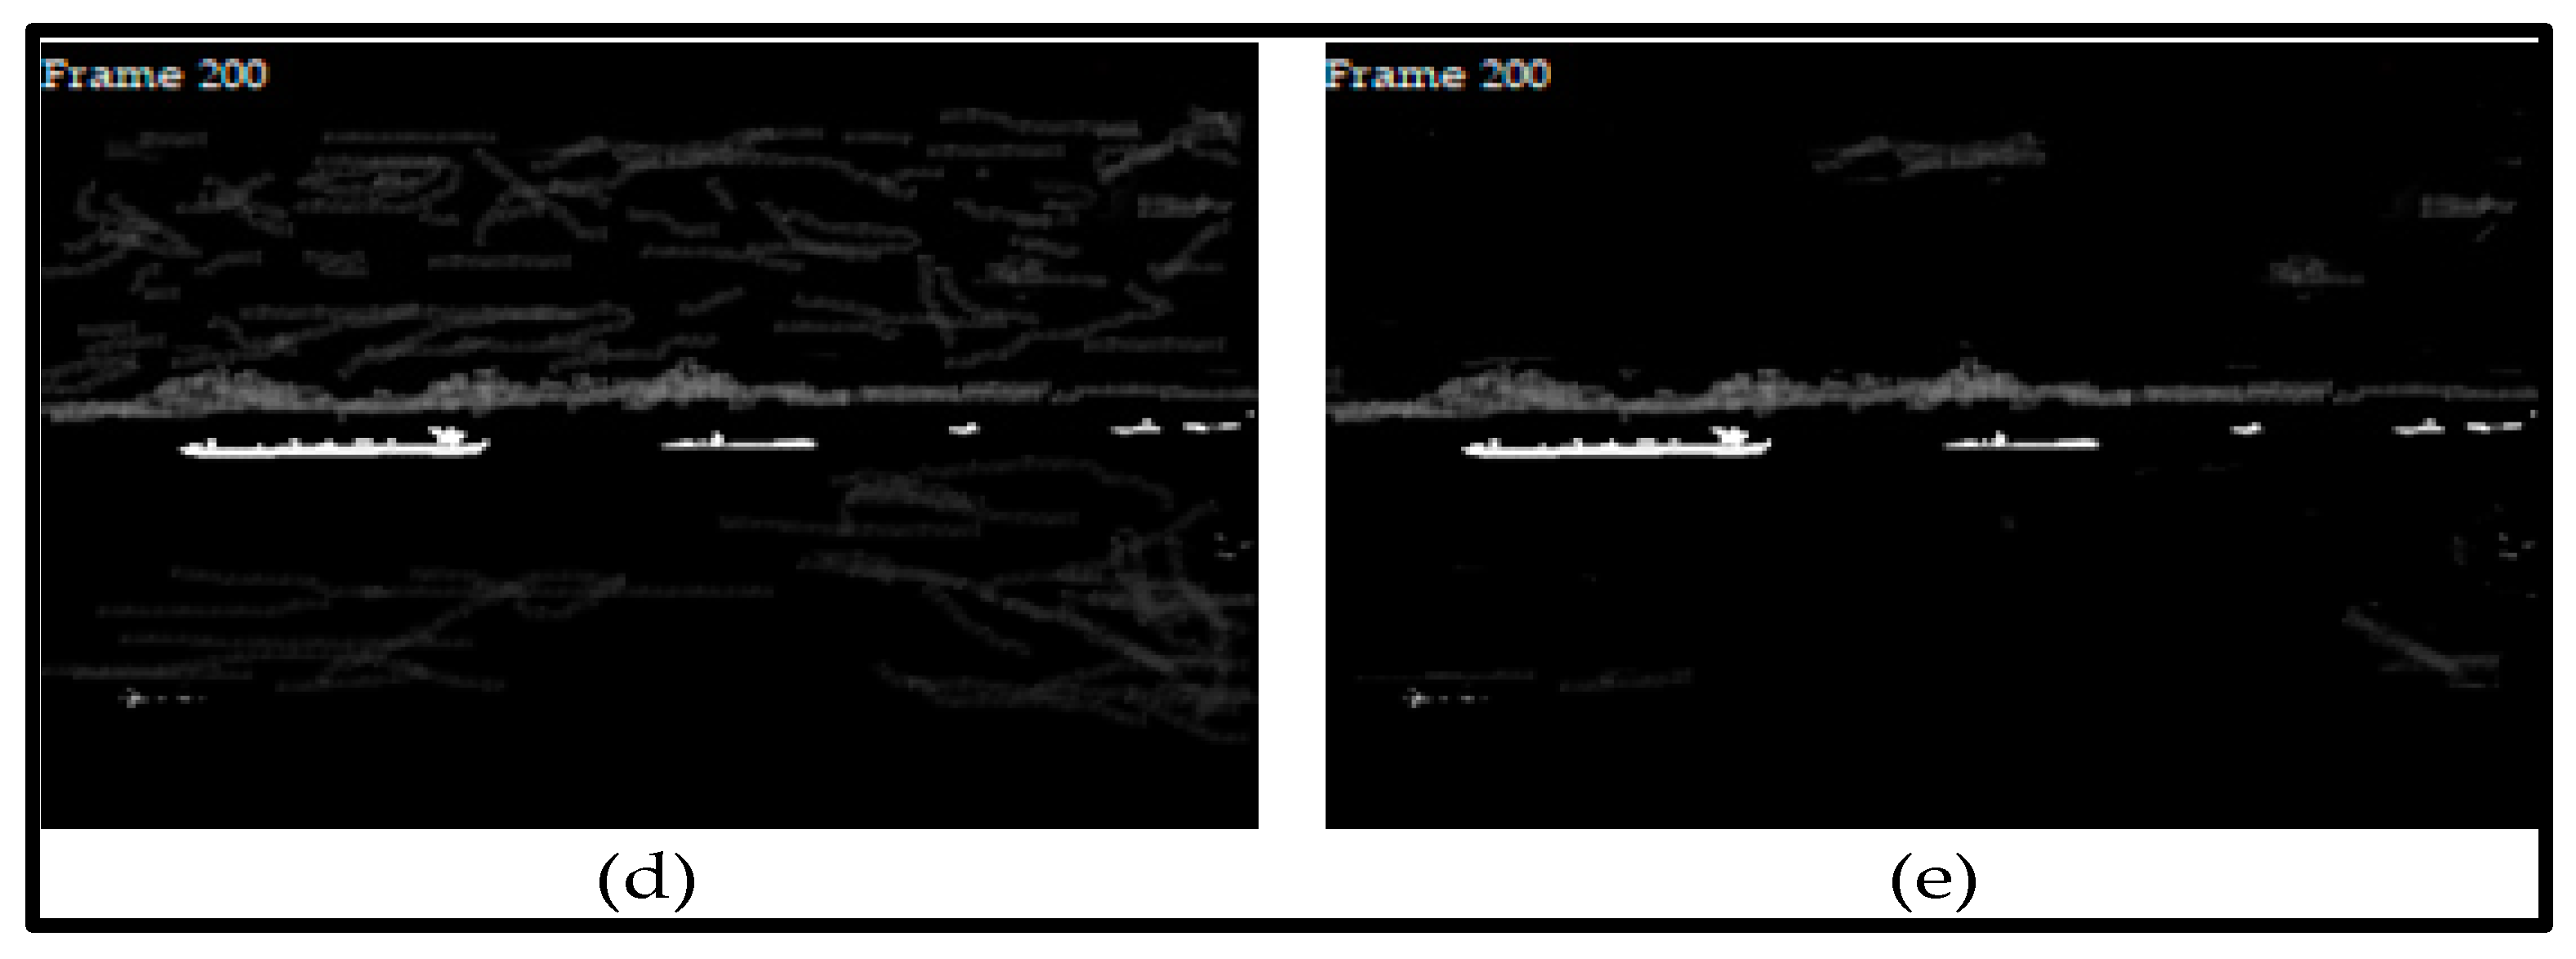
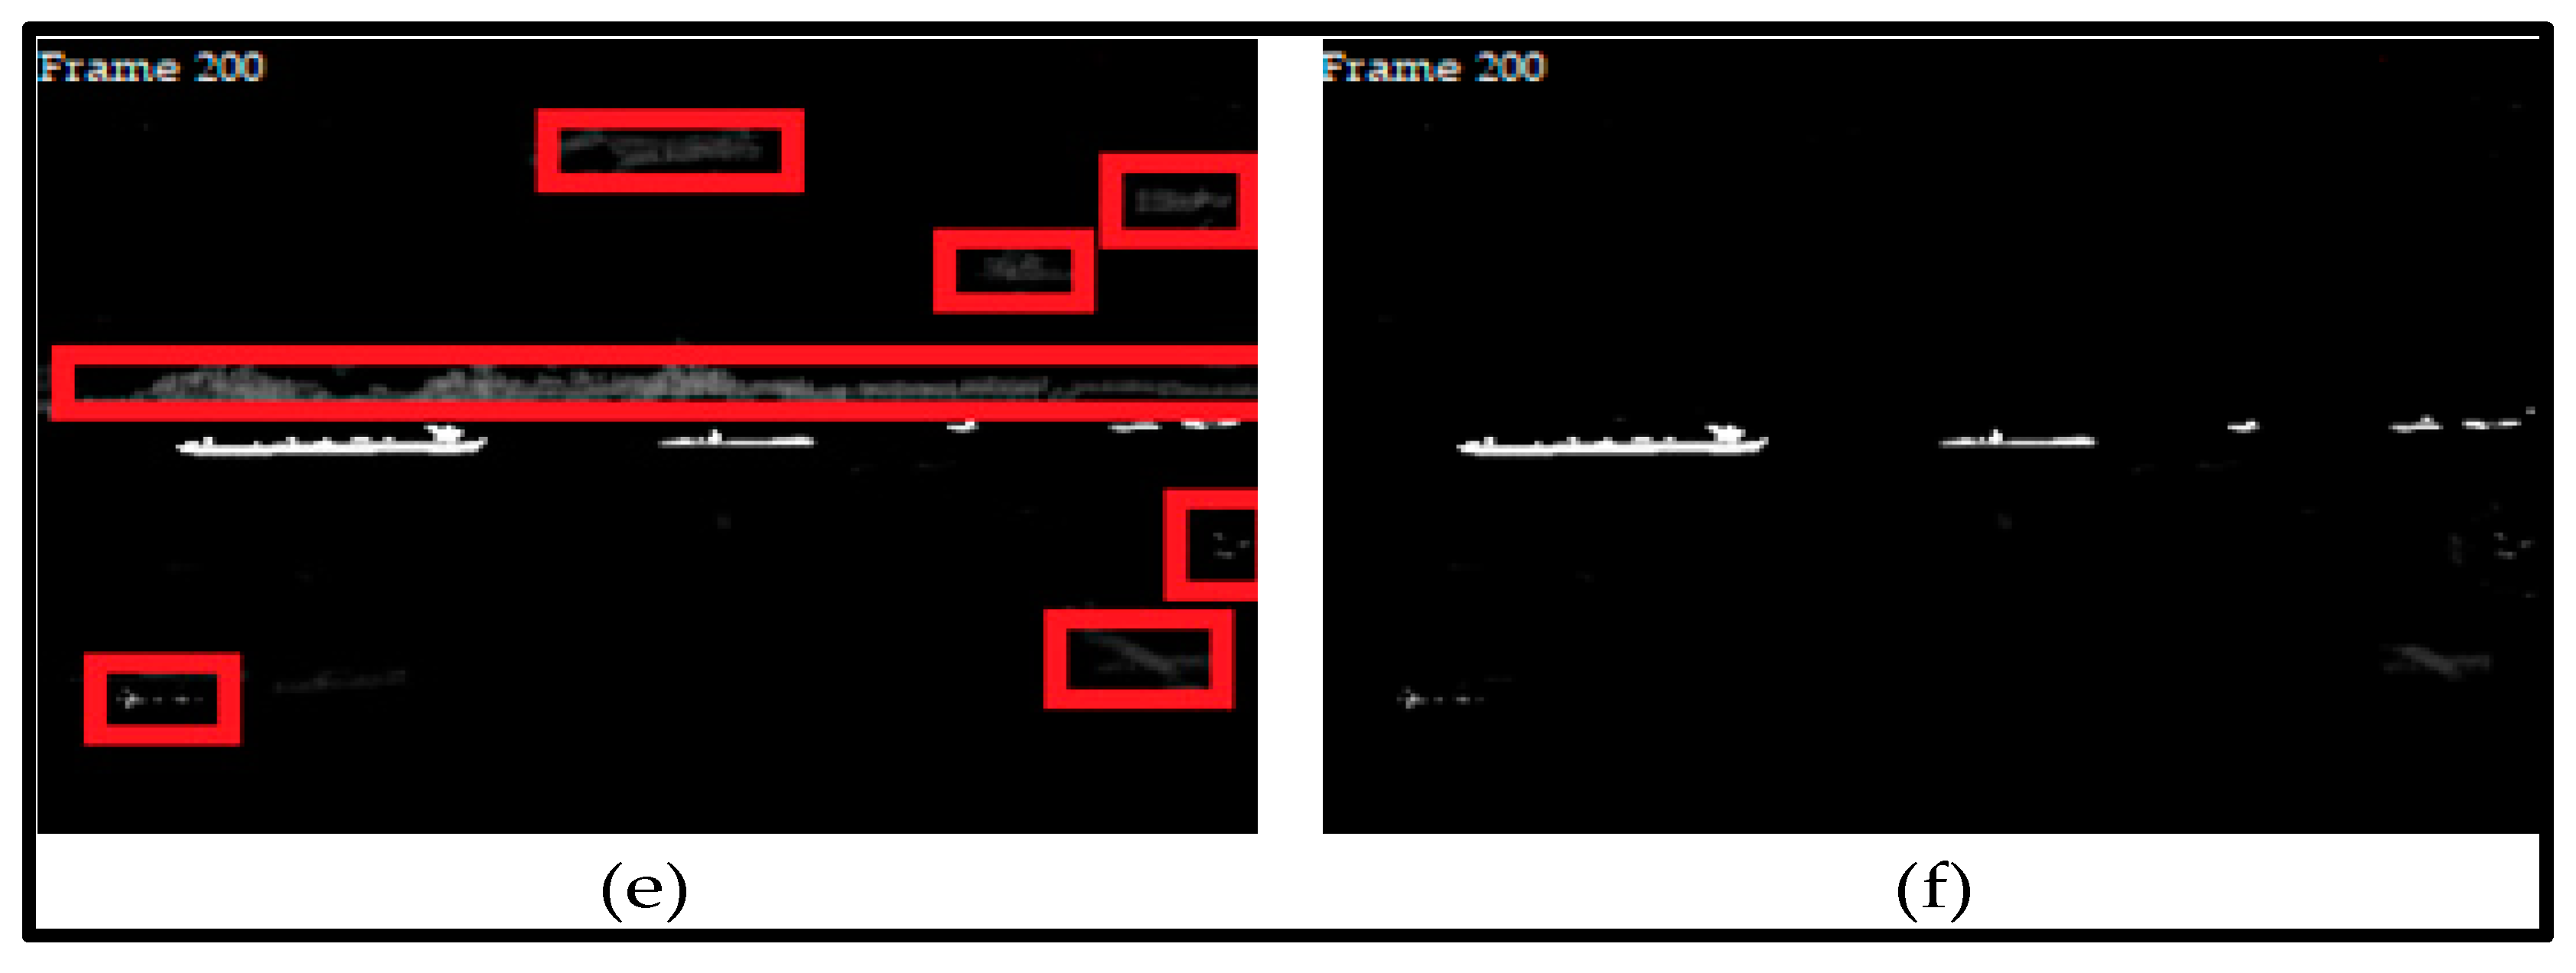
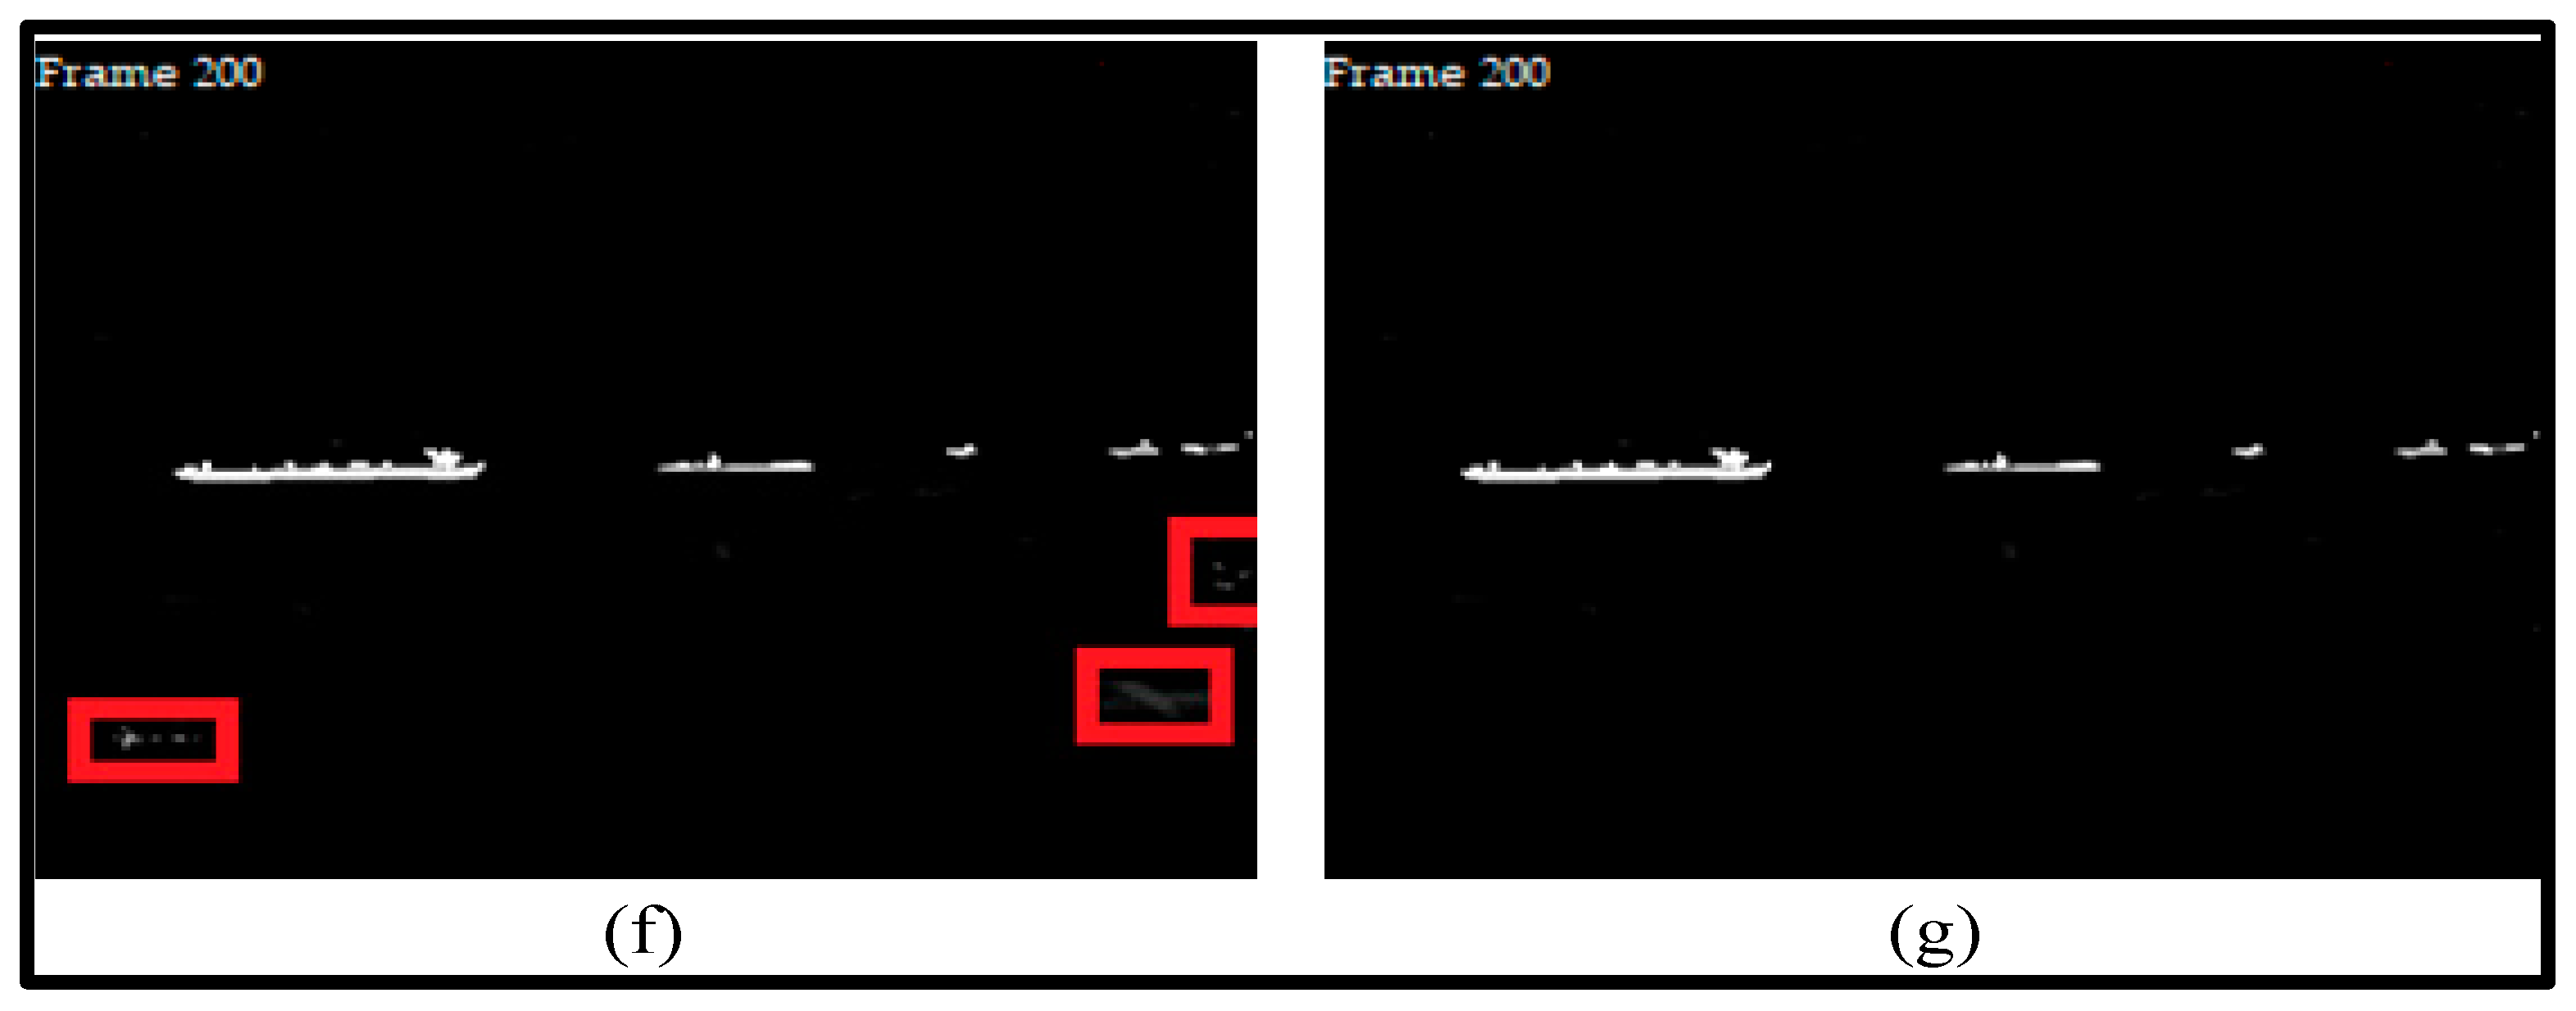
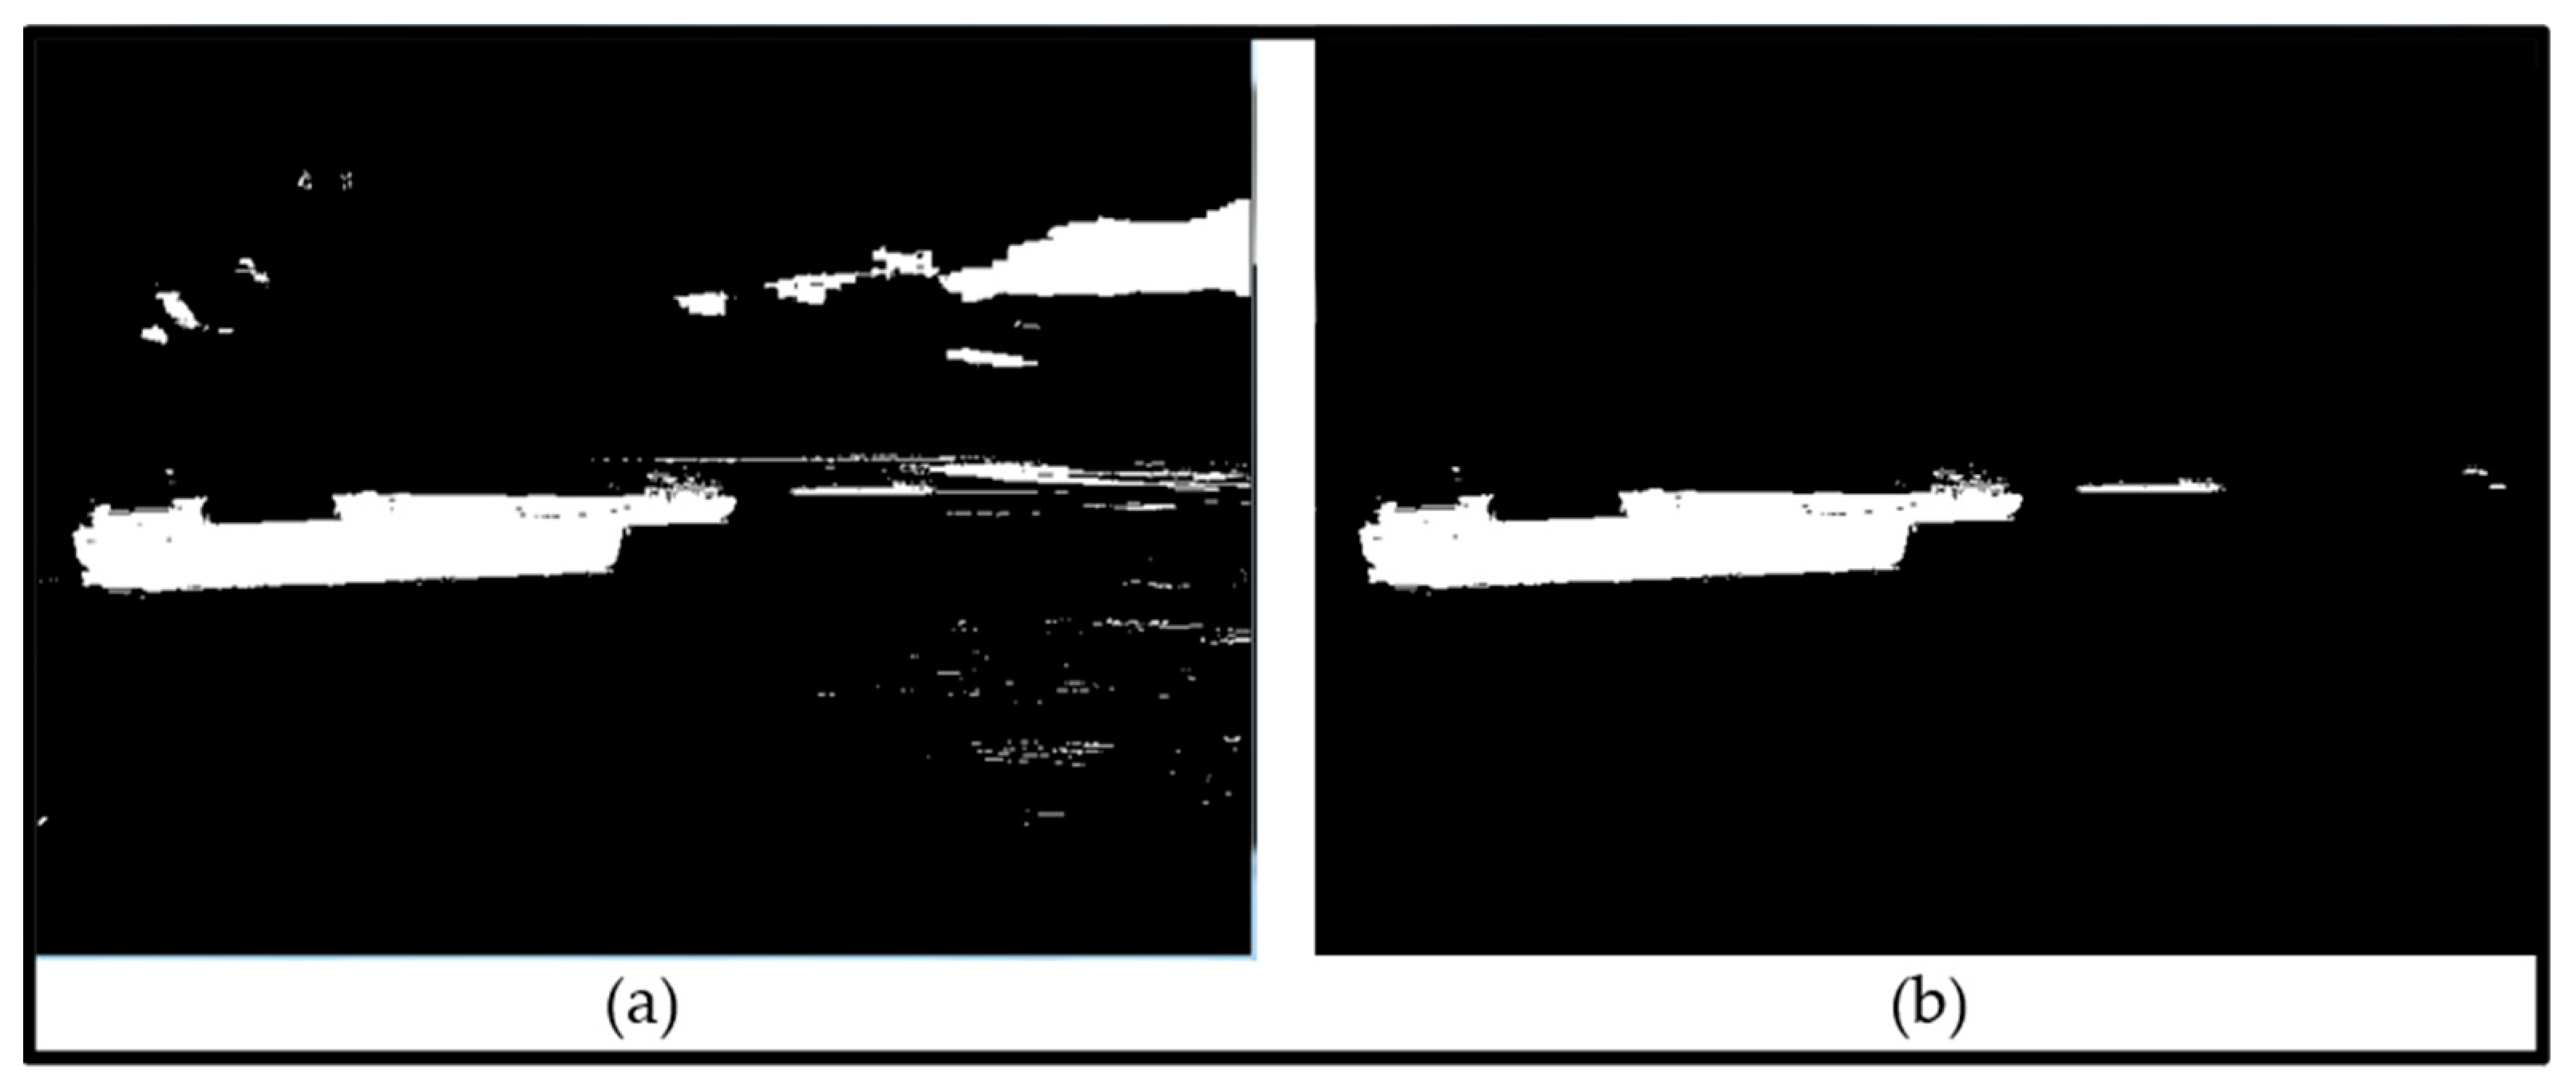
- Undesirable edges and protrusions in the target areas of the vessels were filtered out.
- The four-dimensional target feature vector was effective, as it showed the contour moment features of the vessels.
- The target vessels were distinguished from the surface noise by setting the aspect ratio and the area width of the connected area.
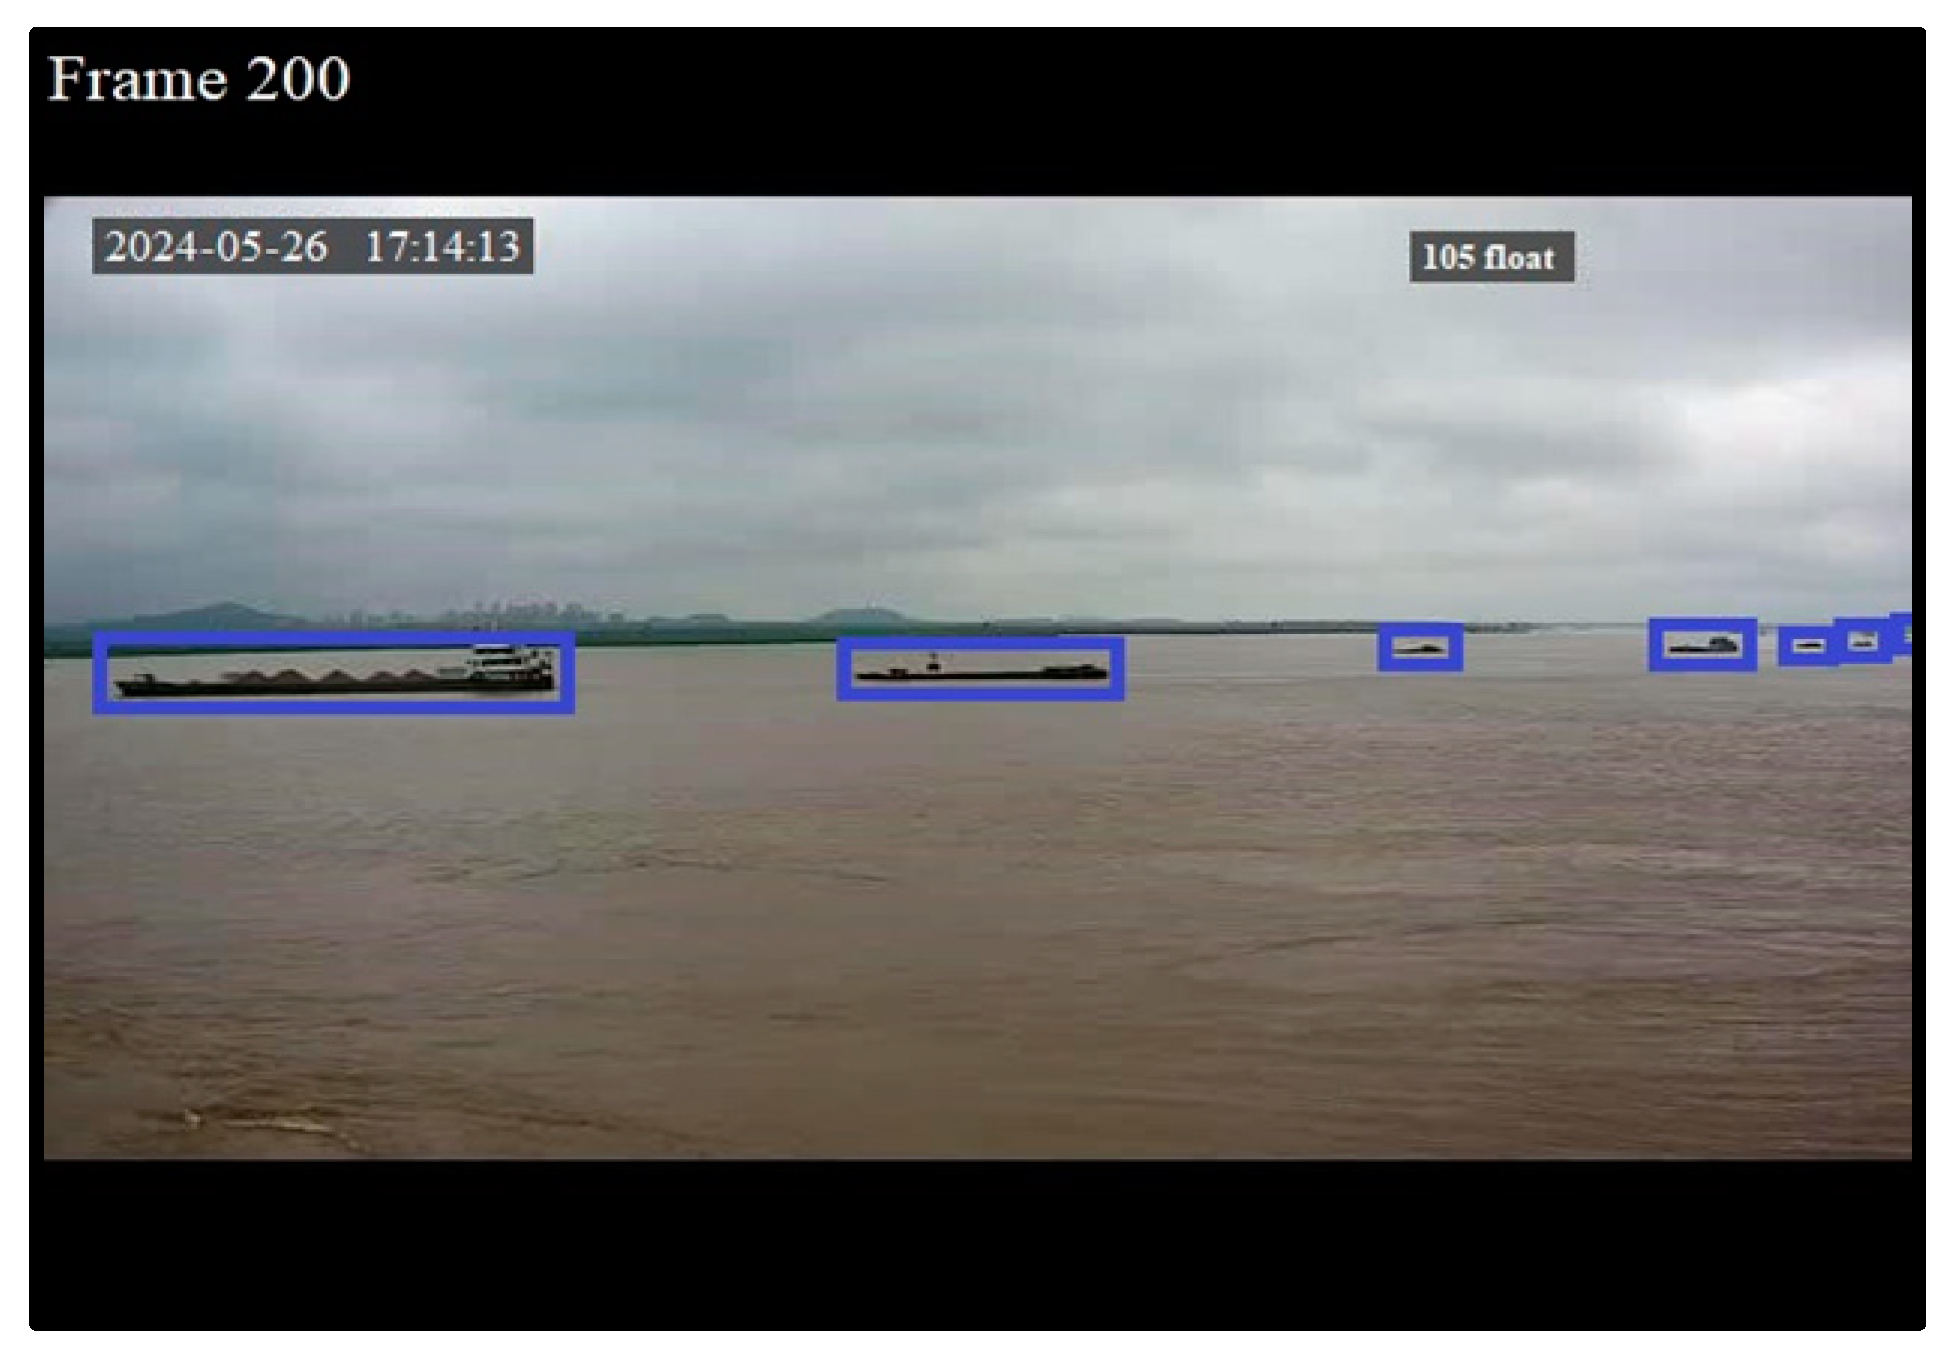
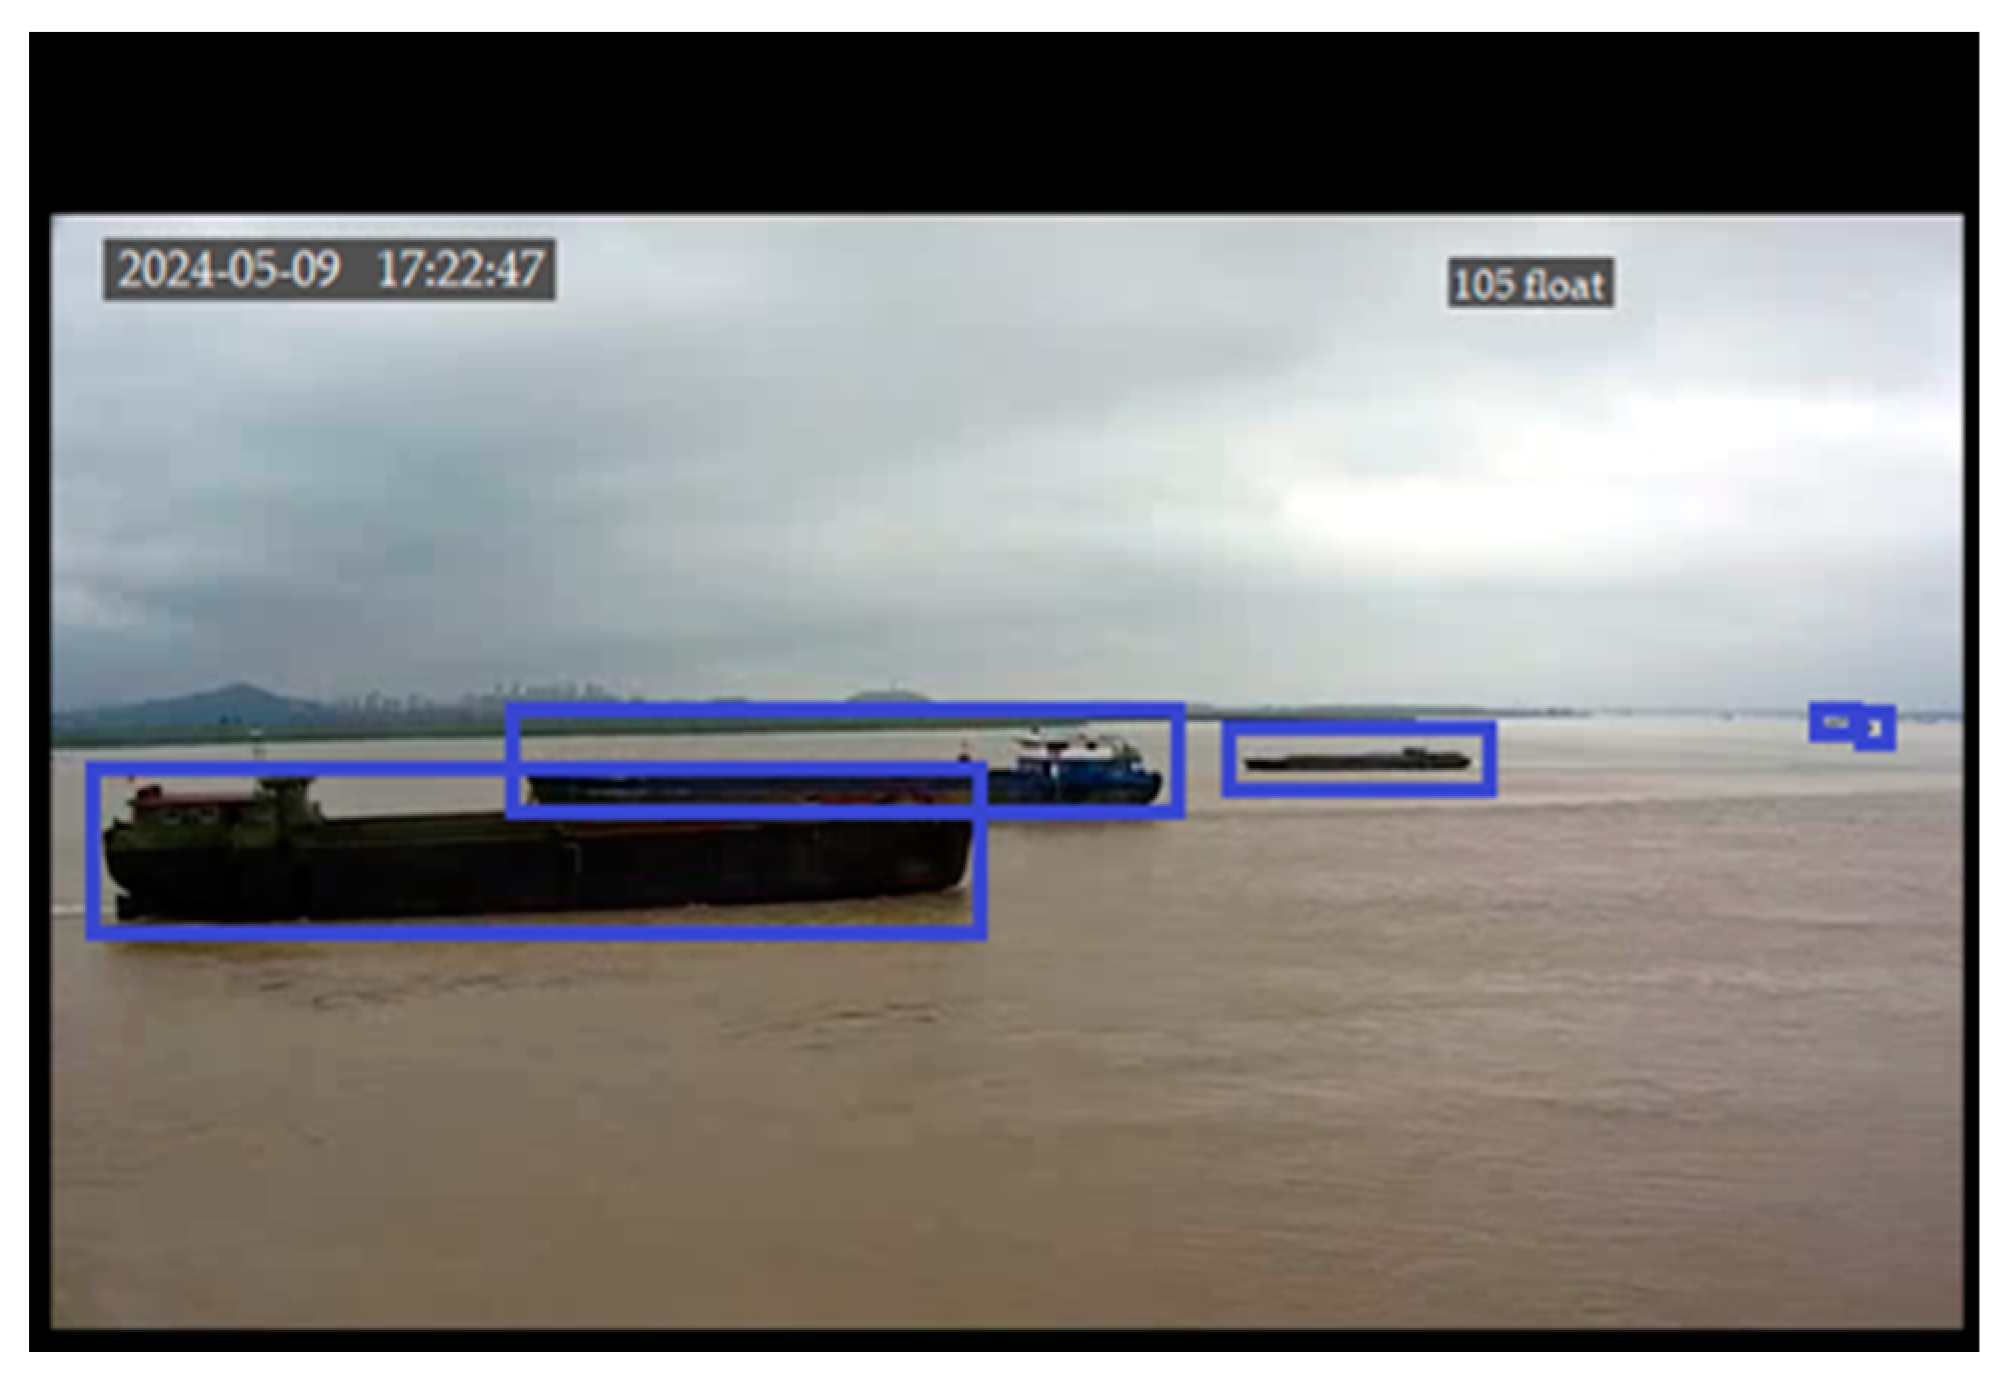
- The final results in Figure 13 indicate that there are seven vessels detected in this image.
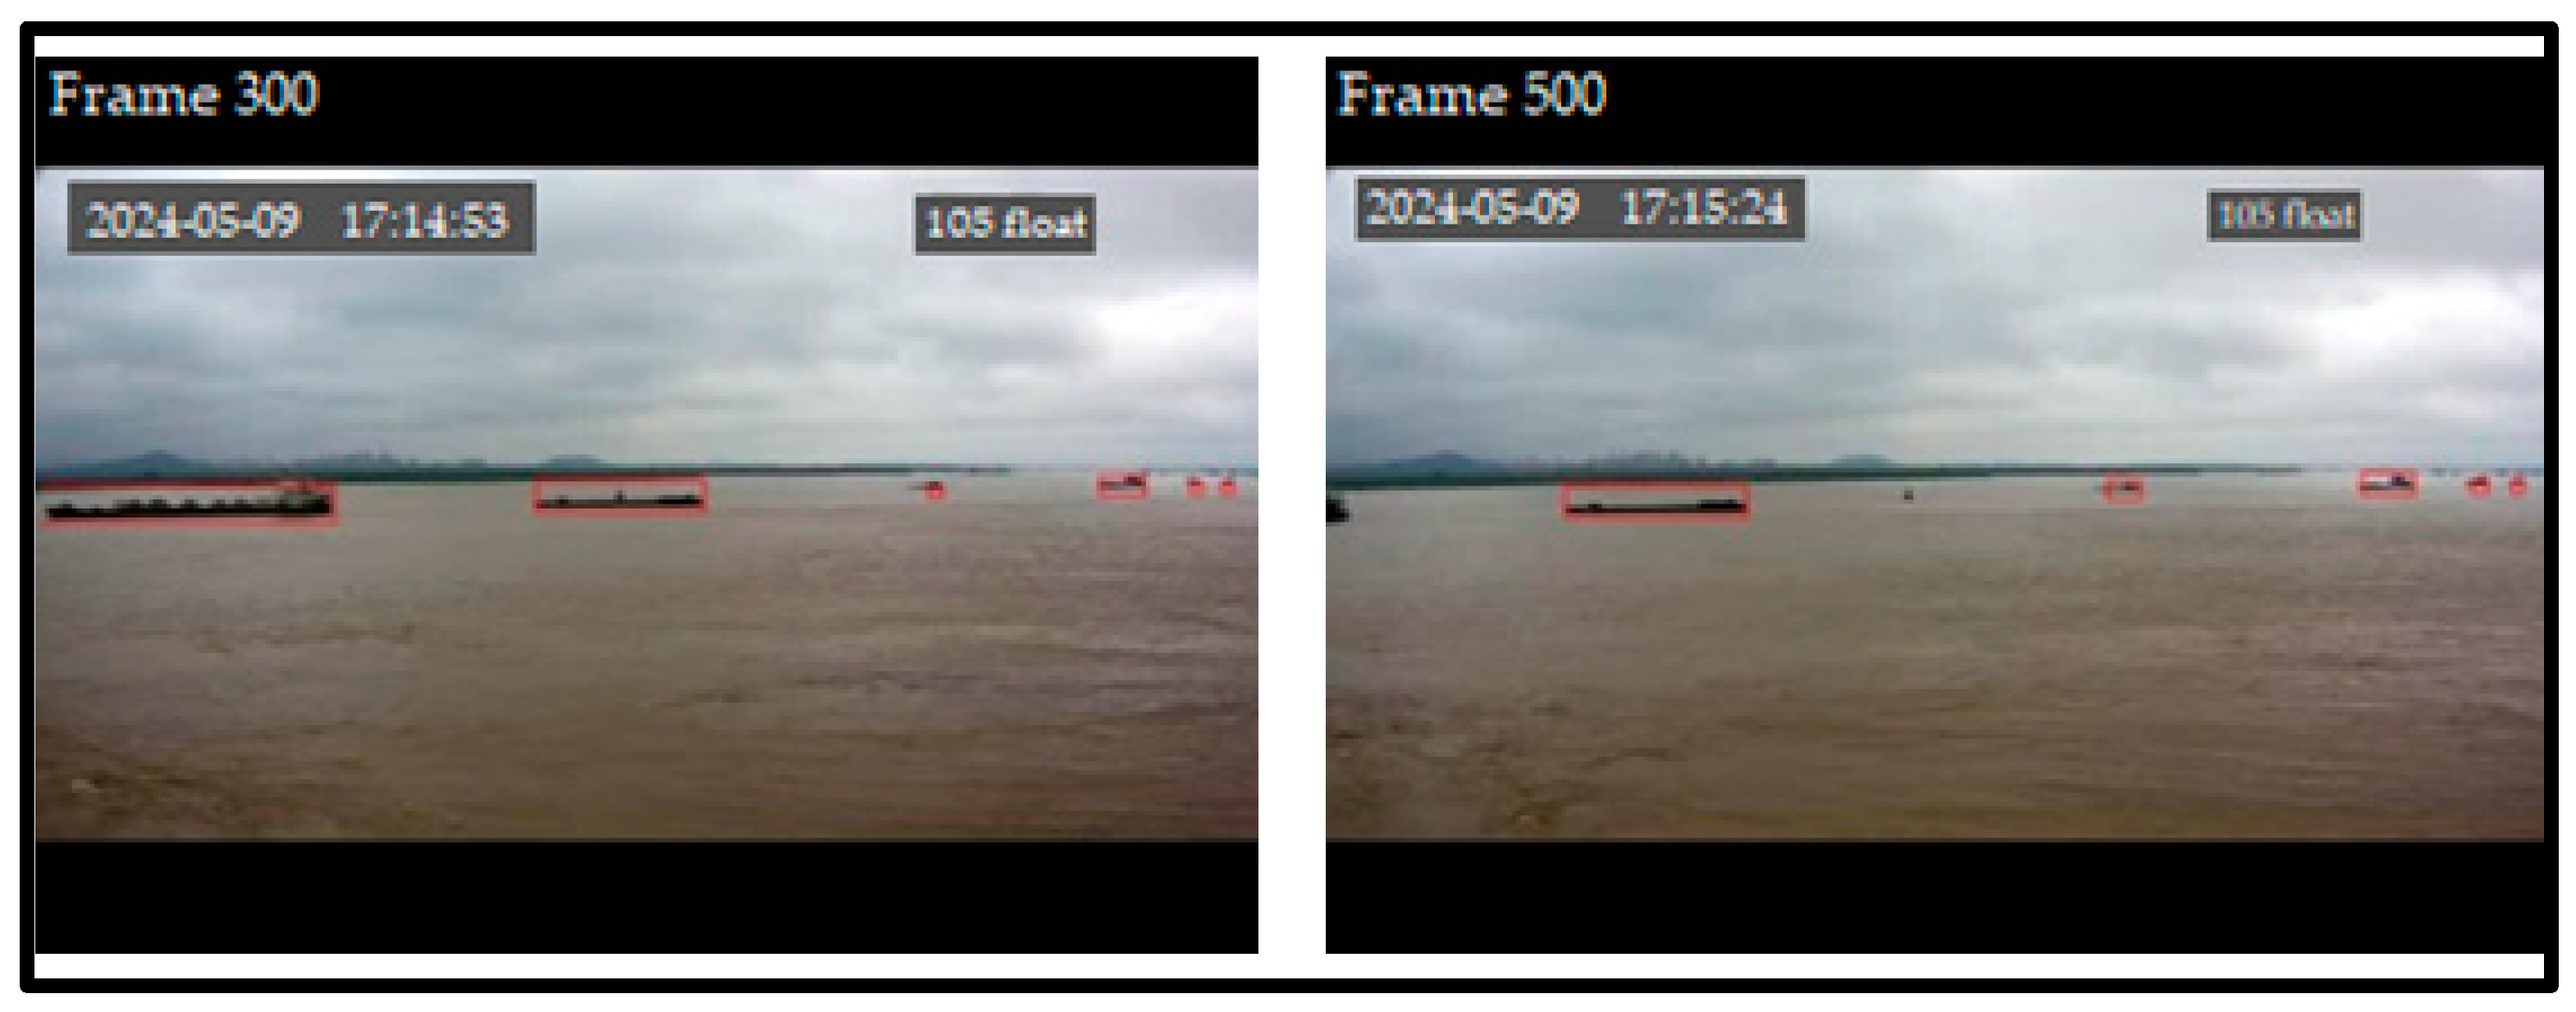
- The same process was run on frames 300 and 500; the results are shown in Figure 14, and they show that frames 300 and 500 detected six and five vessels, respectively.
4.3. Validation of the Approach
4.3.1. First Phase
- In video 1, the contrast of distant target vessels was too low, resulting in a relatively high false detection rate.
- From the analysis of the processing time, video 1 took 2.37 s to determine the number of vessels in the image. Video 2 only needed 1.23 s to obtain the number of vessels from the image. It can be concluded that the vessel detection method adopted in this study can meet the requirements of real-time video processing. The processing time was improved by 1.14 s.
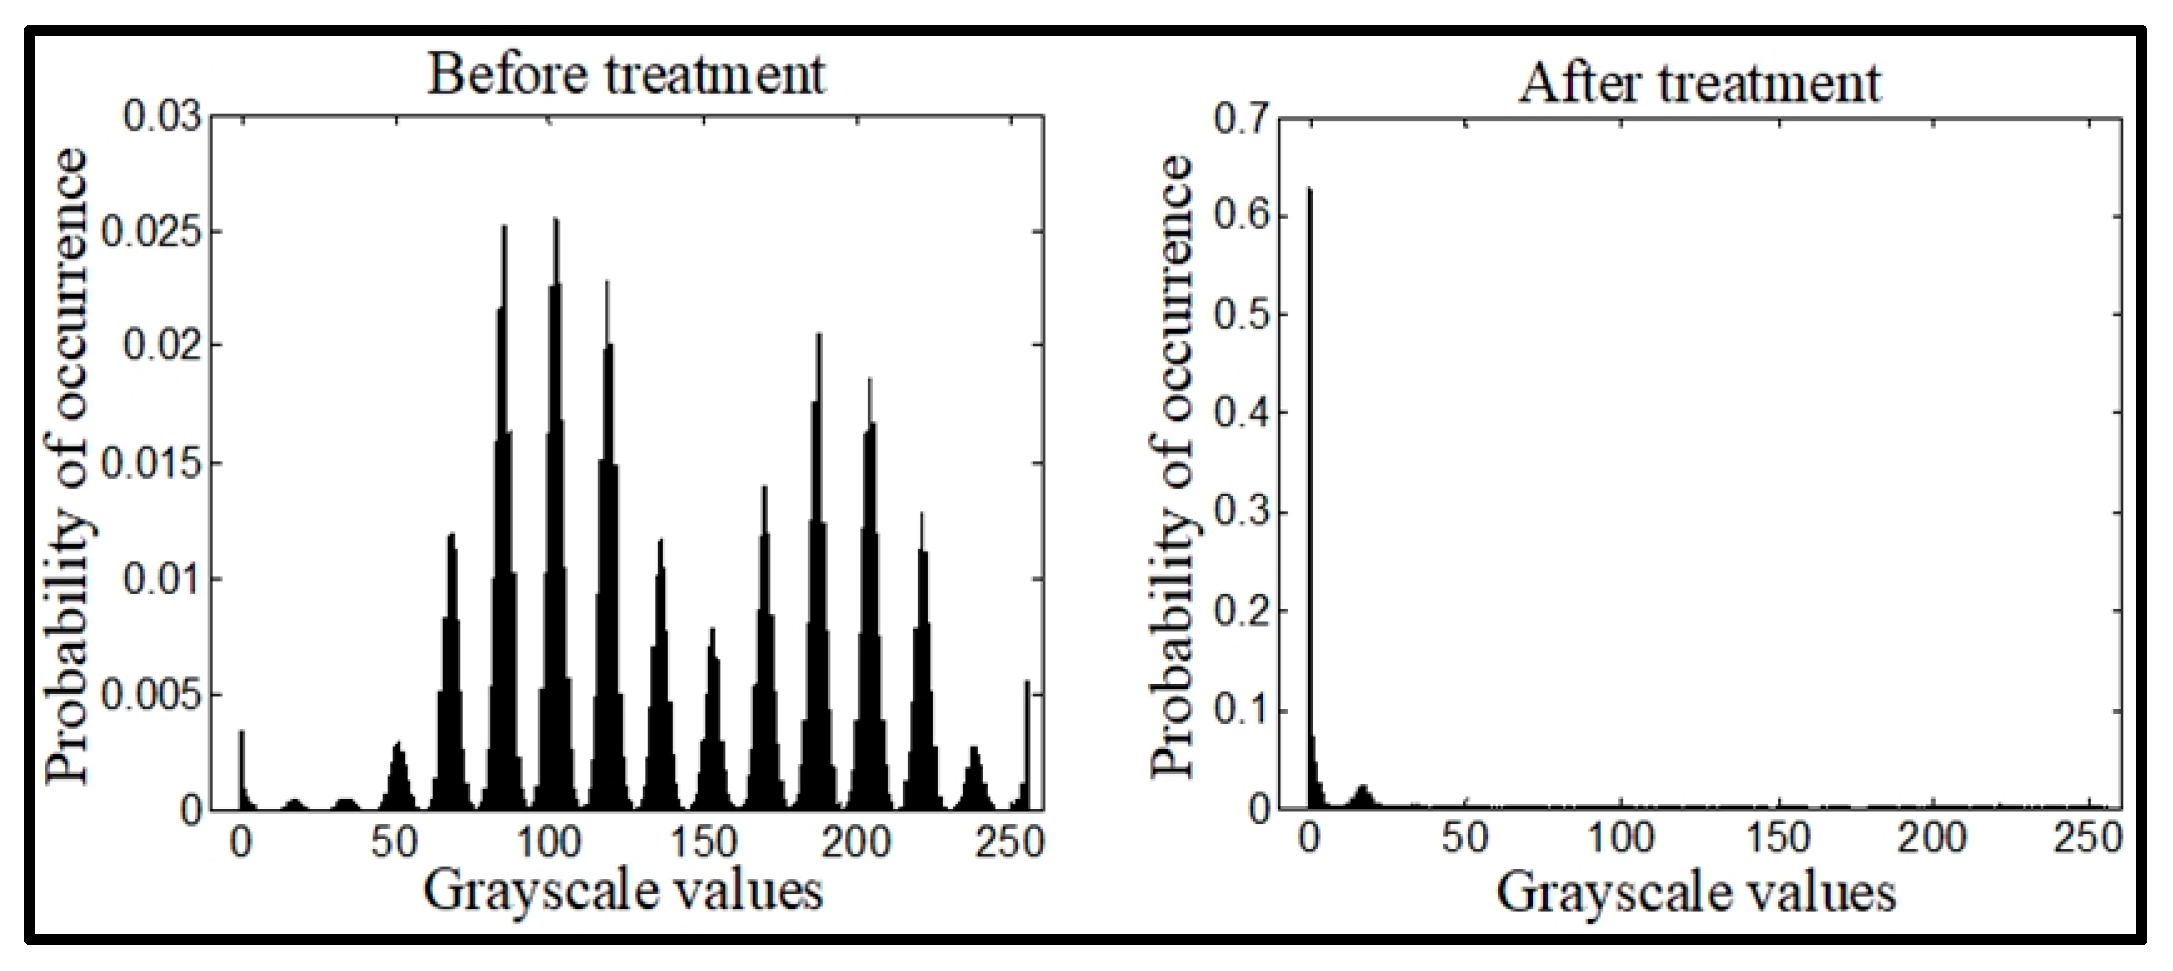
- The original image and the multi-structure diagram were analyzed for significance, and the analysis results are shown in Figure 18.
- The pixels of the original image are evenly distributed in a wide range of gray levels.
- After the calculations were complete, the background pixels of the sea surface were mainly concentrated in a very narrow low gray level.
- The pixels corresponding to the target vessels are concentrated at the end of the high gray level, which is conducive to the image segmentation between the target vessels and the background.
- Comparatively, the improved open operations performed better than the traditional open operations.
4.3.2. Second Phase
5. Discussion
6. Conclusions
Author Contributions
Funding
Institutional Review Board Statement
Data Availability Statement
Acknowledgments
Conflicts of Interest
References
- Sundberg, J.H.; Olin, A.B.; Reddy, S.; Berglund, P.-A.; Svensson, E.; Reddy, M.; Kasarareni, S.; Carlsen, A.A.; Hanes, M.; Kad, S.; et al. Seabird surveillance: Combining CCTV and artificial intelligence for monitoring and research. Remote Sens. Ecol. Conserv. 2023, 9, 435–581. [Google Scholar] [CrossRef]
- Xu, X.Q.; Chen, X.Q.; Wu, B.; Wang, Z.C.; Zhen, J.B. Exploiting high-fidelity kinematic information from port surveillance videos via a YOLO-based framework. Ocean Coast. Manag. 2022, 222, 106117. [Google Scholar] [CrossRef]
- Wang, H.; Wang, T.; Liu, L.; Sun, H.; Zheng, N. Efficient Compression-Based Line Buffer Design for Image/Video Processing Circuits. IEEE Trans. Very Large Scale Integr. (VLSI) Syst. 2019, 27, 2423–2433. [Google Scholar] [CrossRef]
- Li, D.S.; Zhou, Y.C. Recognition and detection of ports and ships based on image application and non local feature enhancement. In Proceedings of the 2022 IEEE 10th Joint International Information Technology and Artificial Intelligence Conference (ITAIC), Chongqing, China, 17–19 June 2022. [Google Scholar] [CrossRef]
- Liu, J.L.; Yan, X.P.; Liu, C.G.; Fan, A.L.; Ma, F. Developments and Applications of Green and Intelligent Inland Vessels in China. J. Mar. Sci. Eng. 2023, 11, 318. [Google Scholar] [CrossRef]
- Li, Y.; Yan, S.H. Moving Ship Detection of Inland River Based on GNSS Reflected Signals. In Proceedings of the 2021 IEEE Specialist Meeting on Reflectometry Using GNSS and other Signals of Opportunity (GNSS+R), Beijing, China, 14–17 September 2021. [Google Scholar]
- Song, P.F.; Qi, L.; Qian, X.M.; Lu, X.Q. Detection of ships in inland river using high-resolution optical satellite imagery based on mixture of deformable part models. J. Parallel Distrib. Comput. 2019, 132, 1–7. [Google Scholar] [CrossRef]
- Yu, N.J.; Fan, X.B.; Deng, T.M.; Mao, G.T. Ship Detection in Inland Rivers Based on Multi-Head Self-Attention. In Proceedings of the 2022 7th International Conference on Signal and Image Processing (ICSIP), Suzhou, China, 20–22 July 2022. [Google Scholar]
- Morillas, J.R.A.; García, I.C.; Zölzer, U. Ship detection based on SVM using color and texture features. In Proceedings of the 2015 IEEE International Conference on Intelligent Computer Communication and Processing (ICCP), Cluj-Napoca, Romania, 3–5 September 2015. [Google Scholar]
- Gao, F.; Lu, Y.G. Moving Target Detection Using Inter-Frame Difference Methods Combined with Texture Features and Lab Color Space. In Proceedings of the 2019 International Conference on Artificial Intelligence and Advanced Manufacturing (AIAM), Dublin, Ireland, 16–18 October 2019. [Google Scholar]
- Marie, T.F.B.; Han, D.; An, B.; Chen, X.; Shen, S. Design and Implementation of Software for Ship Monitoring System in Offshore Wind Farms. Model. Simul. Eng. 2019, 2019, 3430548. [Google Scholar]
- Li, B.; Xie, X.Y.; Wei, X.X.; Tang, W.T. Ship detection and classification from optical remote sensing images: A survey. Chin. J. Aeronaut. 2021, 34, 145–163. [Google Scholar] [CrossRef]
- Wei, T.; Wang, T.; Dong, T.; Jing, M.; Chen, S.; Xu, C.; Liu, Y.; Wu, J.; Gao, L. Comparative analysis of SAR ship detection methods based on deep learning. In Proceedings of the IET International Radar Conference (IRC 2023), Chongqing, China, 3–5 December 2023. [Google Scholar] [CrossRef]
- Elharrouss, O.; Almaadeed, N.; Al-Maadeed, S. A review of video surveillance systems. J. Vis. Commun. Image Represent. 2021, 77, 103116. [Google Scholar] [CrossRef]
- Brooks, C.J.; Grow, C.; Craig, P.A.; Short, D. Cybersecurity Essentials. In Understanding Video Surveillance Systems, 1st ed.; CRC Press: Boca Raton, FL, USA, 2018; pp. 45–70. [Google Scholar] [CrossRef]
- Fouda, B.M.T.; Yang, B.; Han, D.Z.; An, B.W. Pattern Recognition of Optical Fiber Vibration Signal of the Submarine Cable for Its Safety. IEEE Sen. J. 2021, 21, 6510–6519. [Google Scholar] [CrossRef]
- Fouda, B.M.T.; Yang, B.; Han, D.Z.; An, B.W. Principle and Application State of Fully Distributed Fiber Optic Vibration Detection Technology Based on Φ-OTDR: A Review. IEEE Sen. J. 2021, 21, 16428–16442. [Google Scholar]
- Fouda, B.M.T.; Han, D.Z.; An, B.W. Pattern recognition algorithm and software design of an optical fiber vibration signal based on Φ-optical time-domain reflectometry. Appl. Opt. 2019, 58, 8423–8432. [Google Scholar]
- Fouda, B.M.T.; Han, D.Z.; An, B.W.; Li, J.Y. A research on Fiber-optic Vibration Pattern Recognition Based on Time-frequency Characteristics. Advs. Mech. Engr. 2018, 10, 168781401881346. [Google Scholar]
- Fouda, B.M.T.; Han, D.Z.; An, B.W.; Lu, X.J.; Tian, Q.T. Events detection and recognition by the fiber vibration system based on power spectrum estimation. Advs. Mech. Engr. 2018, 10, 1687814018808679. [Google Scholar] [CrossRef]
- Fouda, B.M.T.; Yang, B.; Han, D.Z.; An, B.W. A Hybrid Model Integrating MPSE and IGNN for Events Recognition along Submarine Cables. IEEE Trans. Instr. Meas. 2022, 71, 6502913. [Google Scholar]
- Fouda, B.M.T.; Han, D.Z.; An, B.W.; Pan, M.Q.; Chen, X.Z. Photoelectric Composite Cable Temperature Calculations and its Parameters Correction. Intl. J. Pow. Electr. 2022, 15, 177–193. [Google Scholar]
- Fouda, B.M.T.; Zhang, W.J.; Han, D.Z.; An, B.W. Research on Key Factors to Determine the Corrected Ampacity of Multicore Photoelectric Composite Cables. IEEE Sens. J. 2024, 24, 7868–7880. [Google Scholar]
- Fouda, B.M.T.; Han, D.Z.; Zhang, W.J.; An, B.W. Research on key technology to determine the exact maximum allowable current-carrying ampacity for submarine cables. Opt. Laser Technol. 2024, 175, 110705. [Google Scholar] [CrossRef]
- Yan, Z.J.; Xiao, Y.; Cheng, L.; He, R.; Ruan, X.; Zhou, X.; Li, M.; Bin, R. Exploring AIS data for intelligent maritime routes extraction. Appl. Ocean Res. 2020, 101, 102271. [Google Scholar] [CrossRef]
- Zhong, Z.J.; Wang, Q. Research on Detection and Tracking of Moving Vehicles in Complex Environment Based on Real-Time Surveillance Video. In Proceedings of the 2020 3rd International Conference on Intelligent Robotic and Control Engineering (IRCE), Oxford, UK, 10–12 August 2020. [Google Scholar]
- Wawrzyniak, N.; Hyla, T.; Popik, A. Vessel Detection and Tracking Method Based on Video Surveillance. Sensors 2019, 19, 5230. [Google Scholar] [CrossRef]
- Cong, Y.; Li, Z.; Liang, J.; Liu, P. Research on video-based moving object tracking. In Proceedings of the 2023 IEEE International Conference on Mechatronics and Automation (ICMA), Harbin, China, 6–9 August 2023. [Google Scholar]
- Chen, M.D.; Ma, J.; Zeng, X.; Liu, K.; Chen, M.; Zheng, K.; Wang, K. MD-Alarm: A Novel Manpower Detection Method for Ship Bridge Watchkeeping Using Wi-Fi Signals. IEEE Trans. Instr. Meas. 2022, 71, 5500713. [Google Scholar] [CrossRef]
- Deng, H.M.; Zhang, Y. FMR-YOLO: Infrared Ship Rotating Target Detection Based on Synthetic Fog and Multiscale Weighted Feature Fusion. IEEE Trans. Instr. Meas. 2023, 73, 1. [Google Scholar] [CrossRef]
- Chithra, A.S.; Roy, R.R.U. Otsu’s Adaptive Thresholding Based Segmentation for Detection of Lung Nodules in CT Image. In Proceedings of the 2018 2nd International Conference on Trends in Electronics and Informatics (ICOEI), Tirunelveli, India, 11–12 January 2018; pp. 1303–1307. [Google Scholar]
- Zhu, Q.D.; Jing, L.Q.; Bi, R.S. Exploration and improvement of Ostu threshold segmentation algorithm. In Proceedings of the 2010 8th World Congress on Intelligent Control and Automation, Jinan, China, 7 July 2010; pp. 6183–6188. [Google Scholar]
- Hough, P.V.C. Method and Means for Recognizing Complex Patterns. U.S. Patent 3069654A, 18 December 1962. [Google Scholar]
- Fernandes, L.A.; Oliveira, M.M. Real-time line detection through an improved hough transform voting scheme. Pattern Recogn. 2008, 41, 299–314. [Google Scholar] [CrossRef]
- Princen, J.; Illingworth, J.; Kittler, J. A hierarchical approach to line extraction based on the Hough transform. Comput. Vis. Graph. Image Process. 1990, 52, 57–77. [Google Scholar] [CrossRef]
- Kiryati, N.; Eldar, Y.; Bruckstein, A.M. A probabilistic hough transform. Pattern Recogn. 1991, 24, 303–316. [Google Scholar] [CrossRef]
- Zhang, Z.; Li, Z.; Bi, N.; Zheng, J.; Wang, J.; Huang, K.; Luo, W.; Xu, Y.; Gao, S. PPGnet: Learning point-pair graph for line segment detection. IEEE Conf. Comput. Vis. Pattern Recog. 2019, 2019, 7105–7114. [Google Scholar]
- Zhao, K.; Han, Q.; Zhang, C.B.; Xu, J.; Cheng, M.M. Deep Hough Transform for Semantic Line Detection. IEEE Trans. Pattern Anal. Mach. Intell. 2022, 44, 4793–4806. [Google Scholar] [CrossRef]
- Akinlar, C.; Topal, C. Edlines: A real-time line segment detector with a false detection control. Pattern Recogn. 2011, 32, 1633–1642. [Google Scholar] [CrossRef]
- Lotufo, R.A.; Audigier, R.; Saúde, A.V.; Machado, R.C. Chapter Six: Microscope Image Processing. In Morphological Image Processing, 2nd ed.; Acadenic Press: Cambridge, MA, USA, 2023; pp. 75–117. [Google Scholar] [CrossRef]
- Pingel, T.J.; Clarke, K.; Mcbride, W.A. An Improved Simple Morphological Filter for the Terrain Classification of Airborne LIDAR Data. J. Photogramm. Remote Sens. 2013, 77, 21–30. [Google Scholar] [CrossRef]
- Thanki, R.M.; Kothari, A.M. Morphological Image Processing. In Digital Image Processing Using SCILAB; Springer: Berlin/Heidelberg, Germany, 2019; pp. 99–113. [Google Scholar]
- Zeng, M.; Li, J.X.; Peng, Z. The design of Top-Hat morphological filter and application to infrared target detection. Infrared Phys. Technol. 2006, 48, 67–76. [Google Scholar] [CrossRef]
- Wang, Z.S.; Yang, F.B.; Peng, Z.H.; Chen, L.; Ji, L.E. Multi-sensor image enhanced fusion algorithm based on NSST and top-hat transformation. Optik 2015, 126, 4184–4190. [Google Scholar]
- Li, Y.B.; Niu, Z.D.; Xiao, H.T.; Li, H. BSC-Net: Background Suppression Algorithm for Stray Lights in Star Images. Remote Sens. 2022, 14, 4852. [Google Scholar] [CrossRef]
- Guan, M.S.; Ren, H.E.; Ma, Y. Multi-sale morphological filtering method for preserving the details of images. Control Systems Engineering. In Proceedings of the 2009 Asia-Pacific Conference on Computational Intelligence and Industrial Applications (PACIIA), Wuhan, China, 28–29 November 2009. [Google Scholar]
- Chen, Z.R.; Chen, A.; Liu, W.J.; Zheng, D.K.; Yang, J.; Ma, X.Y. A sea clutter suppression algorithm for over-the-horizon radar based on dictionary learning and subspace estimation. Digit. Signal Process. 2023, 140, 104131. [Google Scholar] [CrossRef]
- Appiah, O.; Asante, M.; Hayfron-Acquah, J.B. Improved approximated median filter algorithm for real-time computer vision applications. J. King Saud Univ.-Comput. Inf. Sci. 2022, 34, 782–792. [Google Scholar] [CrossRef]
- Villar, S.A.; Torcida, S.; Acosta, G.G. Median Filtering: A New Insight. J. Math Imaging Vis. 2016, 58, 130–146. [Google Scholar] [CrossRef]
- Sonali; Sahu, S.; Singh, A.K.; Ghrera, S.P.; Elhoseny, M. An approach for de-noising and contrast enhancement of retinal fundus image using CLAHE. Opt. Laser Technol. 2019, 110, 87–98. [Google Scholar] [CrossRef]
- Cao, H.C.; Shen, N.J.; Qian, C. An Improved Adaptive Median Filtering Algorithm Based on Star Map Denoising. In CIAC 2023: Proceedings of 2023 Chinese Intelligent Automation Conference; Lecture Notes in Electrical Engineering; Springer: Berlin/Heidelberg, Germany, 2023; Volume 1082, pp. 184–195. [Google Scholar]
- Li, N.Z.; Li, H.Q. Improv. Adapt. Median Filter. Algorithm Radar Image Co-Channel Interf. Suppression. Sens. 2022, 22, 7573. [Google Scholar] [CrossRef] [PubMed]
- Hwang, H.; Haddad, R.A. Adaptive median filters: New algorithms and results. IEEE Trans. Image Process. 1995, 4, 499–502. [Google Scholar] [CrossRef]
- Yang, C.Z.; Fang, L.C.; Fei, B.J.; Yu, Q.; Wei, H. Multi-level contour combination features for shape recognition. Comput. Vis. Image Underst. 2023, 229, 103650. [Google Scholar] [CrossRef]
- Xu, H.R.; Yang, J.Y.; Shao, Z.P.; Tang, Y.Z.; Li, Y.F. Contour Based Shape Matching for Object Recognition. In Intelligent Robotics and Applications. ICIRA; Lecture Notes in Computer Science; Kubota, N., Kiguchi, K., Liu, H., Obo, T., Eds.; Springer: Cham, Germany, 2016; Volume 9834. [Google Scholar] [CrossRef]
- Fouda, B.M.T.; Han, D.Z.; An, B.W.; Chen, X.Z. Research and Software Design of an Φ-OTDR-Based Optical Fiber Vibration Recognition Algorithm. J. Electr. Comp. Engr. 2020, 2020, 5720695. [Google Scholar]
- Zhang, Y.G.; Zheng, J.; Zhang, C.; Li, B. An effective motion object detection method using optical flow estimation under a moving camera. J. Vis. Commun. Image Represent. 2018, 55, 215–228. [Google Scholar] [CrossRef]
- Ibrahim, D.; Irfan, K.; Muhammed, K.; Feyza, S. Motion detection in moving camera videos using background modeling and FlowNet. J. Vis. Commun. Image Represent. 2022, 88, 103616. [Google Scholar]
- Zhang, Z.G.; Zhang, H.M.; Zhang, Z.F. Using Three-Frame Difference Algorithm to Detect Moving Objects. In The International Conference on Cyber Security Intelligence and Analytics. CSIA 2019. Advances in Intelligent Systems and Computing; Springer: Cham, Germany, 2019; Volume 928, pp. 923–928. [Google Scholar] [CrossRef]
- Liu, T.; Zhang, Z.; Lei, Z.; Huo, Y.; Wang, S.; Zhao, J.; Zhang, J.; Jin, X.; Zhang, X. An approach to ship target detection based on combined optimization model of dehazing and detection. Eng. Appl. Artif. Intell. 2024, 127, 107332. [Google Scholar] [CrossRef]


| Morphological Filtering Algorithm | Number of Corrugated Bands | MSE | PSNR | EN |
|---|---|---|---|---|
| Before filtering | 9.7011 | 3.7717 | ||
| After filtering | 9.9903 | 3.6399 |
| Adaptive Fast Median Filtering | Number of Corrugated Bands | MSE | PSNR | EN |
|---|---|---|---|---|
| Before filtering | 9.9903 | 3.6399 | ||
| After filtering | 10.0441 | 3.4001 |
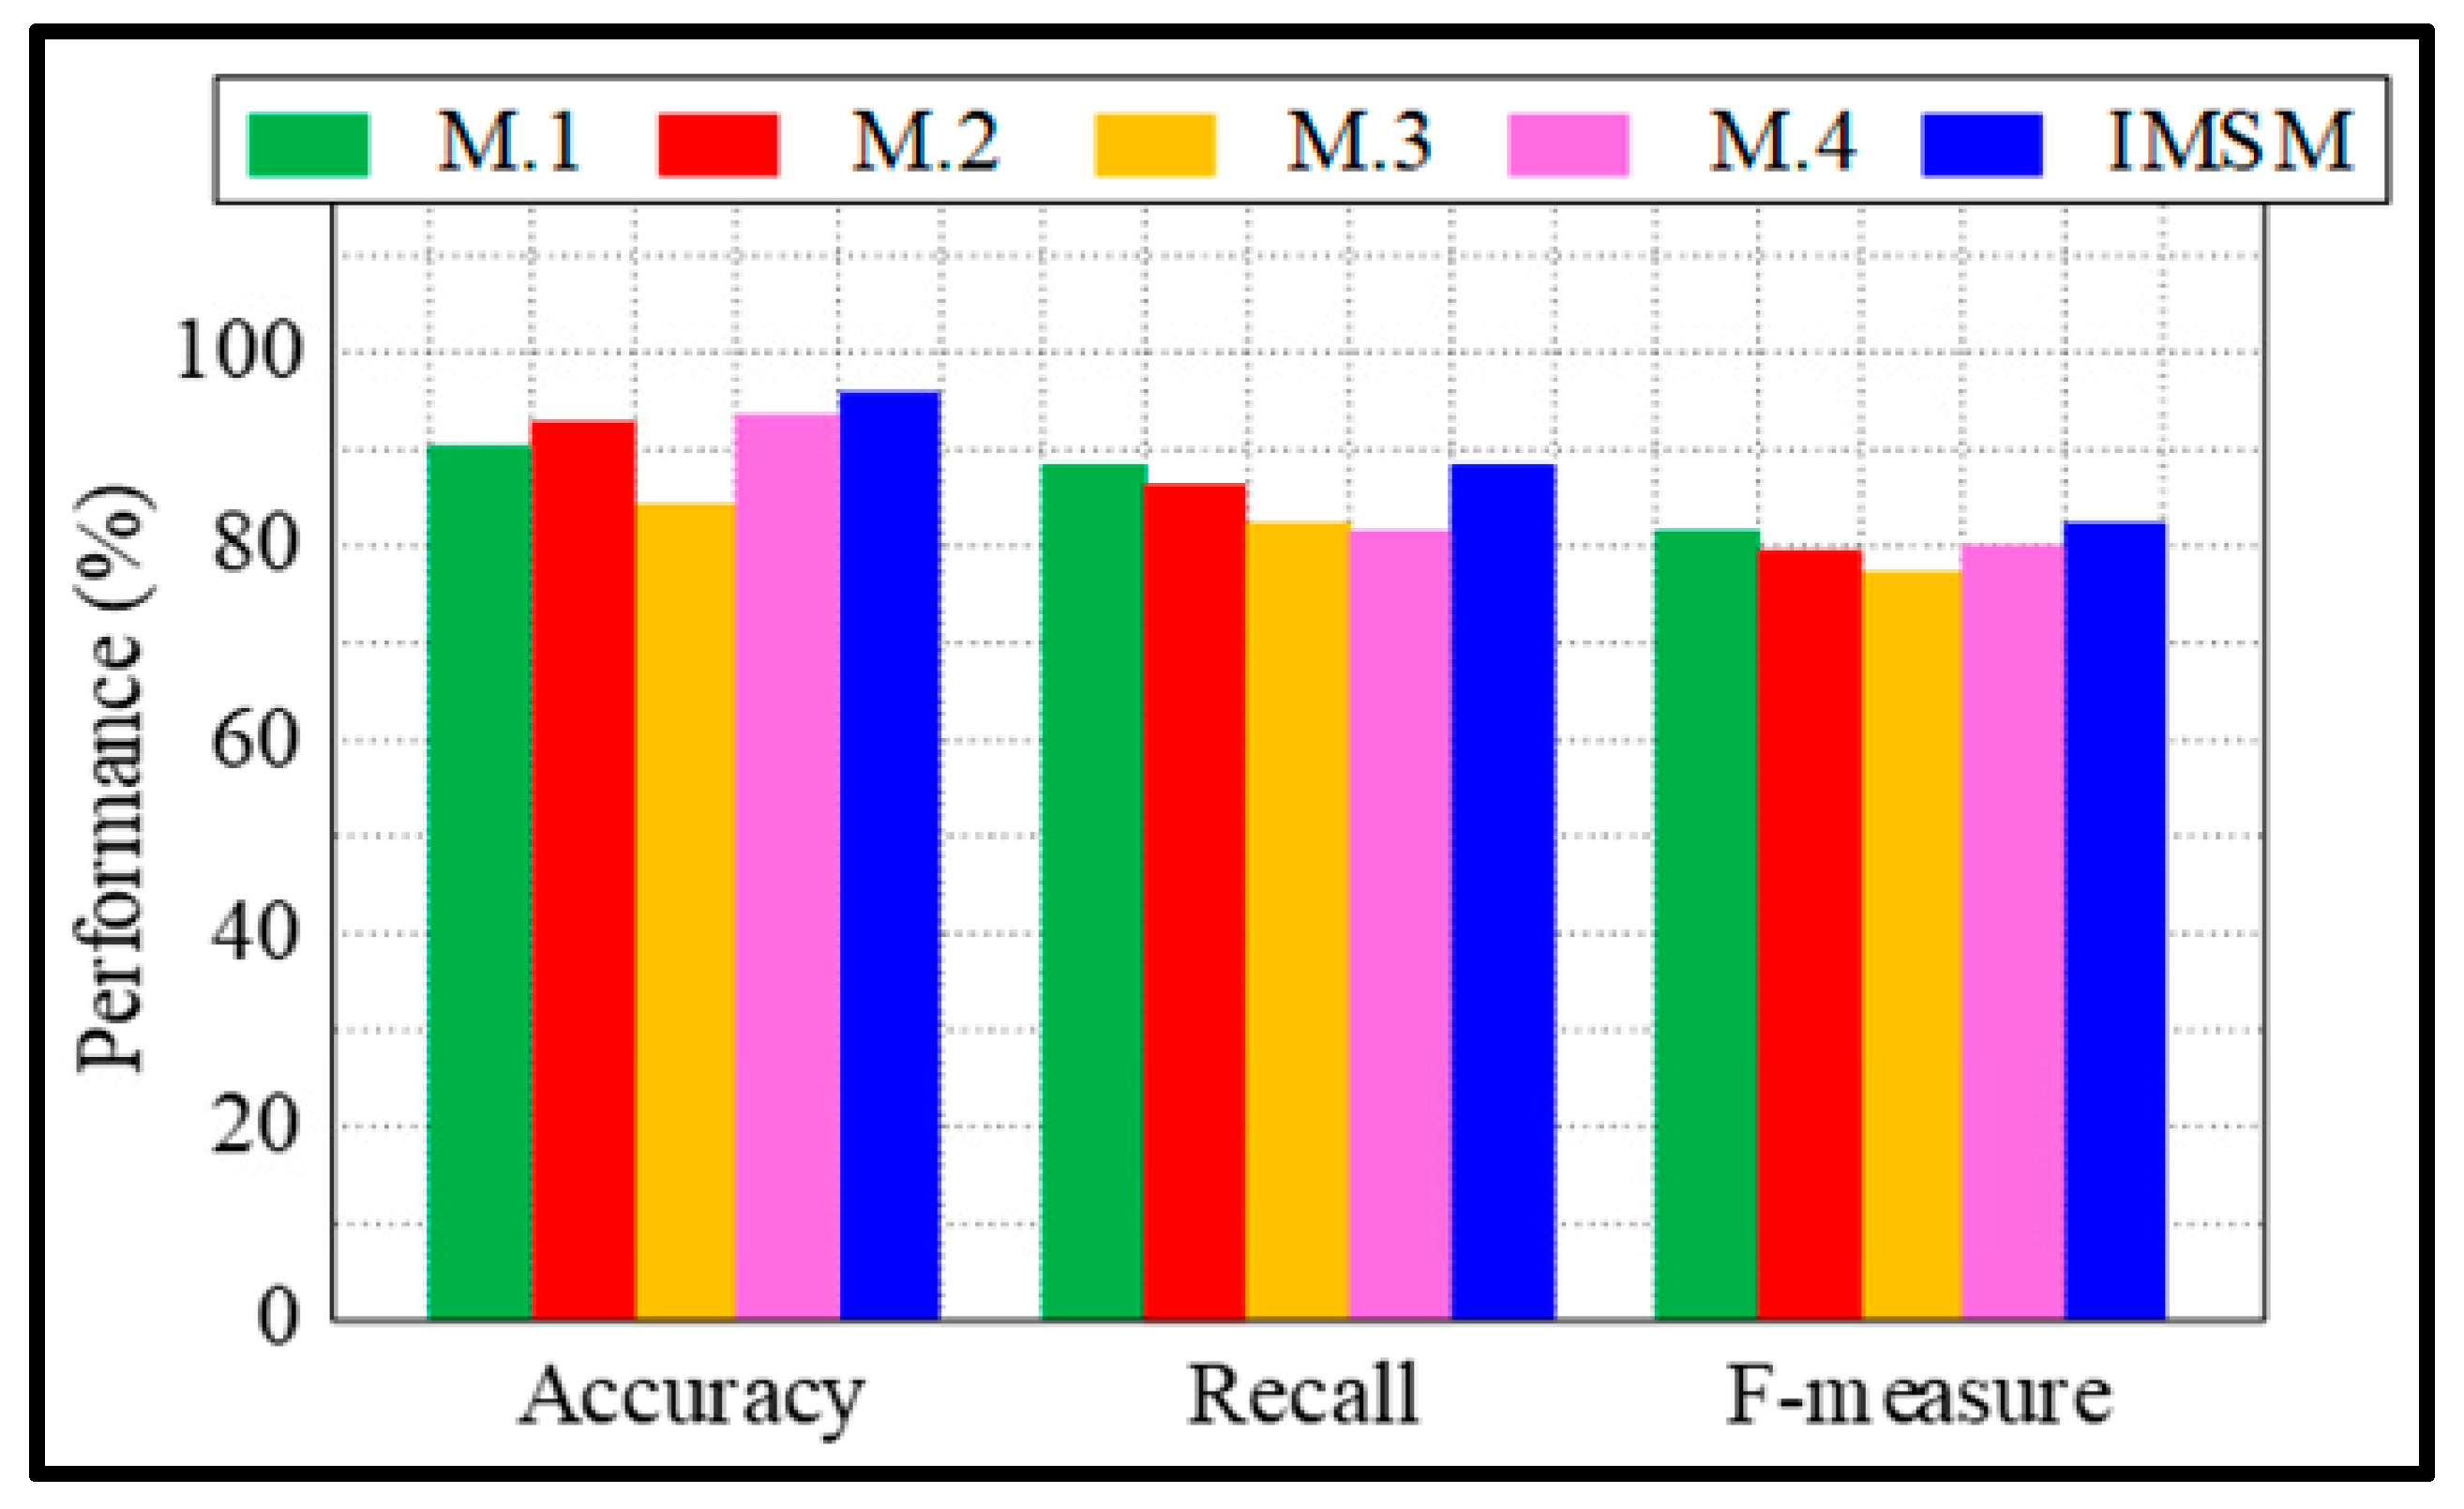
| Characteristics | Methods | ||||
|---|---|---|---|---|---|
| M1 | M2 | M3 | M4 | IMSM | |
| Number of checkouts | 59 | 58 | 56 | 57 | 58 |
| Number of false positive | 0 | 0 | 0 | 0 | 0 |
| Missed detections number | 2 | 2 | 5 | 2 | 2 |
| False detection rate | 0.052 | 0.04 | 0.094 | 0.054 | 0.040 |
| F-measure | 0.817 | 0.801 | 0.788 | 0.806 | 0.821 |
| Recall | 0.882 | 0.877 | 0.819 | 0.811 | 0.882 |
| Accuracy | 0.916 | 0.030 | 0.863 | 0.933 | 0.942 |
| Processing time | 1.41 s | 1.36 s | 1.97 s | 1.72 s | 1.23 s |
Disclaimer/Publisher’s Note: The statements, opinions and data contained in all publications are solely those of the individual author(s) and contributor(s) and not of MDPI and/or the editor(s). MDPI and/or the editor(s) disclaim responsibility for any injury to people or property resulting from any ideas, methods, instructions or products referred to in the content. |
© 2024 by the authors. Licensee MDPI, Basel, Switzerland. This article is an open access article distributed under the terms and conditions of the Creative Commons Attribution (CC BY) license (https://creativecommons.org/licenses/by/4.0/).
Share and Cite
Tabi Fouda, B.M.; Zhang, W.; Atangana, J.; Edima-Durand, H.C. Development of a Key Method for the Optimization of Port Vessel Detection Based on an Improved Multi-Structural Morphology Approach. J. Mar. Sci. Eng. 2024, 12, 1969. https://doi.org/10.3390/jmse12111969
Tabi Fouda BM, Zhang W, Atangana J, Edima-Durand HC. Development of a Key Method for the Optimization of Port Vessel Detection Based on an Improved Multi-Structural Morphology Approach. Journal of Marine Science and Engineering. 2024; 12(11):1969. https://doi.org/10.3390/jmse12111969
Chicago/Turabian StyleTabi Fouda, Bernard Marie, Wenjun Zhang, Jacques Atangana, and Helene Carole Edima-Durand. 2024. "Development of a Key Method for the Optimization of Port Vessel Detection Based on an Improved Multi-Structural Morphology Approach" Journal of Marine Science and Engineering 12, no. 11: 1969. https://doi.org/10.3390/jmse12111969
APA StyleTabi Fouda, B. M., Zhang, W., Atangana, J., & Edima-Durand, H. C. (2024). Development of a Key Method for the Optimization of Port Vessel Detection Based on an Improved Multi-Structural Morphology Approach. Journal of Marine Science and Engineering, 12(11), 1969. https://doi.org/10.3390/jmse12111969