1. Introduction
Ship Radiated Noise (SRN) refers to the noise emitted by vessels during operation, which contains characteristic information related to the ship. Passive sonar systems can utilize radiated noise for remote detection, localization, and tracking of underwater targets. Recognizing targets in the underwater environment has long posed a formidable challenge due to its intricacy and the defensive measures adopted by targets. In the early stages, this task primarily relied on the experience of sonar operators. Currently, we aim to develop neural network-based intelligent recognition methods that are not influenced by environmental conditions or operator factors.
Directly using raw audio to train classification models is highly challenging. On one hand, raw audio signals contain a significant amount of redundant information, requiring large datasets to achieve model convergence, while maritime trial costs are high and field data collection is labor-intensive and resource-consuming. On the other hand, the varied characteristics of targets make it difficult to obtain large amounts of training data under different environmental conditions. Therefore, audio-based feature extraction methods remain indispensable. Traditional feature extraction front-ends are compatible with traditional classifiers, but their performance is limited within deep learning frameworks. Traditional underwater target recognition classifiers mainly include genetic algorithms, fuzzy recognition, shallow artificial neural network methods (ANN), and statistical classification methods represented by support vector machines (SVM). However, these classifiers have limited modeling capabilities. To adapt to these classifiers, traditional features often undergo specific signal processing procedures to extract information from a particular aspect of ship radiated noise (such as frequency line spectrum information, modulation spectrum information), resulting in partial loss of classification-related information due to reduced feature dimensions. Consequently, deep neural networks, which have strong modeling capabilities, cannot obtain sufficient information for target classification and recognition when using traditional features as input.
Recent years have seen a proliferation of deep learning-driven target recognition approaches, showcasing notable benefits compared to conventional time-frequency analysis techniques. For instance, Doan et al. [
1] utilizes a sequence of convolutional modules to capture diverse features from radiated noise, employing distinct classifiers for identification. Tian et al. [
2] introduces a deep residual network that relies on soft thresholding for the discrimination of radiated noise sources. Hu et al. [
3] introduces the Extreme Learning Machine (ELM) to enhance the model’s generalization capability. In [
4], a technique involving a set of multi-scale convolutional layers for initial processing, coupled with the introduction of an end-to-end recognition network, is outlined.
Moreover, inputs for recognition networks can encompass diverse features like Mel-Frequency Cepstral Coefficients (MFCC), Constant-Q Transform (CQT) features, and bio-inspired features obtained through machine learning algorithms. Shen et al. [
5] utilizes a cochlea model and an auditory center model to decompose acoustic signals and extract features. In [
6], a method involving the utilization of Gamma-tone Frequency Cepstral Coefficients (GFCC) features in conjunction with Modified Empirical Mode Decomposition (MEMD) is applied for multi-dimensional feature extraction, and a feature dimensionality reduction method is proposed. Wang et al. [
7] employs Mel filter banks to extract distinctive features of whale subgroups. In [
8], binary images based on Short-Time Fourier Transform are extracted as features for passive sonar classification. Ferguson et al. [
9] uses cepstral analysis to measure time delays between multipath arrivals, thereby estimating the instantaneous range of the sound source. In [
10], the snake optimizer is harnessed to enhance SloEn optimization, introducing a novel entropy metric termed SO-SloEn (Snake Optimized Slope Entropy). To tackle parameter selection challenges in variational mode decomposition, a pioneering adaptive S-RNS feature extraction technique, integrating Successive Variational Mode Decomposition (SVMD) and SO-SloEn, is presented. In [
11], a feature extraction method reliant on Slope Entropy (SlEn) and a dual feature extraction approach combining SlEn with Permutation Entropy (SlEn&PE) are Introduced. In [
12], an intelligent Underwater Acoustic classification system featuring a Learnable Front-end (UALF) is introduced to enhance automation, showcasing the efficacy of learnable Gabor filters in parameter extraction. Various feature extraction methods continue to emerge, but most of them use one-dimensional or two-dimensional features for underwater target classification. This paper attempts to combine multi-type and multi-dimensional features to ensure the network obtains comprehensive classification information. In particular, we propose an SRCA-Net network to adapt to the classification task with multi-dimensional features. The main contributions of this paper are as follows:
A method for selecting and fusing multidimensional features is developed that uses visualisation techniques to quantify the importance of each feature dimension in a classification task, thus filtering out redundant features.
The proposed SRCA-Net combines Sub-regional feature enhancement and Multi-activation channel aggregation modules. In addition, asymmetric cross-entropy loss is employed to enhance the classification of difficult samples, thus improving the accuracy.
We propose and experimentally validate a novel method for classifying ship radiated noise, demonstrating the highest recognition accuracy, to the best of our knowledge, on the DeepShip dataset.
Structure of the Paper: The rest of the chapters are organized as follows.
Section 2 reviews related work.
Section 3 presents the proposed method, including feature selection based on visualization analysis, a Sub-regional Feature Enhancement module, a Multi-activated Channel Aggregation module, and Asymmetric Cross Entropy Loss.
Section 4 discusses ablation studies and comparative experiments. The conclusion is presented in
Section 5.
2. Related Work
Ship Radiated Noise (SRN) perception is impacted by variables like ocean environmental noise, target distance, target noise level, and target motion state, which exhibit considerable variability. To enhance feature extraction from constrained radiated noise datasets, various studies have introduced methods to optimize, fuse, and select features.
Lu et al. [
13] input the optimized DEMON spectrogram into a CNN network to learn hydrophone array signals for fundamental frequency feature detection of sound sources. Song et al. [
14] introduced a machine learning-driven underwater noise classification technique that derives five underwater noise features (the 1/3 octave noise spectrum level (NL), time–frequency spectrum, power spectral density (PSD), Mel-frequency cepstral coefficient, and Mel filter bank energy) across three domains (frequency, time–frequency, and Mel transform domains). Based on PCA and CCA analysis methods, Ke et al. [
15] proposed a two-dimensional feature fusion method to reduce the redundancy of the fused features.
A new feature optimization method was proposed in [
16] to minimize an objective function targeted at augmenting inter-class disparities and diminishing intra-class feature proximity for ship type classification. In [
17], a deep convolutional neural network model with the ability to perceive timbre was introduced. This model selectively boosts the signal energy of radiated noise line spectra and extracts consistent line spectrum features. The correlation perception method, which could extract correlation features from multi-attribute labels and deep time-frequency representations by a group of learnable weights, was proposed in [
18].
In [
19], Log Mel, MFCC, and features optimized through Center loss were amalgamated. Yuan et al. [
20] introduced a multimodal recognition approach employing images and SRN as inputs. Luo et al. [
21] utilized a multi-window spectral analysis technique to concurrently extract diverse signal features. In [
22], a GRU-CAE collaborative deep learning network was suggested to extract collaborative features encompassing spectral spatial information and spectral temporal structure features, showcasing notable class separability.
In [
23], an enhanced variational mode decomposition-based hybrid feature extraction scheme for SRN signals incorporating normalized maximum information coefficient and permutation entropy was introduced. Fernandes et al. [
24] presented a genetic algorithm for feature selection from MFCC, linear predictive coding, and gamma-tone cepstral coefficients. Additionally, in [
25], a DES-Pat feature selector tailored for propeller recognition was proposed, optimizing features for decision trees, k-nearest neighbors, and support vector machines. Zhu et al. [
26] proposed an underwater noise classification method based on spectral segmentation, demonstrating that multi-band spectrograms have better classification performance than a single spectrogram.
The aforementioned works on feature extraction, feature selection, and feature fusion have transformed underwater target classification methods. On one hand, they have moved from single-dimensional features to multi-dimensional features and proposed methods to fuse them; on the other hand, they have replaced traditional shallow classifiers with deep learning methods that can adapt to specific classification tasks. These works inspire us to acquire higher dimensional features and explore how to build a comprehensive and non-redundant information network.
By extracting various spectral features from SRN, including Mel spectrogram, CQT, IIRT, Chroma STFT, Tonnetz, MFCC, Spectral Contrast, and STFT, then using operator-guided visualization methods to screen suitable spectrograms, we can eliminate those that have little impact on classification results. This approach reduces the number of input spectrograms while retaining the best classification performance. Subsequent experiments have demonstrated the effectiveness of this method, providing a visual basis for the selection of acoustic features. Compared to previous works, this method better utilizes the information contained in SRN and has been shown to outperform existing models on the public dataset DeepShip.
3. Methodology
This section primarily presents the SRCA-Net method proposed in this paper. We employ a feature visualization technique based on Grad-CAM [
27] for feature selection. Subsequently, we introduce the Sub-regional Feature Enhancement module and the multi-activation function channel aggregation module of SRCA-Net, along with the Asymmetric Cross Entropy Loss.
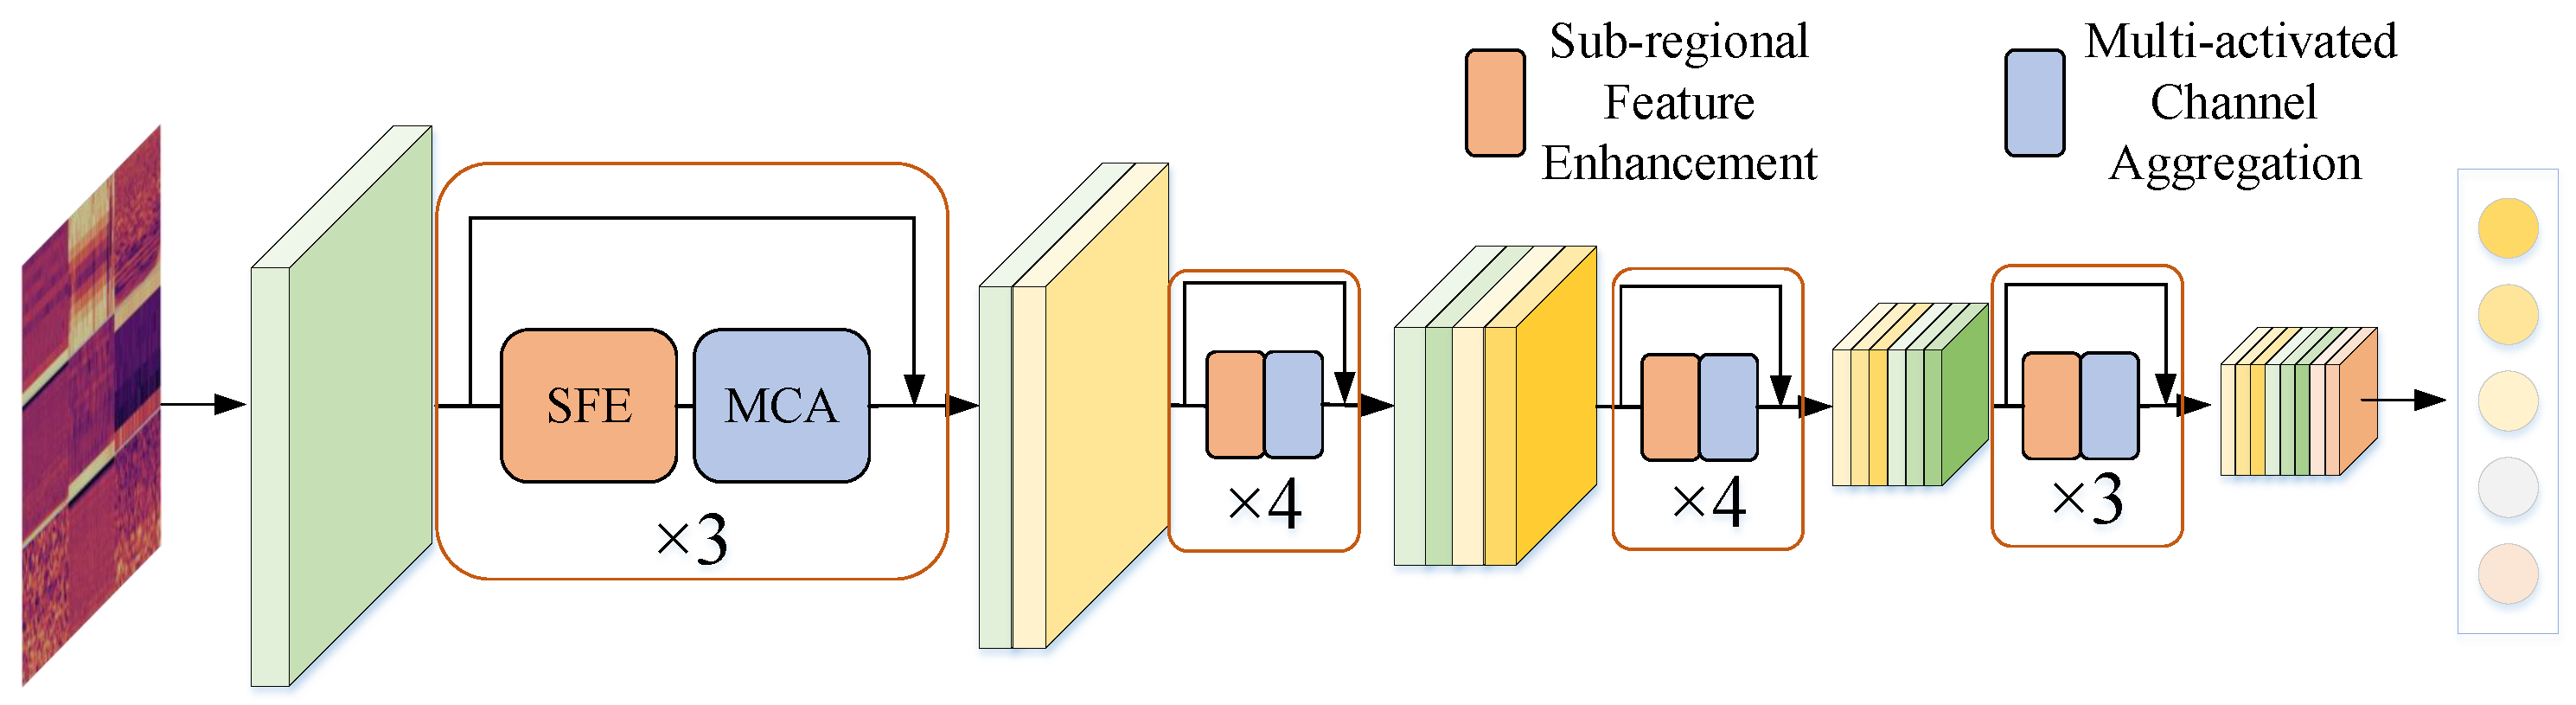
3.1. Structure of SRCA-Net
We propose a Multi-dimensional Feature Aggregation-based Ship Radiated Noise Classification Method: First, 12 features are extracted from 3-second long ship radiated noise samples, including time-domain waveform features, spectral analysis features, time-frequency analysis features, and auditory parameter features. Redundant features are then filtered out using visualization methods, and the remaining 9 features are fused as inputs to the neural network.
Our network, denoted as Sub-Regional Channel Aggregation Net (SRCA-Net), is depicted in
Figure 1. It comprises four blocks, each containing 3, 4, 4, 3 bottlenecks, totaling 14 residual modules and a classification layer. Each residual module incorporates a Sub-regional Feature Enhancement module and a Multi-activated Channel Aggregation module. The network takes feature maps extracted from ship radiated noise as input and enhances the interaction of information flow through dense residual connections.
In each residual module, sub-regional feature enhancement is first applied. This involves enriching spatial detail through independent convolution operations across different channels, ensuring that positional information is retained while enhancing feature details. This is crucial for passive classification tasks where positional information of ships is significant. The module includes grouped convolutions and a process of merging feature maps to enhance the effective classification information in spectrograms.
Following this, the Multi-activated Channel Aggregation module selectively emphasizes the contributions of different feature maps. This is achieved by converting the importance of feature channels into learnable parameters, which are then used to update each channel, thereby recalibrating the feature maps.
Throughout the residual connection process, the size of the feature maps progressively decreases while the number of channels increases. Finally, a classifier, consisting of an average pooling layer and a fully connected layer, produces the final classification result.
3.2. Feature Extraction Based on Spectrum Component Analysis
Several types of features commonly used in neural network identification of radiated noise from ships are as follows:
Time-Domain Spectral Feature Parameters
For example, zero-crossing wavelength, peak-to-peak value, waveform area, Chroma Energy Normalized Spectrogram (Chroma CENS) [
28], spectral contrast [
29].
Spectral Analysis Feature Parameters
Frequency line spectrum features (line spectra), Low Frequency Analysis and Recording spectrogram (LOFAR), Detection of Envelope Modulation on Noise spectrogram (DEMON), High-Order Spectrum Analysis (HOSA), Tonal Centroid [
30], and chroma spectrogram [
31].
Time-Frequency Analysis Feature Parameters
Short-Time Fourier Transform (STFT) [
32], Wigner-Ville Distribution, Wavelet Transform (WT), Hilbert-Huang Transform (HHT), Empirical Mode Decomposition (EMD) and its variants, IIR filters Time-Frequency (IIRT) [
33].
Auditory Feature Extraction
Linear Prediction Coefficient (LPC), Linear Predictive Cepstrum Coefficient (LPCC), Perceptual Linear Prediction (PLP), Mel Frequency Cepstrum Coefficient (MFCC) [
34], Constant-Q Transform (CQT) [
35], and Mel-spectrogram [
36].
Chromatograms visually represent time-varying audio signals, facilitating the extraction of individual tone pitches over time. Chroma CENS enhances signal robustness by normalizing chromatogram energy values, mitigating volume and timbre fluctuations. Spectral contrast evaluates signal variation by comparing peak and valley energies in spectrogram frames, with high values indicating clear narrowband signals and low values suggesting broadband noise.
Tonal Centroid detects shifts in audio harmonic content by integrating an equal-tempered pitch model with DSP for data extraction from digital recordings. Pitch collections are projected as Tonal Centroid points in a 6-D space within the pitch space model. Chroma spectrum, a specialized chromagram variant, employs short-time Fourier transform algorithms to extract frequency data over time in audio signals. Tone pitch estimation algorithms determine pitch values for individual time frames.
The short-time Fourier transform (STFT) dissects the source audio signal into spectral components per time frame to analyze the signal’s frequency distribution over time. The IIRT spectrogram represents the signal’s time-frequency profile using a multistage filter bank comprising infinite impulse response filters.
The Constant Q Transform (CQT) utilizes filters with exponentially spaced center frequencies and varying bandwidths, maintaining a constant center frequency-to-bandwidth ratio (Q). In CQT, the frequency axis is logarithmic (base 2), and the filter window length adjusts based on spectral line frequencies. Mel-Spectrograms map standard spectrogram frequencies to Mel scales by applying Mel Scale filters to spectral data, capturing energy within specific Mel Scale bands using triangular filters. Mel-scaled Frequency Cepstral Coefficients (MFCC) are cepstral features derived in the Mel-scaled frequency domain. MFCC extraction involves computing a spectrogram, applying Mel Scale filters, and capturing signal energy within Mel Scale bands.
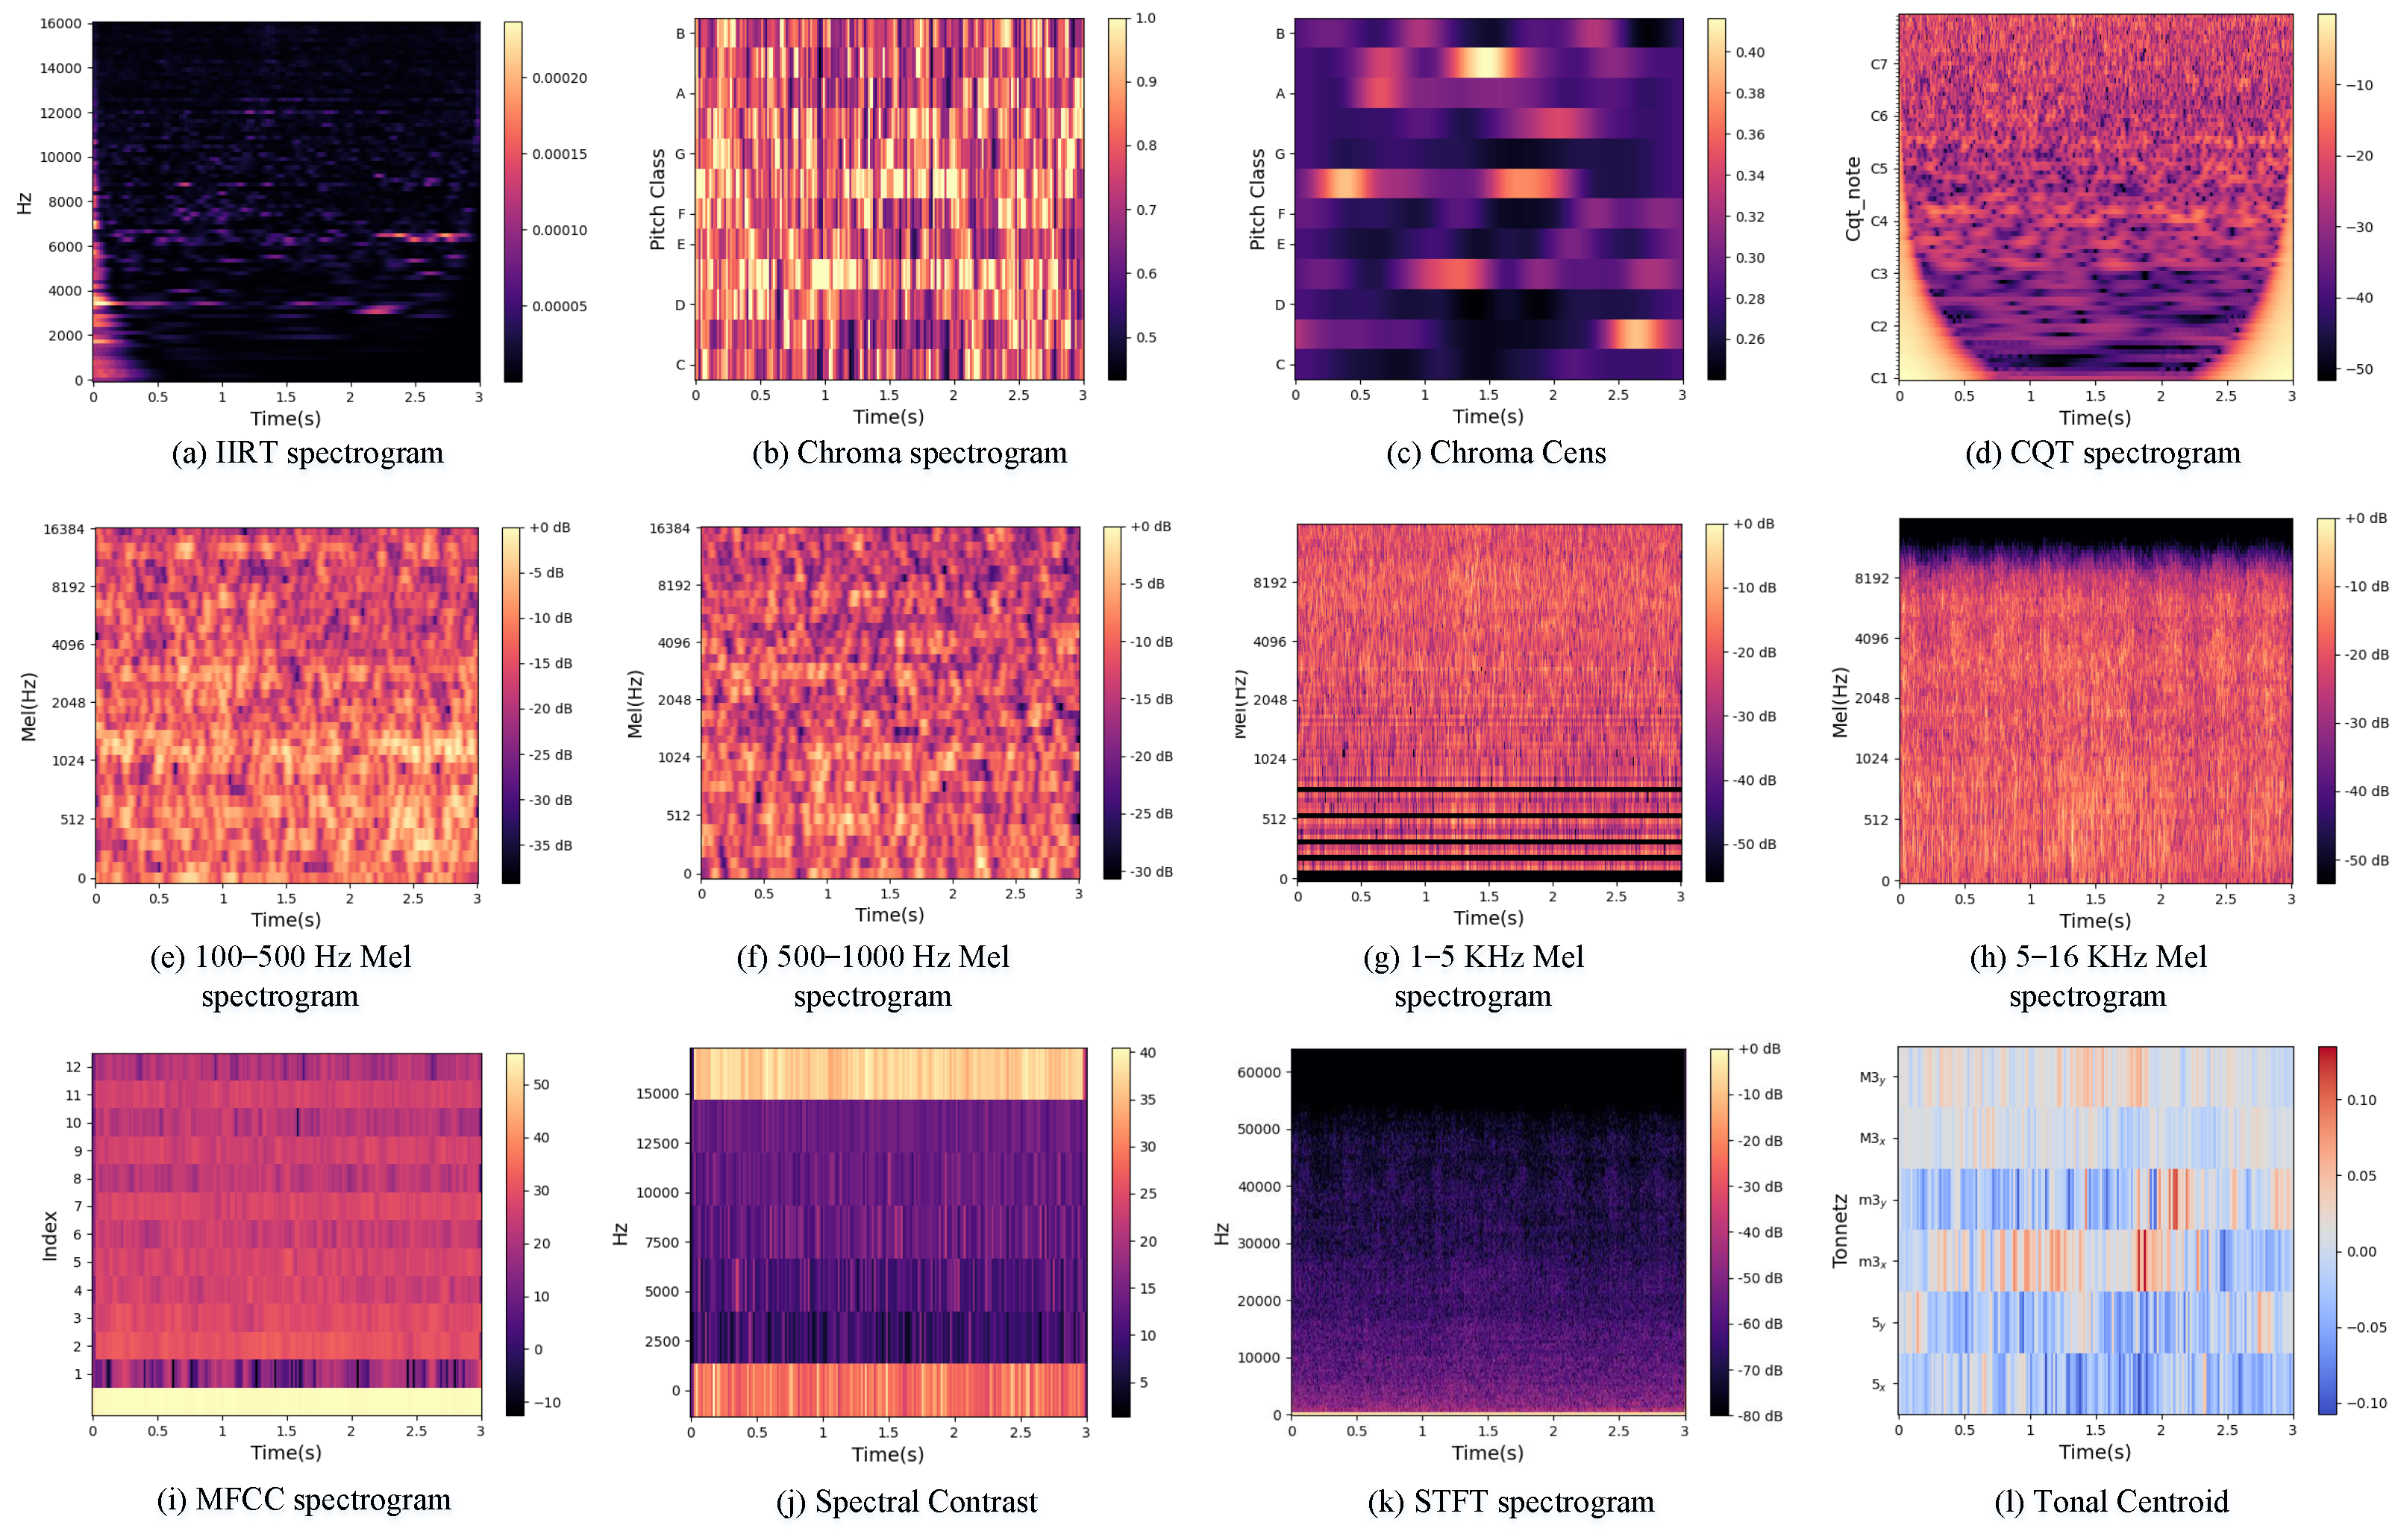
The extracted features must ensure the completeness of our feature space by incorporating all four categories of features while considering the high accuracy of auditory perception features in SRN recognition tasks. Ultimately, we selected the following features: Mel-spectrogram (1–100, 100–500, 500–1000, 1k–16k Hz), MFCC spectrogram, IIRT spectrogram, Chroma spectrogram, Chroma CENS, Spectral contrast, CQT spectrogram, STFT spectrogram, and Tonal centroid. Inspired by Paper [
26], we divide the Mel-spectrogram into four bands. These features encompass commonly used time-domain waveform features, spectral analysis features, time-frequency analysis features, and auditory features. The results of transforming each feature into a two-dimensional image are shown in
Figure 2.
Experiments demonstrated that unsuitable feature combinations increase network training time while reducing detection performance. Therefore, feature selection is necessary. This study proposes a visualisation method to eliminate the redundancy of classification information. Here is a specific example:
We employed two combinations of features. The first combination, named ours, includes: CQT spectrogram, Mel-spectrogram (1–100, 100–500, 500–1000, 1k–16k Hz), MFCC spectrogram, Chroma spectrogram, spectral contrast, and tonal centroid. The second combination, named “with STFT”, replaces the tonal centroid with the STFT spectrogram. These nine feature maps were stitched together and used as inputs to the network. The Grad-cam [
27] method was then used to visualise the neural network prediction process. Given an image and a category of interest, the Grad-cam method plots the importance weights of each position when that image is classified into a category, and the results are shown in
Figure 3.
Using the Grad-CAM outcomes, we quantified the classification impact of each feature map within a specific category. By averaging these impacts across the five categories, an average classification efficiency was calculated. This average efficiency offers valuable insights into the overall significance of the image in the classification process. The average classification efficiencies of the nine feature maps, arranged in the order of their input listing, are presented in
Table 1. The findings reveal that in the second combination, the average classification efficacy of the STFT spectrogram stands at 8.67%, indicating minimal influence on neural network classification. Consequently, the STFT features were dismissed in favor of tonal centroid features, exhibiting an average efficacy of 9.83%.
For similar reasons, the STFT spectrogram and Chroma CENS are also excluded. The remaining features are then combined to serve as the input for the neural network.
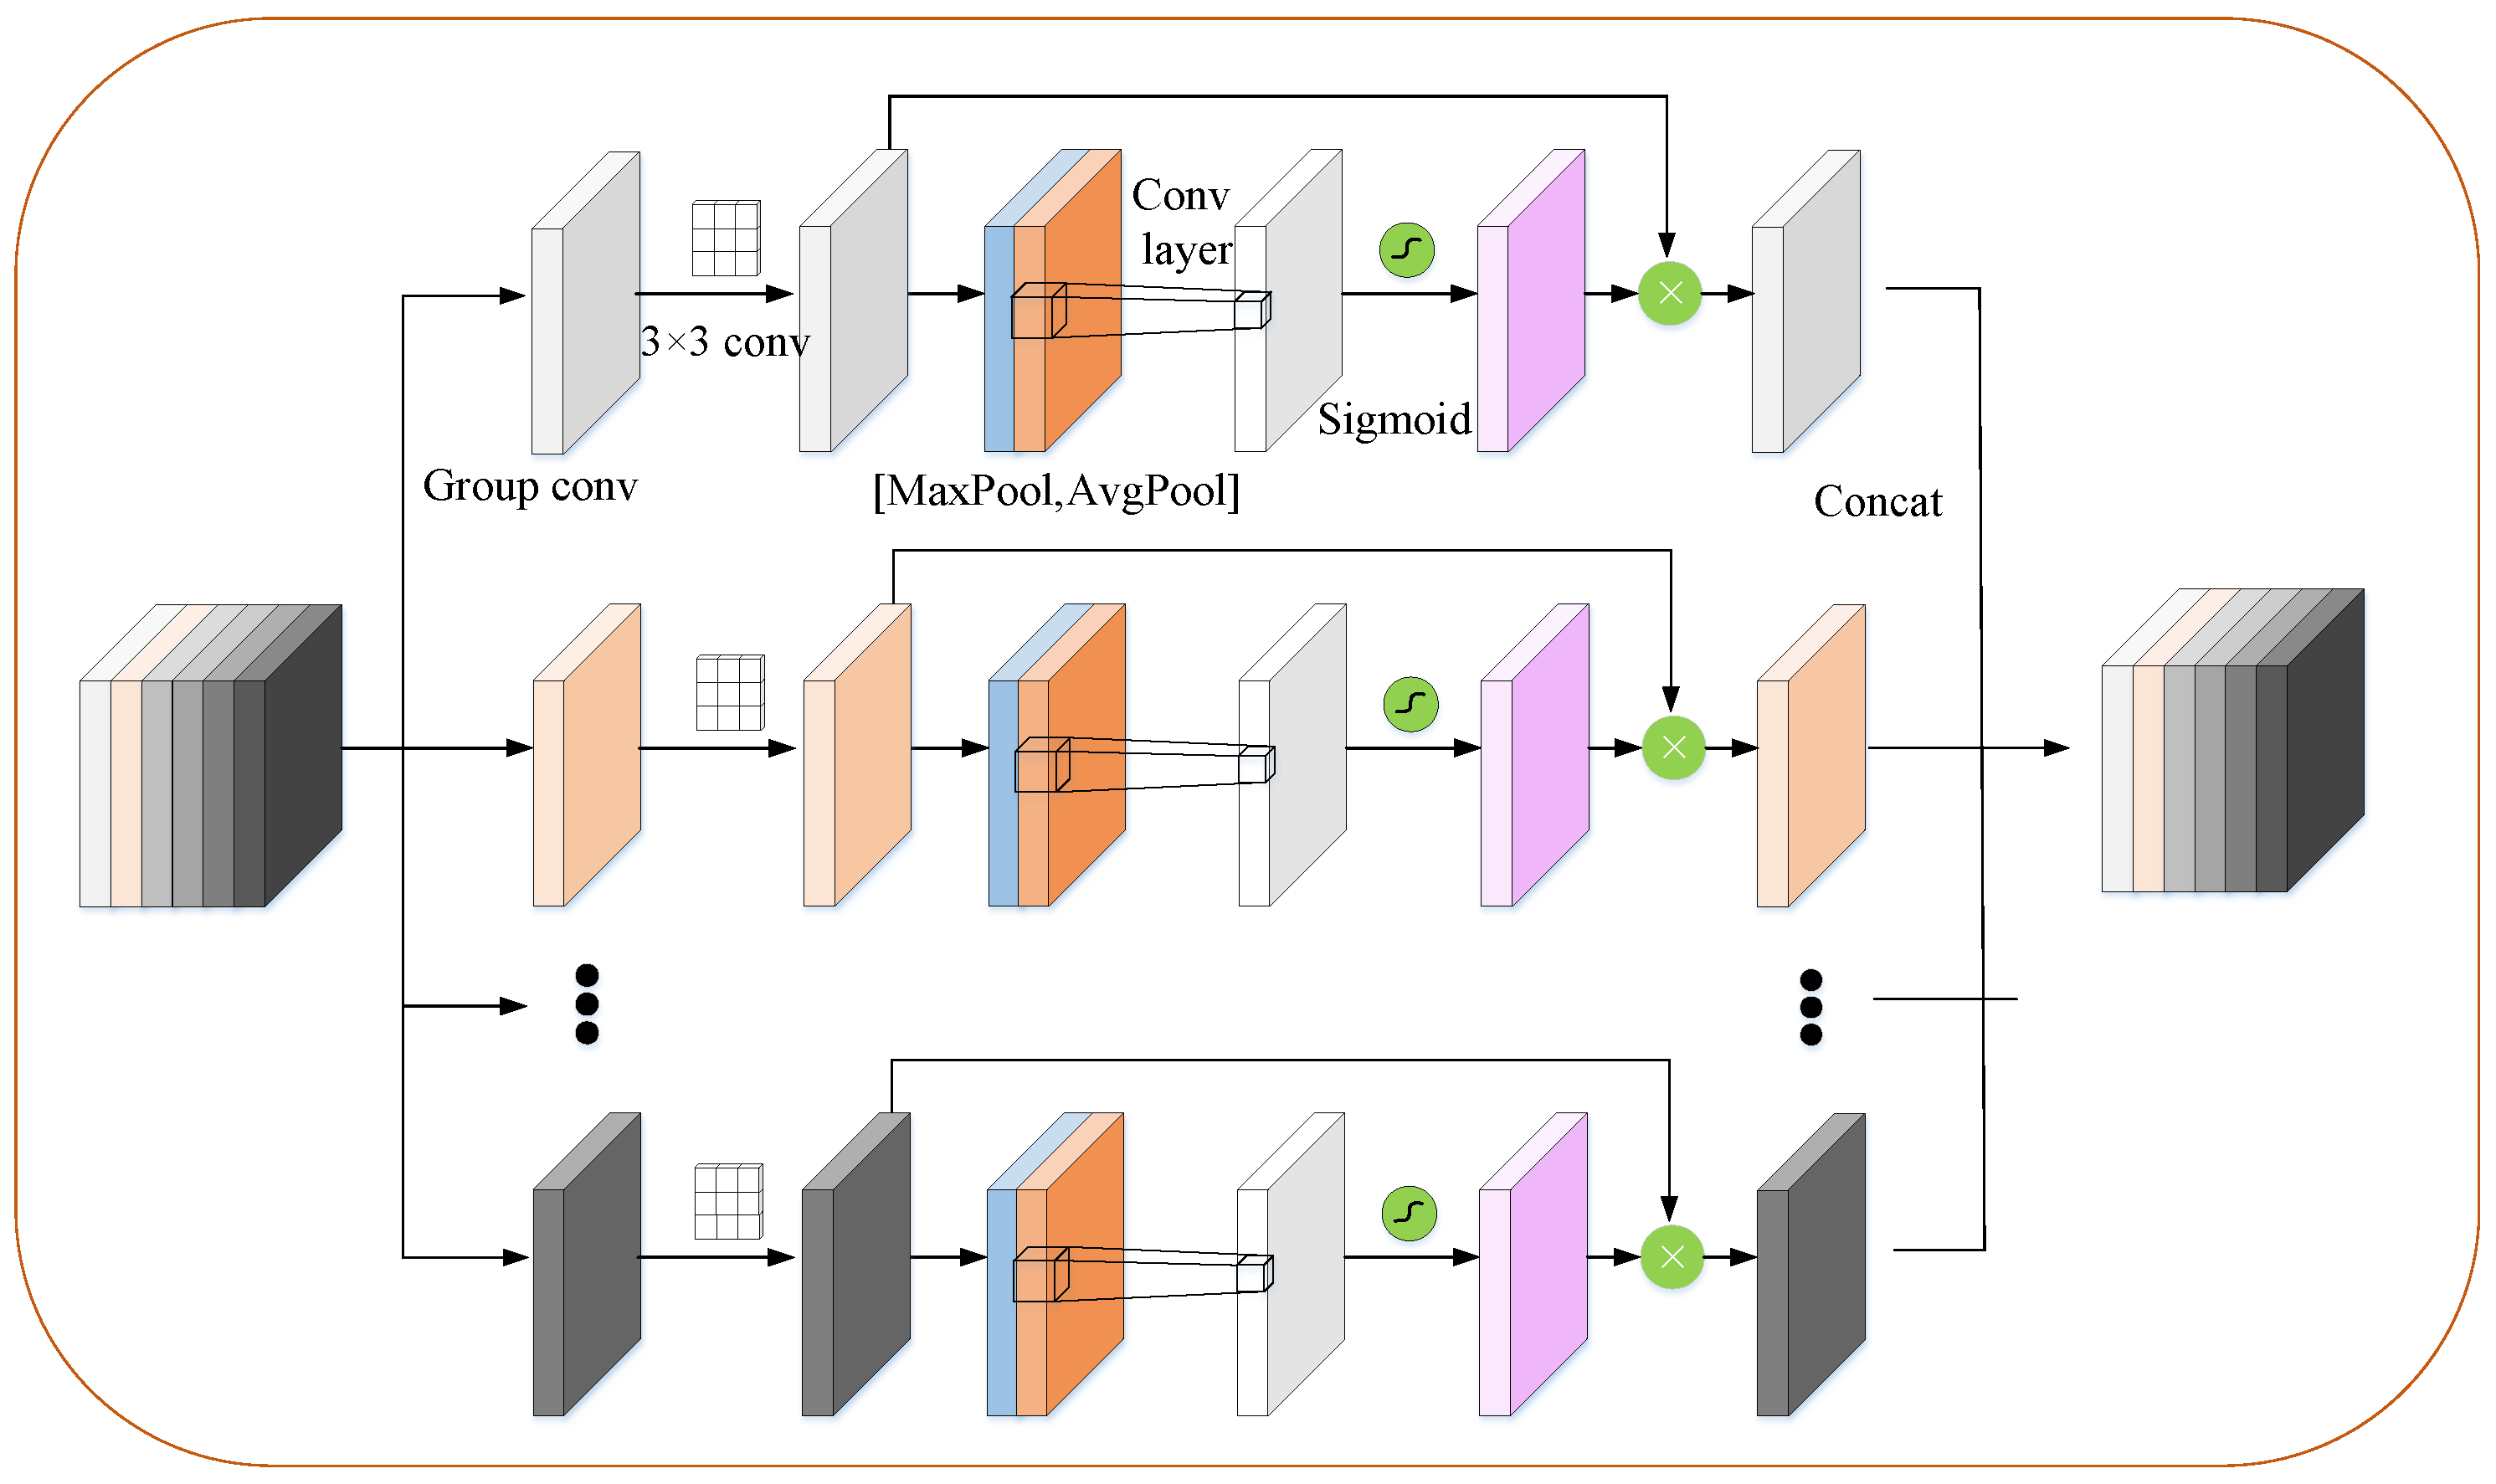
3.3. Sub-Regional Feature Enhancement
Generally, detailed spatial information enriches feature representation, laying a sturdy groundwork for feature mapping in high-level spatial regions. Therefore, a Sub-regional Feature Enhancement module is utilized to capture these intricate spatial details.
As illustrated in
Figure 4, the feature map
is divided into 32 groups along the channel axis, represented as:
Within each group, a 3 × 3 convolution is applied to extract local features, with the kernel size indicating that the network focuses on adjacent features. Following this, average pooling and max pooling operations are conducted along the channel axis. The resultant pooled features are concatenated to construct a powerful feature descriptor.
Figure 4.
Sub-regional Feature Enhancement module schematic.
Figure 4.
Sub-regional Feature Enhancement module schematic.
The application of pooling operations along the channel axis can effectively highlight informative regions. Following this, a convolutional layer is applied to the concatenated feature descriptor to produce an enhanced representation map, , which encodes regions to emphasize or suppress. The enhanced representation map is then element-wise multiplied with the original feature map and broadcasted across all spatial dimensions. Finally, the groups are aggregated along the channel axis, completing the Sub-regional Feature Enhancement process.
Channel information of a feature map is aggregated through two pooling operations, generating two 2D maps:
and
These maps represent average-pooled and max-pooled features across the channel, respectively. These maps are concatenated and convolved by a standard convolution layer, producing the enhanced representation map. In summary, the final sub-regional enhanced feature is computed as follows:
where
represents the feature map after the Sub-regional Feature Enhancement operation,
,
denotes the sigmoid function,
represents a convolution operation with a filter size of 7 × 7, ⊗ denotes element-wise multiplication, and
represents the reassembled feature map in the original grouping order.
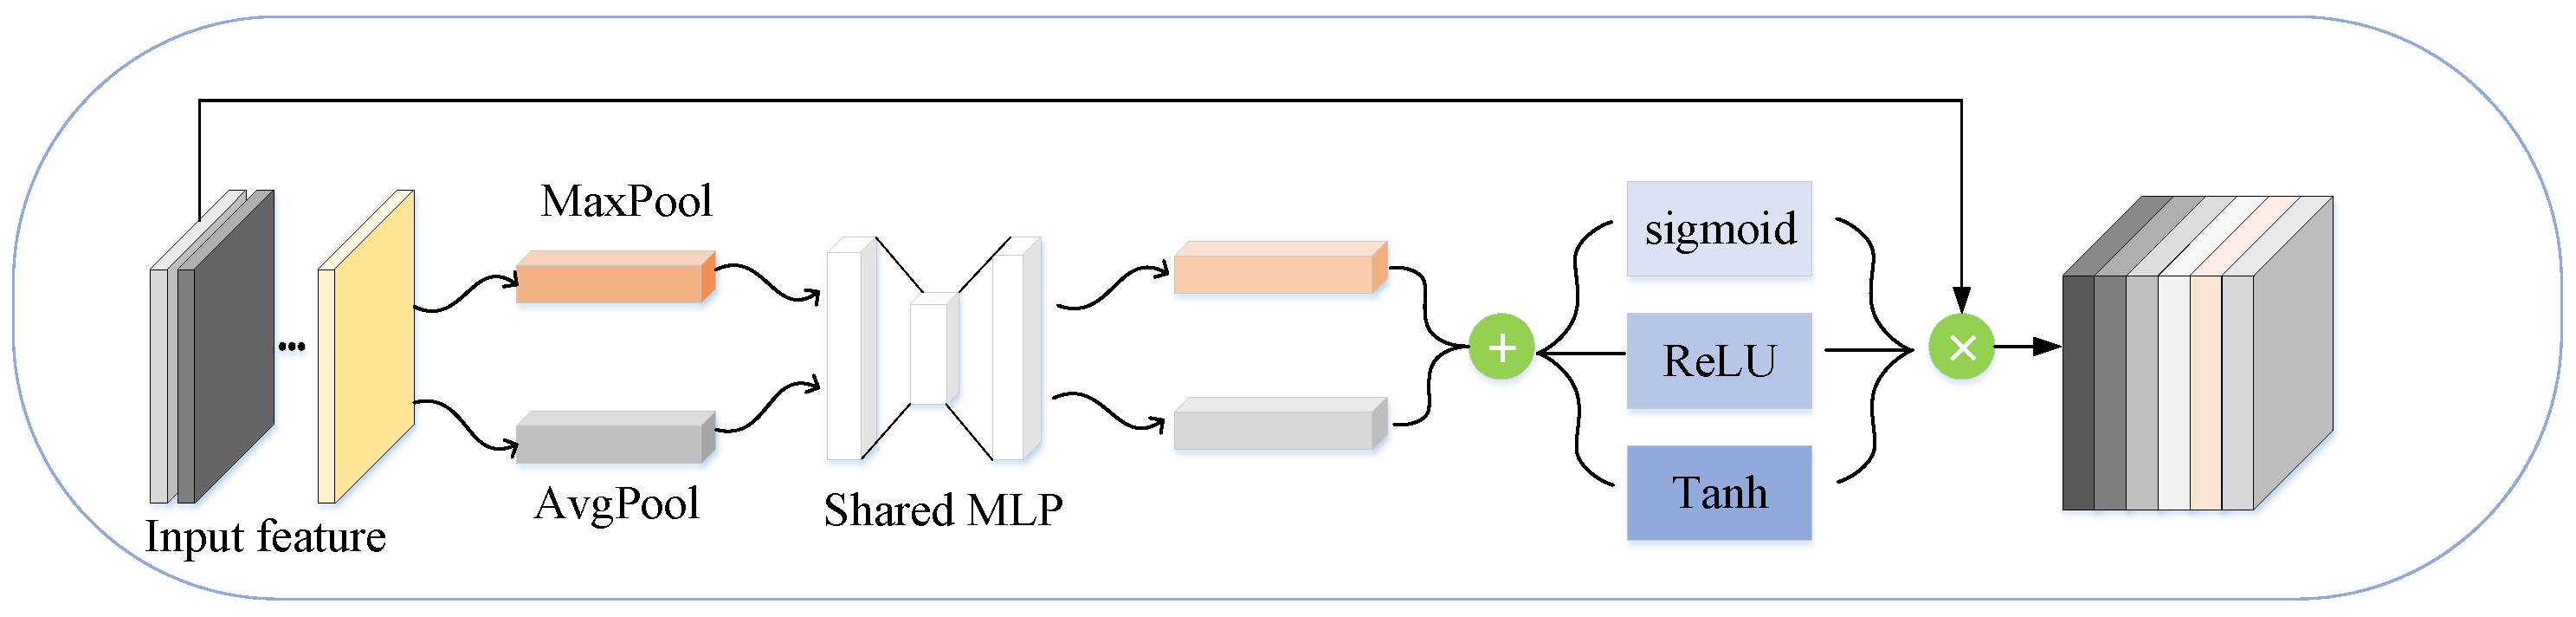
3.4. Muti-Activated Channel Aggregation
As shown in
Figure 5, Spatial information of a feature map is initially aggregated using both average pooling and max-pooling operations, resulting in two distinct spatial context descriptors:
(average-pooled features) and
(max-pooled features). These descriptors are then processed through a shared network to generate the channel aggregation map
. The shared network consists of a multi-layer perceptron (MLP) with a single hidden layer. To minimize parameter overhead, the hidden layer’s activation size is set to
, where
r represents the reduction ratio. Following the application of the shared network to each descriptor, the output feature vectors are combined via element-wise summation. Additionally, three different activation functions are introduced post-channel attention to extract diverse responses. The multi-activated channel attention module employs the Sigmoid, Leaky ReLU, and Tanh activation functions. Each activation function’s resultant feature weights are multiplied by their corresponding channels, and the resulting channel weights are further multiplied with the input feature map. By incorporating multiple activation functions, various attention weight groups are obtained. These weighted feature maps are then concatenated to create a rich feature representation.
In summary, the multi-activated channel aggregation is computed as follows:
The
represents the weighted sum of the outputs from the multi-layer perceptron applied to the pooled features, modulated by different activation functions, where
represents the average-pooled feature map,
represents the max-pooled feature map,
and
denote the output of the multi-layer perceptron applied to the average-pooled and max-pooled feature maps respectively,
represents the
i-th activation function (Sigmoid, Leaky ReLU, or Tanh), and
represents the weights corresponding to the
i-th activation function.
3.5. Asymmetric Cross Entropy Loss
The confusion matrix reveals the imbalance between hard-to- classify samples (Hard Examples) and easy-to-classify samples (Easy Examples). Concurrently, feature heatmaps illustrate the imbalance between line spectra and background, indicating that the proportion of important information is relatively low within the entire image. To improve the training process of the network, this paper introduces Asymmetric Cross Entropy Loss. Asymmetric Cross Entropy Loss loss aims to address the extreme imbalance between foreground and background classes (e.g., 1:1000) during training in single-stage object detection scenarios.
In multi-class classification tasks, cross-entropy loss is often used as the loss function. For
N samples input into a classifier with
j classes, the loss [
37] for a particular sample
x belonging to one class is defined as:
The total loss for all
N samples is obtained by summing or averaging these individual losses:
To address the imbalance between hard-to-classify samples (Hard Examples) and easy-to-classify samples (Easy Examples), we modify the above expression to:
where
is defined as:
Referencing the definition of information entropy, the logarithm is taken to base 2. Here,
represents the loss of sample
x for class
. In single classification tasks, this is calculated only for the correct class. The term
denotes the raw score output by the model for classifying sample
x into class
. The parameter
represents the class-related weight, which can be adjusted to increase the proportion of the loss for hard-to-classify classes in the total loss function, thus making the network focus more on difficult tasks. The parameter
represents the sample-related weight, which can be adjusted to increase the loss weight for hard-to-classify samples, thereby decreasing the loss for easy examples and relatively increasing the loss for hard examples. The larger the value of
, the more the loss for easy examples is suppressed. The total loss for all samples is given by Formula (5).
represents a proportional function that increases monotonically with
, and requires the value to be constant positive. Inspired by the expression of information entropy, we let
throughout the experiment. Based on our experience, throughout the entire experimental process,
was consistently set to 0.75.
4. Experiment and Discussion
In this section, details regarding the datasets, implementation procedures, and evaluation metrics are provided. Subsequently, a series of ablation experiments are conducted to assess performance. The proposed method is then compared with other ship radiation noise classification methods. Finally, an analysis of the classification performance of our approach is presented.
4.1. Implementation Details
The experimental data leverages the publicly available DeepShip dataset, comprising 609 instances of ship radiated noise (SRN), distributed as follows: 240 from tankers, 69 from tugs, 191 from passenger ships, and 109 from cargo ships. Each record spans several minutes, accumulating to around 47 h and 13 min in total. The SRN is sampled at 32 kHz, with all recordings being monophonic.
The data in this paper is divided in the same way as in [
26]. Marine environmental background noise, totaling 7 h and 52 min, is added to the dataset. Each record is segmented into 3-second samples. To ensure prediction accuracy, segments from the same radiated noise do not appear simultaneously in both the training and testing datasets. This results in 137,369 training samples and 58,567 testing samples, with the training set containing 117,734 radiated noise samples and 19,635 background noise samples, and the test set containing 50,434 radiated noise samples and 8133 background noise samples. See
https://github.com/ZhuPengsen/ (accessed on 1 October 2024) Dataset-segmentation for a detailed delineation.
The sampling rate is defined as 32 kHz, with a frame shift of 1 second. The shape of the input radiated noise is 1 × 96,000. Following feature extraction, the features are stored as 112 × 112 images. Post feature extraction, all images are standardized using a mean of [0.80, 0.46, 0.55] and a standard deviation of [0.23, 0.31, 0.24].
The evaluation metrics employed to assess the performance of each method across all experiments include recognition accuracy, macro precision, macro recall, and macro F1-score. The experimental setup utilized in this study involves a server equipped with an NVIDIA RTX 2080 Ti graphics card, possessing 12 GB of on-board memory. The GPU attains a single-precision floating-point computing capability of up to 13.45 TFLOPS.
The proposed method is implemented using the PyTorch 1.8.0 framework. The Adamax optimizer is utilized, which integrates a learning rate cap derived from the Adam optimizer. The optimizer parameters are set as follows: learning rate , , and epsilon . A batch size of 32 is selected, and training is performed for 100 epochs. To identify the optimal model, validation of the model is conducted at the end of each epoch using a validation set.
4.2. Evaluation Metrics
This section outlines the evaluation metrics used for performance assessment in classification tasks. Commonly adopted metrics include recall, precision, accuracy, and F1-score, each defined as follows:
Recall represents the ratio of true positive samples correctly identified to the total number of actual positive samples.
Precision is the ratio of true positive samples correctly identified to the total number of samples predicted as positive.
Accuracy serves as a fundamental metric, reflecting the overall effectiveness of the model by quantifying the ratio of samples correctly identified to the total number of samples in the dataset. The mathematical formulation is represented in Equation (
8):
In this context, (TP) denotes true positives, (TN) represents true negatives, (FP) indicates false positives, and (FN) refers to false negatives. The F1-score serves as a composite metric that evaluates both recall and precision. It is calculated using the following formula [
12]:
where “Recall” refers to the recall metric and “Precision” signifies the precision metric.
For multiclass tasks, the macro-precision, recall, and F1 score are the average of the precision, recall, and F1 score for each individual classification task. All references to precision, recall and F1 score in the following text refer to macro-precision, macro-recall and macro-F1 score.
4.3. Ablation Study
To validate the effectiveness of the SFE and MCA modules within the network architecture, four networks were configured for comparison: ResNet50 (which excludes both modules), a variant without the SFE module named MCANet, a version without the MCA module named SFENet, and our model retaining both modules. All other experimental settings remained consistent across these configurations. The experimental results are summarized in
Table 2.
As evident from the
Table 2, the accuracy decreased by 1.2% upon removal of the SFE module and by 0.87% following the exclusion of the MCA module. Incorporating the SFE or MCA modules into the baseline network resulted in an increase of 1.4% and 1.73% in accuracy, respectively. Additionally, there were varying degrees of enhancement in macro recall, macro precision, and macro F1 score. These findings corroborate the efficacy of the proposed network structure.
4.4. Experiment for Asymmetric Cross Entropy Loss
To validate the effectiveness of our loss function, ablation experiments were conducted to compare scenarios using a standard cross entropy loss with cases employing Asymmetric Cross Entropy Loss (with varying values of
. The results are presented in
Table 3.
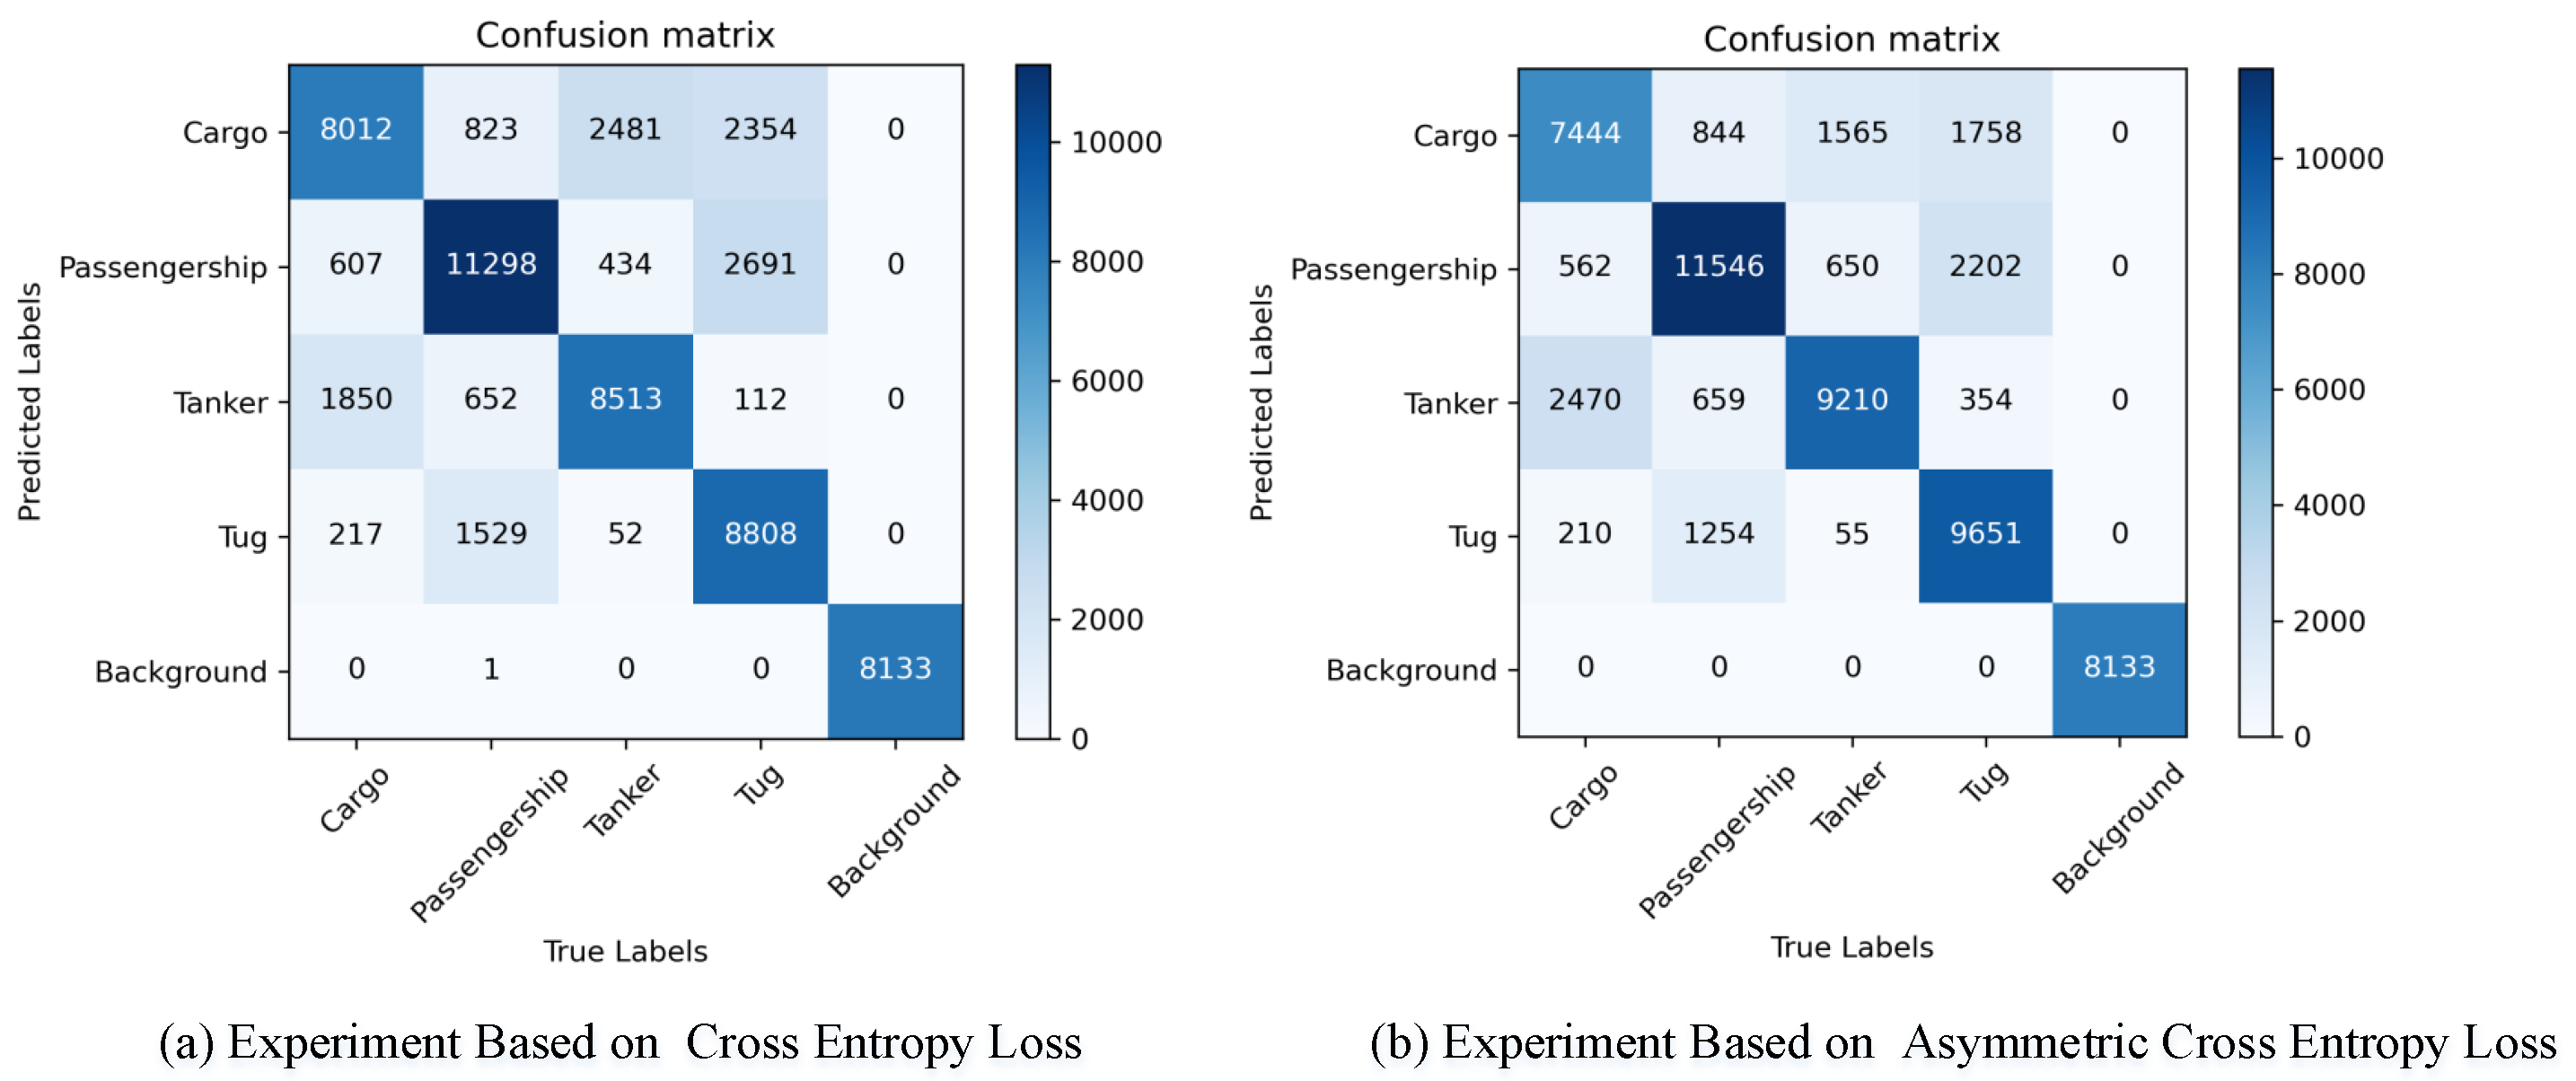
The confusion matrices for both approaches are illustrated in
Figure 6. It is evident that identifying the presence of a ship is relatively straightforward, whereas classification poses greater challenges. It is worth noting that the misclassification rates for the tug and passenger ship categories are significantly higher, and the number of samples identified incorrectly is significantly lower when using asymmetric cross entropy loss. The results of the comparative experiments are illustrated in
Table 3, showcasing an overall improvement across various metrics when employing asymmetric cross-entropy loss compared to traditional cross-entropy loss. Moreover, distinct
values led to noticeable differences in macro-level metrics. Notably, with
set to 3, the network achieved its highest accuracy at 78.52%, alongside peak values for macro recall, macro precision, and macro F1 score. The experimental results confirm the effectiveness of utilizing the Asymmetric Cross-Entropy Loss.
4.5. Experiment for Spectrum Component Analysis
To validate the effectiveness of visual feature screening methods, several scenarios were designed for comparison. “Ours Mixed Feature” refers to the feature fusion method ultimately employed in our approach. “With IIRT” denotes the modification of the Tonal Centroid spectrogram to an IIRT spectrogram; “With Chroma Cens” indicates the alteration of the Tonal Centroid spectrogram to a Chroma Cens representation; and “With STFT” represents the conversion of the Tonal Centroid spectrogram to an STFT spectrogram.
The results as shown in
Table 4 demonstrate that our selection method achieved the highest accuracy as well as superior macro-level metrics, confirming the effectiveness of the feature visualization-based selection and fusion approach.
4.6. Comparative Experiments
To ensure a fair evaluation of our method’s performance, we re-implemented all comparison methods, except for SNANet and ECAPA-TDNN, under the same preprocessing, sample partitioning, and feature fusion conditions. Additionally, multiple ablation experiments were conducted to validate the effectiveness of our approach.
We compared our method against commonly used neural network models. It is important to note that SNANet and ECAPA-TDNN [
38] utilizes metrics provided in [
26]; while these methods employ the same preprocessing and sample partitioning as ours, the input features differ. The quantitative results are presented in
Table 5.
Compared to the SCAE [
39] method provided by the DeepShip dataset, SRCA-Net demonstrated a 6.31% increase in accuracy. In comparison to the state-of-the-art ConvNeXt [
40] method in the field of image target recognition, there was a 2.41% accuracy improvement. Furthermore, in contrast to the currently best-known ship radiated noise identification method, SNANet, SRCA-Net achieved a 0.27% accuracy enhancement, along with 0.5% and 0.55% boosts in macro precision and macro recall, respectively. SRCA-Net achieved the highest accuracy and F1-score, demonstrating its effectiveness.
5. Conclusions
In this paper, we propose the SRCA-Net for underwater acoustic target recognition. By introducing a multi-dimensional feature selection and fusion method, we effectively eliminate feature redundancy through visualization techniques, quantifying each feature’s importance in classification tasks. The SRCA-Net, equipped with Sub-Regional Feature Enhancement and Multi-activated Channel Aggregation modules, alongside an Asymmetric Cross Entropy loss function, is tailored to meet the specific demands of ship classification. The experimental results demonstrate that the accuracy of the proposed method is notably high. This observation underscores that utilizing higher-dimensional feature inputs and directing the network’s attention towards local features can significantly enhance classification accuracy.
The effectiveness of our approach is validated through comprehensive comparative and ablation experiments. The results demonstrate that our algorithm significantly outperforms existing models in recognition accuracy on the public DeepShip dataset, achieving 78.52% accuracy, 80.05% precision, and 79.43% recall.
Future research efforts will focus on learnable feature extraction and fusion techniques, while improving the network structure to focus on effective classification information.
Author Contributions
Z.Z.: Conceptualization of this study, Methodology, Software, Data curation, Writing—Original draft preparation. P.L.: Article Ideas, Experimental Environment, Writing Guidelines. All authors have read and agreed to the published version of the manuscript.
Funding
This work was supported in part by Innovation Promotion Association, Chinese Academy of Sciences under Grant 2022022, in part by South China Sea Nova project of Hainan Province under Grant NHXXRCXM202340, and in part by Hainan Provincial Natural Science Foundation of China under Grant 424QN340.
Institutional Review Board Statement
Not applicable.
Informed Consent Statement
Not applicable.
Data Availability Statement
The data presented in this study are available on request from the corresponding author.
Conflicts of Interest
The authors declare that they have no known competing financial interests or personal relationships that could have appeared to influence the work reported in this paper.
References
- Doan, V.S.; Huynh-The, T.; Kim, D.S. Underwater acoustic target classification based on dense convolutional neural network. IEEE Geosci. Remote Sens. Lett. 2020, 19, 1500905. [Google Scholar] [CrossRef]
- Tian, S.; Chen, D.; Wang, H.; Liu, J. Deep convolution stack for waveform in underwater acoustic target recognition. Sci. Rep. 2021, 11, 9614. [Google Scholar] [CrossRef] [PubMed]
- Hu, G.; Wang, K.; Peng, Y.; Qiu, M.; Shi, J.; Liu, L. Deep learning methods for underwater target feature extraction and recognition. Comput. Intell. Neurosci. 2018, 2018, 1214301. [Google Scholar] [CrossRef] [PubMed]
- Yang, H.; Li, J.; Shen, S.; Xu, G. A Deep Convolutional Neural Network Inspired by Auditory Perception for Underwater Acoustic Target Recognition. Sensors 2019, 19, 1104. [Google Scholar] [CrossRef] [PubMed]
- Shen, S.; Yang, H.; Yao, X.; Li, J.; Xu, G.; Sheng, M. Ship type classification by convolutional neural networks with auditory-like mechanisms. Sensors 2020, 20, 253. [Google Scholar] [CrossRef]
- Wang, X.; Liu, A.; Zhang, Y.; Xue, F. Underwater Acoustic Target Recognition: A Combination of Multi-Dimensional Fusion Features and Modified Deep Neural Network. Remote Sens. 2019, 11, 1888. [Google Scholar] [CrossRef]
- Wang, D.; Zhang, L.; Lu, Z.; Xu, K. Large-scale whale call classification using deep convolutional neural network architectures. In Proceedings of the 2018 IEEE International Conference on Signal Processing, Communications and Computing (ICSPCC), Qingdao, China, 14–16 September 2018; pp. 1–5. [Google Scholar] [CrossRef]
- Vahidpour, V.; Rastegarnia, A.; Khalili, A. An automated approach to passive sonar classification using binary image features. J. Mar. Sci. Appl. 2015, 14, 327–333. [Google Scholar] [CrossRef]
- Ferguson, E.L.; Ramakrishnan, R.; Williams, S.B.; Jin, C.T. Convolutional neural networks for passive monitoring of a shallow water environment using a single sensor. In Proceedings of the 2017 IEEE International Conference on Acoustics, Speech and Signal Processing (ICASSP), New Orleans, LA, USA, 5–9 March 2017; pp. 2657–2661. [Google Scholar] [CrossRef]
- Li, Y.; Tang, B.; Jiao, S. SO-slope entropy coupled with SVMD: A novel adaptive feature extraction method for ship-radiated noise. Ocean. Eng. 2023, 280, 114677. [Google Scholar] [CrossRef]
- Li, Y.; Gao, P.; Tang, B.; Yi, Y.; Zhang, J. Double feature extraction method of ship-radiated noise signal based on slope entropy and permutation entropy. Entropy 2021, 24, 22. [Google Scholar] [CrossRef]
- Ren, J.; Xie, Y.; Zhang, X.; Xu, J. UALF: A learnable front-end for intelligent underwater acoustic classification system. Ocean. Eng. 2022, 264, 112394. [Google Scholar] [CrossRef]
- Lu, J.; Song, S.; Hu, Z.; Li, S. Fundamental frequency detection of underwater acoustic target using DEMON spectrum and CNN network. In Proceedings of the 2020 3rd International Conference on Unmanned Systems (ICUS), Harbin, China, 27–28 November 2020; pp. 778–784. [Google Scholar] [CrossRef]
- Song, G.; Guo, X.; Wang, W.; Ren, Q.; Li, J.; Ma, L. A machine learning-based underwater noise classification method. Appl. Acoust. 2021, 184, 108333. [Google Scholar] [CrossRef]
- Ke, X.; Yuan, F.; Cheng, E. Integrated optimization of underwater acoustic ship-radiated noise recognition based on two-dimensional feature fusion. Appl. Acoust. 2020, 159, 107057. [Google Scholar] [CrossRef]
- Li, C.; Liu, Z.; Ren, J.; Wang, W.; Xu, J. A feature optimization approach based on inter-class and intra-class distance for ship type classification. Sensors 2020, 20, 5429. [Google Scholar] [CrossRef] [PubMed]
- Li, J.; Yang, H. The underwater acoustic target timbre perception and recognition based on the auditory inspired deep convolutional neural network. Appl. Acoust. 2021, 182, 108210. [Google Scholar] [CrossRef]
- Honghui, Y.; Junhao, L.; Meiping, S. Underwater acoustic target multi-attribute correlation perception method based on deep learning. Appl. Acoust. 2022, 190, 108644. [Google Scholar] [CrossRef]
- Hong, F.; Liu, C.; Guo, L.; Chen, F.; Feng, H. Underwater acoustic target recognition with a residual network and the optimized feature extraction method. Appl. Sci. 2021, 11, 1442. [Google Scholar] [CrossRef]
- Yuan, F.; Ke, X.; Cheng, E. Joint representation and recognition for ship-radiated noise based on multimodal deep learning. J. Mar. Sci. Eng. 2019, 7, 380. [Google Scholar] [CrossRef]
- Luo, X.; Zhang, M.; Liu, T.; Huang, M.; Xu, X. An underwater acoustic target recognition method based on spectrograms with different resolutions. J. Mar. Sci. Eng. 2021, 9, 1246. [Google Scholar] [CrossRef]
- Yang, H.; Zheng, K.; Li, J. Open set recognition of underwater acoustic targets based on GRU-CAE collaborative deep learning network. Appl. Acoust. 2022, 193, 108774. [Google Scholar] [CrossRef]
- Xie, D.; Sun, H.; Qi, J. A new feature extraction method based on improved variational mode decomposition, normalized maximal information coefficient and permutation entropy for ship-radiated noise. Entropy 2020, 22, 620. [Google Scholar] [CrossRef]
- Fernandes, R.P.; Apolinário, J.A., Jr. Underwater target classification with optimized feature selection based on genetic algorithms. In Proceedings of the XXXVIII Simpósio Brasileiro de Telecomunicações e Processamento de Sinais—SBrT 2020, Florianópolis, Brazil, 22–25 November 2020. [Google Scholar] [CrossRef]
- Yaman, O.; Tuncer, T.; Tasar, B. DES-Pat: A novel DES pattern-based propeller recognition method using underwater acoustical sounds. Appl. Acoust. 2021, 175, 107859. [Google Scholar] [CrossRef]
- Zhu, P.; Zhang, Y.; Huang, Y.; Zhao, C.; Zhao, K.; Zhou, F. Underwater acoustic target recognition based on spectrum component analysis of ship radiated noise. Appl. Acoust. 2023, 211, 109552. [Google Scholar] [CrossRef]
- Selvaraju, R.R.; Cogswell, M.; Das, A.; Vedantam, R.; Parikh, D.; Batra, D. Grad-cam: Visual explanations from deep networks via gradient-based localization. In Proceedings of the IEEE International Conference on Computer Vision, Venice, Italy, 22–29 October 2017; pp. 618–626. [Google Scholar] [CrossRef]
- Abraham, J.V.T.; Khan, A.N.; Shahina, A. A deep learning approach for robust speaker identification using chroma energy normalized statistics and mel frequency cepstral coefficients. Int. J. Speech Technol. 2021, 26, 579–587. [Google Scholar] [CrossRef]
- Jiang, D.N.; Lu, L.; Zhang, H.J.; Tao, J.H.; Cai, L.H. Music type classification by spectral contrast feature. In Proceedings of the IEEE International Conference on Multimedia and Expo, Lausanne, Switzerland, 26–29 August 2002; Volume 1, pp. 113–116. [Google Scholar] [CrossRef]
- Harte, C.; Sandler, M.; Gasser, M. Detecting harmonic change in musical audio. In Proceedings of the 1st ACM Workshop on Audio and Music Computing Multimedia, Santa Barbara, CA, USA, 27 October 2006; pp. 21–26. [Google Scholar] [CrossRef]
- Raghuwanshi, P.; Kaushik, R. Insect Classification Using Mel-CSTFT: A Fusion of Mel Spectrogram and Chroma STFT Features. In Proceedings of the 2024 First International Conference on Electronics, Communication and Signal Processing (ICECSP), Delhi, India, 8–10 August 2024; pp. 1–5. [Google Scholar] [CrossRef]
- Cao, M.; Zhao, T.; Li, Y.; Zhang, W.; Benharash, P.; Ramezani, R. ECG Heartbeat classification using deep transfer learning with Convolutional Neural Network and STFT technique. J. Phys. Conf. Ser. 2023, 2547, 012031. [Google Scholar] [CrossRef]
- Fayyazi, H.; Shekofteh, Y. IIRI-Net: An interpretable convolutional front-end inspired by IIR filters for speaker identification. Neurocomputing 2023, 558, 126767. [Google Scholar] [CrossRef]
- Mohan, M.; Dhanalakshmi, P.; Kumar, R.S. Speech emotion classification using ensemble models with MFCC. Procedia Comput. Sci. 2023, 218, 1857–1868. [Google Scholar] [CrossRef]
- Abdzadeh, P.; Veisi, H. A comparison of CQT spectrogram with STFT-based acoustic features in Deep Learning-based synthetic speech detection. J. AI Data Min. 2023, 11, 119–129. [Google Scholar] [CrossRef]
- Mohmmad, S.; Sanampudi, S.K. Tree cutting sound detection using deep learning techniques based on mel spectrogram and MFCC features. In Proceedings of the Third International Conference on Advances in Computer Engineering and Communication Systems: ICACECS, Telangana, India, 11–12 August 2022; Springer: Berlin/Heidelberg, Germany, 2023; pp. 497–512. [Google Scholar] [CrossRef]
- Martinez, M.; Stiefelhagen, R. Taming the cross entropy loss. In Pattern Recognition, Proceedings of the 40th German Conference, GCPR 2018, Stuttgart, Germany, 9–12 October 2018; Proceedings 40; Springer: Berlin/Heidelberg, Germany, 2019; pp. 628–637. [Google Scholar] [CrossRef]
- Desplanques, B.; Thienpondt, J.; Demuynck, K. Ecapa-tdnn: Emphasized channel attention, propagation and aggregation in tdnn based speaker verification. arXiv 2020, arXiv:2005.07143. [Google Scholar] [CrossRef]
- Irfan, M.; Jiangbin, Z.; Ali, S.; Iqbal, M.; Masood, Z.; Hamid, U. DeepShip: An underwater acoustic benchmark dataset and a separable convolution based autoencoder for classification. Expert Syst. Appl. 2021, 183, 115270. [Google Scholar] [CrossRef]
- Liu, Z.; Mao, H.; Wu, C.Y.; Feichtenhofer, C.; Darrell, T.; Xie, S. A convnet for the 2020s. In Proceedings of the IEEE/CVF Conference on Computer Vision and Pattern Recognition, New Orleans, LA, USA, 18–24 June 2022; pp. 11976–11986. [Google Scholar] [CrossRef]
| Disclaimer/Publisher’s Note: The statements, opinions and data contained in all publications are solely those of the individual author(s) and contributor(s) and not of MDPI and/or the editor(s). MDPI and/or the editor(s) disclaim responsibility for any injury to people or property resulting from any ideas, methods, instructions or products referred to in the content. |
© 2024 by the authors. Licensee MDPI, Basel, Switzerland. This article is an open access article distributed under the terms and conditions of the Creative Commons Attribution (CC BY) license (https://creativecommons.org/licenses/by/4.0/).


