Article

Vortex-Induced Vibration Performance Analysis of Long-Span Sea-Crossing Bridges Using Unsupervised Clustering

by
Tao Chen
1,
Yi-Lun Wu
1,
Xiao-Mei Yang
1,* and
Shu-Han Yang
2
1
College of Civil Engineering, Fuzhou University, Fuzhou 350108, China
2
School of Civil Engineering, Dalian University of Technology, Dalian 116023, China
*
Author to whom correspondence should be addressed.
J. Mar. Sci. Eng. 2024, 12(10), 1890; https://doi.org/10.3390/jmse12101890
Submission received: 13 September 2024 / Revised: 12 October 2024 / Accepted: 18 October 2024 / Published: 21 October 2024
(This article belongs to the Section Coastal Engineering)

Abstract

:
Vortex-induced vibration is a type of wind-induced vibration occurring frequently in large-span sea-crossing bridges under relatively low wind speeds, posing a threat to the structural fatigue performance and driving comfort. Identifying the instantaneous occurrence moments of vortex-induced vibration is a prerequisite for establishing a data-driven prediction model for vortex-induced vibration, and it is of great significance for the monitoring and early warning of vortex-induced vibration performance in bridges. To automatically detect the occurrence moments of vortex-induced vibration and establish a correlation model between vortex-induced vibration amplitude and environmental factors, this study proposes a fuzzy C-means clustering-based classification method. In order to detect the occurrence moments of vortex-induced vibration more finely, only short-term or even instantaneous structural vibration indicators were selected and transformed for distribution as clustering features. The entire detection process could be carried out unsupervised, reducing the manual cost of obtaining vortex-induced vibration information from massive monitoring data. Finally, actual vortex-induced vibration test data from a certain overseas bridge was utilized to verify the feasibility of this method. Based on the classification results, the correlation between vortex-induced vibration amplitude and environmental variables was determined, providing valuable guidance for predicting vortex-induced vibration amplitudes.

1. Introduction

Due to the rising transportation needs in coastal areas, numerous sea-crossing bridges are either under construction or have already been built worldwide. In marine environments, the impact of extreme wind loads such as typhoons on bridges cannot be overlooked [1]. Particularly, sea-crossing bridges often feature large spans and low stiffness. When extremely strong wind loads act on the bridge, significant vibrations occur. Vortex-induced vibration, which occurs at relatively low wind speeds, poses an important aerodynamic vibration concern for long-span sea-crossing bridges [2,3]. For example, the Great Belt suspension bridge encountered vortex-induced vibrations at moderate wind speeds ranging from approximately 5 to 10 m/s. The Trans-Tokyo Bay highway crossing bridge experienced its first-mode vortex-induced vibration at a wind speed of approximately 16–17 m/s [4]. The vortex-induced vibration event typically involves significant amplitudes that can cause discomfort to drivers, and may even result in fatigue [5] if the vortex-induced event persists over an extended period [6]. Timely identification of vortex-induced vibrations and the prediction of their amplitudes are crucial for ensuring the safety of and comfort when using bridges [7,8,9].
In recent years, research strategies for vortex-induced vibration have often involved methods [10] based on wind tunnel testing [11], computational fluid dynamics [12], finite element modeling, and field monitoring. For instance, Govardhan and Williamson [13] established the motion equation for the vortex-induced vibration system, taking into account the phase relationship between the vortex force and displacement. Duranay [14,15] examined the vortex formation modes at high Reynolds numbers using numerical and experimental techniques. The results illustrated that the vibration amplitudes are influenced by the mass ratio. In particular, there is a growing trend of installing structural health monitoring systems [16,17] on large-scale structures to monitor their on-site conditions. The large accumulation of field monitoring data establishes a robust basis for data-driven identification and the prediction of vortex-induced vibrations [18,19] of structures, including long-span bridges. For example, Zhang et al. [20] developed a digital twin technique to simulate and predict the vortex-induced vibration of a long suspension bridge. In this technique, the bridge model was updated based on the monitored dynamic characteristics, and the vortex-induced force model was established using data from wind tunnel tests. Xu et al. [21] established a prediction model for vortex-induced vibration based on big data, including vibration acceleration and wind data. The results showed that the identification rate of vortex-induced vibration could reach 89%. Given that vortex-induced vibration is a typical nonlinear fluid-structure interaction problem, a data-driven semi-empirical augmentation method has been developed by Gao et al. [22] to improve the prediction of its nonlinear dynamic behaviors. Nevertheless, the general steps in data-driven prediction of vortex-induced vibrations include [23]: accurately identifying the timing of vortex-induced vibration occurrences, developing a correlation model between vortex-induced vibration characteristics and environmental factors, and conducting amplitude prediction utilizing the correlation model between vortex-induced vibrations and environmental factors. Among them, automatically detecting the timing of vortex-induced vibration occurrences is crucial for successful vortex-induced vibration prediction [24].
To automatically identify the vortex-induced vibration response from the extensive acceleration data, a method based on the random decrement technique is proposed [25]. This method takes into account the single-mode free-decay characteristics of the random decrement function of vortex-induced vibration acceleration. Cao et al. [26] utilized the root mean square (RMS) of acceleration and the energy concentration coefficient to assess the onset of vortex-induced vibration, and devised a five-level warning system for vortex-induced vibration events. Lim et al. [27] introduced a classification method for vortex-induced vibration events using supervised learning techniques. Thirteen vortex-induced features, such as the RMS, maximum value, skewness, and kurtosis of acceleration, as well as the peak factor, mean wind velocity, and incident angle, were utilized in their study. Li et al. [28] proposed a decision tree model to classify vortex-induced vibration modes, using wind speeds and directions relative to three measurement points as input data for the model. Guo et al. [29] devised an identification and early-warning strategy for bridge vortex-induced vibration, analyzing wind characteristics and structural dynamic responses as the identification indices. However, the thresholds for these identification and early-warning indices need to be empirically determined. Moreover, the aforementioned vortex-induced vibration identification methods often can only determine the occurrence of vortex-induced vibration over a relatively long time scale. Over this longer time scale, ideal vortex-induced vibrations may not occur continuously. If all vibration data within this time scale, which includes some non-vortex-induced vibration events, are utilized for correlation analysis, it may lead to the establishment of an unreasonable correlation model between vortex-induced vibration and environmental factors, ultimately resulting in irrational predictions of vortex-induced vibration amplitudes. Therefore, it is necessary to develop a vortex-induced vibration event automatic identification method that is more refined in time scale and does not require empirical thresholds.
In this study, an almost real-time automatic identification method for vortex-induced vibrations in long-span bridges is introduced. Initially, the instantaneous classification indices for vortex-induced vibrations are derived from the vibration acceleration data of bridges. Subsequently, the vortex-induced indices are analyzed using fuzzy C-means clustering to achieve the automatic detection of vortex-induced vibration events without the need for thresholds. To guarantee the availability of identification and improve automation, the vortex-induced indices used in clustering are initially transformed into a standard normal distribution. Finally, the monitoring data from actual bridges is utilized to validate the feasibility of the classification framework. At the same time, results from the analysis of the correlation between environmental factors and acceleration amplitudes are provided to guide the prediction of vortex-induced vibration amplitudes.

2. Methodologies

In this section, the theoretical expression for bridge vortex-induced vibration is first briefly introduced. Furthermore, the indicators of a vortex-induced vibration feature are described. Finally, the classification method for the vortex-induced vibration mode is given.

2.1. Theoretical Expression of Vortex-Induced Vibration

Based on the modal superposition theory, the vibration signal of a bridge is composed of a set of modal responses:
x m t = j = 1 n φ m j q j t
where x represents the vibration signal of the bridge, the subscript m represents the measurement point, t represents time, n is the number of modes, φ and q represent the mode shape and modal response.
The j th modal response q j t in Equation (1) is an amplitude-modulated narrow-band signal, as follows:
q j t = A j t cos ω d j t + θ j
where ω d j = 1 ξ j 2 ω j is the j th damped frequency of the bridge, ω j and ξ j are the natural frequency and damping ratio of the bridge, θ j is the initial phase angle, A j t is the amplitude-modulated function that depends on the excitation characteristics.
When the vortex-induced vibration occurs, the vibration signal x m t of the bridge in Equation (1) is approximated as a single-mode amplitude-modulated signal, as follows:
x m t = φ m j q j t = φ m j A j t cos ω d j t + θ j
where the amplitude-modulated function A j t depends on the phase bias between the vibration signal and the vortex shedding excitation [30], expressed as follows:
A j t = a j , 0 + k = 1 K a j , k cos ω ˜ j , k t + ϑ j , k
where a j , 0 is the initial amplitude, a j , k , ω ˜ j , k and ϑ j , k are the amplitude, frequency and phase of the k th component contributed in A j t , respectively.
If the vortex-induced vibration related to the j th mode occurs, vibration signals with respect to different measurement points are simultaneously written as Equation (5). It can be observed that the vortex-induced vibration signals at various measurement points are proportional, with the proportionality coefficient being the mode shape.
x 1 t = φ 1 j A j t cos ω d j t + θ j x 2 t = φ 2 i A j t cos ω d j t + θ j x M t = φ M i A j t cos ω d j t + θ j
where M represents the number of measurement points.

2.2. Vortex-Induced Vibration Feature

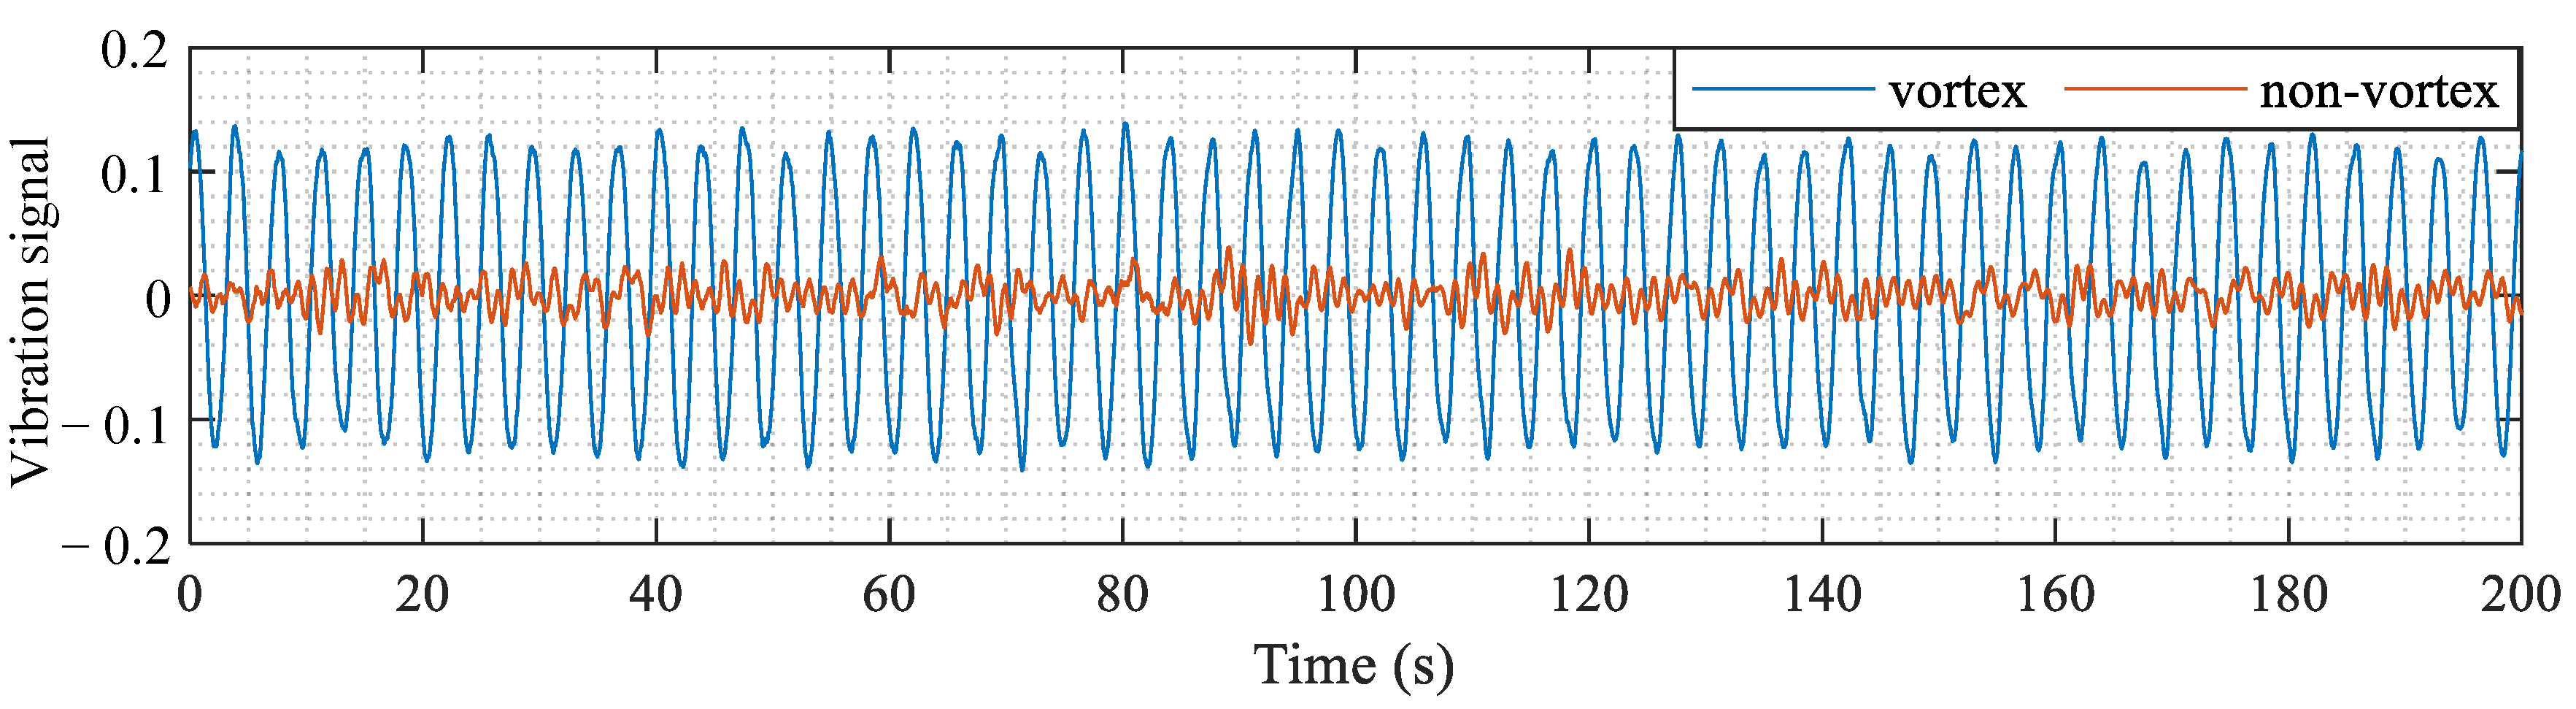
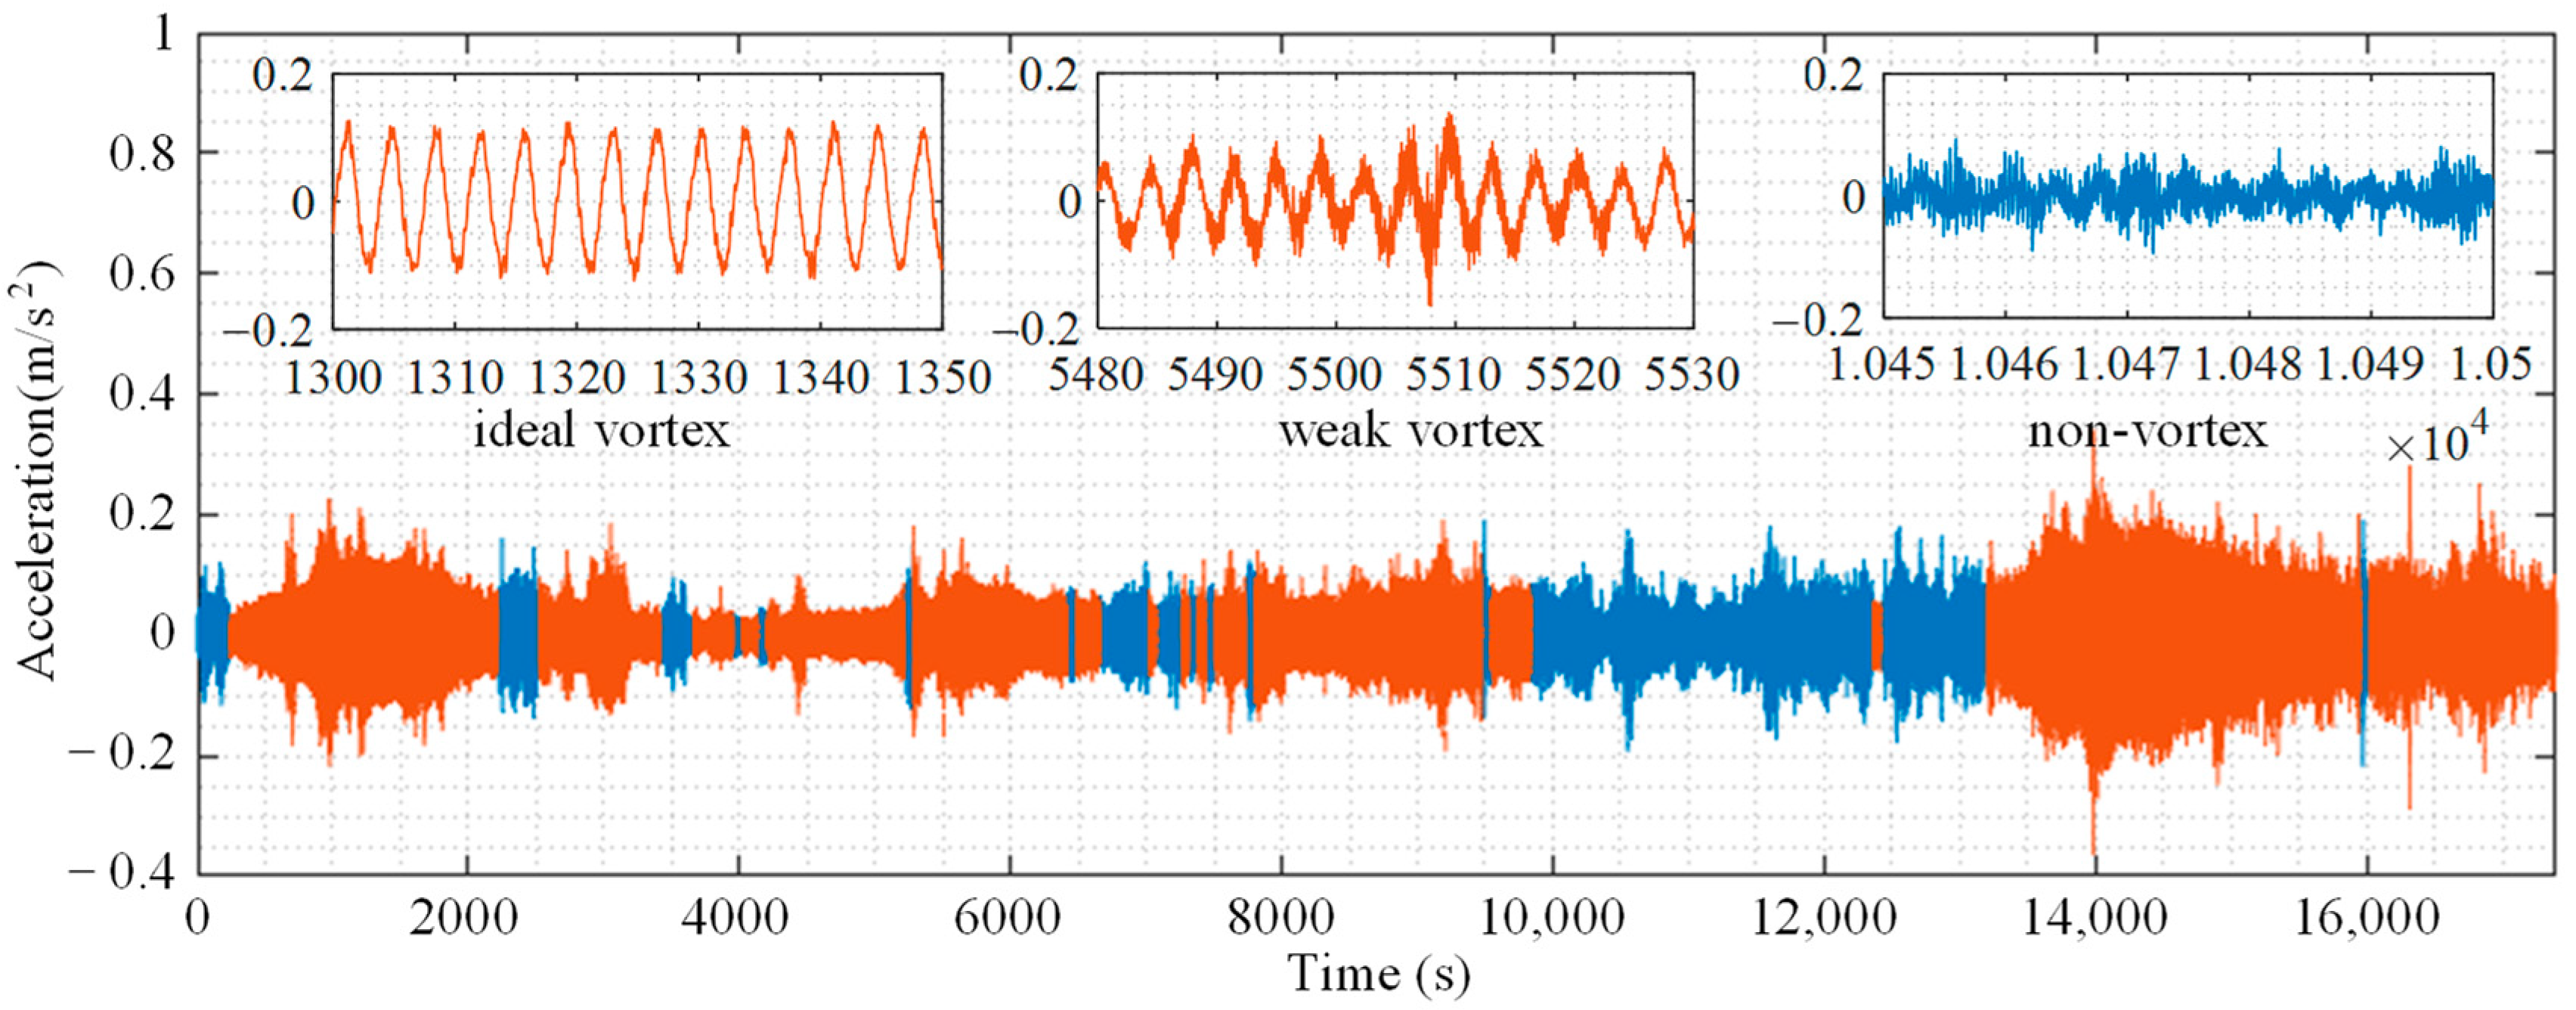
Because vortex-induced vibrations typically manifest within specific ranges of wind loads, the wind speed and wind direction can serve as indicators for classifying such vibrations. In addition to assessing wind loads, vortex-induced vibrations can also be identified through the analysis of vibration signals from bridges. The bridge vibration-based classification indicators are described in the following. Moreover, a vortex-induced vibration signal and a non-vortex-induced vibration signal presented in Figure 1 are used to explain the classification indicators that follow.
(1)
Root mean square
The root mean square (RMS) of a vibration signal x m is defined as:
RMS m = 1 N k = 1 N x m k
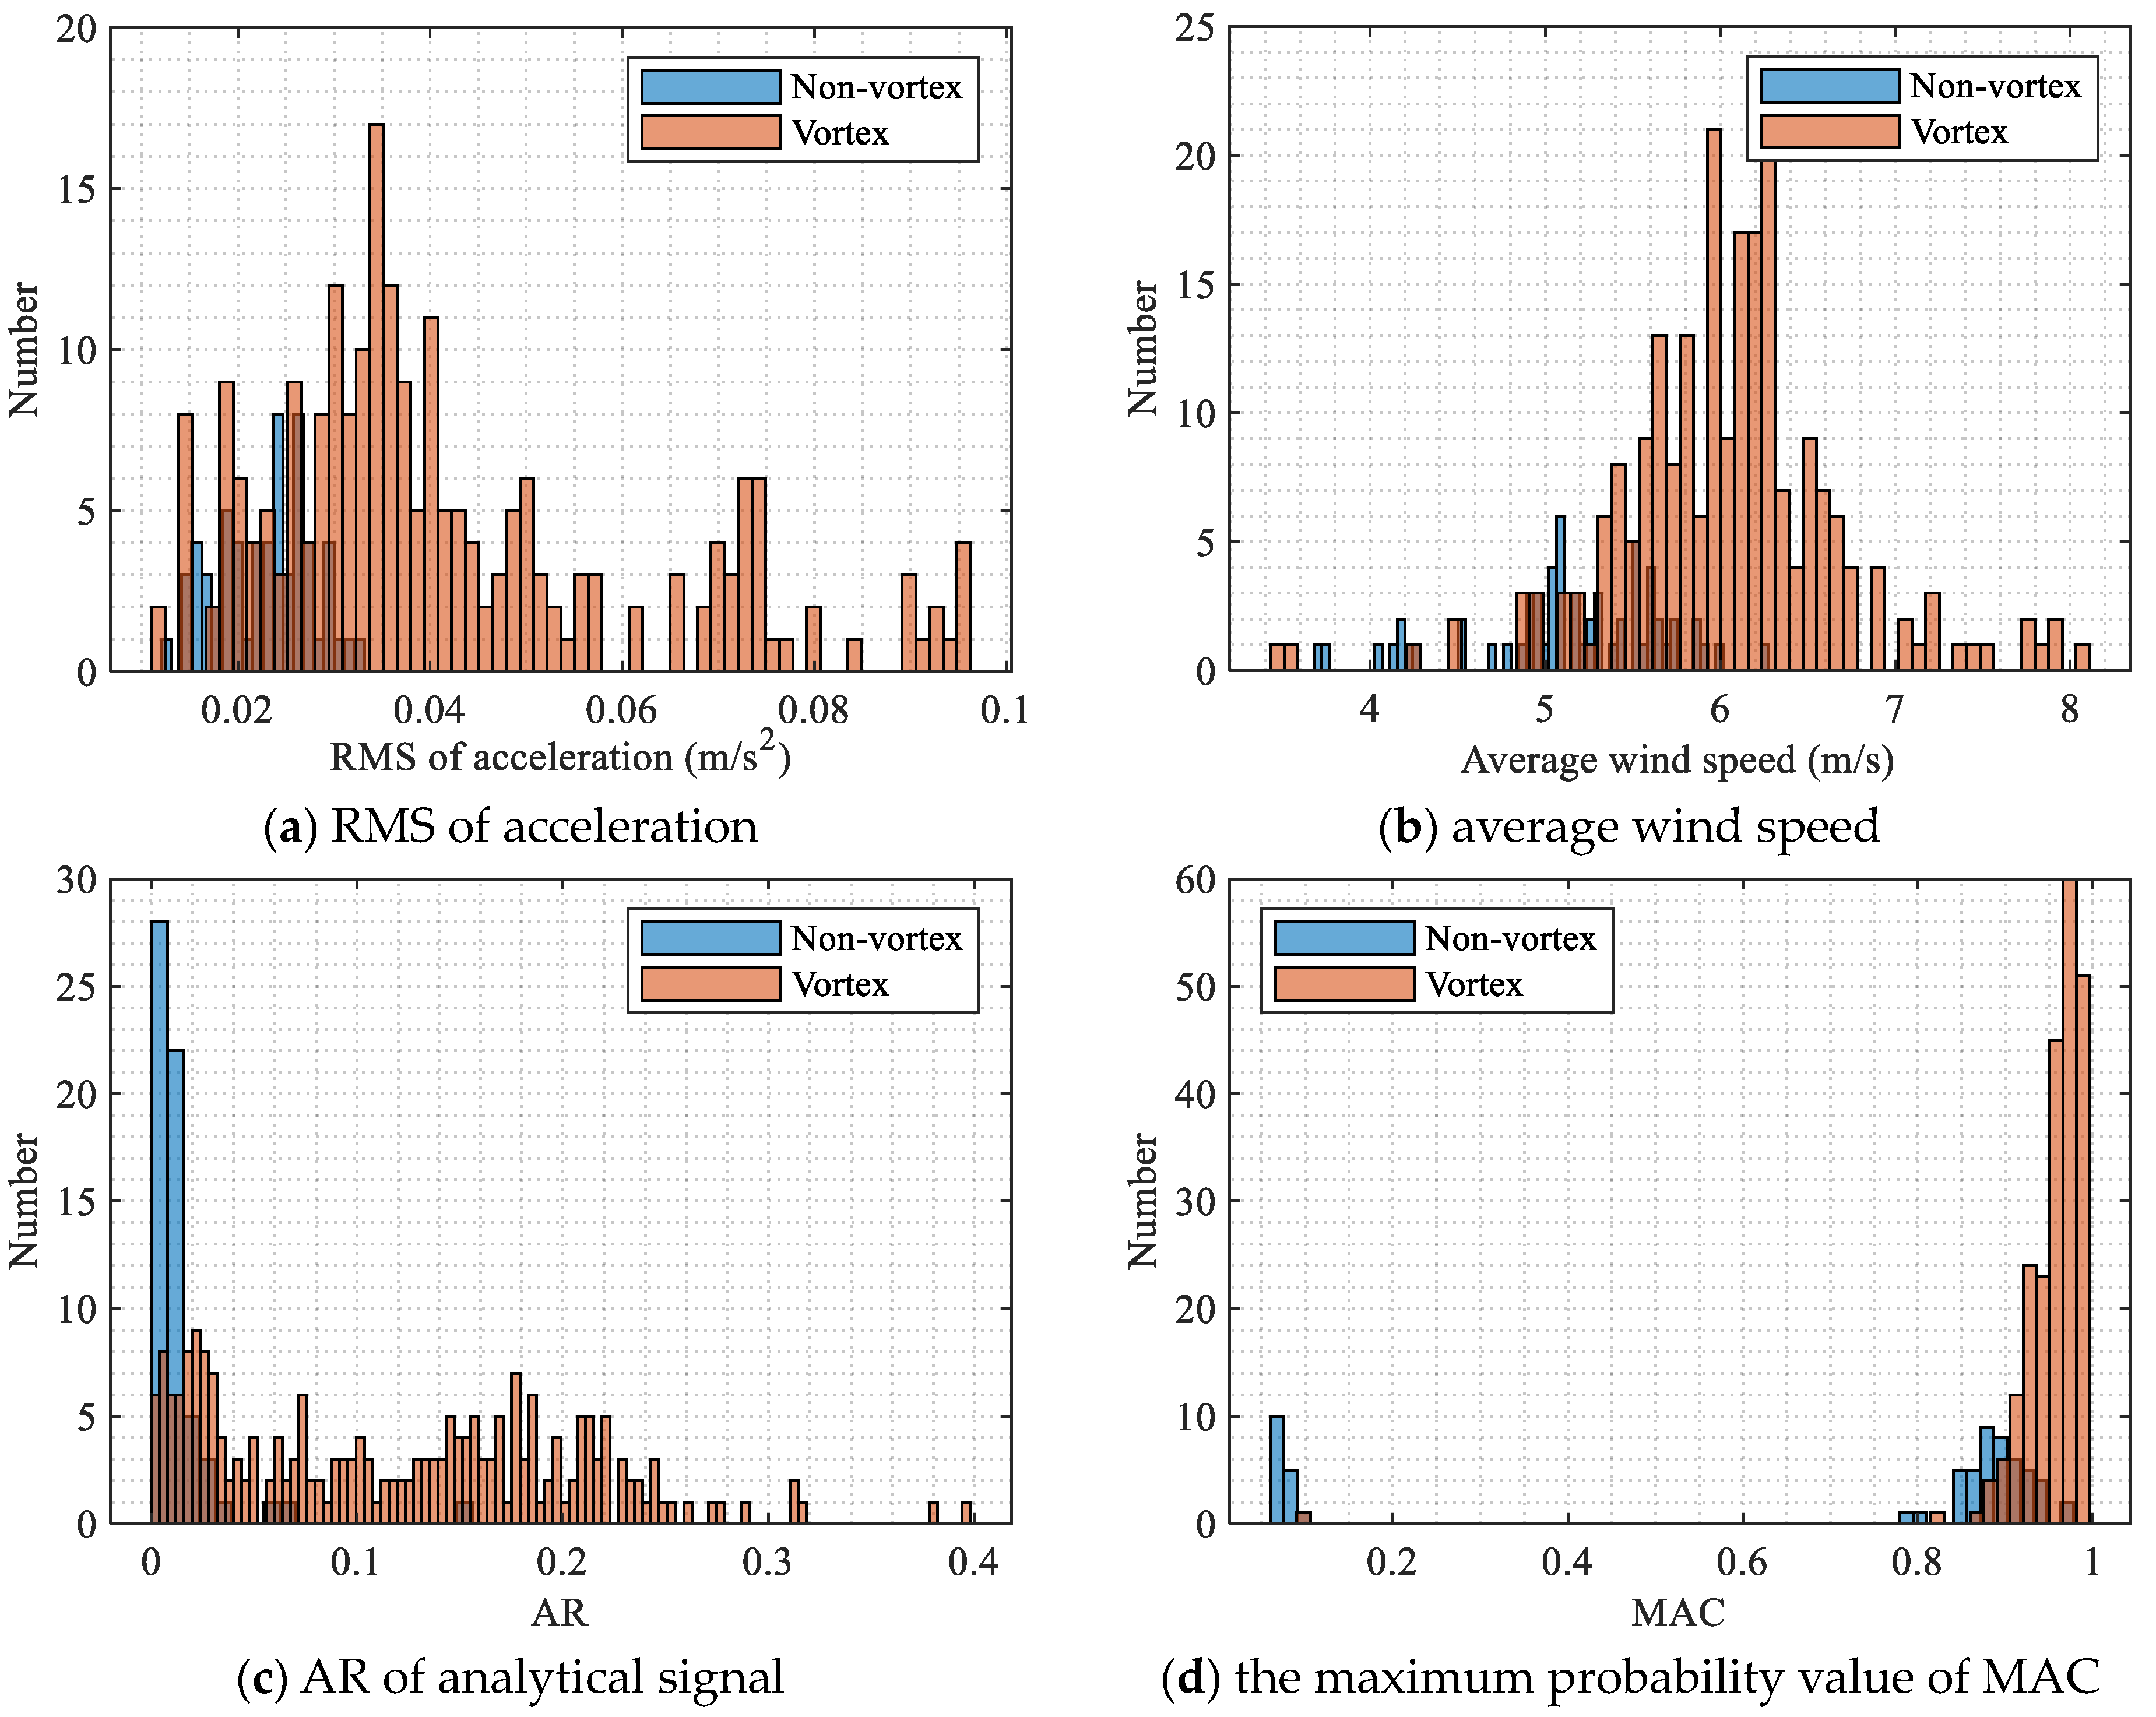
The RMS is utilized to quantify the magnitude of vibration signals. In comparison to the non-vortex-induced vibration signals of a bridge subjected to normal wind loads, the vortex-induced vibration signals exhibit higher vibration magnitude. Therefore, the RMS of vibration signals can be used as an indicator to distinguish between vortex-induced and non-vortex-induced vibrations.
(2)
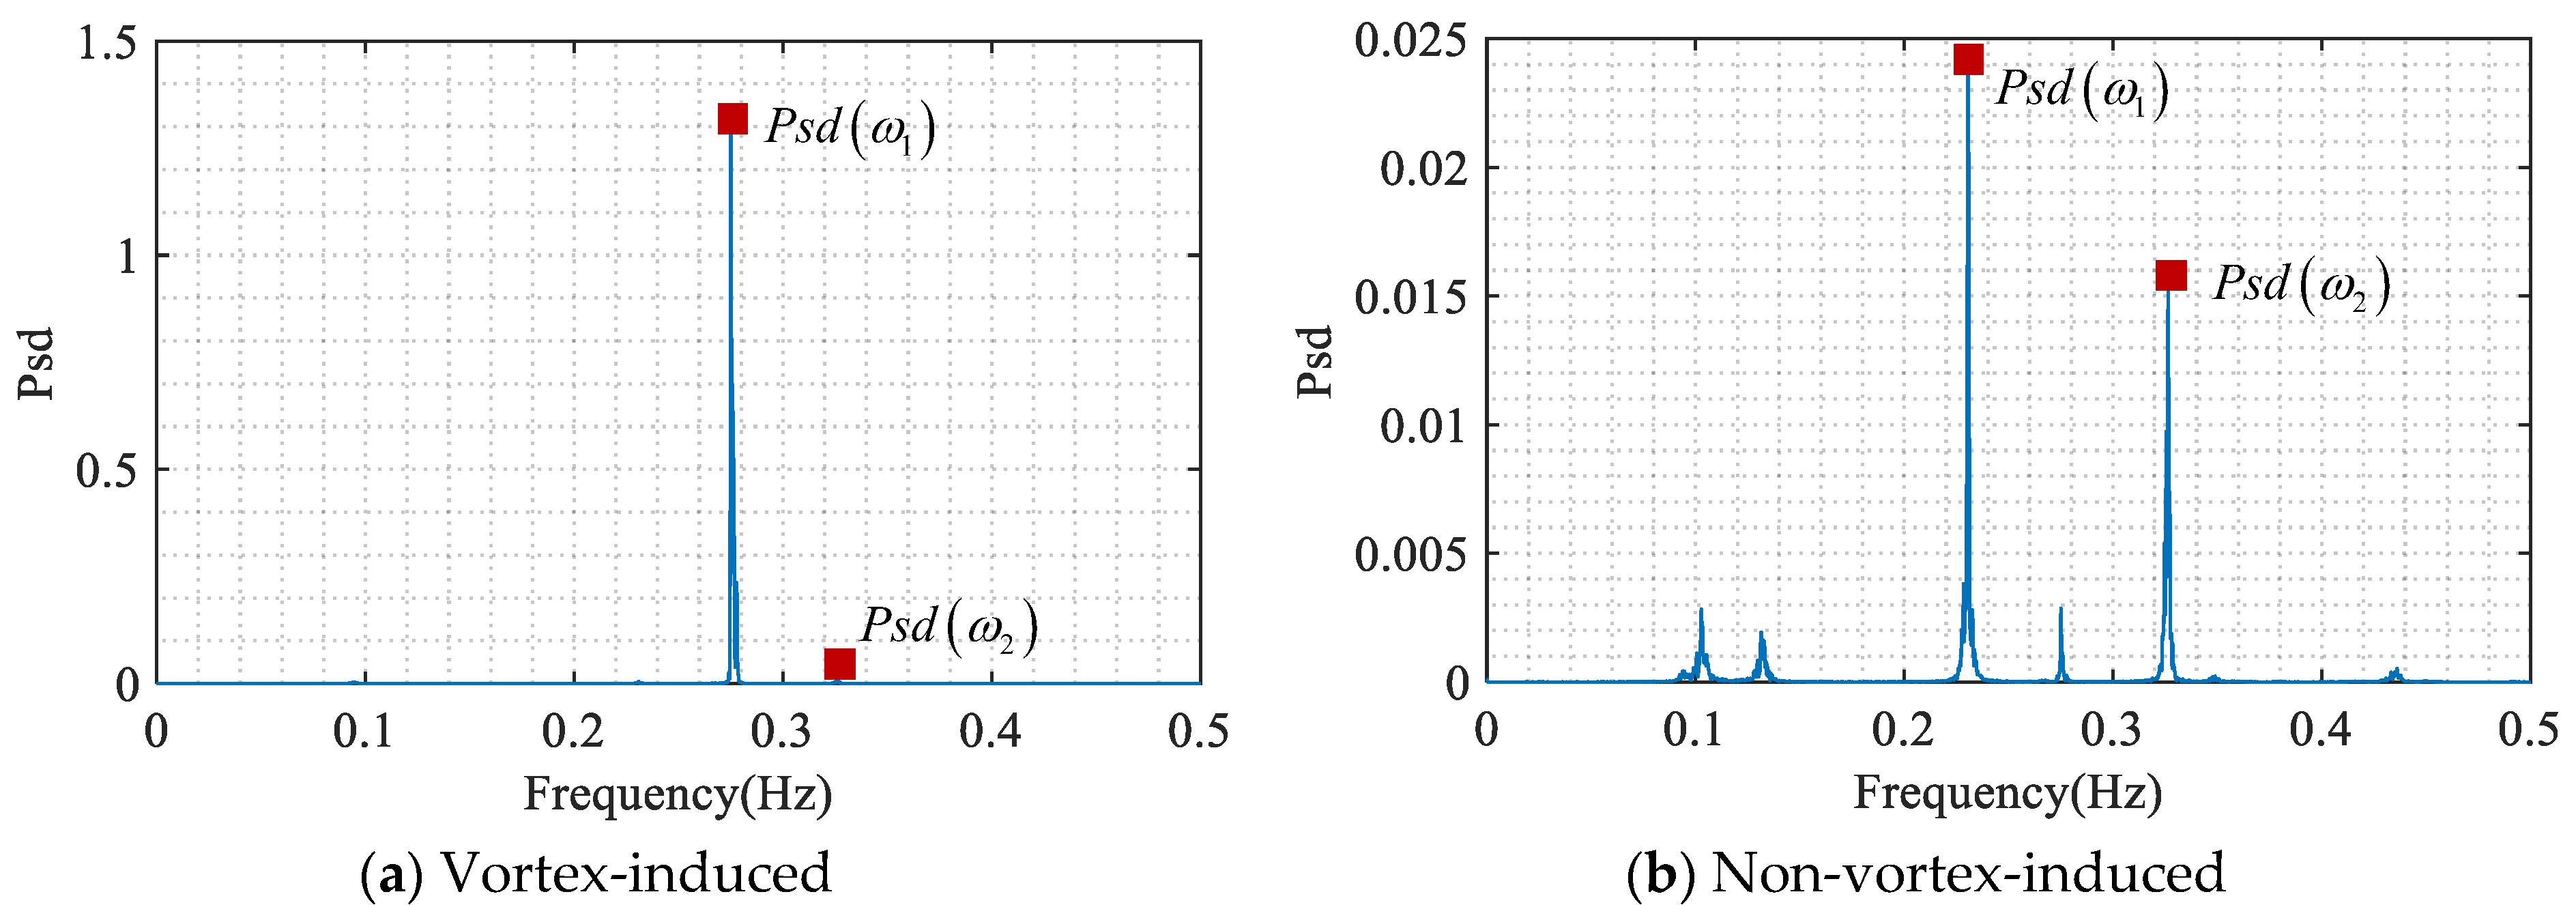
Energy concentration factor
The energy concentration (EC) factor of the vibration signal x m is defined as:
EC m = P s d m ω 2 P s d m ω 1
where P s d m ω 1 and P s d m ω 2 , respectively, represent the highest peak value and the second highest peak value on the power spectral density function curve P s d m ω of the vibration signal x m .
Taking the vibration signals presented in Figure 1 as an example, the power spectral density functions related to vortex-induced vibration and non-vortex-induced vibration are displayed in 
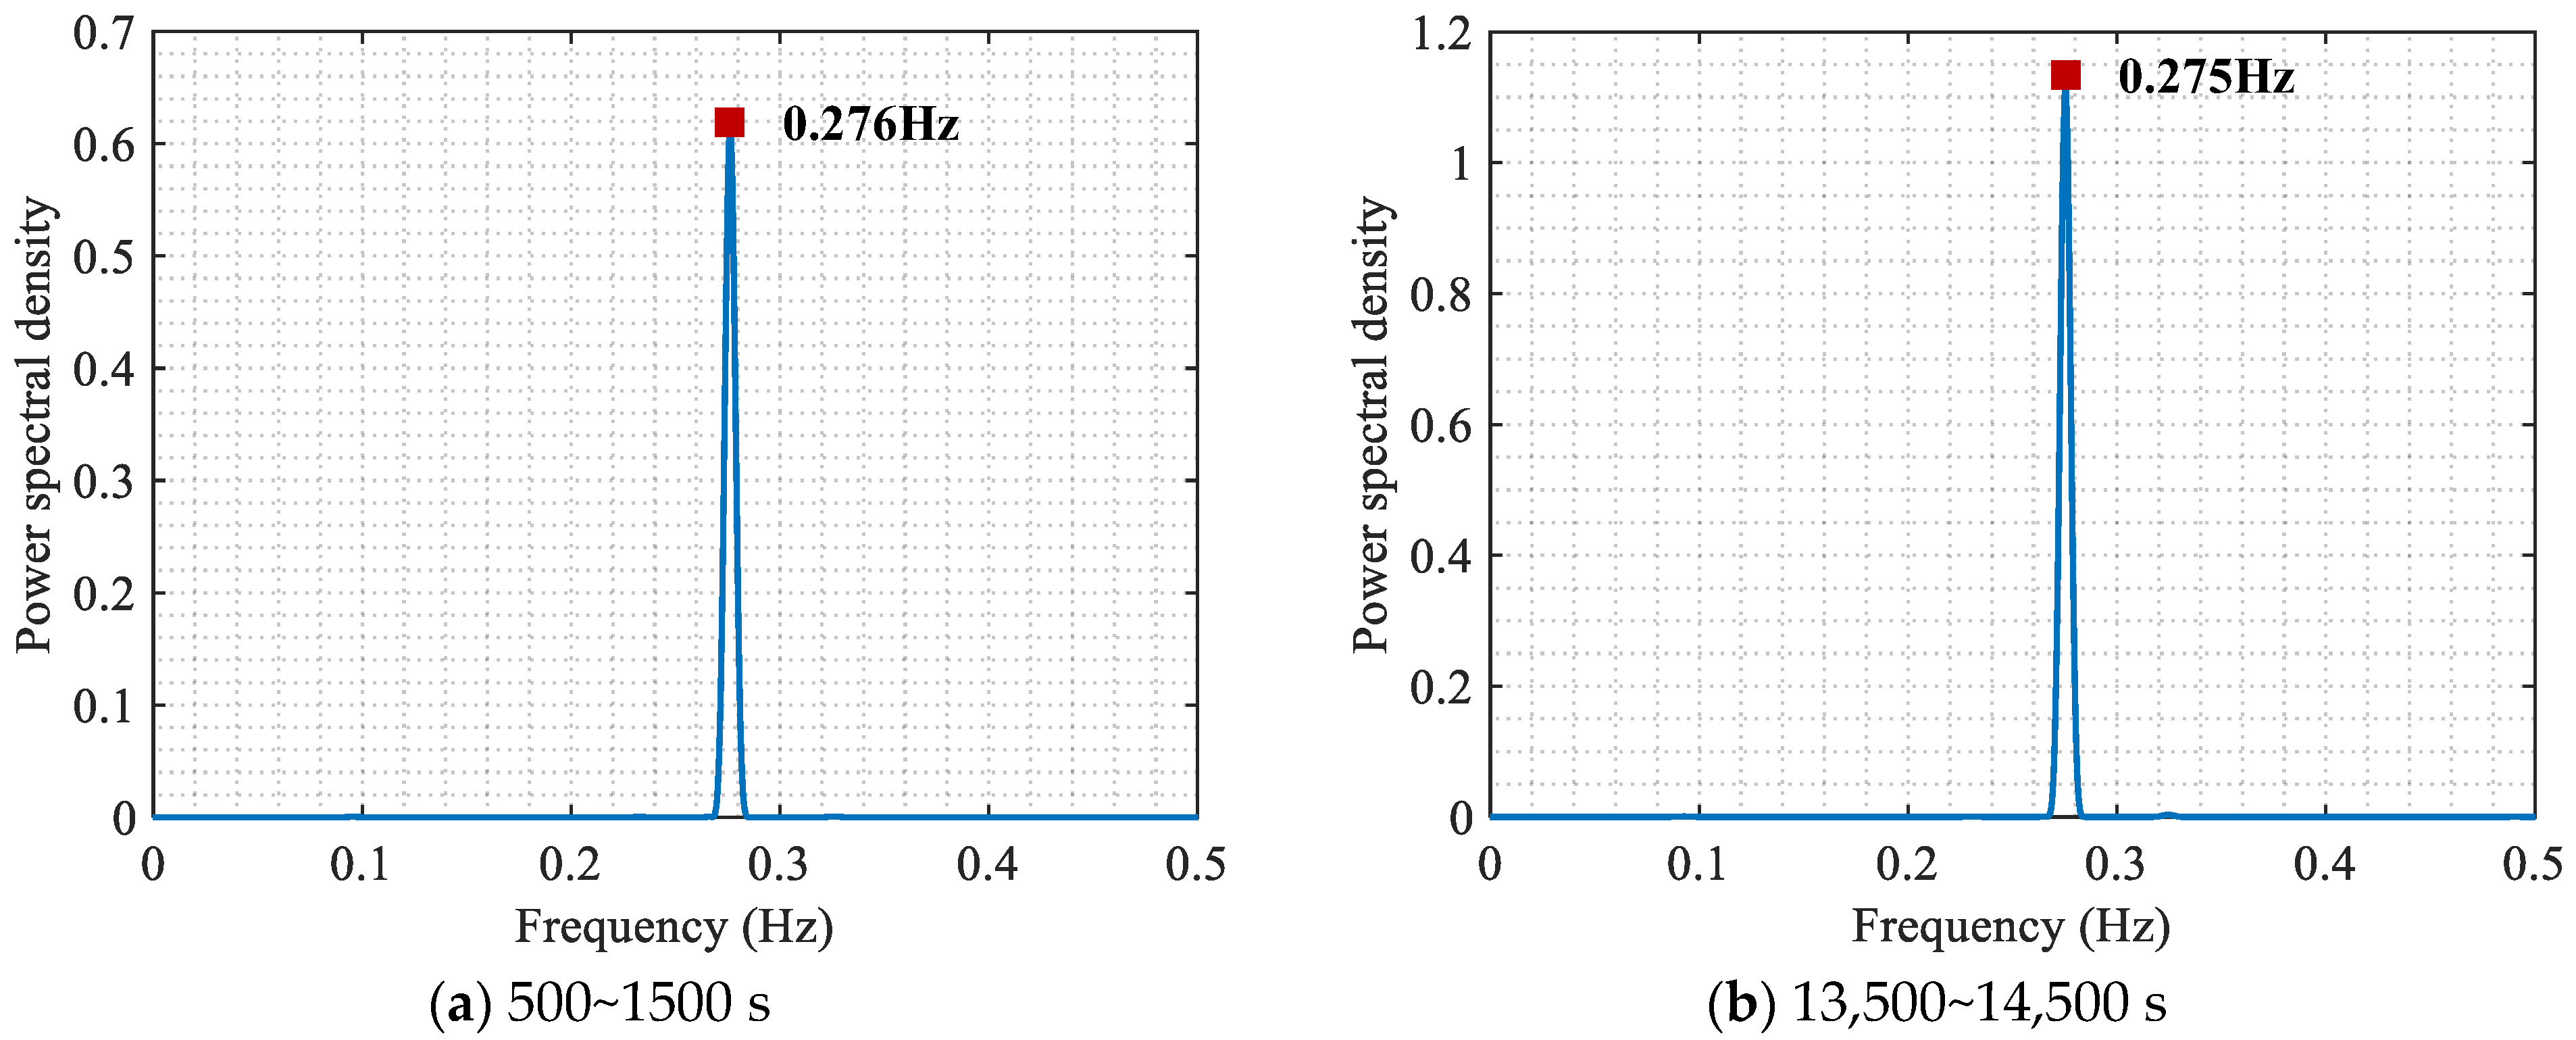
Figure 2. When the vortex-induced event occurs, only one mode significantly contributes to the vibration signal, resulting in the presence of a single prominent peak in its power spectral density function. This one-peak phenomenon does not appear in the power spectral density function of non-vortex-induced vibration signals. When only one peak significantly contributes to the power spectral density function, the energy concentration factor defined in Equation (7) becomes a small value, which can be utilized to detect vortex-induced vibration events.
(3)
Amplitude ratio of analytical signal
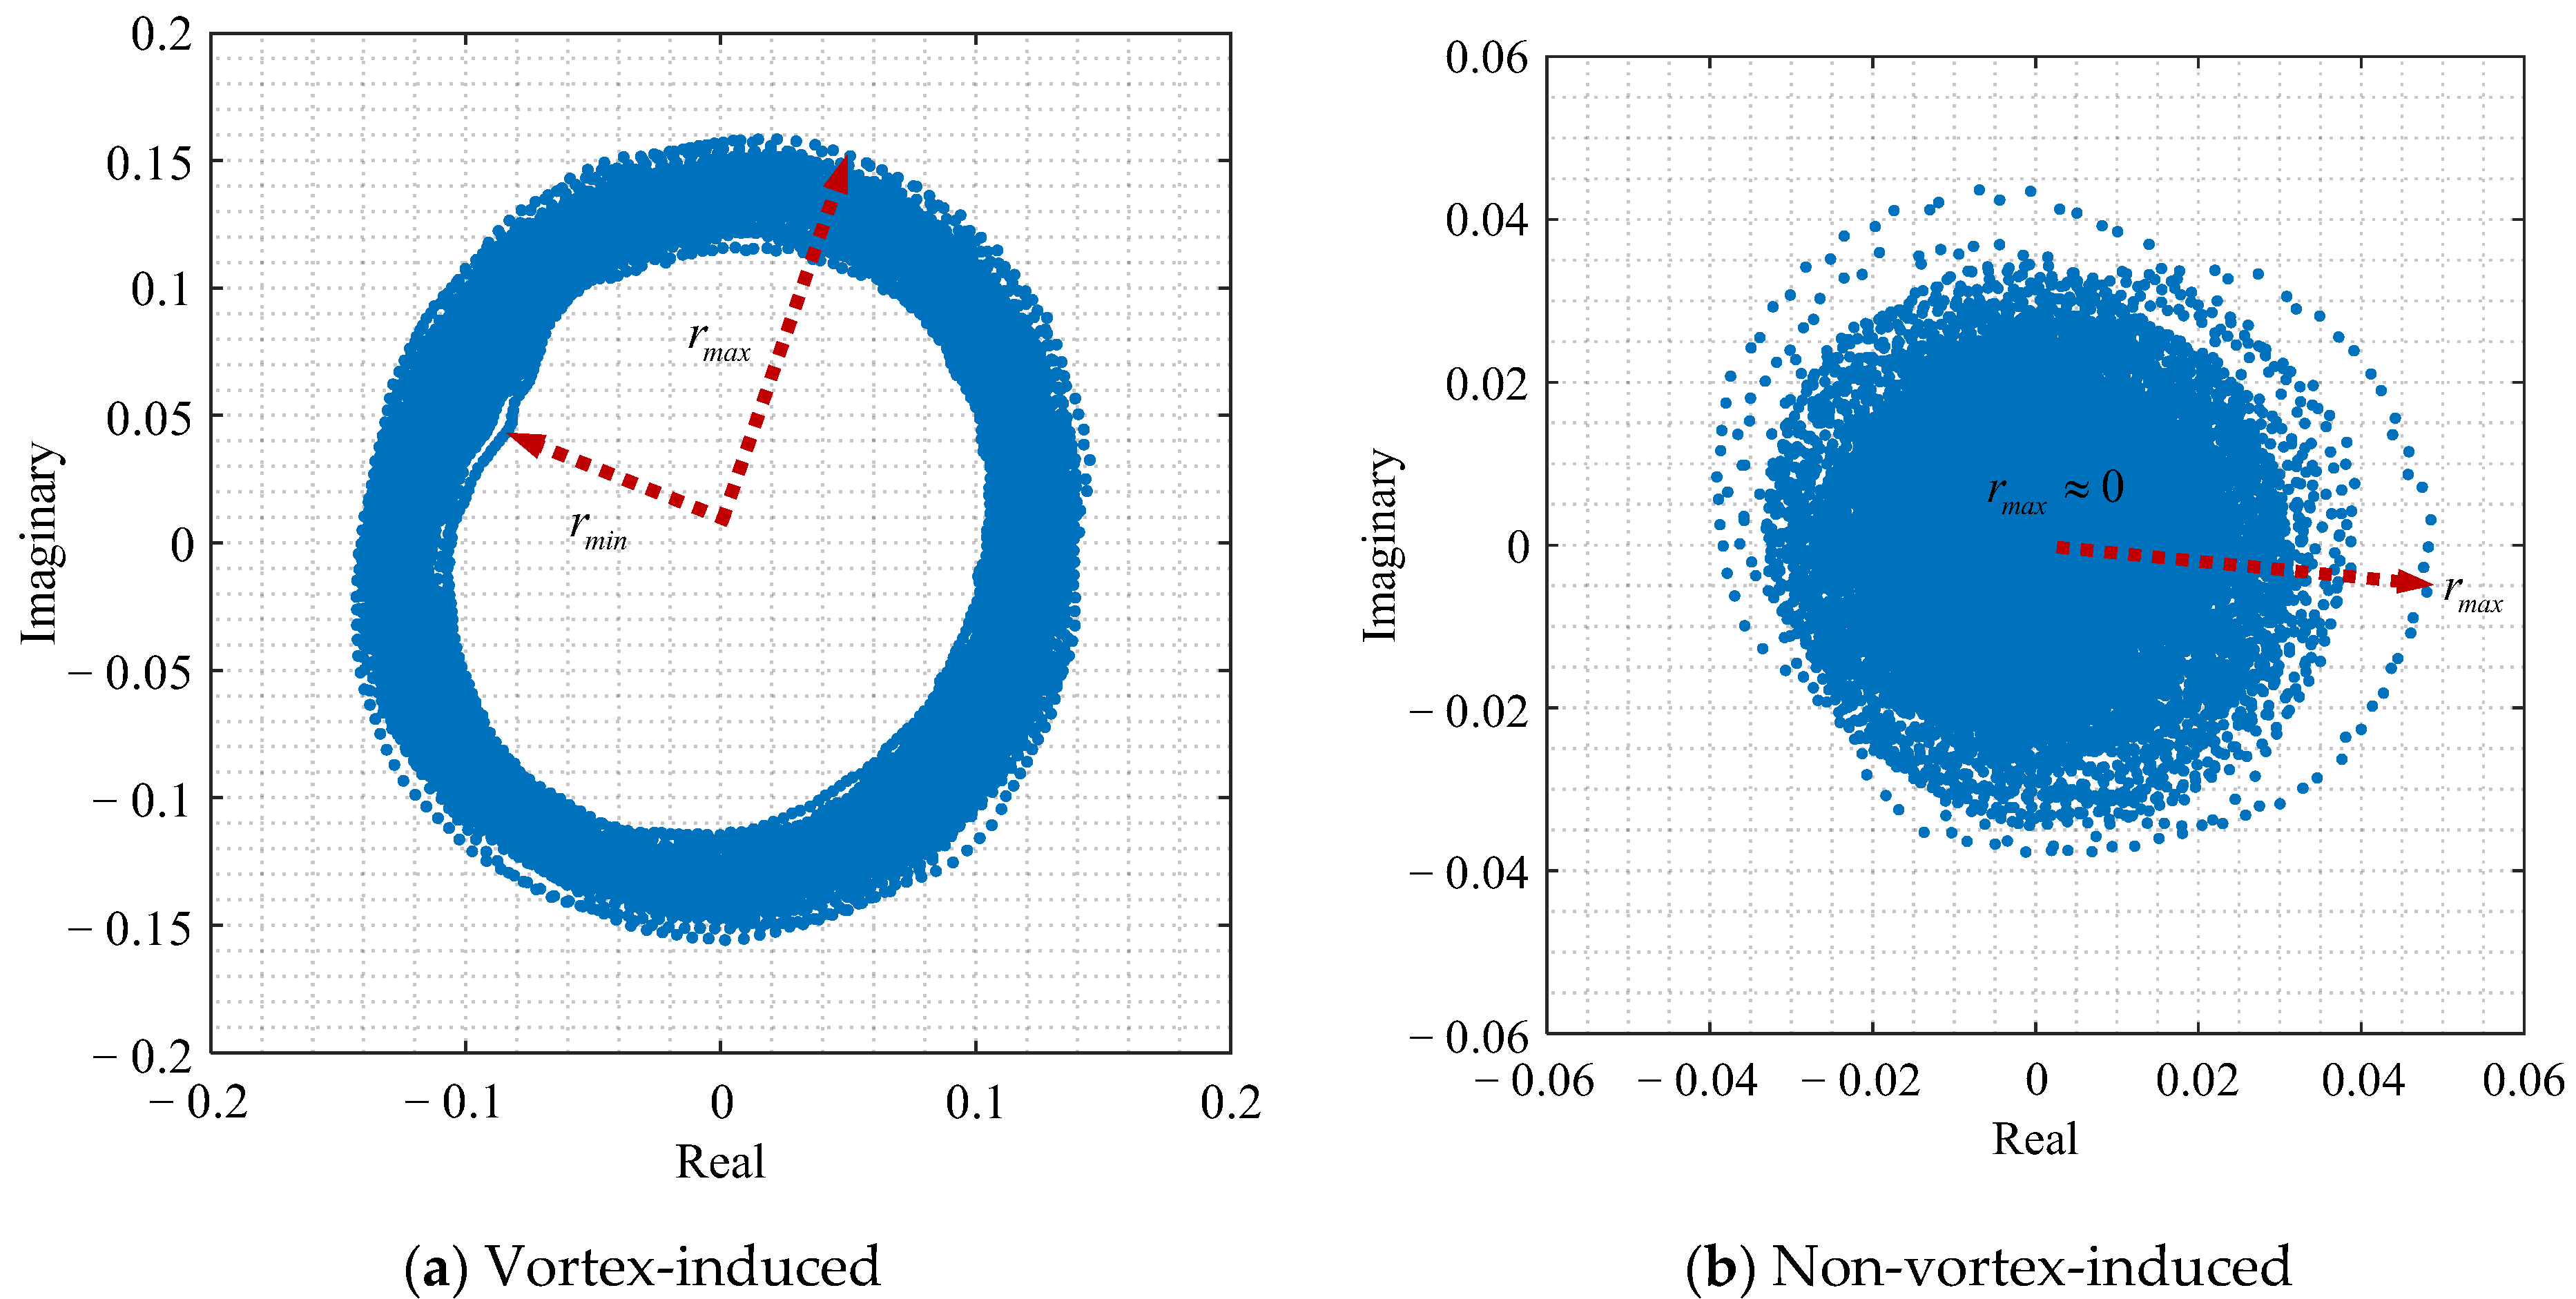
Bridge vortex-induced vibration is usually a single-mode vibration, and its Hilbert transform carries a clear physical meaning. Through recursive Hilbert transform analysis of the bridge vibration signals, analytical signals are acquired. The real and imaginary components of the analytical signal are graphed, as illustrated in Figure 3. When vortex-induced vibration is present, the real-imaginary plot of the analytical signal displays circular features, as depicted in Figure 3a, referred to as the vortex-induced vibration circle. On the other hand, in cases of non-vortex-induced vibration, the real-imaginary plot appears disorderly, as shown in Figure 3b.
To quantify whether the real-imaginary components of the analytical have become a vortex-induced vibration circle, the amplitude ratio (AR) of the analytical signal defined in Equation (8) is used. The amplitude ratio ranges from 0 to 1, where a higher AR value signifies the presence of a distinct vortex-induced vibration circle.
A R = r max r min = max x m t + i H x m t min x m t + i H x m t
where i is the imaginary unit, |   | represents the modulus operator, H x m t represents the Hilbert transform of the vibration signal x m , as follows:
H x m t = 1 π p . v . x m τ t τ d τ
(4)
Modal assurance criterion
According to the vortex-induced vibration expression in Equation (5), it is obvious that the vibration shape vector x t = x 1 t x 2 t x M t T is proportional to the mode shape vector φ j = φ 1 j φ 2 j φ M j T , with the proportional coefficient as A j t cos ω d j t + θ j . However, the proportional characteristics mentioned above cannot be observed in the non-vortex-induced vibration responses of a bridge under normal wind loads, as multiple modes contribute to the vibration signals. Therefore, this proportional relation between the vibration shape vector x t and the mode shape vector φ j can be used for finding the vortex-induced events. When the modal response A j t cos ω d j t + θ j 0 , the modal assurance criterion (MAC) in Equation (10) can be used to quantify this proportional relation. The MAC ranges from 0 to 1, with a higher MAC value indicating a stronger proportionality between the two vectors.
MAC = x T t φ j x T t x t φ j T φ j

2.3. Fuzzy C-Means Clustering Algorithm

The fuzzy C-means clustering is a widely used unsupervised learning algorithm that partitions data points into different clusters, ensuring that data points within the same cluster exhibit higher similarity to each other, while those from different clusters display lower similarity to each other. The term C represents the number of clusters.
Given a data point with its feature as y i = y i 1 y i 2 y i p T , the fuzzy C-means clustering method can classify it into a cluster C s by minimizing the following function:
F = s = 1 K i = 1 η α s i β y i μ s 2
where s = 1 , 2 , , K denotes the cluster number, η denotes the total number of data points,   2 denotes the Euclidean norm, μ s is the center of the cluster C s , α s i denotes the membership of data point i to the cluster C s , the superscript β denotes the fuzzy coefficient and is commonly set as 2.
The clustering process can be conducted as follows. First, the center μ s of each cluster C s is initialized. Second, the membership α s i is updated through Equation (12). Third, the objective function in Equation (11) is calculated. Four, the center of each cluster is updated through Equation (13). The above process was repeated until the objective function in Equation (11) was minimized. Finally, the data point i with its feature y i is classified into the cluster C s if the membership α s i is greater than the memberships α κ i for 1 κ K and κ s .
α s i = κ = 1 K y i μ s y i μ κ 2 β 1 1
μ s = i = 1 η α s i y i i = 1 η α s i

2.4. Vortex-Induced Vibration Classification Framework

The issues that the vortex-induced vibration classification framework aims to address include two stages: the first stage is to determine whether a vortex-induced vibration event occurs, and the second stage is to determine which vibration mode the vortex-induced vibration event belongs to.
The first stage involves using the fuzzy C-means clustering method to classify the current vibration measurements as either belonging to the vortex-induced vibration cluster or the non-vortex-induced vibration cluster. As detailed in Section 2.3, the fuzzy C-means clustering algorithm requires three pre-set parameters. The first parameter is the number of clusters, which, in this case, is set to 2 to distinguish solely between vortex-induced vibration and non-vortex-induced vibration.
The second parameter is the feature vector y i of a data point, which should consist of indicators that can differentiate between vortex-induced vibration and non-vortex-induced vibration. To well define the occurrence timing of vortex-induced vibration and non-vortex-induced vibration on a time scale, it is necessary to select certain vortex-induced vibration feature indicators that can be computed solely using short-time or instantaneous data. Among the feature indicators listed in Section 2.2, the wind speed, the RMS, the AR of the analytical signal, and the MAC can be calculated using short-time measurement data, and these are considered to construct the feature vector y i . In this study, the short-time resolution used for detecting vortex-induced vibrations is selected as one minute. In this case, the average wind speed, the RMS of vibration data, the AR of the analytical signal, and the maximum probability of MAC within one minute, are calculated to construct the initial feature vector y ^ i of the vibration within this minute, where i represents the i th datapoint (i.e., the i th minute). Based on the feature indicators described in Section 2.2, the range of variation for each feature indicator is distinct. For instance, the range of variation for MAC and the amplitude falls between 0 and 1, whereas the ranges for the RMS of the vibration signal and wind speed do not lie within this range. To prevent any single feature indicator from unduly impacting the clustering results, it should not directly use the initial feature vectors for clustering. Instead, it is necessary to subject each feature in the initial feature vector y ^ i = y ^ i 1 y ^ i 2 y ^ i 3 y ^ i 4 T to a standard normal distribution transformation. Subsequently, the transformed feature vector y i = y i 1 y i 2 y i 3 y i 4 T is used for clustering, where y i 1 to y i 4 are respectively transformed from y ^ i 1 to y ^ i 4 . After undergoing standard normal distribution transformation, the standard deviation of each feature becomes 1.
The third parameter is the initial center μ s of the cluster with s = 1 and s = 2 . In this study, the initial center is set according to the standard deviations of features. In detail, μ 1 = 1 1 1 1 T and μ 2 = 1 1 1 1 T . Except for the average wind speed feature, other features (the RMS of the vibration signal, the AR of the analytical signal, and the maximum probability of MAC after standard normal distribution transformation) exhibit a characteristic where the likelihood of a vortex-induced event occurring increases with higher feature values. Therefore, the cluster with the initial center μ 1 = 1 1 1 1 T is more likely associated with the vortex-induced vibration cluster. After the fuzzy C-means clustering, the time periods associated with vortex-induced vibration from those associated with non-vortex-induced vibration can be distinguished.
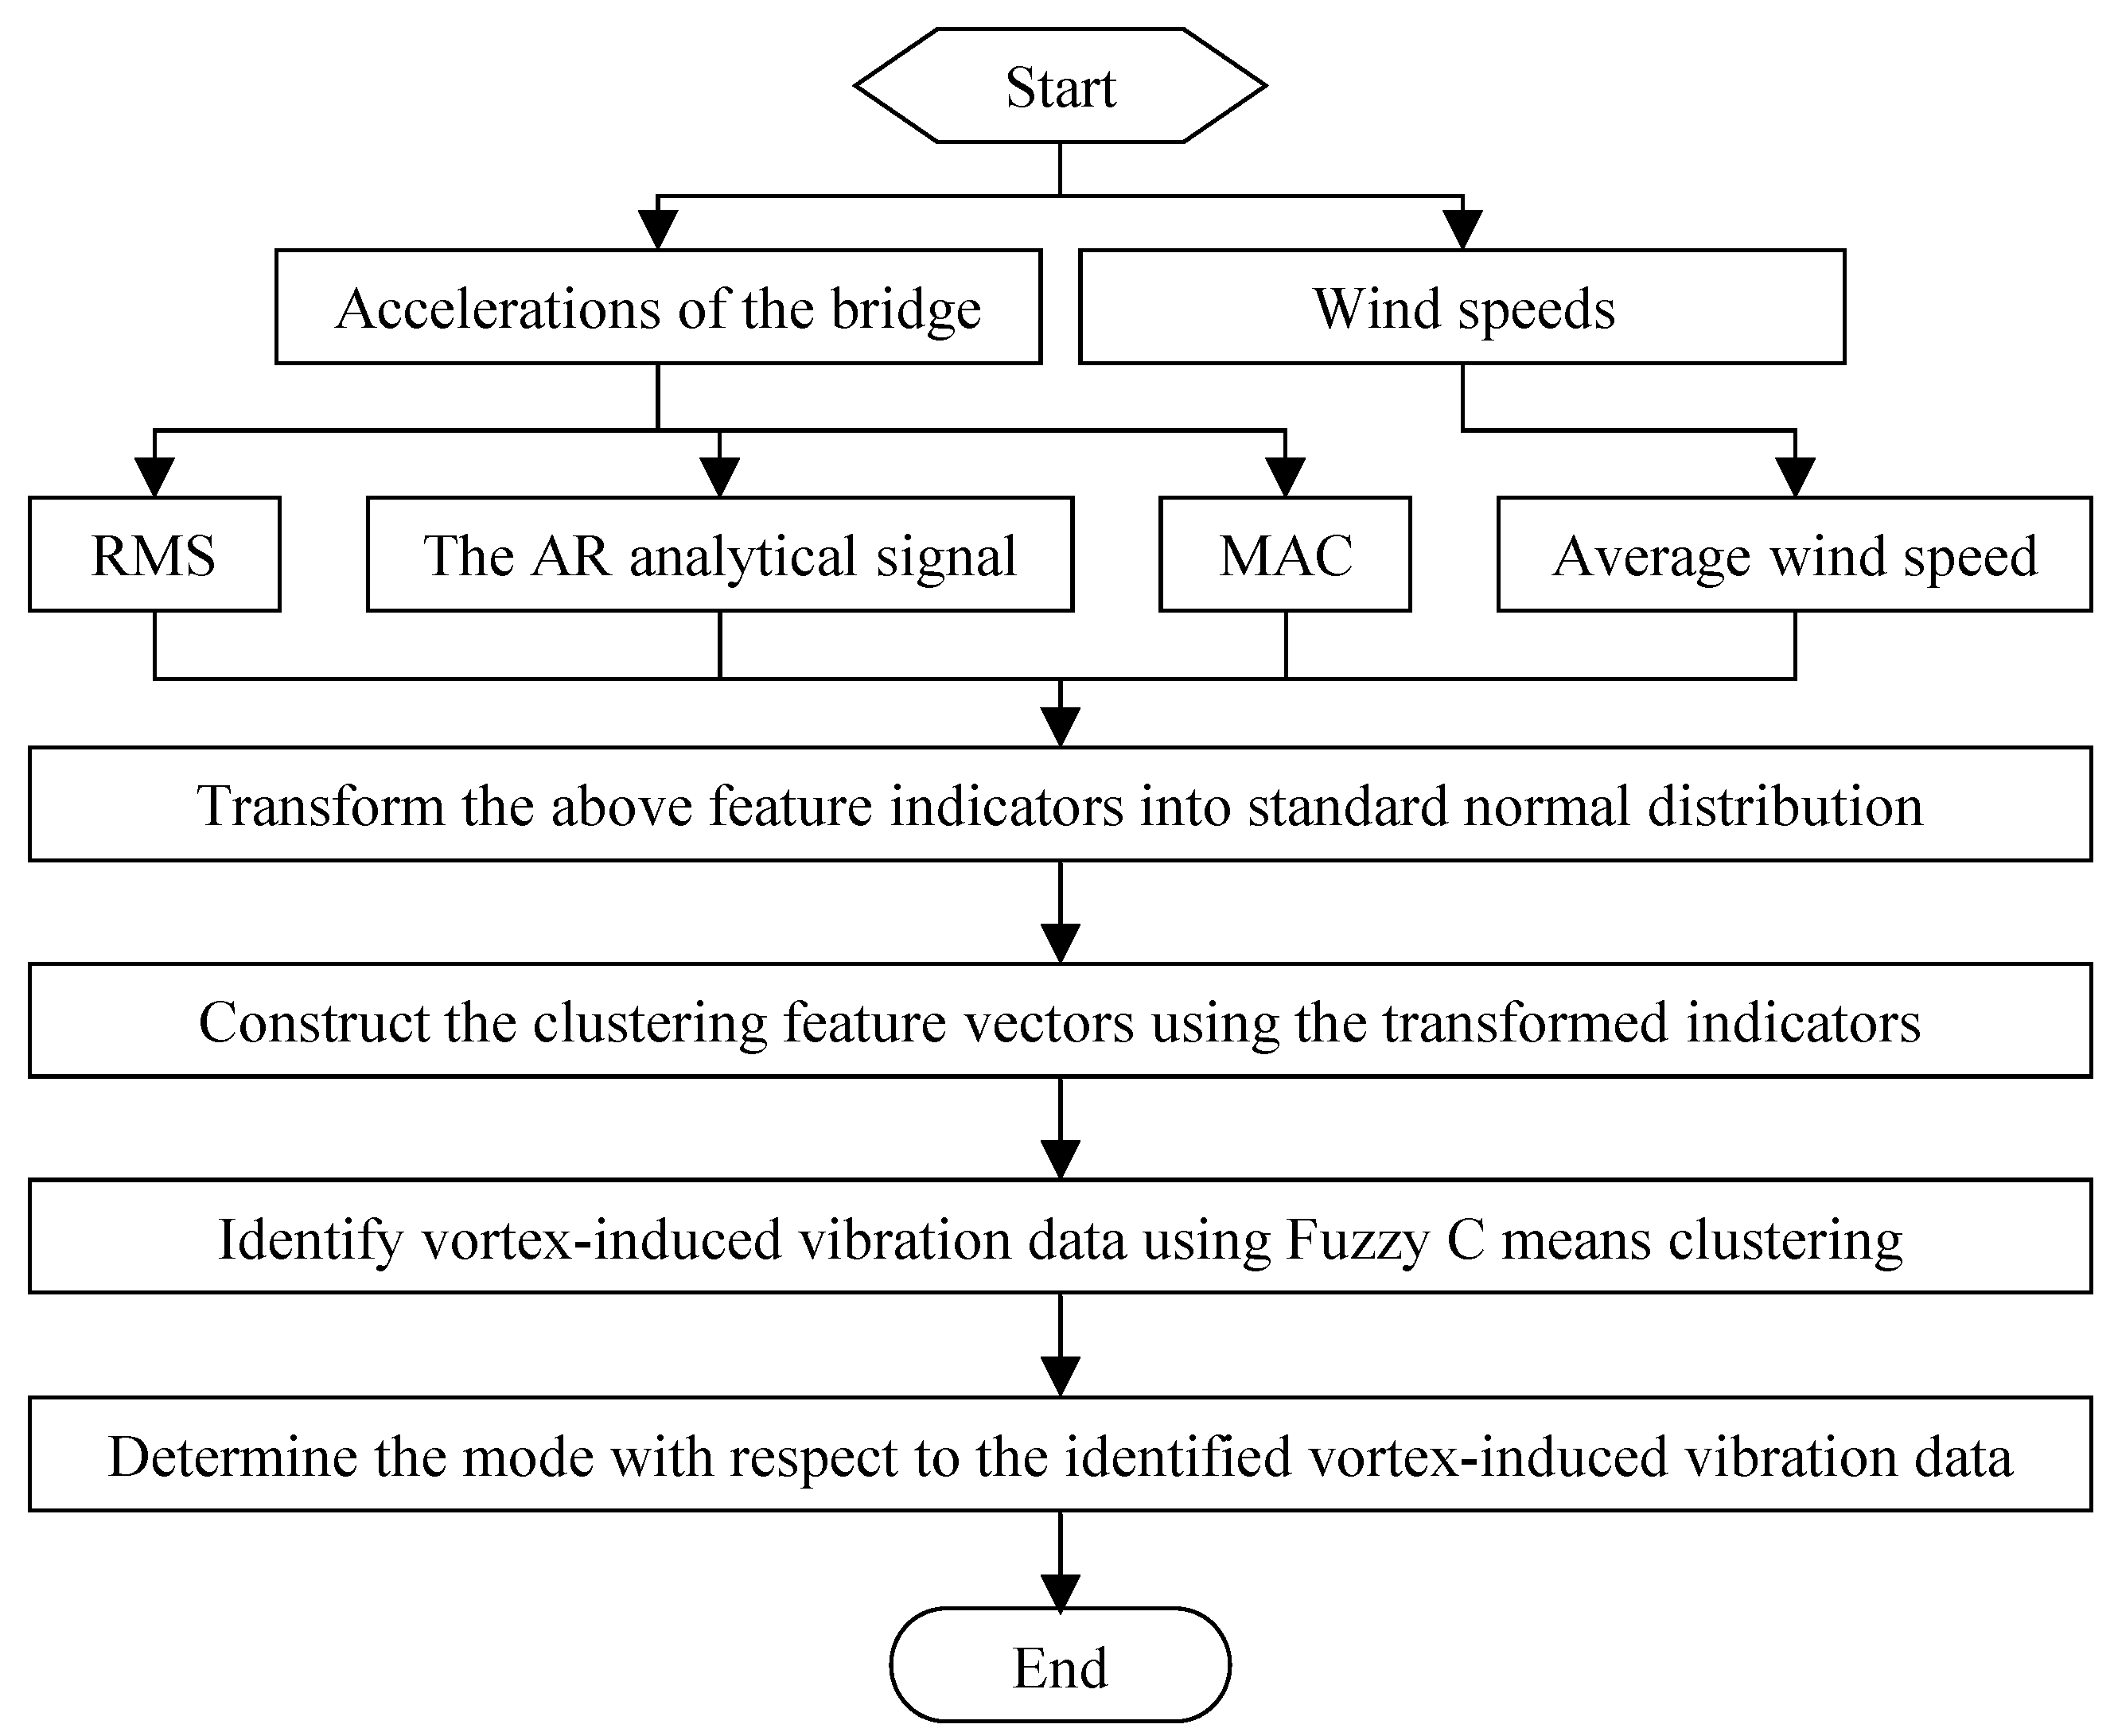
Once the occurrence of vortex-induced vibration has been detected, the next stage involves determining the specific mode to which the vortex-induced vibration belongs. First, the vortex-induced vibration signals are transformed into frequency domain, where the auto power spectral density functions are obtained. the vortex-induced vibration signals are converted into the frequency domain, resulting in the acquisition of auto power spectral density functions. Subsequently, the highest peak in the auto power spectral density function is identified, similar to that in Figure 2a. The frequency associated with the highest peak is linked to the vortex-induced vibration mode. The flowchart is given in Figure 4.

3. Case Study

3.1. Investigated Bridge and Its Monitoring

The analyzed vibration data in this study come from a sea-crossing highway suspension bridge. The elevation drawing of this long-span bridge is depicted in Figure 5, encompassing the main span and asymmetric side spans. The length of the main span is 1650 m. The northern side span extends 578 m and seamlessly connects to the main span, featuring a steel box girder with suspenders. The southern side span consists of a prestressed concrete continuous box girder without suspenders, measuring a total length of 485 m.
Since the construction of the bridge, a health monitoring system has been implemented to ensure the safe operation of the sea-crossing bridge. The monitoring variables in the health monitoring system for the bridge are mainly divided into two parts: load monitoring and response monitoring. Load monitoring includes environmental temperature, humidity, wind, and vehicle load, among others. Response monitoring includes spatial displacement, strain, and the acceleration of the bridge. Vortex-induced vibration analysis primarily utilizes two types of monitoring data: wind load and main girder vibration acceleration. In the bridge monitoring system, the three-axis ultrasonic anemometers (UA) are used to monitor wind speed and wind direction, as shown in Figure 5. The three-axis ultrasonic anemometers are installed on both sides at the mid-span and quarter points of the main span, with a sampling frequency of 32 Hz and a range of 0~65 m/s. The positions of the accelerometers (AC) are shown in Figure 5, where three single-axis accelerometers are installed at AC1, AC2, AC3, and AC4, used to monitor the vertical, transverse, and torsional acceleration responses of the main girder, with a sampling frequency of 50 Hz.
The wind speed record of the bridge within a certain hour of a day is shown in Figure 6. It is apparent that the wind speed in the area where the bridge is situated is relatively high, sometimes exceeding 15 m/s. Furthermore, previous studies [31] have indicated that in the vicinity of the bridge site, the maximum wind speed with a return period of 100 years reaches 41.12 m/s at a height of 10 m. Under the influence of such wind loads, the bridge has experienced over 280 instances of vortex-induced vibration from its opening to traffic until July 2020, with an average annual occurrence of 26.8 instances, each lasting between 10 to 300 min.

3.2. Operational Modal Analysis of the Bridge

In this study, the frequency domain decomposition technique [32], a classical operational modal identification method, was employed to extract the modal parameters of the bridge. One-hour random acceleration data from accelerometers AC2, AC3, and AC4 were utilized to calculate the first singular value spectrum. The results are presented in Figure 7. By identifying peaks in the first singular value spectrum, the frequencies are estimated. By performing singular value decomposition on the power spectral density matrix with respect to the estimated frequency, the mode shape vector is obtained as the first left singular vector.
The identified frequencies are presented in Table 1, with the analytical frequencies related to the bridge model also included in Table 1. The frequencies of ten modes are estimated from acceleration data, aligning with modes 1, 2, 3, 5, 6, 8, 9, 10, 12, and 13 of the analytical model. Since the monitoring system was installed, vortex-induced vibration events corresponding to eight modes have been observed, which are also listed in Table 1. Moreover, the identified mode shapes with respect to eight vortex-induced vibration modes are presented in Figure 8. The dashed lines in Figure 8 represent the mode shapes of the analytical model, while the dots represent the identified mode shape values at measurement points, which will be used for the vortex-induced vibration index calculation in Equation (10).

3.3. Classification Results of Vortex-Induced Vibration

An analysis was conducted on a 287 min dataset containing vortex-induced vibrations. During this period, there were distinct forms of vibrations, including ideal vortex-induced vibration, weak vortex-induced vibration, and non-vortex-induced vibration. Specifically, the ideal vortex-induced vibration form involves only single-mode participation in the vibration, while the weak vortex-induced vibration form is primarily characterized by single-mode participation but may include some measurement noise. The non-vortex-induced vibration form entails the participation of multiple modes and exhibits a random fluctuation phenomenon.
The RMS of acceleration, average wind speed, AR of the analytical signal, and the maximum probability of MAC for each minute of data were calculated to construct the initial feature vector y ^ i = y ^ i 1 y ^ i 2 y ^ i 3 y ^ i 4 T of a data point i . By calculating one by one, a total of 287 initial feature vectors y ^ i for i = 1 to 287 have been obtained. By performing a standard normal distribution transformation on the initial feature vectors, feature vectors y i for each data point are obtained. The fuzzy C-means clustering algorithm was utilized to categorize the vibrations into two distinct groups: vortex-induced vibrations and non-vortex-induced vibrations. After clustering, the distributions of various vibration feature indicators for the vortex-induced vibration and non-vortex-induced vibration categories are displayed in Figure 9. Taking Figure 9a as an example, the RMS of acceleration associated with vortex-induced vibration is higher than that of non-vortex-induced vibration on the whole, which accords with the characteristic that vortex-induced vibration amplitude is generally higher than normal vibration amplitude. Other indicators have produced similar results.
The time periods and vibration accelerations are depicted in Figure 10, where the acceleration waveforms illustrating ideal vortex-induced vibrations, weak vortex-induced vibrations, and non-vortex-induced vibrations are provided. Based on the time history of acceleration data in Figure 10, it can be observed that there were two significant occurrences of vortex-induced vibrations at around 1000 s and 14,000 s, both of which were detected effectively.
Subsequently, power spectral density analysis was conducted on the vortex-induced vibration data from 500 s to 1500 s and from 13,500 s to 14,500 s, as illustrated in Figure 11. It was found that the highest peaks on both power spectra corresponded to a mode of 0.275 Hz, indicating that the vortex-induced vibration mode corresponds to the 8th mode listed in Table 1.

3.4. Correlation Analysis for Vortex-Induced Vibration

Conducting the correlation analysis between vortex-induced vibration responses and other monitored variables is essential for the data-driven prediction of vortex-induced vibration performance. As displacement monitoring data for the girder of this bridge is unavailable in this study, the RMS of acceleration is utilized as a representative indicator for vortex-induced vibration amplitude. Taking the selected vortex-induced vibration data (including ideal vortex-induced vibration and weak vortex-induced vibration) shown in Figure 10 as an example, the correlation scatters between the RMS of acceleration and other variables are presented in Figure 12.
First, correlation scatter plots are created by using the maximum probability value of MAC and the RMS of acceleration, as illustrated in Figure 12a. The ideal vortex scenario marked in Figure 12 is related to the single-mode vibration scenario shown in Figure 10. In the case of ideal vortex-induced vibration scenarios, the root mean square acceleration of vortex-induced vibration is notably high, with the maximum probability value of the modal assurance criterion ranging between 0.97 and 1 (indicating a robust linear relationship between the vortex-induced vibration response and the 8th mode shape). Furthermore, Figure 12b displays the scatter plot illustrating the correlation between the RMS of acceleration and the one-minute average wind speed. It is evident that higher wind speeds do not necessarily result in larger RMS of accelerations, nor do they imply more ideal vortex-induced vibrations. Specifically, for the 8th mode, the average wind speeds associated with the occurrence of ideal vortex-induced vibrations range from 5.2 to 6.6 m/s. This phenomenon is consistent with the wind speed locking theory when vortex-induced vibrations occur. Therefore, when the average wind speed falls within the 5.2 to 6.6 m/s range, if there is a relatively high MAC between the real-time vibration response at multiple measuring points and the 8th mode shape, special attention should be given to the possible onset of the 8th mode vortex-induced vibration with high vibration amplitude, and to assess whether necessary measures need to be implemented to control the vibrations.

4. Conclusions

This study presents an unsupervised classification method for identifying the moments when vortex-induced vibration occurs, which is essential for constructing correlation models used in the early-warning of bridge vortex-induced performance.
To reliably determine the occurrence moments of vortex-induced vibration, a combination of short-term and nearly instantaneous vortex-induced vibration indicators are employed, including the average wind speed, the RMS of vibration data, the AR of the analytical signal, and the maximum probability of MAC.
The fuzzy C-means clustering is employed to automatically detect vortex-induced vibration, without the need to set threshold values for the vibration indicators. In this approach, the number of clusters is automatically set to 2. Additionally, to address unequal contributions from different indicators, the clustering indicators actually utilize the calculated values of vortex-induced vibration indicators transformed by normal distribution.
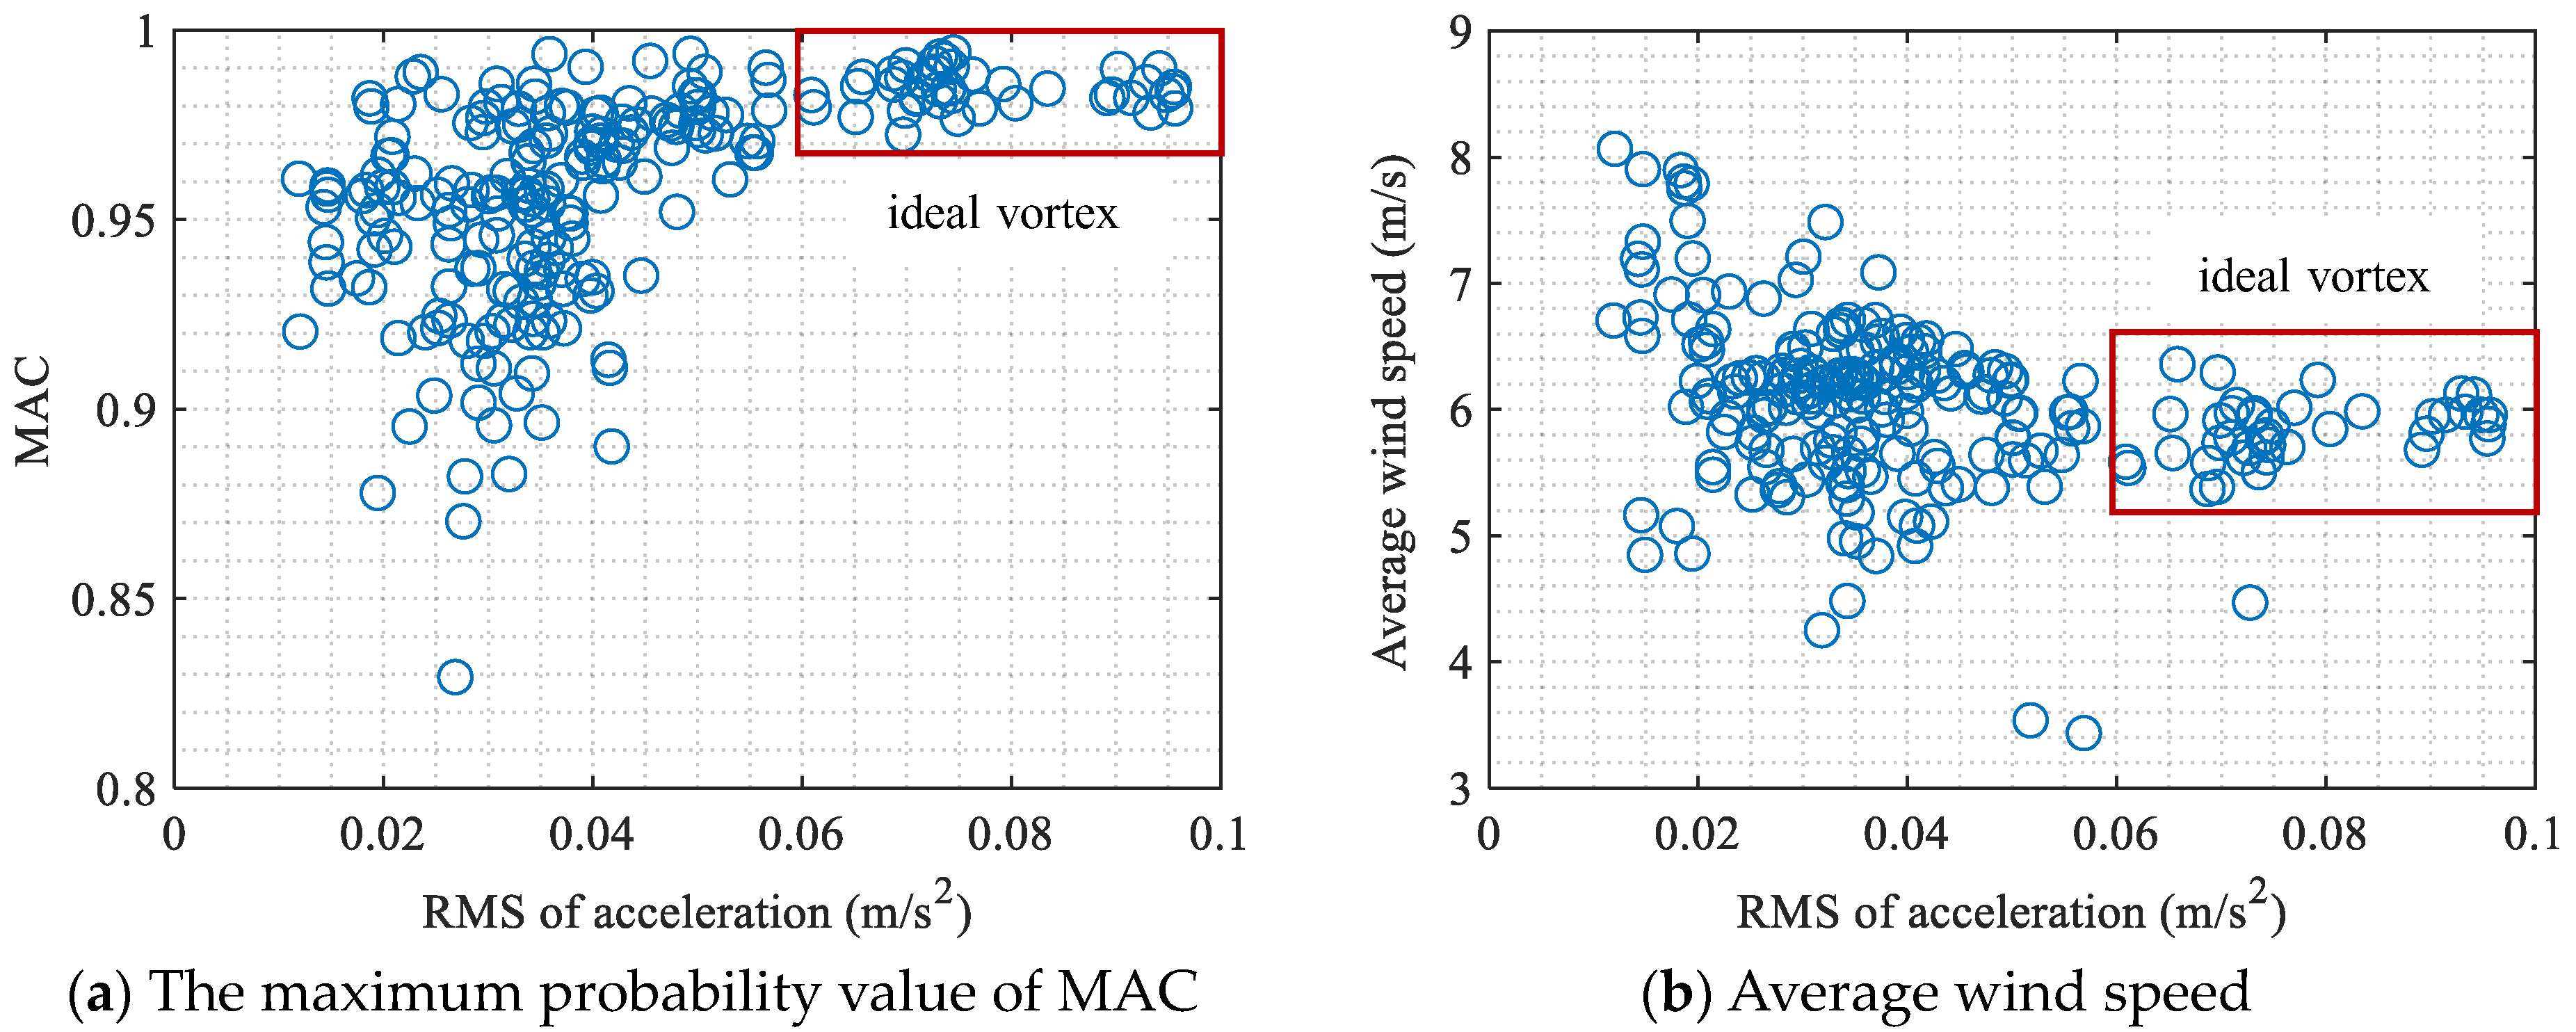
Analyzing the monitoring data of actual bridges, it was found that the ideal vortex-induced vibration does not continuously occur over a long period of time. The correlation between non-vortex-induced vibration amplitude and environmental factors exhibits a completely different trend compared to the correlation between vortex-induced vibration amplitude and environmental factors.
Nevertheless, due to limitations in the monitoring data, only four indicators have been applied to identify vortex-induced vibration. In fact, other information such as wind direction angle is also an important basis for accurately distinguishing vortex-induced vibration. If the monitoring data allows, more wind field characteristics should be applied in the future.

Author Contributions

Conceptualization, T.C.; methodology, X.-M.Y.; validation, Y.-L.W. and S.-H.Y.; original draft preparation, T.C. and X.-M.Y.; review and editing, Y.-L.W. All authors have read and agreed to the published version of the manuscript.

Funding

This project was funded by grants from the Natural Science Foundation of Liaoning Province (Grant No. 2023-BS-064), the Foundation for High-Level Talent Innovation Support Program of Dalian (Grant No. 2022RQ013), the Open Project Program of Guangdong Provincial Key Laboratory of Intelligent Disaster Prevention and Emergency Technologies for Urban Lifeline Engineering (Grant No. 2022ZA02), and the Open Project Program of Key Laboratory of Roads and Railway Engineering Safety Control (Shijiazhuang Tiedao University) Ministry of Education (STDTKF202201).

Data Availability Statement

The data used to support the findings of the study are available from the corresponding author upon request.

Conflicts of Interest

The authors declare that they have no conflicts of interest.

References

  1. Yang, R.; Li, Y.; Xu, C.; Yang, Y.; Fang, C. Directional effects of correlated wind and waves on the dynamic response of long-span sea-crossing bridges. Appl. Ocean Res. 2023, 132, 103483. [Google Scholar] [CrossRef]
  2. Lei, W.; Wang, Q.; Zhang, Y.; Li, Z. Study on VIV performance of streamlined steel box girder of a sea-crossing cable-stayed bridge. Ocean Eng. 2024, 295, 116897. [Google Scholar] [CrossRef]
  3. Yao, G.; Chen, Y.; Yang, Y.; Zheng, Y.; Du, H.; Wu, L. Investigation of vortex-induced vibration of double-deck truss girder with aerodynamic mitigation measures. J. Mar. Sci. Eng. 2023, 11, 1118. [Google Scholar] [CrossRef]
  4. Fujino, Y.; Yoshida, Y. Wind-induced vibration and control of Trans-Tokyo Bay crossing bridge. J. Struct. Eng. 2002, 128, 1012–1025. [Google Scholar] [CrossRef]
  5. Lim, H.; Manuel, L.; Low, Y.M.; Srinil, N. A surrogate model for estimating uncertainty in marine riser fatigue damage resulting from vortex-induced vibration. Eng. Struct. 2022, 254, 113796. [Google Scholar] [CrossRef]
  6. Zhang, J.; Zhou, L.; Tian, Y.; Yu, S.; Zhao, W.; Cheng, Y. Vortex-induced vibration measurement of a long-span suspension bridge through noncontact sensing strategies. Comput-Aided Civil. Infrastruct. Eng. 2022, 37, 1617–1633. [Google Scholar] [CrossRef]
  7. Kim, S.; Kim, T. Machine-learning-based prediction of vortex-induced vibration in long-span bridges using limited information. Eng. Struct. 2022, 266, 114551. [Google Scholar] [CrossRef]
  8. Liu, D.; Li, X.; Mei, F.; Xin, L.; Zhou, Z. Effect of vertical vortex-induced vibration of bridge on railway vehicle’s running performance. Veh. Syst. Dyn. 2023, 61, 1432–1447. [Google Scholar] [CrossRef]
  9. Kim, G.Y.; Lim, C.; Kim, E.S.; Shin, S.C. Prediction of dynamic responses of flow-induced vibration using deep learning. Appl. Sci. 2021, 11, 7163. [Google Scholar] [CrossRef]
  10. Yan, Z.; Zheng, S.; Yang, F.; Tai, X.; Chen, Z. A simplified approach to recognize vortex-induced vibration response using machine learning. Struct. Eng. Int. 2024, 1–13. [Google Scholar] [CrossRef]
  11. Ge, B.; Ma, R.; Li, F.; Hu, X.; Chen, A. Probabilistic vortex-induced vibration occurrence prediction of the twin-box girder for long-span cable-stayed bridges based on wind tunnel tests. Eng. Struct. 2022, 262, 114325. [Google Scholar] [CrossRef]
  12. Wang, B.; Hao, S.; Xu, Y.L.; Liu, Y.; Li, Y. Modelling of vortex-induced force and prediction of vortex-induced vibration of a bridge deck using method of multiple scales. J. Wind Eng. Ind. Aerodyn. 2023, 241, 105533. [Google Scholar] [CrossRef]
  13. Govardhan, R.; Williamson, C. Modes of vortex formation and frequency response of a freely vibrating cylinder. J. Fluid. Mech. 2000, 420, 85–130. [Google Scholar] [CrossRef]
  14. Duranay, A. Numerical and experimental investigation of vortex formation modes on a freely vibrating circular cylinder at high Reynolds numbers. Appl. Ocean Res. 2024, 144, 103909. [Google Scholar] [CrossRef]
  15. Duranay, A.; Usta, O.; Kinaci, O.K. Systematic investigation of the tip effects on vortex-induced vibrations for circular cylinders. Ocean Eng. 2021, 239, 109829. [Google Scholar] [CrossRef]
  16. Chmelko, V.; Garan, M.; Šulko, M.; Gašparík, M. Health and structural integrity of monitoring systems: The case study of pressurized pipelines. Appl. Sci. 2020, 10, 6023. [Google Scholar] [CrossRef]
  17. Surace, C. Special issue on novel approaches for structural health monitoring. Appl. Sci. 2021, 11, 7210. [Google Scholar] [CrossRef]
  18. Wang, Y.; Feng, H.; Xu, N.; Zhong, J.; Wang, Z.; Yao, W.; Laima, S. A data-driven model for predictive modeling of vortex-induced vibrations of a long-span bridge. Appl. Sci. 2024, 14, 2233. [Google Scholar] [CrossRef]
  19. Mentzelopoulos, A.P.; del Águila Ferrandis, J.; Rudy, S.; Sapsis, T.; Triantafyllou, M.S.; Fan, D. Data-driven prediction and study of vortex induced vibrations by leveraging hydrodynamic coefficient databases learned from sparse sensors. Ocean Eng. 2022, 266, 112833. [Google Scholar] [CrossRef]
  20. Zhang, G.Q.; Xu, Y.L.; Dan, D.H.; Jiang, S.J.; Zhu, Q. Simulation and prediction of vortex-induced vibration of a long suspension bridge using SHM-based digital twin technology. J. Wind Eng. Ind. Aerodyn. 2024, 247, 105705. [Google Scholar] [CrossRef]
  21. Xu, S.; Ma, R.; Wang, D.; Chen, A.; Tian, H. Prediction analysis of vortex-induced vibration of long-span suspension bridge based on monitoring data. J. Wind Eng. Ind. Aerodyn. 2019, 191, 312–324. [Google Scholar] [CrossRef]
  22. Gao, C.; Shi, Z.; Zhang, W. Data-knowledge-driven semi-empirical model augmentation method for nonlinear vortex-induced vibration. Nonlinear Dyn. 2023, 111, 20617–20642. [Google Scholar] [CrossRef]
  23. Kim, S.; Kim, S.; Kim, H.K. High-mode vortex-induced vibration of stay cables: Monitoring, cause investigation, and mitigation. J. Sound Vib. 2022, 524, 116758. [Google Scholar] [CrossRef]
  24. Arul, M.; Kareem, A.; Kwon, D.K. Identification of vortex-induced vibration of tall building pinnacle using cluster analysis for fatigue evaluation: Application to Burj Khalifa. J. Struct. Eng. 2020, 146, 04020234. [Google Scholar] [CrossRef]
  25. Huang, Z.; Li, Y.; Hua, X.; Chen, Z.; Wen, Q. Automatic identification of bridge vortex-induced vibration using random decrement method. Appl. Sci. 2019, 9, 2049. [Google Scholar] [CrossRef]
  26. Cao, S.; Zhang, Y.; Tian, H.; Ma, R.; Chang, W.; Chen, A. Drive comfort and safety evaluation for vortex-induced vibration of a suspension bridge based on monitoring data. J. Wind Eng. Ind. Aerodyn. 2020, 204, 104266. [Google Scholar] [CrossRef]
  27. Lim, J.; Kim, S.; Kim, H.K. Using supervised learning techniques to automatically classify vortex-induced vibration in long-span bridges. J. Wind Eng. Ind. Aerodyn. 2022, 221, 104904. [Google Scholar] [CrossRef]
  28. Li, S.; Laima, S.; Li, H. Data-driven modeling of vortex-induced vibration of a long-span suspension bridge using decision tree learning and support vector regression. J. Wind Eng. Ind. Aerodyn. 2018, 172, 196–211. [Google Scholar] [CrossRef]
  29. Guo, J.; Shen, Y.; Weng, B.; Zhong, C. Characteristic parameter analysis for identification of vortex-induced vibrations of a long-span bridge. J. Civ. Struct. Health Monit. 2024, 1–24. [Google Scholar] [CrossRef]
  30. Dan, D.; Li, H. Monitoring, intelligent perception, and early warning of vortex-induced vibration of suspension bridge. Struct. Control Health Monit. 2022, 29, e2928. [Google Scholar] [CrossRef]
  31. Guo, J.; Zhong, C.J.; Wu, J.Y.; Ma, K.J.; Weng, B.W.; Xiao, C.L. Analysis of vortex-induced vibration characteristics of Xihoumen bridge. Eng. Mech. 2023, 40, 39–45. (In Chinese) [Google Scholar]
  32. Brincker, R.; Zhang, L.; Andersen, P. Modal identification of output-only systems using frequency domain decomposition. Smart Mater. Struct. 2001, 10, 441. [Google Scholar] [CrossRef]
Figure 1. Vibration signals measured from a bridge.
Jmse 12 01890 g001
Figure 2. Power spectral density functions of vibration signals.
Jmse 12 01890 g002
Figure 3. The real-imaginary plot of analytical signals.
Jmse 12 01890 g003
Figure 4. Flowchart of the method.
Jmse 12 01890 g004
Figure 5. Bridge and its monitoring sensor.
Jmse 12 01890 g005
Figure 6. Wind speeds.
Jmse 12 01890 g006
Figure 7. The first singular value spectrum.
Jmse 12 01890 g007
Figure 8. Mode shapes.
Jmse 12 01890 g008
Figure 9. Vibration features.
Jmse 12 01890 g009
Figure 10. Vibration accelerations.
Jmse 12 01890 g010
Figure 11. Power spectral density functions of vibration accelerations.
Jmse 12 01890 g011
Figure 12. The correlation relations for RMS of accelerations.
Jmse 12 01890 g012
Table 1. Bridge modal parameters.
ModeNumerical Model’s
Frequency (Hz)
Vibration Measurements
Frequency (Hz)Damping Ratio (%)Vortex-Induced Events
10.0930.0950.43no
20.1000.1040.52no
30.1320.1330.35yes
40.178_________
50.1840.1830.22yes
60.2290.2300.29yes
70.260_________
80.2730.2750.91yes
90.3230.3260.38yes
100.3730.3790.40yes
110.397_________
120.4270.4360.69yes
130.4810.4990.43yes
140.529_________
Disclaimer/Publisher’s Note: The statements, opinions and data contained in all publications are solely those of the individual author(s) and contributor(s) and not of MDPI and/or the editor(s). MDPI and/or the editor(s) disclaim responsibility for any injury to people or property resulting from any ideas, methods, instructions or products referred to in the content.

