
A Hybrid Approach Based on the SR-HWPT-PDF for Identifying Early Fault Signals in Rolling Bearings

 , , , , , and
Abstract
1. Introduction
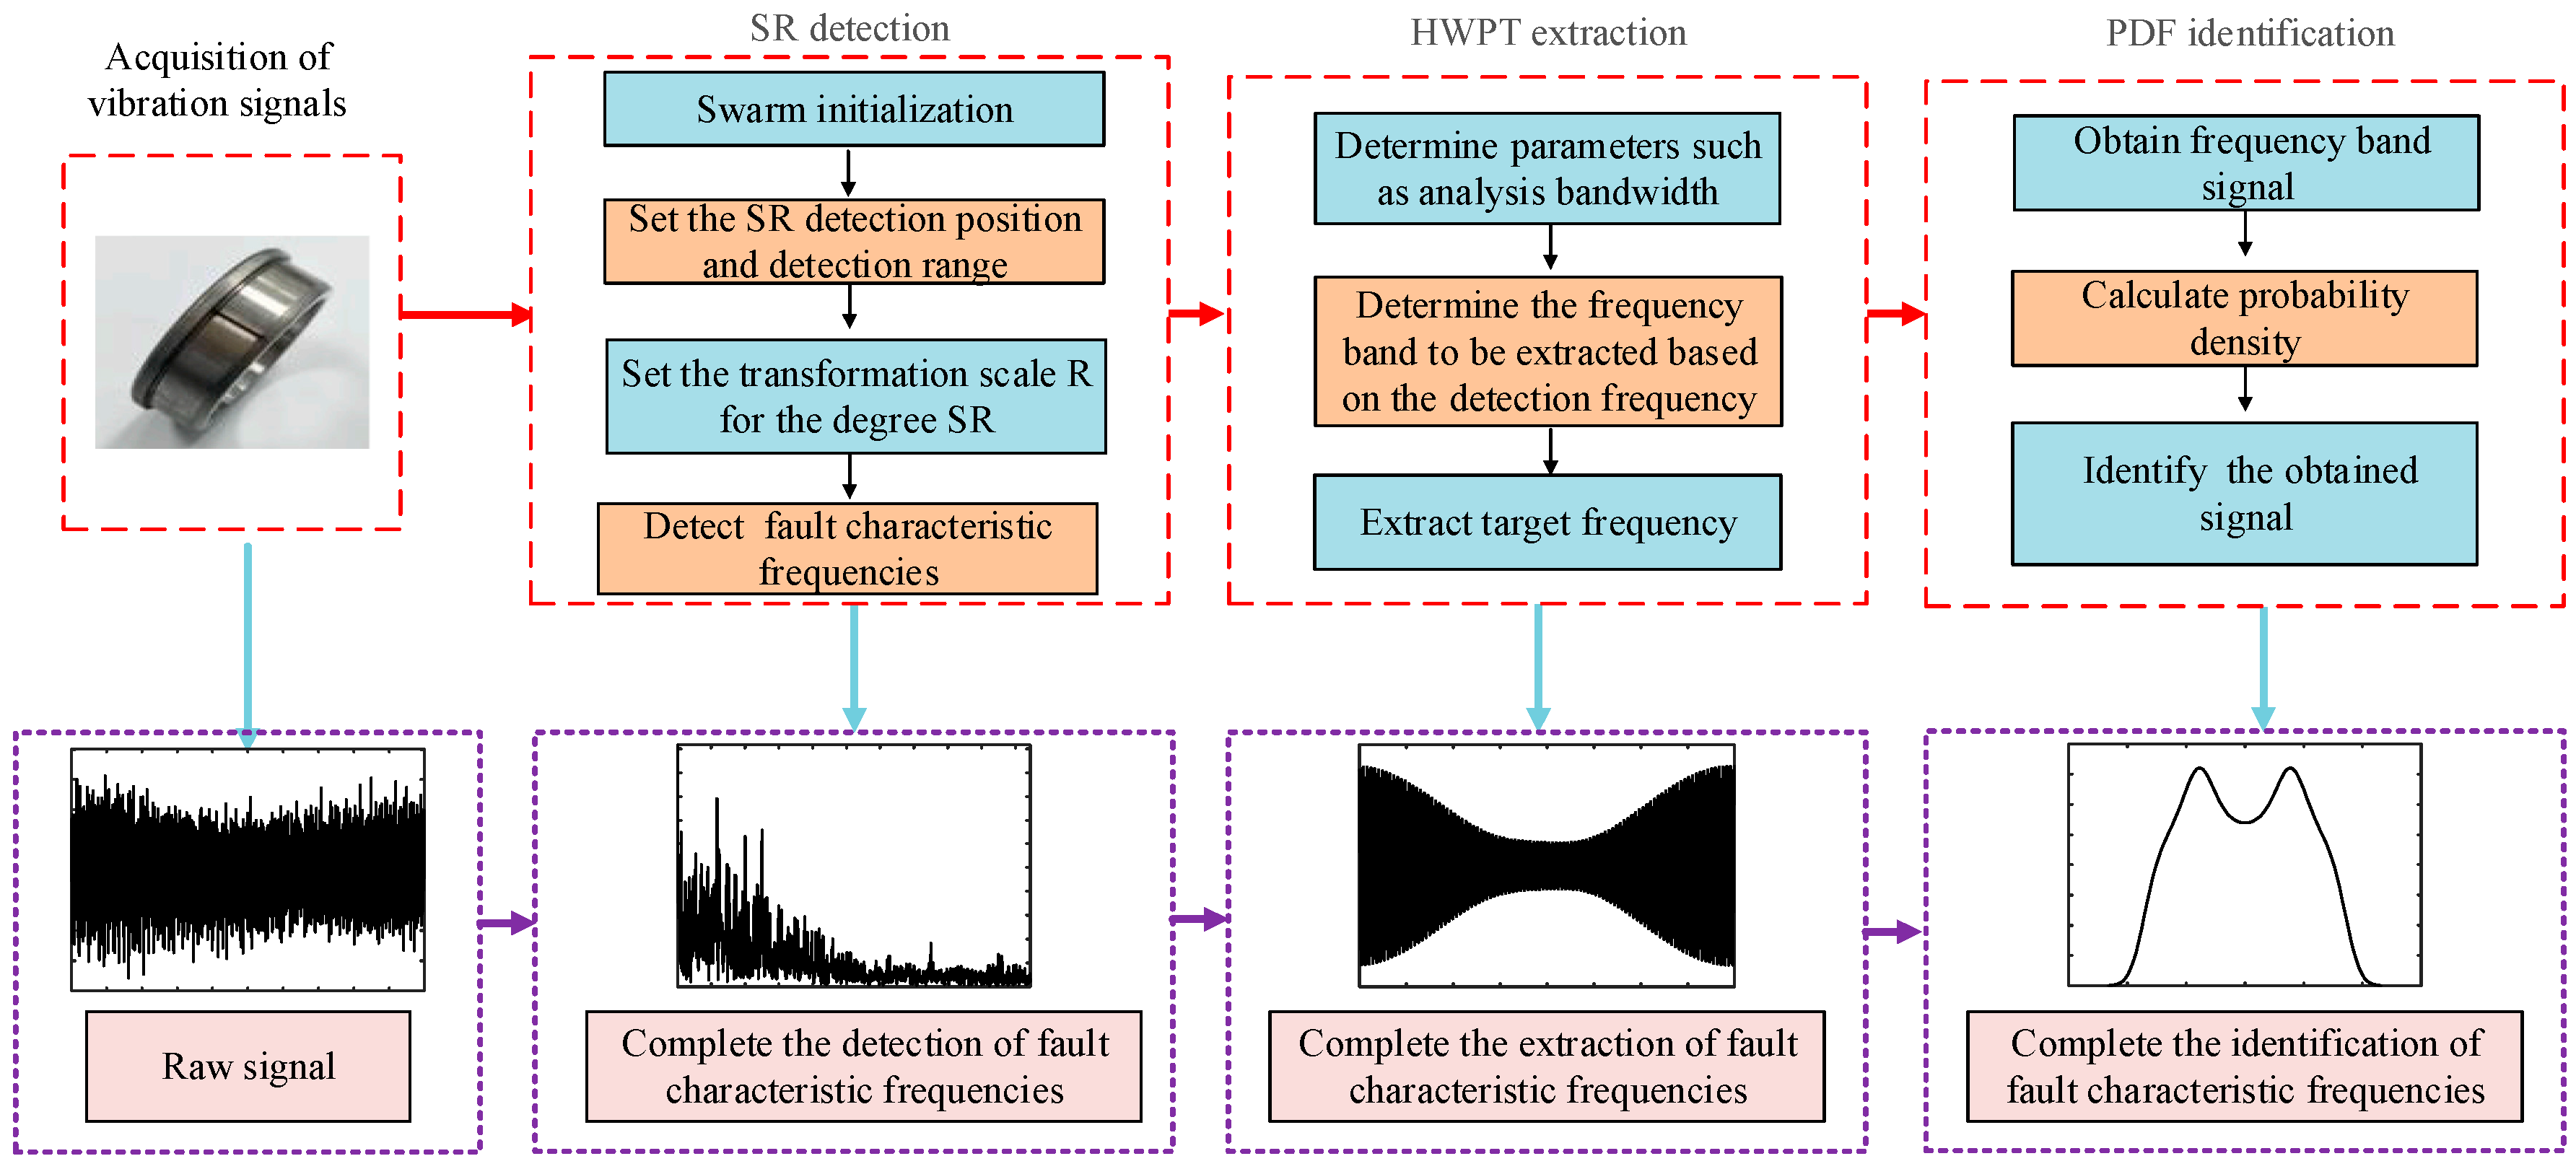
2. Proposed Method
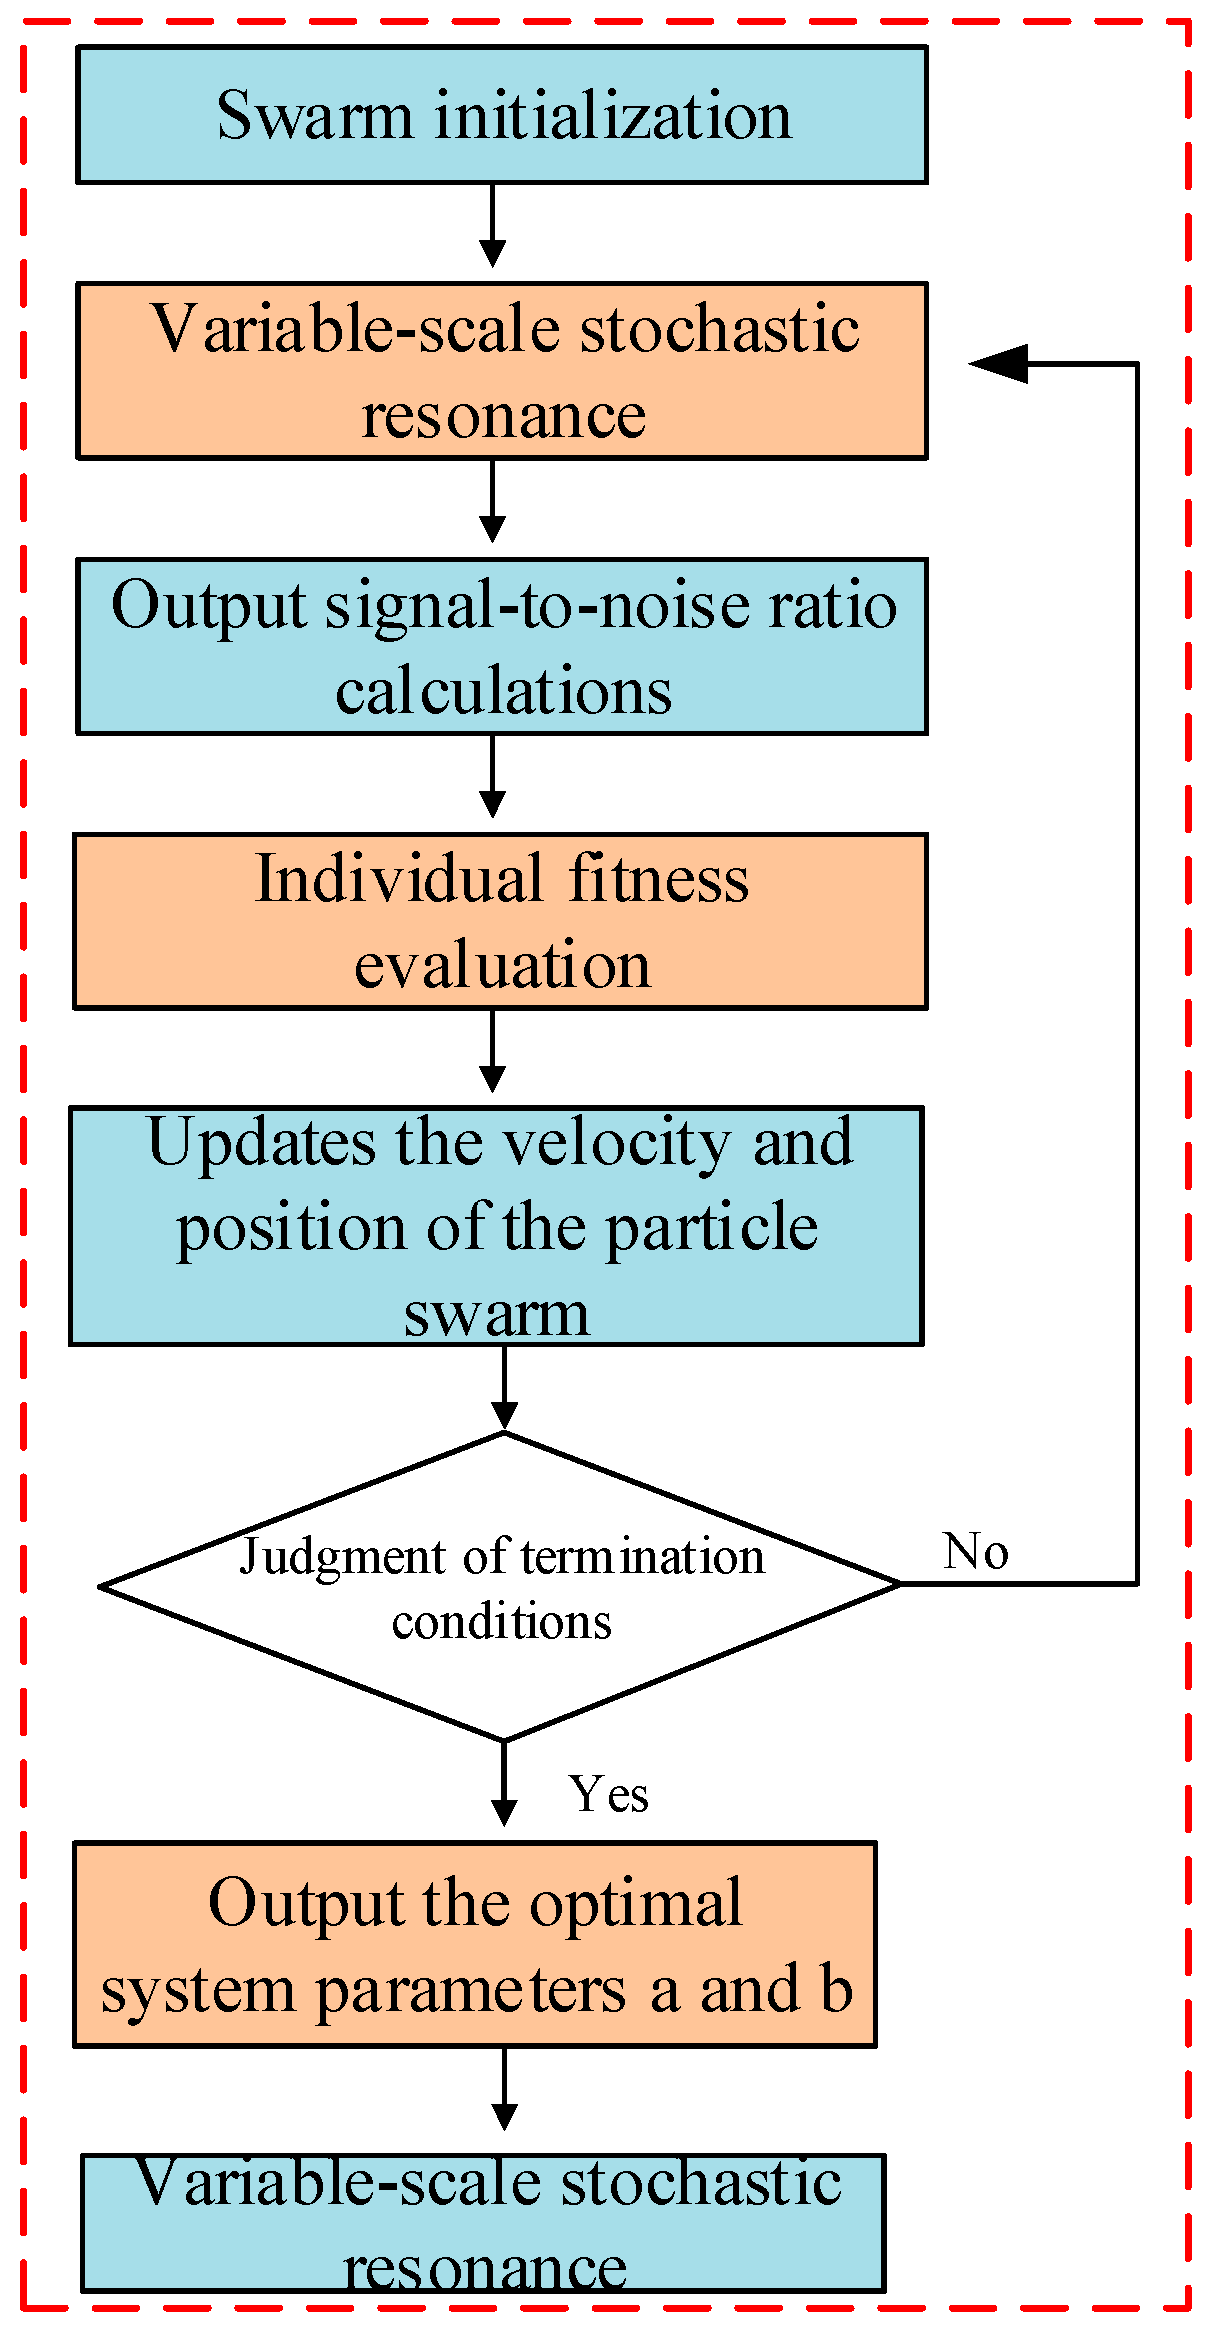
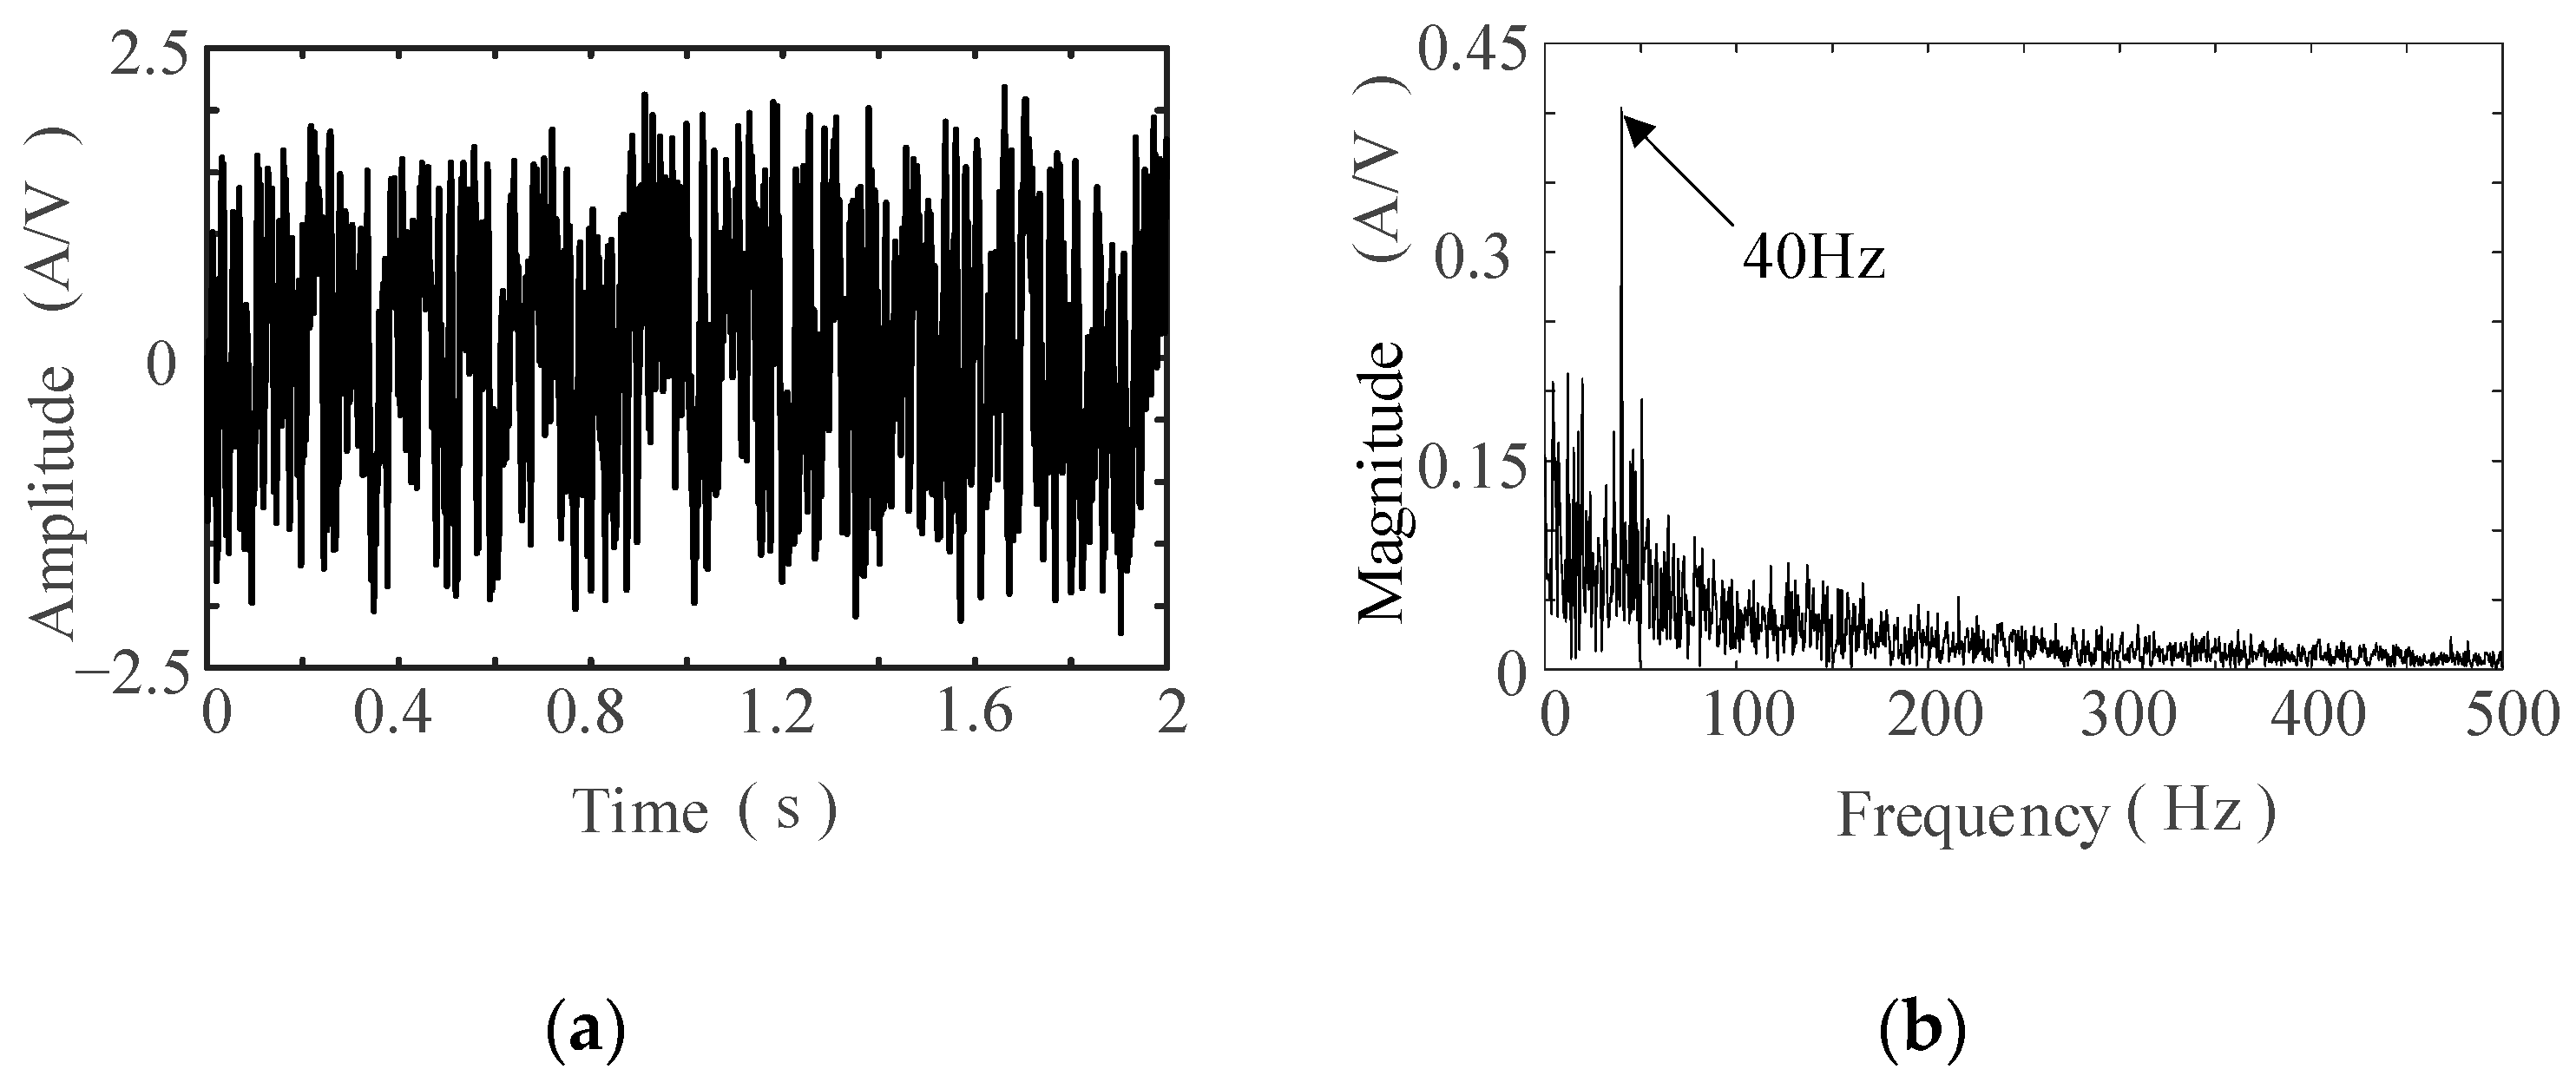
2.1. Detection of Fault Signals
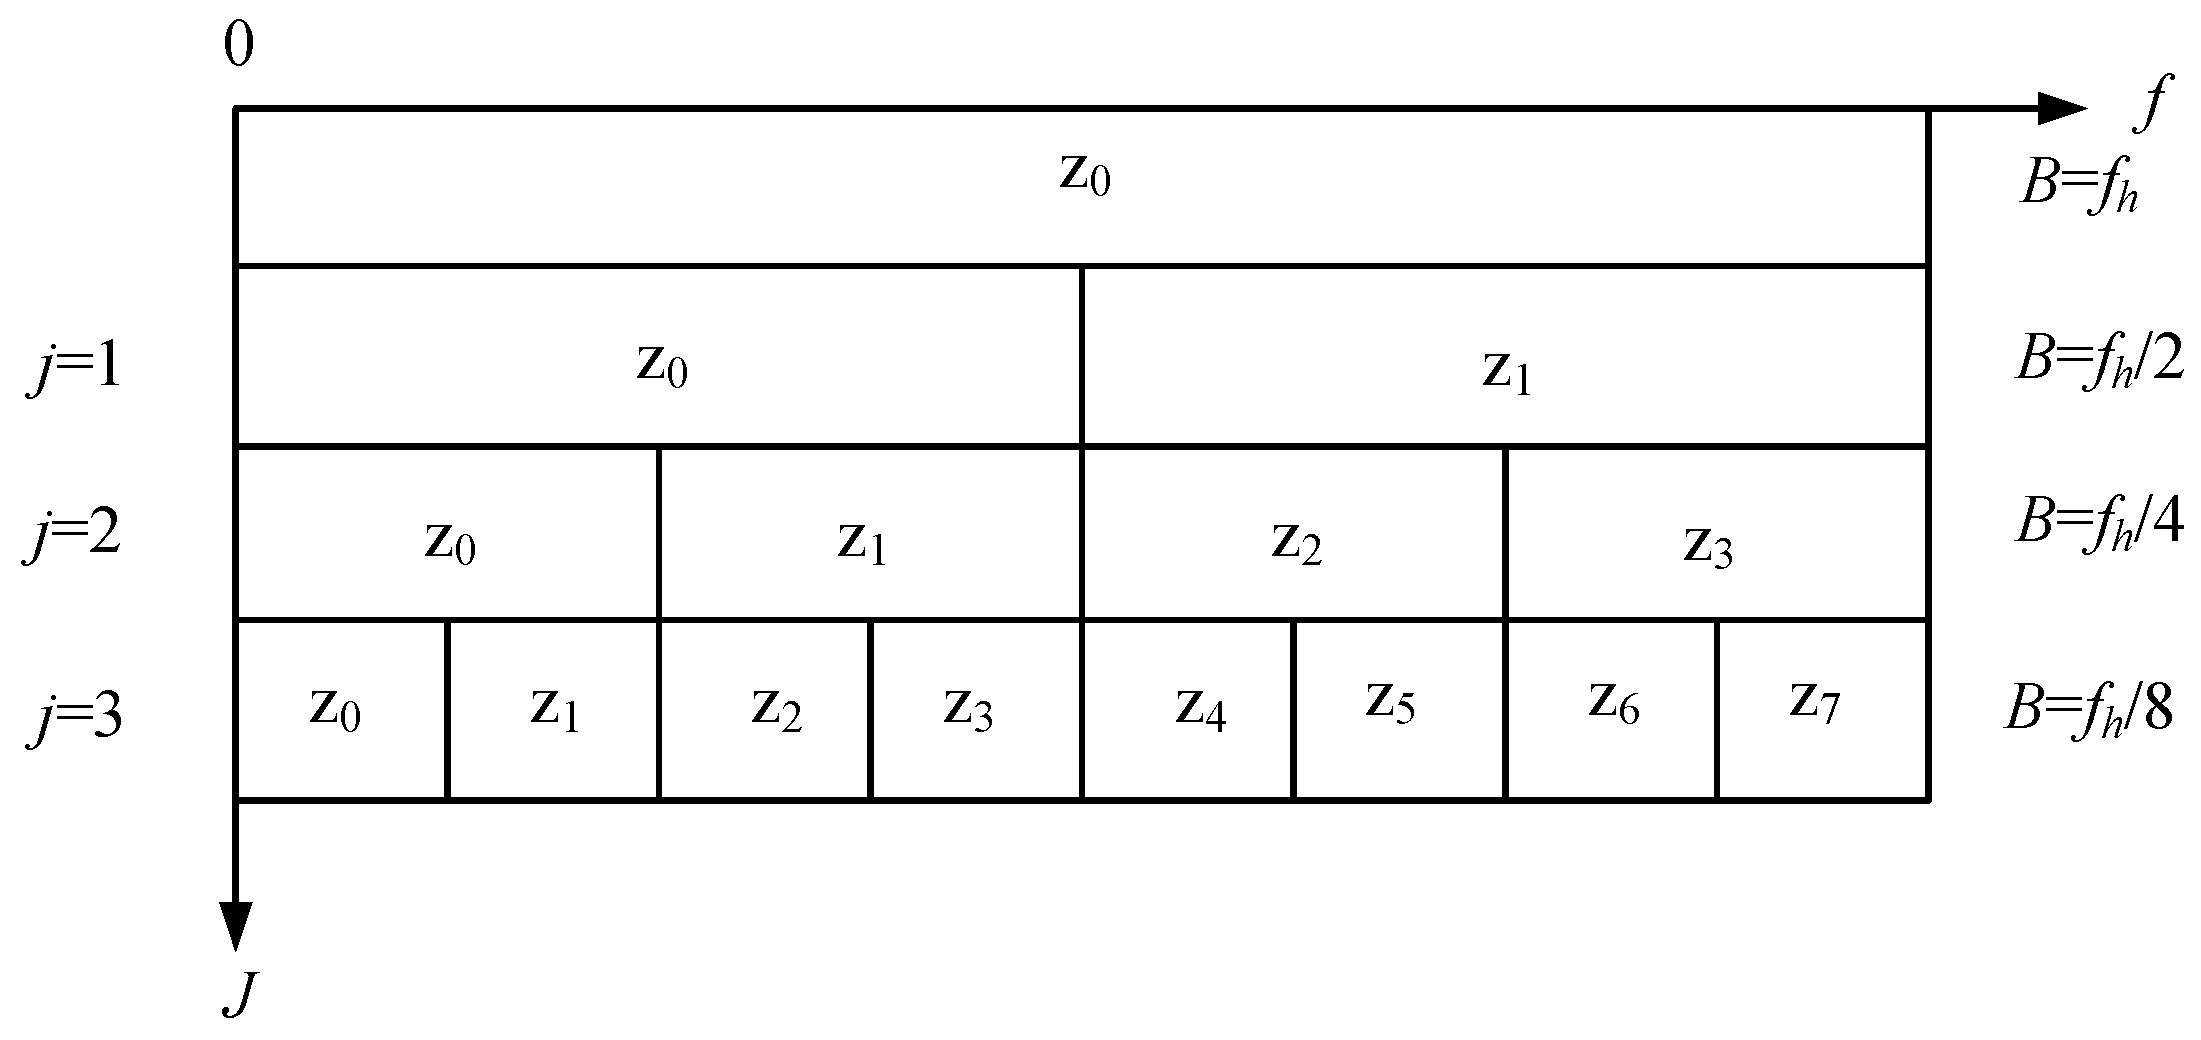
2.2. Extraction of Fault Signals
2.3. Identification of Fault Signals
3. Instance Validation
3.1. Example Introduction
3.2. Results and Discussion
3.2.1. Fault Detection of Rolling Element
3.2.2. Fault Detection of Outer Ring
3.2.3. Fault Detection of Inner Ring
4. Conclusions
- (1)
- Actual failure cases of rolling bearings in the drive motors of offshore platform water injection pumps reveal a significant discrepancy between the failure frequencies observed under real operating conditions and those theoretically derived under rated conditions. Consequently, relying exclusively on failure frequency values derived from theoretical calculations is inadequate for accurately identifying and extracting bearing fault characteristic signals from measured vibration signals.
- (2)
- When employing SR for the detection of fault frequencies within a specified range, it is crucial to recognize that the detected periodic components may not invariably correspond to the fault characteristic frequencies of rolling bearings. Consequently, it is of utmost importance to carry out a verification of the frequencies detected through SR in order to validate their authenticity as representative of fault characteristic frequencies.
- (3)
- Without knowing the exact failure characteristic frequency of rolling bearing, the weak fault signal can be detected, extracted and identified by using a hybrid approach combining SR, HWPT and PDF.
Author Contributions
Funding
Institutional Review Board Statement
Informed Consent Statement
Data Availability Statement
Acknowledgments
Conflicts of Interest
References
- Yuchen, W.; Le, X.; Jiahui, L.; Du, Y. Fault mechanism and diagnostic analysis method of rolling bearings. Plant Maint. Eng. 2021, 23, 149–150. [Google Scholar] [CrossRef]
- Chen, X.; Shu, G.; Zhang, K.; Duan, M.; Li, L. A fault characteristics extraction method for rolling bearing with variable rotational speed using adaptive time-varying comb filtering and order tracking. J. Mech. Sci. Technol. 2022, 36, 1171–1182. [Google Scholar] [CrossRef]
- Ding, J.; Huang, L.; Xiao, D.; Li, X. GMPSO-VMD Algorithm and Its Application to Rolling Bearing Fault Feature Extraction. Sensors 2020, 20, 1946. [Google Scholar] [CrossRef]
- Xiang, Q.; Wang, Y.-W. Research on stochastic Resonation-Hilbert Transform method for fault diagnosis of rolling Bearings. In Proceedings of the 3rd World Conference on Mechanical Engineering and Intelligent Manufacturing (WCMEIM), Shanghai, China, 4–6 December 2020; pp. 703–706. [Google Scholar]
- Qin, B.; Hou, P.; Yi, X.; Dong, H. Research on feature extraction method for fault diagnosis of rolling bearings based on wavelet packet decomposition. In Proceedings of the IEEE International Conference on Prognostics and Health Management (ICPHM), Seattle, WA, USA, 11–13 June 2018. [Google Scholar]
- Yang, M.; Xu, Y.; Zhang, K.; Zhang, X. Singular component decomposition and its application in rolling bearing fault diagnosis. Meas. Sci. Technol. 2024, 35, 015120. [Google Scholar] [CrossRef]
- Huang, X.; Qu, H.; Lv, M.; Yang, J. Fault Diagnosis of Rolling Bearings Based on Spectral Kurtosis Graph and LFMB Network. Russ. J. Nondestruct. Test. 2023, 59, 886–901. [Google Scholar] [CrossRef]
- Cui, L.; Wang, J.; Ma, J. Early fault detection method for rolling bearing based on multiscale morphological filtering of information-entropy threshold. J. Mech. Sci. Technol. 2019, 33, 1513–1522. [Google Scholar] [CrossRef]
- Cheng, Y.; Zhou, N.; Zhang, W.; Wang, Z. Application of an improved minimum entropy deconvolution method for railway rolling element bearing fault diagnosis. J. Sound Vib. 2018, 425, 53–69. [Google Scholar] [CrossRef]
- Jun, Z.; Xinhuan, L.; Ming, K.; Tiantai, G. Weak feature extraction of gear fault based on stochastic resonance denoising. In Proceedings of the Eighth International Symposium on Precision Engineering Measurement and Instrumentation, Chengdu, China, 8–11 August 2012; Volume 8759, pp. 725–732. [Google Scholar]
- Liu, W.-x.; Wang, Y.-j.; Liu, X.; Zhang, M.-j. Weak thruster fault detection for AUV based on stochastic resonance and wavelet reconstruction. J. Cent. South Univ. 2016, 23, 2883–2895. [Google Scholar] [CrossRef]
- Hui, W.; Fei, W.; Hongxia, L.; Yanqiu, X.; Guoning, S. Research on the Weak Signal Extraction Method with Adaptive Stochastic Resonance Based on the Time Grid Sensor for PMSM. Math. Probl. Eng. 2022, 2022, 5013997. [Google Scholar]
- Chenxi, L.; Zheng, D.; Lihao, L.; Xingyang, W. An adaptive stochastic resonance detection method based on a fast artificial fish swarm algorithm. J. Phys. Conf. Ser. 2023, 2517, 012013. [Google Scholar]
- He, B.; Huang, Y.; Wang, D.; Yan, B.; Dong, D. A parameter-adaptive stochastic resonance based on whale optimization algorithm for weak signal detection for rotating machinery. Measurement 2019, 136, 658–667. [Google Scholar] [CrossRef]
- Dybiec, B.; Gudowska-Nowak, E. Stochastic resonance:: The role of α-stable noises. Acta Phys. Pol. B 2006, 37, 1479–1490. [Google Scholar]
- Kangping, G.; Xinxin, X.; Jiabo, L.; Shengjie, J.; Ning, S. Weak fault feature extraction for polycrystalline diamond compact bit based on ensemble empirical mode decomposition and adaptive stochastic resonance. Measurement 2021, 178, 109304. [Google Scholar]
- Zhang, J.; Yang, J.; Liu, H.; Zhou, D. Improved SNR to detect the unknown characteristic frequency by SR. IET Sci. Meas. Technol. 2018, 12, 795–801. [Google Scholar] [CrossRef]
- Qin, Q.; Fuping, Z.; Fangyan, Y.; Yin, L. Fault Feature Extraction of Rolling Bearings Based on Full Vector Improved Continuous Harmonic Wavelet Packet. Mech. Sci. Technol. Aerosp. Eng. 2023, 42, 2040–2046. [Google Scholar] [CrossRef]
- Chen, L.; Tan, A.; Yang, L.; Pang, X.; Qiu, M. Defect Size Evaluation of Cylindrical Roller Bearings with Compound Faults on the Inner and Outer Races. Math. Probl. Eng. 2022, 2022, 6070822. [Google Scholar] [CrossRef]
- Yimin, Z.; Shouyuan, Z.; He, L.; Wen, B. models in operational modal analysis. J. Vib. Shock 2009, 28, 64–67+196. [Google Scholar] [CrossRef]
- Meng, Z.; He, J.; Liu, J.; Jin, Y.; Li, J.; Fan, F. Fault Diagnosis of Rolling Bearings Based on Optimal Noise and Optimal Step Length Superimposed Segmental Bistable Stochastic Resonance. J. Vib. Eng. Technol. 2023, 11, 3521–3534. [Google Scholar] [CrossRef]
- Nasir, V.; Sassani, F. A review on deep learning in machining and tool monitoring: Methods, opportunities, and challenges. Int. J. Adv. Manuf. Technol. 2021, 115, 2683–2709. [Google Scholar] [CrossRef]
- Pimenov, D.Y.; da Silva, L.R.; Ercetin, A.; Der, O.; Mikolajczyk, T.; Giasin, K. State-of-the-art review of applications of image processing techniques for tool condition monitoring on conventional machining processes. Int. J. Adv. Manuf. Technol. 2024, 130, 57–85. [Google Scholar] [CrossRef]


| Model | Ball Diameter (mm) | Pitch Diameter (mm) | Inside Diameter (mm) | Outside Diameter (mm) | Number of Balls | Contact Angle (°) |
|---|---|---|---|---|---|---|
| 6219 | 24 | 133 | 95 | 170 | 10 | 0 |
| NU219 | 38 | 133 | 95 | 170 | 16 | 0 |
| Inner Ring | Outer Ring | Rolling Elements |
|---|---|---|
| Model | Inner Ring Failure/Hz | Outer Ring Failure/Hz | Rolling Elements/Hz |
|---|---|---|---|
| NU219 | 154.3 | 85.7 | 24.1 |
| 6219 | 88.5 | 61.5 | 40.2 |
| Parameters | Numerical Value |
|---|---|
| Number of particle swarms | 50 |
| Maximum number of iterations, d | 150 |
| Maximum search speed | 20% of the maximum adjustment step size |
| Search scope of a and b | [0.1, 10] |
| Detection range, l | 4 |
| Transform scale, R | 450 |
Disclaimer/Publisher’s Note: The statements, opinions and data contained in all publications are solely those of the individual author(s) and contributor(s) and not of MDPI and/or the editor(s). MDPI and/or the editor(s) disclaim responsibility for any injury to people or property resulting from any ideas, methods, instructions or products referred to in the content. |
© 2024 by the authors. Licensee MDPI, Basel, Switzerland. This article is an open access article distributed under the terms and conditions of the Creative Commons Attribution (CC BY) license (https://creativecommons.org/licenses/by/4.0/).
Share and Cite
Feng, Z.; Xing, P.; Li, G.; Zhang, L.; Lu, L.; He, X.; Zhang, H. A Hybrid Approach Based on the SR-HWPT-PDF for Identifying Early Fault Signals in Rolling Bearings. J. Mar. Sci. Eng. 2024, 12, 1857. https://doi.org/10.3390/jmse12101857
Feng Z, Xing P, Li G, Zhang L, Lu L, He X, Zhang H. A Hybrid Approach Based on the SR-HWPT-PDF for Identifying Early Fault Signals in Rolling Bearings. Journal of Marine Science and Engineering. 2024; 12(10):1857. https://doi.org/10.3390/jmse12101857
Chicago/Turabian StyleFeng, Zhaoyang, Pengfei Xing, Guobin Li, Lu Zhang, Lixun Lu, Xiaoliang He, and Hongpeng Zhang. 2024. "A Hybrid Approach Based on the SR-HWPT-PDF for Identifying Early Fault Signals in Rolling Bearings" Journal of Marine Science and Engineering 12, no. 10: 1857. https://doi.org/10.3390/jmse12101857
APA StyleFeng, Z., Xing, P., Li, G., Zhang, L., Lu, L., He, X., & Zhang, H. (2024). A Hybrid Approach Based on the SR-HWPT-PDF for Identifying Early Fault Signals in Rolling Bearings. Journal of Marine Science and Engineering, 12(10), 1857. https://doi.org/10.3390/jmse12101857