Abstract
Coastal evolutions are expected to have a significant impact on storm tides, disproportionately aggravating coastal flooding. In this study, we utilize a nested storm tide model to provide an integrated investigation of storm tide responses to changes in coastline and bathymetry along the Zhejiang coasts. We selected coastline and bathymetry data from 1980 and 2016, as well as data from three typical typhoon events (i.e., Winnie, Haikui, and Chan-hom) for simulating the storm surge processes. The results indicate that changes in the coastline and bathymetry from 1980 to 2016 have resulted in an increase in storm tides in the northern part and a decrease in the central part of Zhejiang. Specifically, storm tides in Hangzhou Bay have increased significantly, with an average increase of about 0.3 m in the maximum storm tides primarily attributed to coastline changes. On the contrary, in smaller basins like Sanmen Bay, while reclamation itself has reduced peak storm surges, rapid siltation has consequently exacerbated the storm surge. By decomposing storm tides into astronomical tides and storm surges, we discovered that the change in tidal levels was twice as significant as the surge change. Moreover, the nonlinear tide–surge interaction was nearly four times that of the pure surge, significantly contributing to storm surge variation. Alterations in the momentum balance reveal that the water depth-induced bottom friction and wind stress increase contributes to the local enlargement of storm tides at the bay head, while the coastline changes exaggerate nearshore storm tides through an increase in the advection term.
1. Introduction
Storm surge is a phenomenon that refers to the abnormal rise of sea level triggered by strong atmospheric disturbances, particularly hurricanes and typhoons [1]. This unusual rise in water level always leads to various impacts such as coastal defense destruction, wave overtopping, and inland flooding, which, in turn, lead to significant socio-economic consequences for the affected regions [2]. Zhejiang Province, located on the coast of the East China Sea and the southern wing of the Yangtze River Delta (Figure 1a), is highly vulnerable to typhoons. Annually, between three and five typhoons originating in the northwestern Pacific Ocean make landfall on the Zhejiang coast, making storm surge a serious threat. Between 2012 and 2021, storm surge disasters in Zhejiang caused 443.778 km of coastal engineering damage and CNY 19.605 billion in direct economic losses, significantly impacting the province’s development [3]. Therefore, understanding storm surge and its changing trends along Zhejiang coasts is critical for ensuring the safety and sustainability of low-lying coastal cities.
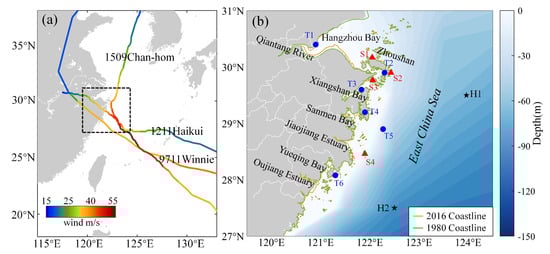
Figure 1.
(a) Location of the Zhejiang coasts and the three typhoon paths; (b) coastline changes and locations of the verification stations (T1−6, S1−4 and H1−2 are the verification stations of the astronomical tide, storm surge, and significant wave height, respectively).
The atmospheric-induced storm surge is a highly intricate physical process influenced by multiple factors, including typhoon intensity, path, and translation speed [4,5,6,7], as well as tidal regime and coastal geometric features [8,9]. Generally, super typhoons with low translation speeds, coinciding with spring tides and large waves, are known to produce extremely high water levels and substantial storm surges [10,11,12]. Additionally, the coastal geometry and topography interact extensively with tides and waves, further influencing the character of the storm surge through tide–wave–surge interaction [9,13].
Human activities, such as barrier and seawall construction, the dredging of navigation channels, and land reclamation, have had widespread impacts on estuarine, coastal, and transitional areas worldwide [14,15,16]. Although the reclamation projects have been undertaken to address land shortage, the geometric and topographic changes of coasts have proved that these projects have significantly altered the nearshore hydrodynamic process. In some areas sheltered by groynes, currents, storm surges, and strong waves have been mitigated to varying extents [17,18]. Conversely, in estuaries and bays, reclamation and harbor construction have led to a decrease in prism, resulting in elevated tides and storm surges. For example, reclamation projects in Hangzhou Bay (HZB) have increased the maximum tidal range in the bay by more than 2 m [19]. Similarly, extensive reclamation in Bohai Bay since 2003 has amplified tidal ranges and storm surges by 0.2 m, 0.1~0.2 m, and 0.2 m, respectively [9,20,21]. The ongoing loss of tidal storage not only reinforces tidal amplification and propagation speed but can also trigger destructive surges and waves when combined with increased typhoon intensity [2,22]. Particularly, the combination of reclamation in the Pearl River Estuary and a 10% typhoon intensity increase can induce the maximum wave height and surge height, reaching 0.88–2.31 m and 2.71–3.77 m along the seawalls of Zhuhai, respectively, indicating a greater risk of seawall submersion and inland flooding in the region [2].
The Zhejiang coast, being one of the largest economic zones in China, has undergone significant reclamation activities over the years to create space for agriculture, industry, and urban development. This extensive reclamation has led to a total of approximately 147,700 hectares of reclaimed land and a reduction in coastline length by 184.27 km [23]. Numerous research studies have examined the hydrodynamic changes resulting from reclamation in specific estuaries or bays along the Zhejiang coast, such as HZB [19], Zhoushan [17], Sanmen Bay [24], Jiaojiang Estuary [25], and other local areas. Some studies, like that conducted by Song et al. [26], have highlighted that tidal flat reclamation not only impacts local dynamics but also has far-field effects on tidal patterns. Nevertheless, a comprehensive investigation into the cumulative effect of land reclamation along the entire Zhejiang coast on storm surge has been lacking. Under natural conditions, coastline and bathymetry change very slowly. However, the human activities bring the morphology into a new equilibrium. The loss of intertidal areas caused by reclamation projects has resulted in flood-dominant conditions, accelerating coastal siltation. Conversely, channel dredging or harbor construction has increased wave or current intensity, leading to erosion and the deepening of water depths. Consequently, the bathymetry changes along coastal Zhejiang are mainly siltation, such as the south coast of HZB, Sanmen Bay, and Yueqing Bay, which have experienced drastic changes in the coastline, and local areas manifest as erosion. Moreover, in offshore areas where there is no human interference, the bathymetry changes are negligible. These changes in bathymetry are critical factors that influence peak storm surge water levels in shallow bays [27,28]. Despite their significance, these bathymetry changes have often been neglected in previous studies due to the lack of long-term topography data monitoring. Given the complex and interconnected effects of reclamation and human activities on coastal dynamics and storm surge, it becomes crucial to conduct integrated and long-term studies that consider the cumulative impact of reclamation activities along the entire Zhejiang coast. Such research efforts can provide valuable insights for coastal management and disaster preparedness in the region.
This study aims to investigate the influence of significant human activities on storm surge through numerical simulations under various typhoon, coastline, and bathymetry scenarios. The study will focus on the following main scopes: (1) to analyze the storm surge processes along the Zhejiang coast under typical typhoon events (Winnie, Haikui, Chan-hom); (2) to assess how storm tide responds to changes in the coastline and bathymetry over the past 40 years and discuss the potential implications for coastal flooding; (3) to uncover the underlying mechanisms that govern storm tide alteration due to human activities.
2. Typhoon Events
According to the National Meteorological Center of China, a total of 49 typhoons have made landfall in Zhejiang Province from 1949 to 2022. These typhoons can be categorized into three types based on their paths: northwest direction, west direction, and northeast direction after turning (as shown in Figure 1a). Among them, 9711 Winnie, 1211 Haikui, and 1509 Chan-hom serve as typical examples of typhoon events that have impacted Zhejiang, corresponding to the three aforementioned paths.
Typhoon Winnie in 1997 (no. 9711) was the strongest typhoon in 1997, with a maximum wind speed of 60 m/s. After the formation of the Pacific Ocean, it steadily moved in a northwest direction and made landfall in Shitang Town, Wenling City, Zhejiang Province on the evening of August 18, with a central pressure of 960 hPa and a maximum wind speed of 40 m/s. The impact of Typhoon Winnie was devastating, causing extensive damage along the Zhejiang coastline. A total of 766 km of seawalls was destroyed, resulting in economic losses exceeding CNY 19.3 billion [29]. This event was regarded as the costliest natural disaster in China’s history. Typhoon Haikui in 2012 (no. 1211) made landfall at 3:20 on August 2012 in Hepu Town, Xiangshan County, Zhejiang Province, with a central pressure of 965 hPa and a maximum wind speed of 42 m/s. The northern and central coastal areas of Zhejiang experienced winds above category 14 for 24 h. Haikui damaged 137.22 km of seawalls and revetments, resulting in an economic loss of CNY 4.145 billion [30]. Typhoon Chan-hom in 2015 (No. 1509) made landfall on 11 July 2015 along the coast of Zhujiajian Town, Zhoushan City, Zhejiang Province, with a central pressure of 955 hpa and a maximum wind speed of 45 m/s. After landfall, it crossed the Yellow Sea in a northeastern direction and made another landfall off the coast of South Hwanghae Province in North Korea. Zhenhai and Dinghai Station in Zhejiang Province both had high tide levels exceeding the local warning tide level. Chan-hom affected 1,464,600 people, damaged 116 houses, and caused direct economic losses of CNY 1.022 billion [31].
3. Numerical Models
3.1. Model Description
The Delft3D-FLOW module was utilized to investigate the surge evaluation, which solved the Navier–Stokes equations based on incompressible fluid, shallow water, and Boussinesq assumptions. The momentum equations of 2D depth-averaged simulations in the and direction [32] are given by:
where and are the fluid velocity in and direction, respectively; is the Coriolis parameter depending on the geographic latitude and the angular speed of rotation of the Earth ; stands for the sea surface atmospheric pressure; and is the water density. The water depth , represents the free surface elevation above the reference plane (at ), and represents the depth below the reference plane.
The terms on the left-hand side of the equations stand for the local acceleration (ACC), horizontal advection (HADV), and Coriolis force (COR), respectively. The first four terms on the right-hand side represent the momentum changes caused by barotropic pressure gradients (PRE), wind stress (WIND), bottom friction (BSTR), and wave-induced forcing (WAVE), respectively. The wind stress and bottom friction are as follows:
where is the air density; is gravitational acceleration; and represent the wind speed at 10 m elevation in and direction, respectively; and is the wind drag coefficient, dependent on and . The Chézy coefficient , and is the Manning coefficient.
and are the depth-averaged wave-induced forcing computed by the wave model and can be written as:
and represent the unbalance of horizontal Reynold’s stresses for a large-scale flow simulated with coarse horizontal grids, i.e., when the shear stresses along the closed boundaries may be neglected, the forces and are simplified as:
and represent the effect of the secondary flow on the depth-averaged velocities:
where , , and are the shear-stress resulting from the secondary flow.
The Delft3D-Wave module is based on SWAN model, which is based on the discrete spectral action balance equation and is fully spectral (in all directions and frequencies). When considering the influence of the flow field, the action density spectrum (the ratio of energy density to relative frequency ) is conserved, and varies with time and space. In Cartesian coordinates, the spectral action balance equation in SWAN [33] is:
The first term in the left-hand side represents the local rate of change of in time, the second and third term represent the propagation of in geographical space. The fourth term represents shifting of the relative frequency due to variations in depths and currents. The fifth term represents depth-induced and current induced refraction. The term S at the right-hand side of the action balance equation is the source term in terms of energy density, representing the effects of generation by wind, dissipation, and non-linear wave–wave interactions. The transfer mechanism of wind energy to the waves is described as the sum of linear and exponential growth in SWAN [33]:
in which represents energy density spectrum, and and depend the on wave frequency and direction, as well as wind speed and direction. More detailed description can be referred to in the documents [34,35,36,37,38,39].
Note that the radiation stress tensors , , , and of Equations (7) and (8) can be written as:
where is the ratio of group velocity over phase velocity.
The SWAN model is also driven by and whereas the computations use the friction velocity , which can be obtained with:
The wave-flow coupling is implemented using the wave conditions (i.e., wave driven currents, enhanced turbulence, and bed shear-stress), calculated in the Delft3D-WAVE module as input for the Delft3D-FLOW module, and by transferring the water levels and current velocities of Delft3D-FLOW to the Delft3D-WAVE model.
3.2. Model Setup
A structured grid was utilized in this study. We expanded the simulation scope to overcome the boundary instability issue. Additionally, in order to enhance computational efficiency, a nested model approach was adopted. This approach involves employing DD-boundary technology to refine the grid along the Zhejiang coast. This allows for a balance between calculation accuracy and speed, which is challenging to achieve with a single grid. The nested grid configuration is illustrated in Figure 2, with a larger domain spanning from 105.5° E to 132.3° E and from 13.6° N to 41° N, and a smaller domain covering from 120.2° E to 123.34° E and from 26.27° N to 32.43° N. Considering the intricate structure of the coastline and islands, the grid resolution was refined to 223 m along the Zhejiang coast, while the maximum grid size at the open boundary was set at 13.65 km.
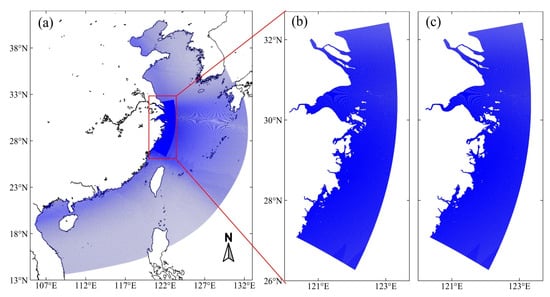
Figure 2.
Computational model domains and grids ((a) total; (b) 1980; (c) 2016).
In the Flow model, the simulation time step was set as 1 min, and the horizontal eddy viscosity coefficient was set as 10 m2/s. A manning coefficient of 0.005~0.1 m−1/3∙s, with spatial variation related to water depth and seabed roughness, was adopted. The bathymetry data were obtained from sea charts and General Bathymetric Chart of the Oceans datasets. The open sea boundary was forced with the tidal levels derived the global tide model TPXO9-atlas [40], which accounts for 15 tide components. In the wave model, the bottom friction coefficient of Collin was set to 0.015 [41]. The wind and pressure field data utilized in both the Flow and Wave models were obtained from the global reanalysis wind product ERA5, provided by the European Centre for Medium-Range Weather Forecasts (ECMWF). ERA5 offers global grid data with a time resolution of 1 h and a grid plane resolution of 0.25° × 0.25°. This dataset serves as a valuable source of information for capturing the atmospheric conditions necessary for accurate modeling of wind and pressure effects. The coastline data for 1980 were extracted from the 1980 KH-9 satellite imagery, while the 2016 coastline data were provided by the Second Institute of Oceanography, Ministry of Natural Resources. The bathymetry data were obtained from sea charts and the General Bathymetric Chart of the Oceans (GEBCO) datasets. These bathymetry data were then interpolated to the corresponding grid points to ensure compatibility with the modeling framework.
3.3. Numerical Experiments
To examine the effects of coastline and bathymetry on storm surge, this model utilized four combinations of coastline and bathymetry (refer to Table 1). For instance, running the model with the 1980/2016 coastline and 1980/2016 bathymetry represents the actual historical/present scenario. On the other hand, the cases involving the 2016 coastline and 1980 bathymetry, as well as the 1980 coastline and 2016 bathymetry, were specifically designed to elucidate the individual impacts of coastline and bathymetry on storm surge.

Table 1.
Description of the model runs.
Following previous studies [42,43], we obtained the specific water elevation components by controlling the input conditions of the model. The storm tide represents the total observed water level due to all the physical processes during the storm, which can be calculated from Case 1–Case 4. Whereas the astronomical tide level and pure surge can be derived from model runs with tidal forcing only (Case 5–Case 8) and meteorological forcing only (Case 9–Case 12), respectively. The storm surge (non-tidal residual) is defined by the residual between and (i.e., ), representing the de-tiding water level. also can be decomposed into the surge due to meteorological forcing only and nonlinear tide–surge interaction , i.e., . Therefore, the nonlinear tide–surge interaction can be calculated as directly.
3.4. Model Verification
This model has been verified with the astronomical tidal elevation (from the Zhejiang 2021 Tide Table), observed storm surge [44], and significant wave height [45] at typical stations (Figure 1b). The statistical method proposed by Willmott [46] was used to quantify the model performance as follows:
where and are the simulated and the observed data, respectively; is the mean value of observed data; and is the number of observed data. A skill value of 1.0 indicates perfect performance of the model, a skill value between 0.65 and 1.0 indicates excellent performance, a skill value in a range of 0.5~0.65 indicates very good performance, a skill value in a range of 0.2~0.5 indicates good performance, and a skill value less than 0.2 indicates poor performance.
Based on Figure 3, the comparison between the simulated and observed water elevation processes at T1–6 demonstrates a high level of agreement in both magnitude and phase. Furthermore, all skill values for tide elevation, exceeding 0.97 at all six stations, indicate excellent performance of the model in simulating astronomical tides. During Typhoon Chan-hom, the model also effectively reproduced the storm surge and significant wave height, as depicted in Figure 4. The skill scores for storm surge ranged from 0.95 to 0.97, while the skill scores for significant wave height ranged from 0.93 to 0.96. These results further demonstrate the model’s accuracy in simulating the generation and dissipation processes of storm surge and waves during typhoons. Consequently, we are confident in utilizing this model to investigate changes in storm surge.
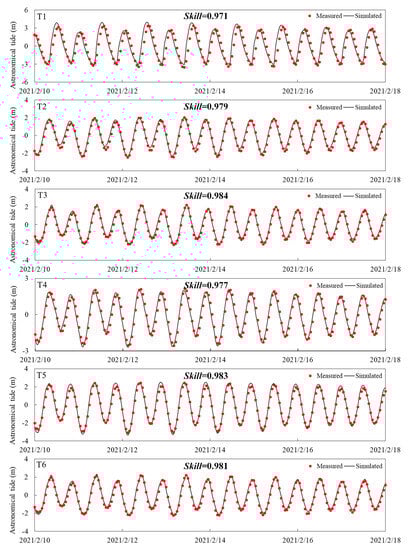
Figure 3.
Validation of tide levels at T1−6 stations.
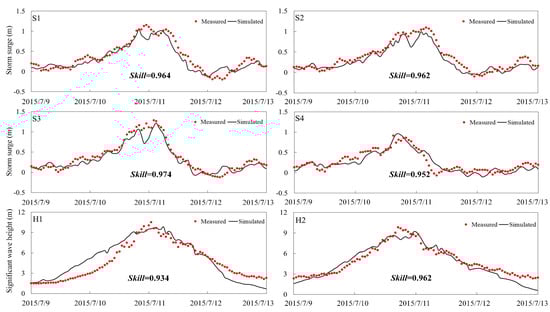
Figure 4.
Validation of storm surges and significant wave heights under Typhoon Chan–hom.
4. Results
4.1. Storm Surge Process under Typical Typhoon Events
The storm surge processes under three typical typhoon paths are shown in Figure 5. The maximum storm surge simulated during Typhoon Winnie, Haikui and Chan-hom during landfall were 4.65 m, 3.3 m and 3.4 m, respectively. Among them, Typhoon Winnie generated a more substantial storm surge, leading to surges exceeding 1.5 m along most coastal areas of Zhejiang. This significant surge was due to its strong winds, wide coverage, and prolonged duration of intense gale. As the typhoon followed a northern trajectory, Typhoon Haikui and Chan-hom caused more severe storm surges in central and northern Zhejiang rather than southern Zhejiang.
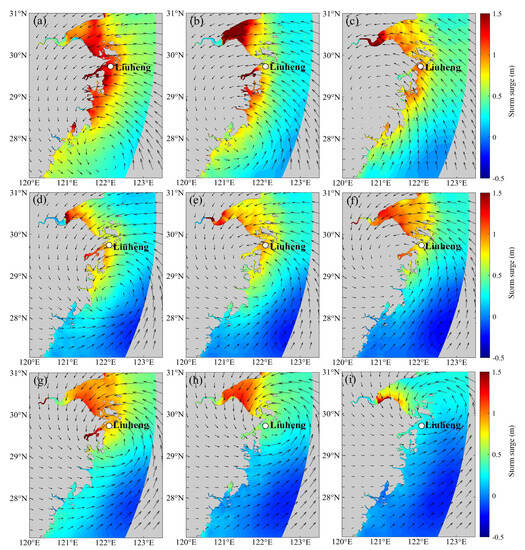
Figure 5.
Distribution of storm surges and winds during typhoon Winnie (a–c), Haikui (d–f), and Chan–hom (g–i). (a,d,g) are 3 h before landfall, (b,e,h) are at landfall, and (c,f,i) are 3 h after landfall.
After landfall, both Typhoon Winnie and Haikui continued to advance northwestward through Zhejiang, resulting in noteworthy storm surges of over 1 m in the Zhejiang Sea (Figure 5c,f). However, the post-landfall storm surge of Haikui was weaker compared to that of Winnie, owing to Haikui’s northern path and lower intensity. Typhoon Chan-hom took a northeastward turn immediately after landfall, causing a rapid decline in storm surges across Zhejiang. Specifically, storm surges triggered by Chan-hom subsided below 0.5 m in the Zhejiang Seas within 3 h of landfall, except for certain areas in HZB.
Table 2 presents the maximum wind speeds recorded during typhoons Winnie, Haikui, and Chanhom, which were 21.29 m/s, 22.23 m/s, and 23.06 m/s, respectively. The wind speed exceeding 17.2 m/s persisted for 21 h, 15 h, and 18 h, respectively. In terms of the resulting storm surges, the maximum values for typhoons Winnie, Haikui, and Chanhom were 1.32 m, 0.93 m, and 1.19 m, while the durations of surges exceeding 0.5 m were 28 h, 18 h, and 24 h, respectively. A noteworthy observation from comparisons at the Liuheng station is that the duration of fresh gale (strong winds) had a more significant influence on the storm surge magnitude than the peak wind speed. This implies that typhoons with a low translation speed or prolonged effects are more likely to cause substantial surge disasters. Importantly, the maximum storm surges coincided with the flood tide (Winnie) or ebb tide (Haikui and Chan-hom), rather than the high tide (Figure 6). This indicates that the maximum storm tide level (MSTL) is not synchronized with the maximum storm surge, with MSTL playing a more critical role in coastal flooding scenarios.
Table 2.
Comparison of wind speed and surge characteristics at Liuheng station.
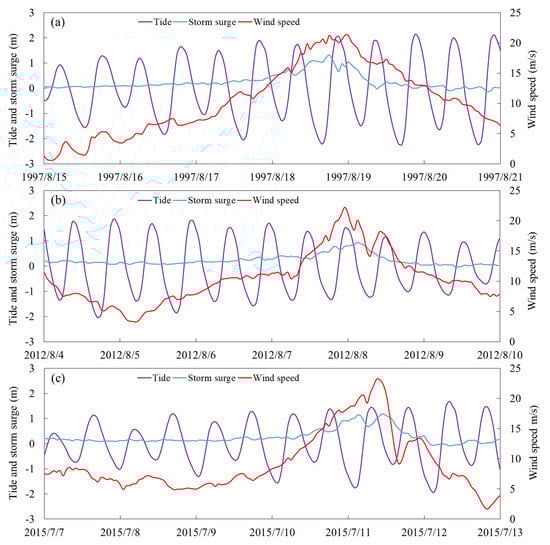
Figure 6.
Tides, storm surges and wind speeds time series at the Liuheng station under Winnie (a), Haikui (b) and Chan–hom (c).
4.2. Effects of Coastline and Bathymetry Changes on the Flood Risk
The spatial distribution of MSTL during the typhoon events is depicted in Figure 7. The magnitude of MSTL was significantly influenced by astronomical tide patterns. Typhoon Winnie, coinciding with a spring tide, resulted in the highest MSTL values. Specifically, areas like HZB, Xiangshan Bay, Sanmen Bay, and Yueqing Bay, as well as narrow rivers like the Oujiang Estuary, experienced MSTL exceeding 6 m. As tidal waves propagated within bays, the tidal distortion intensified, leading to MSTL values exceeding 7 m near the head of the bay, which caused a huge impact on the local surrounding coastal environment. Typhoons Haikui and Chan-hom struck Zhejiang during neap tide and mid tide, respectively. The spatial distribution of MSTL for these two typhoons resembles that of Typhoon Winnie, but with lower magnitudes, generally below 6 m. Moreover, MSTL during Typhoon Chan-hom was notably lower along southern Zhejiang compared to Haikui due to the northerly path of the typhoon.
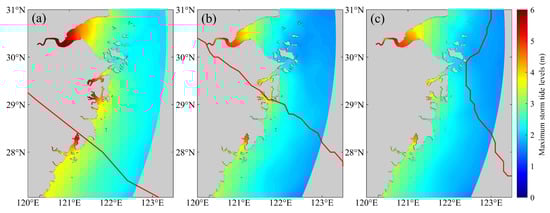
Figure 7.
Spatial distribution of the maximum storm tides under the typical typhoon events ((a). Winnie; (b). Haikui; (c). Chan-hom).
The impacts of changes in the coastline and bathymetry on MSTL are demonstrated in Figure 8. Changes in Zhejiang’s coastline from 1980 to 2016 (Figure 8a,d,g) had a more pronounced effect on HZB compared to other areas. MSTL increases are particularly evident as the bay mouth narrows, resulting in an average increase of approximately 0.4 m under the three typhoon events. The southern part of the Zhejiang coast generally experienced a decreasing trend in MSTL, except for Yueqing Bay, which saw a mean increase of 0.16 m. MSTL in Sanmen Bay decreased by over 0.5 m. The MSTL of the Jiaojiang Estuary showed minor changes under Typhoons Winnie and Chan-hom but displayed an overall increase during Typhoon Haikui. Figure 8b,e,h illustrate the impact of bathymetry changes on MSTL. Notably, MSTL decreased significantly at the head of HZB, Xiangshan Bay, Jiaojiang Estuary, and Oujiang Estuary, while it increased at the mouths of HZB, Sanmen Bay, and Yueqing Bay. Additionally, the magnitude of change under Typhoon Winnie was notably greater than that under Haikui and Chan-hom, possibly due to the influence of astronomical tides. The combined effects of the coastline and bathymetry changes on MSTL (Figure 8c,f,i) indicate that coastline changes primarily drove MSTL variations along most of the Zhejiang coast. However, the results for Sanmen Bay were more aligned with the bathymetry-only cases, suggesting that bathymetry played a dominant role in that specific area.
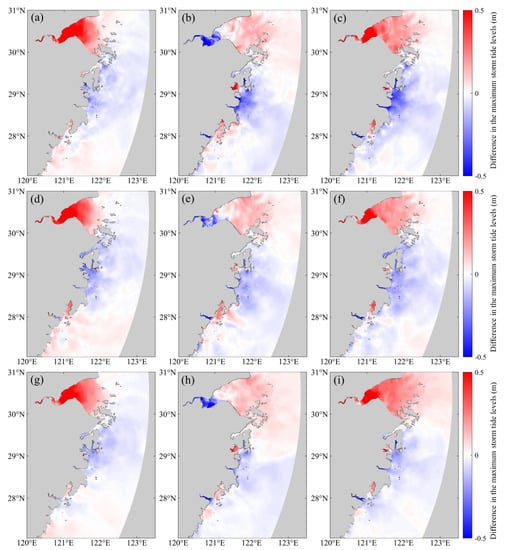
Figure 8.
Differences in the maximum storm tides using different coastlines and bathymetries under typhoon Winnie (a–c), Haikui (d–f), and Chan-hom (g–i). (a,d,g) show the impact of change in coastline, (b,e,h) show the impact of bathymetry change, and (c,f,i) show the impact of changes both in coastline and bathymetry.
4.3. Comparison of the Changes in Astronomical Tides and Storm Surges
As mentioned in Section 3.3, storm tides can be broken down into astronomical tides and storm surges. This section delves into the analysis of the impact of coastline and bathymetry changes on astronomical tides and storm surges during Typhoon Chan-hom, aiming to elucidate their respective contributions. We divided the study area into two parts, south of Xiangshan Bay (S) and north of Xiangshan Bay (N) (Figure 9), and calculated the effects of coastline and bathymetry separately, as listed in Table 3. Over the period from 1980 to 2016, alterations in the coastline and bathymetry resulted in a tide level change of 0.163 m across the domain, while the storm surge changed by approximately 0.083 m during Typhoon Chan-hom. Table 3 demonstrates that the variation in astronomical tides was roughly twice the magnitude of the variation in storm surges, and changes in storm tides were heavily influenced by changes in astronomical tides.
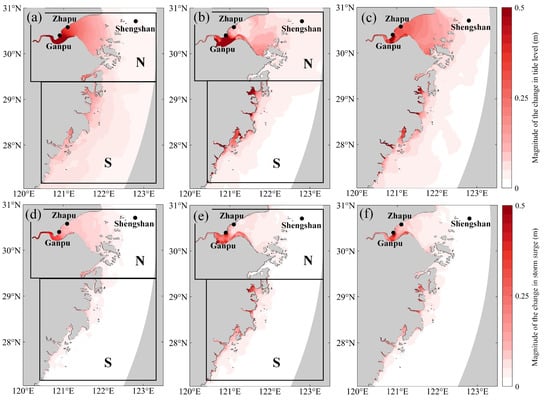
Figure 9.
The average magnitude of changes in astronomical tides (a–c) and storm surges (d–f) in the 24 h before Chan-hom made landfall. (a,d) show the change between Case 2 and Case 1, (b,e) show the change between Case 3 and Case 1, (c,f) show the change between Case 4 and Case 1.
Table 3.
The averaged absolute changes of storm tides, astronomical tides, storm surges, interaction levels, and pure surges within 24 h before Chan-hom made landfall.
Figure 9a,b provide an illustration of the far field impact of coastline changes on tide levels compared to the influence of bathymetric changes. Bathymetry effects were localized along specific coastal areas, such as the head of HZB, Sanmen Bay, Yueqing Bay, Jiaojiang Estuary, Ou-fei Shoal, and Aojiang Estuary. Changes in offshore tide levels were minimal due to the preservation of water depth. The influence of coastline changes on storm surges (Figure 9d) was more confined to HZB, while in the south of Xiangshan Bay, it was weaker compared to that of bathymetry on storm surges (Figure 9e). Overall, the coastline had a greater influence on the astronomical and storm surges in the N region, while in the S region, the influence of bathymetry was much greater than that of the coastline.
Three stations within and outside of HZB were selected for an analysis of water level changes within the 24 h prior to Typhoon Chan-hom landfall, as presented in Figure 10. Furthermore, the averaged absolute changes at these stations are computed and presented in Table 4. At the Ganpu station, storm tide changes caused by coastline and bathymetry evolution were comparable at 0.443 and 0.429 m, respectively, and the changes in astronomical tide were 0.434 m and 0.666 m, respectively. The variations in storm surge were predominantly caused by bathymetric shifts, with an average value of 0.409 m. Conversely, the storm tide and astronomical tide change at the Zhapu Station was primarily influenced by coastline evolution, with an average change of 0.343 m and 0.315 m. The average change in storm surge was within 0.1 m. As for the Shengshan station, the storm tide, astronomical tide, and storm surge displayed negligible variations under any scenario, with the average change in the storm tide and astronomical tide being less than 0.04 m and the average change in storm surge being below 0.016 m.
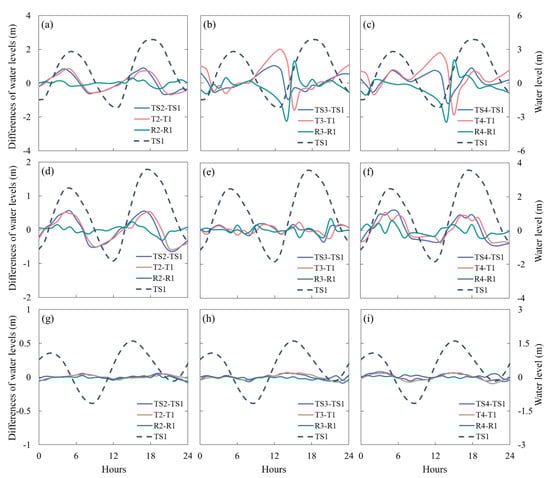
Figure 10.
Time series of the differences in storm tides (TS), astronomical tides (T), and storm surges (R) during a tidal cycle before Chan–hom made landfall at the Ganpu (a–c), Zhapu (d–f) and Shengshan (g–i) stations.
Table 4.
The averaged absolute changes of storm tides (TS), astronomical tides (T), and storm surges (R) at selected stations within 24 h before Chan-hom made landfall.
4.4. Response of Tide-Surge Interaction to Coastline and Bathymetry Changes
Storm surge can be expressed as the superposition of the pure surge with the tide–surge interaction level, i.e., . Figure 11 and Table 3 provide insight into the average changes in pure surges and tide–surge interaction levels within the 24 h preceding Typhoon Chan-hom’s landfall. As depicted in Figure 11a–c, the influence of coastline and topographic changes on pure surges was remarkably faint, yielding an average variation of under 0.025 m across the domain. Although pure surge variations were relatively more pronounced in narrow estuaries and bays, they remained within 0.2 m. The alterations in tide–surge interaction levels significantly outweighed those in pure surges (Figure 11d–f), exhibiting an average variation of 0.089 m. This indicates that the tide–surge interaction contributes substantially to storm surge. Consistent with tides and storm surges variation, the response of the tide–surge interaction to the coastline change was greater in the N region, whereas the bathymetric effect dominated the change in the S region. The strength of the tide–surge interaction heightened as it approached the shoal due to the amplification of both tidal amplitude and storm surge [9,11,12], which resulted in intensified variation near the shore under the influence of coastline and bathymetry changes.
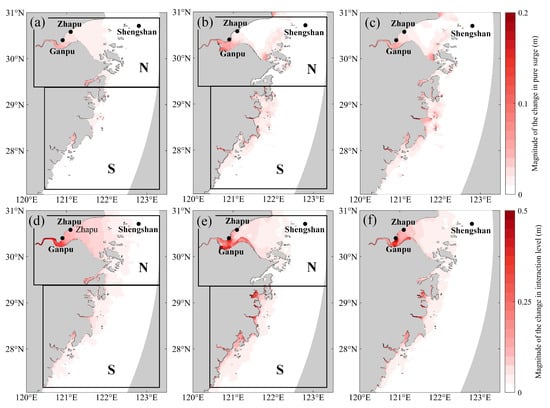
Figure 11.
The average magnitude of changes in pure surges (a–c) and tide-surge interaction levels (d–f) in the 24 h before Chan-hom made landfall. (a,d) show the change between Case 2 and Case 1, (b,e) show the change between Case 3 and Case 1, (c,f) show the change between Case 4 and Case 1.
Figure 12 presents a comparison of the tide-surge interaction processes for Case 1–4 under Typhoon Chan-hom. The interaction at the Ganpu station was notably altered in Case 3 and Case 4. The maximum interaction magnitude increased by 0.21 m and 0.28 m with a delay of 1 h in arrival. Whereas for the Zhapu and Shengshan stations, the interaction levels remained relatively unchanged. Consequently, the strength of interaction levels weakened gradually from the head to the mouth of HZB. Moreover, a comparison between Case 2 and Case 1 demonstrates that coastline changes exerted minimal influence on these interactions. These findings suggest that nonlinear tide–surge interaction primarily stems from bottom conditions in the nearshore zone.
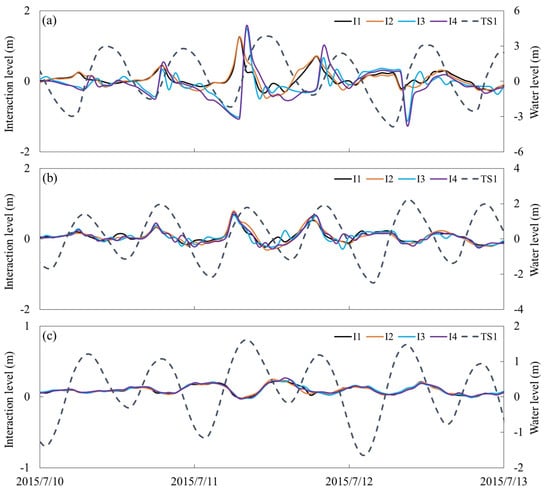
Figure 12.
Comparison of the tide-surge interaction levels for Case 1–4 under typhoon Chan-hom ((a) Ganpu station; (b) Zhapu station; (c) Shengshan station).
5. Discussion
5.1. Contributions of Dynamic Factors to Momentum Balance
To gain insight into the physical mechanism of sea level changes during typhoons resulting from coastline and bathymetry changes, we conducted an analysis of the momentum equations (Equations (1) and (2)) of the Ganpu, Zhapu, and Shengshan stations. We specifically estimated the individual contribution of momentum terms in the x- and y- components to understand the dynamics of the system. The variations in the momentum balance equations for Case1 and Case4 during one tidal cycle before Chan-hom made landfall are shown in Figure 13. These variations are quantitatively summarized in Table 5.
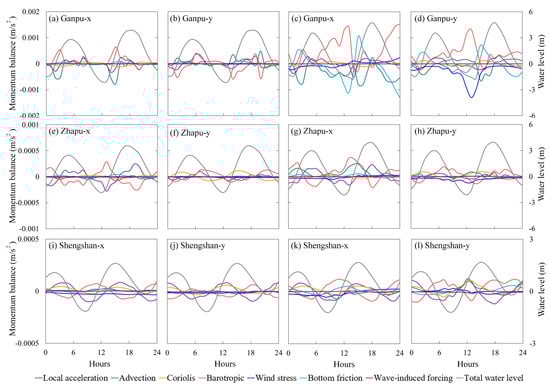
Figure 13.
Time series of terms in the 2D momentum equation in the x−direction and y−direction for Case 1 (left) and Case 4 (right) within 24 h before Chan-hom made landfall.
Table 5.
The averaged absolute values of the terms (unit of 10−5 m/s2) in the horizontal momentum equation within 24 h before Chan-hom made landfall.
In the historical scenario (1980), the dominant factors contributing to momentum balance were the barotropic pressure gradient and advection, while the local acceleration also played a third role at the head of HZB (Ganpu station). However, with the expansion of the water area, the significance of advection diminished at the Zhapu and Shengshan stations. Consequently, the momentum balance at these stations shifted to the interplay between the barotropic pressure gradient and local acceleration. In the present scenario (2016), several changes were observed due to the coastline and bathymetry change. For example, the decrease in depth led to increases in the wind stress and bottom friction that were directly related to the water depth. In addition, the reduced width at the head of HZB intensified the shallow water effect, leading to an amplification of tidal amplitude [19], further increasing the barotropic pressure gradient. These two effects gradually increased from the mouth to the head of the bay, and they were most significant at Ganpu. More specifically, the barotropic pressure switched to be balanced by the bottom friction and wind stress in x- and y- direction at the Ganpu station (Figure 13). In contrast, at the Zhapu station, the momentum balance hinged primarily on the interaction between the barotropic pressure gradient and local acceleration. Following reclamation activities, advection gained prominence in influencing the x-directed momentum balance, indicating the coastline change-induced tidal distortion was mainly attributed to advection in the nearshore zone. At the mouth of the bay, specifically at the Shengshan station, changes in the coastline and bathymetry did not appear to significantly disrupt momentum balance during storm surges. In this context, the barotropic term remained counterbalanced by the local acceleration, in line with the results before reclamation.
5.2. Implications for Coastline Restoration
Coastal reclamation intensity and coastline pressure have been increasing since 1980 [47], and areas where port reclamation projects have been completed require comprehensive assessments and dynamical monitoring [48]. In this study, the rapid and dynamic changes in the coastline of Zhejiang had a profound impact on storm surges, particularly in HZB. In light of this alteration, we wondered if restoring the coastline to its 1980 form would reduce storm tides while holding the 2016 bathymetry constant. The differences of the MSTL were obtained by subtracting Case4 from Case3, as illustrated in Figure 14. Surprisingly, the analysis revealed that during the three typhoons studied, the MSTL in HZB exhibited a substantial decrease, while the area outside the bay experienced a slight increase. This result contrasts with the patterns observed in Figure 8a,d,g, indicating that the response of storm surge to coastline changes is much greater than the response to bathymetry changes in this region. However, the situation in other coastal areas proved to be more intricate, where the change trends in MSTL are not completely opposite to these of Figure 8a,d,g.
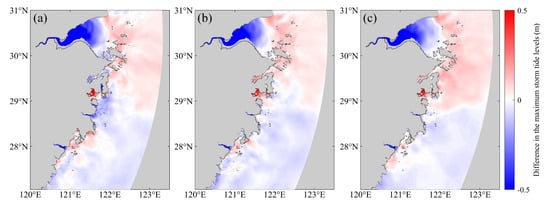
Figure 14.
Distribution of the maximum storm tides for Case 3–Case 4 ((a). Winnie; (b). Haikui; (c). Chan-hom).
In summary, restoring the coastline to its 1980 state would indeed lead to a significant reduction in storm surge risk for HZB. Nevertheless, this positive effect would not be uniformly experienced across all regions of Zhejiang. In fact, certain areas, such as Zhoushan and Ningbo Sea, exhibited a tendency toward increased storm surge levels. These complex dynamics emphasize the importance of considering both coastal topography and bathymetry changes when evaluating the potential impacts of coastline restoration on storm surge behavior in different regions of Zhejiang. Such insights are crucial for implementing effective coastal management strategies to mitigate the risks posed by storm surges and safeguard coastal communities and ecosystems.
5.3. Comparison with Previous Studies
In comparison to previous studies on the effects of coastline and bathymetry changes on storm surges, our research encompasses the entire Zhejiang coasts, resulting in a comprehensive analysis. Our findings reveal diverse patterns of storm surge and tide changes in historical and contemporary conditions, aligning with prior regional-scale investigations in HZB [18] and Sanmen Bay [24]. Moreover, our study underscores the distinct roles played by the coastline and bathymetry through simulation experiments. The reclamation along the southern coast of HZB intensified its trumpet-shaped topographic features, leading to maximum storm tide increases primarily attributed to coastline changes. Conversely, in smaller basins like Sanmen Bay, while reclamation itself reduced peak storm surges, the reduced tidal prism triggered rapid siltation and, consequently, exacerbated the storm surge. This emphasizes that in such smaller basins, the effects of bathymetry changes on storm surges cannot be ignored, as they can rapidly respond to hydrodynamic alterations compared to larger basins [49], thus exerting dominance over surge variations.
Coastline and bathymetry changes produced similar surge responses in the three historical typhoon events (i.e., Winnie, Haikui and Chan-hom); however, the magnitudes of variation differed in each event due to the varying typhoon intensities, paths, and astronomical tides. Storm surge is regarded as a crucial indicator for flood risk analysis, with its peak occurrence more likely during ebb and flood tide periods rather than coinciding with high tide [50]. Previous research has established a consensus that tide–surge interaction has a notable and distinct impact on the magnitudes and phases of storm surges at different tidal stages [5,51]. The semi-diurnal modulation of storm surge is primarily a result of the nonlinear tide–surge interaction [9]. By separating pure surge and tide–surge interaction levels, our study demonstrates that under the influence of coastline and bathymetry evolution, the variation at the nonlinear level is nearly four times that of the pure surge. We are also convinced that tide–surge interaction significantly contributes to storm surge variation, and this nonlinear interaction is primarily intensified by an increase in bottom friction. Importantly, our results reveal that coastline and bathymetry evolution resulted in an average change of 0.083 m in storm surge, 0.163 m in tide level, and a 0.157 m change in storm tide due to the lag effect between tides and surges. The change in tidal level is twice as significant as the surge change. This indicates that the fundamental rise in tidal level dominates the enlargement of storm tide and should receive more attention in flood risk assessments during storms. Moreover, since there is a time lag between the maximum storm surge and high tide, the maximum storm tide is better suited for flood risk assessment than the maximum storm surge.
6. Conclusions
Utilizing a nested storm tide model, we provide an integrated investigation of storm tide responses to the coastline and bathymetry along Zhejiang coasts. For this study, we selected coastline and bathymetry data from 1980 to 2016, as well as data from three typical typhoon events, namely Winnie, Haikui, and Chan-hom, to simulate the storm tide processes. The primary conclusions are as follows.
The maximum storm surge triggered by typhoons Winnie, Haikui, and Chan-hom in three different paths were 4.65 m, 3.3 m, and 3.4 m, respectively. Among these, Winnie had the most significant impact on Zhejiang’s coasts due to its prolonged duration of strong winds. Both Winnie, moving northwestward, and Haikui, moving westward, continued to affect Zhejiang significantly even after making landfall. In contrast, the storm surge triggered by Chan-hom, which turned northeastward after landfall, dissipated more rapidly.
The coastline and bathymetry changes from 1980 to 2016 led to diverse patterns of storm surge and tide changes along the coastal Zhejiang. The northern part of Zhejiang experienced an increase in storm tides, while the central part saw a decrease. In southern Zhejiang, changes were more variable, with both increases and decreases in storm tides observed. The reclamation along the southern coast of HZB intensified its trumpet-shaped topographic features, leading to maximum storm tide increases by 0.358 m, 0.294 m, and 0.353 m under Winnie, Haikui and Chan-hom, respectively, which were primarily attributed to coastline changes. Conversely, in smaller basins like Sanmen Bay, while reclamation itself reduced peak storm surges, it also reduced the tidal prism, triggering rapid siltation and, consequently, exacerbating the storm surge.
The evolution of the coastline and bathymetry resulted in an average change of 0.083 m in storm surge, 0.163 m in tide level before the landfall of Chan-hom, and a 0.157 m change in storm tide due to the lag effect between tides and surges. This reveals that the fundamental rise in tidal levels dominates the enlargement of storm tide. By separating pure surge and tide–surge interaction levels from surges, we observed that the variation at the nonlinear level (0.089 m) was nearly four times that of the pure surge (0.024 m). This illustrates that tide–surge interaction significantly contributes to storm surge variation, and this nonlinear interaction is primarily intensified by an increase in bottom friction.
The momentum balance was analyzed to reveal the intrinsic mechanisms of storm tide changes in HZB. At the head of HZB, the depth decrease led to a significant increase in the wind stress and bottom friction. As balanced by the barotropic pressure gradient, the tidal elevation in Zhapu was exaggerated. When moving to the middle of HZB, the water depth had insignificant changes. However, coastline changes enlarged the advection term to balance with the barotropic pressure gradient, which also increased the water elevation. At the mouth of the bay, specifically at the Shengshan station, changes in the coastline and bathymetry did not appear to significantly disrupt momentum balance during storm surges. In this context, the barotropic term remained counterbalanced by local acceleration, resulting in insignificant changes in storm tides.
Author Contributions
Conceptualization, X.G. and H.L.; methodology, X.G. and H.L.; software, X.G.; validation, X.G.; formal analysis, X.G., H.L. and X.X.; Data Curation, T.C. and X.W.; resources, X.X.; writing—original draft preparation, X.G.; writing—review and editing, X.G. and H.L.; visualization, X.G.; supervision, H.L.; project administration, H.L. and Y.C.; funding acquisition, H.L. and Y.C. All authors have read and agreed to the published version of the manuscript.
Funding
This research was funded by the Zhejiang Provincial Natural Science Foundation, grant number LY22E090011, and the China National Key Research and Development (R&D) Program, grant number 2022YFC3105404.
Institutional Review Board Statement
Not applicable.
Informed Consent Statement
Not applicable.
Data Availability Statement
Data are contained within the article.
Acknowledgments
We are sincerely grateful to the two anonymous reviewers for their constructive comments.
Conflicts of Interest
The authors declare no conflict of interest.
References
- Feng, S.Z. The Advance of Researches on Storm Surges. World Sci. RD 1998, 04, 44–47. [Google Scholar] [CrossRef]
- Zhang, H.X.; Shen, Y.M.; Tang, J. Wave and storm surge evolutions in the Pearl River Estuary with large-scale land reclamation impacts. Ocean Eng. 2023, 273, 113977. [Google Scholar] [CrossRef]
- Bulletin of Oceanic Disaster of China. Available online: https://www.mnr.gov.cn/sj/sjfw/hy/gbgg/zghyzhgb/ (accessed on 27 August 2022).
- Irish, J.L.; Resio, D.T.; Ratcliff, J.J. The influence of storm size on hurricane surge. J. Phys. Oceanogr. 2008, 38, 2003–2013. [Google Scholar] [CrossRef]
- Mo, D.; Hou, Y.; Li, J.; Liu, Y. Study on the storm surges induced by cold waves in the Northern East China Sea. J. Mar. Syst. 2016, 160, 26–39. [Google Scholar] [CrossRef]
- Sahoo, B.; Bhaskaran, P.K. Multi-hazard risk assessment of coastal vulnerability from tropical cyclones—A GIS based approach for the Odisha coast. J. Environ. Manag. 2018, 206, 1166–1178. [Google Scholar] [CrossRef]
- Chen, W.; Liu, W.L.; Liang, H.D.; Jiang, M.T.; Dai, Z.L. Response of storm surge and M2 tide to typhoon speeds along coastal Zhejiang Province. Ocean Eng. 2023, 270, 113646. [Google Scholar] [CrossRef]
- Kuang, C.P.; Liang, H.D.; Gu, J.; Song, H.L.; Dong, Z.C. Morphological responses of unsheltered channel-shoal system to a major storm: The combined effects of surges, wind-driven currents and waves. Mar. Geol. 2020, 427, 106245. [Google Scholar] [CrossRef]
- Song, H.L.; Kuang, C.P.; Gu, J.; Zou, Q.P.; Liang, H.D.; Sun, X.M.; Ma, Z. Nonlinear tide-surge-wave interaction at a shallow coast with large scale sequential harbor constructions. Estuar. Coast. Shelf Sci. 2020, 233, 96543. [Google Scholar] [CrossRef]
- Prandle, D.; Wolf, J. The interaction of surge and tide in the North Sea and River Thames. Geophys. J. Int. 1978, 55, 203–216. [Google Scholar] [CrossRef]
- Horsburgh, K.J.; Wilson, C. Tide-surge interaction and its role in the distribution of surge residuals in the North Sea. J. Geophys. Res. Oceans. 2007, 112. [Google Scholar] [CrossRef]
- Feng, X.; Olabarrieta, M.; Valle-Levinson, A. Storm-induced semidiurnal perturbations to surges on the US Eastern Seaboard. Cont. Shelf Res. 2016, 114, 54–71. [Google Scholar] [CrossRef]
- Wang, J.; Yi, S.; Li, M.Y.; Wang, L.; Song, C.C. Effects of sea level rise, land subsidence, bathymetric change and typhoon tracks on storm flooding in the coastal areas of Shanghai. Sci. Total Environ. 2018, 621, 228–234. [Google Scholar] [CrossRef] [PubMed]
- Hoeksema, R.J. Three stages in the history of land reclamation in The Netherlands. Irrig. Drain. 2007, 56, S113–S126. [Google Scholar] [CrossRef]
- Kennish, M.J. Coastal salt marsh systems in the U.S.: A review of anthropogenic impacts. J. Coast Res. 2001, 17, 731–748. [Google Scholar]
- Jiang, S.; Xu, N.; Li, Z.C.; Huang, C.H. Satellite derived coastal reclamation expansion in China since the 21st century. Glob. Ecol. Conserv. 2021, 30, e01797. [Google Scholar] [CrossRef]
- Pan, Z.H.; Liu, H. Impact of human projects on storm surge in the Yangtze Estuary. Ocean Eng. 2020, 196, 96792. [Google Scholar] [CrossRef]
- Li, L.; Ye, T.Y.; Wang, X.H.; He, Z.G.; Shao, M. Changes in the Hydrodynamics of Hangzhou Bay Due to Land Reclamation in the Past 60 Years. In Sediment Dynamics of Chinese Muddy Coasts and Estuaries; Academic Press: Cambridge, MA, USA, 2019; pp. 77–93. [Google Scholar] [CrossRef]
- Pelling, H.E.; Uehara, K.; Green, J.A.M. The impact of rapid coastline changes and sea level rise on the tides in the Bohai Sea, China. J. Geophys. Res. 2013, 118, 3462–3472. [Google Scholar] [CrossRef]
- Ding, Y.M.; Wei, H. Modeling the impact of land reclamation on storm surges in Bohai Sea, China. Nat. Hazards 2017, 85, 559–573. [Google Scholar] [CrossRef]
- Van Maren, D.S.; Beemster, J.G.W.; Wang, Z.B.; Khan, Z.H.; Schrijvershof, R.A.; Hoitink, A.J.F. Tidal amplification and river capture in response to land reclamation in the Ganges-Brahmaputra delta. Catena 2023, 220, 96651. [Google Scholar] [CrossRef]
- Kang, B.; Ding, J.W.; Wang, Z.W. Temporal and Spatial Changes of Continental Coastline in Zhejiang in Recent 50 years. Ocean. Dev. Manag. 2022, 39, 57–64. [Google Scholar] [CrossRef]
- Sun, Z.L.; Zhong, S.H.; Wang, C.; Tu, W.R.; Ji, H.Q. Simulation and Analysis of Storm Surge at Zhoushan Fishing Port. Haiyang Xuebao 2020, 42, 136–143. [Google Scholar] [CrossRef]
- Yang, W.K.; Feng, X.R.; Yin, B.S. The impact of coastal reclamation on tidal and storm surge level in Sanmen Bay, China. J. Ocean. Limnol. 2019, 37, 1971–1982. [Google Scholar] [CrossRef]
- Sun, Z.L.; Huang, S.J.; Jiao, J.G.; Nie, H.; Lu, M. Effects of cluster land reclamation projects on storm surge in Jiaojiang Estuary, China. Water Sci. Eng. 2017, 10, 59–69. [Google Scholar] [CrossRef]
- Song, D.H.; Wang, X.H.; Zhou, X.M.; Bao, X.W. Modeling studies of the far-field effects of tidal flat reclamation on tidal dynamics in the East China Seas. Estuar. Coast. Shelf Sci. 2013, 133, 147–160. [Google Scholar] [CrossRef]
- Yang, W.K.; Yin, B.S.; Feng, X.R.; Yang, D.Z.; Gao, G.D.; Chen, H.Y. The effect of nonlinear factors on tide-surge interaction: A case study of Typhoon Rammasun in Tieshan Bay, China. Estuar. Coast. Shelf Sci. 2019, 219, 420–428. [Google Scholar]
- Rego, J.L.; Li, C.Y. Nonlinear terms in storm surge predictions: Effect of tide and shelf geometry with case study from Hurricane Rita. J. Geophys. Res. 2010, 115. [Google Scholar] [CrossRef]
- Bulletin of Oceanic Disaster of China in 1997. 1998. Available online: http://gc.mnr.gov.cn/201806/t20180619_1798000.html (accessed on 27 August 2022).
- Bulletin of Oceanic Disaster of China in 2012. 2013. Available online: http://gc.mnr.gov.cn/201806/t20180619_1798016.html (accessed on 27 August 2022).
- Bulletin of Oceanic Disaster of China in 2015. 2016. Available online: http://gc.mnr.gov.cn/201806/t20180619_1798019.html (accessed on 27 August 2022).
- Deltares. Delft3D FLOW User Manual; Deltares: Delft, The Netherlands, 2016. [Google Scholar]
- Deltares. Delft3D WAVE User Manual; Deltares: Delft, The Netherlands, 2016. [Google Scholar]
- Cavaleri, L.; Rizzoli, P.M. Wind wave prediction in shallow water: Theory and applications. J. Geophys. Res. Oceans. 1981, 86, 9961–9973. [Google Scholar] [CrossRef]
- Tolman, H.L. Effects of Numerics on the Physics in a Third-Generation Wind-Wave Model. J. Phys. Oceanogr. 1992, 22, 995–1111. [Google Scholar] [CrossRef]
- WAMDI group. The WAM model a third generation ocean wave prediction model. J. Phys. Oceanogr. 1988, 18, 1775–1810. [Google Scholar] [CrossRef]
- Snyder, R.L.; Dobson, F.W.; Elliott, J.A.; Long, R.B. Array measurements of atmospheric pressure fluctuations above surface gravity waves. J. Fluid Mech. 1981, 92, 1–59. [Google Scholar] [CrossRef]
- Janssen, P. Quasi-linear theory of wind-wave generation applied to wave forecasting. J. Phys. Oceanogr. 1991, 21, 1631–1642. [Google Scholar] [CrossRef]
- Komen, G.J.; Cavaleri, L.; Donelan, M.; Hasselmann, K.; Janssen, P. Dynamics and Modelling of Ocean Waves; Cambridge University Press: Cambridge, UK, 1994. [Google Scholar]
- Gary, D.E.; Svetlana, Y.E. Efficient inverse modeling of barotropic ocean tides. J. Atmos. Ocean. Technol. 2002, 19, 183–204. [Google Scholar] [CrossRef]
- Collins, J.I. Prediction of shallow-water spectra. J. Geophys. Res. 1972, 77, 2693–2707. [Google Scholar] [CrossRef]
- Banks, J.E. A mathematical model of a river—Shallow sea system used to investigate tide, surge and their interaction in the Thames—Southern North Sea region. Philos. Trans. R. Soc. London. Ser. A Math. Phys. Sci. 1974, 275, 567–609. [Google Scholar] [CrossRef]
- Sinha, P.C.; Jain, I.; Bhardwaj, N.; Rao, A.D.; Dube, S.K. Numerical modeling of tide-surge interaction along Orissa coast of India. Nat. Hazards 2008, 45, 413–427. [Google Scholar] [CrossRef]
- Zhang, X.L.; Chu, D.D.; Zhang, J.C. Effects of Nonlinear Terms and Topography on Storm Surges in the Southeast Seas of China: A Case Study of Typhoon Chan-hom. Oceanol. Limnol. Sinica. 2020, 51, 1320–1331. (In Chinese) [Google Scholar] [CrossRef]
- Ying, W.M.; Zheng, Q.; Zhu, C.C.; Zhu, Y.; Che, Z.M.; Chu, D.D.; Zhang, J.C. Numerical simulation of “CHAN-HOM” typhoon waves using SWAN model. Mar. Sci. 2017, 41, 98–117. (In Chinese) [Google Scholar] [CrossRef]
- Willmott, C.J. On the validation of models. Phys. Geogr. 1981, 2, 184–194. [Google Scholar] [CrossRef]
- Yan, F.Q.; Wang, X.G.; Huang, C.; Zhang, J.J.; Su, F.Z.; Zhao, Y.F.; Lyne, V. Sea Reclamation in Mainland China: Process, Pattern, and Management. Land Use Policy 2023, 127, 106555. [Google Scholar] [CrossRef]
- Wang, N.; Zhu, G.R.; Li, X.Y.; Cheng, J.X.; Yi, W.B.; Liu, S.Q.; Xie, Z.L. Transitions and suggestions for China’s coastal port reclamation policies. Ocean. Coast Manag. 2023, 236, 106532. [Google Scholar] [CrossRef]
- Wang, Z.B.; Van Maren, D.S.; Ding, P.X.; Yang, S.L.; VanProoijen, B.C.; DeVet, P.L.M.; Winterwerp, J.C.; DeVriend, H.J. Human impacts on morphodynamic thresholds in estuarine systems. Cont. Shelf Res. 2015, 111, 174–183. [Google Scholar] [CrossRef]
- Feng, J.L.; Li, D.Q.; Li, D.L.; Zhang, J.; Zhao, T. Comparison between the skew surge and residual water level along the coastline of China. J. Hydrol. 2021, 598, 126299. [Google Scholar] [CrossRef]
- Yu, L.L.; Lu, S.S.; Zhang, J.B.; Yang, B.; Xu, M. Effects of tide-surge interactions on the temporal distribution of the peak residual in Hangzhou Bay, China. Ocean Eng. 2022, 266, 112705. [Google Scholar] [CrossRef]
Disclaimer/Publisher’s Note: The statements, opinions and data contained in all publications are solely those of the individual author(s) and contributor(s) and not of MDPI and/or the editor(s). MDPI and/or the editor(s) disclaim responsibility for any injury to people or property resulting from any ideas, methods, instructions or products referred to in the content. |
© 2023 by the authors. Licensee MDPI, Basel, Switzerland. This article is an open access article distributed under the terms and conditions of the Creative Commons Attribution (CC BY) license (https://creativecommons.org/licenses/by/4.0/).