Article

Life Cycle Assessment of a Coastal Concrete Bridge Aided by Non-Destructive Damage Detection Methods

by
Mehrdad Hadizadeh-Bazaz
,
Ignacio J. Navarro
* and
Víctor Yepes
Department of Construction Engineering, Institute of Concrete Science and Technology (ICITECH), Universitat Politècnica de València, 46022 Valencia, Spain
*
Author to whom correspondence should be addressed.
J. Mar. Sci. Eng. 2023, 11(9), 1656; https://doi.org/10.3390/jmse11091656
Submission received: 1 August 2023 / Revised: 20 August 2023 / Accepted: 21 August 2023 / Published: 24 August 2023
(This article belongs to the Section Ocean Engineering)

Abstract

:
Recently, using economic damage identification techniques to ensure the safety of bridges has become essential. But investigating the performance of those techniques for various conditions and environments and, in addition, a life cycle assessment (LCA) through these methods depending on the situation and during the life of a structure could help specialists and engineers in this field. In these regards, analyzing the implementation of a technique for the restoration and maintenance stages of costly structures such as bridges can illustrate the effect of each damage detection method on the LCA. This research assessed non-destructive abilities and a dynamic approach to predict the amount and location of damages in the LCA. For this purpose, the power spectral density (PSD) technique’s performance by different approaches in identifying corrosion damages for a coastal bridge and the effectiveness of using this technique on reducing the environmental impact compared with a conventional method were evaluated. The results demonstrate a reduction of the environmental impacts by approximately 23% when using the PSD during the bridge’s service life. In conclusion, the PSD approach does well in anticipating the damage quantity and location on a coastal bridge, which reduces the environmental impacts during the repair and maintenance.

1. Introduction

The Brundtland Report’s definition of sustainability, which integrates social, economic, and environmental requirements, is defined as the “development that satisfies the needs of the present without compromising the capacity of future generations to satisfy their own needs” [1]. In line with this idea, the adequate maintenance of infrastructures is essential to avoid unnecessary expenses and environmental impacts associated with the construction of new assets. Nevertheless, in recent years, there has been a notable emphasis among academics on evaluating the consequences linked to infrastructure maintenance [2,3]. This is due to the recognition that these effects might surpass those related to infrastructure creation if the design is inadequate. In this context, LCA has arisen as a powerful decision tool to evaluate maintenance impacts. In recent years, comprehensive research has assessed the environmental ramifications associated with diverse infrastructural developments across their entire life cycle, such as buildings [4], pavements [5], railway tracks [6], or urban infrastructure elements [7].
In light of the societal and economic significance of transportation networks and the substantial economic and environmental consequences linked to the establishment and upkeep of transportation infrastructure, there has been a notable focus in recent years on conducting life cycle assessments for bridges [8]. Pons et al. [9] evaluated and contrasted the environmental impacts generated by building several kinds of earth-retaining walls to guide designers in picking the most appropriate solution for each height to decrease emissions. Navarro et al. [10] examined the long-term performance designs of structure from the LCA impacts standpoint by using simple additive weighting (SAW) and the analytic hierarchy process (AHP) to assess the consequences of bridges’ end-of-life cycle stages. Penadés-Plà et al. [11] conducted an environmental evaluation utilizing a single criterion that reliably indicates the environmental effect as a first approximation of the environmental aim for the assessment performance of an optimization method. Navarro et al. [12] used a weighted criterion decision-making strategy to review the use of such methodologies in infrastructure sustainability evaluation implications and criteria by employing the analytic hierarchy process. Niu and Fink [13] assess the sustainability of modern timber fridges by using an LCA-based approach. Navarro et al. [14] analyzed the financial and environmental consequences of 18 potential designs for a pre-existing concrete bridge deck subject to chloride exposure based on the maintenance interval. Reliability-based maintenance optimization for life cycle costs and environmental implications in concrete by 10% silica fume is the most cost-effective way to avoid reinforcing steel corrosion and decrease deck design life cycle costs by 76%. In addition to silica fume, other studies have also reported a similar outstanding performance of fly ash to increase concrete’s durability and reduce maintenance needs [15,16]. Cheng et al. [17] contributed to the field of sustainable structure by developing a BIM-LCA strategy for completely evaluating the life cycle embodied environmental impact (LCEEI) of buildings during the design stage. Khorgade et al. [18] compare the bridge life cycle performance with carbon fiber polymer and steel reinforcements. Navarro et al. [19] assessed the LCA impacts of 15 prevention options on the deck of bridge exposed to a chloride environment through the Eco-Indicator 99 method used to assess the effects. They also assessed the social impacts of bridge decks in aggressive environments [20]. Peng et al. [21] focus their work on the maintenance optimization of bridges considering a variety of economic, environmental, and social criteria.
Almost all research on economic and environmental impacts assessment along the use and maintenance stages of an infrastructure for repair activities uses conventional damage estimation methods or non-destructive and destructive damage prediction methods. However, other approaches could potentially be used to determine damages in an infrastructure of any kind and increase the accuracy of the prediction. These methods to predict damage could be either destructive or non-destructive. The destructive tactics use models, which typically include removing structural samples to assess damages. However, non-destructive approaches are independent models that may determine whether or not there is damage to a numerical model without actually inflicting any damage to the structural elements [22]. Non-destructive damage detection methods can use technologies based on signals. The application of different non-destructive methods to detect the damage quantification and location to maintain and repair structures is of great interest for the sustainability assessment of structures.
In structural health monitoring, using modern and innovative high-tech computers and sensors has contributed to a growth in the adoption of signal-based techniques [23]. Among the various signal-based methods are those that operate in either the time domain technique [24,25], the frequency domain technique [26,27], or the time-frequency domain technique [28,29]. Some dynamic frequency-domain approaches used as non-destructive damage detection methods include natural frequencies [30,31], modal curvatures [32,33], modal strain energies [34,35], frequency response functions (FRF) [36,37], and power spectral density (PSD) [38,39]. Of these methods, the PSD is one of the frequency-domain techniques that use the responses of a periodic or randomized stimulus in frequencies to describe the mean power repartition. This approach employs a sensitive nonlinear function of structural factors to generate a transfer function of the second order [40]. Recently, researchers from various disciplines have examined the performances of the PSD technique for detecting distinct forms of damage to structures. Hadizadeh-Bazaz et al. [41] investigated the performance of PSD to determine the amount and location of damages on a coastal bridge caused by corrosion. Bayati et al. [42] evaluated a method according to the PSD and the least square to detect failures in a concrete bridge. Gunawan et al. [43] evaluated the PSD approach’s dependability using seven masses in eight linear elastic repartition springs. Meanwhile, the PSD technique performed in life cycle cost assessment (LCCA) has recently been evaluated by Hadizadeh-Bazaz et al. [44].
However, PSD method performance in other life cycle assessment cases, such as environmental and social impacts, has not been evaluated in the past. Figure 1 illustrates a flowchart on the methodology and level processes for detecting damage by the PSD approach to maintain and repair concrete bridge structures.
This research evaluated the LCA of a bridge in an exposed coastal environment. In this work, a non-destructive technique was used to aid the analysis of the environmental impacts during maintenance activities. These results were then compared with those that resulted from applying conventional damage prediction methods. The estimation of the damage of each element over time was performed by using various methods according to dynamic component changes of the structure, such as the stiffness and mass of the bridge structural elements.
Following that, the LCA was carried out under the principles of ISO standards 14040 [45] and 14044 [46]. In this study, a variety of preventative strategies were taken into consideration. The necessary upkeep procedures for each scenario were included in these options throughout the period of time under consideration. During the evaluation, their individual contributions to the anticipated length of a structure’s service life were calculated. The derived estimates of service life were utilized as inputs for the LCA to quantify the environmental effects caused by each assessed measure as part of the life cycle.

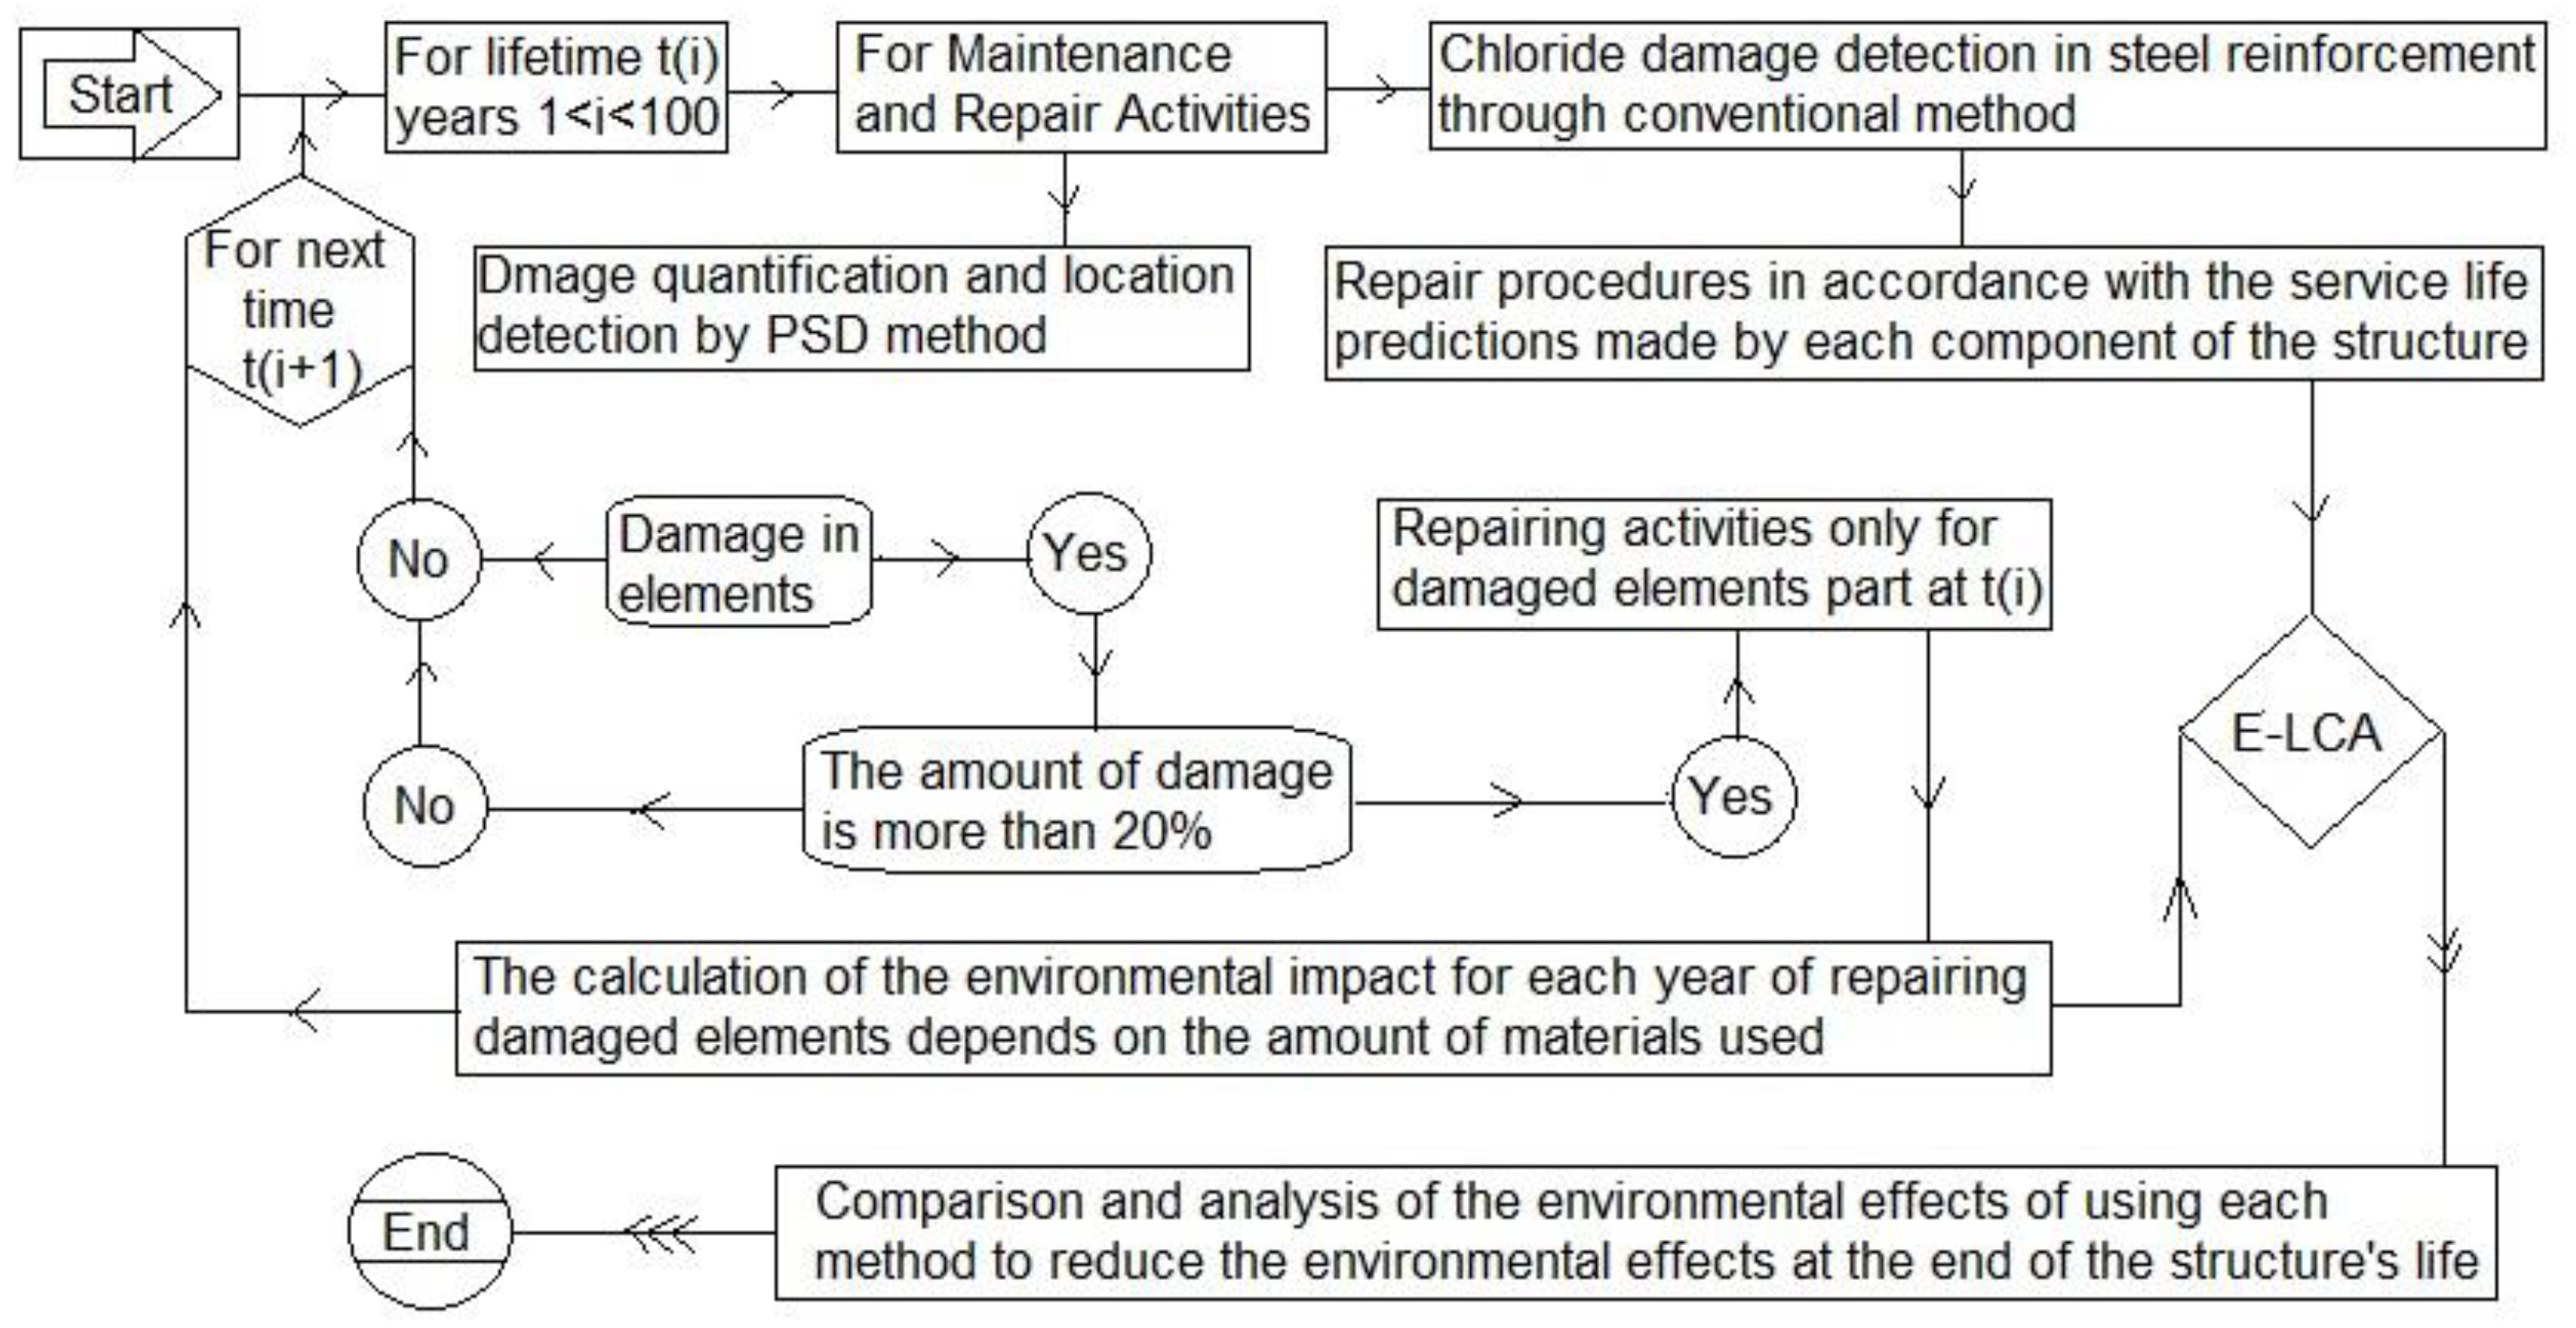
2. Materials and Methods

In recent years, the life cycle has gained widespread acceptance and has been standardized in a variety of countries throughout the world [45,46]. Economic, environmental, and societal impact considerations are just some elements that may be considered when modeling a process, product, or service using the LCA technique [47]. Since the evaluation of other aspects of life cycle assessment, including the environmental and social impacts, can be used in the analysis of the performance of non-destructive dynamic methods of the structure in environmental conditions and different kinds of structures, in this investigation, the environmental impacts of the repair activities on a concrete and coastal bridge exposed to corrosion by chloride ions were evaluated using the PSD as a non-destructive signal-based method. However, Figure 2 demonstrates the general diagram of the methodology stages of the damage detection method for the LCA in this research.
As the diagram in Figure 2 shows, this research investigated the performance aspect of the LCA that was used. In addition, it evaluated the PSD method’s performance as a signal-based method with a different approach to diagnosing the damage caused by chloride ions to repair and maintain a bridge.
The evaluation results of this research can show the effectiveness of using this method compared with conventional methods in reducing the environmental effects during the repair and maintenance of a bridge.

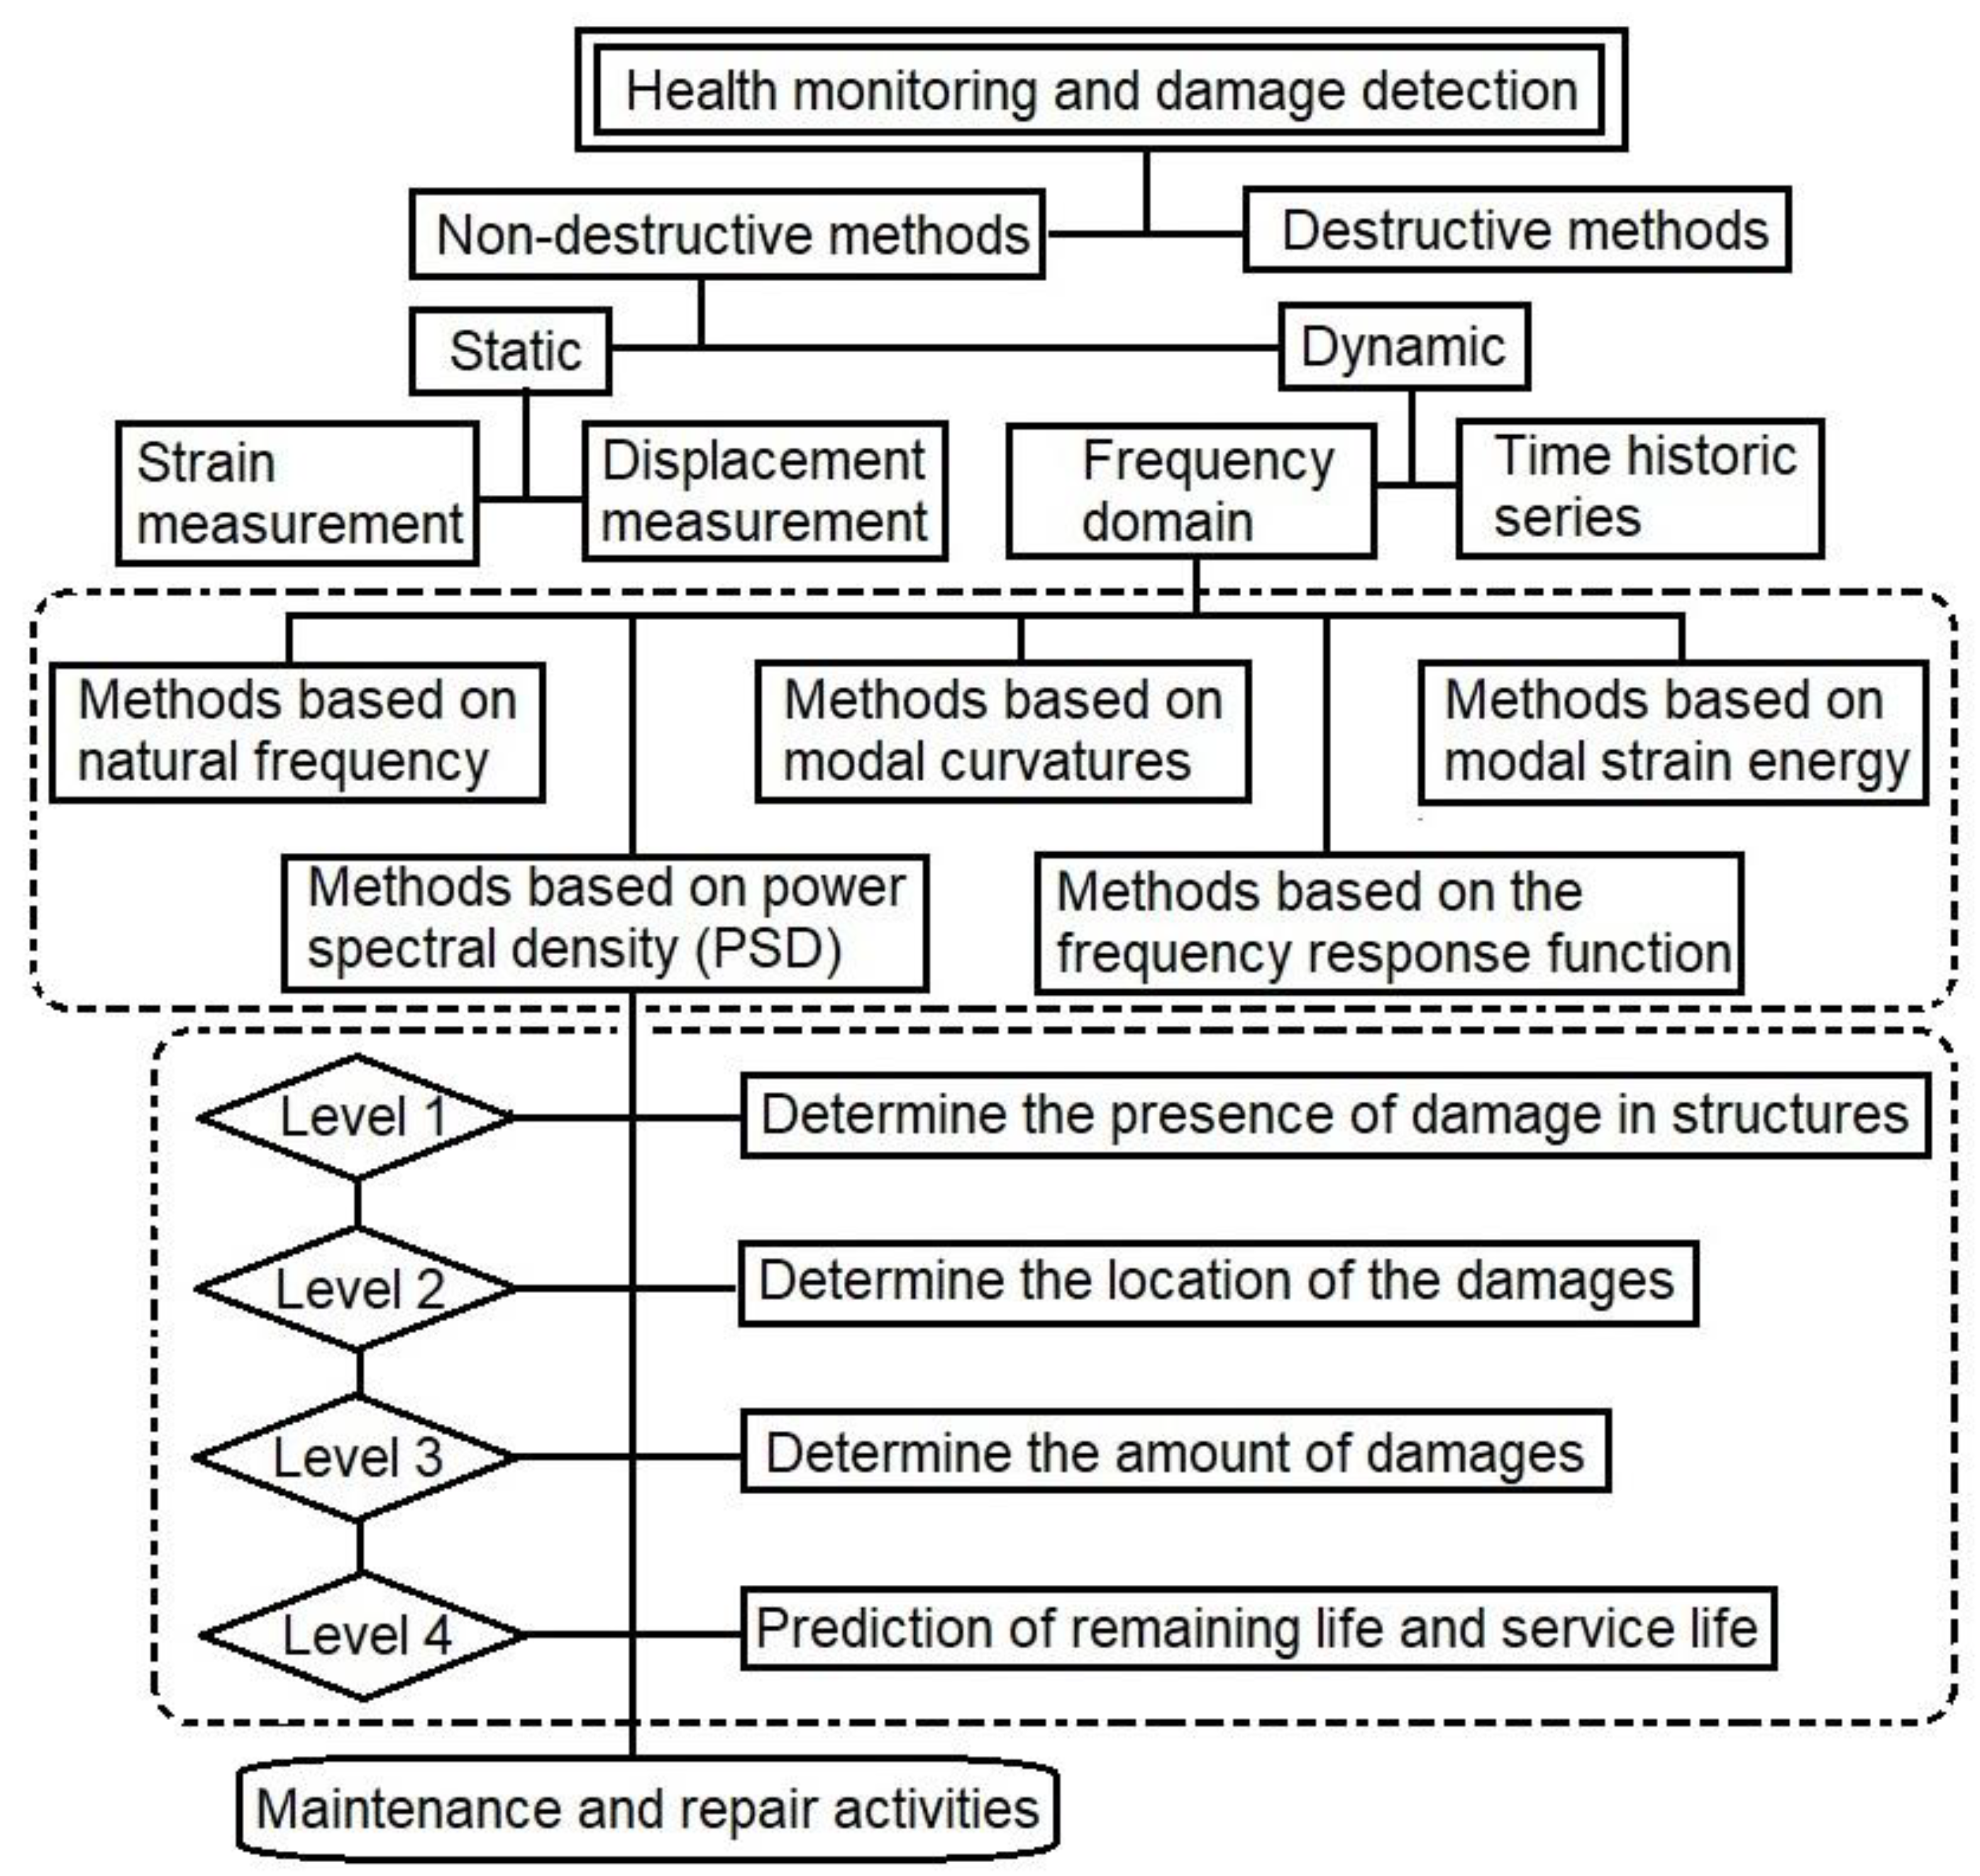
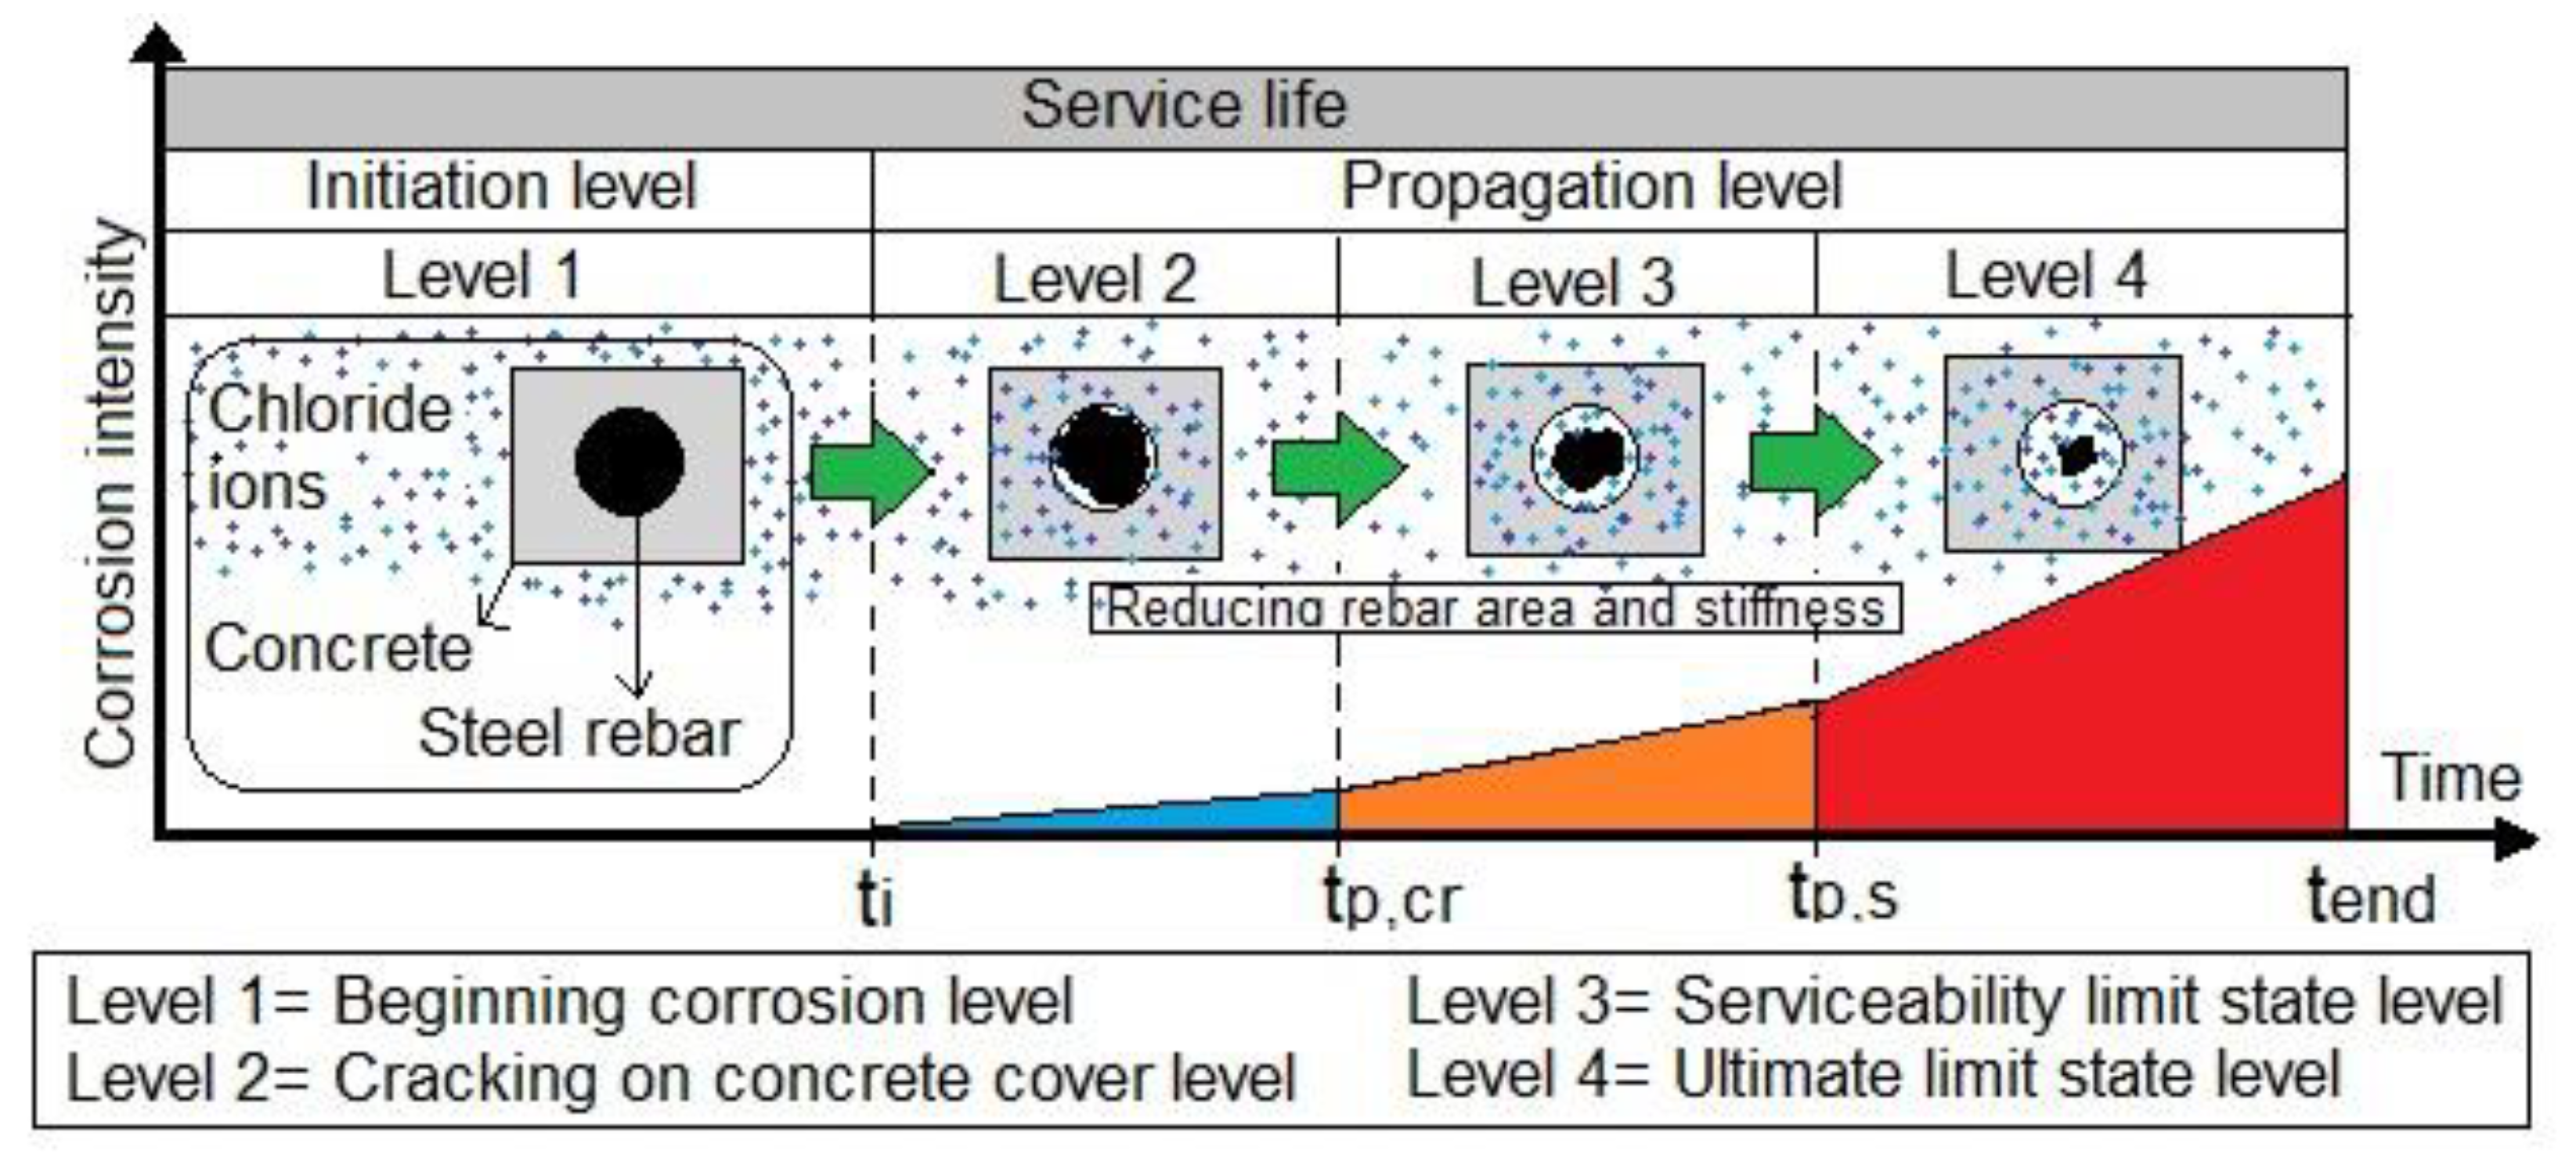
2.1. Service Life and Damage Prediction Methods

Repairing and maintaining structures during their lifetime involves different methods for identifying and predicting possible damage. One of these methods is the PSD method. This research took into account the amount of corrosion and damage to rebars in different parts of a reinforced concrete bridge that was corroded by chloride ions. The impacts of using this method on the environmental impact of the considered structure have been discussed. So, the PSD equation can be obtained according to the transfer function as the following equations [39,41,48,49]:
H ω = ( K ω 2 M + i ω C ) 1
where K is the stiffness, M is the mass, and C is the damping matrices. i is the identity matrix equal to −1. Equation (2) is the form that may be used to write the structural response equation in accordance with the power spectral density.
S X X ω = H * ω S F F ω H T ω
SFF is the PSD inputs matrix at degrees of freedom (DOF). In addition, H*(ω) is expressed as the complex conjugate of a transfer function. The PSD was shown to be a second-order function of the frequency response function in Equation (2), suggesting that it was a highly nonlinear response in structural characteristics.
Structures made of concrete, like bridges and coastal concrete structures, are often prone to corrosion. The damage produced by chloride corrosion in the reinforced concrete building is said to have certain service life levels in the degradation model established in Figure 1 by Tuutti [50].
As seen in Figure 3, corrosion by chloride began at the first corrosion level. In the initial phase, the chlorides were below the chloride threshold. The propagation phase of chloride ion activity included commencing corrosion, structure cover cracking, the serviceability state, and the ultimate limit state [51]. The overall time of the service life of the bridge’s reinforcements by chloride corrosion is shown in the equations below [52].
t l = t i + t p
The corrosion initiation period (ti) refers to the time required for chloride concentrations to rise to the point where corrosion might occur on the rebars. The chloride threshold is determined by the steel qualities and, to some degree, the concrete parameters. In addition, the period tp refers to the amount of time required for corrosion to spread across an entire structural element before the part begins to fail significantly. This research used a deterministic solution based on Fick’s law according to the chlorine diffusion in the RC structure. The equation used in this study was derived from Fib Bulletin 34 [53], whereby it is assumed that the surface chloride concentration remains constant and does not vary with time. The calculation of the initiation stage of chloride diffusion (ti) may be determined using the equation provided in reference [52].
t i = x 2 4 D e r f 1 C s C x . t C x . t 2
where in the equation, D refers to the diffusion coefficient of the chloride for every age of the concrete obtained as
D = D t 0 . t 0 t
Regarding the durability parameters, it was assumed here that the conditioning deterioration mechanism was caused by airborne chlorides. According to Fick’s second law of diffusion, the advance of chlorides through the concrete cover over time depends mainly on two parameters, namely, a diffusion coefficient and a critical chloride threshold, which depend on the concrete mixture [53]:
C x , t = C s · 1 e r f x 2 D 0 · t · t 0 t α
where C(x,t) refers to the chloride concentration in time t (measured in years) and at a depth x from the surface, D0 is the chloride diffusion coefficient, Cs is the surface chloride content, t0 is the primary time, expressed in years, and usually considered as t0 = 0.0767 (equal to 28 days), and α = 0.5 is an age factor.
Conversely, the level of chloride corrosion propagation (tp) commenced subsequent to the starting stage of chloride diffusion, whereby chloride ions present on the surface of the inner rebars initiated the erosion of steel reinforcements. Over a prolonged period, the process of chloride corrosion gradually diminished the stiffness and area of the cross-section of the reinforcements. The Spanish concrete design code offers the following computation for estimating this time:
t p = 80 ϕ d V c o r r
where d is the concrete cover thickness. Vcorr shows the chloride corrosion rate, and ϕ is the diameter of the rebar.
Based on the Spanish Ministry of Public Works [42] findings, pertinent information on the condition of the marine bridge in the seawater may be derived for analytical purposes, as shown in Table 1.
The following formula for the chloride corrosion of reinforcements in coastal bridges may be used to predict the amount of damage produced by corrosion as a percentage [44].
D a m s t   r e b a r t = t t i t p × 100  
Damst rebar is the percentage of reinforcement affected by chloride ions in every time (t) since propagation tp.
Using the sensitivity equation, we can model the updating process by considering the following equations:
Δ Z ω = Δ K ω 2 Δ M + i ω Δ C  
H D ω = Z ω + Δ Z ω 1  
HD(ω) is the frequency response of the corroded bridge according to Equation (8), and Z(ω) refers to the impedance matrix and is the inverse transfer function. So, the damaged elements through the PSD equation can be as follows.
S X X ω = H D * ω S F F ω Δ H ω H D * ω Δ Z * ω S X X ω
The complex conjugate bridge failure transfer function for reinforced chloride corrosion is H D * , depending on the failure prediction approach.
The following equation is an expression of the precise ΔH that was provided by Esfandiari et al. [54]:
Δ H ω = H D ω Δ K ω 2 Δ M + i ω C H ω
It is possible to rewrite Equation (10) by making use of Equations (11) and (13) in the following manner:
Δ S X X ω = H D * ω S F F ω H D ω Δ Z ω H ω H D * ω Δ Z * ω H * ω S F F ω H ω
The dynamic characteristics of each element were changed in the reinforcement’s corrosion damage over time to assess the effect that corrosion had on the structural behavior of the system. This was done so that corrosion damage may be attributed to the system. The equations for the structural stiffness, mass, and damping matrices can be obtained as follows:
Δ K = n = 1 n e K n Δ P n K Δ M = n = 1 n e M n Δ P n M Δ C = n = 1 n e C n Δ P n C  
The structural components’ stiffness, mass, and damping matrix levels are Kn, Mn, and Cn. The observed changes in structural parameters ΔPnK, ΔPnM, and ΔPnC fall within the range of −1 to 1. According to Equation (13) and a chloride-corroded RC bridge, the sensitivity matrices for the structure’s nth parameter determine passive stiffness ratios:
S K = H D * ω S F F ω H D ω K n H T ω H D * ω K n H w S F F ω H T ω S M = ω 2 ( H D * ω S F F ω H D ω M n H T ω ) + H D * ω M n H w S F F ω H T ω S C = i ω ( H D * ω S F F ω H D ω C n H T ω ) + H D * ω C n H w S F F ω H T ω
Finally, the PSD equation for calculating the dynamic characteristic parameter changes for the anticipated damages is as follows:
Δ S x x = S K Δ p K + S M Δ p M + S C Δ p C
In order to monitor the changes in dynamics, such as stiffness and reinforcement loss in cross-section areas over time in the concrete marine bridge elements, Δpk, ΔpM, and ΔpC illustrate the differences in the structural stiffness caused by deterioration over time using the PSD method and equations for the corrosion of the reinforcement.
The construction phase of bridges or tunnels is often associated with several environmental implications and dangers. These include diminished water exchange, habitat destruction, biodiversity loss, heightened levels of suspended solids, and water quality degradation.

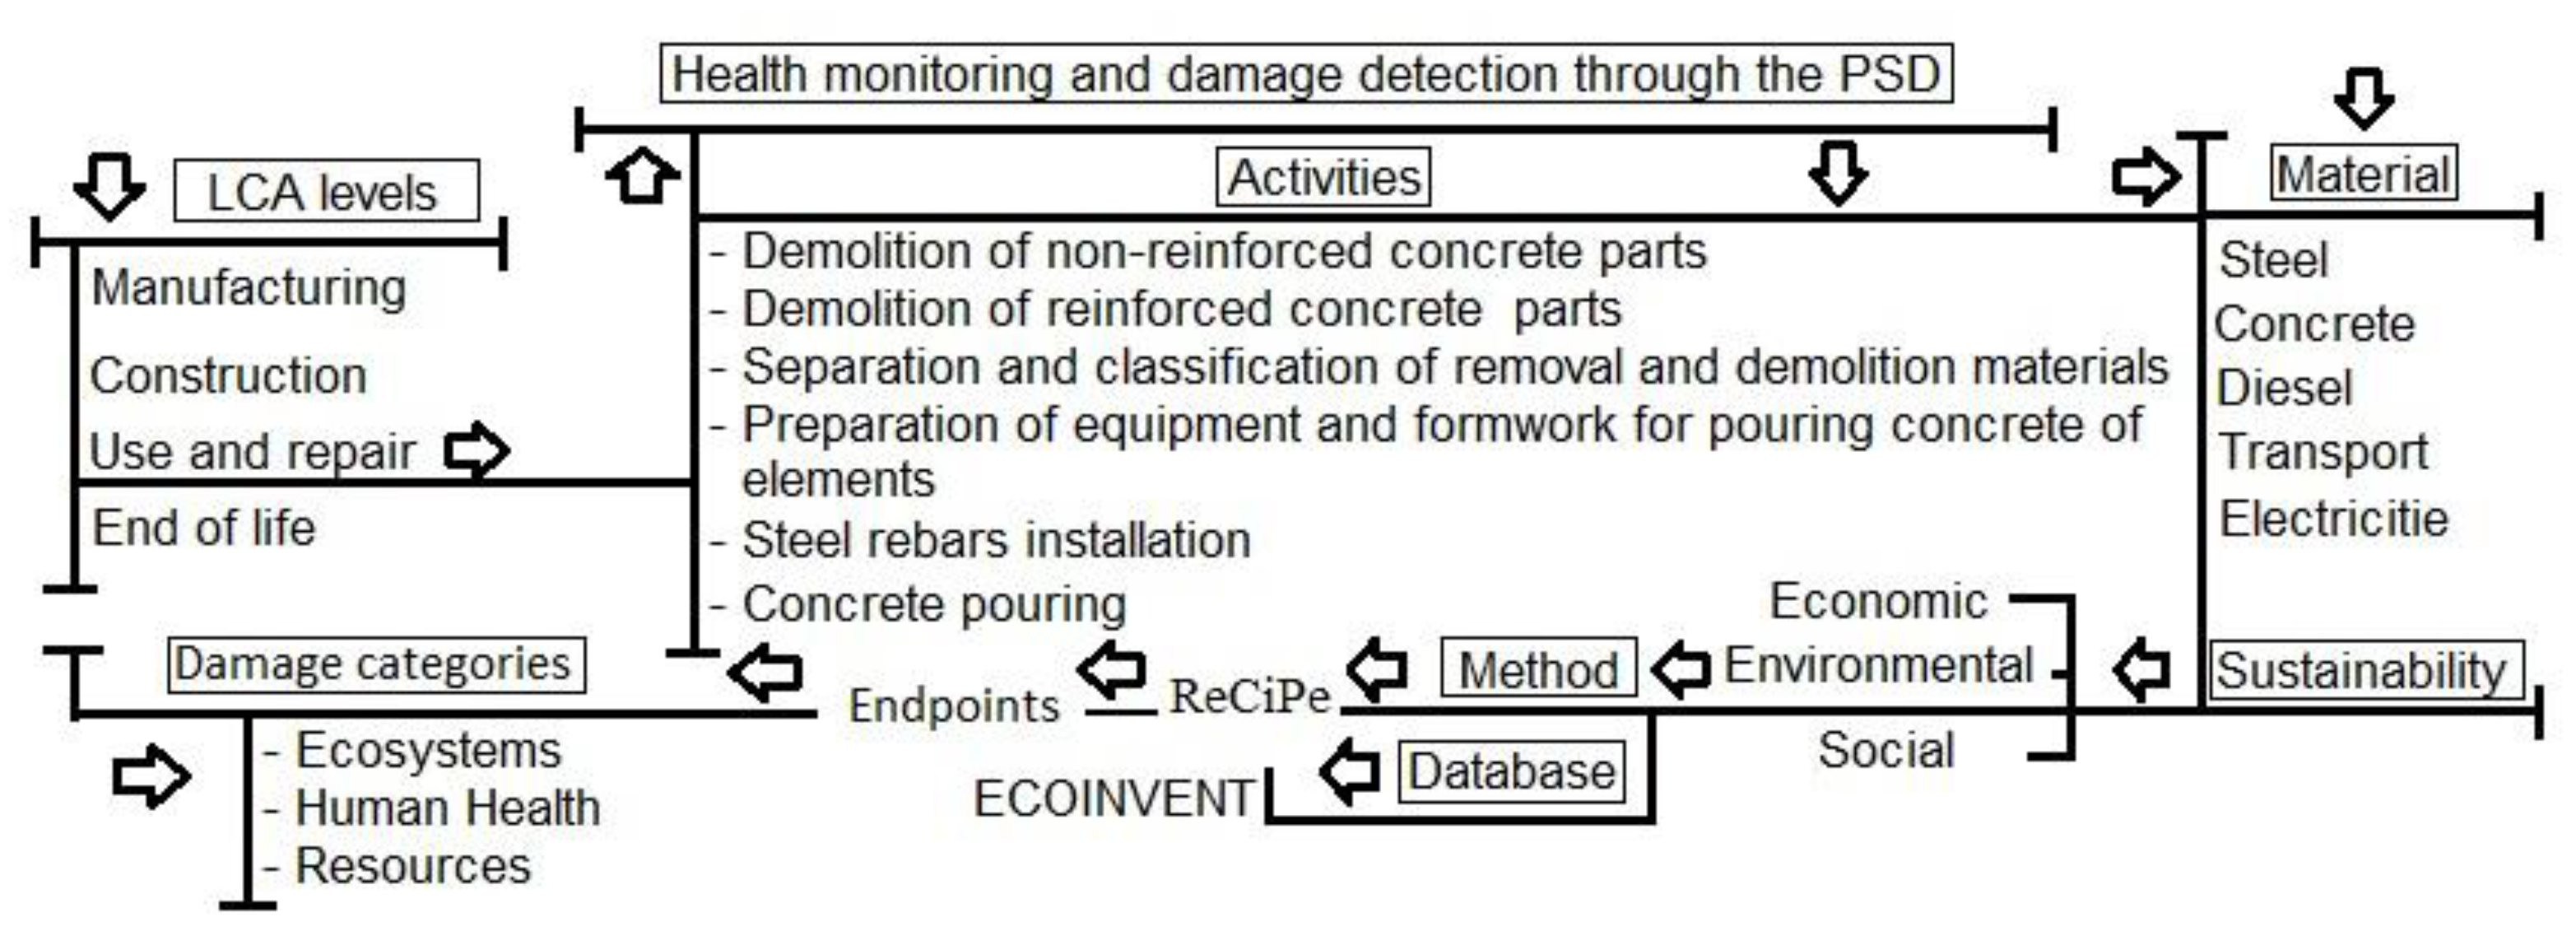
2.2. Life Cycle Assessment

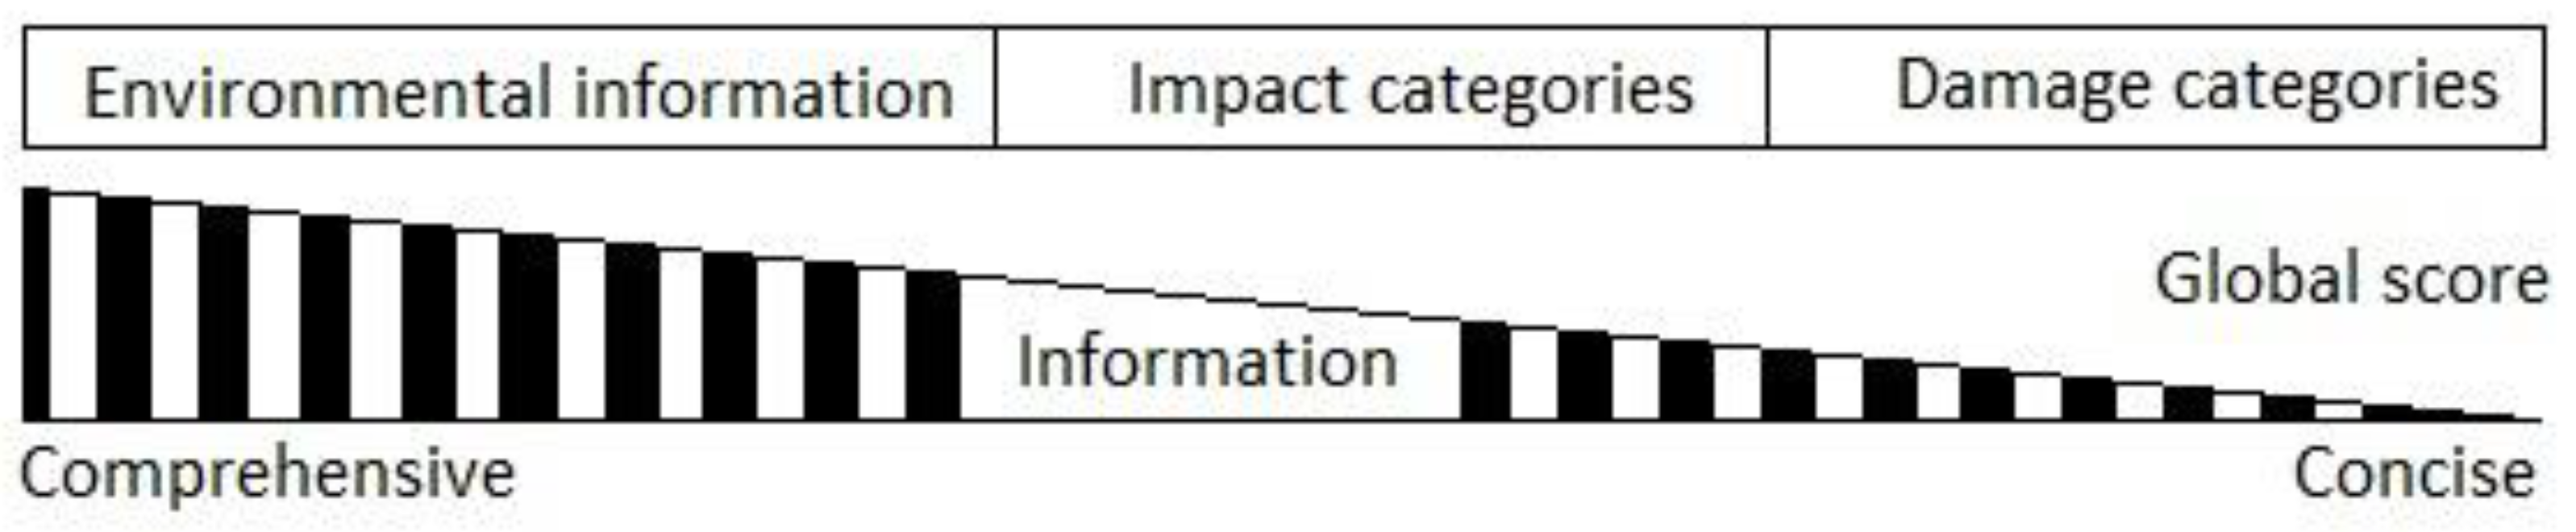
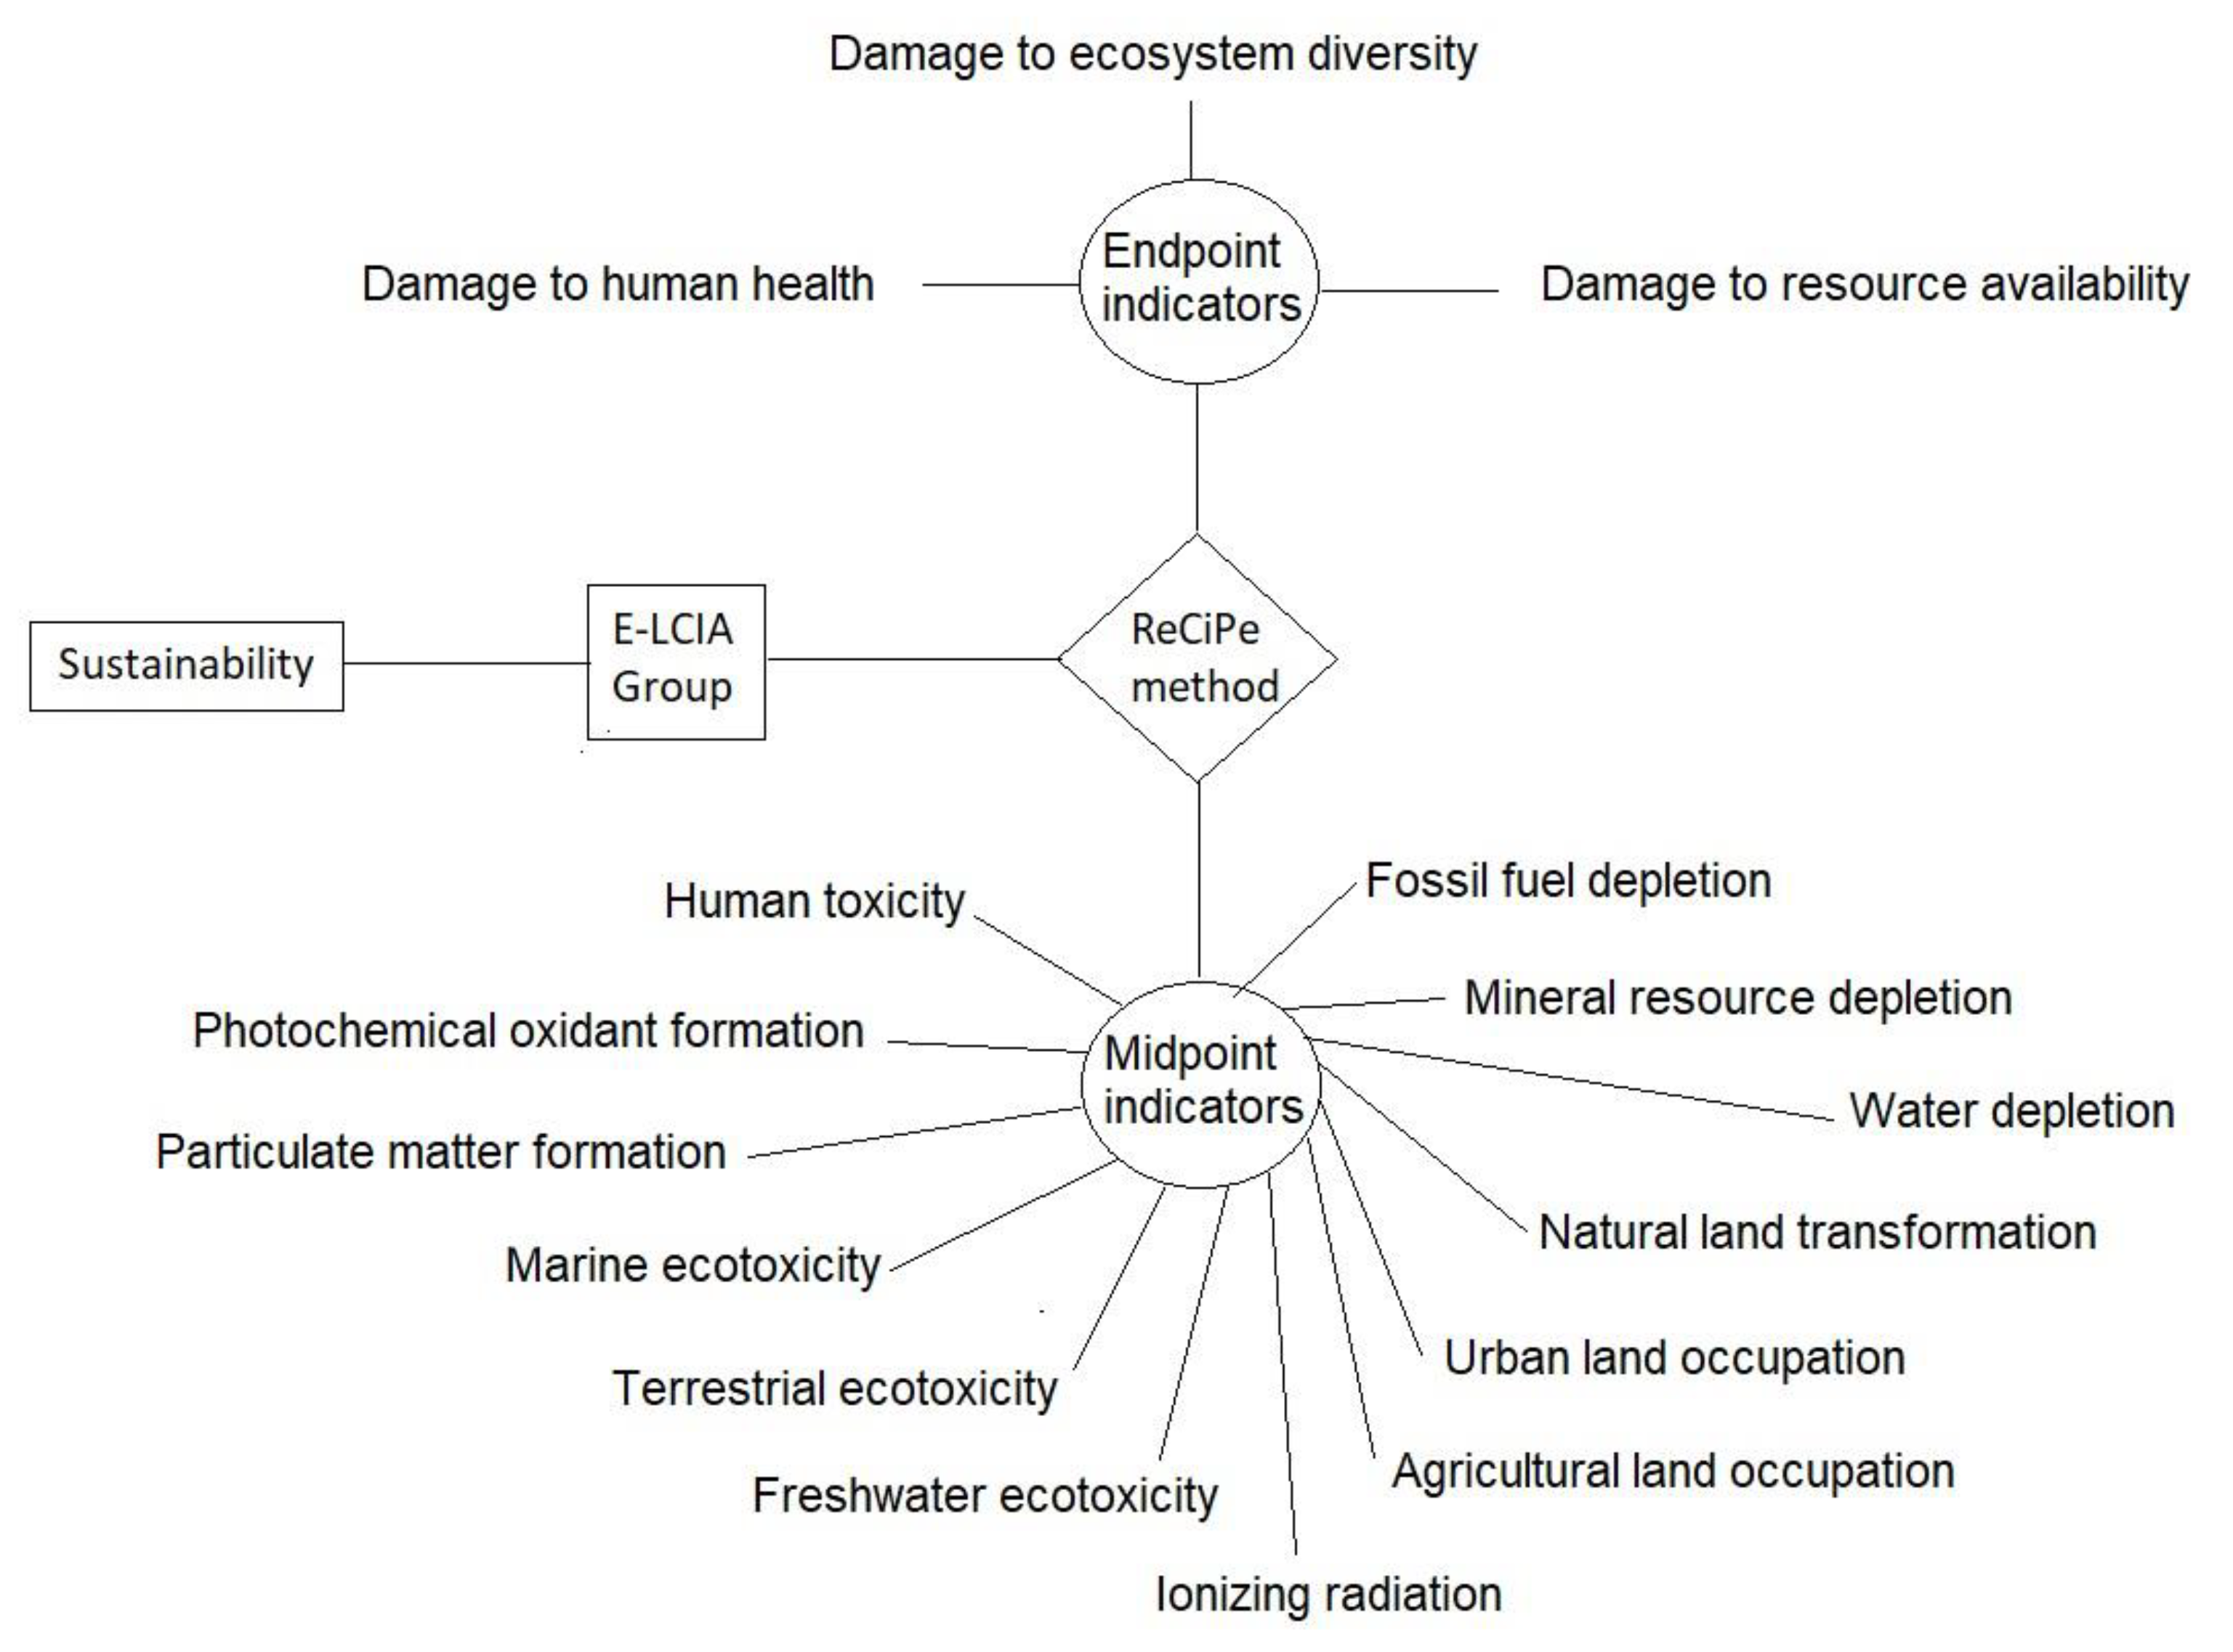
Environmental Impact Assessment

In general, the environmental consequences and dangers that are present throughout the building phase for bridges and tunnels include a reduction in the amount of water exchange, loss of habitat, a decrease in the amount of biological diversity, an increase in suspended particles, and contamination of water quality.
The midpoint and endpoint approaches are two methodologies used in the environment life cycle assessment, an inventory of the life cycle to intelligible indications. The impact on the environment is the focus of the endpoint method, whereas environmental effects are the focus of the midpoint approach. An alternative view is that the midpoint approach is the direct cause, and the endpoint approach is the long-term result. The midpoint and the endpoint are expressed in Figure 4.
The midpoint technique yields more comprehensive information, whereas the endpoint approach yields more compact information. Climate change processes, products, and services release gases into the atmosphere that cause environmental issues like ozone loss and global warming, which is a midpoint approach. In the long term, these gas releases will hurt the environment, people’s health, and finances. In this case, ozone loss can cause more skin cancer cases, which can be an endpoint method. The four main LCA approaches were CML (Institute of Environmental Sciences, institute of the Faculty of Science of Leiden University, Leiden, The Netherland), ReCiPe 2016 (National Institute for Public Health and the Environment, Bilthoven, The Netherland), IMPACT 2002+ (Industrial Ecology & Life Cycle Systems Group, GECOS, Swiss Federal Institute of Technology Lausanne (EPFL), Lausanne, Switzerland), and TRACI (Sustainable Technology Division National Risk Management Research Laboratory Office of Research and Development U.S. Environmental Protection Agency Cincinnati, OH, USA). SimaPro® (Data quality guideline for the ecoinvent database version 3. St. Gallen, Switzerland) and Ecoinvent® (The ecoinvent Database is a Life Cycle Inventory (LCI) database that supports various types of sustainability assessments. Zurich, Switzerland) are the most popular databases [56]. ISO 14040 [45] and ISO 14044 [46] have standardized specifications for different systemic analysis approaches. Figure 5 demonstrates the ReCiPe [57,58] method for the midpoint and endpoint indicators.
As shown in Figure 5, the environment assessment according to the ReCiPe method for midpoint includes human toxicity, photochemical oxidant formation, particulate matter formation, marine ecotoxicity, terrestrial ecotoxicity, freshwater ecotoxicity, and ionizing radiation, which are among the various environmental factors that can have adverse effects on ecosystems and human health. The topics of interest include agricultural land occupation, urban land occupation, natural land transformation, water depletion, mineral resource depletion, and fossil fuel depletion. Conversely, the terminal point encompasses various classifications of harm, including ecosystems, human health, and resources.
The LCA in a structure like a bridge is specified in four phases. These phases may consider all the actions required from the initial design through the end structure’s service life: manufacturing, construction, maintenance, repair, and destruction at the end of the structure’s lifetime (see Figure 6).
This study analyzed the maintenance level that included some activities for maintaining and repairing a coastal RC bridge using the PSD approach as a non-destructive method to determine the location and quantify the damages caused by corrosion during the bridge’s lifetime. E-LCIA was assessed using the ECOINVENT [59] database via the ReCiPe method. For this purpose, the endpoint included damage categories such as ecosystems, human health, and resources.
The maintenance and repair stage during the use of a structure includes all of the procedures required during the bridge’s life.

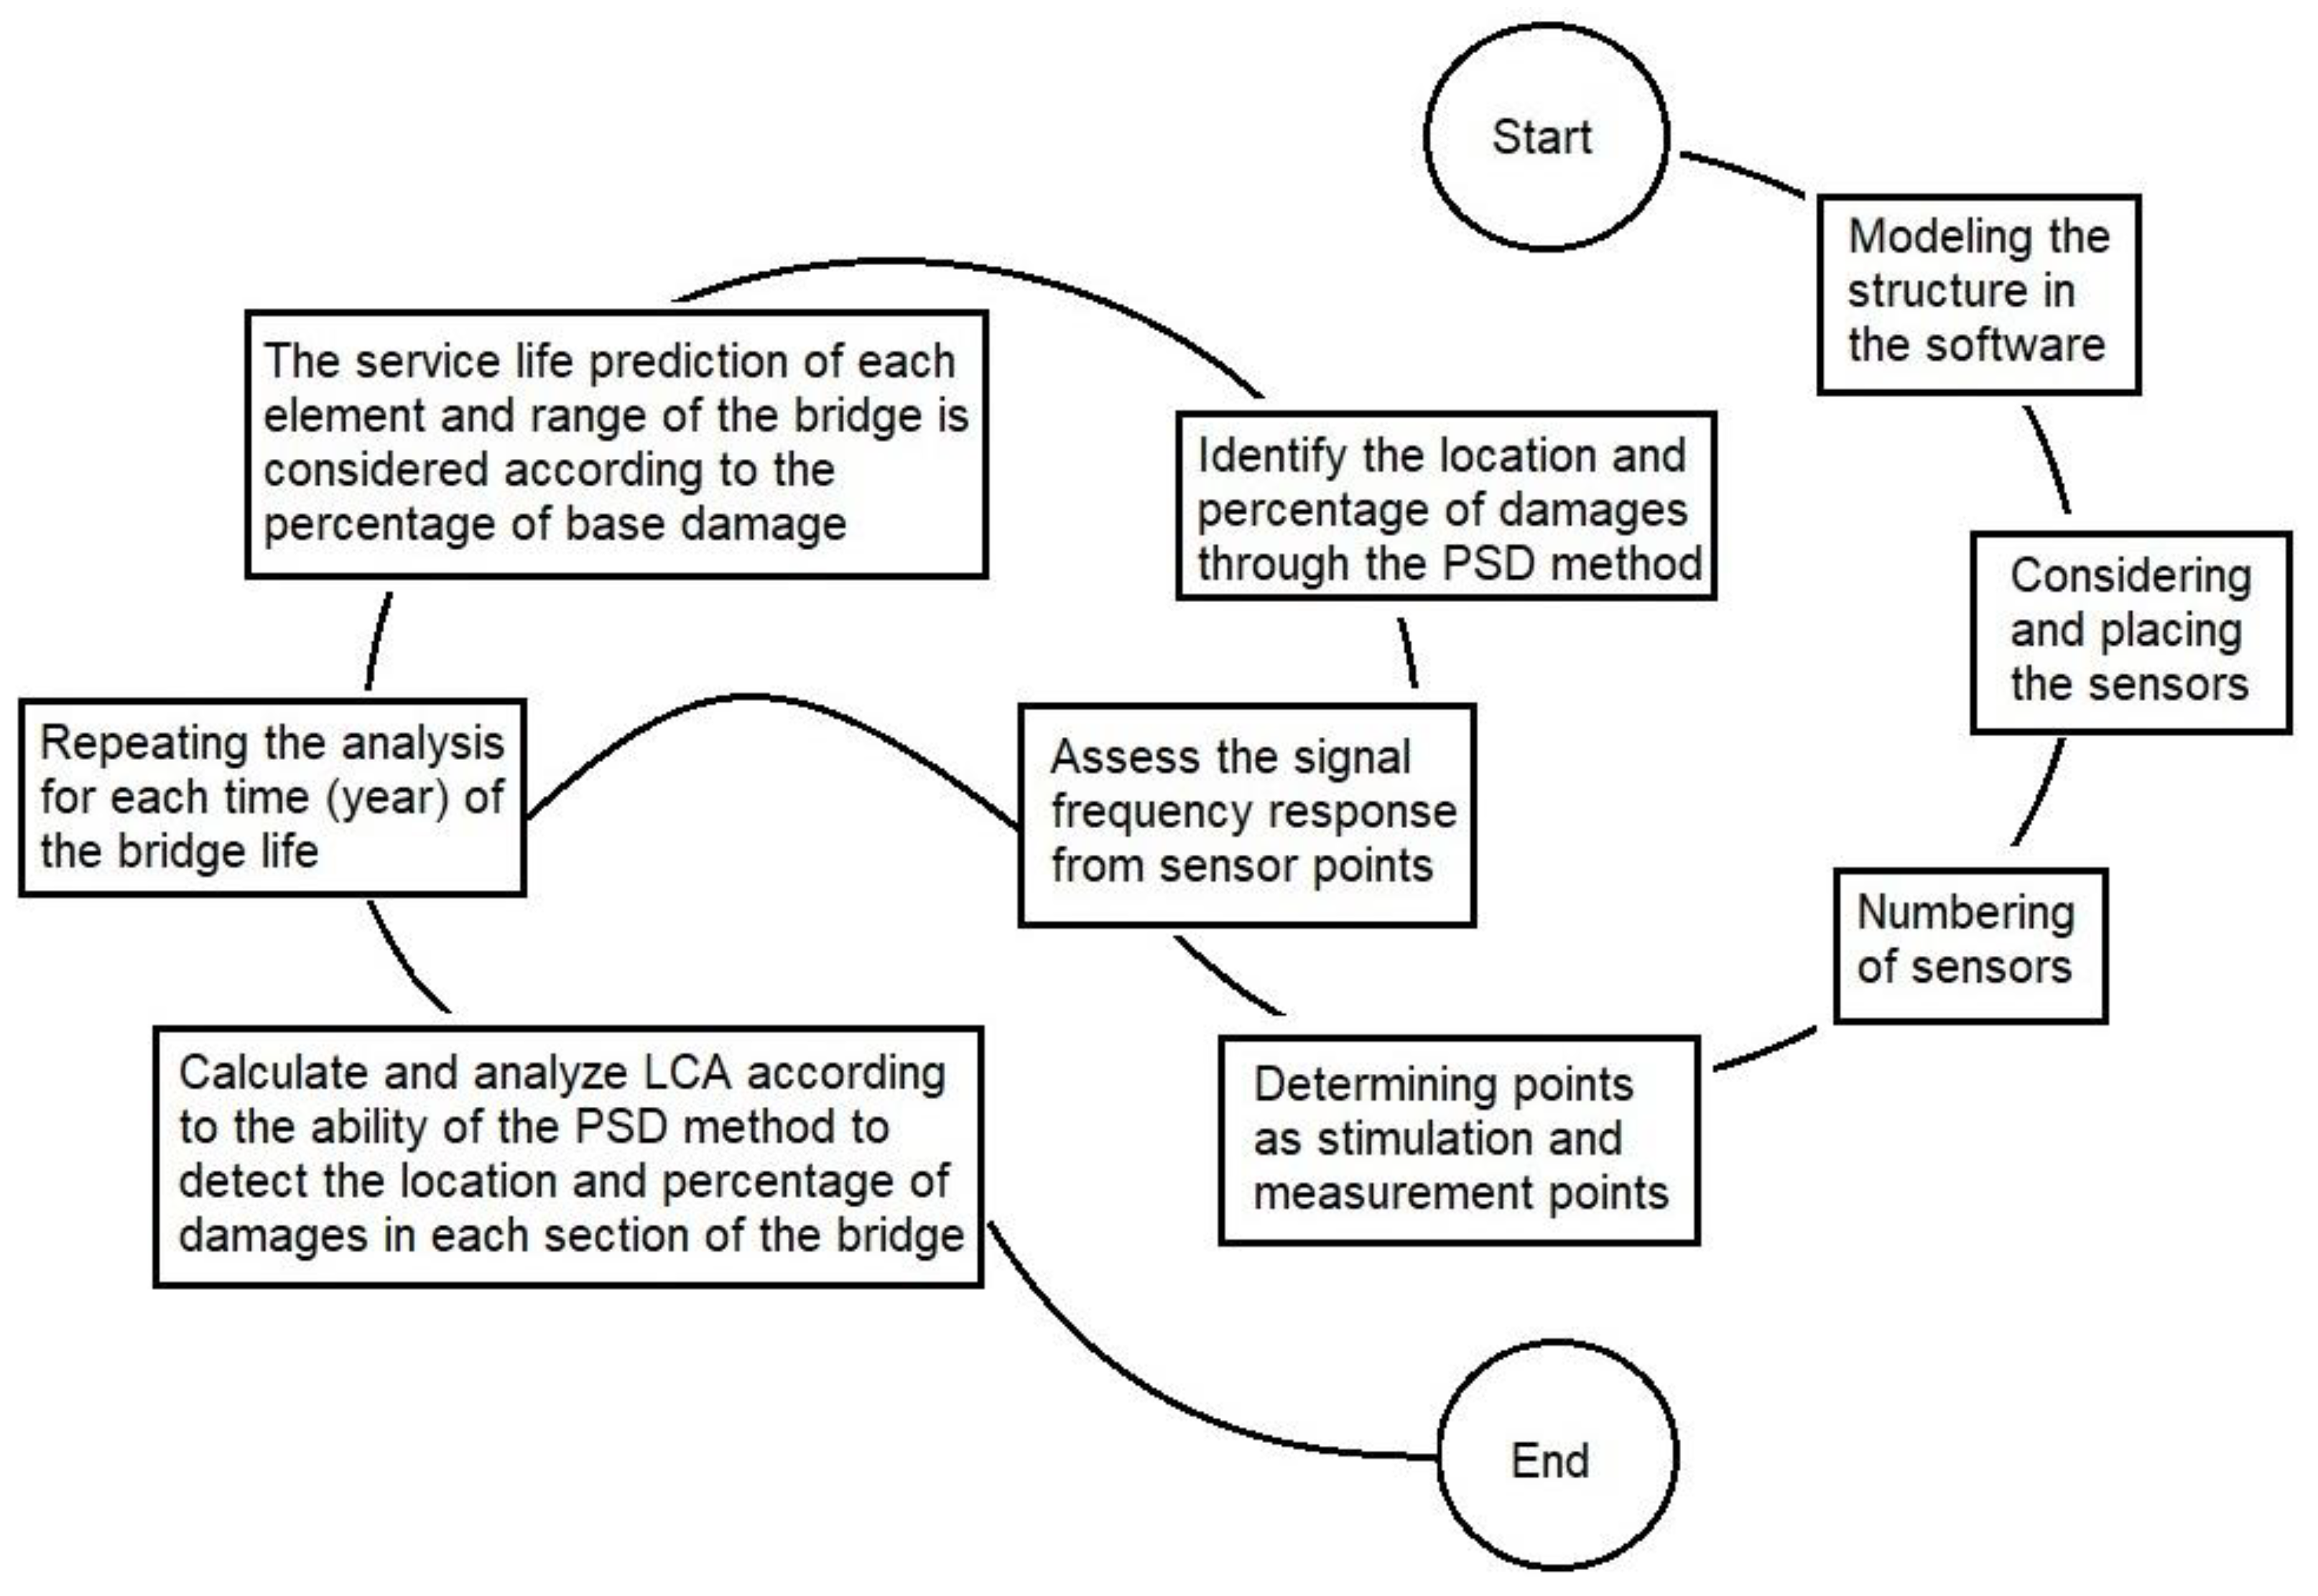
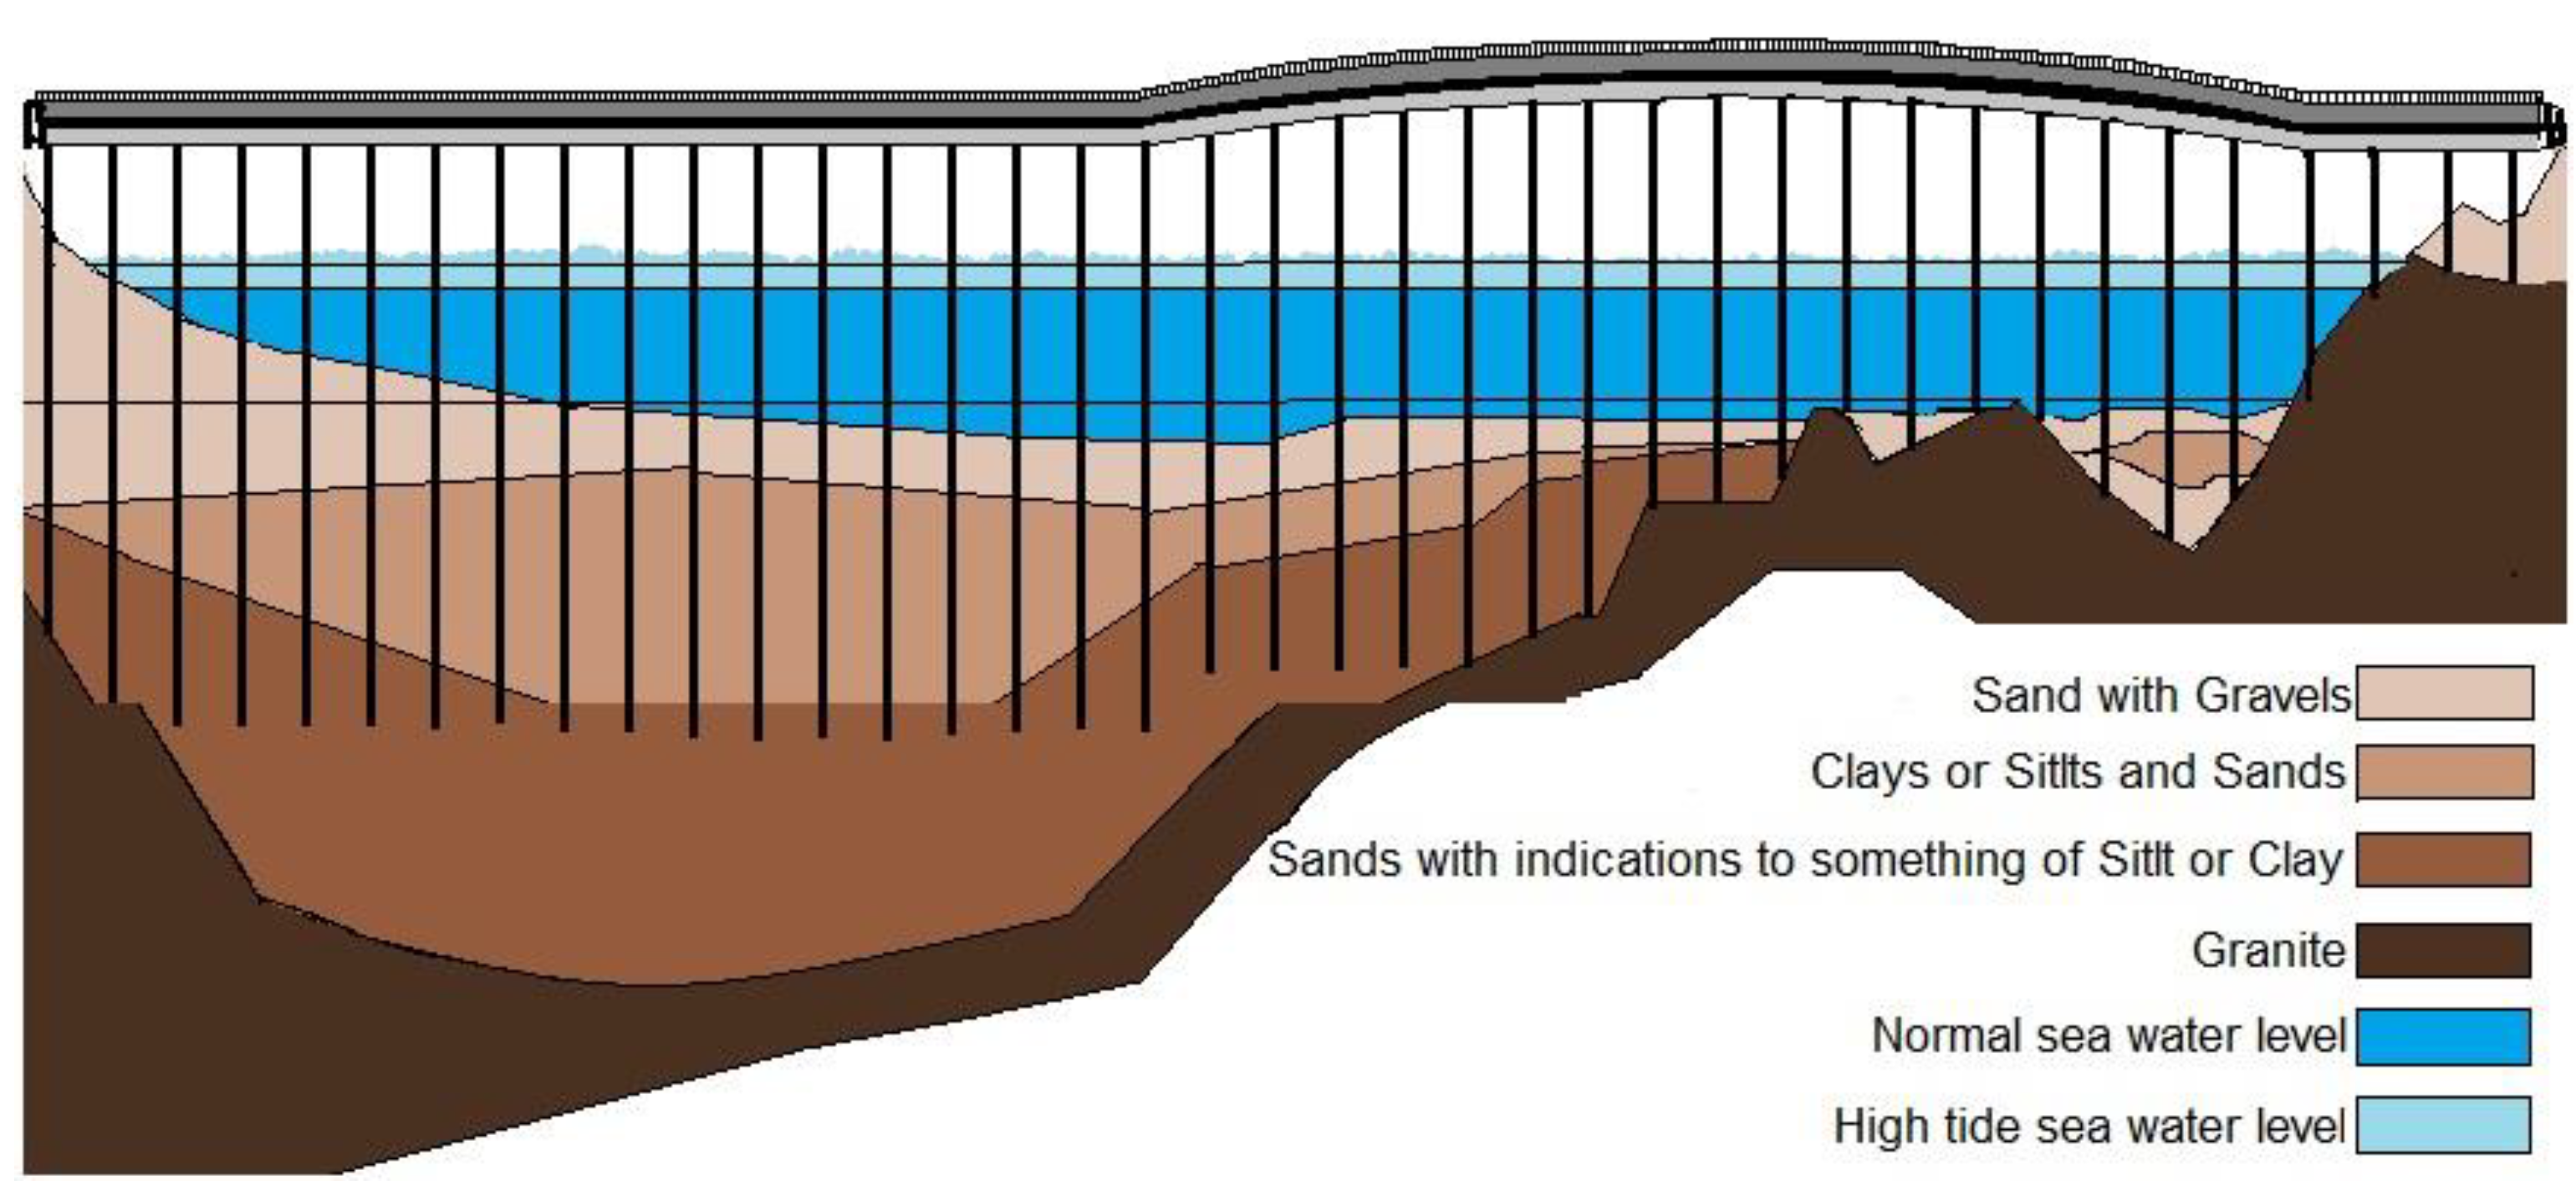
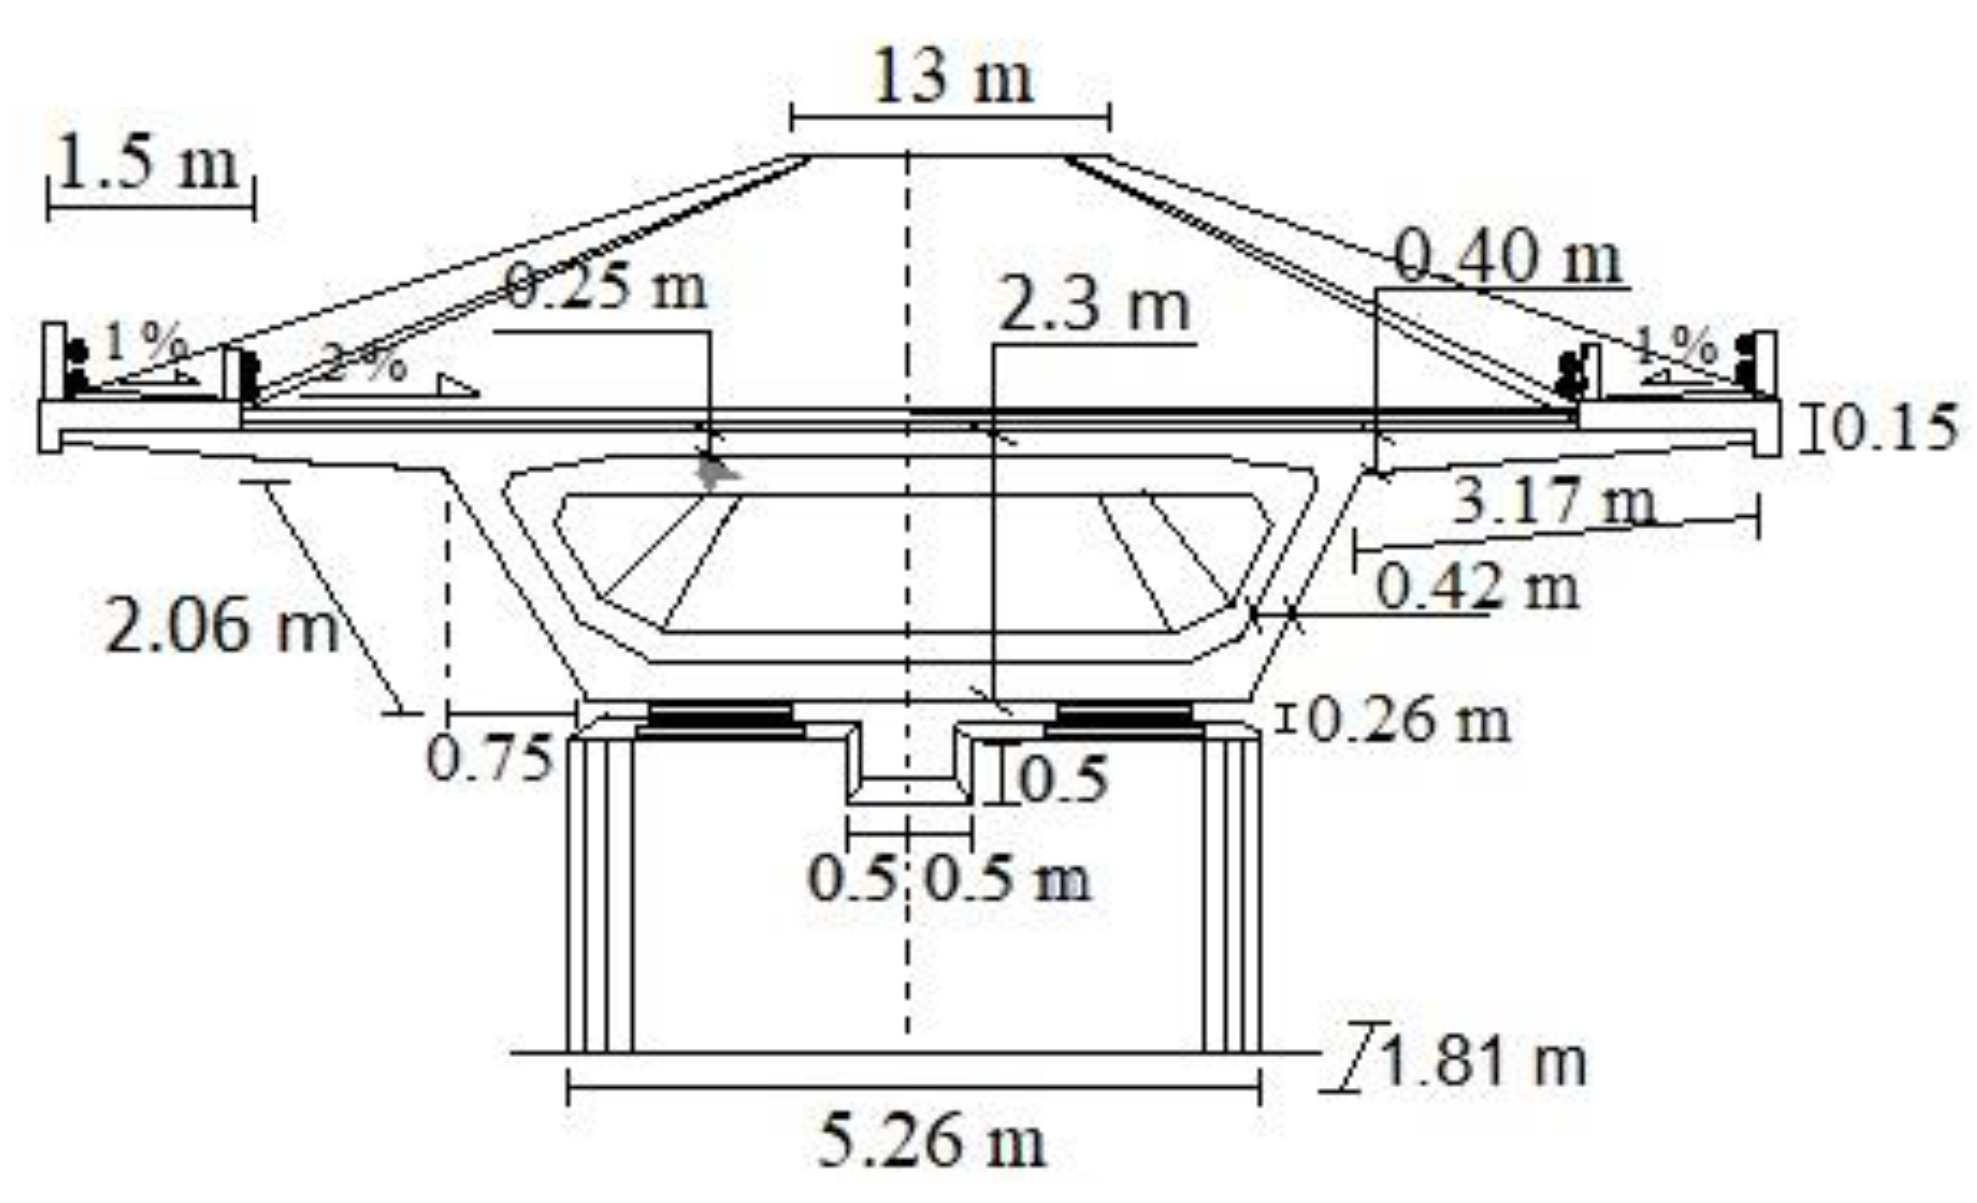
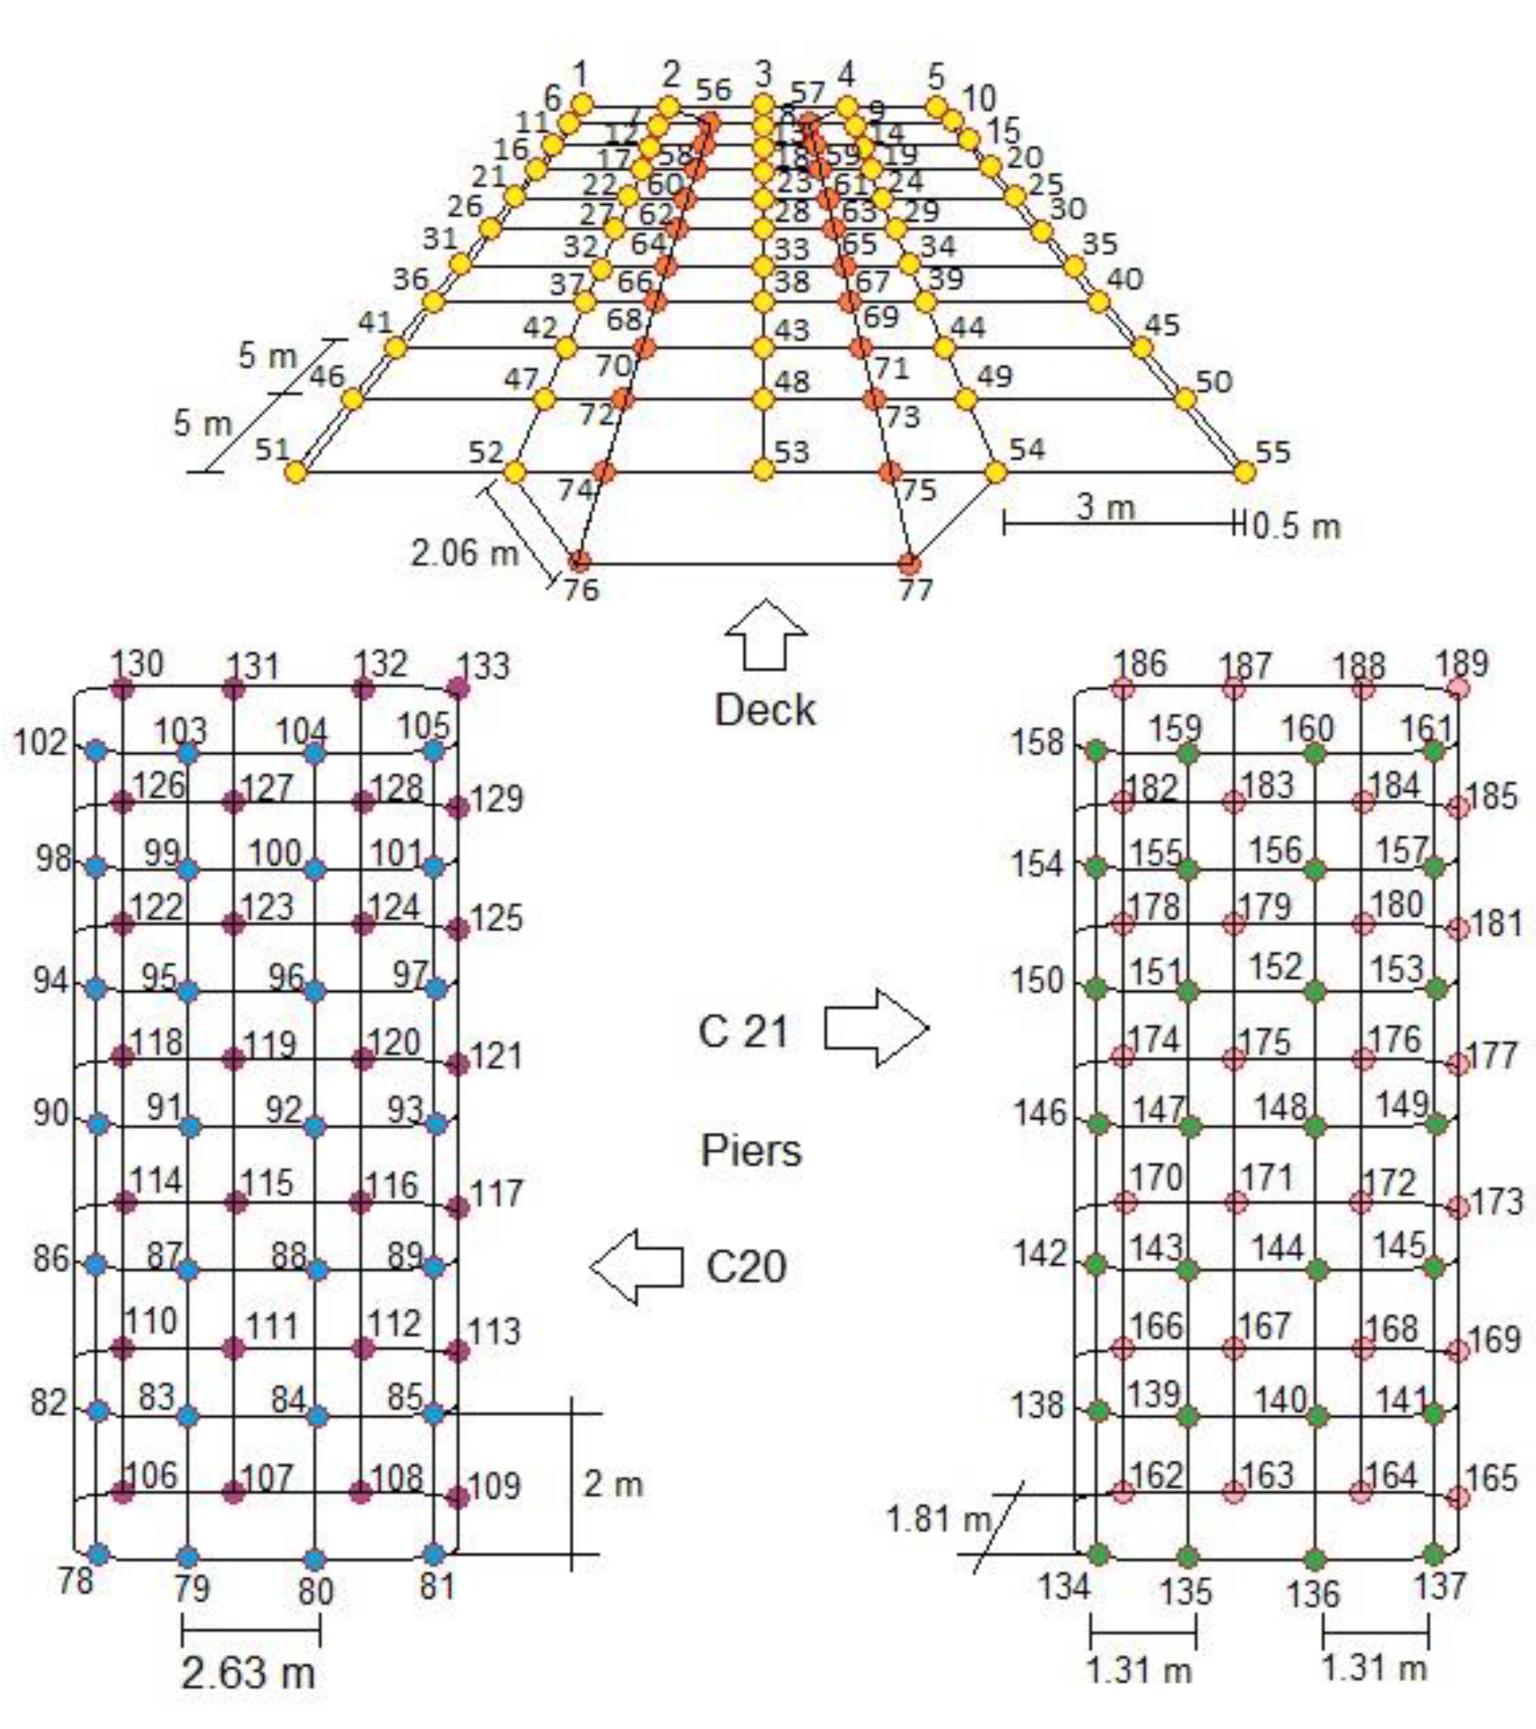
3. Model Description

The methodology presented above was applied to an existing concrete bridge located near the shore. The bridge used as a model for the present investigation was the reinforced concrete bridge in Arosa, in the Spanish region of Galicia (Figure 7). The data required to define the geometry of this bridge were gathered from the scientific literature [60,61,62]. In particular, the bridge measured 1980 m in length. The initial and final spans each had a span length of 40 m, while the intermediate spans had a length of 50 m.
The deck of this bridge was of a box-girder type and lay approximately 9.6 m above the mean high water level, being thus exposed to a high concentration of airborne seawater chlorides. Figure 8 presents the dimensions of the bridge deck [61,62], which were as follows: 13 m in width and 2.30 m in height. There were two walkways on each side of the deck. The width of each of them on the sides of the deck was 1.5 m. The bridge’s transverse and longitudinal piers were 5.26 m and 1.80 m, respectively.
It was estimated that the steel amount for this bridge was 100 kg per cubic meter of concrete [61]. The steel reinforcement concrete cover was 35 mm for the deck reinforcement and was increased to 45 mm for the reinforcement in the piers, which were located in the so-called splash, tidal, and spray exposure zones (XS3 exposure zone according to UNE EN 1992-1-1).
The concrete mix of the structure included a water-to-cement ratio w/c = 0.45 and contained 218.5 l/m³ of water, 485.6 kg/m³ of cement, 926.7 kg/m³ of gravel, and 827.9 kg/m³ of sand, where every value was referred to a m³ of the resulting concrete. In addition, the characteristic compressive strength fcm equaled 40 MPa, and the modulus of elasticity Ec equaled 29 GPa.
Furthermore, according to the concrete mix considered in this study and following the provisions from [52], the diffusion coefficient to be considered for the present case study was D0 = 10 × 10−12 m²/s, and the critical chloride threshold Ccrit = 0.6%. The third parameter that determined the chloride advance through concrete over time was the so-called surface chloride concentration, which depended on the chloride content in contact with the concrete element. Based on the distance between the structure and the seawater, a surface chloride content of 3.34% (Cs,0) was used to assess the bridge deck [52].

The Numerical Model Analyses
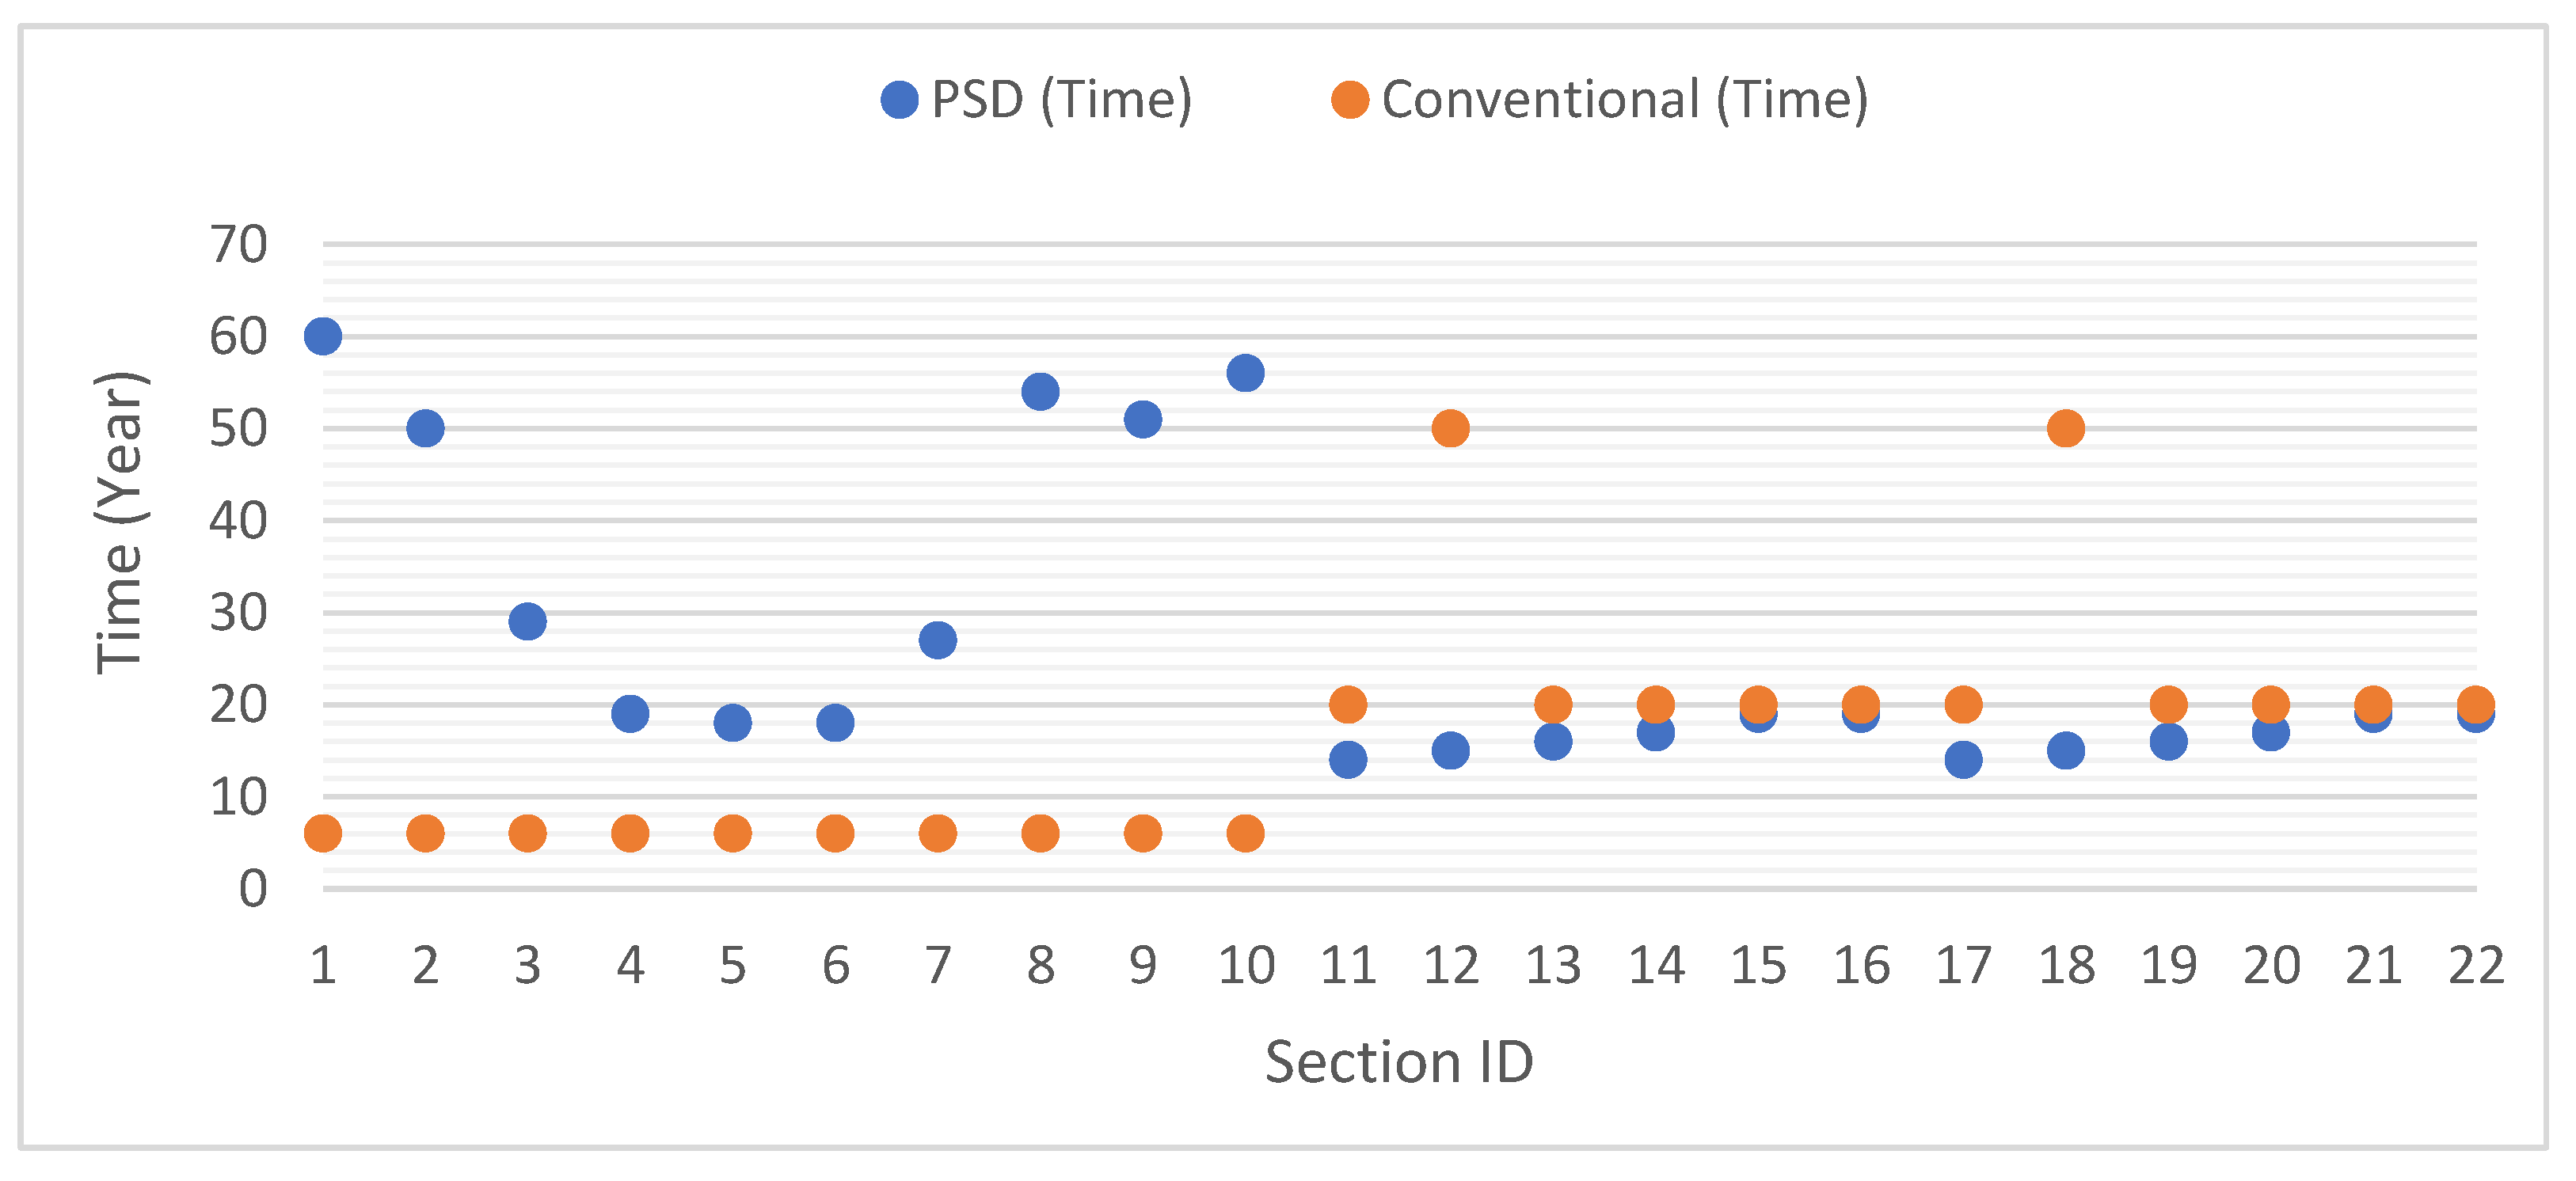
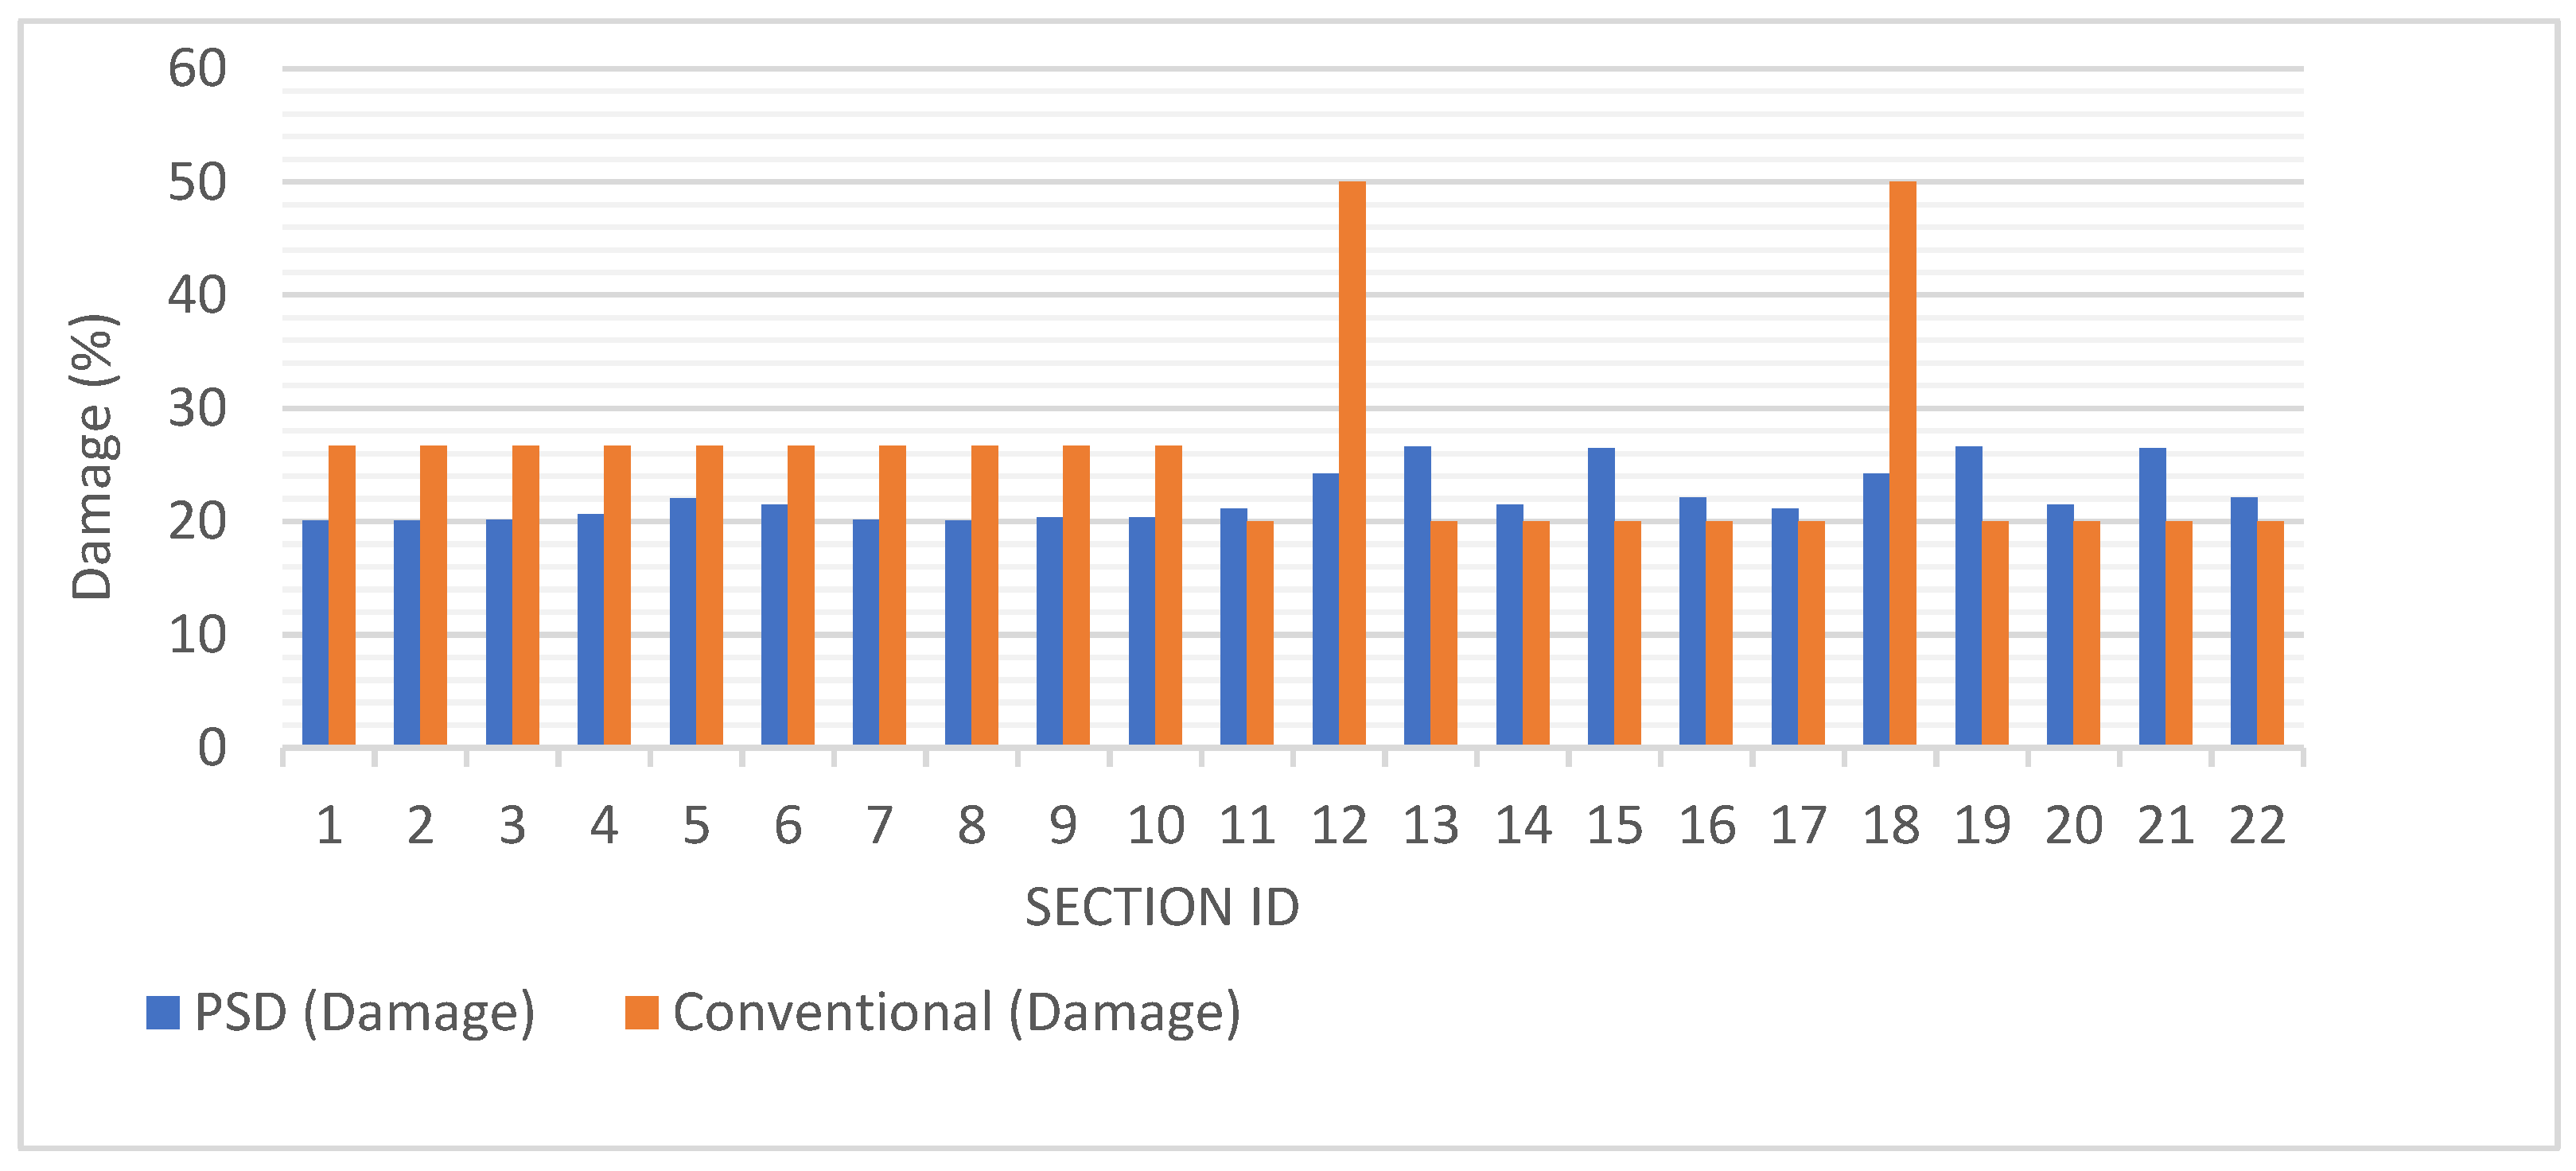
As computers and sensors improve in capacity and speed, non-destructive numerical models of structures are used to identify damages. Based on vibration and signals, the PSD technique studied damage caused by chloride ions on a computational model of a coastal bridge. The numerical model of the reinforced concrete bridge reinforcement used defined regions and sensors at certain distances for health monitoring every year from the start of the corrosion period to the end. As seen in Figure 9, these spans’ deck and column numbers were renumbered from 1 to 167.
The numbering of the sensor locations for assessment is shown in Figure 9. The numbers 1 through 77 correspond to deck bridge locations 5 m apart in length and 3 m apart in breadth. The point totals on one column began at 78 and went to 189 on the other. The sensors on the columns’ lengths were 2.63 m apart in breadth and 2 m apart in height. The column widths were roughly 1.80 m apart.
Some sites were points of simulation, and some were measuring points to track chloride attack damage at each bridge position. These points were believed to be fixed for yearly test monitoring and analysis. In this regard, certain portions and components were selected as simulation points, and others were selected as locations for measurement points. The simulated and measured points were far apart. Thus, the simulated points on the deck were 3, 18, 33, 48, 58, 59, 64, 65, 70, 71, 76, and 77, and between piers, the points were 86, 89, 98, 101, 115, 116, 127, 128, 135, 136, 147, 148, 159, 160, 162, 165, 174, 177, 186, and 189. The locations of the measurement and stimulation points were assumed to be fixed and under the same conditions throughout the experiment. Because of this assumption, the researchers could track how these sites moved over time. This experiment employed trial and error to determine the number and location of sensors on the bridge span as software often computes sensor distances and frequency responses. The number and location of sensors determined their distance. Reducing the number of sensors increased their distance, which reduced the simulation point signals. This affected the frequency reception at the measuring stations even at large distances, influencing the findings.
Additionally, chloride ions damage concrete components. This numerical study estimated 10% noise and error for the coastal bridge. PSD could detect damage via MATLAB, and Open Sees was used to examine the chloride ions. Figure 10 summarizes the research on the PSD and the ability of a traditional techniques approach to anticipate structural failure and reduce repair costs for the coastal bridge.
The environmental impact assessment through a non-destructive damage detection method for repairing and maintaining a bridge over its expected lifetime of one hundred years is depicted in flowchart form in Figure 10. The annual wear and tear on the bridge was analyzed in detail. After that, the repair operation was examined for structural, elemental, and area damage exceeding twenty percent. The percentage of damage that represented the commencement of damage depended on how important it was to monitor building repair and maintenance times. The annual impact on the environment of repairing and maintaining the facility was subsequently calculated.

4. Results

A non-destructive approach to assess the quantity and location of damages on a corroded and eroded coastal bridge was tested in the first stage. In order to identify the damages brought on by chloride corrosion in the RC bridge structure, the performance of the PSD approach in comparison with the conventional method was evaluated, and the results were compared and contrasted. The service life period time in Arosa Bridge according to the quantity damages based on the beginning repair is shown in Figure 11.
As shown in Figure 11, the desired time (years) to carry out the repair activities of each section of this bridge span was calculated during the life of this structure (100 years). The amount of damage to the base was assumed to be 20% for the purpose of carrying out repair activities [44]. Therefore, when the percentage of damage in one bridge element was more than 20%, this time (year) was the service life period for repair activities. The amount for each bridge section number of this case study is shown in Figure 12. And this amount could be different according to the importance and conditions of the structure.
As shown in Figure 12, the percentage of damage obtained to calculate the service lifetime and repair period in every part of the bridge in Figure 11 showed that the PSD method could be more accurate for each section ID considered, on average, if the damage reached 20% to 22%, predicting that it would reduce more damage to the structure, perform life service earlier and on time, and prevent more damage and more cost for repair.
Furthermore, as a defect of the conventional method of determining the service lifetime for most parts and sections of the bridge, it was determined that the amount of damage was about 27% or more. According to the obtained results, this problem would involve the most significant risk and financial loss, especially for the sections of the bridge foundations that were in the tide zone (12 and 18), and would cause more corrosion by chloride ions because the damage in these parts for the conventional method of timed first-life service, repair, and maintenance was predicted, which was around 50%. But the PSD method predicted the time when the amount of damage was around 24% as the first time (year) to carry out repair and service life activities, which could reduce the repair and maintenance costs and life risks as well as decrease the environmental effects in the repair and maintenance phase of this bridge.
As follows, according to the predicted times for each section of the bridge using the PSD and the conventional techniques for repairing the damaged parts of the bridge, the performance of PSD as a method of identifying damage in the structure in the changing environmental impact was evaluated and compared in the stage of bridge repair and maintenance. Generally, the results of the assessment of the environmental impact by ReCiPe for endpoint using ECOINVENT for the deck and columns of the bridge through these methods are presented in Table 2.
Table 2 demonstrates the environmental impact results of the Open LCA 2.0 software for three categories, including the ecosystem quality, human health, and resources.
The difference in E-LCA impacts when maintenance by the PSD method was compared with the conventional method in the Arosa bridge is shown in Table 3.
Table 3 shows the differences in values for the subcategories of the ecosystem quality category, including agricultural land occupation, climate change for ecosystems, freshwater ecotoxicity, freshwater eutrophication, marine ecotoxicity, natural land transformation, terrestrial acidification, terrestrial ecotoxicity, and urban land occupation, which were equal to 3232.54, 79,745.45, 10.32, 40.55, 223.05, 39,134.41, 261.40, 885.54, and 766.71, respectively, using the conventional method and PSD for a bridge span including two columns and a 50 m long deck. Also, this value difference between the two methods for the subsets of the human health category included climate change (human health), human toxicity, ionizing radiation, ozone depletion, particulate matter formation, and photochemical oxidant formation, respectively, with values of 100,331.05, 124,842.53, 104.79, 6.54, 13,768.97, and 356.95. And finally, the value differences for the subset of the resources category, including fossil depletion and metal depletion, were 84,746.24 and 14,056.66, respectively.
Furthermore, the E-LCA for the deck and columns of a span of the bridge through two method damage detection methods for maintenance and repair activities are shown in Figure 13.
The analysis results showed the PSD method’s significant effect on reducing this bridge’s environmental impact. The PSD method reduced the amount of total ecosystem impact, compared with a conventional approach in maintenance and repair of the deck of a span of the bridge, with a decrease of about 61,449.68 points; for total human health as one of the vital impacts, it helped to reduce the impact by about 118,802.69 points. And also, the total resources in the deck of the bridge through the PSD method could save about 49,028.9 points. Finally, in the columns of the coastal bridge, for total ecosystem quality, human health, and resources, the use of the PSD method could result in less harm to the environment, by about 62,363.55, 120,608.15, and 49,774 points, respectively.
Overall, the final results showed that the total difference in the effect of using PSD compared with the conventional method on the whole ecosystem quality, human health, and resources in the bridge deck and two columns of a span was less than during the bridge’s life.

5. Conclusions

The results of the LCA and the performance of a non-destructive method of detecting damage in a structure to repair and maintain a structure, and therefore, the design and construction of the bridge, showed the use of these methods in reducing inappropriate and harmful environmental effects. The life cycle assessment analysis and the performance of the non-destructive and dynamic method of detecting damage in a structure showed here that the PSD method, which is a dynamic and non-destructive method, outperformed conventional techniques in terms of its ability to predict damage in a coastal reinforced concrete bridge in an environmental impact assessment.
The application of PSD for predicting maintenance needs along the use and maintenance life cycle stages of a structure, in comparison with conventional methods, allows the designer to estimate not only the occurrence of damages over time but also their approximate location. This provides a more realistic prediction of the impacts of maintenance of any kind throughout the infrastructure lifecycle, leading to more valuable decision-oriented results. In this research, and for the case study analyzed, it was shown that the use of the PSD method, in comparison with the conventional method in terms of environmental impact, could reduce the predicted harmful effects on the environment by 14.33% in the deck and 29.62% in the columns of the bridge in the stage of bridge repair and maintenance.
Future studies will look at using PSD-based maintenance prediction algorithms in structures to analyze societal consequences throughout the infrastructure’s life cycle. It would also be interesting to include PSD-based methodologies in sustainable decision-making tools to obtain more realistic scenarios from the usage stage of an infrastructure’s life cycle and make more practical judgments during the design phase.

Author Contributions

Conceptualization, M.H.-B.; methodology, M.H.-B., I.J.N., and V.Y.; software, M.H.-B.; validation, M.H.-B., I.J.N., and V.Y.; formal analysis, M.H.-B.; investigation, M.H.-B.; resources, M.H.-B., I.J.N., and V.Y.; data curation, M.H.-B.; writing—original draft preparation, M.H.-B.; writing—review and editing, I.J.N. and V.Y.; supervision, V.Y. and I.J.N.; visualization, M.H.-B. and I.J.N.; project administration, V.Y.; funding acquisition, V.Y. All authors have read and agreed to the published version of the manuscript.

Funding

This study was funded by Grant PID2020-117056RB-I00, by MCIN/AEI/10.13039/501100011033, and by “ERDF A way of making Europe”.

Institutional Review Board Statement

Not applicable.

Informed Consent Statement

Not applicable.

Data Availability Statement

Not applicable.

Conflicts of Interest

The authors declare no conflict of interest.

References

  1. Keeble, B.R. The Brundtland report: Our common future. Med. Confl. Surviv. 1988, 4, 17–25. [Google Scholar] [CrossRef]
  2. Liljenström, C.; Björklund, A.; Toller, S. Including maintenance in life cycle assessment of road and rail infrastructure—A literature review. Int. J. Life Cycle Assess. 2022, 27, 316–341. [Google Scholar] [CrossRef]
  3. Renne, N.; Kara De Maeijer, P.; Craeye, B.; Buyle, M.; Audenaert, A. Sustainable Assessment of Concrete Repairs through Life Cycle Assessment (LCA) and Life Cycle Cost Analysis (LCCA). Infrastructures 2022, 7, 128. [Google Scholar] [CrossRef]
  4. Caruso, M.; Pinho, R.; Bianchi, F.; Cavalieri, F.; Lemmo, M.T. A Life Cycle Framework for the Identification of Optimal Building Renovation Strategies Considering Economic and Environmental Impacts. Sustainability 2020, 12, 10221. [Google Scholar] [CrossRef]
  5. Kazemeini, A.; Swei, O. Identifying environmentally sustainable pavement management strategies via deep reinforcement learning. J. Clean. Prod. 2023, 390, 136124. [Google Scholar] [CrossRef]
  6. Celauro, C.; Cardella, A.; Guerrieri, M. LCA of Different Construction Choices for a Double-Track Railway Line for Sustainability Evaluations. Sustainability 2023, 15, 5066. [Google Scholar] [CrossRef]
  7. Wang, Y.; Ni, Z.; Hu, M.; Li, J.; Wang, Y.; Lu, Z.; Chen, S.; Xia, B. Environmental performances and energy efficiencies of various urban green infrastructures: A life-cycle assessment. J. Clean. Prod. 2020, 248, 119244. [Google Scholar] [CrossRef]
  8. Balogun, T.B.; Tomor, A.; Lamond, J.; Gouda, H.; Booth, C.A. Life-cycle assessment environmental sustainability in bridge design and maintenance. Proc. ICE Eng. Sustain. 2020, 173, 365–375. [Google Scholar] [CrossRef]
  9. Pons, J.J.; Penadés-Plà, V.; Yepes, V.; Martí, J.V. Life cycle assessment of earth-retaining walls: An environmental comparison. J. Clean. Prod. 2018, 192, 411–420. [Google Scholar] [CrossRef]
  10. Navarro, I.J.; Penadés-Plà, V.; Martínez-Muñoz, D.; Rempling, R.; Yepes, V. Life cycle sustainability assessment for multi-criteria decision making in bridge design: A review. J. Civ. Eng. Manag. 2020, 26, 690–704. [Google Scholar] [CrossRef]
  11. Penadés-Plà, V.; García-Segura, T.; Yepes, V. Accelerated optimization method for low-embodied energy concrete box-girder bridge design. Eng. Struct. 2019, 179, 556–565. [Google Scholar] [CrossRef]
  12. Navarro, I.J.; Yepes, V.; Martí, J.V. A Review of Multicriteria Assessment Techniques Applied to Sustainable Infrastructure Design. Adv. Civ. Eng. 2019, 2019, 6134803. [Google Scholar] [CrossRef]
  13. Niu, Y.; Fink, G. Life Cycle Assessment on modern timber bridges. Wood Mater. Sci. Eng. 2019, 14, 212–225. [Google Scholar] [CrossRef]
  14. Navarro, I.J.; Martí, J.V.; Yepes, V. Reliability-based maintenance optimization of corrosion preventive designs under a life cycle perspective. Environ. Impact Assess. Rev. 2019, 74, 23–34. [Google Scholar] [CrossRef]
  15. Longarini, N.; Crespi, P.; Zucca, M.; Giordano, N.; Silvestro, G. The advantages of fly ash use in concrete structures. Inz. Miner. 2014, 15, 141–145. [Google Scholar]
  16. Orozco, C.; Babel, S.; Tangtermsirikul, S.; Sugiyama, T. Understanding the environmental, economic, and social impact of fly ash utilization on early-age high-strength mass concrete using life cycle analysis. Mater. Today Proc. 2023, in press. [Google Scholar] [CrossRef]
  17. Cheng, B.; Lu, K.; Li, J.; Chen, H.; Luo, X.; Shafique, M. Comprehensive assessment of embodied environmental impacts of buildings using normalized environmental impact factors. J. Clean. Prod. 2021, 334, 130083. [Google Scholar] [CrossRef]
  18. Khorgade, P.; Rettinger, M.; Burghartz, A.; Schlaich, M. A Comparative Cradle-to-Gate Life Cycle Assessment of Carbon Fiber-Reinforced Polymer and Steel-Reinforced Bridges. Struct. Concr. 2022, 24, 1737–1750. [Google Scholar] [CrossRef]
  19. Navarro, I.J.; Yepes, V.; Martí, J.V.; González-Vidosa, F. Life cycle impact assessment of corrosion preventive designs applied to prestressed concrete bridge decks. J. Clean. Prod. 2018, 196, 698–713. [Google Scholar] [CrossRef]
  20. Navarro, I.J.; Yepes, V.; Martí, J.V. Social life cycle assessment of concrete bridge decks exposed to aggressive environments. Environ. Impact Assess. Rev. 2018, 72, 50–63. [Google Scholar] [CrossRef]
  21. Peng, J.X.; Yang, Y.M.; Bian, H.B.; Zhang, J.R.; Wang, L. Optimisation of maintenance strategy of deteriorating bridges considering sustainability criteria. Struct. Infrastruct. Eng. 2022, 18, 395–411. [Google Scholar] [CrossRef]
  22. Rathod, H.; Gupta, R. Sub-surface simulated damage detection using Non-Destructive Testing Techniques in reinforced-concrete slabs. Constr. Build. Mater. 2019, 215, 754–764. [Google Scholar] [CrossRef]
  23. Yang, Y.; Zhang, Y.; Tan, X. Review on Vibration-Based Structural Health Monitoring Techniques and Technical Codes. Symmetry 2021, 13, 1998. [Google Scholar] [CrossRef]
  24. Baybordi, S.; Esfandiari, A. Model updating and damage detection of jacket type platform using explicit and exact time domain sensitivity equation. Ocean Eng. 2023, 269, 113551. [Google Scholar] [CrossRef]
  25. Yao, J.; Zeng, B.; Zhou, Z.; Zhang, Q. Damage identification analysis of Cable-stayed arch-truss based on multi-node time-domain data fusion. Lat. Am. J. Solids Struct. 2023, 20. [Google Scholar] [CrossRef]
  26. Li, Z.; Lan, Y.; Lin, W. Investigation of Frequency-Domain Dimension Reduction for A2M-Based Bridge Damage Detection Using Accelerations of Moving Vehicles. Materials 2023, 16, 1872. [Google Scholar] [CrossRef]
  27. Chen, M.J.; Sivakumar, K.; Banyay, G.A.; Golchert, B.M.; Walsh, T.F.; Zavlanos, M.M.; Aquino, W. Bayesian Optimal Sensor Placement for Damage Detection in Frequency-Domain Dynamics. J. Eng. Mech. 2022, 148, 04022078. [Google Scholar] [CrossRef]
  28. Liu, N.; Schumacher, T.; Li, Y.; Xu, L.; Wang, B. Damage Detection in Reinforced Concrete Member Using Local Time-Frequency Transform Applied to Vibration Measurements. Buildings 2023, 13, 148. [Google Scholar] [CrossRef]
  29. Yang, Y.B.; Li, Z.; Wang, Z.L.; Liu, Z.; Mo, X.Q.; Qiu, F.Q. Closely spaced modes of bridges estimated by a hybrid time–frequency method using a multi-sensor scanning vehicle: Theory and practice. Mech. Syst. Signal Process. 2023, 192, 110236. [Google Scholar] [CrossRef]
  30. Khan, M.W.; Akmal Din, N.; Ul Haq, R. Damage detection in a fixed-fixed beam using natural frequency changes. J. Vibroengineering 2020, 30, 38–43. [Google Scholar] [CrossRef]
  31. Wang, Y. Adaptive Finite Element Algorithm for Damage Detection of Non-Uniform Euler-Bernoulli Beams with Multiple Cracks Based on Natural Frequencies. In Adaptive Analysis of Damage and Fracture in Rock with Multiphysical Fields Coupling; Springer: Singapore, 2021; pp. 73–103. [Google Scholar] [CrossRef]
  32. Ciambella, J.; Pau, A.; Vestroni, F. Modal curvature-based damage localization in weakly damaged continuous beams. Mech Syst Signal Process. 2019, 121, 171–182. [Google Scholar] [CrossRef]
  33. Ganguli, R. Modal Curvature Based Damage Detection. In Structural Health Monitoring; Springer: Singapore, 2020; pp. 37–78. [Google Scholar] [CrossRef]
  34. Alavinezhad, M.; Hassanabad, M.G.; Ketabdari, M.J.; Nekooei, M. Numerical and experimental structural damage detection in an offshore flare bridge using a proposed modal strain energy method. Ocean Eng. 2022, 252, 111055. [Google Scholar] [CrossRef]
  35. Le, T.C.; Ho, D.D. Structural damage identification of plates using two-stage approach combining modal strain energy method and genetic algorithm. In Modern Mechanics and Applications: Select, Proceedings of the International Conference on Modern Mechanics and Applications, Ho Minh City, Vietnam, 2–4 December 2020; Springer: Singapore, 2022; pp. 1004–1017. [Google Scholar] [CrossRef]
  36. Zhang, Q.; Hou, J.; An, X.; Jankowski, Ł.; Duan, Z.; Hu, X. Vehicle parameter identification based on vehicle frequency response function. J. Sound Vib. 2023, 542, 117375. [Google Scholar] [CrossRef]
  37. Kurent, B.; Brank, B.; Ao, W.K. Model updating of seven-storey cross-laminated timber building designed on frequency-response-functions-based modal testing. Struct. Infrastruct. Eng. 2023, 19, 178–196. [Google Scholar] [CrossRef]
  38. Fang, Y.; Liu, X.; Xing, J.; Li, Z.; Zhang, Y. Substructure damage identification based on sensitivity of Power Spectral Density. J. Sound Vib. 2023, 545, 117451. [Google Scholar] [CrossRef]
  39. Hadizadeh-Bazaz, M.; Navarro, I.J.; Yepes, V. Performance comparison of structural damage detection methods based on Frequency Response Function and Power Spectral Density. Dyna 2022, 97, 493–500. [Google Scholar] [CrossRef]
  40. Nilsson, A.; Liu, B. Frequency domain. In Vibro-Acoustics; Springer: Berlin/Heidelberg, Germany, 2015; Volume 1, pp. 31–66. [Google Scholar] [CrossRef]
  41. Hadizadeh-Bazaz, M.; Navarro, I.J.; Yepes, V. Power Spectral Density method performance in detecting damages by chloride attack on coastal RC bridge. Struct. Eng. Mech. 2023, 85, 197–206. [Google Scholar] [CrossRef]
  42. Bayat1a, M.; Ahmadi, H.R.; Mahdavi, N. Application of power spectral density function for damage diagnosis of bridge piers. Struct. Eng. Mech. 2019, 71, 57–63. [Google Scholar] [CrossRef]
  43. Gunawan, F.E. Reliability of the power spectral density method in predicting structural integrity. Int. J. Innov. Comput. Inf. Control 2019, 15, 1717–1727. [Google Scholar] [CrossRef]
  44. Hadizadeh-Bazaz, M.; Navarro, I.J.; Yepes, V. Life-Cycle Cost Assessment Using the Power Spectral Density Function in a Coastal Concrete Bridge. J. Mar. Sci. Eng. 2023, 11, 433. [Google Scholar] [CrossRef]
  45. ISO 14040:2006; Environmental Management—Life Cycle Assessment—Principles and Framework. International Standards Organization: Geneva, Switzerland, 2006.
  46. ISO 14044:2006; Environmental Management—Life Cycle Assessment—Requirements and Guidelines. International Standards Organization: Geneva, Switzerland, 2006.
  47. Soust-Verdaguer, B.; Galeana, I.B.; Llatas, C.; Montes, M.; Hoxha, E.; Passer, A. How to conduct consistent environmental, economic, and social assessment during the building design process. A BIM-based Life Cycle Sustainability Assessment method. J. Build. Eng. 2021, 45, 103516. [Google Scholar] [CrossRef]
  48. Zheng, Z.D.; Lu, Z.R.; Chen, W.H.; Liu, J.K. Structural damage identification based on power spectral density sensitivity analysis of dynamic responses. Comput. Struct. 2015, 146, 176–184. [Google Scholar] [CrossRef]
  49. Pedram, M.; Esfandiari, A.; Khedmati, M.R. Damage detection by a FE model updating method using power spectral density: Numerical and experimental investigation. J. Sound Vib. 2017, 397, 51–76. [Google Scholar] [CrossRef]
  50. Tuutti, K. Corrosion of Steel in Concrete; Report. Cement-och Betonginst 1982, 4, 468. [Google Scholar]
  51. Zhang, D.; Zeng, Y.; Fang, M.; Jin, W. Service life prediction of precast concrete structures exposed to chloride environment. Adv. Civ. Eng. 2019, 2019, 3216328. [Google Scholar] [CrossRef]
  52. Spanish Ministry of Public Works. EHE-08 Instrucción del Hormigón Estructural; Spanish Ministry of Public Works: Madrid, Spain, 2008; ISBN 978-84-498-0899-9. [Google Scholar]
  53. FIB. Model Code for Service Life Design; Federation Internationale du Beton, fib. Bulletin: Lausanne, Switzerland, 2006; No. 34. [Google Scholar]
  54. Esfandiari, A.; Bakhtiari-Nejad, F.; Rahai, A.; Sanayei, M. Structural model updating using frequency response function and quasi-linear sensitivity equation. J. Sound Vib. 2009, 326, 557–573. [Google Scholar] [CrossRef]
  55. Penadés-Plà, V.; Martínez-Muñoz, D.; García-Segura, T.; Navarro, I.J.; Yepes, V. Environmental and Social Impact Assessment of Optimized Post-Tensioned Concrete Road Bridges. Sustainability 2020, 12, 4265. [Google Scholar] [CrossRef]
  56. Barahmand, Z.; Eikeland, M.S. Life Cycle Assessment under Uncertainty: A Scoping Review. World 2022, 3, 692–717. [Google Scholar] [CrossRef]
  57. Goedkoop, M.; Heijungs, R.; Huijbregts, M.; De Schryver, A.; Struijs, J.; Van Zelm, R. ReCiPe 2008 a Life Cycle Impact Assessment Method Which Comprises Harmonised Category Indicators at the Midpoint and the Endpoint Level; Ministerie van VROM: Hague, The Netherlands, 2009.
  58. Huijbregts, M.A.J.; Steinmann, Z.J.N.; Elshout, P.M.F.; Stam, G.; Verones, F.; Vieira, M.D.M.; Hollander, A.; Zijp, M.; Zelm, R. ReCiPe 2016 a Harmonized Life Cycle Impact Assessment Method at Midpoint and Endpoint Level Report I: Characterization; Rijksinstituut voor Volksgezondheid en Milieu RIVM: De Bilt, The Netherlands, 2016.
  59. Association, E. Ecoinvent Datebase. Ecoinvent 3.3. 2016. Available online: https://ecoinvent.org/the-ecoinvent-database (accessed on 20 May 2023).
  60. León, J.; Prieto, F.; Rodríguez, F. Proyecto de rehabilitación del puente de la Isla de Arosa. Hormig. Acero 2013, 270, 75–89. [Google Scholar]
  61. Pérez-Fadón Martínez, S. Puente a la Isla de Arosa. Hormig. Acero 1985, 36, 157. [Google Scholar]
  62. Pérez-Fadón Martínez, S. Puente sobre la Ría de Arosa. Rev. Obras Publicas 1986, 3243, 1–16. [Google Scholar]
Figure 1. Health monitoring and damage detection processes in a bridge structure.
Jmse 11 01656 g001
Figure 2. The general diagram stages of the damage detection method for the life cycle assessment that this research proposes.
Jmse 11 01656 g002
Figure 3. Reinforcement concrete structure’s rebar service life according to Tuutti’s model (1982) [50].
Jmse 11 01656 g003
Figure 4. The approaches to environmental life cycle assessment [55].
Jmse 11 01656 g004
Figure 5. The indicators of E-LCIA through the ReCiPe method.
Jmse 11 01656 g005
Figure 6. Methodologies, activities, and material used in this research.
Jmse 11 01656 g006
Figure 7. The total view of the piers and deck of Spain’s reinforced concrete coastal Arosa bridge.
Jmse 11 01656 g007
Figure 8. Cross-section and dimensions of the Arosa coastal and concrete bridge.
Jmse 11 01656 g008
Figure 9. Counting and dividing points as sensors in an Arosa bridge span.
Jmse 11 01656 g009
Figure 10. An overview of the study and computation procedures used for E-LCA for the bridge.
Jmse 11 01656 g010
Figure 11. The service lifetime for the repair of each element section ID of the concrete bridge.
Jmse 11 01656 g011
Figure 12. The percentage of the predicted damages for service life and repair period activities.
Jmse 11 01656 g012
Figure 13. The total quantification of environmental categories’ impacts on the Arosa Bridge.
Jmse 11 01656 g013
Table 1. Durability parameters in a coastal reinforced concrete bridge [42].
Marine Exposure ClassificationCs
(% of Concrete Weight)
Vcorr
(μm/Year)
D0
(×10−12 m2/s)
Aerial (IIIa)0.142010.0
Submerged (IIIb)0.724
In tide zone (IIIc)0.5050
Table 2. Environmental impact assessment results from two methods on the coastal bridge.
Impact CategoryEnvironmental Impact (Points)
DeskColumns
ConventionalPSDConventionalPSD
Ecosystem quality
Agricultural land occupation1872.4268.32313.8685.4
Climate change, ecosystems46,192.76620.757,082.616,909.2
Freshwater ecotoxicity5.90.87.32.1
Freshwater eutrophication23.43.329.08.5
Marine ecotoxicity129.218.5159.647.2
Natural land transformation22,668.73249.028,012.88298.0
Terrestrial acidification151.421.7187.155.4
Terrestrial ecotoxicity512.973.5633.8187.7
Urban land occupation444.163.6548.8162.5
Human health
Climate change, human health58,117.08329.871,818.121,274.2
Human toxicity72,315.310,364.889,363.626,471.6
Ionizing radiation60.78.775.022.2
Ozone depletion3.70.54.61.3
Particulate matter formation7975.71143.19855.92919.5
Photochemical oxidant formation206.729.6255.575.6
Resources
Fossil depletion49,089.47035.960,662.317,969.6
Metal depletion8142.31167.010,061.92980.5
Table 3. Benefits of utilizing PSD in the environmental impacts category of a bridge span.
Impact CategoryDifferenceImpact CategoryDifference
Ecosystem Quality Human Health
Agricultural land occupation3232.5Climate change, human health100,331
Climate change, ecosystems79,745.4Human toxicity124,842.5
Freshwater ecotoxicity10.3Ionizing radiation104.7
Freshwater eutrophication40.5Ozone depletion6.54
Marine ecotoxicity223Particulate matter formation13,768.9
Natural land transformation39,134.4Photochemical oxidant formation356.9
Terrestrial acidification261.4Resources
Terrestrial ecotoxicity885.5Fossil depletion84,746.2
Urban land occupation766.71Metal depletion14,056.6
Disclaimer/Publisher’s Note: The statements, opinions and data contained in all publications are solely those of the individual author(s) and contributor(s) and not of MDPI and/or the editor(s). MDPI and/or the editor(s) disclaim responsibility for any injury to people or property resulting from any ideas, methods, instructions or products referred to in the content.

