Article

Relationship between Submerged Marine Debris and Macrobenthic Fauna in Jeju Island, South Korea

1
Ocean Climate Response & Ecosystem Research Department, Korea Institute of Ocean Science & Technology (KIOST), 385, Haeyang-ro, Yeongdo-gu, Busan 49111, Republic of Korea
2
Maritime Robotics Test and Evaluation Center, Korea Institute of Ocean Science & Technology (KIOST), 30, Haean-ro 1106 beon-gil, Heunghae-eup, Buk-gu, Pohang-si 37553, Republic of Korea
*
Author to whom correspondence should be addressed.
J. Mar. Sci. Eng. 2023, 11(7), 1427; https://doi.org/10.3390/jmse11071427
Submission received: 15 June 2023 / Revised: 6 July 2023 / Accepted: 14 July 2023 / Published: 17 July 2023
(This article belongs to the Section Marine Ecology)

Abstract

:
Pollution associated with marine debris is of global ecological concern, as it threatens wildlife and local economies. Submerged marine debris alters local benthic species composition and community characteristics. The study site of Jaguri, Jeju Island, where a variety of submerged marine debris was found, was used to investigate the impact of submerged marine debris on the macrobenthic fauna of sandy and rocky substrates. The dominant macrobenthos taxon differed by sediment type; the polychaete Armandia lanceolata was dominant in sandy bottom environments and the mollusk Leiosolenus lischkei was dominant in rocky bottom environments. The presence of marine debris was associated with differences in biomass in both the soft and rocky areas. The site without debris had higher biomass in the soft area, and the site with nets had a higher density of benthic animals within the site with debris. In the rocky area. the site with debris had a higher biomass. Macrobenthos were affected by the type of deposited marine debris and the type of sediment substrate. This study provides a basis for future studies on the impact of debris on marine ecosystems and identified the benthos species affected by marine debris.

1. Introduction

Marine debris is solid waste from human activities that enters the sea from the land or sea [1,2]. Plastic constitutes more than 80% of the anthropogenic debris that accumulates on coastlines, sea surfaces, and seabeds [3,4,5]. Approximately 50% of plastic marine debris sinks to the seafloor and can be transported over long distances [6]. Coastal and continental inland flows are the primary means by which plastic materials reach marine surface waters [7,8,9]. Terrestrial sources significantly contribute to global marine pollution [10]. The negative impacts of marine debris are global in nature, affecting humans, wildlife, and habitats. Accumulation is particularly concentrated in estuaries, coastlines, and seabeds [11,12]. Marine debris has diverse impacts on environments and economies [13]. Such debris can be marine- or land-based in terms of its origin [1]. Its abundance and distribution are influenced by ocean currents, wind patterns, and geomorphic features [14].
Plastic pollution is a global problem that is threatening marine biodiversity [3,15,16]. The United Nations has set a goal of preventing and significantly reducing marine pollution by 2025 (UN General Assembly, 2015). The South Korean government has established a legal framework for marine debris management and has implemented a variety of policies to reduce marine debris, including prevention, collection, and public awareness [17]. In particular, the government is working to achieve a 33% reduction in marine debris (SMD) by 2023 through expanded collection efforts [18]. However, despite efforts to remove debris from the marine environment, quantities of plastic are increasing in some locations [19,20,21]. This is likely due to the movement of debris into areas where monitoring is minimal, such as deep sea sediments and offshore areas, and also the fragmentation of plastic debris into pieces smaller than those routinely sampled [22,23].
Abandoned fishing gear, often associated with intensive fishing, is a common type of aquatic debris [3,12]. Many reports have documented the negative impacts of fishing litter on marine ecosystems [2,14,24,25,26,27,28,29]. Fishing nets and other lost items of fishing gear are non-degradable and can continue to fish (ghost fish) after being lost, harming marine organisms and disrupting spawning areas [30,31,32]. The distribution of derelict fishing traps and other seabed litter has been studied in the eastern South Sea, the East China Sea, and the West Sea of Korea [33]. Floating debris can spread invasive species, and plastic items can be consumed by marine organisms [8]. Lost nets and traps damage benthic habitats and capture fish and invertebrates [25]. Plastics transported to the sea via waterways may degrade into microplastics [34,35].
Submerged marine debris (SMD) has been detected in deep sea regions and accumulates at high densities on the seafloor [23]. Such debris can accumulate at various depths, including the deep sea, where degradation is slower [3,10,16,36]. It impacts macrobenthos, including blue crabs, and may form artificial ecosystems. SMD has a negative impact on the marine environment, including the destruction of habitats, the deterioration of marine products, and threats to maritime safety [37,38]. SMD poses a threat to the benthos, but more research is needed to understand its full impact [27]. Submerged marine debris content is influenced by topographic and anthropological factors; such material is typically trapped in bays and lagoons, which are regions of low hydrodynamic activity [39,40,41].
Submerged marine debris (SMD) is difficult to collect because it is located at the bottom of the sea and requires special equipment and diving personnel [18]. SMD is a growing problem that is difficult to manage [38]. Floating marine debris is relatively easy and cheap to collect, but SMD requires divers and special equipment [20]. This makes SMD collection more expensive and time consuming [42]. In terms of submerged marine debris management, swimmers equipped with snorkels can monitor the sea surface, coastline, and shallow seabeds [2,43]. Bottom trawl surveys using echo and video devices can be used to assess the amounts and types of benthic debris in the deep sea [22,28,39,44,45,46,47,48]. Such debris is distributed across all seabed types, accumulating in geological features such as seamounts, canyons, and trenches; 86% of bottom trawls in the Arctic retrieve plastic debris [49,50].
Previous studies on submerged marine debris (SMD) in Korea have mainly focused on the distribution of debris in certain onshore or offshore regions [51,52], but most studies did not consider the influence of benthic organisms. A recent study assessed marine debris in all Korean waters, but focused on the ecological impact of aquatic fishing gear [31]. This study aimed to (1) identify the macrobenthic fauna according to substrate (rocky vs. sandy) in submerged marine debris areas, (2) determine their distribution characteristics by marine debris type, and (3) understand the impact of the presence or absence of marine debris on the benthic ecosystem.

2. Materials and Methods

2.1. Study Area

The Jaguri coast in the southern part of Jeju Island, South Korea, has an inland river with an average flow rate of 0.6765 m3/s, and during floods, it serves as a route for a large amount of water and waste to flow into the sea. The eastern part of the southern region of the area is protected from offshore waves by Seop Island, and the southern part is protected by Mun Island. However, the east–west currents are stronger than in the surrounding sea areas due to the topographic influence between the islands. In addition, there is a strong east–west current flowing between the islands in the south, and a clockwise current flows east of the Seogwipo breakwater, resulting in a topographical vortex [53]. The study area is used as a shelter for coastal fishing boats during storms. Sediments composed of volcanic ash and shells exist in the northwest–southeast direction [54,55].
The survey was conducted on 15 July 2021, using a multi-beam echo sounder to identify the topography and surface geological characteristics of the Jaguri coast in the southern part of Jeju Island, South Korea (Figure 1). Based on the acquired data, scuba divers collected macrobenthos from areas with and without marine debris in May 2022. The scope of the investigation was limited to the inner part of the bay where sediment debris is often reported, within a depth of 30 m that could be investigated by scuba divers. The investigation area was approximately 1 km long and 0.5 km wide. The area is a concave bay facing north, formed by the Seogwipo breakwater in the west, Jungbang Falls in the north, and the underwater rock area in the east (Figure 1).

2.2. Echo Sounding Technique

The survey was conducted using a multi-beam echo sounder (Reson Seabat 7125, 400 kHz) to collect acoustic data to identify the topography and surface geological characteristics of the study area. The survey data were used to create a backscatter imagery of the surface. A high acoustic backscatter strength indicates that the sediment is poorly sorted and the composition is hard, while a low backscatter strength indicates that the sediment is well sorted and the composition is soft. In this study, strong backscatter strengths are shown in black and weak backscatter strengths are shown in white. To confirm this, they were compared to surface samples collected by divers.

2.3. Macrobenthos Sampling Process

The survey was conducted in subtidal zones with both sandy and rocky bottom areas with and without marine debris. In sandy areas with nets, cloth, and bottles, or without marine debris, two replicates were taken three times using 12 × 21 cm can cores. In rocky areas, single samples were taken three times using a 15 × 15 cm scraper. Prior to sampling, scuba divers photographed submerged debris, and then removed it. Samples were filtered through a 1 mm sieve, fixed in 10% (v/v) formalin, and transported to the laboratory. Benthic organisms were identified to the species level using a stereomicroscope, counted, and their wet weights were documented. Sediment samples were subjected to total organic carbon (TOC) and particle size analyses using 20 mL conical tubes. Sediments were frozen at −20 °C before analysis, and particle size was determined using the method of Folk and Ward (1957) [56]. TOC analysis was performed using a TOC analyzer (SSM-5000A; Shimadzu, Kyoto, Japan).

2.4. Data Processing

The density (individuals/m2) and biomass (g/m2) of macrobenthos were calculated. The Shannon–Wiener diversity index (loge H’), the Pielou uniformity index (J’), and the Margalef index (d) were derived. Two-way analysis of variance (ANOVA) was used to test for the effects of bottom types and debris status on the number of species, density, and diversity index. The Kruskal–Wallis test was used to test for the effects of bottom types and debris status on macrobenthos biomass using SigmaPlot 12 program (Systat Software Inc., San Jose, CA, USA). All statistical tests were two-tailed, and p-values < 0.05 were considered to be significant.
The Bray–Curtis similarity measure based on fourth-root-transformed density data were calculated, and the data were subjected to cluster and nonmetric, multidimensional scaling analyses. The similarity profile (SIMPROF) permutation test and the analysis of similarities (ANOSIM) test were used to determine differences between macrobenthic groups. Permutational multivariate analysis of variance (PERMANOVA) was employed to test for differences in the community structure among the areas. All analyses were performed using PRIMER 6 and PERMANOVA+ software (Plymouth Marine Laboratory, Plymouth, UK) [57].

3. Results

3.1. Topography and Surface Geological Characteristic

The boundary between the sand deposit and the rocky area was clearly visible in the topographic survey, and the marine submerged debris was concentrated at the boundary of the deposit (Figure 1 and Figure 2). The surface samples collected from the black series area in the southernmost part of the survey area were composed of coarse volcanic ash. The depth gradually increases to the southeast, and the rocky area is exposed to the east and north.

3.2. Submerged Marine Debris Distribution

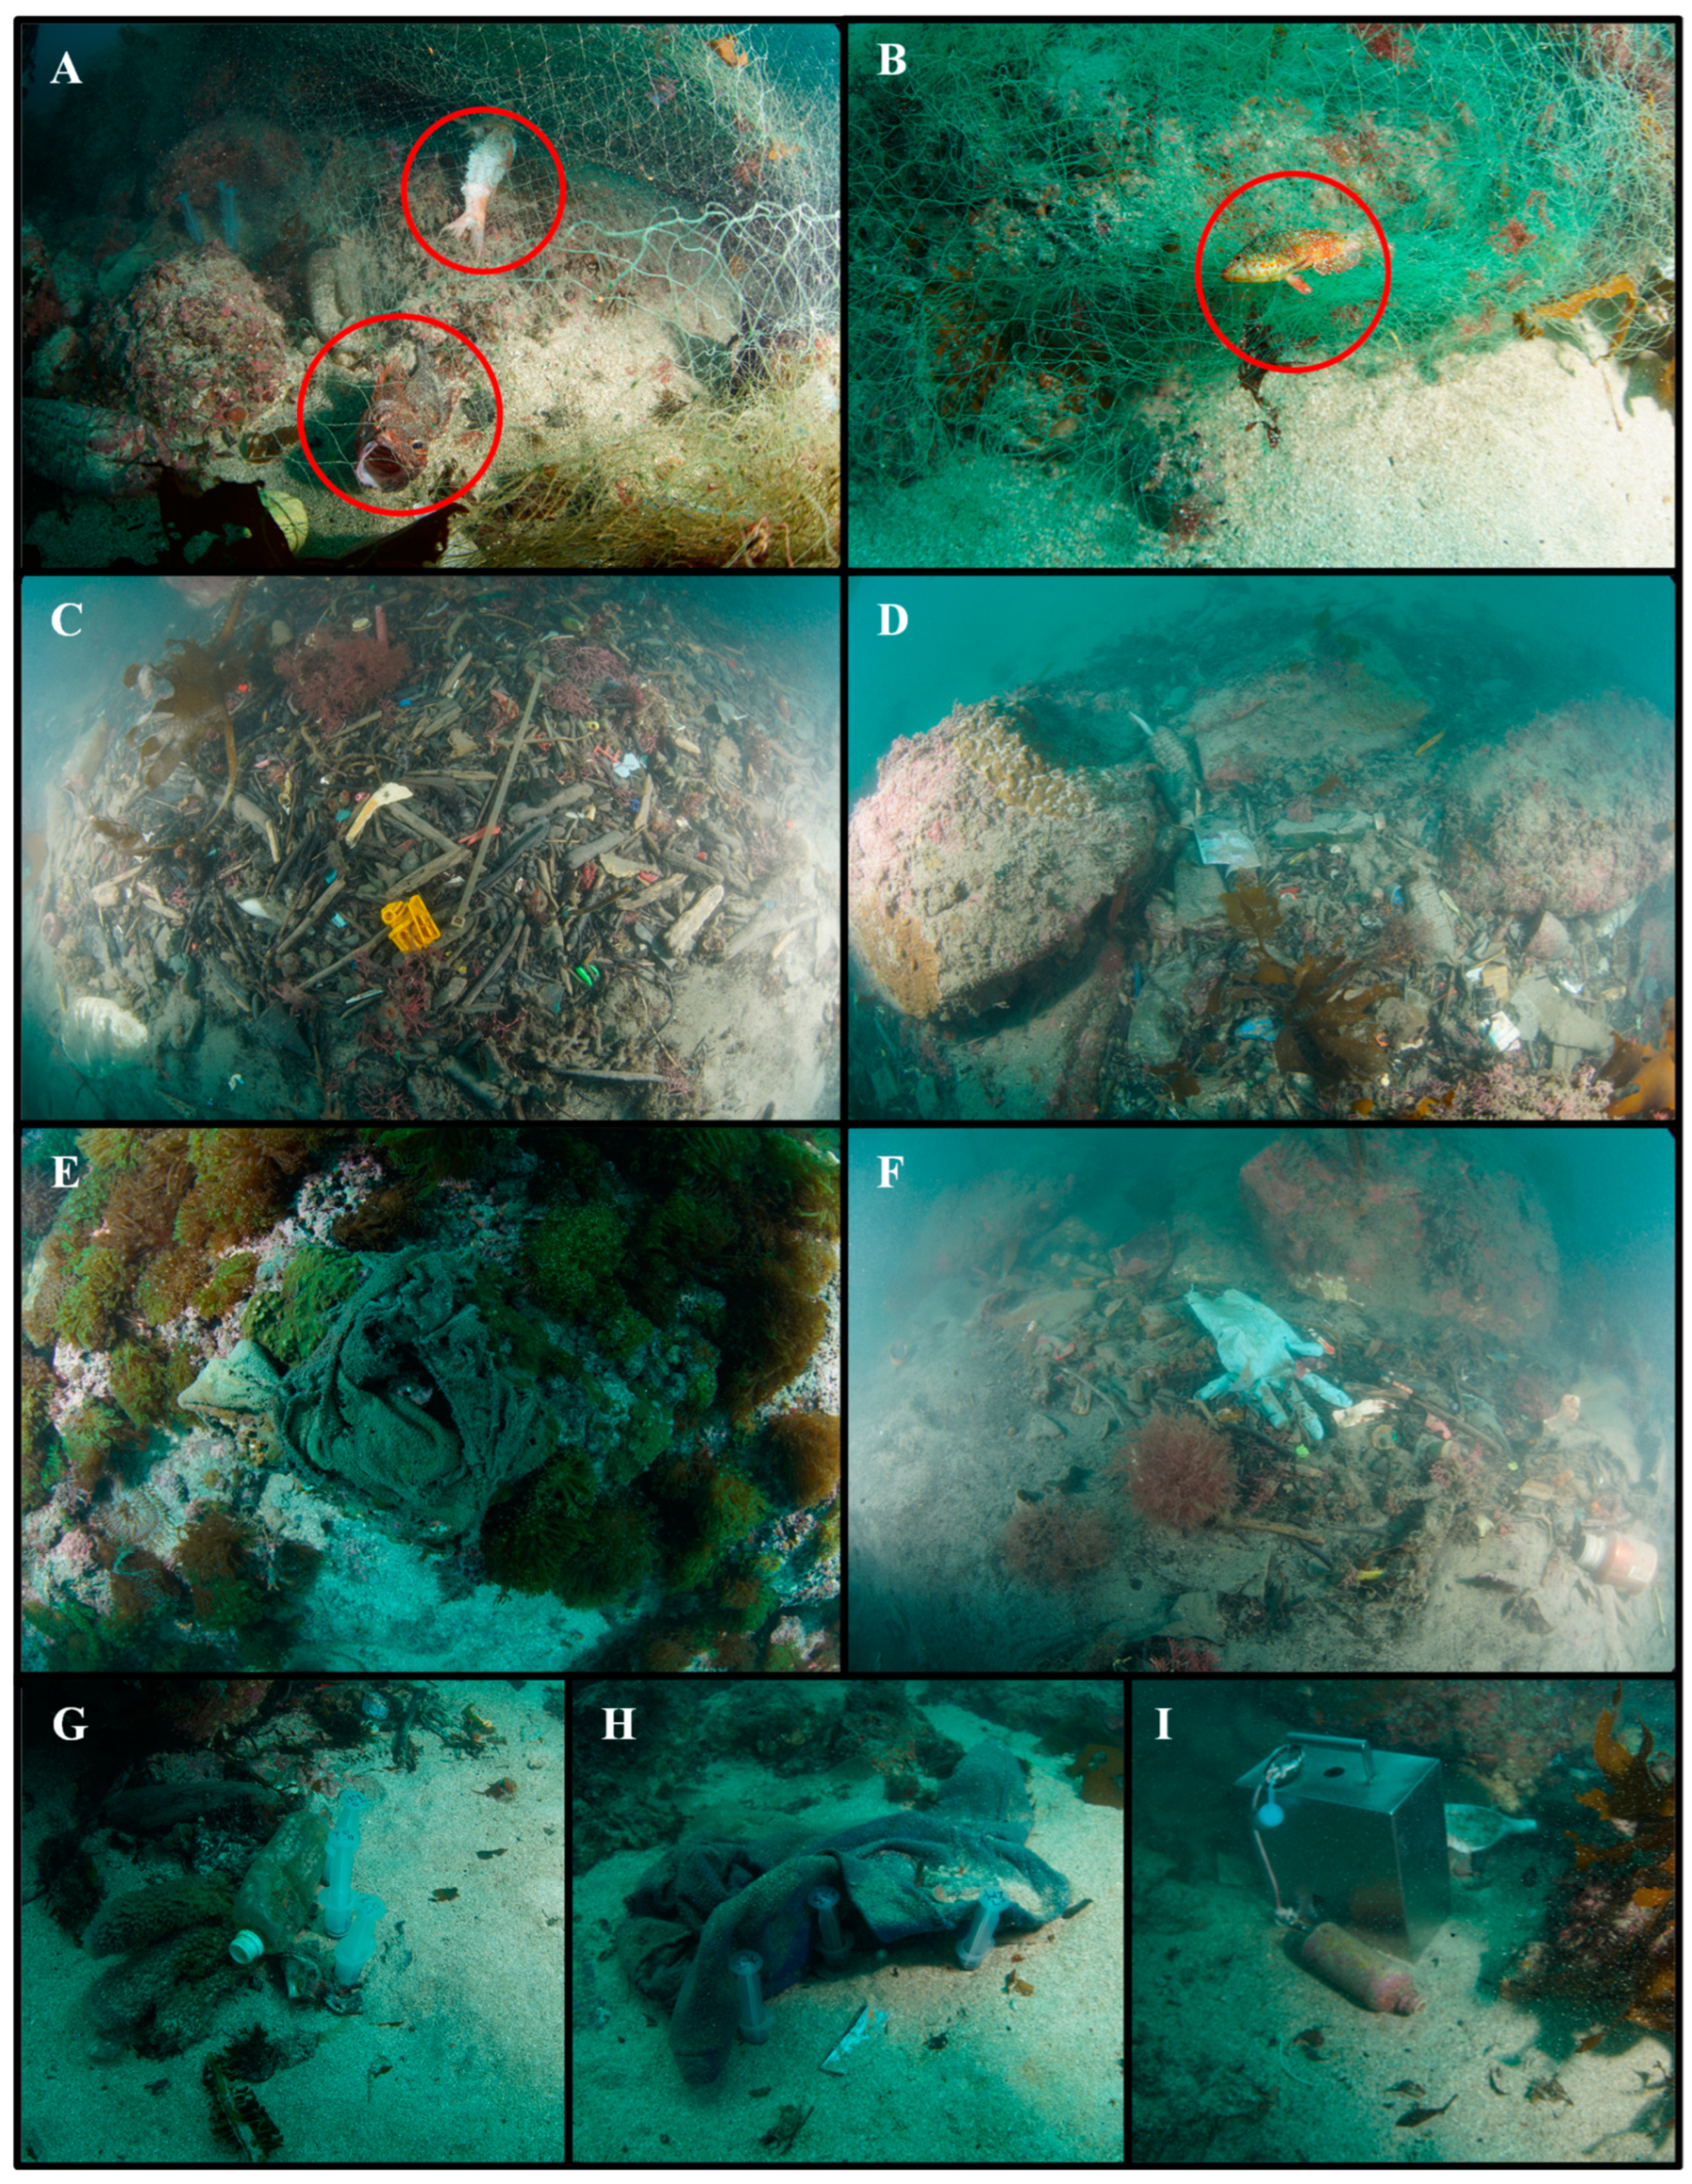
Marine submerged debris was concentrated at the sediment boundary (Figure 2). The survey area was littered with various types of debris, including fishing nets, wood, plastic fragments, plastic bags, clothing, rubber gloves, and plastic bottles. Fishing nets were particularly abundant, covering a wide area and resulting in ghost fishing (Figure 2). Plastic debris was the most common type of debris, and it negatively impacted the benthic organisms living on the seafloor. Household debris was scattered and some of the debris covered the original sedimentary layer (Figure 2). It was confirmed that seaweed and PET bottles were scattered between the boundary of sand sediment and the rocky area. In the terrain that was lower than the surrounding area, small, crushed, plastic cans and food packaging films were concentrated, and in the rocky area, debris in the form of cloth or rope existed (Figure 2).

3.3. Environmental Variability

The average water depth in the area with a sandy bottom was 12.4 m, with SP-1 (cloth) (sandy bottom, cloth debris) being the shallowest at 10.4 m and SP-3 (bottle) (sandy bottom, bottle debris) being the deepest at 14.5 m (Table 1). The average water depth of sites with debris was 12.6 m, while the average water depth of sites without debris was 11.5 m. The average water temperature was 18.1 °C, with little difference between sites (Table 1). The sites with cloth and without debris were slightly higher at 18.2 °C. The salinity was 34.0 psu on average, with the sites without debris having the lowest average of 33.6 psu, and the sites with nets and bottles having the highest average of 34.2 psu. The dissolved oxygen was 4.2 on average, with the site with cloth having the lowest average of 3.9 and the site with bottle having the highest average of 4.5. In the sandy bottom area, the water depth and salinity were higher in the presence of debris than in the absence of debris. In contrast, the water temperature and dissolved oxygen were higher without debris. In the sites with debris, the sites with bottles had higher water temperatures and dissolved oxygen.
The average depth of the rocky area was 12.5 m. The sites with nets had an average depth of 10.9 m, and those without nets had an average depth of 14.0 m. The average water temperature was 18.0 °C. The sites with debris had an average water temperature of 17.9 °C, and the sites without debris had an average water temperature of 18.1 °C. The average salinity was 34.1 psu. There was almost no difference in salinity between the sites. The average dissolved oxygen was 4.4. The sites with nets had an average dissolved oxygen of 4.2, and those without nets had an average dissolved oxygen of 4.5. In the rocky area, there was almost no difference in water temperature and salinity between sites, but the sites without debris had a greater depth and dissolved oxygen content.
In the soft subtidal zone, the sediment was mainly a sand deposit, and the mean grain size (Mz) was highest at 1.9 phi in SP-3(sandy bottom, with debris) regions (Table 2). Except for SP-2(sandy bottom, with debris) regions, the TOC was less than 1%.

3.4. Macrobenthos Groups

Among the benthic macrofauna groups, polychaetes had the highest average density of 168.1 individuals/m2, followed by mollusks and arthropods at 85 ind/m2 (Table 3). Polychaetes had the highest average density of 518.3 ind/m2 at HA (rocky bottom, no debris), and the lowest average density of 50 ind/m2 at SP-3(net) (sandy bottom, net debris). The average density of sites with debris was higher than those without debris, and rocky sites were higher than sandy sites (Table 3). The average density of arthropods was highest at HP-1(net) (rocky bottom, net debris) at 233.3 ind/m2 and did not appear at SP-3(net) (sandy bottom, net debris). Although HA (rocky bottom, no debris) is a rocky site, it had a significant difference of 20.8 ind/m2 from HP-1(net) (rocky bottom, net debris). Echinoderms had a higher average density at sandy sites than at rocky sites. SA (sandy bottom, no debris) had the highest density of 233.3 ind/m2 and did not occur at SP-2(cloth) (sandy bottom, cloth debris). The average density was higher at sites without debris than at sites with debris. Mollusks had a higher average density at rocky sites than at sandy sites; they had the highest density of 220 ind/m2 at HA (rocky bottom, no debris) and did not occur at SP-3(net) (sandy bottom, net debris). And mollusks were higher at the site without debris than at the site with debris. Overall, the average density was higher at sites without debris than at sites with debris, and rocky sites were richer than sandy sites (Table 3).
In terms of average biomass, polychaetes had the highest value of 126.2 g/m2, followed by echinoderms with 65.7 g/m2 (Table 3). Arthropods and mollusks were almost the same at 63.1 g/m2. Polychaetes had the highest average biomass of 379.1 g/m2 at HA (rocky bottom, no debris) and the lowest of 0.6 g/m2 at SP-2(cloth) (sandy bottom, cloth debris). Similar to density, the average biomass of sites with debris was higher than that of sites without debris, and rocky sites were higher than sandy sites. Arthropods had the highest biomass of 214.1 g/m2 at HP-1(net) (rocky bottom, net debris) and did not appear at SP-3(net) (sandy bottom, net debris). Echinoderms had a higher average biomass at sandy sites than rocky sites (Table 3). SA (sandy bottom, no debris) had the highest biomass of 233.3 g/m2 and did not occur at SP-2(cloth) (sandy bottom, cloth debris). In rocky bottom sites, the biomass was very small, and there was no difference with or without debris. In the sandy areas, sites without debris had a higher biomass than sites with debris. Mollusks had a higher average biomass at rocky sites than at sandy sites, with the highest biomass of 160 g/m2 at HA (rocky bottom, no debris). And this was higher at the site without debris than at the site with debris. Overall, the average biomass was closely related to the density, being higher at sites without debris than at sites with debris, and higher at higher rocky sites than at sandy sites (Table 3).

3.5. Dominant Species

The dominant macrobenthos species differed between the sandy and rocky bottom areas (Table 4). In the sandy zone, polychaetes were the most dominant species, with 6 out of the 10 species (above 2%), followed by mollusks (3 species). The polychaetes Armandia lanceolata and Dorvillea matsushimaensis were predominant, with average densities of 293 and 207 individuals/m2, accounting for 30% and 21% of the total density, respectively.
The following most common species was the mollusk Jactellina clathrate, with an average density of 50 ind/m2, followed by the mollusk Callista pilsbryi, with an average density of 38 ind/m2. The only arthropod was Bubocorophium exolitus, with an average density of 35 ind/m2.
Mollusks dominated rocky sites, and the percentage of polychaetes was reduced compared to the soft bottom area (Table 4). In the rocky zone, 5 out of 10 species were mollusks (above 2%), while only 4 species were polychaetes. Leiosolenus lischkei was the most abundant mollusk in the rocky zone, with an average density of 758 ind/m2. The mollusk Cerithium alutaceum was the second most abundant species, with an average density of 325 ind/m2. Cantellius arcuatus was the most abundant polychaete in the rocky zone, with an average 300 ind/m2 density.

3.6. Correlation between Submerged Marine Debris and Macrobenthos

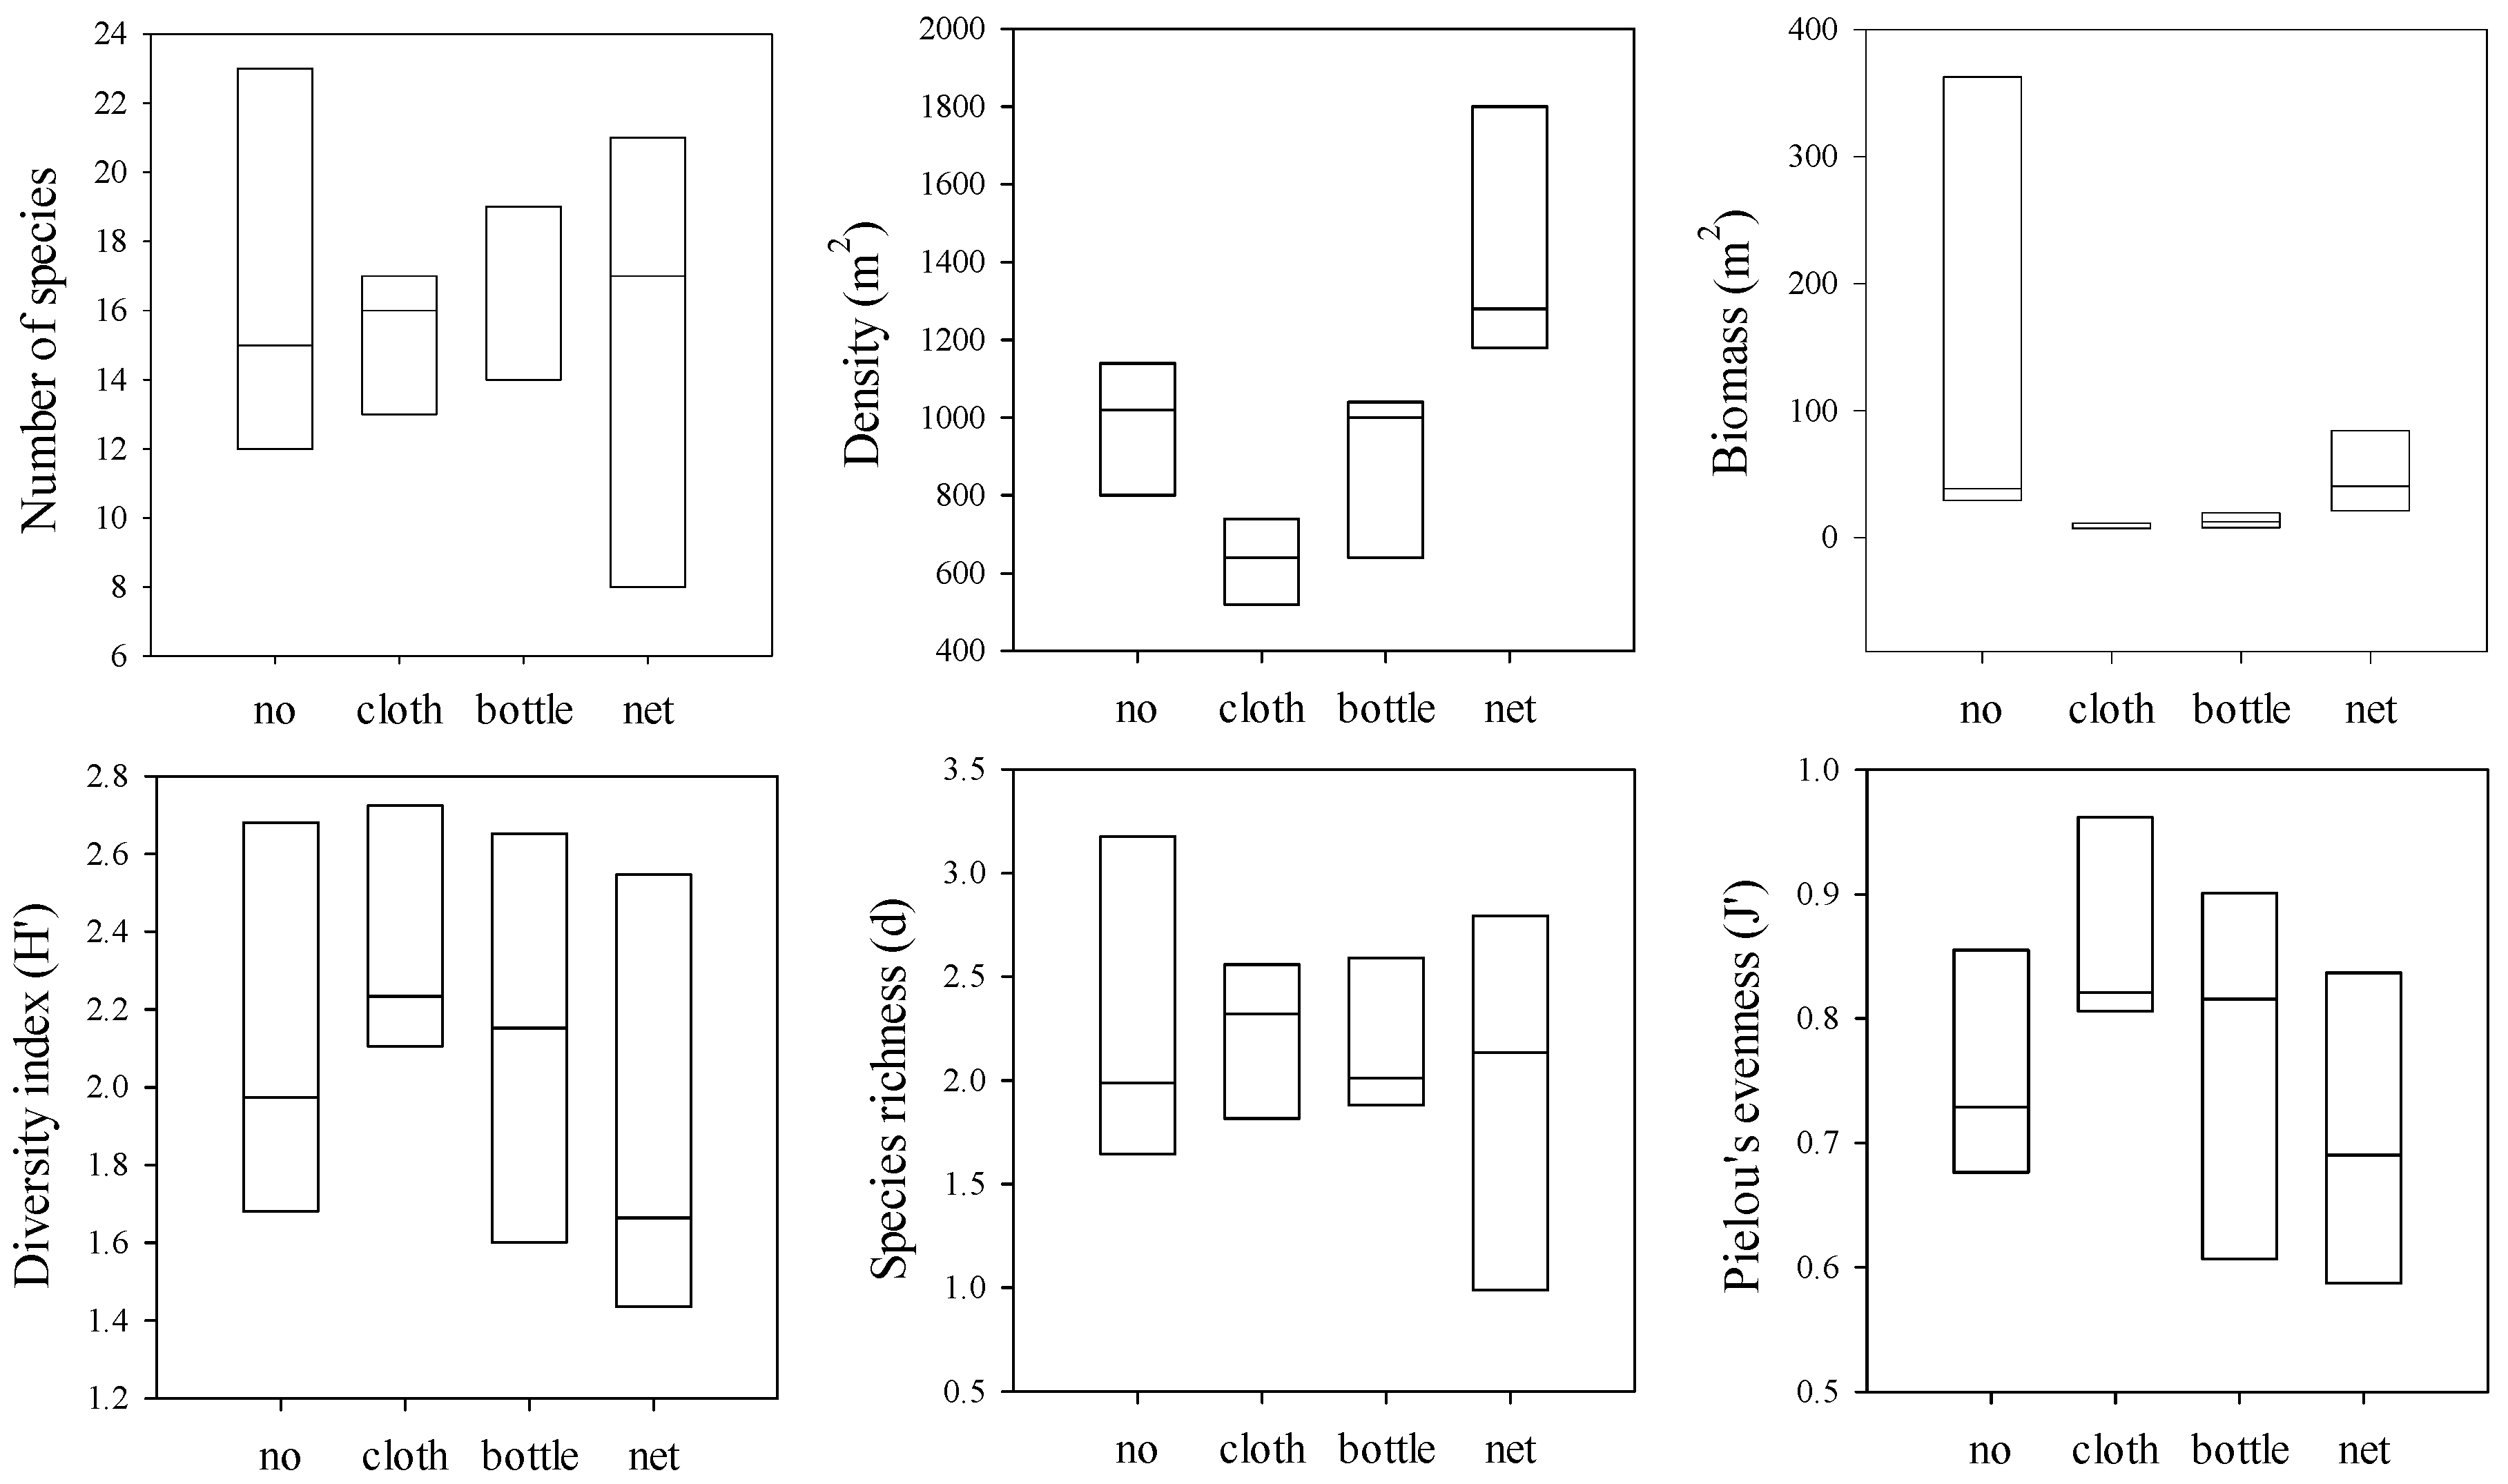
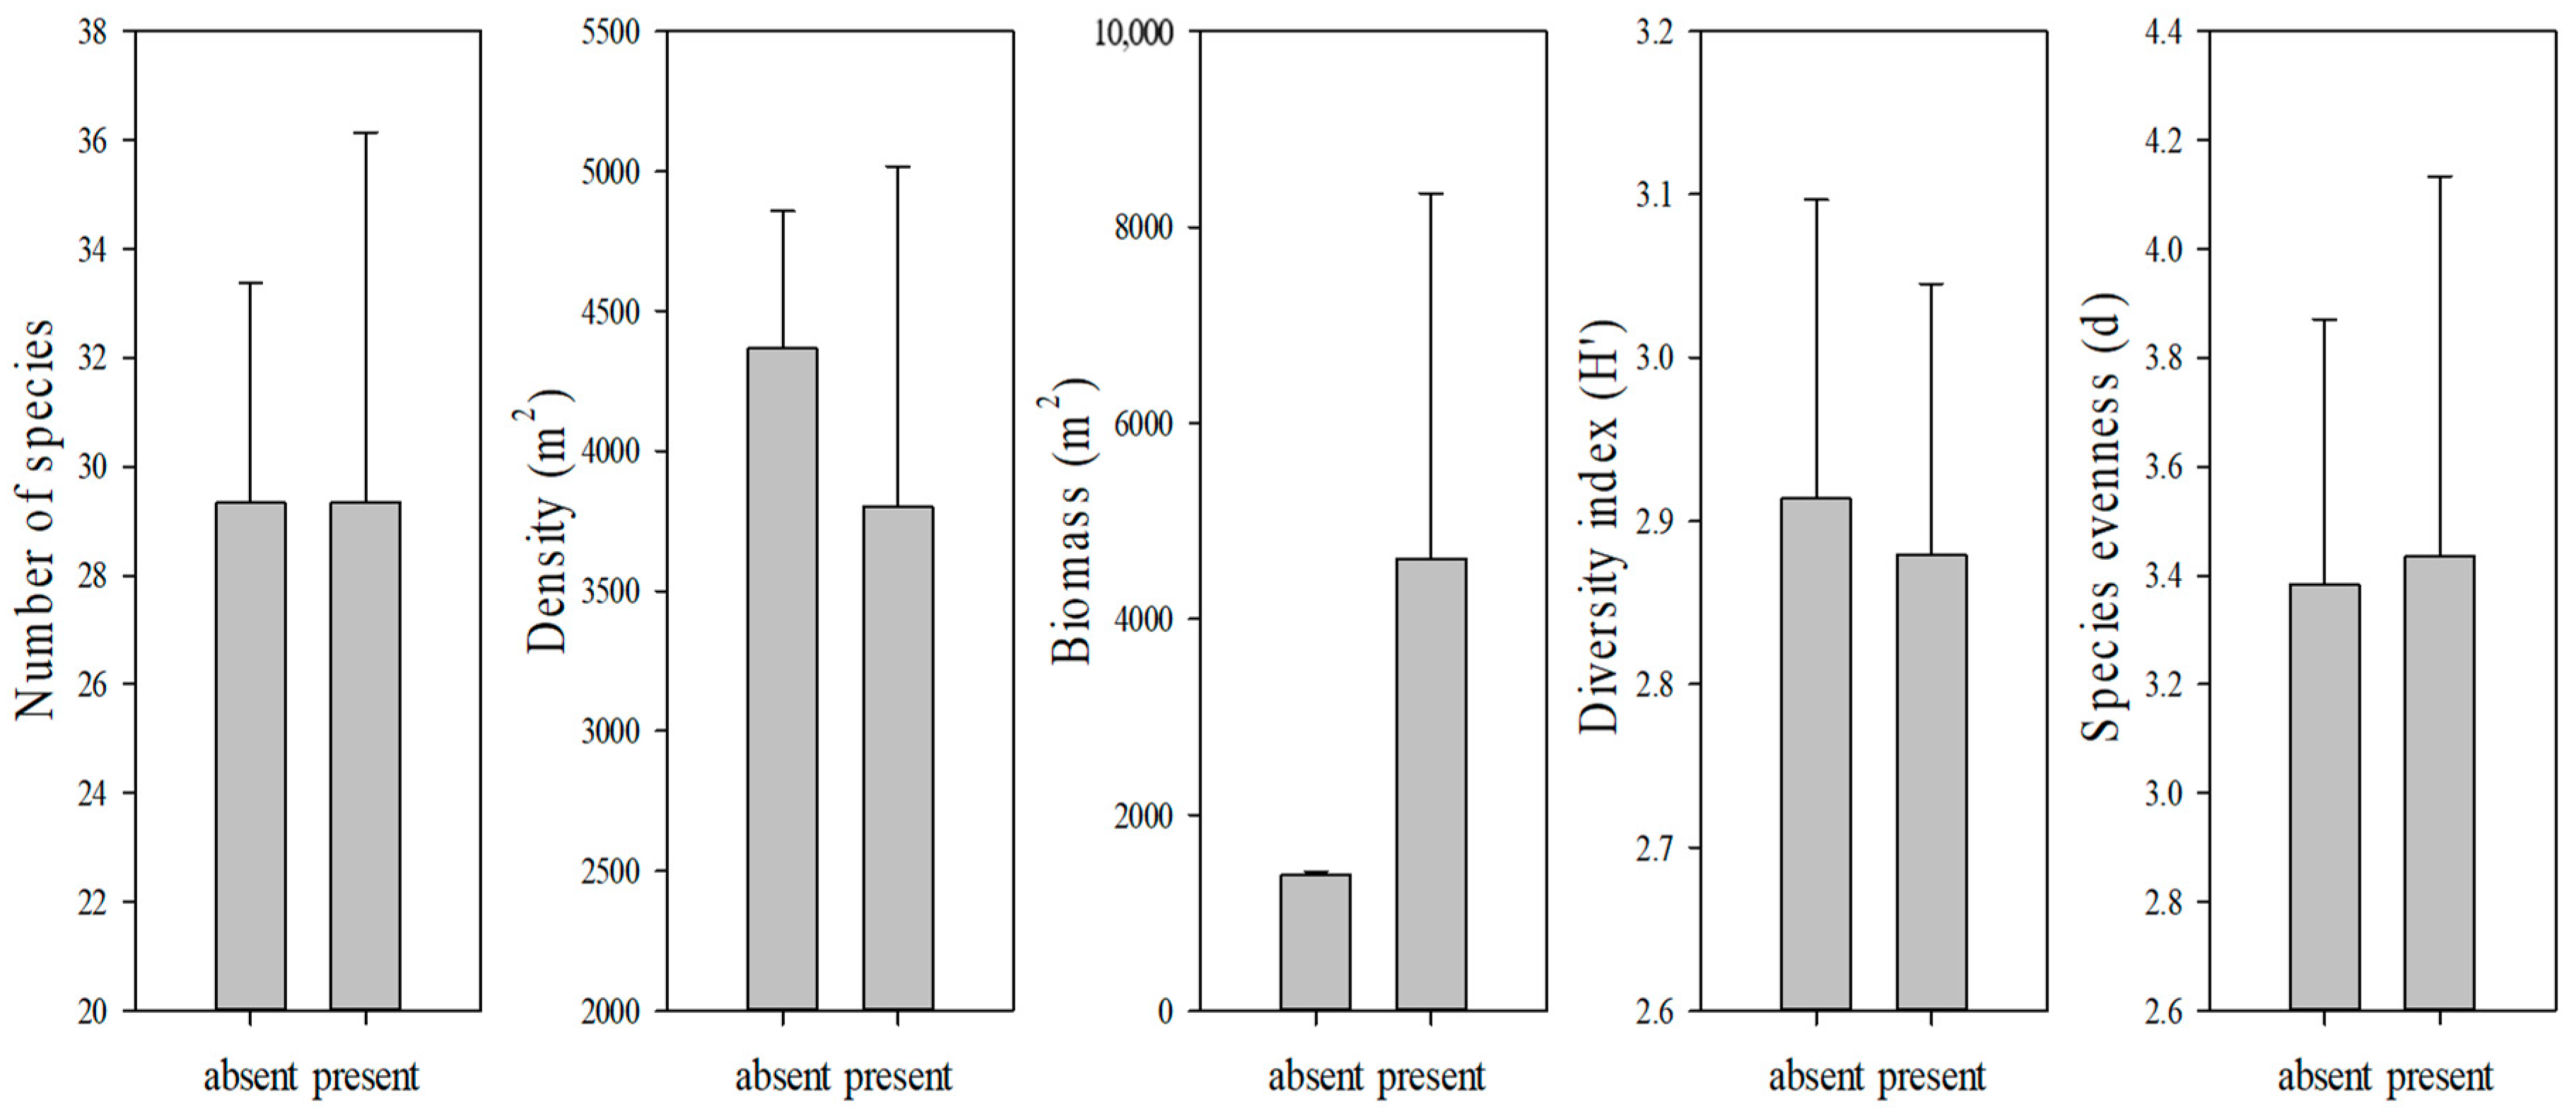
At locations with sandy bottoms, the number of species was higher in debris-free sites, followed by netted sites (Figure 3). The density was highest at the site with nets and lowest at the site with cloth. Although debris-free sites showed a higher biomass, the variation was significant, and net sites showed the second-highest biomass (Figure 3). The species richness was higher in areas with nets, and evenness was highest in sites with both cloth and bottles (Figure 3). The density of macrobenthos was higher in rocky bottoms without debris, while the biomass was higher in sites with debris (Figure 4).
The two-way ANOVA confirmed that bottom type and debris status did not significantly impact density and diversity (Table 5). However, the number of species differed significantly between the bottom type and by debris status (p = 0.003). The Kruskal–Wallis test revealed significant differences in macrobenthos biomass by bottom type (sandy/rocky) (H = 11.368, df = 1, p < 0.001), but not by debris status (presence/absence) (H = 2.538, df = 1, p = 0.111).

3.7. Macrobenthos Assemblages

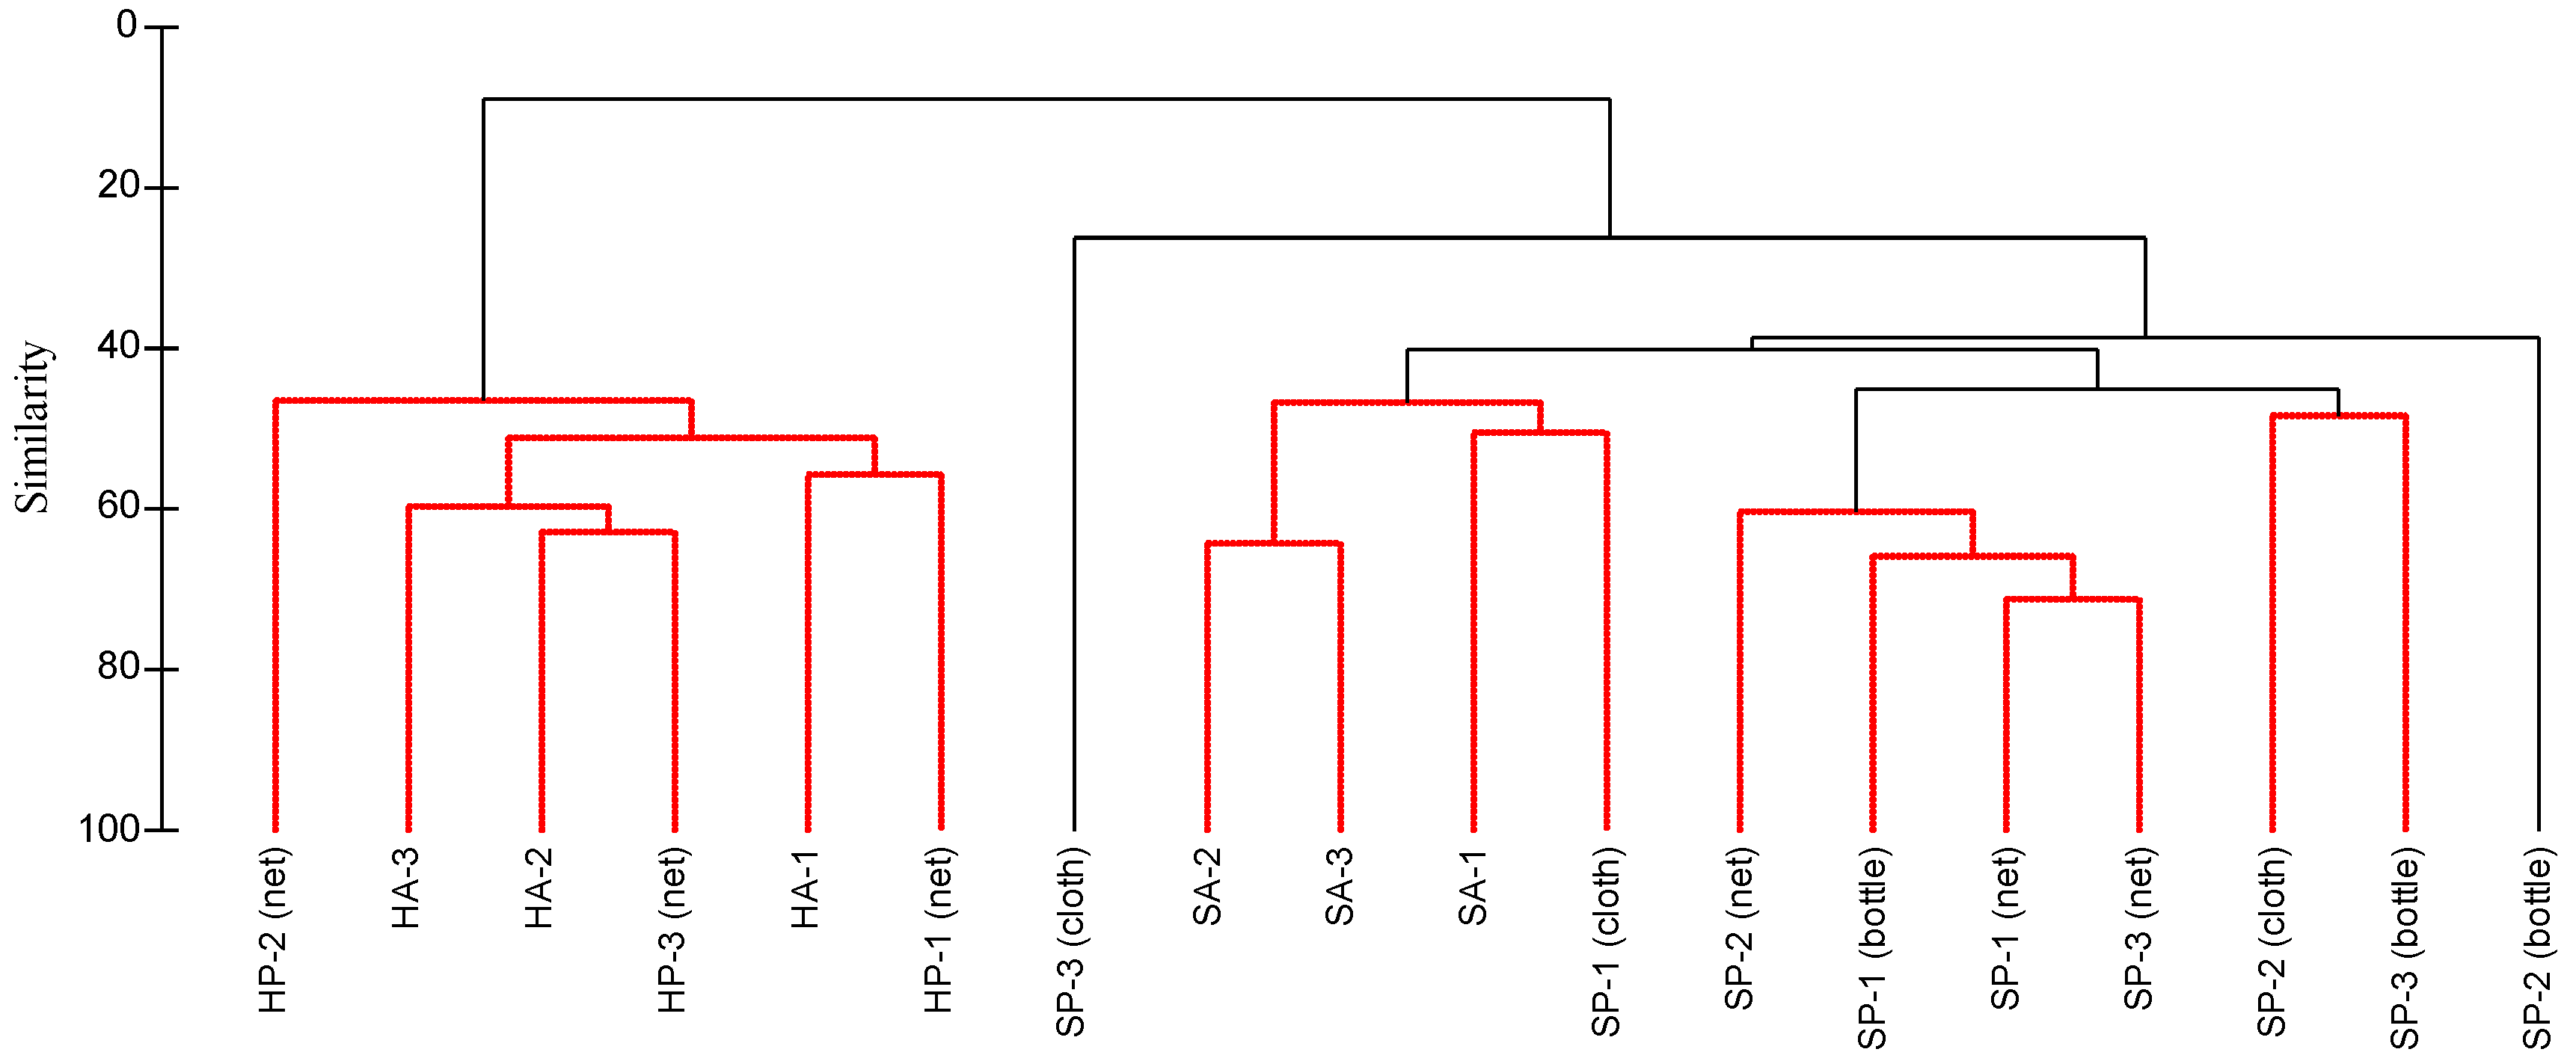
The similarity profile test (Simprof test) results divided the clusters into four groups (ANOSIM global R-value: 0.926) (Figure 5). Group 1 consisted of HP-1(net) (rocky bottom, net debris 1), HP-2(net) (rocky bottom, net debris 2), HP-3(net) (rocky bottom, net debris 3), HA-1(rocky bottom, no debris 1), HA-2(rocky bottom, no debris 2), and HA-3(rocky bottom, no debris 3).
Group 2 consisted of SP-1(cloth) (sandy bottom, cloth debris 1), SA-1(sandy bottom, no debris 1), SA-2(sandy bottom, no debris 2), and SA-3(sandy bottom, no debris 3). Group 3 consisted of SP-1(net) (sandy bottom, net debris 1), SP-1(bottle) (sandy bottom, bottle debris 1), SP-2(net) (sandy bottom, net debris 2), and SP-3(net) (sandy bottom, net debris 3). Group 4 consisted of SP-2(cloth) (sandy bottom, cloth debris 2) and SP-3(bottle) (sandy bottom, bottle debris 3) (Figure 5).

4. Discussion

The study area was polluted with a variety of marine debris, including household garbage (plastic bottles, cans, cloth), fishing gear and nets. Debris (particularly plastic) was concentrated in the boundary areas, covering the entire sediment surface or part of the rocks. Southern Jeju Island has been reported to have high amounts of debris, including a very high proportion of plastics (69.4%) in a previous study [31]. The amount of debris generated by fishing activities documented in that study was extremely high, as has also been found in other studies [20,21,22,46,58,59]. In Korea, the distribution of fishing traps and fishing gear, which are commonly seen in the eastern part of the South Sea, has been studied [60], as well as the characteristics of marine debris in the East China Sea and the Yellow Sea [33]. Industrialization increases the amounts of discarded plastics, Styrofoam, and PET bottles, which damages the marine environment and significantly compromises marine ecosystems and fishery resources [1]. Plastic debris, which decomposes very slowly, has persistent adverse effects on benthic ecosystems by breaking down into microplastics [3]. In this study, fishing nets were frequently observed, reflecting coastal fishing activities [48].
Plastic debris (bags, bottles, and other objects) has been shown to have a significant relationship with depth [23]. The wide spatial variation in debris can be caused by hydrological factors, as well as the movement and accumulation of marine debris in deeper water [61]. Our study area was relatively shallow (depth less than 20 m), but we can confirm that debris was concentrated. To the left of the study area is Seogwipo Port, which is used by many ships. Pasternak (2019) collected submerged marine debris along the Mediterranean coast, with a focus on areas that are minimally influenced by ocean currents and thus with significant debris concentrations; open areas with strong currents contained less debris [62]. In particular, sediment movement and deposition significantly affected the amount of debris [63]. The topography of the area changed when a port was built, reducing currents and thus sediment movements [24,64]. Other studies have indicated that ports affect ocean currents and marine debris. The debris levels in regions without harbors should be explored.
The study area was a mixed rocky and sandy subtidal zone; nets were frequently observed among the debris. Ghost fishing was also observed, and a variety of fish were trapped. Ghost fishing is caused by abandoned, lost, or discarded fishing gear that continues to capture and kill fish and other marine life [65]. This phenomenon can have a devastating impact on marine ecosystems and is a serious problem that has been around for centuries [66,67,68]. Han (2023) reported that nets and ropes were commonly entangled on rocks or corals of rocky intertidal zones, were difficult to remove, and negatively impacted benthic ecosystems [43]. Fishing nets can be fatal to marine organisms that become trapped but they are difficult to retrieve from the ocean floor [30].
In this study, the benthic macrofauna groups clearly differed by sediment type, with polychaetes dominating sandy bottoms and mollusks dominating rocky bottoms. The dominant species of sandy bottoms, polychaete Armandia lanceolata, is a subsurface deposit feeder [69]. This species is found in sandy or muddy sediments of shallow waters, usually up to depths of approximately 100 m, in the western Pacific Ocean, including along the coasts of Japan, Korea, and China. Deposit feeders are an important component of benthic ecosystems and play major roles in nutrient cycling and sediment stability [70]. On rocky bottoms, the mollusk Leiosolenus lischkei was predominant, with large numbers of small individuals. Leiosolenus can tunnel into limestone or coral, thus playing an important role in coral reef erosion and creating safe habitats for various animals [71]. Plastic debris is often ingested by these benthic animals, especially those that feed on sediment and use non-selective particle capture methods [72]. Furthermore, plastic ingested by benthic food chains is mostly at low trophic levels and can be a means of reintroducing sedimented plastic fragments into coastal and pelagic food chains [73].
The benthic macrofauna densities and ecological indices varied by the presence and type of debris. Polychaetes and mollusks exhibited higher densities and biomasses in areas without debris, particularly on rocky substrates. Generally, a hard substrate attracts mobile species that then settle, increasing species richness and abundance [74]. However, in this study, although hard substrates initially attracted various organisms, continuous marine debris input rendered survival difficult. Tourinho (2010) found that areas with high levels of debris exhibited significant declines in both benthic and pelagic organisms, with negative implications for human fisheries and ocean productivity [75].
We investigated the impact of underwater marine debris and sediment on benthic animals in terms of species composition and distribution. The study area had high levels of debris. However, the short distance between survey sites limited the scope of our investigation. In the future, we will study more areas with high levels of marine debris and increase the survey frequency. We will classify debris types more precisely and quantify them in more detail. Our research provides a basis on which our understanding of the effects of marine debris on marine ecosystems will improve in the future.

5. Conclusions

Marine debris pollution is a global ecological concern, as it threatens wildlife and local economies. Submerged marine debris alters local benthic species composition and community characteristics. This study investigated the impact of submerged marine debris on the macrobenthic fauna of sandy and rocky substrates. The study found that the sandy substrate area had higher species richness and biomass than the rocky substrate area. The study also found that the dominant macrobenthos taxon differed between the two areas. In the sandy substrate area, the dominant macrobenthos taxon was polychaetes, while in the rocky substrate area, the dominant macrobenthos taxon was mollusks. The study concluded that submerged marine debris can have a negative impact on benthic communities.

Author Contributions

Conceptualization, O.H.Y. and S.L.K.; methodology, S.L.K.; software, S.L.K.; validation, O.H.Y. and S.L.K.; formal analysis, S.L.K.; investigation, H.G.L., Y.P. and S.L.K.; writing—original draft preparation, O.H.Y. and S.L.K.; writing—review and editing, O.H.Y. and S.L.K.; funding acquisition, O.H.Y. All authors have read and agreed to the published version of the manuscript.

Funding

This research was supported by the project “Development of technology for impact assessment of marine plastic debris on marine ecosystems (PEA0114)” funded by the Korea Institute of Ocean Science and Technology.

Institutional Review Board Statement

Not applicable.

Informed Consent Statement

Not applicable.

Data Availability Statement

The data that support the findings of this study are available from the corresponding author upon reasonable request.

Conflicts of Interest

The authors declare no conflict of interest.

References

  1. Sheavly, S.B.; Register, K.M. Marine debris & plastics: Environmental concerns, sources, impacts and solutions. J. Polym. Environ. 2007, 15, 301–305. [Google Scholar] [CrossRef]
  2. Watters, D.L.; Yoklavich, M.M.; Love, M.S.; Schroeder, D.M. Assessing marine debris in deep seafloor habitats off California. Mar. Pollut. Bull. 2010, 60, 131–138. [Google Scholar] [CrossRef] [PubMed]
  3. Barnes, D.K.A.; Galgani, F.; Thompson, R.C.; Barlaz, M. Accumulation and fragmentation of plastic debris in global environments. Philos. Trans. R. Soc. B Biol. Sci. 2009, 364, 1985–1998. [Google Scholar] [CrossRef] [PubMed] [Green Version]
  4. Damian, M.; Harris, A.; Aussage, J.; Fraser, G.S. Seasonal deposition of marine debris on an important marine turtle Nesting Beach in Costa Rica. Mar. Pollut. Bull. 2022, 177, 113525. [Google Scholar] [CrossRef] [PubMed]
  5. Jambeck, J.R.; Roland, G.; Chris, W.; Theodore, R.S.; Miriam, P.; Anthony, A.; Ramani, N.; Lavender, L.K. Plastic waste inputs from land into the ocean. Science 2015, 347, 764–768. [Google Scholar] [CrossRef]
  6. Engler, R.E. Chemicals in the Ocean. Environ. Sci. Technol. 2012, 46, 302–315. [Google Scholar]
  7. Nollkaemper, A. Land-based discharges of marine debris: From local to global regulation. Mar. Pollut. Bull. 1994, 28, 649–652. [Google Scholar] [CrossRef] [Green Version]
  8. Ivar do Sul, J.A.; Santos, I.R.; Friedrich, A.C.; Matthiensen, A.; Fillmann, G. Plastic Pollution at a Sea Turtle Conservation Area in NE Brazil: Contrasting Developed and Undeveloped Beaches. Estuaries Coasts 2011, 34, 814–823. [Google Scholar] [CrossRef]
  9. Rech, S.; Borrell, Y.; García-Vazquez, E. Marine litter as a vector for non-native species: What we need to know. Mar. Pollut. Bull. 2016, 113, 40–43. [Google Scholar] [CrossRef] [Green Version]
  10. Galgani, F.; Hanke, G.; Maes, T. Marine Anthropogenic Litter; Bergmann, M., Gutow, L., Klages, M., Eds.; Springer: Berlin, Germany, 2015; ISBN 9783319165103. [Google Scholar]
  11. Santos, I.R.; Friedrich, A.C.; do Sul, J.A.I. Marine debris contamination along undeveloped tropical beaches from northeast Brazil. Environ. Monit. Assess. 2009, 148, 455–462. [Google Scholar] [CrossRef]
  12. Moore, C.J. Synthetic polymers in the marine environment: A rapidly increasing, long-term threat. Environ. Res. 2008, 108, 131–139. [Google Scholar] [CrossRef]
  13. Mcilgorm, A.; Campbell, H.F.; Rule, M.J. The economic cost and control of marine debris damage in the Asia-Pacific region. Ocean Coast. Manag. 2011, 54, 643–651. [Google Scholar] [CrossRef]
  14. Donohue, M.J.; Boland, R.C.; Sramek, C.M.; Antonelis, G.A. Derelict fishing gear in the Northwestern Hawaiian Islands: Diving surveys and debris removal in 1999 confirm threat to Coral Reef ecosystems. Mar. Pollut. Bull. 2001, 42, 1301–1312. [Google Scholar] [CrossRef] [PubMed]
  15. Gall, S.; Thompson, R. The impact of debris on marine life. Mar. Pollut. Bull. 2015, 92, 170–179. [Google Scholar] [CrossRef]
  16. Derraik, J.G.B. The pollution of the marine environment by plastic debris: A review. Mar. Pollut. Bull. 2002, 44, 842–852. [Google Scholar] [CrossRef] [PubMed]
  17. Choi, E.C.; Lee, J.S. The willingness to pay for removing the microplastics in the ocean—The case of Seoul metropolitan area, South Korea. Mar. Policy 2018, 93, 93–100. [Google Scholar] [CrossRef]
  18. Jin, S.J.; Kwon, Y.J.; Yoo, S.H. Economic valuation of reducing submerged marine debris in South Korea. Appl. Sci. 2020, 10, 6086. [Google Scholar] [CrossRef]
  19. Li, W.; Tse, H.F.; Fok, L. Plastic waste in the marine environment: A review of sources, occurrence and effects. Sci. Total Environ. 2016, 566–567, 333–349. [Google Scholar] [CrossRef]
  20. Corcoran, P.L. Benthic plastic debris in marine and fresh water environments. Environ. Sci. Process. Impacts 2015, 17, 1363–1369. [Google Scholar] [CrossRef]
  21. Kumar, A.A.; Sivakumar, R.; Reddy, Y.S.R.; Bhagya Raja, M.V.; Nishanth, T.; Revanth, V. Preliminary study on marine debris pollution along Marina beach, Chennai, India. Reg. Stud. Mar. Sci. 2016, 5, 35–40. [Google Scholar] [CrossRef]
  22. Debrot, A.O.; Vinke, E.; van der Wende, G.; Hylkema, A.; Reed, J.K. Deepwater marine litter densities and composition from submersible video-transects around the ABC-islands, Dutch Caribbean. Mar. Pollut. Bull. 2014, 88, 361–365. [Google Scholar] [CrossRef]
  23. Angiolillo, M.; di Lorenzo, B.; Farcomeni, A.; Bo, M.; Bavestrello, G.; Santangelo, G.; Cau, A.; Mastascusa, V.; Cau, A.; Sacco, F.; et al. Distribution and assessment of marine debris in the deep Tyrrhenian Sea (NW Mediterranean Sea, Italy). Mar. Pollut. Bull. 2015, 92, 149–159. [Google Scholar] [CrossRef] [PubMed]
  24. Kuo, F.J.; Huang, H.W. Strategy for mitigation of marine debris: Analysis of sources and composition of marine debris in northern Taiwan. Mar. Pollut. Bull. 2014, 83, 70–78. [Google Scholar] [CrossRef] [PubMed]
  25. Tomas, J.; Guitart, R.; Mateo, R.; Raga, J.A. Marine debris ingestion in loggerhead sea turtles, Caretta caretta, from the Western Mediterranean. Mar. Pollut. Bull. 2002, 44, 211–216. [Google Scholar] [CrossRef]
  26. Melli, V.; Angiolillo, M.; Ronchi, F.; Canese, S.; Giovanardi, O.; Querin, S.; Fortibuoni, T. The first assessment of marine debris in a Site of Community Importance in the north-western Adriatic Sea (Mediterranean Sea). Mar. Pollut. Bull. 2017, 114, 821–830. [Google Scholar] [CrossRef] [PubMed]
  27. Bilkovic, D.M.; Havens, K.; Stanhope, D.; Angstadt, K. Derelict fishing gear in Chesapeake Bay, Virginia: Spatial patterns and implications for marine fauna. Mar. Pollut. Bull. 2014, 80, 114–123. [Google Scholar] [CrossRef]
  28. Lee, D.I.; Cho, H.S.; Jeong, S.B. Distribution characteristics of marine litter on the sea bed of the East China Sea and the South Sea of Korea. Estuar. Coast. Shelf Sci. 2006, 70, 187–194. [Google Scholar] [CrossRef]
  29. Consoli, P.; Andaloro, F.; Altobelli, C.; Battaglia, P.; Campagnuolo, S.; Canese, S.; Castriota, L.; Cillari, T.; Falautano, M.; Pedà, C.; et al. Marine litter in an EBSA (Ecologically or Biologically Significant Area) of the central Mediterranean Sea: Abundance, composition, impact on benthic species and basis for monitoring entanglement. Environ. Pollut. 2018, 236, 405–415. [Google Scholar] [CrossRef]
  30. Gilman, E.; Musyl, M.; Suuronen, P.; Chaloupka, M.; Gorgin, S.; Wilson, J.; Kuczenski, B. Highest risk abandoned, lost and discarded fishing gear. Sci. Rep. 2021, 11, 7195. [Google Scholar] [CrossRef]
  31. Song, S.H.; Lee, H.W.; Kim, J.N.; Jeong, J.M.; Ji, H.S.; Jo, H.S.; Kim, D.H.; Park, C. Frist observation and effect of fishery of seabed litter on sea bed by trawl survey Korea waters. Mar. Pollut. Bull. 2021, 170, 112228. [Google Scholar] [CrossRef]
  32. Jeong, Y.H.; Yang, J.S.; Park, K.; Lebrato, M.; Wang, Y.V.; Tseng, L.C.; Achterberg, E.P.; Chen, X.G.; Molinero, J.C.; Bremer, K.; et al. Distribution of microcystins in environmental multimedia and their bioaccumulation characteristics in marine benthic organisms in the Geum River Estuary, South Korea. Environ. Int. 2019, 19, 143815. [Google Scholar] [CrossRef]
  33. Kim, J.N.; Kang, M.; Jo, H.-S. The distribution and composition of seabed litter in the exclusive economic zone of the West Sea of South Korea. J. Korean Soc. Fish. Technol. 2017, 53, 437–445. [Google Scholar] [CrossRef]
  34. Sruthy, S.; Ramasamy, E.V. Microplastic pollution in Vembanad Lake, Kerala, India: The first report of microplastics in lake and estuarine sediments in India. Environ. Pollut. 2017, 222, 315–322. [Google Scholar] [CrossRef] [PubMed]
  35. Van Cauwenberghe, L.; Devriese, L.; Galgani, F.; Robbens, J.; Janssen, C.R. Microplastics in sediments: A review of techniques, occurrence and effects. Mar. Environ. Res. 2015, 111, 5–17. [Google Scholar] [CrossRef] [PubMed] [Green Version]
  36. Schlining, K.; von Thun, S.; Kuhnz, L.; Schlining, B.; Lundsten, L.; Jacobsen Stout, N.; Chaney, L.; Connor, J. Debris in the deep: Using a 22-year video annotation database to survey marine litter in Monterey Canyon, central California, USA. Deep. Res. Part I Oceanogr. Res. Pap. 2013, 79, 96–105. [Google Scholar] [CrossRef]
  37. Murray, F.; Cowie, P.R. Plastic contamination in the decapod crustacean Nephrops norvegicus (Linnaeus, 1758). Mar. Pollut. Bull. 2011, 62, 1207–1217. [Google Scholar] [CrossRef]
  38. Hong, S.; Lee, J.; Jang, Y.C.; Kim, Y.J.; Kim, H.J.; Han, D.; Hong, S.H.; Kang, D.; Shim, W.J. Impacts of marine debris on wild animals in the coastal area of Korea. Mar. Pollut. Bull. 2013, 66, 117–124. [Google Scholar] [CrossRef]
  39. Ramirez-Llodra, E.; De Mol, B.; Company, J.B.; Coll, M.; Sardà, F. Effects of natural and anthropogenic processes in the distribution of marine litter in the deep Mediterranean Sea. Prog. Oceanogr. 2013, 118, 273–287. [Google Scholar] [CrossRef]
  40. Cole, M.; Lindeque, P.; Halsband, C.; Galloway, T.S. Microplastics as contaminants in the marine environment: A review. Mar. Pollut. Bull. 2011, 62, 2588–2597. [Google Scholar] [CrossRef]
  41. Thompson, R.C.; Swan, S.H.; Moore, C.J.; Vom Saal, F.S. Our plastic age. Philos. Trans. R. Soc. B Biol. Sci. 2009, 364, 1973–1976. [Google Scholar] [CrossRef] [Green Version]
  42. Xue, B.; Huang, B.; Chen, G.; Li, H.; Wei, W. Deep-sea debris identification using deep convolutional neural networks. IEEE J. Sel. Top. Appl. Earth Obs. Remote Sens. 2021, 14, 8909–8921. [Google Scholar] [CrossRef]
  43. Han, G.H.; Kim, S.L.; Kang, S.M.; Lee, H.G.; Yu, O.H. Effect of submerged marine debris on the species compositions and community characteristics of the macrobenthos in the subtidal zone of Jeju Island, Korea. J. Sea Res. 2023, 192, 102347. [Google Scholar] [CrossRef]
  44. Hess, N.A.; Ribic, C.A.; Vining, I. Benthic marine debris, with an emphasis on fishery-related items, surrounding Kodiak Island, Alaska, 1994–1996. Mar. Pollut. Bull. 1999, 38, 885–890. [Google Scholar] [CrossRef]
  45. Backhurst, M.K.; Cole, R.G. Subtidal benthic marine litter at Kawau Island, north-eastern New Zealand. J. Environ. Manag. 2000, 60, 227–237. [Google Scholar] [CrossRef]
  46. Moore, S.L.; Allen, M.J. Distribution of anthropogenic and natural debris on the mainland shelf of the Southern California Bight. Mar. Pollut. Bull. 2000, 40, 83–88. [Google Scholar] [CrossRef]
  47. Spengler, A.; Costa, M.F. Methods applied in studies of benthic marine debris. Mar. Pollut. Bull. 2008, 56, 226–230. [Google Scholar] [CrossRef]
  48. Pham, C.K.; Ramirez-Llodra, E.; Alt, C.H.S.; Amaro, T.; Bergmann, M.; Canals, M.; Company, J.B.; Davies, J.; Duineveld, G.; Galgani, F.; et al. Marine litter distribution and density in European seas, from the shelves to deep basins. PLoS ONE 2014, 9, e95839. [Google Scholar] [CrossRef] [Green Version]
  49. Woodall, L.C.; Robinson, L.F.; Rogers, A.D.; Narayanaswamy, B.E.; Paterson, G.L.J. Deep-sea litter: A comparison of seamounts, banks and a ridge in the Atlantic and Indian Oceans reveals both environmental and anthropogenic factors impact accumulation and composition. Front. Mar. Sci. 2015, 2, 3. [Google Scholar] [CrossRef]
  50. Grøsvik, B.E.; Prokhorova, T.; Eriksen, E.; Krivosheya, P.; Horneland, P.A.; Prozorkevich, D. Assessment of marine litter in the Barents Sea, a part of the joint Norwegian-Russian ecosystem survey. Front. Mar. Sci. 2018, 5, 72. [Google Scholar] [CrossRef] [Green Version]
  51. Jang, S.W.; Park, J.M.; Chung, Y.H.; Kim, D.H.; Yoon, H.J. A Study on the Inflow and Seasonal Characteristics of Foreign Marine Debris in the Coastal Area of the West Sea. J. Korean Soc. Mar. Environ. Energy 2012, 15, 89–100. [Google Scholar] [CrossRef]
  52. Kim, S.; Kang, W. Distribution Characteristics and Cost Estimation of Collection and Treatment of Deposited Marine Debris in Coastal Fisheries around the Southwestern Islands of Korea. J. Korean Soc. Mar. Environ. Eng. 2012, 15, 330–336. [Google Scholar] [CrossRef]
  53. Yang, S.-C.; Yang, S.-K.; Kim, Y.-S. Mean Velocity Distribution of Natural Stream using Entropy Concept in Jeju. J. Environ. Sci. Int. 2019, 28, 535–544. [Google Scholar] [CrossRef]
  54. Ko, J.-C.; Koo, J.-H.; Yang, M.-H. Characteristics of Ocean Environmental Factors and Community Structure of Macrobenthos around Munseom, Jeju Island, Korea. Korean J. Malacol. 2008, 24, 215–228. [Google Scholar]
  55. Cho, I.Y.; Kang, D.W.; Kang, J.; Hwang, H.; Won, J.H.; Paek, W.K.; Seo, S.Y. A study on the biodiversity of benthic invertebrates in the waters of Seogwipo, Jeju Island, Korea. J. Asia Pac. Biodivers. 2014, 7, e11–e18. [Google Scholar] [CrossRef] [Green Version]
  56. Folk, R.; Ward, W. Brazos river bar: A study in the significance of grain-size parameters. J. Sediment Pet. 1957, 27, 3–26. [Google Scholar] [CrossRef]
  57. Clarke, K.R.; Gorley, R.N. Primer V6: User Manual/Tutorial; PRIMER-E: Plymouth, UK, 2006. [Google Scholar]
  58. Van Cauwenberghe, L.; Claessens, M.; Vandegehuchte, M.B.; Mees, J.; Janssen, C.R. Assessment of marine debris on the Belgian Continental Shelf. Mar. Pollut. Bull. 2013, 73, 161–169. [Google Scholar] [CrossRef]
  59. Pawar, P.R.; Shirgaonkar, S.S.; Patil, R.B. Plastic marine debris: Sources, distribution and impacts on coastal and ocean biodiversity. Pencil Publ. Biol. Sci. 2016, 3, 40–54. [Google Scholar]
  60. Kim, M.S.; Kim, S.K.; Kim, J.K.; Jeong, S.B.; Jo, H.J. A study on the distribution of marine litters in the eastern part area of the southern sea mainly on discarded pots. Bull. J. Korean Soc. Fish. Technol. 1999, 35, 386–390. [Google Scholar]
  61. Galgani, F.; Leaute, J.P.; Moguedet, P.; Souplet, A.; Verin, Y.; Carpentier, A.; Goraguer, H.; Latrouite, D.; Andral, B.; Cadiou, Y.; et al. Litter on the sea floor along European coasts. Mar. Pollut. Bull. 2000, 40, 516–527. [Google Scholar] [CrossRef]
  62. Pasternak, G.; Ribic, C.A.; Spanier, E.; Ariel, A.; Mayzel, B.; Ohayon, S.; Zviely, D. Nearshore survey and cleanup of benthic marine debris using citizen science divers along the Mediterranean coast of Israel. Ocean Coast. Manag. 2019, 175, 17–32. [Google Scholar] [CrossRef]
  63. Manickavasagam, S.; Kumar, S.; Kumar, K.; Rathi Bhuvaneswari, G.; Paul, T.; Shukla, S.P. Quantitative assessment of influx and efflux of marine debris in a water channel of South Juhu creek, Mumbai, India. Reg. Stud. Mar. Sci. 2020, 34, 101095. [Google Scholar] [CrossRef]
  64. Ruiz-Orejón, L.F.; Sardá, R.; Ramis-Pujol, J. Floating plastic debris in the Central and Western Mediterranean Sea. Mar. Environ. Res. 2016, 120, 136–144. [Google Scholar] [CrossRef] [PubMed]
  65. Perroca, J.F.; Giarrizzo, T.; Azzurro, E.; Rodrigues-Filho, J.L.; Silva, C.V.; Arcifa, M.S.; Azevedo-Santos, V.M. Negative effects of ghost nets on Mediterranean biodiversity. Aquat. Ecol. 2022. [Google Scholar] [CrossRef]
  66. de Oliveira Leis, M.; Devillers, R.; Medeiros, R.P.; Chuenpagdee, R. Mapping fishers’ perceptions of marine conservation in Brazil: An exploratory approach. Ocean Coast. Manag. 2019, 167, 32–41. [Google Scholar] [CrossRef]
  67. Andrades, R.; Trindade, P.A.A.; Giarrizzo, T. A novel facet of the impact of plastic pollution on fish: Silver croaker (Plagioscion squamosissimus) suffocated by a plastic bag in the Amazon estuary, Brazil. Mar. Pollut. Bull. 2021, 166, 112197. [Google Scholar] [CrossRef]
  68. Vitorino, H.; Ferrazi, R.; Correia-Silva, G.; Tinti, F.; Belizário, A.C.; Amaral, F.A.; Ottoni, F.P.; Silva, C.V.; Giarrizzo, T.; Arcifa, M.S.; et al. New treaty must address ghost fishing gear. Science 2022, 376, 1169. [Google Scholar] [CrossRef]
  69. Kim, S.L.; Lee, H.G.; Yu, O.H. Correlation between rocky reefs and surrounding benthic habitats: Distribution and diversity patterns of polychaetes in the macrobenthic community in the East Sea of South Korea. J. Sea Res. 2021, 174, 102083. [Google Scholar] [CrossRef]
  70. Kanaya, G.; Nakamura, Y.; Koizumi, T.; Yamada, K. Seasonal changes in infaunal community structure in a hypertrophic brackish canal: Effects of hypoxia, sulfide, and predator-prey interaction. Mar. Environ. Res. 2015, 108, 14–23. [Google Scholar] [CrossRef]
  71. Owada, M. Functional morphology and phylogeny of the rock-boring bivalves Leiosolenus and Lithophaga (Bivalvia: Mytilidae): A third functional clade. Mar. Biol. 2007, 150, 853–860. [Google Scholar] [CrossRef]
  72. Graham, E.R.; Thompson, J.T. Deposit- and suspension-feeding sea cucumbers (Echinodermata) ingest plastic fragments. J. Exp. Mar. Biol. Ecol. 2009, 368, 22–29. [Google Scholar] [CrossRef]
  73. López-López, L.; Preciado, I.; González-Irusta, J.M.; Arroyo, N.L.; Muñoz, I.; Punzón, A.; Serrano, A. Incidental ingestion of meso- and macro-plastic debris by benthic and demersal fish. Food Webs 2018, 14, 1–4. [Google Scholar] [CrossRef]
  74. Katsanevakis, S.; Verriopoulos, G.; Nicolaidou, A.; Thessalou-Legaki, M. Effect of marine litter on the benthic megafauna of coastal soft bottoms: A manipulative field experiment. Mar. Pollut. Bull. 2007, 54, 771–778. [Google Scholar] [CrossRef] [PubMed]
  75. Tourinho, P.S.; Ivar do Sul, J.A.; Fillmann, G. Is marine debris ingestion still a problem for the coastal marine biota of southern Brazil? Mar. Pollut. Bull. 2010, 60, 396–401. [Google Scholar] [CrossRef] [PubMed]
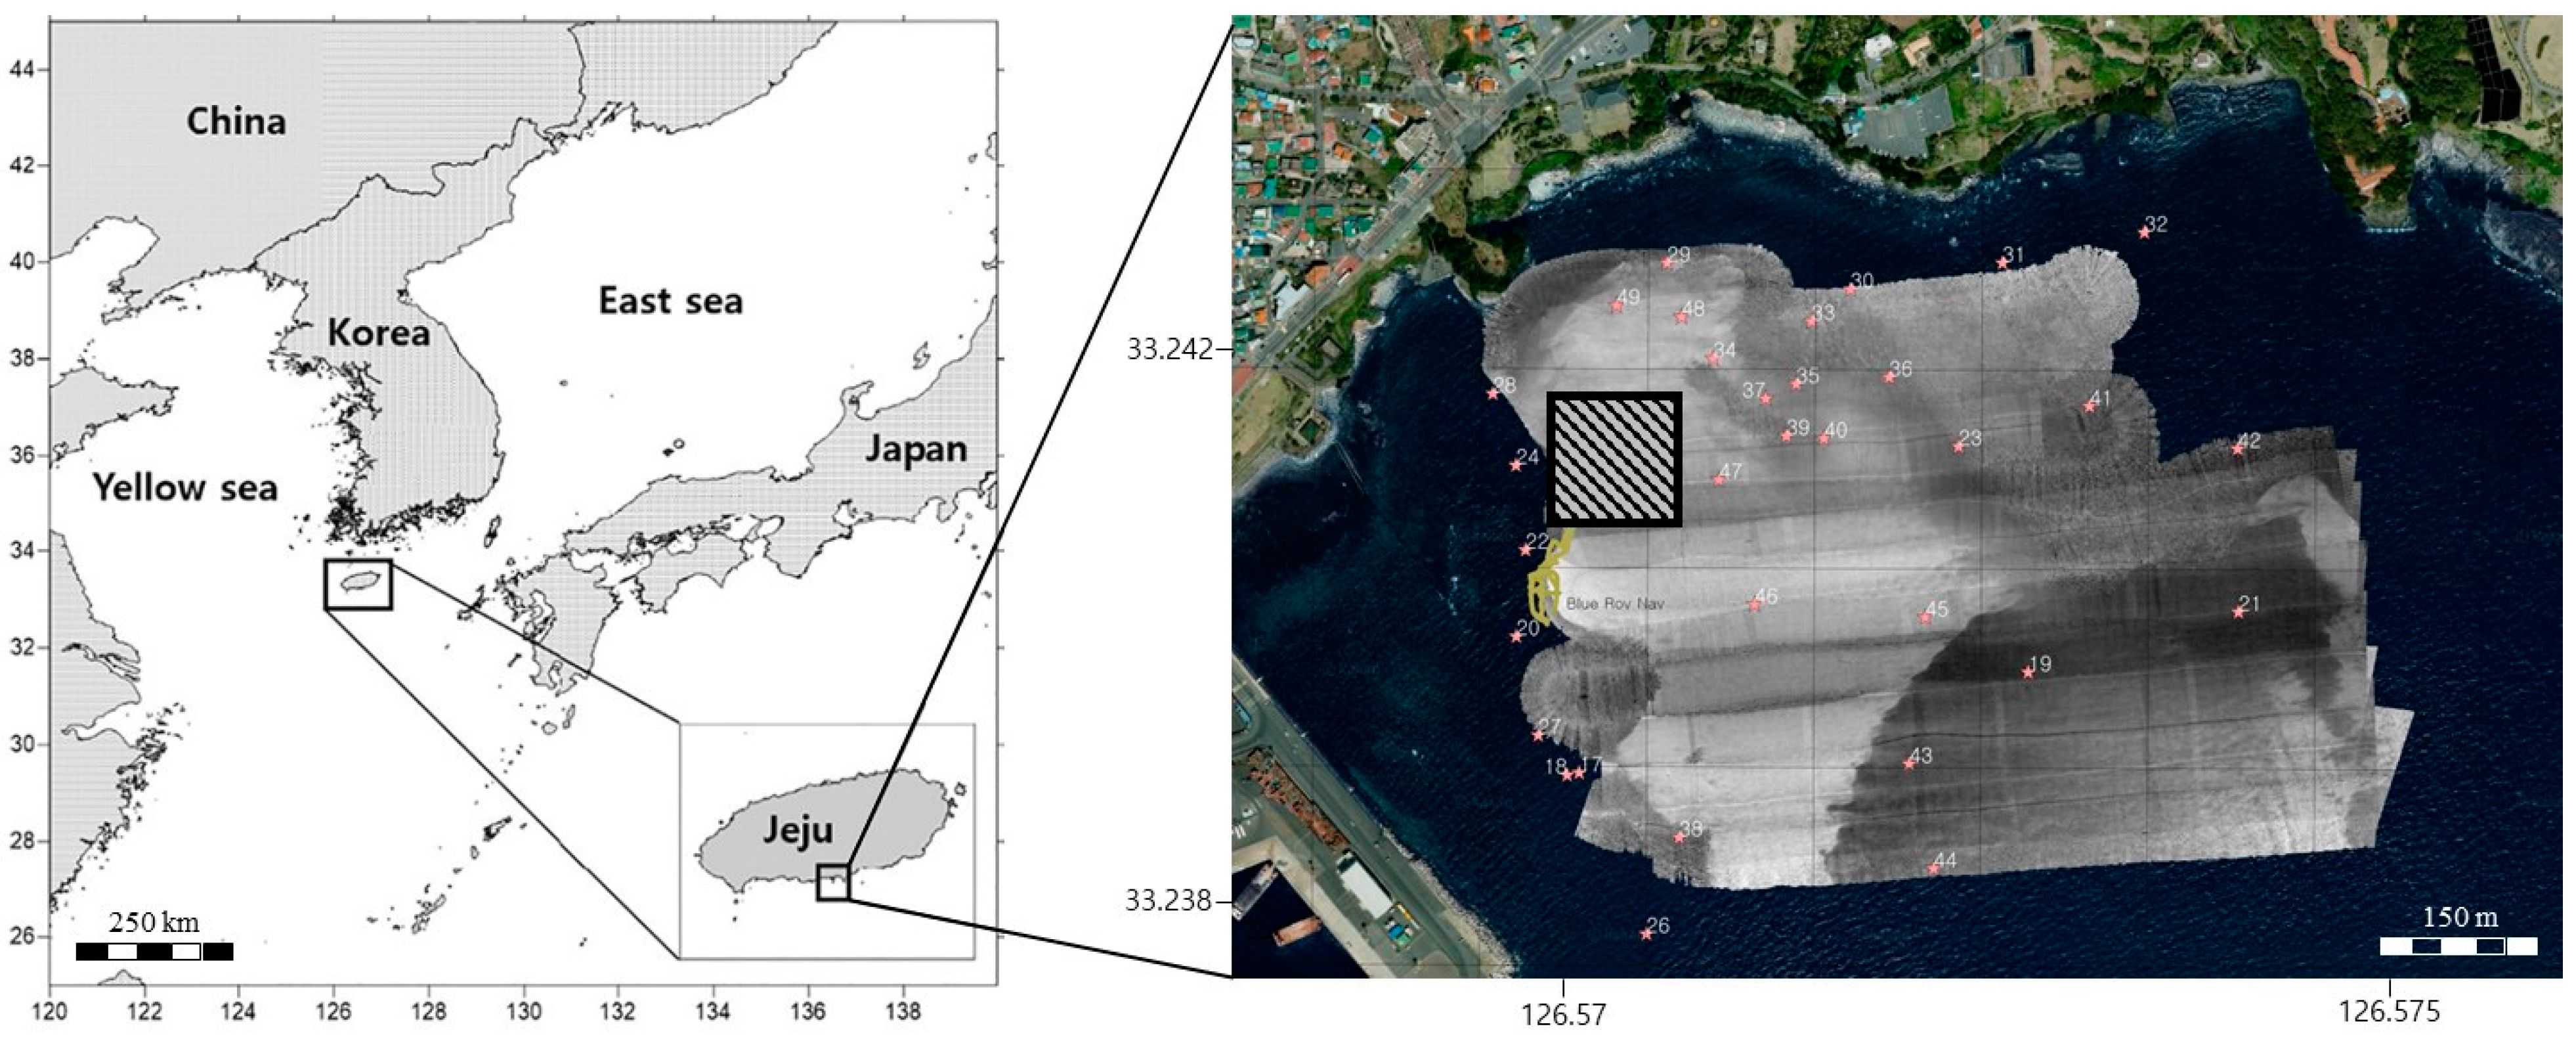
Figure 1. Study area on the Jaguri coast of Jeju island, South Korea (the gray area was investigated with multi-beam echo sounder for marine debris monitoring; areas with weak scattering intensity are indicated in white (sand deposits), and areas with high scattering intensity are indicated in black (coarse volcanic ash). The black square is an area where marine debris was concentrated and macrobenthic sampling was conducted).
Jmse 11 01427 g001
Figure 2. Submerged marine debris on the Jaguri coast of Jeju island, South Korea. (A) Fishing nets on a rocky bottom, red circle; ghost fishing. (B) Fishing nets on a sandy bottom, red circle; ghost fishing. (C) Wood and plastic fragments. (D) Vinyl and plastic fragments between rocks. (E) Cloth. (F) Plastic debris and rubber gloves. (G) Plastic bottles. (H) Cloth. (I) Plastic bottles.
Jmse 11 01427 g002
Figure 3. Macrobenthic fauna by marine debris status and type in areas with sandy bottoms. Species numbers, densities, biomasses, and ecological indices (diversity index H’; species richness d; Pielou’s evenness J’).
Jmse 11 01427 g003
Figure 4. Macrobenthic fauna by presence or absence of marine debris with rocky bottom from submerged marine debris areas. Species numbers, densities, biomass, and ecological indices (diversity index; H’, species richness; d).
Jmse 11 01427 g004
Figure 5. Cluster analysis of the fourth-root-transformed macrobenthos species densities from areas with submerged marine debris (SIMPROF test; the groups are separated by red lines; ANOSIM results; Global test R = 0.926).
Jmse 11 01427 g005
Table 1. Geographical positions, depths, sampling equipment, sampling replicates, and sampling areas are shown. SP (net), sandy bottom with nets; SP (cloth), sandy bottom with cloth; SP (bottle), sandy bottom with bottles; SA; sandy bottom with no debris; HP (net), rocky bottom with nets; HA; rocky bottom with no debris.
NoSiteLatitudeLongitudeDepth (m)Temperature (°C)Salinity
(psu)
Dissolved Oxygen (mg/L)
1SP-1(net)33 14.344126 34.27811.218.034.24.0
2SP-2(net)33 14.363126 34.28813.618.034.24.0
3SP-3(net)33 14.363126 34.28813.618.034.24.0
4SP-1(cloth)33 14.344126 34.28210.418.234.03.9
5SP-2(cloth)33 14.344126 34.28210.418.234.03.9
6SP-3(cloth)33 14.358126 34.29114.518.234.03.9
7SP-1(bottle)33 14.358126 34.2851318.134.24.5
8SP-2(bottle)33 14.345126 34.2901318.134.24.5
9SP-3(bottle)33 14.368126 34.2951418.134.24.5
10SA-133 14.358126 34.29011.518.233.64.5
11SA-233 14.358126 34.29011.518.233.64.5
12SA-333 14.358126 34.29011.518.233.64.5
13HP-1(net)33 14.351126 34.27510.817.934.04.2
14HP-2(net)33 14.351126 34.27510.817.934.04.2
15HP-3(net)33 14.353126 34.27311.117.934.04.2
16HA-133 14. 358126 34.2801418.134.14.5
17HA-233 14.358126 34.2801418.134.14.5
18HA-333 14.358126 34.2801418.134.14.5
Table 2. Sediment data on sandy bottom areas. Sedimentary phase percentage (gravel, sand, silt, clay), mean grain size, and total organic carbon. SP (net), sandy bottom with nets; SP (cloth), sandy bottom with cloth; SP (bottle), sandy bottom with bottles; SA; sandy bottom with no debris.
SiteGravel (%)Sand (%)Silt (%)Clay (%)Mz (Phi)TOC (%)
SP-1(bottle)0.0100.00.00.01.10.878
SP-2(cloth)0.0100.00.00.01.71.286
SP-3(net)0.0100.00.00.01.90.171
SA0.0100.00.00.01.80.750
Table 3. Macrobenthos groups. Average number of species, average density, and average biomass. SP (net), sandy bottom with nets; SP (cloth), sandy bottom with cloth; SP (bottle), sandy bottom with bottles; SA; sandy bottom with no debris; HP (net), rocky bottom with nets; HA; rocky bottom with no debris.
GroupsSiteAverage Density (m2)Average Biomass (m2)
PolychaetaSP-1 (bottle)26.72.6
SP-2 (cloth)93.30.6
SP-3 (net)50.082.7
SA100.0131.8
HP-1 (net)220.0160.5
HA518.3379.1
ArthropodaSP-1 (bottle)26.72.6
SP-2 (cloth)93.30.6
SP-3 (net)0.00.0
SA116.7160.1
HP-1 (net)233.3214.1
HA20.80.2
EchinodermsSP-1 (bottle)75.054.6
SP-2 (cloth)0.00.0
SP-3 (net)120.0124.3
SA233.3214.1
HP-1 (net)31.30.2
HA50.00.1
MolluskSP-1 (bottle)40.02.6
SP-2 (cloth)46.71.0
SP-3 (net)0.00.0
SA103.382.2
HP-1 (net)100.0131.8
HA220.0160.5
OthersSP-1 (bottle)46.71.0
SP-2 (cloth)6.70.5
SP-3 (net)40.02.6
SA53.30.6
HP-1 (net)116.7160.1
HA233.3214.1
Table 4. Dominant species ranking based on density above 2% and bottom type. Bottom type, rank, faunal group, average density, percentage of density, and frequency (%) for each site among all sites are shown.
Bottom TypeRankGroupsSpeciesAverage Density (m2)% of DensityFrequency (%)
Sandy1PolychaetaArmandia lanceolata Wiley, 190529330100
2PolychaetaDorvillea matsushimaensis (Okuda in Ikuda and Yamada, 1954)2072167
3MolluskJactellina clathrata (Deshayes, 1835)50592
4MolluskCallista pilsbryi Habe, 196038492
5ArthropodaBubocorophium exolitus (Hirayama, 1984)35433
6PolychaetaAricidea sp.33367
7MolluskScintilla sp.27358
8PolychaetaSthenelais fusca Johnson, 189725358
9PolychaetaNotomastus latericeus Sars, 185120258
10PolychaetaPrionospio sp.20283
Rocky1MolluskLeiosolenus lischkei M. Huber, 201075819100
2MolluskCerithium alutaceum (A. Gould, 1861)325883
3BalanomorphaCantellius arcuatus (Hiro, 1938)300767
4PolychaetaLysidice collaris Grube, 18682506100
5PolychaetaNereis sp.2256100
6PolychaetaSyllis (Typosyllis) sp.2085100
7MolluskOnithohiton sp.142383
8PolychaetaEunice indica Kinberg, 1865125383
9MolluskChama limbula Lamarck, 1819100250
10MolluskCardita leana Dunker, 1860922100
Table 5. Results of two-way ANOVA analysis of bottom type and debris effects for macrobenthos.
Number of Species Density (ind./m2)Diversity Index (H’)
Bottom type (sandy/rocky)F value0.0619100.66712.513
p value0.807<0.0010.807
Debris (presence/absence)F value29.2070.8550.00246
p value<0.0010.3710.378
Bottom x debrisF value0.06190.8280.0111
p value0.0030.9610.917
Disclaimer/Publisher’s Note: The statements, opinions and data contained in all publications are solely those of the individual author(s) and contributor(s) and not of MDPI and/or the editor(s). MDPI and/or the editor(s) disclaim responsibility for any injury to people or property resulting from any ideas, methods, instructions or products referred to in the content.