Abstract
In this study, the monotonic and cyclic behavior of an offshore wind turbine with a monopile foundation installed in a sand layer were evaluated in the centrifuge. A simplified offshore wind turbine was modeled, and the lateral load was applied to the tower under displacement control. The monotonic loading test evaluated ultimate lateral load capacity and bending moment profiles under different loading levels. During cyclic loading, variations of moment-rotation responses, cyclic stiffness, and bending moments along the pile were observed. The initial rotational stiffness of the monopile decreased as the loading level increased. In the fatigue limit state (FLS) and service limit state (SLS) loading conditions, no noticeable variation in stiffness was observed with the number of cycles. However, in the ultimate limit state (ULS), the stiffness of the monopile increased during the first few cycles, followed by a decreasing rate of increase, and reached a certain value. The loading rate had a weakening effect on the monopile–soil interaction, which was supported by the bending moments induced in the monopile.
1. Introduction
After signing the Kyoto Protocol in 1997 by more than 160 countries, many countries have made efforts to control the environmental pollution caused by fossil fuels. Alternative reusable energy sources from water, wind, solar, and tidal power sources have been chosen to meet the environmental pollution problems. In particular, wind energy, one of the cleanest energies, was chosen to cope with the difficult pollution problems of many European countries, and offshore wind turbines have been growing up as a promising renewable energy source [1,2]. In the case of onshore wind farms, wind turbine installation is easier and faster than on offshore farms. However, it also has a lot of disadvantages, such as noise pollution and a high land acquisition price for wind turbine installation. Offshore wind turbines avoid these demerits and have an advantage due to higher wind speeds in offshore conditions.
Different foundation concepts can be chosen in order to support the offshore wind turbine. Of several types of foundations, monopiles are the most widely used for offshore wind turbines due to their proven stability and well-established design methods [3,4,5,6]. The diameter and penetration depth of the monopile depend to a large extent on the site conditions and capacity of the turbines [7]. Wind turbines with a rated power value of less than 3 MW are generally suitable for shallow water depths of less than 10 m and a pile diameter of less than 5 m. However, as large turbines with higher power generation capacity are needed to be installed at 15–30 m water depth, the demand for large diameter monopiles of 5–7 m has been growing [8,9].
In practice, the p–y curve is widely used for the prediction of the lateral behavior of monopiles. However, the original p–y curve is largely based on field tests on slender piles (i.e., long and small diameter) [3,4,10,11]. Even though applying the existing p–y method is limited to a certain condition, this approach has been broadly used to predict the lateral response of large-diameter monopiles. However, the behavior of the large-diameter piles themselves is relatively rigid compared to the small-diameter piles, so the pile rotates without noticeable deflection. Moreover, this tendency becomes extreme as the diameter increases. The problem of the application of the p–y method for large-diameter monopiles has been raised by various researchers [12,13,14,15,16]. In recent years, various alternative methods have been proposed to widen the applicability of the existing p–y method for monotonic lateral loads on non-slender piles [17,18,19].
Offshore foundations are typically exposed to complex load combinations from wind and waves in a cyclic manner, and such loads act on the foundation with different loading directions, levels, and rates during their lifetime [20]. DNV GL [6] noted that the environmental load imposed on a wind turbine should always be considered as one-way cyclic loading or two-way cyclic loading. Moreover, Bienen et al. [21] emphasized that large permanent displacements can occur when the direction of loading changes during a cycle. Meanwhile, the behaviors of the offshore foundation quite depend on the loading rate as well as the loading direction. A soil strain will gradually accumulate if the cyclic loading frequency is high enough to generate excess pore water pressure in the soil surrounding the offshore foundation. Hence, it decreases in overall strength and rigidity [22]. This implies that cyclic loads reduce the stiffness and bearing capacity of the soil, and the capacity may be lower under cyclic loading than under monotonic loading [23,24]. Byrne et al. [25] pointed out that serviceability requirements, rather than ultimate conditions, should determine the foundation design. The critical design criterion is that the permanent displacement should be lower than the service limit, typically 0.25° of accumulated rotations due to cyclic loading [6]. Moreover, the stiffness of the wind turbine system is significant, as the blade and rotor eigenfrequencies provide only a small range of frequencies suitable for design [21].
For monopile design considering the effect of cyclic loading, API [5] proposed the extended p–y method by adopting an empirical calibration factor from field cyclic loading tests, which results in a 70% degradation in the ultimate resistance of soil at seabed level. This degradation decreased linearly with depth down to z = 2.625D (here, D is the monopile diameter). Below this point, the p–y curve of monotonic loading is equal to that of cyclic loading. Such a design method leads to an overall softer behavior of the foundation compared to that of the monotonic loads. However, many questions have been raised as to whether the p–y method can be fully applied to large-diameter monopiles because the lateral behavior of large-diameter monopiles is affected by the number of cycles as well as load characteristics. Recently, many researchers proposed predicting the lateral cyclic response of large-diameter monopiles, such as the high-cycle accumulation model, through numerical analysis [8,26,27,28] and small-scale model tests [12,16,29]. Still, a clear conclusion has not been reached, as the cyclic behavior of large-diameter monopiles is very complex.
Soil–foundation–structure interaction (SFSI) is another key issue for designing the offshore wind turbine because the system’s natural frequency of the wind tower should have a safe margin from the governing loading frequencies (rotor frequency 1P and blade passing frequency 3P), including the wind and waves [30]. Several studies have been conducted to predict the dynamic performance of offshore structures. They pointed out that the cyclic stiffness between soil and foundations has a significant impact on the whole dynamic behavior of the offshore structures [31,32,33,34]. Nevertheless, there is still a lack of knowledge on the change in foundation stiffness depending on the cyclic loading level, number of cycles, cyclic loading frequency, and so on.
Therefore, in this study, a series of centrifuge model tests were performed to evaluate the cyclic behavior of the large-diameter monopile foundation in the sand layer under different cyclic loading levels and rates. In particular, the permanent displacement and stiffness variation of the soil–foundation system, which greatly affect offshore wind towers, were experimentally evaluated. In addition, soil–structure interaction behavior was investigated in the cyclic loading tests by measuring the bending moment transferred along the monopile.
2. Centrifuge Modelling
2.1. Facility
In geotechnical engineering, small-scale physical modeling is often conducted within a large centrifuge to provide correct scaling of the self-weight of structures and to simulate in situ soil stress conditions and prototype behavior accurately in a model test [35,36]. In this study, the C72–2 beam-type centrifuge model was used at the Korea Construction Engineering Development Collaboratory Program (KOCED) Geotechnical Centrifuge Testing Center installed at the Korea Advanced Institute of Science and Technology (KAIST). This model is a beam centrifuge with a radius of 5 m and a capacity of 240 g-tons. The general specifications of the centrifuge are listed in Table 1 [37].

Table 1.
Specification of KAIST centrifuge.
2.2. Modelling of Monopile
The National Renewable Energy Laboratory 5 MW wind turbine was used as a target structure for a small-scale wind turbine model because the detailed information on structural specification is open for research purposes [38]. The prototype wind turbine was first simplified to a flagpole model, which is comprised of hollow pipes and concentrated head mass, as suggested by [39]. Then, the wind turbine model was made to 1/4 the size of the simplified prototype turbine as a ‘virtual model’ due to the limitations of soil container size and allowable centrifugal acceleration. Iai et al. [40] presented a generalized scaling law that suggests a virtual model for modeling the large prototype model in the centrifuge tests. As described in Figure 1, in the first stage, the target structure was modeled as a simplified model by replacing a turbine blade part with a lumped mass having the same natural period as the blade part. In the second stage, the simplified model was scaled down to the 1/4 virtual model. In the final stage, the virtual model was again scaled down to a ratio of 50:1, considering the centrifuge scaling law [36]. Based on this method, the dimensions of the scaled model were further scaled without increasing the centrifugal acceleration. The details of the model simplification can be found in Seong et al. [41]. The scaling ratio of 50:1 was selected in order to minimize the rigid container boundary effect. Kim et al. [42] evaluated the rigid container boundary effect through the cone penetration test (CPT) in the centrifuge. They suggested that the boundary effect was negligible when the spacing between the rigid wall and CPT was seven times the CPT diameter or more. In this study, the boundary effect is therefore expected to be negligible because the spacing is more than ten times the monopile diameter in all experiments.
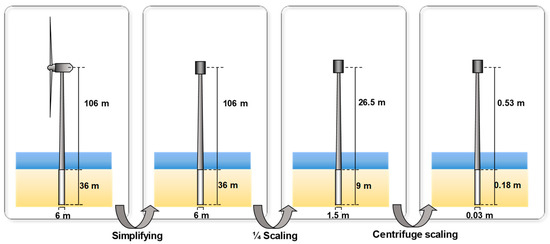
Figure 1.
Schematics of monopile modeling.
The turbine model was manufactured with aluminum 7075 to ensure its stability. The turbine model was divided into three parts (lumped mass, tower, and monopile), and the bolt connections at each end of the tower part allow easy attachment to the lumped mass and the pile part. The dimensions of the turbine model are 30 mm (diameter, D), 180 mm (pile length, LP), 508 mm (tower length, LT), and 2.5 mm (model thickness, t), representing 1.5 m × 34.4 m × 1.25 mm in 1/4 prototype scale. The specifications of the dimensions are tabulated in Table 2. The conventional range for the ratio of wall thickness to the diameter of a pile is approximately 0.3% to 0.6%. However, recent case studies on the large-diameter monopile with a thick wall thickness ranging from 2% to 4.4% have also been reported [8,21,43,44]. In this study, due to limitations in model fabrication, the wall thickness is 2.5 mm, resulting in a ratio of wall thickness to diameter of 8.3%. Although the thickness ratio is somewhat larger than the conventional one, the results were consistently analyzed by considering the flexural rigidity, EI, of the manufactured monopile. To measure the bending load transferred from the structure–soil interaction, pairs of 11 strain gauges were attached along the tower, and each pair was installed at 180° with respect to the cross-section of the pile. All strain gauges were coated with a solvent-thinned polyurethane protective coating and insulation tape for protection purposes. Figure 2 shows a cross-section of the turbine model.

Table 2.
Specific dimensions of monopile models.
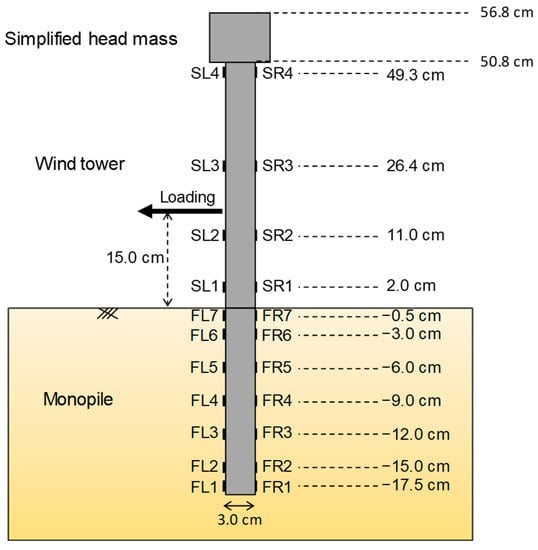
Figure 2.
Cross section diagram of the monopile.
2.3. Soil Preparation
Silica sand artificially produced by the hammer crusher method was used in the centrifuge test. According to the Unified Soil Classification System (USCS), silica sand is classified as poorly graded sand (SP) with a mean particle size of D50 = 0.235 mm. The silica sand used in this study has advantages such as relatively accurate density control and uniform particle size. Moreover, the particle size effect is minimal for the centrifuge test because the mean particle size (D50) is quite small, so the effect of the particle size on interfacial problems between sand particles and pile surfaces is negligible [44]. Table 3 lists the general properties of silica sand [45]. A sand-raining method was used in this study to reconstruct the ground model. This method is proven to have repeatable relative density results for the prepared model [46,47]. Using the sand raining system, the dry silica sand was poured into a cylindrical soil box with a target relative density (Dr) of 80%. The height of the ground model was 500 mm on the model scale and 25 m on the prototype scale.

Table 3.
Basic soil properties of silica sand.
2.4. Testing System
Figure 3 shows a schematic diagram of a cyclic testing system mounted in the centrifuge. A horizontal load actuator was used to apply a lateral load to the monopile under displacement control. The loading capacity and maximum loading speed of the linear actuator are 10 kN and 8.3 mm/s, respectively, in the model scale. It consists of a linear servo motor driver (Mitsubishi, MR-J2S-40A, 400W) and controller (National Instruments, NI PCI-7390, 4-axis motion controller) [44]. In all the tests performed in this study, the lateral load was subjected to a predetermined height of 150 mm (5D; here, D indicates the external diameter of the monopile) on a model scale above the sea floor due to considerable rollover moments and lateral loads.
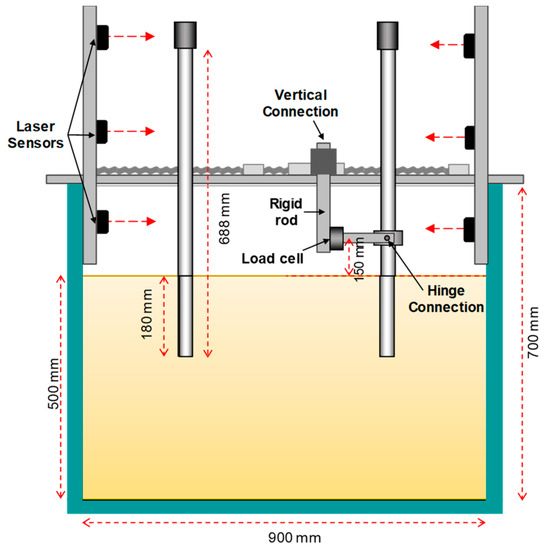
Figure 3.
Cross-section diagram and photograph of the monopile.
The actuator was connected to a vertical connector, then to a hinge connection, as shown in Figure 4. With this system, the lateral loading can be transferred to the monopile, and the load is measured using a load cell installed next to the hinge connection. Three laser sensors were installed to measure the rotational and horizontal displacement of the monopile (located at 270 mm, 360 mm, and 540 mm above the ground, respectively). The data measured by the transducers were collected at a sampling rate of 10 Hz.
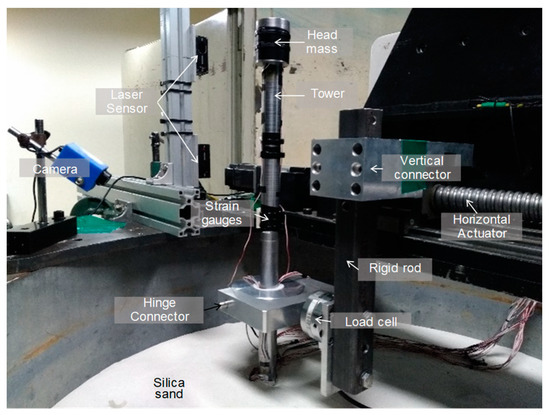
Figure 4.
Photograph of the testing equipment.
3. Testing Procedure and Program
3.1. Determination of Ultimate Load Capacity
Monotonic loading tests were performed to determine the ultimate capacity of the monopile. At the target g-level, the horizontal load was applied at a given height of the monopile (5D from the seabed) by moving the horizontal actuator at a constant rate. Figure 5 shows the load-displacement curve. In the figure, straight lines were fitted to the initial stiff elastic section and the more flexible plastic section. The intersection is used to define an ultimate load following Villalobos [48], and it was approximately 2000 kN on a prototype scale. The capacity was used to define the loading levels in the cyclic tests. As a method of defining cyclic loading level, DNV GL [6] proposed the following design load states: (1) the ultimate limit state (ULS), related to the ultimate capacities (ULS: denoted by VU); (2) the serviceability limit state (SLS), which occurs approximately 102 times during the lifetime of the wind turbine; and (3) the fatigue limit state (FLS), which occurs approximately 107 times during the lifetime of the wind turbine. The SLS is estimated at 50% of the ULS and the FLS at 30% of the ULS [6]. The limit state loads were used as the cyclic loading level, respectively. These are explained in detail in Section 4.3.
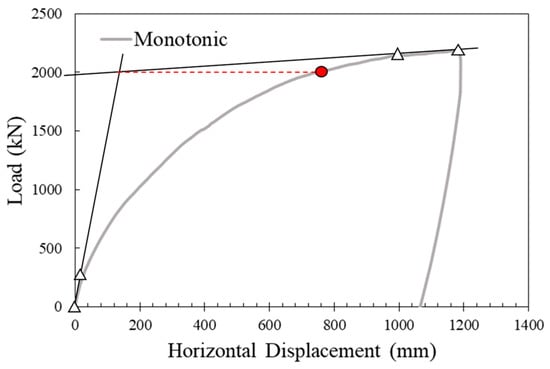
Figure 5.
Determination of ultimate capacity from the monotonic load test (red circle in the figure indicates the ultimate capacity).
3.2. Testing Procedure and Program
After soil preparation, the monopile was installed into the sand by employing the jacking method at 1 g. The monopile was penetrated slowly, at 1 mm per hit, using a rubber hammer. A guiding system and two inclinometers maintain the verticality of the monopile during the installation. All monopiles in this study were penetrated using the same installation method to ensure the consistency of the experiment. The prepared soil model with monopile was carefully rested on the centrifuge basket, and the linear actuator and sensors were installed. Then, the centrifuge was ramped up to the target g-level (50 g) at 2 g/min and maintained the spinning level for 10 min after reaching the target g-level to stabilize the settlement of the soil.
Two types of centrifuge tests were conducted: monotonic and cyclic tests. The monotonic tests were performed to obtain the ultimate bearing capacity of the monopile under the lateral load. Here, two loading rates were selected to evaluate the loading rate effect: 0.2 mm/s and 2 mm/s in the model scale. In cyclic loading tests, the effects of loading level (0.3 ULS, 0.5 ULS, and ULS), number of cycles, and loading rate (0.2- and 2-mm/s) on the cyclic behavior of the monopile were evaluated. All experiments were performed at a centrifugal acceleration of 50 g with recorded values representing the prototype scale, and all testing conditions are listed in Table 4. The results of cyclic load tests were analyzed following the definitions of cyclic loading stiffness and permanent displacement illustrated in Figure 6. According to the established centrifuge scaling laws based on dimensional analyses [36], all values recorded in this study are converted to the prototype scales. This conversion was conducted using the equation Fp = Fm·N2, where Fp and Fm are the loads in prototype and model scale, respectively, and N is the centrifugal acceleration relative to the Earth’s gravity (g).

Table 4.
Testing program.
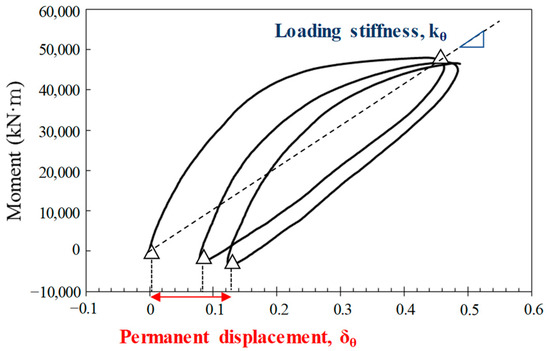
Figure 6.
Definitions of cyclic loading stiffness and permanent displacement.
4. Test Results and Analysis
4.1. Criteria for Rigid and Flexible Behavior
When analyzing the soil–foundation interaction of the pile, a distinction of behavior should be considered between rigid and flexible [49]. The rigid pile rotates without significant bending, creating a “toe kick” under moments and lateral loads [50]. On the other hand, the flexible pile is characterized by structural bending without movement at the pile toe. The determination of the rigid or flexible behavior of the monopile has been proposed by various researchers (e.g., [51,52]). According to Poulos and Hull [53], the range of transition from flexible to rigid pile behavior is:
where = the elastic modulus of the soil, = the embedded depth of the pile, = the elastic modulus of the pile, and = moment of inertia of the pile. Substituting the properties of the soil and the monopile model into Equation (1), the transition from rigid to flexible pile behavior becomes in the range from = 19.5 MPa to = 1570 MPa. The elastic modulus of the soil used in this experiment is within this range, so the behavior of the monopile tends toward the rigid and flexible cases.
4.2. Permanent Displacement and Rotational Stiffness of Monopile
The rotation of offshore wind turbines refers to the inclination of the monopile axis in relation to the horizontal plane. The rotation of the foundation has a significant impact on the performance and stability of the wind turbine. Even a small amount of accumulated rotation can greatly reduce the optimization of energy production for offshore wind turbines [1,24]. Therefore, evaluating and predicting the displacement of the foundation is of utmost importance. Accurately estimating the accumulated deformation of the structure over its design life is crucial, and serviceability requirements typically constrain it. According to DNV GL [6] and Peire et al. [54], the recommended serviceability design limits for tilt rotations of offshore wind turbines are 0.25° during installation and 0.25° during operation, respectively.
In this study, the rotational displacement of a monopile was measured based on the cyclic test results of the monopile foundation. Figure 7 presents graphs depicting the rotational displacement, referred to as a permanent rotation, which occurs when a load is applied and subsequently unloaded until the load magnitude reaches zero. In other words, the displacement values themselves do not represent the absolute displacement of the turbine but rather indicate the relative magnitude of displacement. Due to the relative displacement, it is not possible to observe the absolute tilt of the monopile. However, it can be used to analyze and predict variations in monopile displacement.
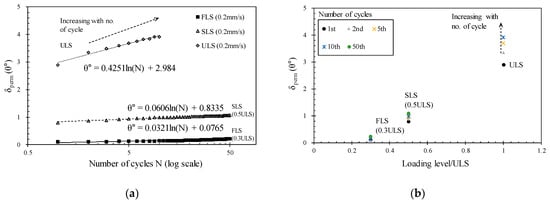
Figure 7.
Permanent displacement of the monopile with (a) number of cycles and (b) loading level ratio.
This graph represents the experimental results for three different magnitudes of loads under three conditions. In all three experiments, the rate of load application was 0.2 mm/s. The square markers represent the results under the FLS condition (30% of ULS), the triangle markers represent the results under the SLS condition (50% of ULS), and the diamond markers represent the results under the ULS load condition. In both graphs, the y-axis represents the permanent displacement. In graph Figure 7a, the x-axis represents the number of load cycles, while in graph Figure 7b, the x-axis represents the ratio of the load magnitude to the ultimate limit state (ULS) load value. In all three experiments, the permanent displacement increased with an increase in the number of load cycles. However, the degree of increase in displacement depends on the magnitude of the load. The slope of the trend line in Figure 7a represents the increase in permanent displacement with an increase in the number of load cycles. The slopes for the three experiments are 0.0321 (FLS experiment), 0.0606 (SLS experiment), and 0.4251 (ULS experiment).
The results of the slope values show that permanent displacement occurs to a very small extent when the load magnitude does not exceed 50% of the ultimate limit state (ULS). Moreover, the trend lines of permanent displacement in the cases of FLS and SLS are represented by a logarithmic function. This means that the majority of displacement occurs during the early stages of the number of cycles and gradually stabilizes to reach a steady state. Similar results were also observed in axial pipe–soil friction tests conducted by Boylan et al. [55], where soil densification and stabilization were observed. This implies that the occurrence of initial densification is due to the initial loading prior to long-term steady state behavior. However, when the load magnitude is at the ULS level, the permanent displacement increases significantly. In the case of the ULS load experiment, even after a few load cycles, the soil adjacent to the monopile undergoes compression, resulting in a reduction in the soil volume and subsequent loosening between the monopole and the soil. Consequently, it leads to a decrease in reaction forces.
The trends in the permanent displacements of the monopile according to the loading level and the number of cycles can also be explained by rotational stiffness graphs. Figure 8 shows the rotational stiffness of the monopile according to the loading level and the number of cycles. Generally, a smaller loading level results in a larger rotational stiffness, which aligns with the results in Figure 7. As a result, smaller permanent displacements are observed. However, the changes in stiffness with the number of cycles are different depending on the loading level. In the FLS and SLS experiments where the load magnitude does not exceed 50% of the ULS, the stiffness gradually increases during the initial cycles (within five cycles). Still, thereafter, it reaches convergence without further increases. During the initial stages of repeated loading, the monopile experiences soil densification as a result of its movement under load, leading to a gradual increase in stiffness.
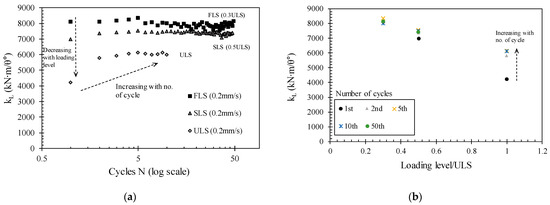
Figure 8.
Cyclic rotational stiffness of monopile with (a) number of cycles and (b) loading level ratio.
However, as the relative density of the soil used in this experiment is rather large at 80%, the soil does not continue to be compacted, and the stiffness tends to converge. This observation can be explained more clearly when compared to the results of Jeong et al. [56]. In the results of the rotational stiffness of the tripod suction bucket foundation in Jeong et al. [56], the rotational stiffness gradually increases at the FLS or SLS load levels. As the number of cycles increases, the stiffness of the foundation increases continuously, although the rate of increase decreases continuously. In these tests, soil densification continues to occur because the relative density of surface soil is Dr = 40%. On the other hand, in the ULS load tests, the loading level is significantly high, resulting in a substantial increase in stiffness during the initial cycles of repeated loading. Once the number of load cycles exceeds five, a gradual increase in stiffness can be observed, and finally, it reaches a certain value.
4.3. Cyclic Loading Rate Effects on the Monopile
The variation of monopile stiffness in response to the rate of repeated loading was evaluated. Generally, the rate effects of loading are explained by the excess pore water pressure generation induced by the cyclic loading [21,24]. However, in this study, all of the tests were performed in dry soil conditions to analyze the rate effects, excluding the influence of pore pressure. Therefore, the difference in the behavior of the monopile depending on the strain rate can be identified.
Figure 9 presents the rotational stiffness results according to the differences in load rates for the FLS, SLS, and ULS experiments. Figure 9a shows the variation in stiffness for six experiments under different loading rates and load levels. The load rates were chosen to be 0.2 mm/s and 2 mm/s on a model scale under FLS, SLS, and ULS loading levels for each rate, respectively.
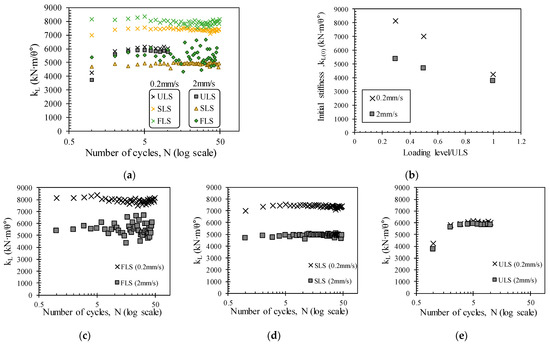
Figure 9.
Cyclic rotational stiffness of monopile with loading rate with (a) number of cycles; (b) loading level ratio; and results of (c) FLS tests; (d) SLS tests; and (e) ULS tests.
In all experiments, a faster loading rate resulted in lower stiffness values. This trend appears to be more prominent in experiments with smaller loads that do not exceed 50% of the ultimate limit state (ULS). Similar results were found in Jeong et al. [57] and Bienen et al. [21], where compressive cyclic loading experiments of a single bucket foundation were conducted via the centrifuge model tests. These studies demonstrated that faster loading rates were associated with lower stiffness in the case of FLS and SLS tests, which aligns with the findings of the present study and is consistent with the results of this study. Typically, faster loading rates induce an increase in pore water pressure, leading to a decrease in effective stress and ultimately resulting in a decrease in ground stiffness [21,24]. However, from the results of this experiment, it can be inferred that even in dry sand deposits, a higher load rate results in greater displacements and lower stiffness, independent of the increase in pore water pressure. It is also noted that the variation in stiffness with the number of cycles is more influenced by the loading level than the loading rate, as shown in Figure 9c–e. The faster loading rate resulted in lower soil stiffness, and this effect is more dominant when the load magnitude is smaller. However, the increase in stiffness due to repeated loading is not greatly affected by the loading speed. LeBlanc et al. [50] also emphasized that the loading rate effects are very significant in interpreting soil response under cyclic loads. Therefore, when designing the foundation for an offshore wind turbine, it is essential to consider the changes in soil stiffness caused by the loading level and the loading rate.
4.4. Bending Moment Distribution of the Monotonic Load Tests
The bending moment load distributions were monitored during the monotonic load test by the strain gauges installed along the pile shaft. It should be noted that the loading was applied by the movement of the actuator at two different constant displacement rates of 0.2 mm/s (Test 1, model scale) and 2 mm/s (Test 2, model scale). Figure 10 shows the bending moment curves for the different lateral loads applied at the loading point (0.3, 0.6, 0.9, 1.2, 1.5, 1.8, 2 MN). These representative loads were selected from the load-displacement curves for each test. The bending moment measured at each location increased from the seabed with increasing depth up to 3 m and then decreased to zero at the toe of the monopile. The bending moment at a certain depth increased with increasing lateral loads until the load reached its ultimate value. In addition, the depth at which the maximum bending moment occurred was almost constant at approximately D (monopile diameter), regardless of the loading level for both tests. However, at the same loading level, the maximum bending moment of Test 1 (slow loading rate) had a 7% lower value than Test 2 (fast loading rate). It can be seen that the soil deformation induced by the pile load is dependent on the loading rate under the testing conditions, as the tests were conducted in dry sand, indicating no generation of excess pore pressure.
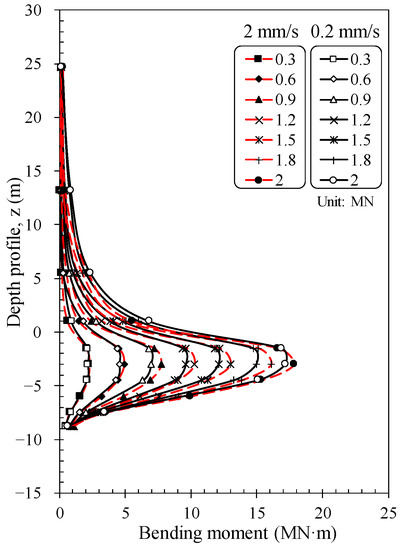
Figure 10.
Bending moment profile (monotonic tests).
Based on the measured bending moment profiles, 5th polynomial fitting curves were obtained, as suggested by Wilson [58]. It provides the best mathematical estimation of the measured bending moment in the monopile [18].
Here, an exponent of 2.5 within Equation (2) is used to satisfy the requirement that the soil reaction pressure at the soil surface must be zero (0). For instance, the second derivative of the bending moment equals the minus of the soil pressure p (soil reaction per unit length of the monopile), and it should be zero at the soil surface (). The six coefficients can be obtained from the best-fitting curve of the 5th-order polynomial function. The pile deflection along the depth can be calculated by double integration of the bending moment profile divided by the flexural modulus of the monopile (, elastic modulus multiplied by the moment of inertia of the monopile cross-section area).
where y is the lateral deflection at the depth of the monopile. Here, special care is required when double-integrating the regression of the bending moment profile with the polynomial method because significant errors can occur during the integration of a high-order function. In addition, Choo and Kim [18] described that the pile deflection calculated by the double integration of the moment profile needed to be calibrated to match the measured displacements of the exposed portion of the monopile because the rotation angle and deflection at the pile toe were not zero for the friction pile. In this study, the deflection of the pile was calculated by considering the lateral displacement of the pile and rotational angle at the soil surface (indicated as y0 and r0, respectively). Two laser sensors adjacent to the ground surface were used to calculate y0 and r0 following the suggested method proposed by Klinkvort [59].
Figure 11 presents the lateral deflection of the monopile with different loading levels. Overall, rotational behavior was dominant, but horizontal translation occurred along with rotation as the loading level increased. It is noted that the deflection of the monopile is similar to that of the short (rigid) pile under lateral load. The reasons for the rigid rotational behavior of the monopile with some translation under lateral loading are: (1) low pile embedded depth (6D; here, D indicates external pile diameter); (2) thick pile tip thickness (D/t = 12) compared to that of the conventional monopile (D/t ≈ 40); and (3) low loading point from the ground surface (5D). Comparing the behavior of the monopile under different loading rates, it can be seen that the pile displacements under the higher loading rate condition (2 mm/s) are higher than those of the monopile under the low loading rate condition (0.2 mm/s). Moreover, the difference in displacement for both testing cases increases with increasing loading levels. The results indicated that the higher the loading rate, the more deformation is induced at the same loading level due to the rate effect of the soil, as mentioned before.
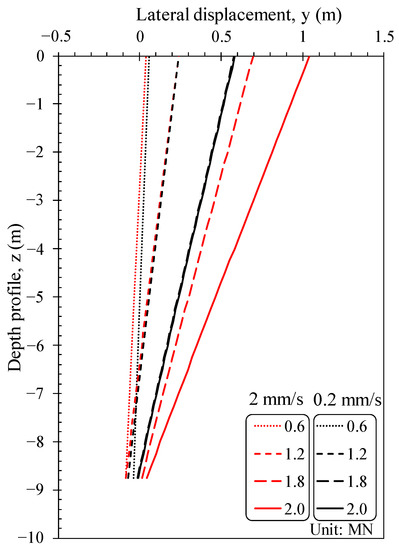
Figure 11.
Distribution along the monopile shaft of lateral pile deflection.
4.5. Bending Moment Distribution of the Cyclic Load Tests
Figure 12 represents the bending moment profiles of the monopile under cyclic loading, which are induced by the 1st, 3rd, 4-, 8-, and 10-th cycles for the initial ULS loading level and the 1st, 3rd, 4-, 8-, 10-, 20-, 30-, and 50-th cycles for the initial FLS and SLS loading levels, respectively. As anticipated, the bending moment in the pile increases with the loading level (FLS, SLS, and ULS). In addition, the position where the maximum bending moment occurred was nearly constant at about 1D regardless of the loading level (FLS, SLS, and ULS). However, it is noted that the monopile bending moment decreased with the number of cycles. This is because the cyclic load was applied under displacement control at a certain loading rate, so the load acting on the pile and soil gradually decreased as the number of cyclic loads increased. In other words, accumulated soil deformation due to the cyclic load reduces the load acting on the pile and soil, resulting in a reduction in the acting load on the pile. It is also due to the fact that the soil adjacent to the pile is gradually densified as the load is repeated so that the stress acting on the pile is released, indicating the soil reaction has gradually decreased [60]. In the figure, a reduction in the maximum bending moment with the number of cycles was more prominent at the higher loading level (ULS). Again, the higher the loading level, the higher the soil densification occurs. Hence, the maximum bending moment generated by the lateral load is also greatly reduced.
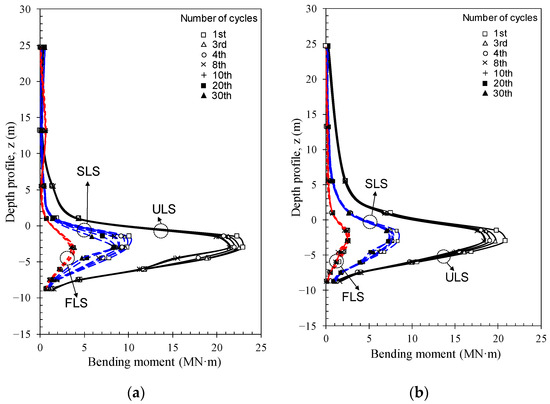
Figure 12.
Bending moment profiles of the monopile during cycling with loading rate of (a) 0.2 mm/s and (b) 2 mm/s.
Figure 13 shows the ratio of maximum bending moment measured at each loading cycle to that of the initial load cycle under ULS condition [Mmax/(Mmax)int]. The graph clearly shows that the reduction of the maximum moment is remarkable under the condition of high cyclic loading rate. The ratio induced by 10th cycle was Mmax/(Mmax)int = 0.88 for fast repeated loading rate (2 mm/s in model scale) and Mmax/(Mmax)int = 0.93 for slow repeated loading rate (0.2 mm/s in model scale). The test conducted at the faster loading rate indicates a maximum bending moment reduction of about 5% rather than that of the slow loading test. This rate dependency behavior of the monopile was also observed in the field tests [61,62].
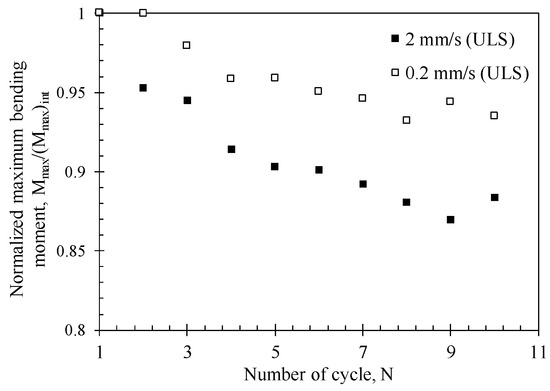
Figure 13.
Normalized bending moment trend in ULS tests.
It is also noted worthy that the reduction ratio [Mmax/(Mmax)int] was greatly decreased within a few number of cycles and then converged with number of cycles. The initial displacement behavior is dominant for first few number of cycles and then it reaches the plateau where it stabilizes. Similar observation was noted in suction bucket foundation for cyclic loading tests (Jeong et al. [2,56,63]) and pile-soil friction tests (Uesugi et al., Boylan et al.) [55,64].
5. Conclusions
A series of centrifuge tests were conducted to evaluate the monotonic and cyclic behavior of a large-diameter monopile installed in dry sand. The effects of loading level, number of cycles, and loading rates were investigated through the tests. Firstly, the load-displacement response and stiffness variation were assessed for monotonic and cyclic loading levels. Secondly, bending moment development under monotonic and cyclic loads was evaluated. In these tests, the wind tower and turbine were simplified as a hollow tower with a centroid head mass using 1 g and centrifuge scaling laws. The lateral load was applied by utilizing an actuator mounted on the soil container to induce a constant rated displacement on the monopile. The following conclusions were drawn based on the interpretation of the centrifuge model test:
- As the loading level increased, the initial stiffness (kθ(0)) decreased with the loading level due to the nonlinearity of the soil. For the FLS and SLS tests (0.3 ULS and 0.5 ULS), the stiffness was nearly constant with the number of cycles, indicating the entire wind turbine system’s behavior was almost unaffected by the cyclic load. However, for the ULS test, the stiffness of the monopile gradually increased in the initial few cycles and then converged to a certain value. The lateral loading rate affects the stiffness response of the monopile.
- The monopile bending moment increases with the lateral loading level for monotonic tests. The position with the maximum bending moment remained consistent at about 1D depth, regardless of the loading level and loading rate. However, the larger the bending moment monitored, the higher the loading rate. This resulted in large pile deformation at the same lateral load.
- When the monopile was subjected to cyclic loading with FLS and SLS levels, the variation of the bending moment profiles with the number of cycles was insignificant. However, for the large cyclic loading test (ULS), the maximum bending moment gradually decreased as the number of loads increased. The reduction in the maximum bending moment occurred mainly at the initial few cycles and converged.
- The cyclic loading rate effect was prominent in the ULS state. It was confirmed that the faster the loading rate, the larger the reduction in the maximum bending moment due to the densification of the soil adjacent to the pile.
In this study, the centrifuge test was conducted on a monopile thicker than the typical wall thickness (8.3% of the monopile diameter). Moreover, the installation process was not simulated, which can significantly affect the behavior of the monopile. The number of cycles and displacement-controlled loading tests are also limited to specific conditions. Therefore, the results of this study are valid only for specific experimental conditions, and more extensive experimental studies are needed to understand the behavior of various monopiles.
Author Contributions
Conceptualization, H.-J.P., Y.-H.J. and J.-G.H.; data curation, Y.-H.J., J.-H.K. and H.-J.P.; writing—original draft preparation, J.-H.K. and Y.-H.J.; writing—review and editing, H.-J.P. and Y.-H.J.; supervision, H.-J.P.; project administration, H.-J.P.; formal analysis, J.-H.K. and J.-G.H.; investigation, Y.-H.J. All authors have read and agreed to the published version of the manuscript.
Funding
This study was supported by the Research Program funded by SeoulTech (Seoul National University of Science and Technology).
Institutional Review Board Statement
Not applicable.
Informed Consent Statement
Not applicable.
Data Availability Statement
Not applicable.
Conflicts of Interest
The authors declare no conflict of interest.
References
- Houlsby, G.T.; Ibsen, L.B.; Byrne, B.W. Suction caissons for wind turbines. In Frontiers in Offshore Geotechnics: ISFOG, Perth, WA, Australia; CRC Press: Boca Raton, FL, USA, 2005; pp. 75–93. [Google Scholar]
- Jeong, Y.H.; Kim, J.H.; Park, H.J.; Kim, D.S. Cyclic behavior of unit bucket for tripod foundation system supporting offshore wind turbine via model tests. Wind. Energy 2019, 22, 257–268. [Google Scholar] [CrossRef]
- Matlock, H. Correlations for design of laterally loaded piles in soft clay. In Proceedings of the 2nd Offshore Technology Conference, Richardson, TX, USA, 21–23 April 1970; pp. 577–594. [Google Scholar]
- Reese, L.C.; Cox, W.R.; Koop, F.D. Analysis of laterally loaded piles in sand. In Proceedings of the Offshore Technology Conference, Houston, TX, USA, 5–7 May 1974; pp. 473–483. [Google Scholar]
- American Petroleum Institute. Recommended Practice 2GEO—Geotechnical and Foundation Design Considerations, 22nd ed.; RP2A-WSD; American Petroleum Institute: Washington, DC, USA, 2014. [Google Scholar]
- DNVGL-ST-0126; Support Structures for Wind Turbines. Det Norske Veritas: Oslo, Norway, 2018.
- Arany, L.; Bhattacharya, S.; Macdonald, J.H.; Hogan, S.J. Closed form solution of Eigen frequency of monopile supported offshore wind turbines in deeper waters incorporating stiffness of substructure and SSI. Soil Dyn. Earthq. Eng. 2016, 83, 18–32. [Google Scholar] [CrossRef]
- Achmus, M.; Kuo, Y.S.; Abdel-Rahman, K. Behavior of monopile foundations under cyclic lateral load. Comput. Geotech. 2009, 36, 725–735. [Google Scholar] [CrossRef]
- LeBlanc, C.; Houlsby, G.T.; Byrne, B.W. Response of stiff piles in sand to long-term cyclic lateral loading. Géotechnique 2010, 60, 79–90. [Google Scholar] [CrossRef]
- Murchison, J.M.; O’Neill, M.W. Evaluation of p-y relationships in cohesionless soils. In Analysis and Design of Pile Foundations; ASCE: Reston, VA, USA, 1984; pp. 174–191. [Google Scholar]
- American Petroleum Institute. Recommended Practice for Planning. Designing and Constructing Fixed Offshore Platforms—Working Stress Design. RP2A-WSD, 20th ed.; API: Houston, TX, USA, 2000. [Google Scholar]
- Klinkvort, R.T.; Leth, C.T.; Hededal, O. Centrifuge modelling of a laterally cyclic loaded pile. Int. J. Phys. Model. 2010, 7, 959–964. [Google Scholar]
- Hearn, E.N.; Edgers, L. Finite element analysis of an offshore wind turbine monopile. In GeoFlorida 2010: Advances in Analysis, Modeling & Design; ASCE: Reston, VA, USA, 2010; pp. 1857–1865. [Google Scholar]
- Doherty, P.; Gavin, K. Laterally loaded monopile design for offshore wind farms. Proc. Inst. Civ. Eng. Energy 2012, 165, 7–17. [Google Scholar] [CrossRef]
- Haiderali, A.; Cilingir, U.; Madabhushi, G. Lateral and axial capacity of monopiles for offshore wind turbines. Indian Geotech. J. 2013, 43, 181–194. [Google Scholar] [CrossRef]
- Frick, D.; Achmus, M. An experimental study on the parameters affecting the cyclic lateral response of monopiles for offshore wind turbines in sand. Soils Found. 2020, 60, 1570–1587. [Google Scholar] [CrossRef]
- Thieken, K.; Achmus, M.; Lemke, K.; Terceros, M. Evaluation of p-y approaches for large-diameter monopiles in sand. Int. J. Offshore Polar Eng. 2015, 25, 134–144. [Google Scholar] [CrossRef]
- Choo, Y.W.; Kim, D. Experimental development of the p-y relationship for large-diameter offshore monopiles in sands: Centrifuge tests. J. Geotech. Geoenviron. 2016, 142, 04015058. [Google Scholar] [CrossRef]
- Djillali, A.M. Numerical investigation of large-diameter monopiles in sands: Critical review and evaluation of both API and newly proposed p-y curves. Int. J. Geomech. 2018, 18, 04018141. [Google Scholar]
- Rudolph, C.; Bienen, B.; Grabe, J. Effect of variation of the loading direction on the displacement accumulation of large-diameter piles under cyclic lateral loading in sand. Can. Geotech. J. 2014, 51, 1196–1206. [Google Scholar] [CrossRef]
- Bienen, B.; Klinkvort, R.T.; O’Loughlin, C.D.; Zhu, F.; Byrne, B.W. Suction caissons in dense sand, part I: Installation, limiting capacity and drainage. Géotechnique 2018, 68, 937–952. [Google Scholar] [CrossRef]
- Zhu, B.; Ren, J.; Yuan, S.; Zhu, J.; Yang, Q.; Gao, Y.; Kong, D. Centrifuge modeling of monotonic and cyclic lateral behavior of monopiles in sand. J. Geotech. Geoenviron. 2021, 147, 04021058. [Google Scholar] [CrossRef]
- Foglia, A.; Ibsen, L.B.; Andersen, L.V.; Roesen, H.R. Physical modelling of bucket foundation under long-term cyclic lateral loading. In Proceedings of the Twenty-Second International Offshore and Polar Engineering Conference, Rhodes, Greece, 17–22 June 2012. [Google Scholar]
- Andersen, K.H. Bearing capacity under cyclic loading—Offshore, along the coast, and on land. Can. Geotech. J. 2009, 46, 513–535. [Google Scholar] [CrossRef]
- Byrne, B.W.; Houlsby, G.T. Experimental investigations of the response of suction caissons to transient combined loading. J. Geotech. Geoenviron. 2004, 130, 240–253. [Google Scholar] [CrossRef]
- Staubach, P.; Machaček, J.; Tafili, M.; Wichtmann, T. A high-cycle accumulation model for clay and its application to monopile foundations. Acta Geotech. 2022, 17, 677–698. [Google Scholar] [CrossRef]
- Achmus, M.; Abdel-Rahman, K.; Peralta, P. On the Design of Monopile Foundations with Respect to Static and Quasi-Static Cyclic Loading; European Wind Energy Association: Brussels, Belgium, 2005. [Google Scholar]
- Kuo, Y.S.; Achmus, M.; Abdel-Rahman, K. Minimum embedded length of cyclic horizontally loaded monopiles. J. Geotech. Geoenviron. 2012, 138, 357–363. [Google Scholar] [CrossRef]
- Møller, I.F.; Christiansen, T.H. Laterally Loaded Monopile in Dry and Saturated Sand-Static and Cyclic Loading: Experimental and Numerical Studies. Master’s Thesis, Aalborg University, Aalborg, Denmark, 2011. [Google Scholar]
- Bhattacharya, S.; Adhikari, S. Experimental validation of soil–structure interaction of offshore wind turbines. Soil Dyn. Earthq. Eng. 2011, 31, 805–816. [Google Scholar] [CrossRef]
- Scharff, R.; Siems, M. Monopile foundations for offshore wind turbines–solutions for greater water depths. Steel Constr. 2013, 6, 47–53. [Google Scholar] [CrossRef]
- Li, Z.; Haigh, S.K.; Bolton, M.D. Centrifuge modelling of mono-pile under cyclic lateral loads. In Proceedings of the 7th International Conference of Physical Modelling in Geotechnics, Zurich, Switzerland, 27 June–2 July 2010; pp. 965–970. [Google Scholar]
- Klinkvort, R.T.; Hededal, O. Lateral response of monopile supporting an offshore wind turbine. In Proceedings of the Institution of Civil Engineers-Geotechnical Engineering; ICE Publishing: London, UK, 2013; Volume 166, pp. 147–158. [Google Scholar]
- Su, L.; Lu, J.; Elgamal, A.; Arulmoli, A.K. Seismic performance of a pile-supported wharf: Three-dimensional finite element simulation. Soil Dyn. Earthq. Eng. 2017, 95, 167–179. [Google Scholar] [CrossRef]
- Schofield, A.N. Cambridge geotechnical centrifuge operations. Geotechnique 1980, 30, 227–268. [Google Scholar] [CrossRef]
- Taylor, R.E. Geotechnical Centrifuge Technology; CRC Press: Boca Raton, FL, USA, 2018. [Google Scholar]
- Kim, D.S.; Kim, N.R.; Choo, Y.W.; Cho, G.C. A newly developed state-of-the-art geotechnical centrifuge in Korea. KSCE J. Civ. Eng. 2013, 17, 77–84. [Google Scholar] [CrossRef]
- Jonkman, J.; Butterfield, S.; Musial, W.; Scott, G. Definition of a 5-MW Reference Wind Turbine for Offshore System Development (No. NREL/TP-500-38060); National Renewable Energy Lab. (NREL): Golden, CO, USA, 2009.
- Van der Tempel, J.; Molenaar, D.P. Wind turbine structural dynamics—A review of the principles for modern power generation, onshore and offshore. Wind. Eng. 2002, 26, 211–222. [Google Scholar] [CrossRef]
- Iai, S.; Tobita, T.; Nakahara, T. Generalised scaling relations for dynamic centrifuge tests. Geotechnique 2005, 55, 355–362. [Google Scholar] [CrossRef]
- Seong, J.T.; Ha, J.G.; Kim, J.H.; Park, H.J.; Kim, D.S. Centrifuge modeling to evaluate natural frequency and seismic behavior of offshore wind turbine considering SFSI. Wind. Energy 2017, 20, 1787–1800. [Google Scholar] [CrossRef]
- Kim, J.H.; Choo, Y.W.; Kim, D.J.; Kim, D.S. Miniature cone tip resistance on sand in a centrifuge. J. Geotech. Geoenviron. 2016, 142, 04015090. [Google Scholar] [CrossRef]
- Haiderali, A.; Nakashima, M.; Madabhushi, S. Cyclic lateral loading of monopiles for offshore wind turbines. In Frontiers in Offshore Geotechnics III, 1st ed.; Meyer, V., Ed.; CRC Press: Oslo, Norway, 2015; pp. 711–716. [Google Scholar]
- Choo, Y.W.; Kim, D.; Park, J.H.; Kwak, K.; Kim, J.H.; Kim, D.S. Lateral response of large-diameter monopiles for offshore wind turbines from centrifuge model tests. Geotech. Test. 2014, 37, 107–120. [Google Scholar] [CrossRef]
- Jo, S.B.; Ha, J.G.; Yoo, M.; Choo, Y.W.; Kim, D.S. Seismic behavior of an inverted T-shape flexible retaining wall via dynamic centrifuge tests. Bull. Earthq. Eng. 2014, 12, 961–980. [Google Scholar] [CrossRef]
- Lo Presti, D.C.F.; Pedroni, S.; Crippa, V. Maximum dry density of cohesionless soil by pluviation and by ASTM D 4253-83: A comparative study. Geotech. Testing J. 1992, 15, 180–189. [Google Scholar]
- Tabaroei, A.; Abrishami, S.; Hosseininia, E.S. Comparison between two different pluviation setups of sand specimens. J. Mater. Civ. Eng. 2017, 29, 04017157. [Google Scholar] [CrossRef]
- Villalobos, F.A. Model Testing of Foundations for Offshore Wind Turbines. Ph.D. Thesis, University of Oxford, Oxford, UK, 2006. [Google Scholar]
- Briaud, J.L.; Smith, T.O.; Meyer, B.J. Using the pressuremeter curve to design laterally loaded piles. In Proceedings of the Offshore Technology Conference, Houston, TX, USA, 2–5 May 1983. [Google Scholar]
- LeBlanc, C. Design of Offshore Wind Turbine Support Structures. Ph.D. Thesis, Technical University of Denmark, Copenhagen, Denmark, 2009. [Google Scholar]
- Budhu, M.; Davies, T.G. Nonlinear analysis of laterality loaded piles in cohesionless soils. Can. Geotech. J. 1987, 24, 289–296. [Google Scholar] [CrossRef]
- Carter, J.P.; Kulhawy, F.H. Analysis and Design of Drilled Shaft Foundations Socketed into Rock; Electric Power Research Inst.: Palo Alto, CA, USA, 1988. [Google Scholar]
- Poulos, H.G.; Hull, T.S. The role of analytical geomechanics in foundation engineering. In Proceedings of the 1989 Foundation Engineering Conference, Evanston, IL, USA, 25–29 June 1989; pp. 1578–1606. [Google Scholar]
- Peire, K.; Nonneman, H.; Bosschem, E. Gravity based foundations for the Thornton Bank Offshore Wind Farm. Terra Aqua 2009, 115, 19–29. [Google Scholar]
- Boylan, N.P.; White, D.J.; Brunning, P. Seabed friction on carbonate soils: Physical modelling of axial pipe-soil friction. In Proceedings of the Offshore Technology Conference, Houston, TX, USA, 5–8 May 2014. [Google Scholar]
- Jeong, Y.H.; Lee, S.W.; Kim, J.H. Centrifuge modeling for the evaluation of the cyclic behavior of offshore wind turbine with tripod foundation. Appl. Sci. 2021, 11, 1718. [Google Scholar] [CrossRef]
- Jeong, Y.H.; Kim, J.H.; Manandhar, S.; Ha, J.G.; Park, H.J.; Kim, D.S. Centrifuge modelling of drained pullout and compression cyclic behaviour of suction bucket. Int. J. Phys. Model. 2020, 20, 59–70. [Google Scholar] [CrossRef]
- Wilson, D. Soil-Pile-Superstructure Interaction in Liquefying Sand and Soft Clay. Ph.D. Thesis, University of California, Davis, Davis, CA, USA, 1998. [Google Scholar]
- Klinkvort, R.T. Monopile Design through Centrifuge Technology; OSIG Evening Geoforum, OSIG-SUT: London, UK, 2018. [Google Scholar]
- Randolph, M.; Gourvenec, S. Offshore Geotechnical Engineering; CRC Press: Boca Raton, FL, USA, 2017. [Google Scholar]
- Byrne, B.W.; McAdam, R.A.; Burd, H.J.; Beuckelaers, W.J.; Gavin, K.G.; Houlsby, G.T.; Zdravković, L. Monotonic laterally loaded pile testing in a stiff glacial clay till at Cowden. Géotechnique 2020, 70, 970–985. [Google Scholar] [CrossRef]
- McAdam, R.A.; Byrne, B.W.; Houlsby, G.T.; Beuckelaers, W.J.; Burd, H.J.; Gavin, K.G.; Zdravković, L. Monotonic laterally loaded pile testing in a dense marine sand at Dunkirk. Géotechnique 2020, 70, 986–998. [Google Scholar] [CrossRef]
- Jeong, Y.H.; Ko, K.W.; Kim, D.S.; Kim, J.H. Studies on cyclic behavior of tripod suction bucket foundation system supporting offshore wind turbine using centrifuge model test. Wind. Energy 2021, 24, 515–529. [Google Scholar] [CrossRef]
- Uesugi, M.; Kishida, H.; Tsubakihara, Y. Friction between sand and steel under repeated loading. Soils Found. 1989, 29, 127–137. [Google Scholar] [CrossRef]
Disclaimer/Publisher’s Note: The statements, opinions and data contained in all publications are solely those of the individual author(s) and contributor(s) and not of MDPI and/or the editor(s). MDPI and/or the editor(s) disclaim responsibility for any injury to people or property resulting from any ideas, methods, instructions or products referred to in the content. |
© 2023 by the authors. Licensee MDPI, Basel, Switzerland. This article is an open access article distributed under the terms and conditions of the Creative Commons Attribution (CC BY) license (https://creativecommons.org/licenses/by/4.0/).