1. Introduction
Korean fishing boat laws necessitate the installation of fishing boat location transmitters, which automatically transmit the location of fishing boats. Currently, commonly used devices include an automatic identification system (AIS), V-pass, satellite-communication devices, and the intelligent marine traffic information service terminal. According to the Korea Coast Guard [
1,
2], approximately 91% of registered fishing boats have V-pass terminals, whereas those with a gross tonnage of 10 t or more have either V-pass or AIS terminals or both. The fishing boat location data periodically transmitted by the fishing boat location transmitter is used to locate the boat during emergencies; however, it is also used in accident investigations to determine exact causes and prevent the reoccurrence of such incidents.
Therefore, it is necessary to verify the accuracy of the global positioning system (GPS) location of the location transmitter in the fishing boat involved in an accident in order to investigate the accident that occurred. Because the location data transmitted from the fishing boat to the land relay station can be delayed by 30 s–7 min 30 s depending on the transmission conditions, this data alone cannot accurately determine the cause of the accident [
3].
To reliably investigate the accidents that occur on fishing boats, the accuracy of the location information transmitted from the fishing boat must be verified. Although several studies have been conducted on AIS terminals [
4,
5,
6,
7,
8,
9,
10,
11], most focus on the problems of using AIS equipment and research that utilizes the collected information. In [
12], the ship information of AIS and radar were compared, and the course-over-ground and speed-over-ground values were different due to errors in the initial set values of the equipment; the two values were analyzed using the fuzzy expert system [
13].
There have been studies on the location accuracy of some AIS. For instance, a method for detecting the two most dangerous abnormal behaviors based on AIS was conducted in [
14], a study establishing a major ship navigation route between ports based on the extracted ship orbiter cluster was conducted in [
15], and a study suggesting a data preparation process for managing actual kinematic data and detecting fishing boats was conducted in [
16]. Most studies on V-pass terminals used in most fishing boats focus only on V-pass data utilization; thus, few studies on the location accuracy—a crucial variable—exist [
17,
18,
19,
20,
21].
Therefore, this study aimed to directly evaluate the location accuracy of AIS and V-pass terminals, which are mainly used as fishing boat location transmitters. To determine the exact location, we installed AIS and V-pass terminals on a training ship equipped with Electronic Chart Display and Information System (ECDIS) and compared the location information stored in the fishing boat location transmitters with those of the training ship ECDIS through marine experiments. AIS and V-pass terminals were installed on experimental ships equipped with ECDIS connected with DGPS antennas to compare the location errors of DGPS and GNSS data received in Tongyeong waters, and marine experiments were conducted to compare the GNSS location information of the experimental ship ECDIS.
3. Results
Typically, devices are not set up to store location data every second, as in this study, which involved checking real-time locations due to internal-memory capacity limitations. The time period to store location data varies from terminal to terminal; however, AIS is usually set to save 2 s–3 min, V-pass 30 s, and ECDIS every minute depending on speed or change.
The experimental results and splashing-position error (PE) of the device may appear to decrease as the location storage time interval is widened. Therefore, to determine the exact PE, we compared the position every second, which is the minimum unit of storage. The original data received from the terminal receives GNSS satellite signals and minimizes PEs via internal correction using processes such as DGPS.
The GNSS PE of the terminal was measured to be approximately 20 m and 1–5 m after going through DGPS. However, in actual seas, cases exceeding 20 m or irregular splashing have been observed.
As in the study by the authors [
24], ECDIS location data was stored in NMEA code with
$GPGGA representing location data. Fix quality information appeared as the number shown in
Figure 3.
Table 1 shows the GNSS satellite signal status and the GNSS error according to Fix Quality Number. ECDIS data are known to have a GNSS error of 2–10 m with a DGPS calibrated value of Fix Quality No. 2.
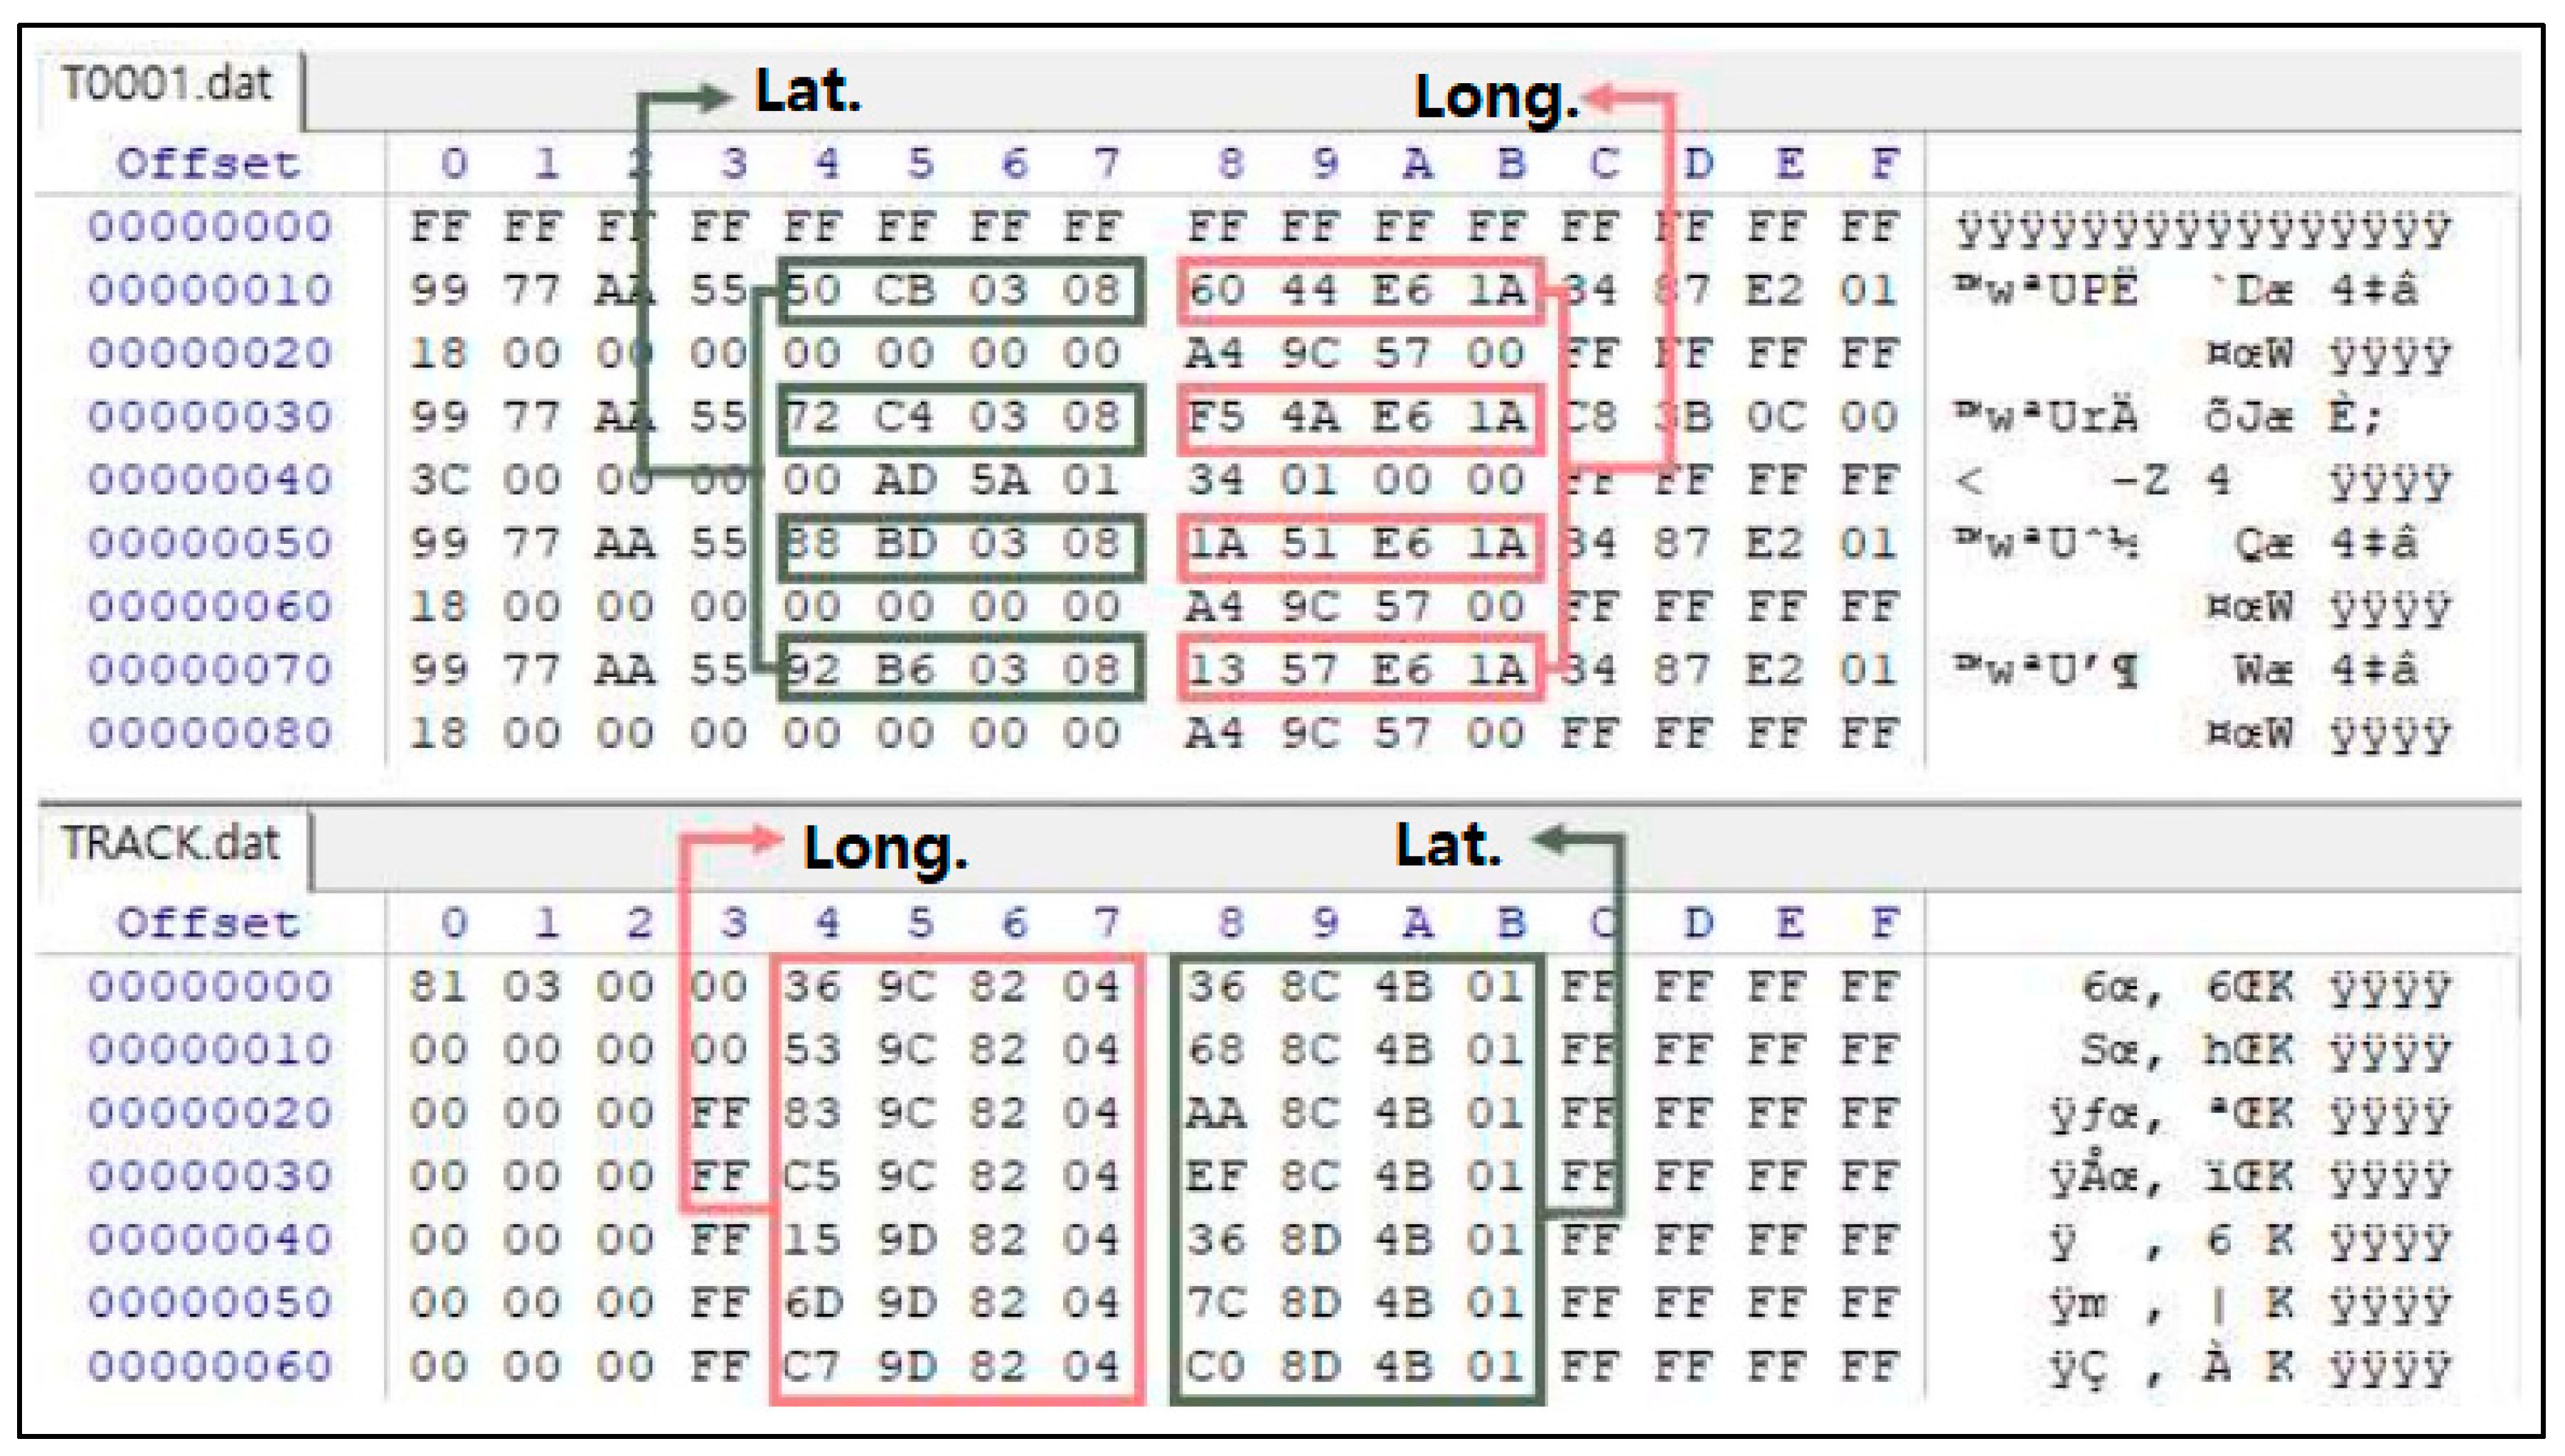
As shown in
Figure 4, trajectory data stored on the AIS and V-pass terminals are encoded in hexadecimal numbers and can be decoded to extract latitude and longitude values [
25].
When navigation data extracted from terminals are entered into the ship’s collision reproduction system, latitude and longitude coordinate points are connected to each other in the order of time stored in the electronic chart, and the three terminal data are placed at similar coordinates over time. Therefore, error comparison can be performed by measuring the distance from the other two data points relative to this ECDIS coordinate. Among the entire sections, the sections sailing in a straight line and turning sections were divided and compared, and the sections with the largest GNSS error for each terminal were determined and compared.
3.1. Comparison of Locations in the Straight-Voyage Section
The AIS and V-pass terminals were set to use a track preservation interval of 5 s, and the ECDIS was set to use a storage interval of 1 s. The measurements were conducted while maintaining a constant course, and the stored tracks were compared based on the electronic diagram.
Figures in the lower left square represent the distance scale of the square’s transverse length, AIS is represented by blue dots, V-pass by green dots, and ECDIS by red dots.
Figure 5 demonstrates a comparison of the three tracks for each terminal obtained by navigating the experimental vessel at various paths and speeds (090 degrees 11.4 kn, 180 degrees 12.8 kn, 330 degrees 14.2 kn). The extent to which AIS and V-pass tracks diverged were compared based on the ECDIS track, and ECDIS measured and compared the deviation from the extension of the course when maintaining a certain course in terms of distance.
The AIS track had the largest PE (43 m) when sailing at 090 degrees; it suddenly bounced to the north and maintained a relatively stable course when sailing at 180 degrees. The ECDIS track traveled approximately 26 m away from the steady course for 8–27 s in parallel; additionally, a sudden bounce-like departure was observed. The V-pass track was out of 38 m when sailing in a 330-degree direction and exhibited the largest PE (48 m) when traveling in a 180-degree direction. While AIS and ECDIS maintained a constant straight course for a long time and one suddenly appeared to bounce, V-pass deviated from the path for more than a minute.
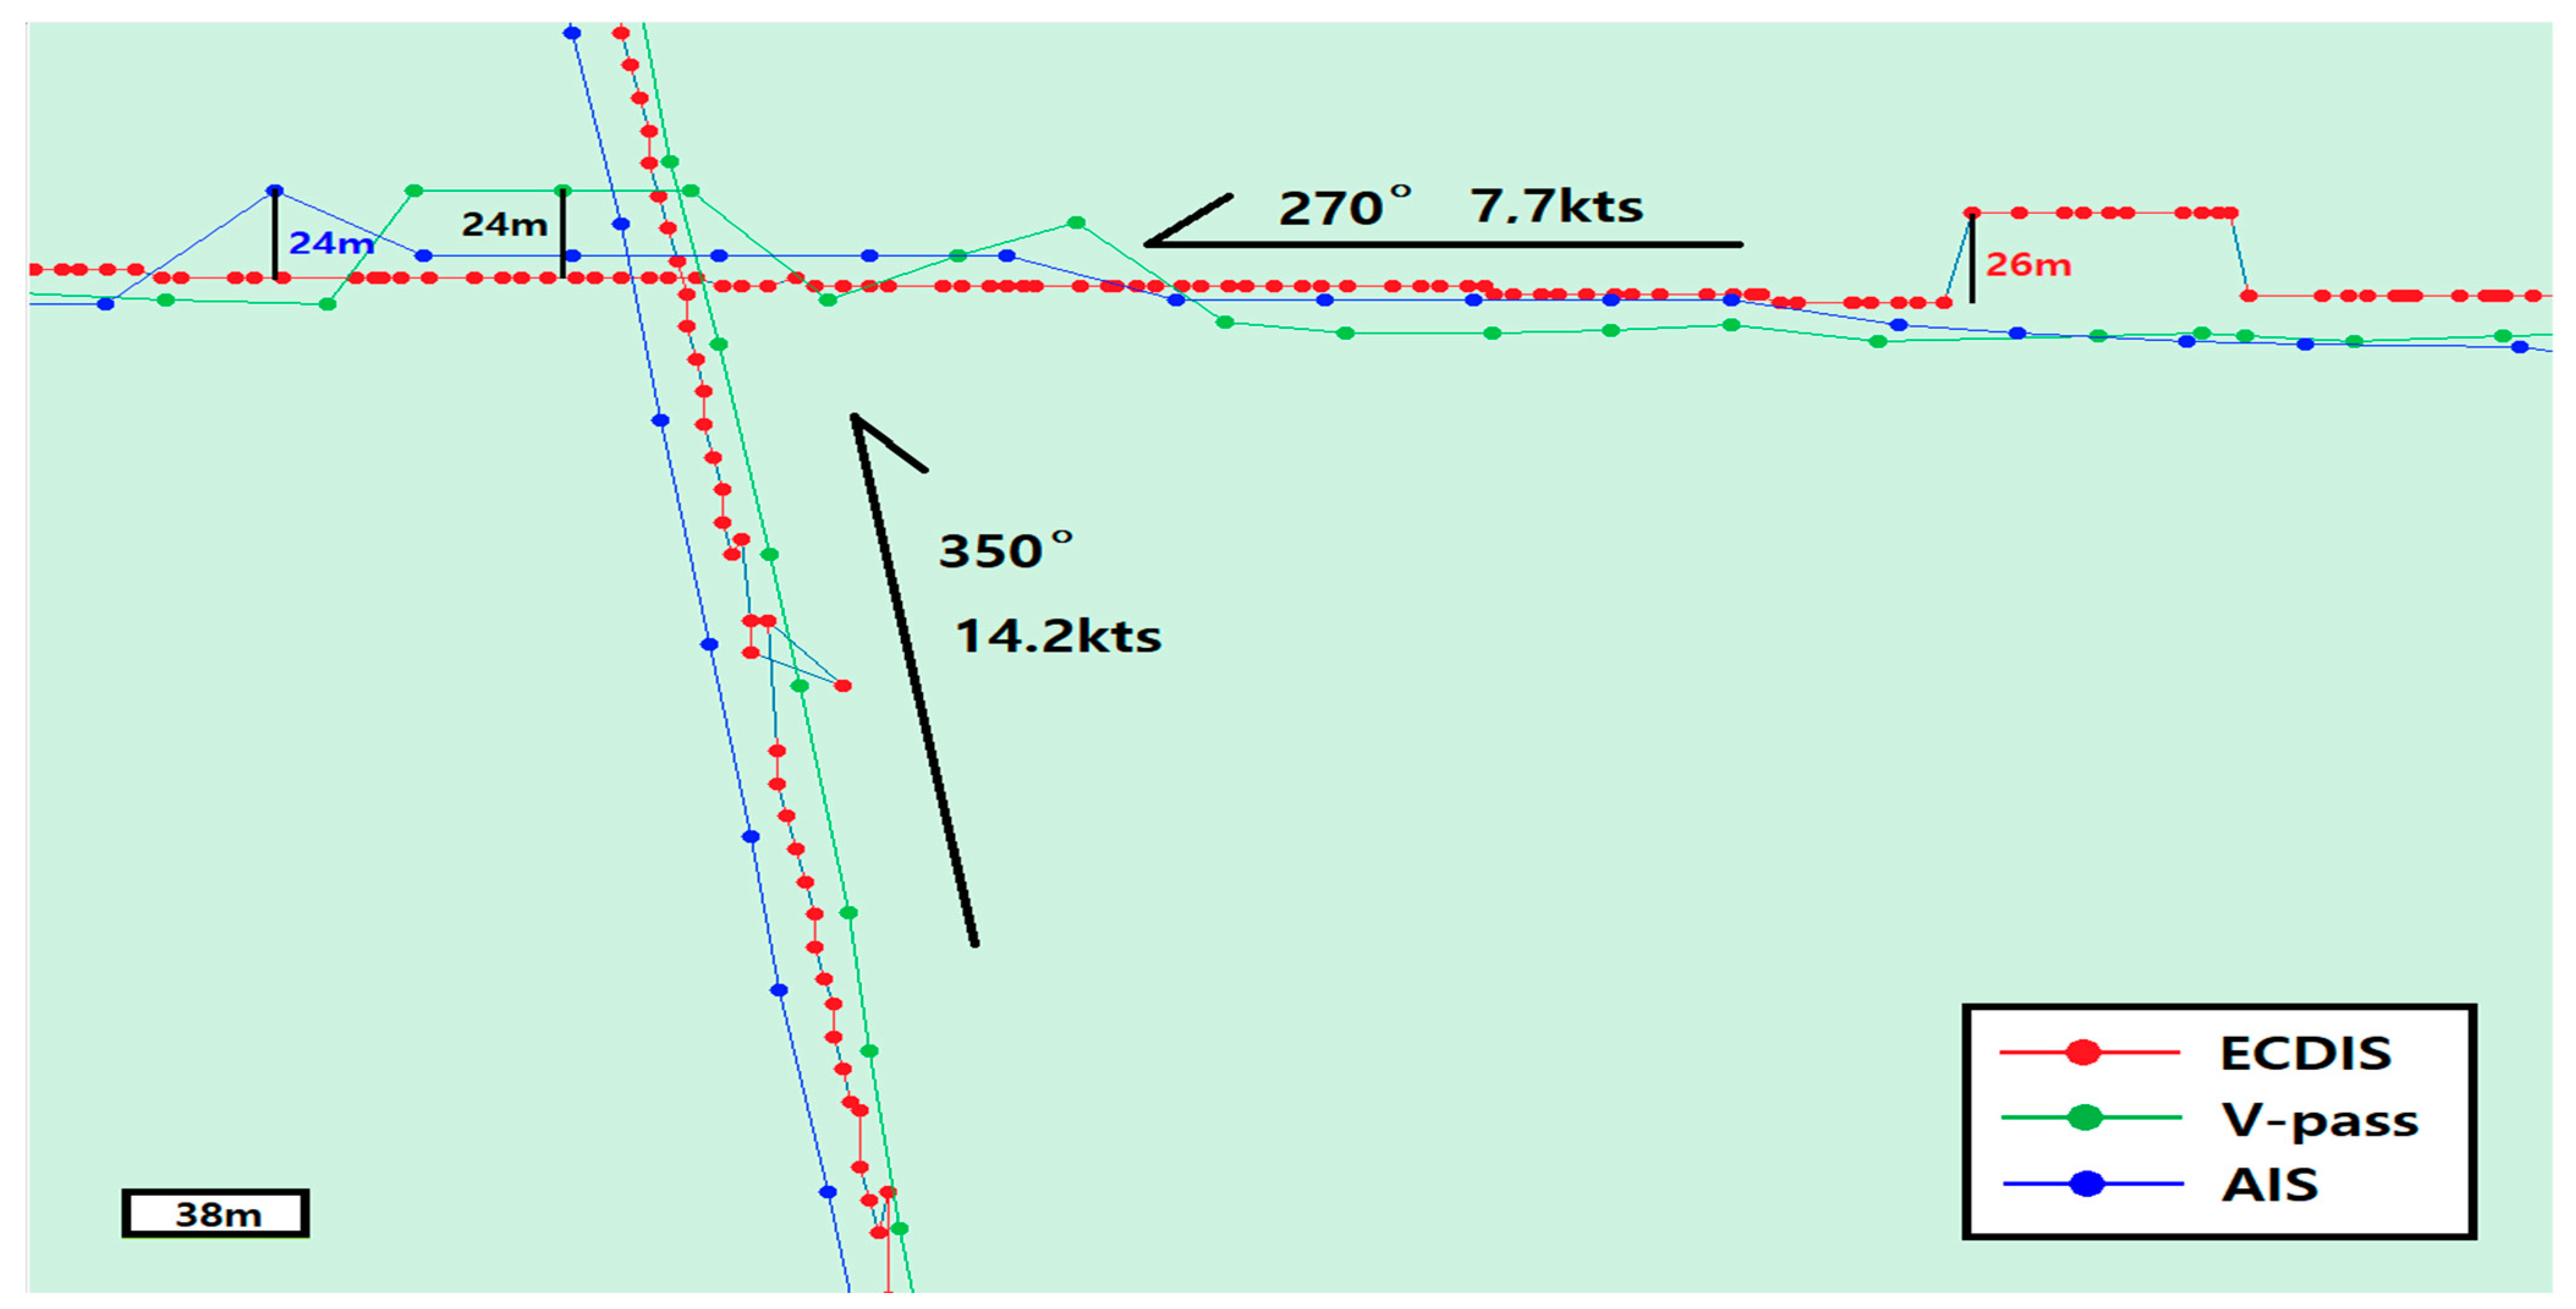
Figure 6 depicts a comparison of the tracks of the three instruments recorded while navigating the experimental vessel with a heading of 270 degrees and speed of 7.7 kn or a heading of 350 degrees and speed of 14.2 kn. Both V-pass and AIS terminals showed a PE of 24 m.
Figure 5 verifies the location accuracy according to the change in the straight course at a speed of 11–14 kn, and
Figure 4 compares the route data at speeds of 7 and 14 kn. Because the entire experimental section was operated between 7 and 14 kn, the PE was greater when the speed was 7 kn than when it was 14 kn.
A PE was not observed on AIS tracks or V-pass tracks that appear every 5 s when navigating straight courses at 090, 180, 270, 330, and 350 degrees; however, on ECDIS tracks that appear every 1 s, a PE was observed in the north (000 degree) or south (180 degrees) directions.
The 76 m scale for straight courses does not appear to have a large PE; however, enlarging it to 38 m appears to increase the margin of error at the terminal. The scale of 76 m on the straight course does not appear to have a significant location error; however, when expanded to 38 m, the error-distance width for each terminal appeared to increase further.
3.2. Comparison of Locations in the Turning-Voyage Section
While altering the turning diameter between 1800 m, 1000 m, 600 m, and 300 m, we compared the track data stored by AIS, V-pass, and ECDIS.
When conducting a turn with a diameter of 1800 m, the tracks of the AIS terminal, V-pass terminal, and ECDIS appeared similar at a distance scale of 306 m (
Figure 7); however, a noticeable difference was observed when a 1000 m diameter turn was performed at a distance scale of 153 m (
Figure 8).
This remarkable phenomenon was evident when the turning circle or distance scale was reduced.
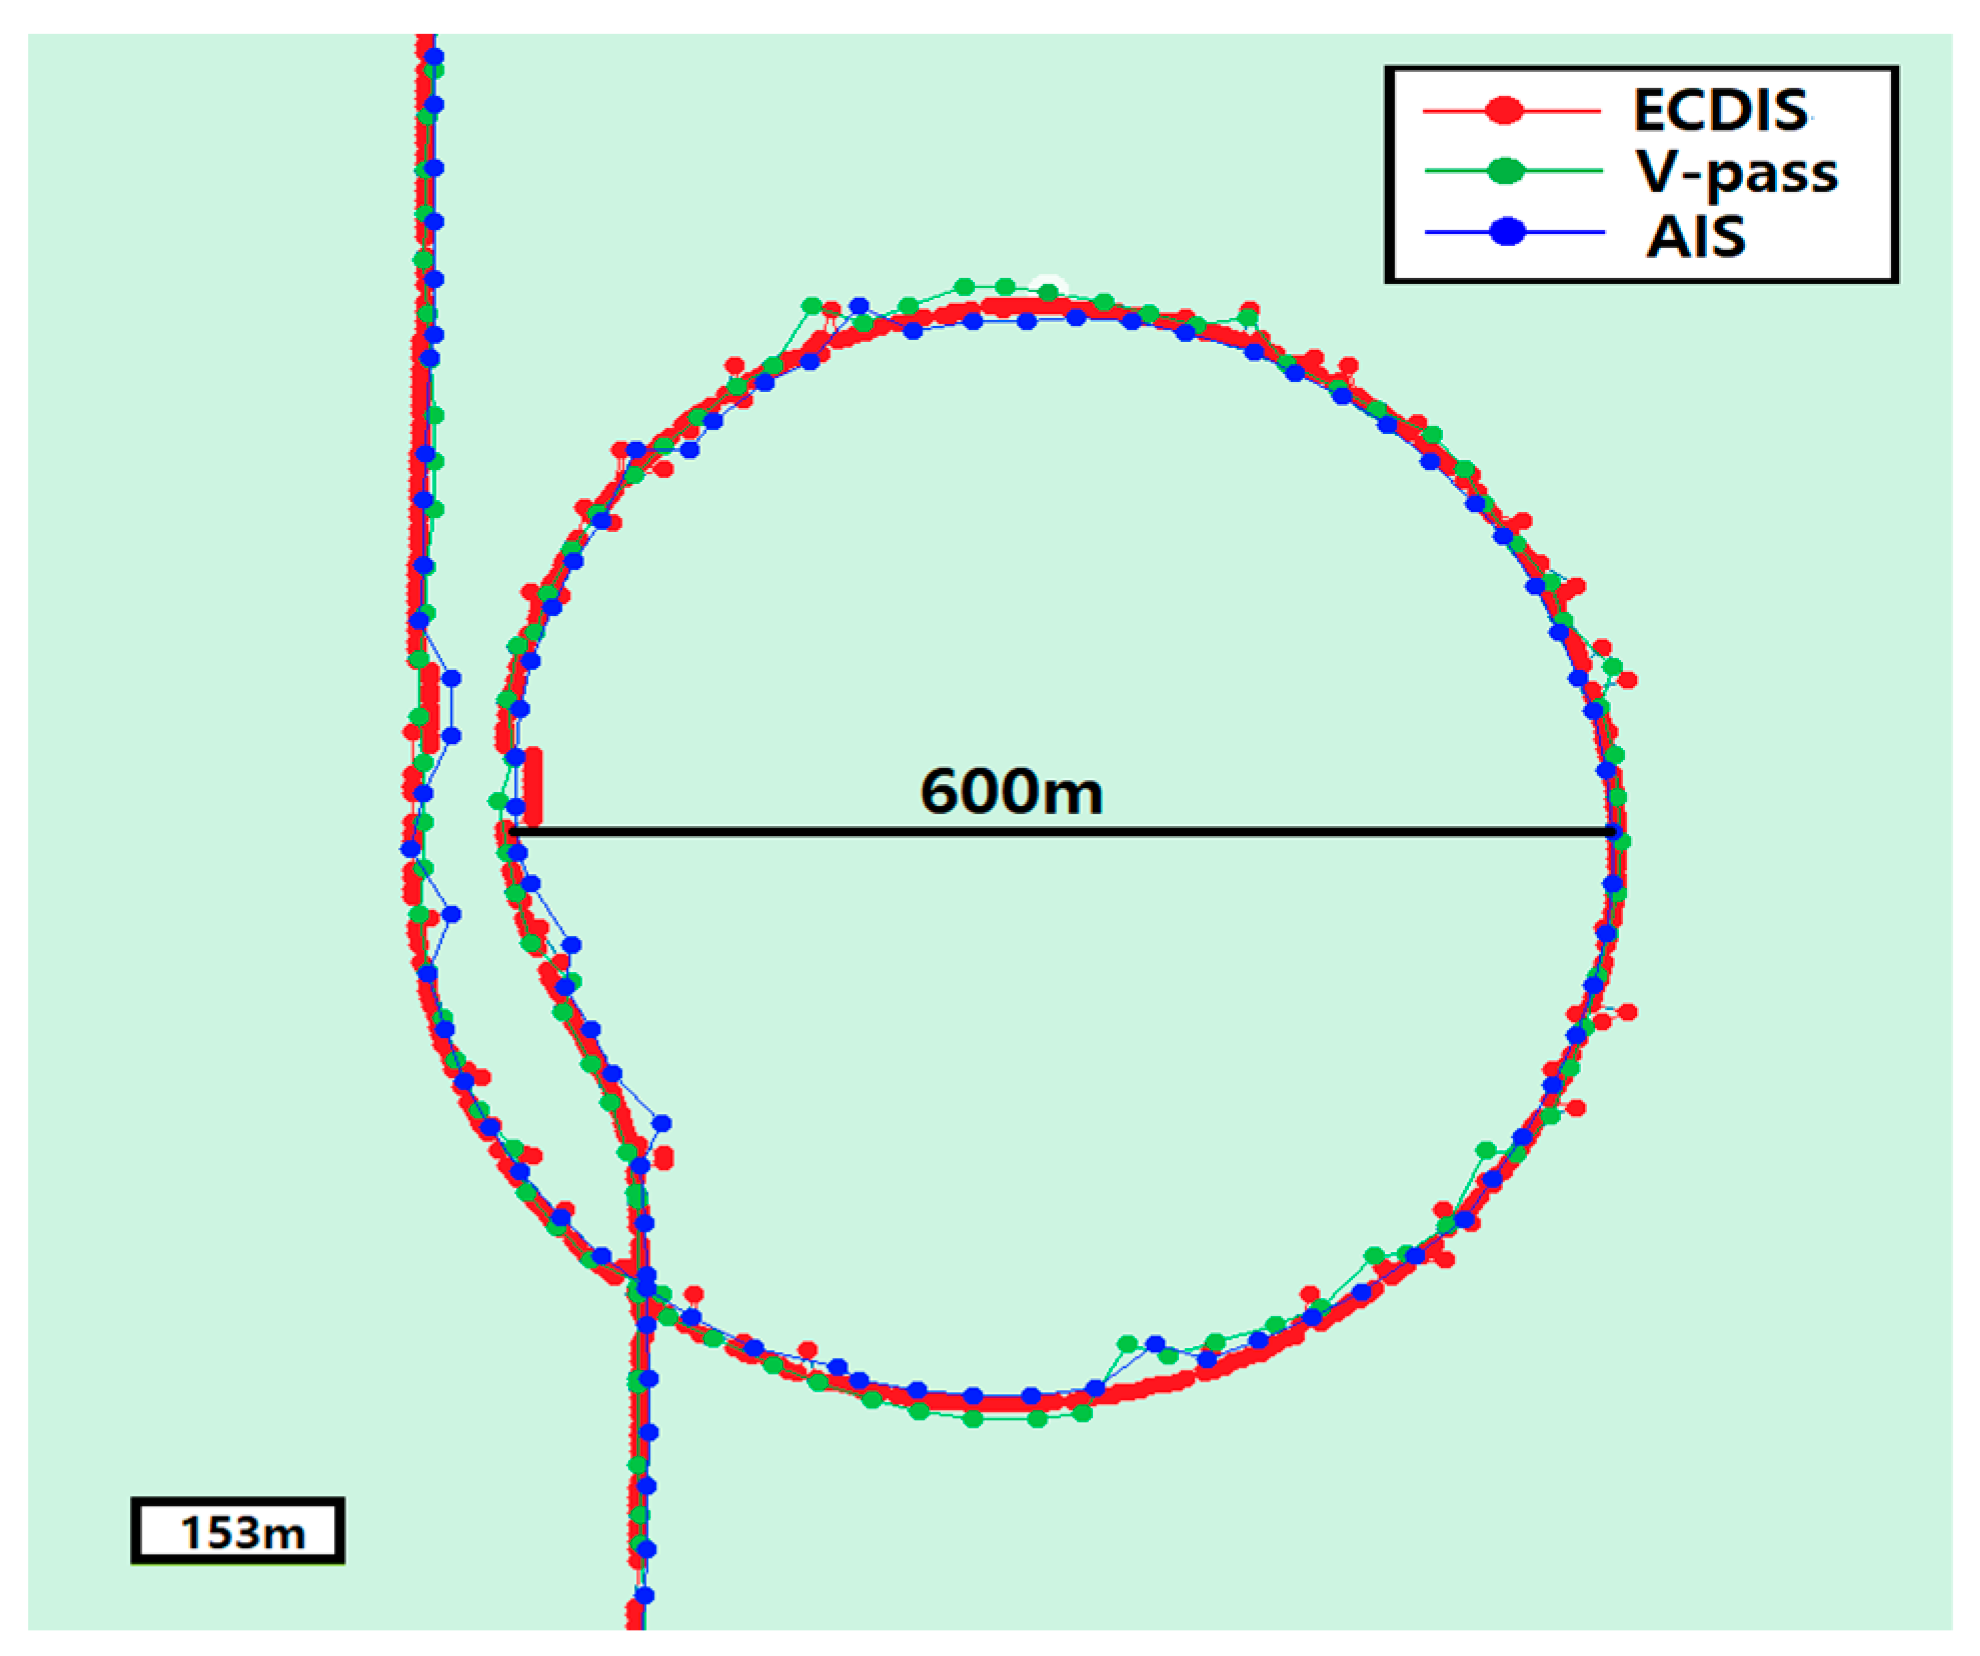
Figure 9 demonstrates the 600 m diameter turn tracks. The rebound degree appeared to be almost the same when compared with that shown in
Figure 8 at the same distance scale of 153 m. However, when comparing the 300 m turn tracks at a distance scale of 76 m, as shown in
Figure 10, the differences appeared more noticeable.
The maximum distance errors were 41, 40, 38, and 40.5 m for the 1800, 1000, 600, and 300 m turns, respectively. The error varied slightly depending on the diameter of the turn; however, the maximum distance error remained within 27–41 m.
While AIS and V-pass exhibited an error of up to 38–41 m, the maximum error of ECDIS was 27 m, indicating higher precision than those of the fishing boat location transmitters.
When the turning circles were larger, as shown in
Figure 7 and
Figure 8, the distance scale increased, making it difficult to confirm whether the location point was outside of the actual route.
Therefore, if a navigational officer uses a navigation instrument that indicates the location of a ship, such as DGPS, GNSS, and radar, the location error cannot be confirmed on a high distance scale; however, at lower distances, the points representing other ships may start appearing from 20 m to 50 m or more. Furthermore, the PE may be greater when the ship turns or moves diagonally, depending on the type of location transmitting device being used.
3.3. Location Error during Navigation of Complex Experimental Routes
AIS and V-pass terminals were configured to store trails every 5 s, and ECDIS was configured to use a track storage interval of 1 s to display more detailed tracks.
Figure 11 depicts a section where the ECDIS and V-pass locations deviated substantially from the real route while navigating a complex route with a combination of straight and curved lines as the experimental ship. This section was used to determine the location errors of the instruments.
As shown in
Figure 11, the ECDIS track deviated in sections A-1 and A-2, whereas the V-pass track deviated in sections B-1 and B-2.
3.4. ECDIS-Specific PEs
While most PEs generally appeared briefly, ECDIS PEs appeared in a somewhat unique form of parallel movement in some sections.
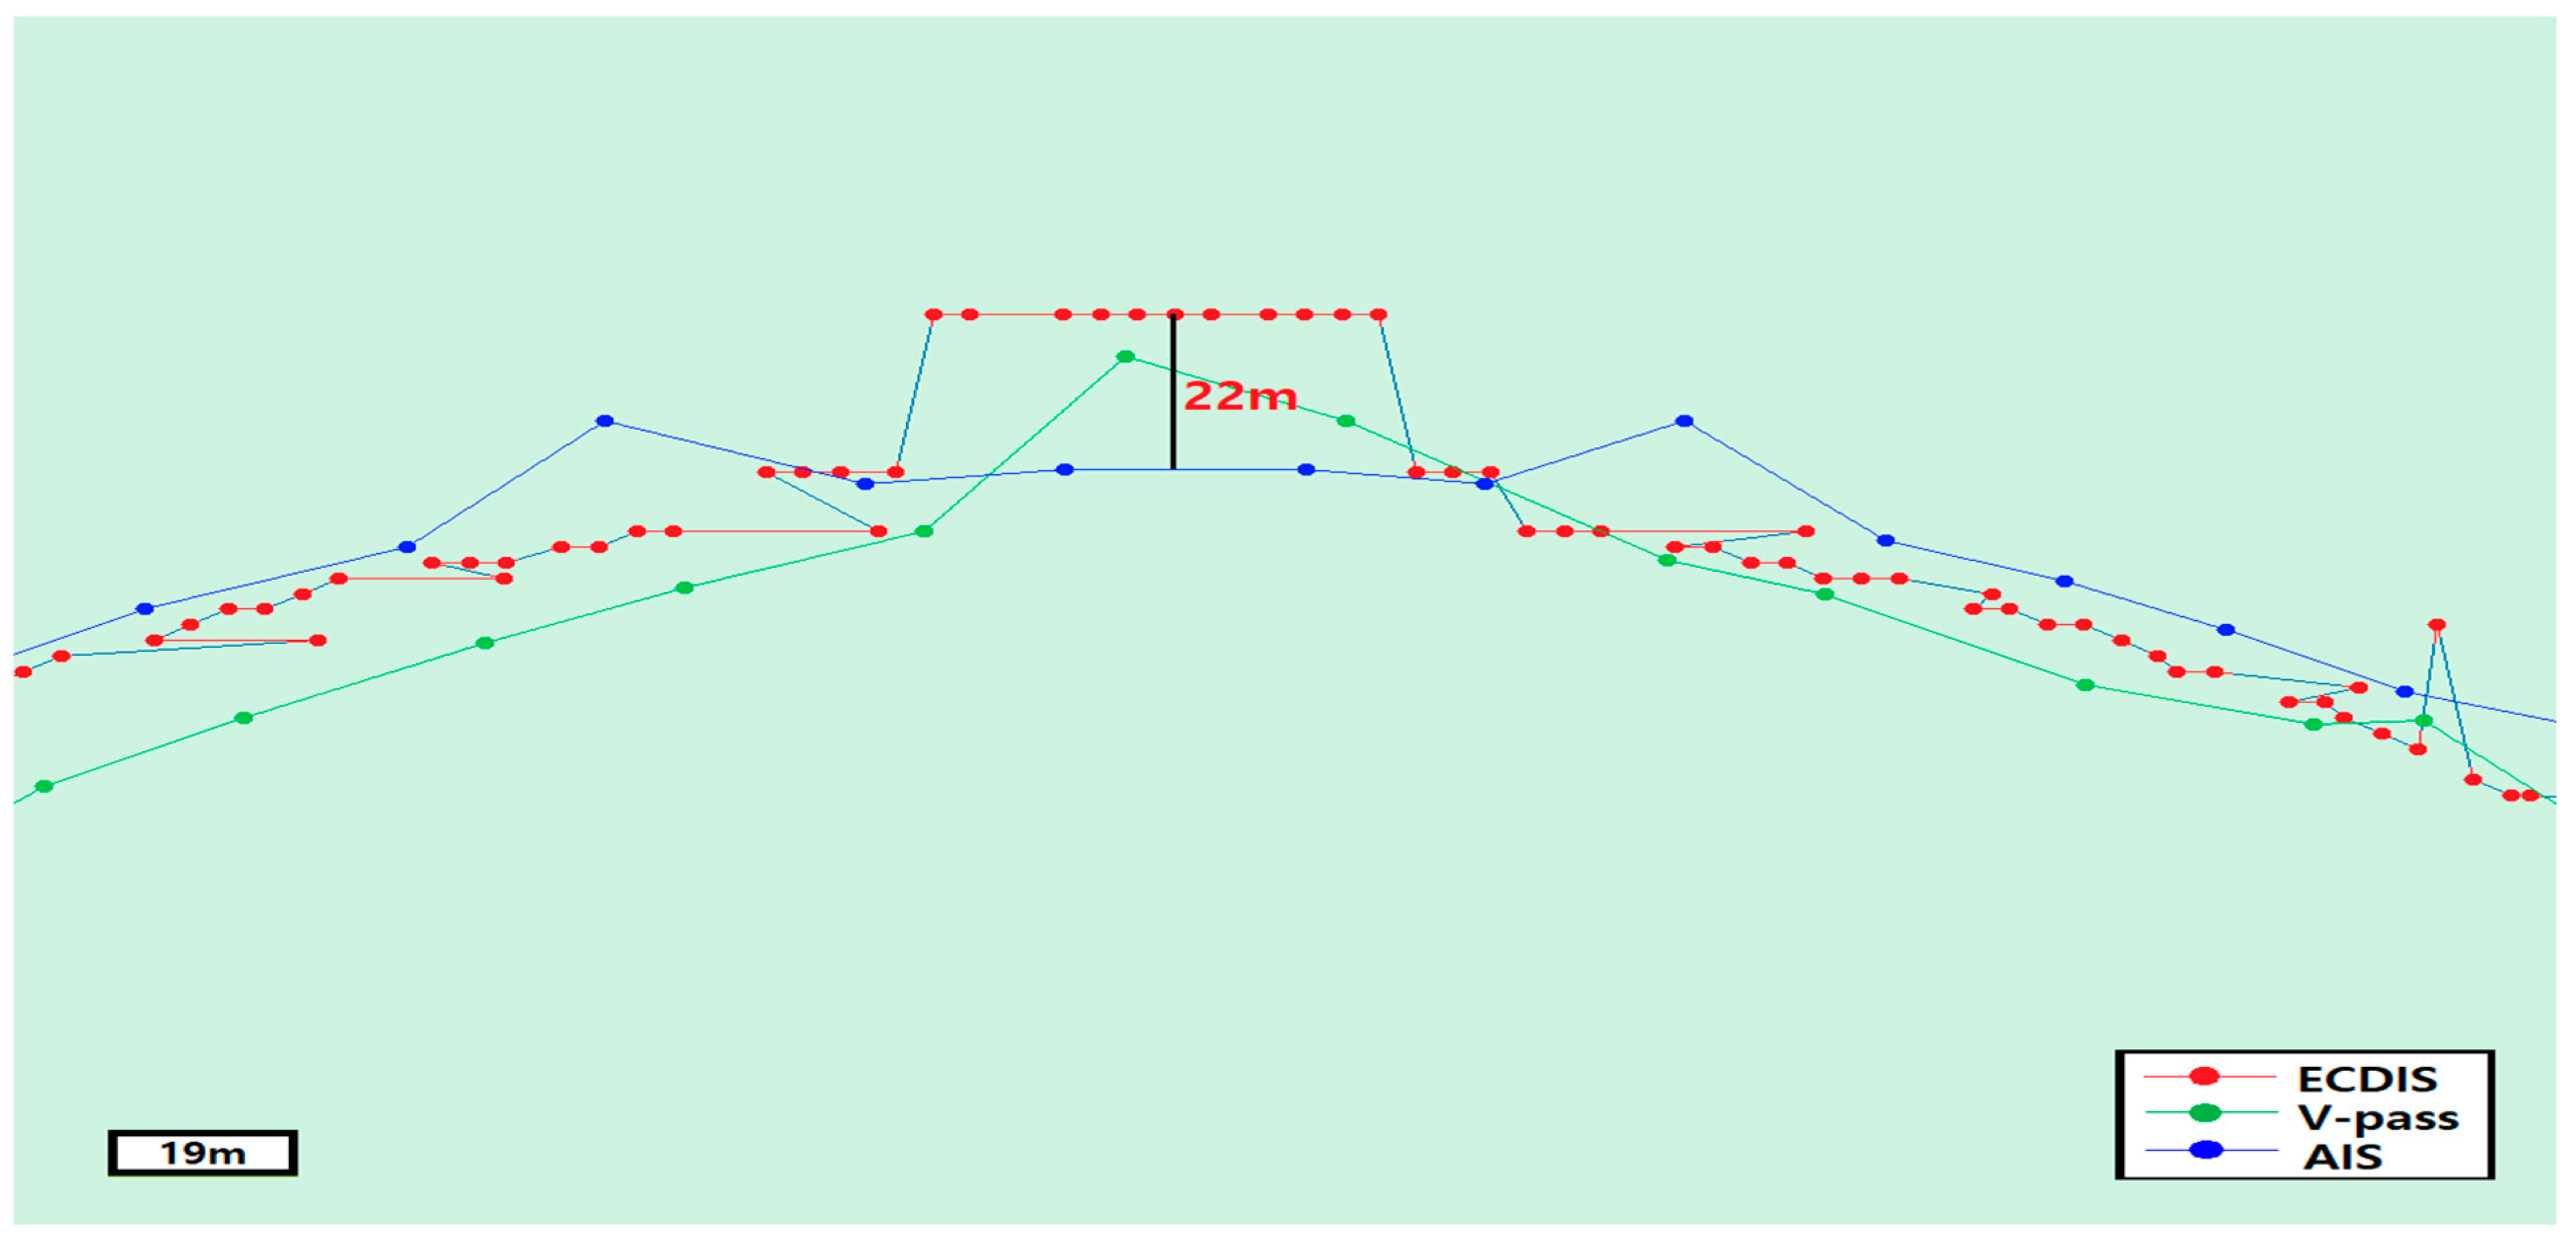
Figure 12 depicts an extension of the A-1 section of
Figure 11 at a distance scale of 19 m to identify the shape and size of the PE of the ECDIS terminal, confirming that the point connected to the red dots deviated from the real track by approximately 22 m for 11 s.
Moreover, the location points did not appear as a smooth curve; however, it instantly progressed in a direction differing from the true course by 000 or 090 degrees, with an error of approximately 20 m and then returned to the true path.
Figure 13 demonstrates an extension of the A-2 section of
Figure 11 at a distance scale of 19 m, revealing that the A-1 curve section moved in parallel for 9 s with an error of 24 m. In addition, the PE of ECDIS was similar to the form observed in
Figure 12, and zigzag trails indicating abrupt shifts in the 000-degree and 090-degrees directions appeared every 10–30 s.
The A-2 section demonstrates that the red dot on the ECDIS jumped more frequently than the blue dot on the AIS or the green dot on the V-pass. The A-1 section was curved, whereas the A-2 section was straight. The results indicate that the ship departed from the existing route for 19 s from 12:34:30 to 12:34:49 (KST) and sailed up to 24 m away. In addition, the 12:34:38–12:34:40 (KST) section was recorded to temporarily sail in the opposite direction of the ship’s progress over time and return to its original route.
In
Figure 12 and
Figure 13, the unique PE type of ECDIS was identified. Regardless of the ship’s movement direction, curve, or course, the PE appeared in the north or south directions. Most of them appeared temporarily for a second; however, in some cases, they appeared for 10–20 s.
AIS or V-passes did not deviate remarkably from the existing route and did not exhibit jumping fluctuations; therefore, if the straight section of this time zone was limited, AIS or V-pass appeared to have higher location accuracy than ECDIS.
Figure 11, which is a complex mixture of straight lines and curves, demonstrates that the straight section with minimal course change had fewer red points jumping or departing from the path than the gentle curve or turning section.
3.5. V-Pass-Specific PE
Among the ECDIS, AIS, and V-pass instruments, V-pass exhibited the largest errors across the entire experimental section, as shown in the B-1 and B-2 sections of
Figure 11.
Figure 14 demonstrates an extension of the B-1 section from
Figure 11, revealing a slightly larger V-pass PE during approximately 70 s, resulting in a PE of up to 92 m compared with the ECDIS moving track.
Figure 15 demonstrates an extension of the B-2 section from
Figure 11, revealing that the exact GNSS location of the ship was not displayed for approximately 80 s, with the largest V-pass PE overall. A PE of up to 168 m occurred compared with ECDIS moving track.
The fact that the exact GNSS location of the ship was not displayed for approximately 80 s indicates that if the storage period of the V-pass terminal was calculated as 5 s, the exact GNSS signal was not received during the storage 16 times.
Except for V-pass tracks, the AIS or ECDIS tracks were not notably different from the PEs. Although the proposed device receives GNSS signals from the same location, stores the current ship’s location, and shows it on the monitor, the considerable location error associated with V-pass may arise due to a problem with the terminal itself or because of mistakes in correcting the error when receiving GNSS signals.
3.6. AIS-Specific PE
Overall, we extracted some sections where the location of the AIS terminal deviates significantly from the ECDIS route and measured the error rate.
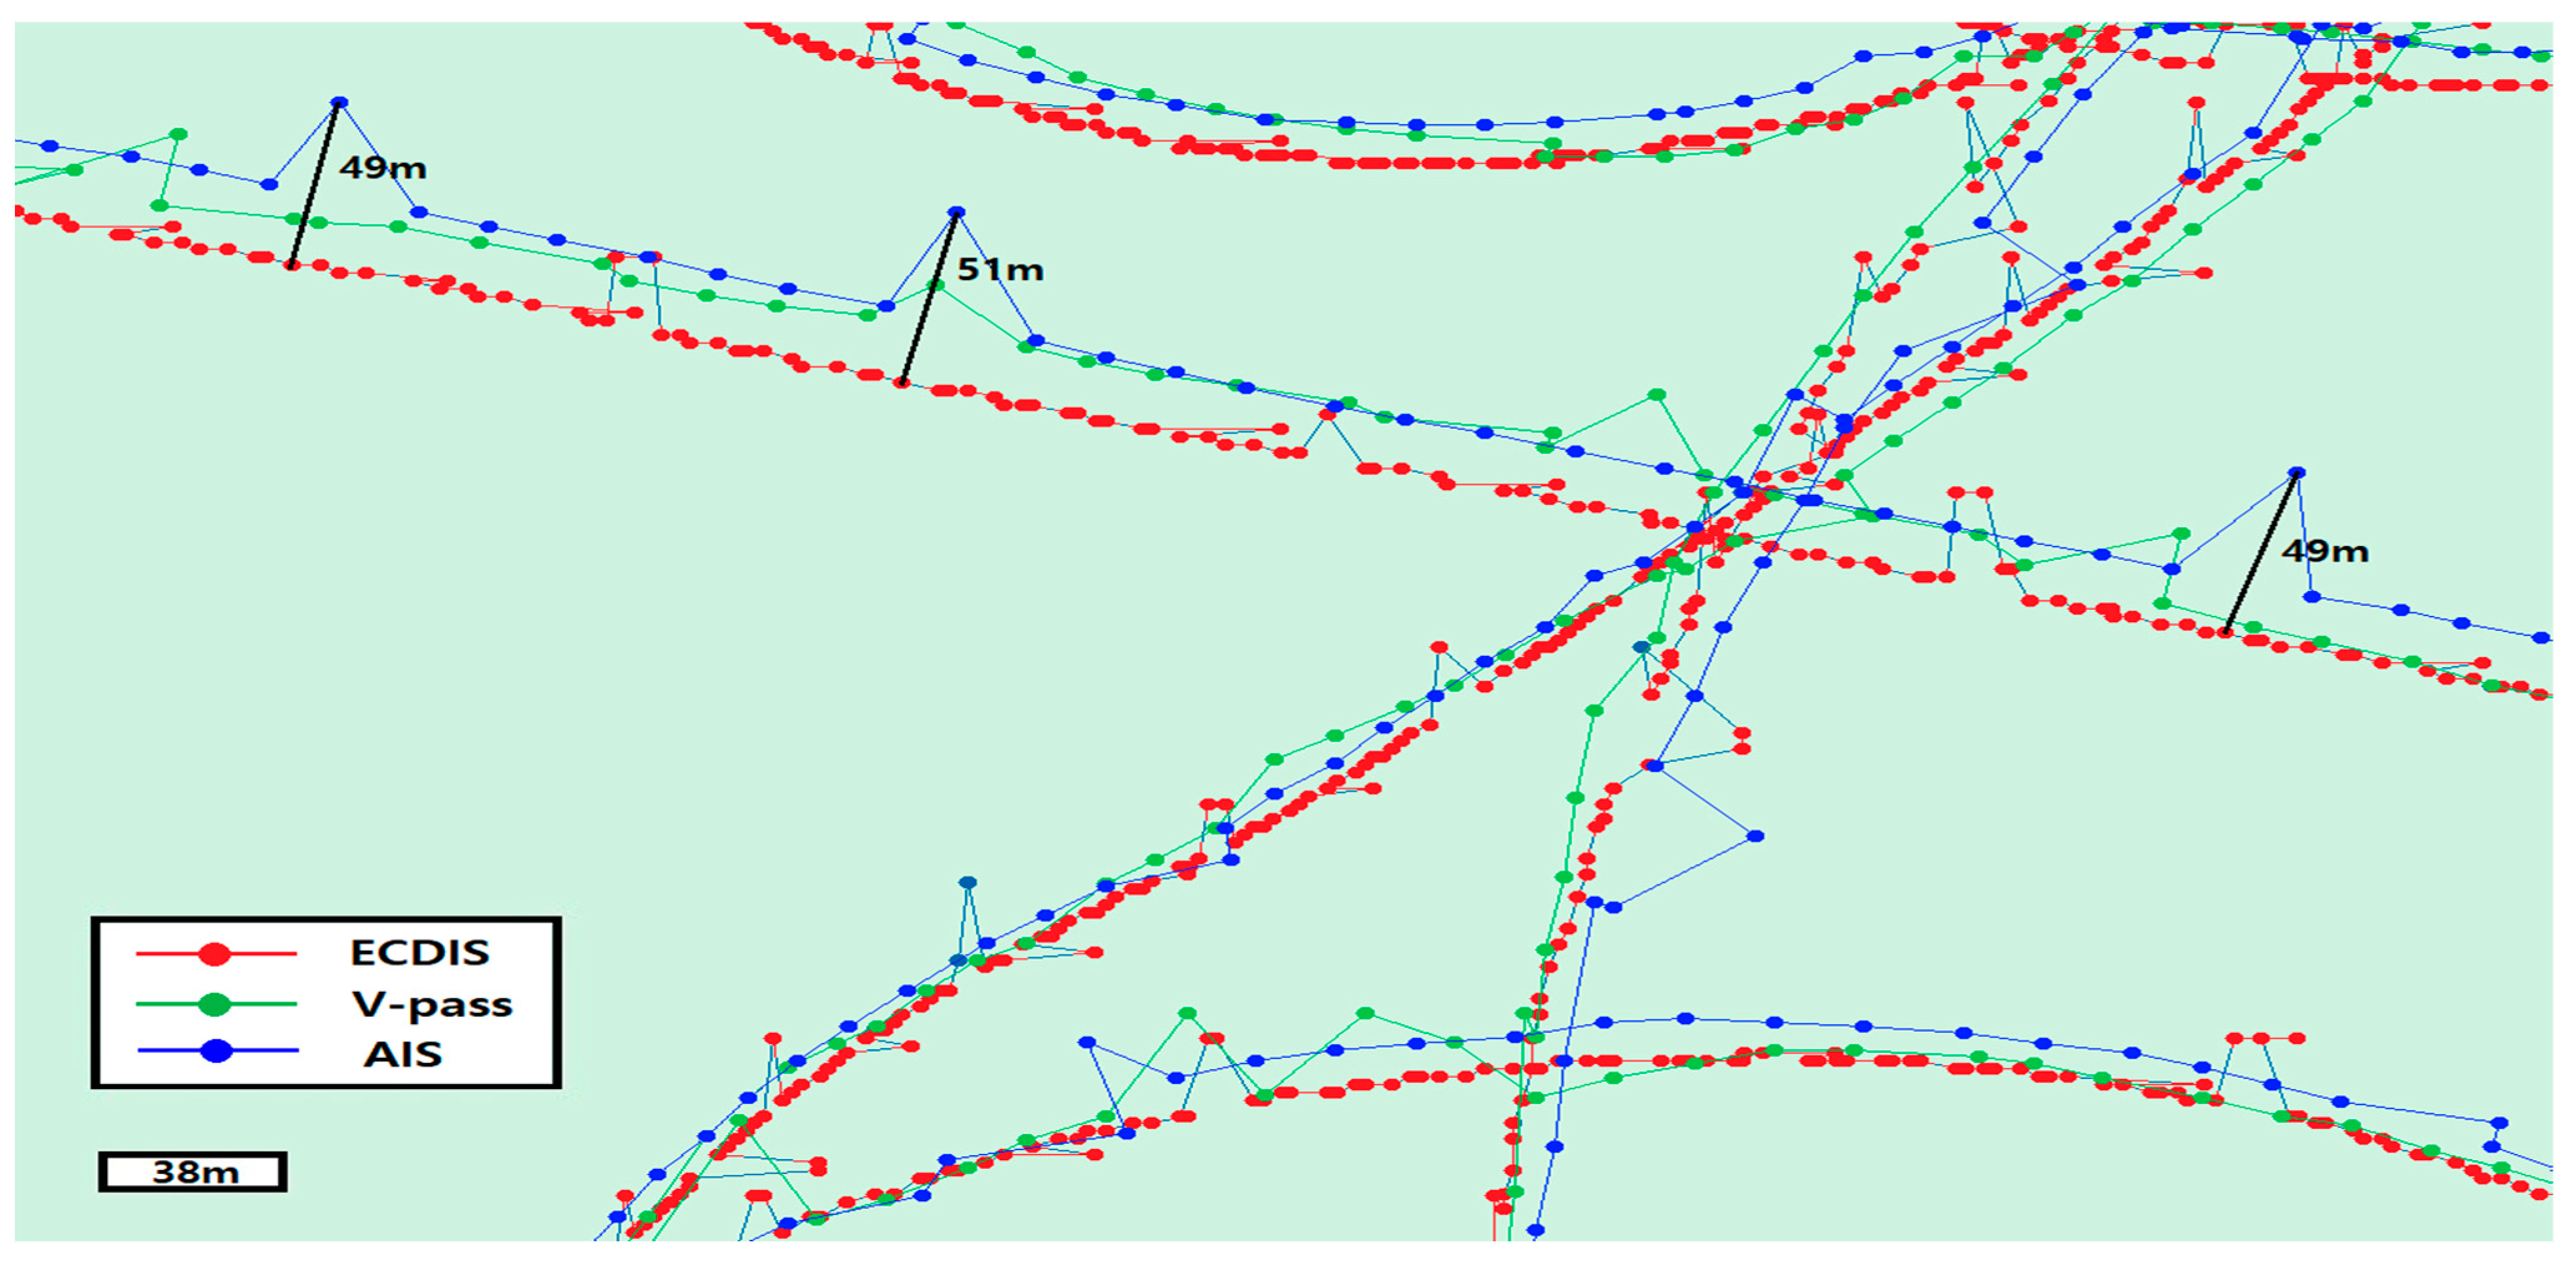
Figure 16 demonstrates a measurement of the distance wherein the experimental ship experienced a large PE on the AIS track while navigating several complex routes. The AIS track has a form of record similar to the V-pass track rather than the ECDIS track. Overall, the movement appeared parallel to the ECDIS track at a constant interval of approximately 18 m. In some sections, it suddenly fluctuated by 49–51 m compared with the ECDIS route.
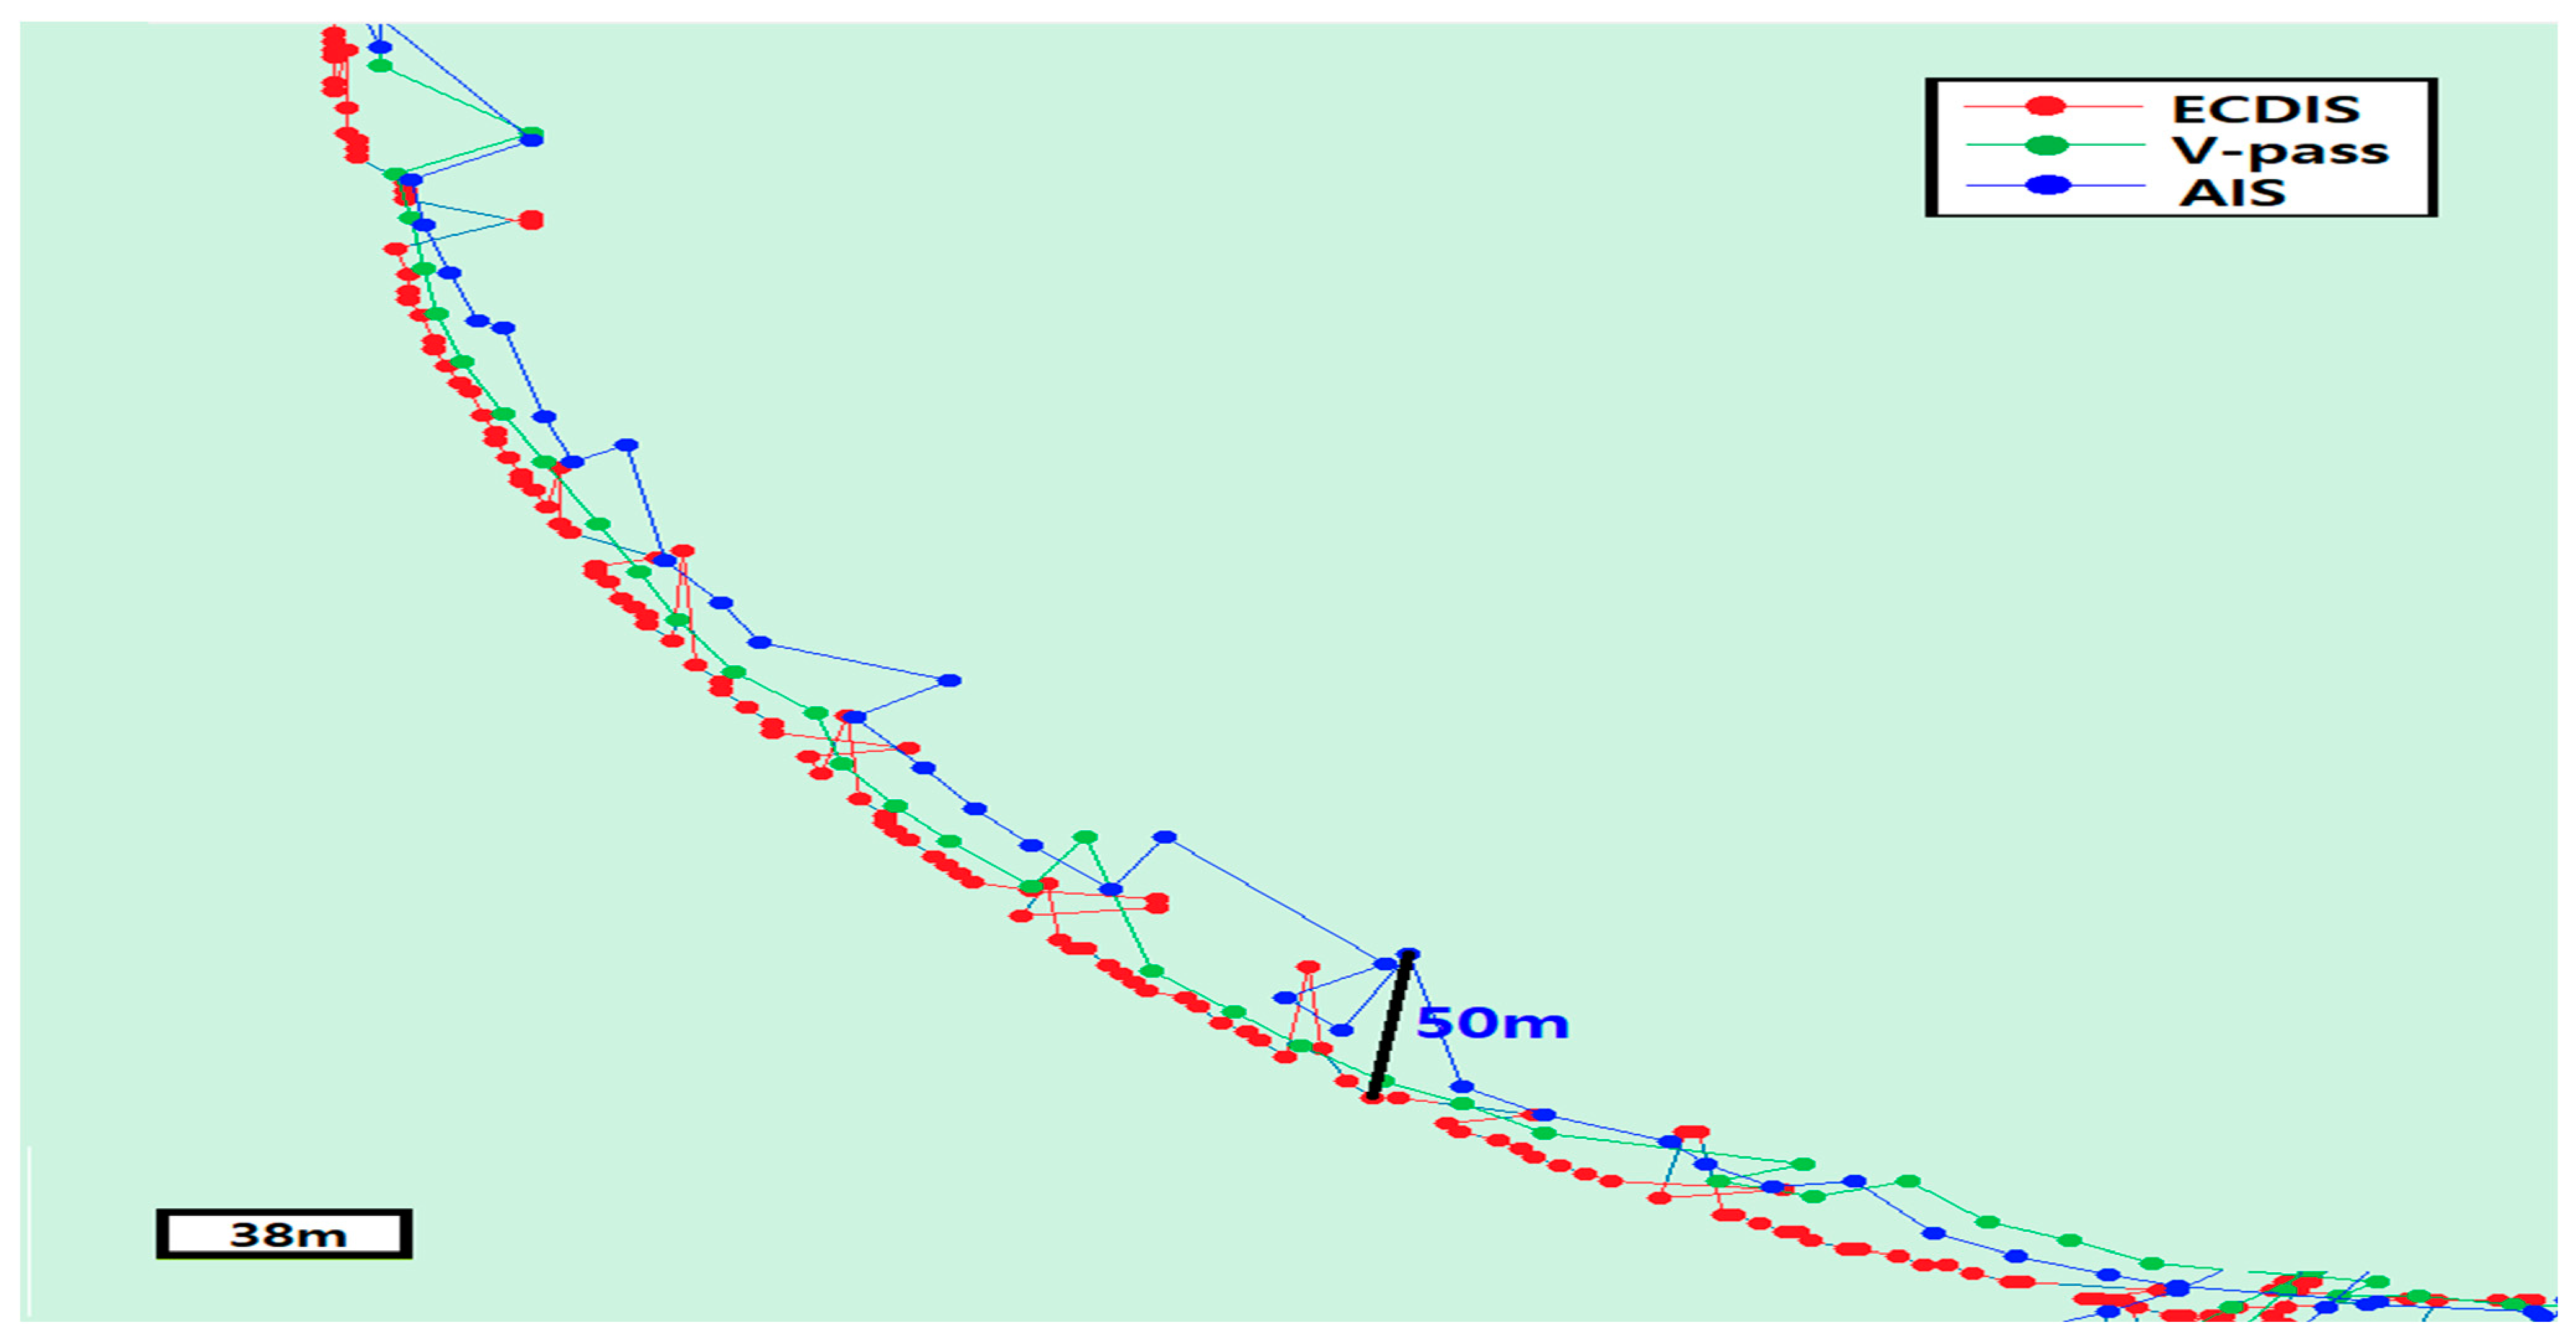
Figure 17 demonstrates the longest linear section of the entire experiment. The lower left square represents the 38 m distance scale of the square’s transverse length; AIS is represented by blue dots, V-pass by green dots, and ECDIS by red dots. The AIS recorded track moved parallel to the ECDIS route at a distance of approximately 18 m and suddenly shifted by 48–51 m every 30–50 s compared with the ECDIS route.
In the curved section of
Figure 18, the PE of the AIS track is more irregular and complicated than that in the straight section of
Figure 17. In the straight section, it remained parallel at a certain distance and fluctuated sporadically. However, in the curved section, it appeared irregularly in a zigzag form without maintaining the equilibrium line; the largest PE was approximately 50 m.
3.7. Statistical Analysis
3.7.1. Mean Value and Standard Deviation
Thus far, we have determined the section and error value with the largest GNSS location error for each terminal. Because the amount of data stored on each device during the same experimental time period was different and no reference time information was stored, this section calculates and compares the deviation and standard deviation with the latitude and longitude values identified in our experiments.
As shown in
Table 2, the amount of ECDIS data set to be stored every second for approximately 6 h and 30 min from 09:09:21 to 15:39:20 was 23,301; V-pass set every 5 s was 4330, and AIS was 4062. If GNSS signals are not missing, the number of cases that should be stored is normally 23,400 for ECDIS and 4680 for V-pass and AIS, with percentages of 99.58% for ECDIS, 92.52% for V-pass, and 86.79% for AIS.
The trajectory data were compared by separating latitude and longitude, and only ‘minute’ units were compared (except ‘degree’). For example, if the latitude (ECDIS) is 34.123477, as shown in Equation (1), and the ‘degree’ part of 34 is subtracted, the ‘minute’ value of 7.40862 is multiplied by 60 again. The reason for obtaining the ‘minute’ value is that the ‘one minute’ value is 1 nM, which makes it easy to obtain the distance error. Longitude was calculated in the same manner. The latitude and longitude of ECDIS are indicated by Lat(E), Long(E), V-pass by Lat(V), Long(V), AIS by Lat(A), and Long(A). The latitude and longitude values of the other terminals were determined using Equations (2) and (3).
To check the error of each terminal, the overall mean (Equation (4)) of the latitude and longitude values of each terminal were obtained, and the deviation (Equation (5)) and the standard deviation (Equations (6)–(8)) were obtained by comparing the mean and total mean values of each terminal. In addition, to compare the AIS and V-pass Pes, based on the ECDIS position, the standard deviation (
Table 2) was obtained to determine the extent of the PE by subtracting the average value of each terminal from the ECDIS value.
The deviations and standard deviation graphs in
Figure 19 and
Figure 20 show that the values of the three terminals were not significantly different (calculated based on the mean values of the three terminals).
Table 3 shows the deviation and standard deviation of V-pass and AIS compared to the mean value of the ECDIS position obtained using Equations (9) and (10). Briefly, the DGPS correction values and ECDIS data are compared with the GNSS values of the device.
The deviation and standard deviation graphs comparing the ECDIS (DGPS) values in
Figure 21 and
Figure 22 show that the AIS value was larger than the V-pass value in the deviation, but the difference between the two values was not large in terms of the standard deviation.
To calculate the degree of PE (m) of each terminal based on the obtained average value, the ECDIS average value was subtracted from the terminal’s position average, as shown in Equation (11), and the nM value was multiplied by 1852 m to obtain the PE.
As shown in
Table 4, the PE of the AIS was calculated as approximately 72.48 m for latitude and 57.44 m for longitude, and the PE of the V-pass was calculated as approximately 10.38 m for latitude and approximately 0.23 m for longitude.
3.7.2. Trajectory Data Graphs
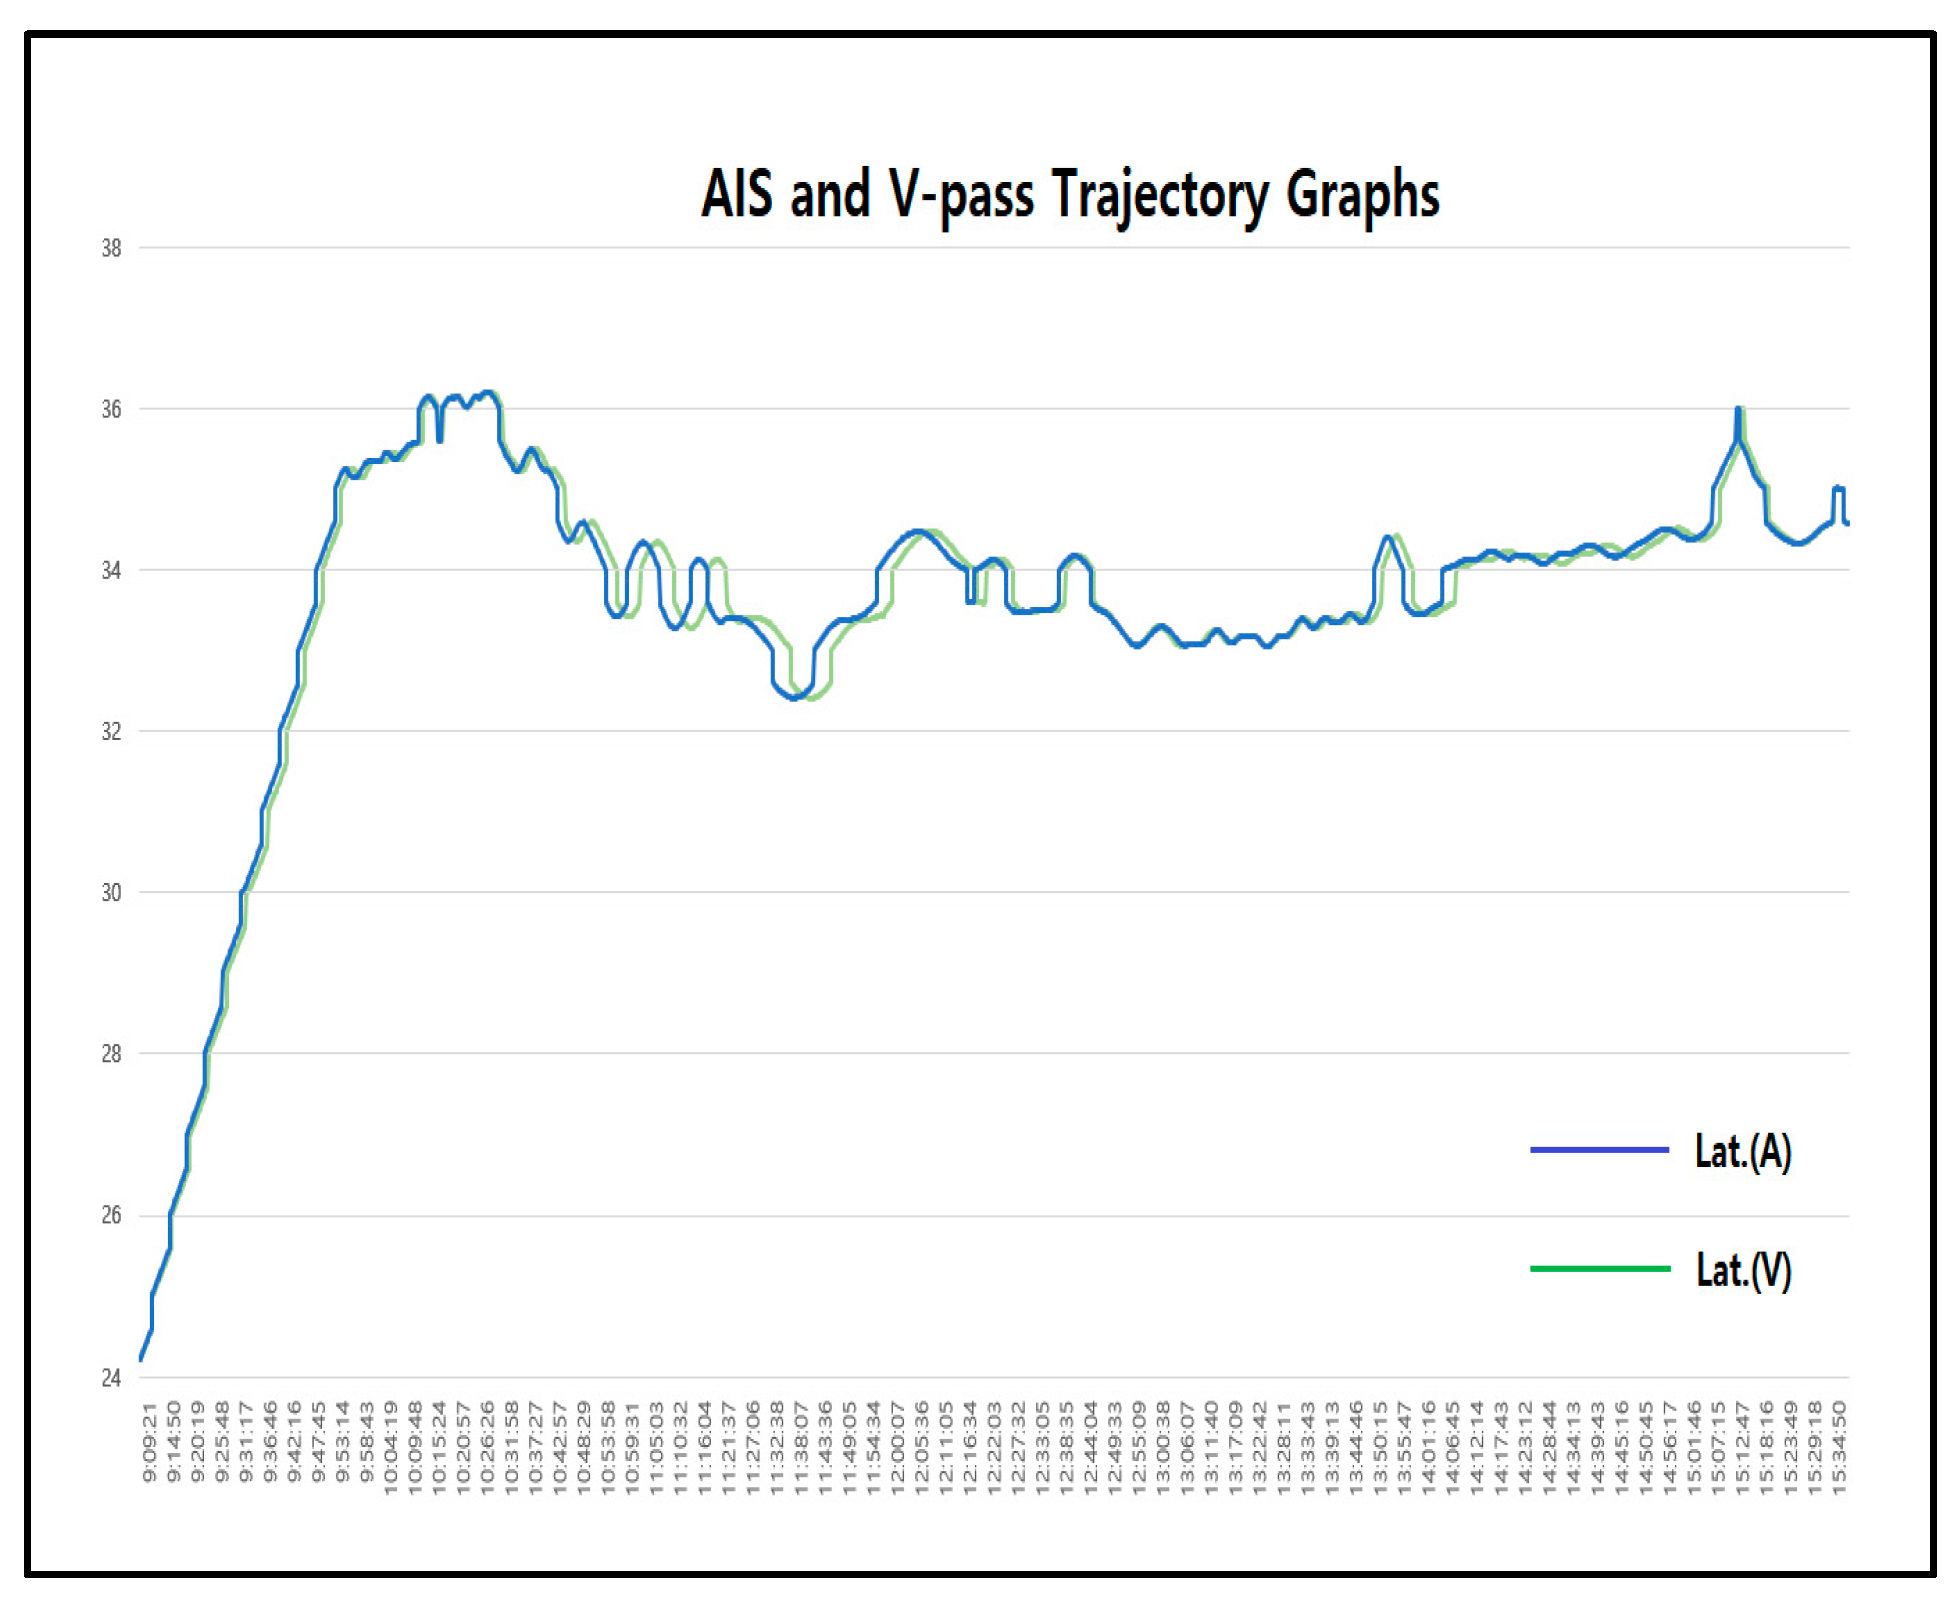
When a linear graph of the trajectory data stored in the terminal was drawn according to ECDIS time, the trajectory form was similar to the AIS and V-pass comparison graphs shown in
Figure 23 and
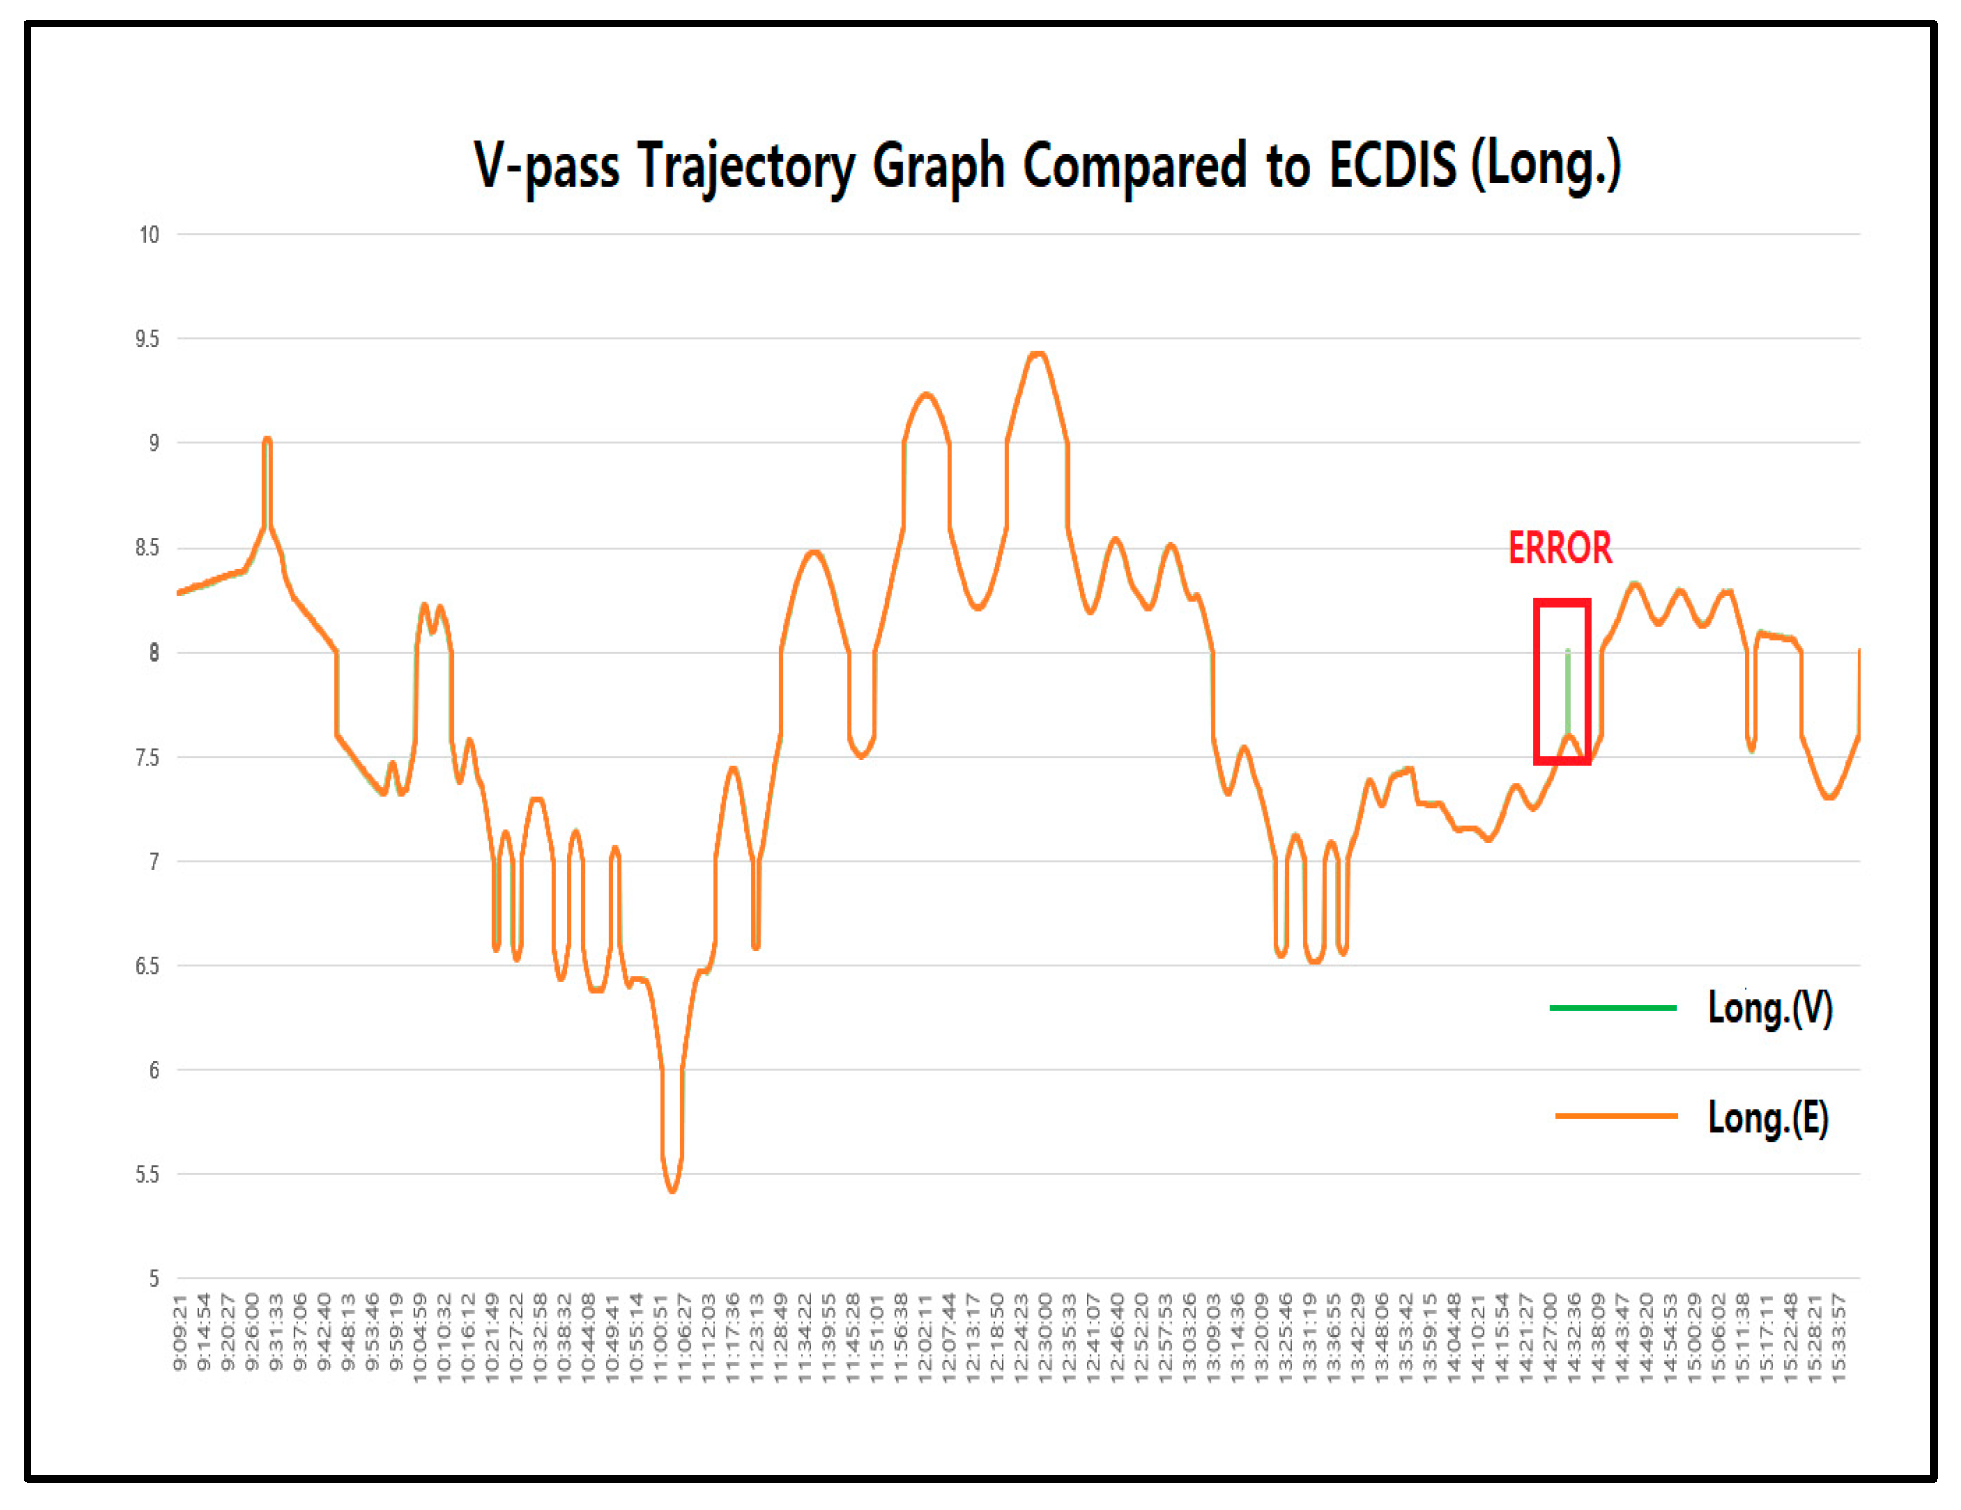
Figure 24, but errors occur depending on time information in some sections. However, when comparing the V-pass and ECDIS trajectories, it can be seen that most of the trajectories match, as shown in
Figure 25 and
Figure 26, and the error is severe in one section of
Figure 26. This is the section of B-1 and B-2 of
Figure 11, where the V-pass error was severe, and other parts except for this section were found to be more similar to the ECDIS trajectory than the AIS trajectory.
4. Discussion
The cause of the errors in the location tracks of AIS and V-pass terminals, which are mainly used for fishing boat location transmission, was investigated in a previous study.
According to the previous studies on AIS location error [
26,
27], the factors affecting AIS-data reception rate are attributed to slot occupancy, fading, and interference. Although no large differences existed between open-water and coastal areas, determining the effect of AIS data error is difficult.
According to the authors of [
28], the AIS-signal failure rate is generally high in areas cluttered with obstacles, such as islands, and when sailing near the lower part of the AIS base-station antenna (60 m).
As reported previously [
25], V-pass transmits fishing boat location data to land and ship-based data communication equipment every 5–90 s; subsequently, land-based data communication equipment sends response messages to the fishing boat communication equipment. Therefore, the location error of the V-pass is slightly larger than that of other terminals in areas where the experimental sea area includes islands.
The above experimental results show that, by comparing the ECDIS (DGPS) information with time information in a linear graph, we can estimate the amount of data missing in a fishing boat location transmitter that lacks time information.
A comparison of the shape of the graph and the time zone enables an analysis of the trajectory, thereby identifying the intervals where errors occur frequently.
The results showed that considerably fewer data were missing in the DGPS calibration data over the period than in the GNSS location data, and the shorter the storage or transmission interval, the more accurate the location information obtained.
The shorter the storage or transfer interval, the more accurate the obtained location information. Statistical analysis indicated that the accuracy of PE values is related to the number of data stored in the same time period. Some terminals missed GNSS information because they did not receive it at a fixed time, and through comparing the two terminals AIS and V-pass, which are fishing boat location transmitters, the PE value of the terminal storing more location information was observed to be more accurate.
To store more data and use more frequencies, additional frequencies can be simultaneously used to exchange information via radio communication.
In this experiment, we compared the reference tracks of ECDIS with the tracks of the mainly used fishing boat location transmitters V-pass and AIS class B to determine their precision.
Furthermore, additional research should be conducted to determine the precision of V-pass terminals that have not been studied in-depth in terms of location accuracy and communication environment to determine methods for their improvement.
5. Conclusions
No significant change was observed in the position between the straight and curved navigation of the AIS and V-pass terminals when the route data of the straight and curved portions were compared using the experimental ship. In ECDIS, some straight sections had less PE than curved sections.
By comparing the three terminals (ECDIS, AIS, and V-pass), we established that the ECDIS position was recorded relatively accurately; however, it also fluctuated while jumping at intervals of 10–30 s or moved away parallelly for 8–30 s.
The V-pass was found to be the most severe, with a maximum of 168 m, whereas the AIS was up to 51 m and ECDIS was 28 m.
The overall average value of the latitude and longitude of the three terminals was obtained, and the PE was obtained by determining the deviation between AIS and V-pass based on the ECDIS position. The V-pass terminal received GNSS signals and stored them regularly compared to AIS; therefore, PE was reduced in our calculations.
The V-pass, AIS, and e-NAV [
29,
30] navigation instruments are used by the operators of various vessels; however, AIS terminals have only been installed on fishing boats with a total tonnage of more than 10 t. In particular, the V-pass terminals used in most fishing boats are not exposed to other ships and cannot observe the location of other ships. In addition, fishing boats’ location tracking equipment is mainly for rescue, departure, and entry rather than collision prevention. Therefore, after a marine accident occurs, it is often necessary to extract the flight from the terminal and check the cause.
In this study, DGPS location information and GNSS location information were compared to verify the location accuracy of the trajectories in the fishing vessel V-pass and AIS terminals. The experimental results can help predict the maximum possible location error depending on GNSS information and correction when analyzing the location data extracted from the accident ship terminal in the future.
In the future, additional experiments should be conducted to assess the accuracy of various types of location transmitter terminals used on fishing boats to ensure safe navigation, adequate responses to various marine accidents [
31,
32], and the safe operation of fishing boats.


