Article

Numerical Study on Ductile Failure Behaviours of Steel Structures under Quasi-Static Punch Loading

1
State Key Laboratory of Materials Synthesis and Processing, Wuhan University of Technology, Wuhan 430070, China
2
School of Naval Architecture, Ocean and Energy Power Engineering, Wuhan University of Technology, Wuhan 430063, China
3
Department of Civil and Environmental Engineering, National University of Singapore, Singapore 117576, Singapore
4
Foshan Xianhu Laboratory of the Advanced Energy Science and Technology Guangdong Laboratory, Xianhu Hydrogen Valley, Foshan 528200, China
5
Hubei Key Laboratory of Theory and Application of Advanced Materials Mechanics, Wuhan University of Technology, Wuhan 430070, China
*
Authors to whom correspondence should be addressed.
J. Mar. Sci. Eng. 2023, 11(6), 1197; https://doi.org/10.3390/jmse11061197
Submission received: 13 May 2023 / Revised: 5 June 2023 / Accepted: 6 June 2023 / Published: 9 June 2023
(This article belongs to the Section Ocean Engineering)

Abstract

:
A reliable finite element procedure to simulate shear-dominated ductile fractures in large-scale, thin-walled steel structures is still evolving primarily due to the challenges in determining the failure criterion of metal materials under complex stress states. This paper aims to examine the accuracy of the modified Gurson–Tvergaard–Needleman (GTN) model considering the shear failure in simulating the ductile fracture of steel plate structures under quasi-static punch loading. The modified GTN damage models are performed by the ABAQUS user-defined material subroutine (VUMAT). The void-related parameters and shear damage parameters of Xue’s and the N-H modified GTN models are calibrated from test specimens with various geometries corresponding to different stress triaxiality and shearing conditions. The damage evolution associated with shearing of voids in the modified GTN models has strong influences on the stress triaxiality versus plastic strain under complex stress states, especially for the shear-dominated loading conditions. Based on the original GTN model, Xue’s and the N-H modified GTN model with calibrated material parameters, a numerical comparative study examines the ductile fracture of steel non-stiffened plates and stiffened plates under punch loading. Benchmarked against the experimental studies, the numerical simulations demonstrate that the shear-driven void evolution in the modified GTN model imposes significant effects on the load–displacement responses as well as the onset and extension of ductile fractures in steel plates under punch actions. The N-H modified model with calibrated shear damage parameters shows a better correlation with the ductile fractures in steel plates observed in the experiment than the original GTN model and Xue’s modified GTN model. As a result of this study, the modified GTN model considering shear action can be applied for practical applications in the crashworthiness assessment of ship collision and grounding.

1. Introduction

Ship collision and grounding accidents have become common events with increasing tonnage and busier traffic routes. In a collision or grounding accident, the penetration and damage of the ship structure may cause loss of life and property as well as potential pollution [1]. In most cases, ship collision or grounding events are the scenarios of structures subjected to local quasi-static loads with a low loading speed and large loading mass. The crashworthiness analysis of a structure subjected to localised quasi-static punch load is widely used in the safety assessment in the early design stage of a ship. It is very important to develop an effective and accurate assessment procedure for the crashworthiness of a structure under localised load. Consequently, a comprehensive understanding of the failure mechanisms, including the fracture failure driven by shear actions, in marine structures under local quasi-static loads thus becomes essential to enhance the integrity of these structures.
The explicit finite element method is often used to analyse accidental responses of large-scale and thin-walled steel structures due to the rapid development of computational technology. However, the simulation of cracking evolution in marine structures is a challenging task in the ship collision or grounding analysis, especially in the determination of the fracture criterion under large shear actions. Numerical simulations for the penetration responses of a structure including highly nonlinear elastic-plastic deformations until rupture are also intriguing. The elastic-plastic behaviour until the stage of necking can be captured well with the FE method, but beyond the onset of necking, the correspondence to reality for structure fracture may be very poor [2]. Simulations of fracture processes of structures need both accurate material models and failure criteria to address the failure elements. For steel materials under predominantly tensile loading, many researchers have proposed different failure criteria for ductile fracture, including the critical equivalent plastic strain (EPS) criterion, the Rice–Tracey–Cockcroft–Latham (RTCL) criterion [3,4], the GTN damage criterion [5,6,7,8], the Bressan–Williams–Hill (BWH) instability criterion [9], and the Forming Limit Diagram (FLD) [10,11]. Although the BWH criterion and the RTCL damage criterion can predict the resistance versus penetration depth of steel structures under punching action satisfactorily with calibrated material models and appropriate mesh size [12], they cannot be used to reveal the influence mechanisms of material shearing behaviour on the structural responses.
The porous plasticity-inspired micro-mechanical models are widely used in ductile fracture analysis. Some studies [5,8,13,14,15,16,17,18] for ductile fracture analysis have been conducted using the popular GTN model. Gurson [5] first developed a pressure-dependent constitutive relation for yielding a porous material. Tvergaard and Needleman [8] then extended Gurson’s model by improving the yield condition to incorporate the coalescence of micro-voids. Faleskog et al. [13] conducted the micromechanics calibration of void growth considering material strain hardening based on the GTN model. Kim et al. [14] investigated the influences of initial porosity and stress triaxiality on void growth and coalescence. Qian et al. [15,16] investigated the ductile fracture behaviour of tubular joints and ductile crack extension of the API 5L X65 steel pipeline through the GTN plasticity damage model. Gholipour et al. [17] used the GTN model to simulate the ductile fracture of in situ tensile testing specimens under different stress states. Yan et al. [18] carried out numerical simulations for ductile fracture of the cold-formed S700 steel using the GTN model.
Despite its success in simulating ductile fractures in metallic materials under medium to high stress triaxialities, the critical weakness of the GTN model lies in its inability in describing the fracture driven predominantly by shear actions under low stress triaxiality. In pure shear conditions where the stress triaxiality is zero, the void growth behaviour in the GTN model prohibits the void growth, which requires positive mean stress. To deal with this problem, some researchers have modified the GTN model according to the failure criterion of voids in the internal shear band proposed by McClintock et al. [19]. Xue [20,21] developed an extended stress-state function to distinguish tension and shear stress states and modified the GTN model considering the shear actions of voids. Then, Nahshon and Hutchinson [22] proposed a damage law in the GTN model to account for the damage accumulation under shearing. Butcher et al. [23] numerically simulated steel straight tube hydroforming (DP600) using a modified GTN constitutive model to account for the influence of void shape and shear on coalescence. Zhou et al. [24] coupled the volumetric damage and the shear damage into the yield function and flow potential of the GTN model, which can simulate shear-induced damage by combining the damage mechanics method with the void growth model. Malcher et al. [25] assessed two different shear mechanisms proposed by Xue [20] and Nahshon and Hutchinson [22] for the prediction of crack formation. Li et al. [26] developed a modified GTN-Thomason criterion for modelling ductile failures of a metal material. He et al. [27] proposed an ISMGTN model considering shear failure and containing two independent damage mechanisms. This model was used for ductile fracture prediction of aluminium alloys under different stress states.
The literature review shows that the modified GTN models considering the shear influences on coalescence are widely used in ductile fracture analysis under different stress states for some small-scale material specimens. Very little work for ductile failure analysis of a large-scale thin-walled structure using the above-mentioned GTN models is reported. The structures under quasi-static punch load exhibited strong shear failure behaviours in both the accidental scenarios and model tests, as mentioned in Ref. [28]. It is difficult for the current failure models to clearly investigate the influences of material shear failure characteristics on structural responses under quasi-static punch loading, such as the EPS criterion, the RTCL criterion, and the BWH instability criterion. Developing a reliable and accurate numerical failure model to simulate the shear-dominated ductile fracture of large-scale, thin-walled steel structures is still a research difficulty due primarily to the challenges in determining the fracture criterion of steel materials under complex stress states.
Therefore, this paper aims to apply the modified GTN model considering shear effects to numerical failure analysis of steel structures under quasi-static punch loading and assess the influences of the shear damage on coalescence on the resistance to penetration response of the structure. The accuracy of simulations for the ductile fracture of steel structures under quasi-static punch loading using the modified GTN model are verified by experimental results in the paper. This paper starts with the description of the modified GTN model considering shear effects proposed by Xue [20] and Nahshon and Hutchinson [22]. The modified GTN damage models presented in this section are implemented in ABAQUS software via a VUMAT subroutine. The next section presents a series of numerical simulations on the ductile fracture of in situ tensile tests under different stress states using the modified GTN model. In this section, the void-related and damage parameters in the model are calibrated based on the experimental results. The subsequent section carried out numerical simulations for fracture behaviours of non-stiffened and stiffened steel plates under quasi-static punch loading using the modified GTN model. The numerically obtained force–displacement results are compared with the experimental ones. The last section summarizes the conclusions drawn from this study. The research of this paper can provide a useful tool to simulate the failure behaviour of structures in ship collision and grounding.

2. Description of the Constitutive Model
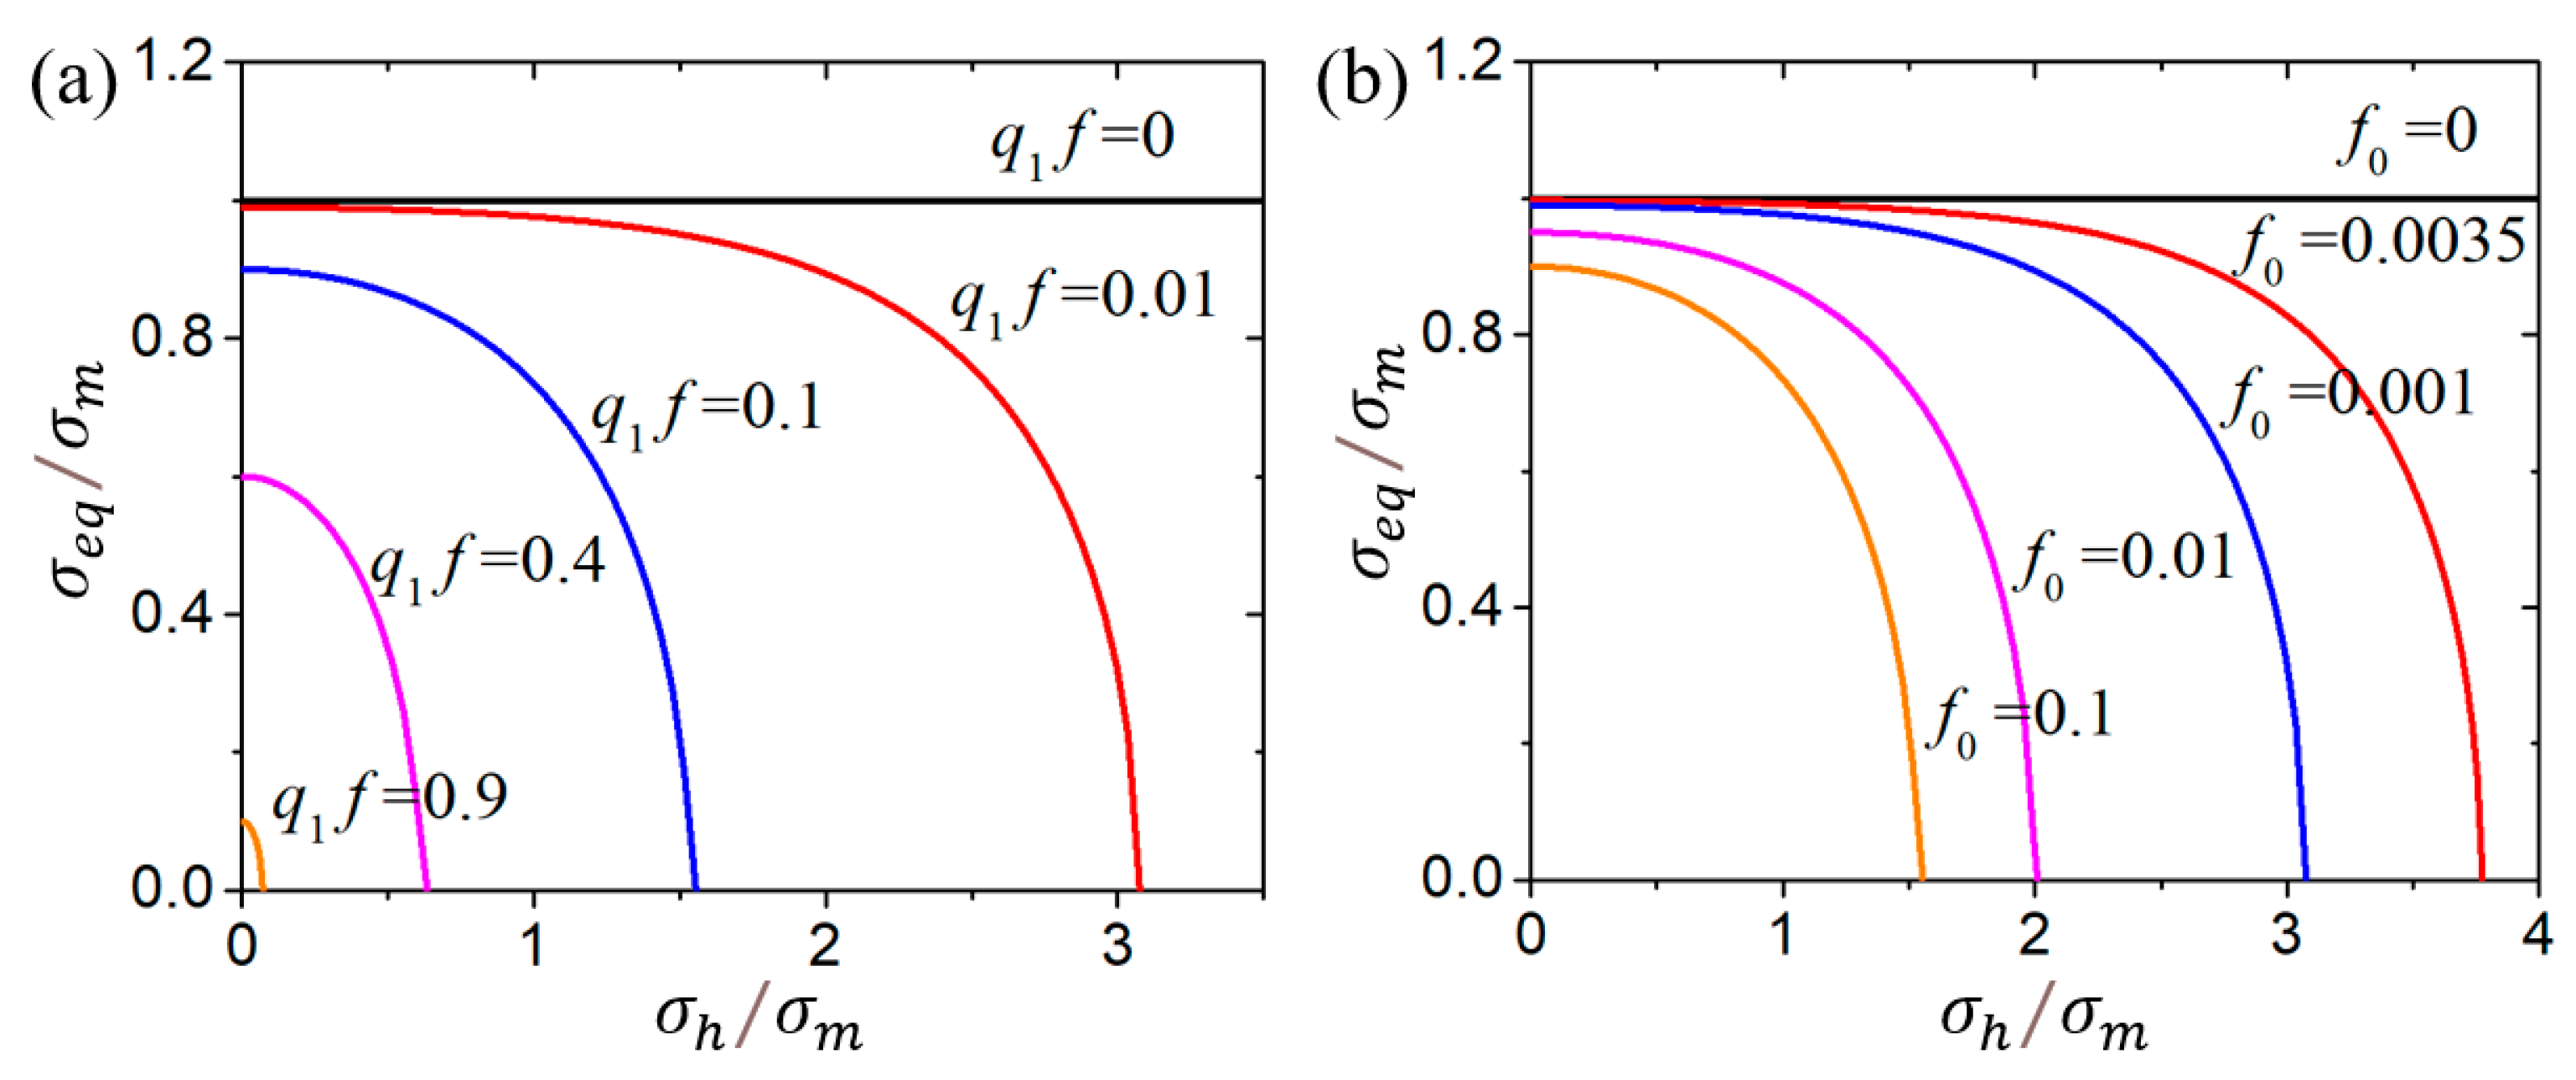
2.1. GTN Model

Gurson [5] initially developed a pressure-dependent yield function from an isolated spherical void in a continuum medium. Then, Tvergaard and Needleman [6,7,8] enhanced Gurson’s model to construct the GTN model theory containing porous plasticity. In the GTN model [5,6,7,8], the yield function of the GTN model is written as
ϕ = σ e q σ m 2 + 2 q 1 f * cosh 3 q 2 σ h 2 σ m 1 + q 3 f * 2 = 0
where ϕ is the yield function, σ e q is the von Mises stress of material, σ e q = 1 2 σ 1 σ 2 2 + σ 1 σ 3 2 + σ 2 σ 3 2 , and σ m is the yield stress as a function of equivalent plastic strain in the matrix ε ¯ m p ; σ h is the macroscopic hydrostatic pressure, σ h = p = 1 3 σ 1 + σ 2 + σ 3 , q1, q2, q3 are the coefficients, and q 3 = q 1 2 . The equivalent void volume fraction f* is a function of the current void volume fraction f:
f * = f   f < f c f c + 1 q 1 f c f c f c f f f c f c   f < f f
where fc and ff are the critical void fraction and the void volume fraction at fracture, respectively. The void coalescence will occur when the void volume fraction reaches a critical value fc, and the material will fail when the void volume fraction reaches the value of ff. Equation (2) works very well for low-stress triaxiality cases but slightly worse for high triaxiality cases [29].
The increase in the void volume fraction under loading comes from two parts: the original void growth and the extended void nucleation. The total change rate of the void volume fraction is written as
f ˙ = f ˙ g r o w t h + f ˙ n u c l e a t i o n
where f ˙ g r o w t h is the change rate of voids owing to growth, and f ˙ n u c l e a t i o n is the change rate of voids owing to the extended void nucleation.
The matrix material is assumed to be plastically incompressible. Therefore, the void growth rate can be expressed as
f ˙ g r o w t h = 1 f ε ˙ p : I
where I is the second-order unit tensor, and ε ˙ p is the macroscopic plastic strain rate tensor. A normal distribution of void nucleation versus the plastic strain is expressed as
f ˙ n u c l e a t i o n = A ε ¯ ˙ m p
where ε ¯ ˙ m p is the plastic strain rate, and the void nucleation coefficient A controlled by strain is
A = f N s N 2 π exp 1 2 ε ¯ m p ε N s N 2 ε ¯ ˙ m p
where fN represents the limit value of volume fraction of all particles with potential for micro-void nucleation, ε N is the average equivalent plastic strain, sN is the standard deviation of the distribution.
In porous materials, the plastic flow is related to the void volume fraction and the accumulated plastic strain. The matrix plastic strain is related to the macroscopic strain by the equivalence of the rate of the plastic work, which can be shown as
σ : ε ˙ p = 1 f σ ¯ m ε ¯ ˙ m p
where σ is Cauchy’s stress tensor. Therefore, the cumulative plastic strain can be written as
ε ¯ ˙ m p = σ : ε ˙ p 1 f σ ¯ m
If the hydrostatic pressure effect is ignored, the yield function of the GTN model will be
ϕ = σ e q σ m 2 1 q 1 f * 2 = 0
When f = 0, the yield surface is the original Mises yield surface. The presence of a nonzero f value effectively shrinks the original Mises yield surface, as shown Figure 1. According to Equation (1), the yield surface in the σ e q σ h plane under different equivalent void volume fractions can be obtained as shown in Figure 1. The damage accumulation forces a strong dependence of the yield surface and the plastic potential on the hydrostatic stress, in contrast to the original Mises yield surface which is independent of the mean stress.

2.2. Modified GTN model for Shear Failure

The original GTN model cannot capture localization and fracture for low triaxialities in shear-dominated deformations. Under shear actions, the distortion of voids and inter-void linking promotes an effective increase in the material’s internal degradation and contributes to material softening.

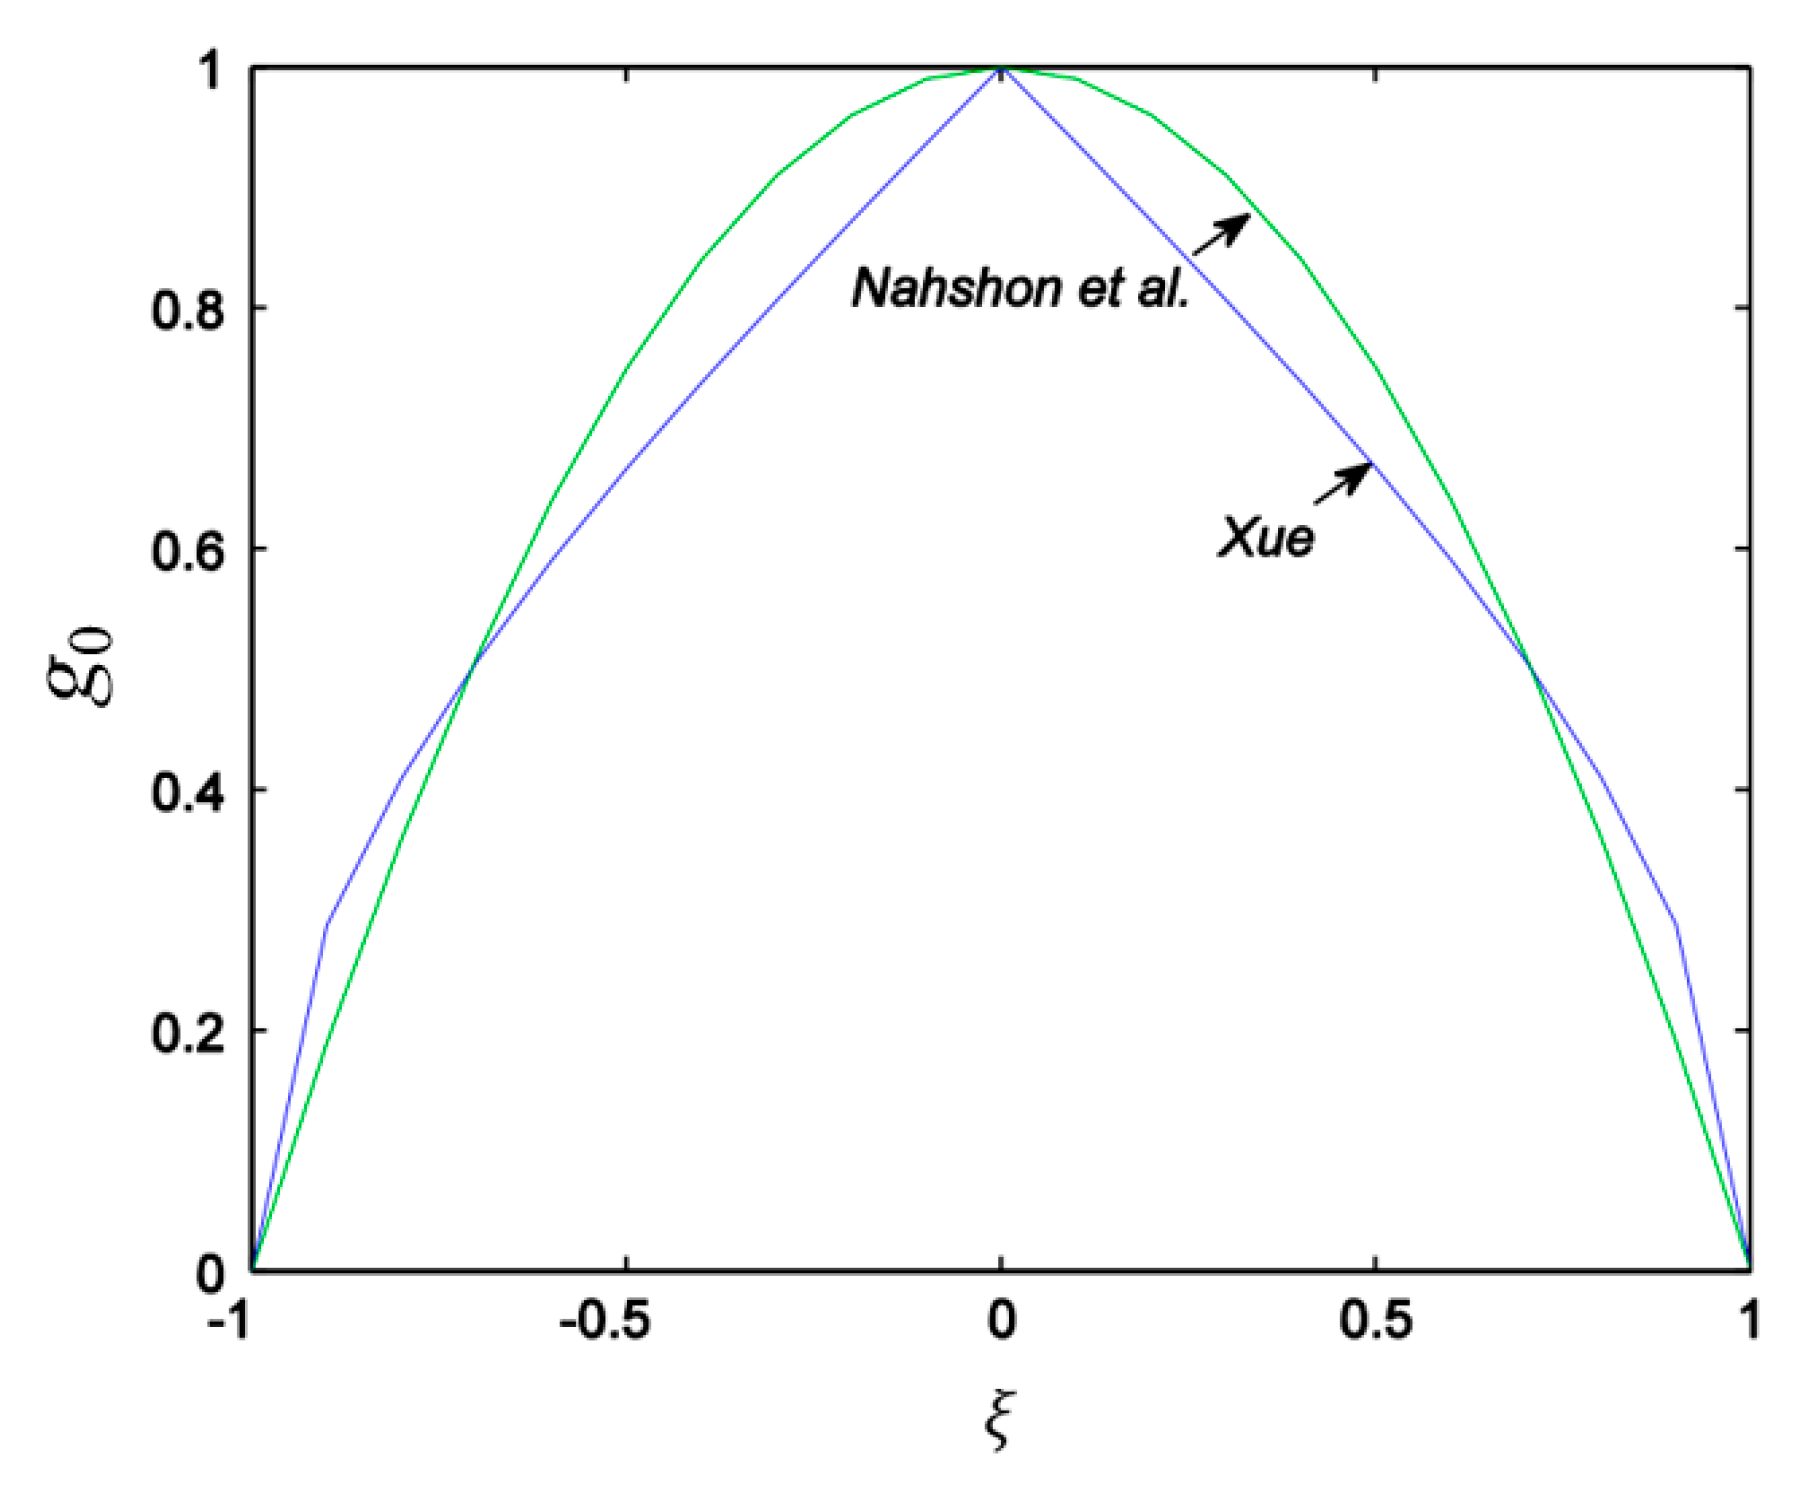
2.2.1. Xue’s Modified GTN Model

Xue [20] further extended the original GTN model to incorporate the void shearing damage and assumed that the relative position of the void does not change, as shown in Figure 2. With the shear strain increasing, the distance between the free surface and the boundary of the representative volume element decreases. The cell in the initial undeformed configuration and in the deformed configuration is shown in Figure 2.
In the undeformed configuration, the minimal distance between the free surface and the boundary of the cell is
a = L / 2 R
The shear strain γ in the deformed configuration is
γ = tan α
where α is the deformation angle seen in Figure 2b. The minimal distance at a deformed configuration is
a = a cos α = a 1 1 + γ 2 a
With the logarithm definition of strain, the artificial strain ε a r t is defined as
ε a r t = ln a a = ln 1 + γ 2
Additionally, the failure shear strain in the shear band ε s h e a r b a n d for a small void volume is defined as
ε s h e a r b a n d = L / 2 R
The damage with respect to the shearing of the void is expressed as
D s h e a r = ε a r t / ε s h e a r b a n d = 2 R ln 1 + γ 2 / L
Using Taylor’s expansion for γ = 3 ε e q , the artificial strain is reduced to the leading terms, which can be expressed as
ε a r t = 1 2 γ 2
Therefore, Equation (17) can be rewritten as
D s h e a r γ 2 π / f = 3 π f 1 / 2 ε e q 2
where f = π R 2 / L 2 is the void volume fraction of the cell. Equation (17) can be only used for a 2D problem.
For the 3D case, a spherical void of radius R is at the centre of the representative cell of length L. A similar relation for damage associated with void shearing can be obtained as
D s h e a r = 3 2 6 π 1 / 3 f 1 / 3 ε e q 2
where f = 4 π R 3 / 3 L 3 is the void volume fraction for the 3D cell. The evolution of shear damage can be written using the rate form:
D ˙ s h e a r = q 4 f q 5 ε e q ε ˙ e q
where q4 = 1.69 and q5 = 1/2 for a 2D cell structure, and q4 = 3.72 and q5 = 1/3 for a 3D cell structure. Xue [20] mentioned that for intermediate to large values of f (f > 0.05), Equation (19) becomes less accurate, and the material constant q4 should be calibrated based on the experimental results.
The rate of the void volume fraction can be expressed by the sum of the void growth and the void nucleation and the void shearing as
D ˙ = f ˙ n u c l e a t i o n + f ˙ g r o w t h + D ˙ s h e a r
The Lode angle related to the third invariant of the deviatoric stress tensor is an important parameter in the characterization of the stress rate effect on the ductile failure of the material. The function of the Lode angle proposed by Xue [20] is defined as
g 0 = 1 θ ¯
where g0 represents the Lode angle function, and θ ¯ is the normalized Lode angle which assumes values between 1 θ ¯ 1 . The end conditions of g 0 = 0 for the generalized tension ( θ L = 30 ° ) and g 0 = 1 for the generalized shear ( θ L = 0 ° ) should be satisfied, where the Lode angle θ L is
θ L = tan 1 1 3 2 χ 1
θ = 6 π θ L
In Equation (22), χ = s 2 s 3 / s 1 s 3 , and s1, s2, and s3 are the principal values of the deviatoric stress tensor.

2.2.2. Nahshon and Hutchinson’s (N-H) Modified GTN Model

Nahshon and Hutchinson [22] developed a function to quantify the shearing damage effects of voids at low triaxiality, which was directly added to the total change rate of the void volume fraction, although it cannot represent a physical accumulation of the porosity. The extended shear failure term assuming linear relations of the porosity and the deviatoric plastic strain rate is written as
D ˙ s h e a r = k s f ω s : ε ˙ p q
The void volume fraction rate is expressed by the sum of the growth of voids and shear effects by
D ˙ s h e a r = 1 f ε ˙ p : I + k s f ω s : ε ˙ p q
where ks is a defined damage parameter used for scaling the magnitude of the damage growth rate in shear loading, and ω is the function of the stress states, which is defined by
ω = 1 ξ 2 = 1 cos 2 3 θ = 1 27 J 3 2 q 3 2
where ξ is the Lode parameter defined as
ξ = 27 J 3 2 q 3
where the q is the equivalent stress, q = σ e q , and the third invariant of stress J3 is
J 3 = det s = σ 1 σ m σ 2 σ m σ 3 σ m = s 1 s 2 s 3
In Equation (14), s1, s2, s3 are the principal values of the deviatoric stress tensor.
A Lode angle dependence function was proposed by Nahshon and Hutchinson [22]:
g 0 = 1 ξ 2
where ξ is the normalized third invariant, 1 ξ 1 .
Figure 3 compares the evolution of the Lode angle functions proposed by Nahshon and Hutchinson [22] and Xue [20].
The shear damage evolutions can be rephrased for arbitrary loading conditions as
D ˙ s h e a r = g 0 q 4 f q 5 ε e q ε ˙ e q       for   Xue s   model g 0 k s ε ˙ e q                           for   N - H   model
where
g 0 = 1 θ ¯           for   Xue s   model 1 ξ 2           for   N - H   model
The modified GTN model can simulate the fracture mode dominated by the shear mechanism under low stress triaxiality and account for the effective damage accumulation caused by shear mechanisms such as rotation and torsion of micro-voids under the complex stress stage. This model can provide some physical and mechanical explanations for the ductile fracture of metal to a certain extent. However, there are some issues that need to be studied and discussed. The parameters and damage variables in this model need to be identified and calibrated through extensive numerical simulations, and the mesh sensitivity of the model needs to be discussed. This model is mainly used in ductile fracture analysis under different stress states for some small-scale material specimens but is rarely used for failure analysis of a large-scale thin-walled structure. The study for the application of this model in failure analysis of large-scale thin-walled structures needs to be conducted.

3. Quasi-Static Tension Tests Correlations

The finite element method is widely used in failure analysis of different types of structures [30,31,32,33]. The present section presents the numerical simulations for quasi-static tensile tests to study the fracture mechanism of specimens with various geometries under different stress states. The modified GTN damage model is implemented in ABAQUS software through using the VUMAT subroutine. The void-related parameters and shear failure parameters of the modified GTN damage model elaborated in Section 2 are calibrated based on the results of tensile tests. The correlated parameters can be used for modelling the ductile fracture of a complex structure under quasi-static punch loadings in the next section.

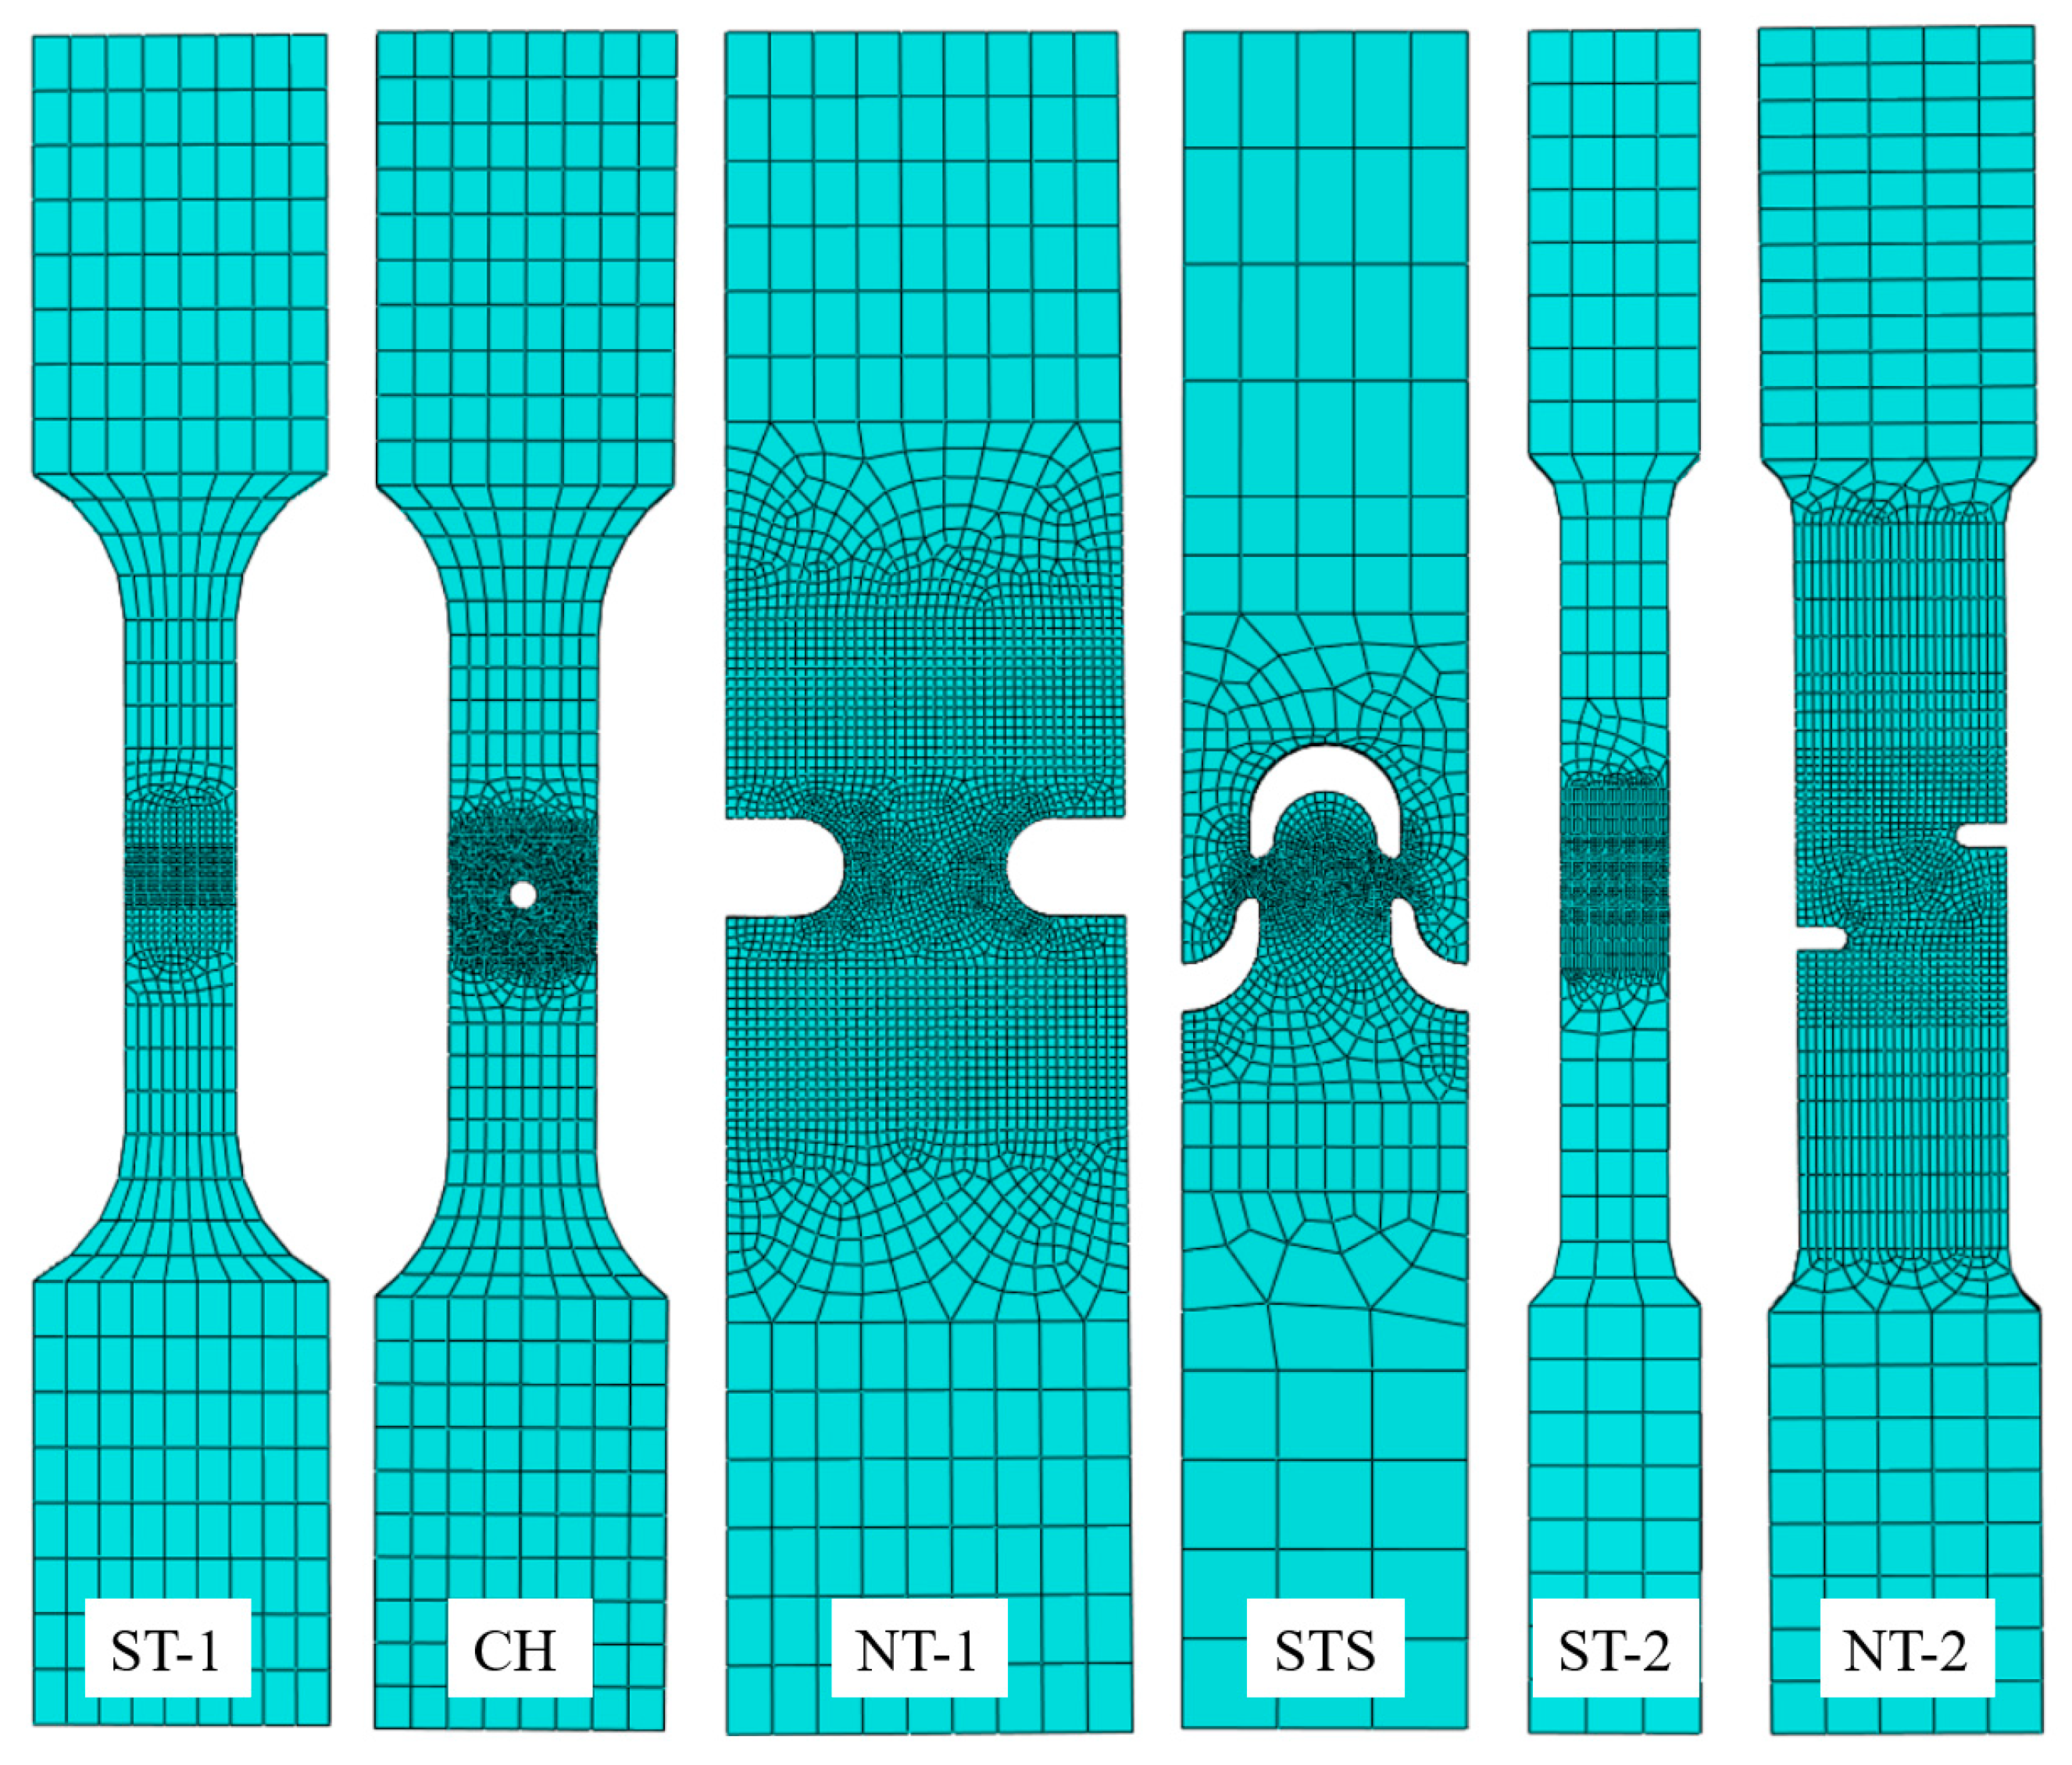
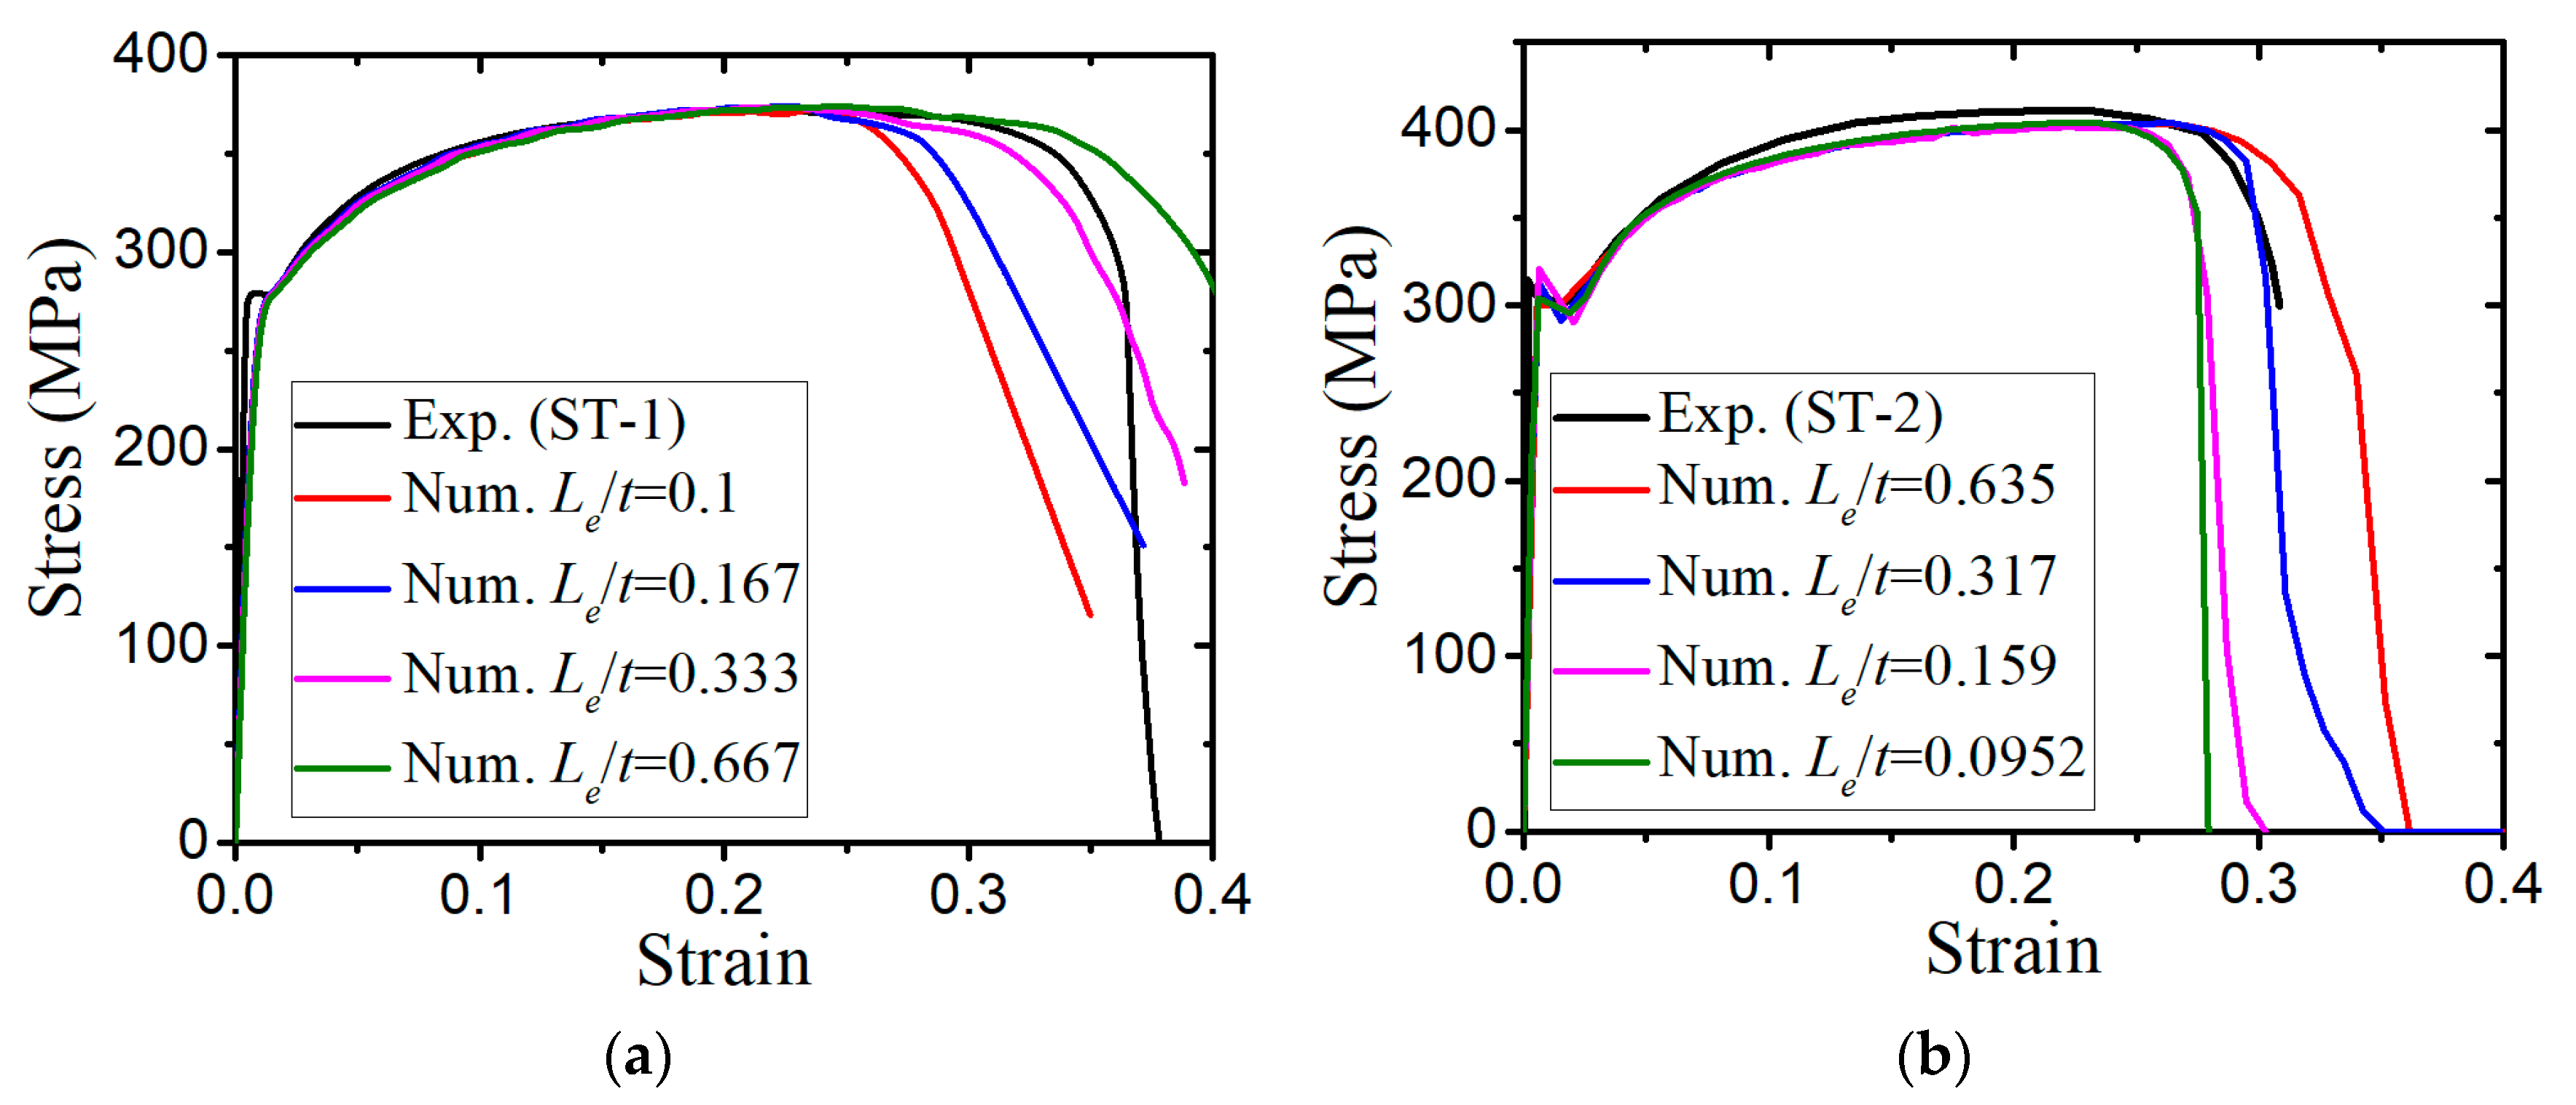
3.1. Finite Element Models for Tensile Specimens

In order to calibrate the parameters of the modified GTN model, seven in situ quasi-static tensile tests [32,33] were chosen to validate the numerical results. Figure 4 shows the dimensions of seven tensile specimens with different shapes. The tensile tests for the first four specimens as shown in Figure 4a–d were conducted by Kõrgesaar et al. [32]. The tensile tests for the last two specimens as shown in Figure 4e,f were carried out by Zhang et al. [33]. The force–displacement responses as well as the failure initiation and crack propagation corresponding to each specimen were obtained in the tensile tests [32,33].
The engineering and true stress–strain relations of steel materials can be obtained according to the load–displacement curves from the tensile tests ST-1 and ST-2. Table 1 lists two types of material parameters of steel specimens. For material 1 [32], the true stress–strain relationship follows a Swift model:
σ e q = σ y                             ε ε L 1 ξ 2               ε > ε L
In this equation, σ e q is the equivalent true stress, σ y is the yield stress, and k and n are the parameters of strain hardening. The strain hardening is delayed until the plastic strain reaches the plateau strain ε L . The parameter ε 0 is
ε 0 = σ y / k 1 / n ε L
For material 2 [33], the equivalent true stress–strain relationship is expressed by a pow–law relation:
σ e q = σ y             ε ε L   k ε n         ε > ε L
A series of 3D models were built with the eight-node solid element with reduced integration (C3D8R) in the FE analysis, as shown in Figure 5. The refined and coarse meshes are used within and outside the central region of specimens, respectively, in order to better capture fracture behaviours of specimens and to reduce the simulation times.

3.2. Parameter Calibration of the Modified GTN Model

In the original GTN model, nine material parameters need to be determined and calibrated based on experimental and numerical results, including coefficients of the yield function (q1, q2 and q 3 = q 1 2 ), void nucleation parameters (f0, fN, ε N , SN), and void volume fractions of coalescence and fracture (fc, ff). In order to ascertain the range of original GTN model material parameters, Table 2 summarizes the GTN model parameters retrieved from a literature review. Most of the references in Table 2 adopt the same quantities of yield function parameters proposed by Tvergaard et al. [8], q1 = 1, q2 = 1.5, q3 = 2.25, ε N = 0.3 , and SN = 0.1. For the N-H modified GTN model, the parameter ks for shear damage needs to be determined. For Xue’s modified GTN model, the parameters q4 and q5 need to be calibrated.
Table 3 lists the range of values for material parameters in the modified GTN models. Based on the numerical simulations for the tensile test (ST-2), the sensitivity analysis of the material parameters (q1, q2, f0, fN, fc, ff) of the GTN model is shown in Figure 6.
The comparisons of numerically obtained load–displacement curves under different GTN parameters are given in Figure 6. They show that the final tension displacement increases with the increase in the parameter values (fc, ff) or with the decrease in the parameter values (q1, q2, f0, fN). The parameter of initial void volume fraction f0 affects the load–displacement response, as it causes a shrink in the yield surface of a material as seen in Figure 1. The other parameters (q1, q2, fN, fc, ff) have no effect on the load–displacement curve prior to necking. Figure 6 also shows that the parameter of the volume fraction for void nucleation fN imposes a strong effect on the load–displacement response of specimen under uniaxial tension. Figure 7 shows the sensitivity analysis of the parameters (q4 and q5) for shear damage in Xue’s modified GTN model. As the parameter q4 decreases or the parameter q5 increases, the final tension displacement will increase. The larger value of q4 or the smaller value of q5 increases the shear damage rate D ˙ s h e a r , which facilitates the fracture failure in the specimen.
Based on the sensitivity analysis of the modified GTN model parameters, Table 4 lists the calibrated material parameters which lead to the closest agreement between the numerically computed and the experimentally obtained load–displacement curves. To account for the mesh size sensitivity of the modified GTN model, FE simulations are conducted with four types of uniform element sizes in the failure zone. For the specimen ST-1, the mesh lengths are chosen as 0.3 mm, 0.5 mm, 1 mm, and 2 mm, which correspond to four different ratios of mesh size over the plate thickness, 0.1, 0.167, 0.333, and 0.667, respectively. For the specimen ST-2, the mesh lengths are chosen as 0.3 mm, 0.5 mm, 1 mm, and 2 mm, which have the corresponding ratios of mesh size over the plate thickness of 0.0952, 0.159, 0.317, and 0.635.
Figure 8 shows the comparisons of engineering stress–strain curves between standard tensile tests (ST-1, ST-2) and numerical simulations with different mesh sizes based on Xue’s modified GTN model. Before the peak force is reached, the simulated engineering stress–strain curves show a reasonable agreement with the experiments for all mesh sizes. A strong mesh sensitivity in the modified GTN model arises at large deformation levels. Differences between the load–displacement curves become more pronounced when the mesh size increases. The displacement at the onset of fracture with fine meshes is obviously smaller than that with medium or coarse meshes. Figure 9 compares the numerically obtained load–displacement curves based on three material models, the original GTN model, N-H modified GTN model, and Xue’s modified GTN model. In Figure 9, the FE models used have a length of 1 mm. The comparisons show that the predicted final tension displacement using the original GTN model is larger than those using the other two modified GTN models, and the shear damage parameter ks of the N-H modified GTN model has little influence on the load–displacement response in the standard tension state.
Figure 10 compares the numerically calculated load–displacement curves for NT-1, NT-2, CH, and STS specimens using the original GTN model, N-H modified GTN model, and Xue’s modified GTN model with the experimental results. The numerical load–displacement curves of the NT-1, NT-2, and CH specimens using the modified GTN model compared well with the experimental ones, whereas some slight discrepancies exist for the case of the STS specimen. The force–displacement relations of the original GTN model are highly overestimated, especially for the displacement at the maximal tension before the fracture occurs. The shear damage parameter ks of the N-H modified GTN model has a significant effect on the prediction of tensile results of the NT-1, NT-2, and STS specimens, except the CH specimen. Figure 11 and Figure 12 present the fracture modes predicted from the FE analysis for the NT-2 and STS specimens. For the NT-2 specimen, the location where the crack initiates and propagates in the numerical simulation of Xue’s modified GTN model agrees with the experimental observation. Due to the differences in the failure criterion, the fracture modes obtained from numerical results of the three GTN models show some divergences. The original GTN model fails to predict the shear failure and leads to an incorrect failure mechanism.
For the tensile shear specimen (STS), the numerical crack initiation and propagation based on the N-H modified GTN model show a good agreement with the experimental observation. In Figure 10d, for Xue’s modified GTN model, the fracture of the STS specimen is captured with a large nominal tension displacement under shear-dominated loading conditions. Compared to the N-H modified GTN model, Xue’s modified GTN model behaves more conservatively, as its peak load is much larger than that of the N-H modified GTN model, and it behaves a much slower post-peak load reduction. For the N-H modified GTN model, the STS specimen fractures with a small nominal tension displacement similar to the experimental data under the same loading condition. Moreover, with the increase in the parameter ks of shear damage, the material fails quickly with a small tension displacement, as the damage rate D ˙ s h e a r associated with void shearing is positively correlated with the parameter ks.
Figure 13 illustrates the evolution of the stress triaxiality with respect to the equivalent plastic strain for each tensile specimen. The stress triaxiality is defined as the ratio of the macroscopic hydrostatic pressure and equivalent effective stress of material, σ h / σ e q . The evolution of the stress triaxiality is evaluated at the element located in the region (marked by the red dot in Figure 13) where the crack initiates. The different stress triaxiality levels for the same material are observed from the different tensile tests with different geometries. As shown in Figure 13, for specimens ST-1, ST-2, CH, and NT-1, the stress triaxialities at low plastic strain levels obtained from three GTN damage models are very close. Moreover, for the standard tensile specimens (ST-1, ST-2), notched specimens (NT-1, NT-2), and central-hole specimen (CH), the stress triaxialities exceed the value of 1/3 corresponding to the uniaxial tension. In contrast, the initial stress triaxialities in the sheared tensile specimen (STS) remain below the uniaxial tension value of 1/3 at a small deformation level. The predicted stress triaxialities versus equivalent plastic strain for all specimens based on three types of GTN models have some differences as the damage evolves in the element with increasing deformation. The damage evolution associated with the shearing of voids has significant influences on the stress triaxiality versus equivalent plastic strain, especially for the shear-tension-dominated loading conditions.

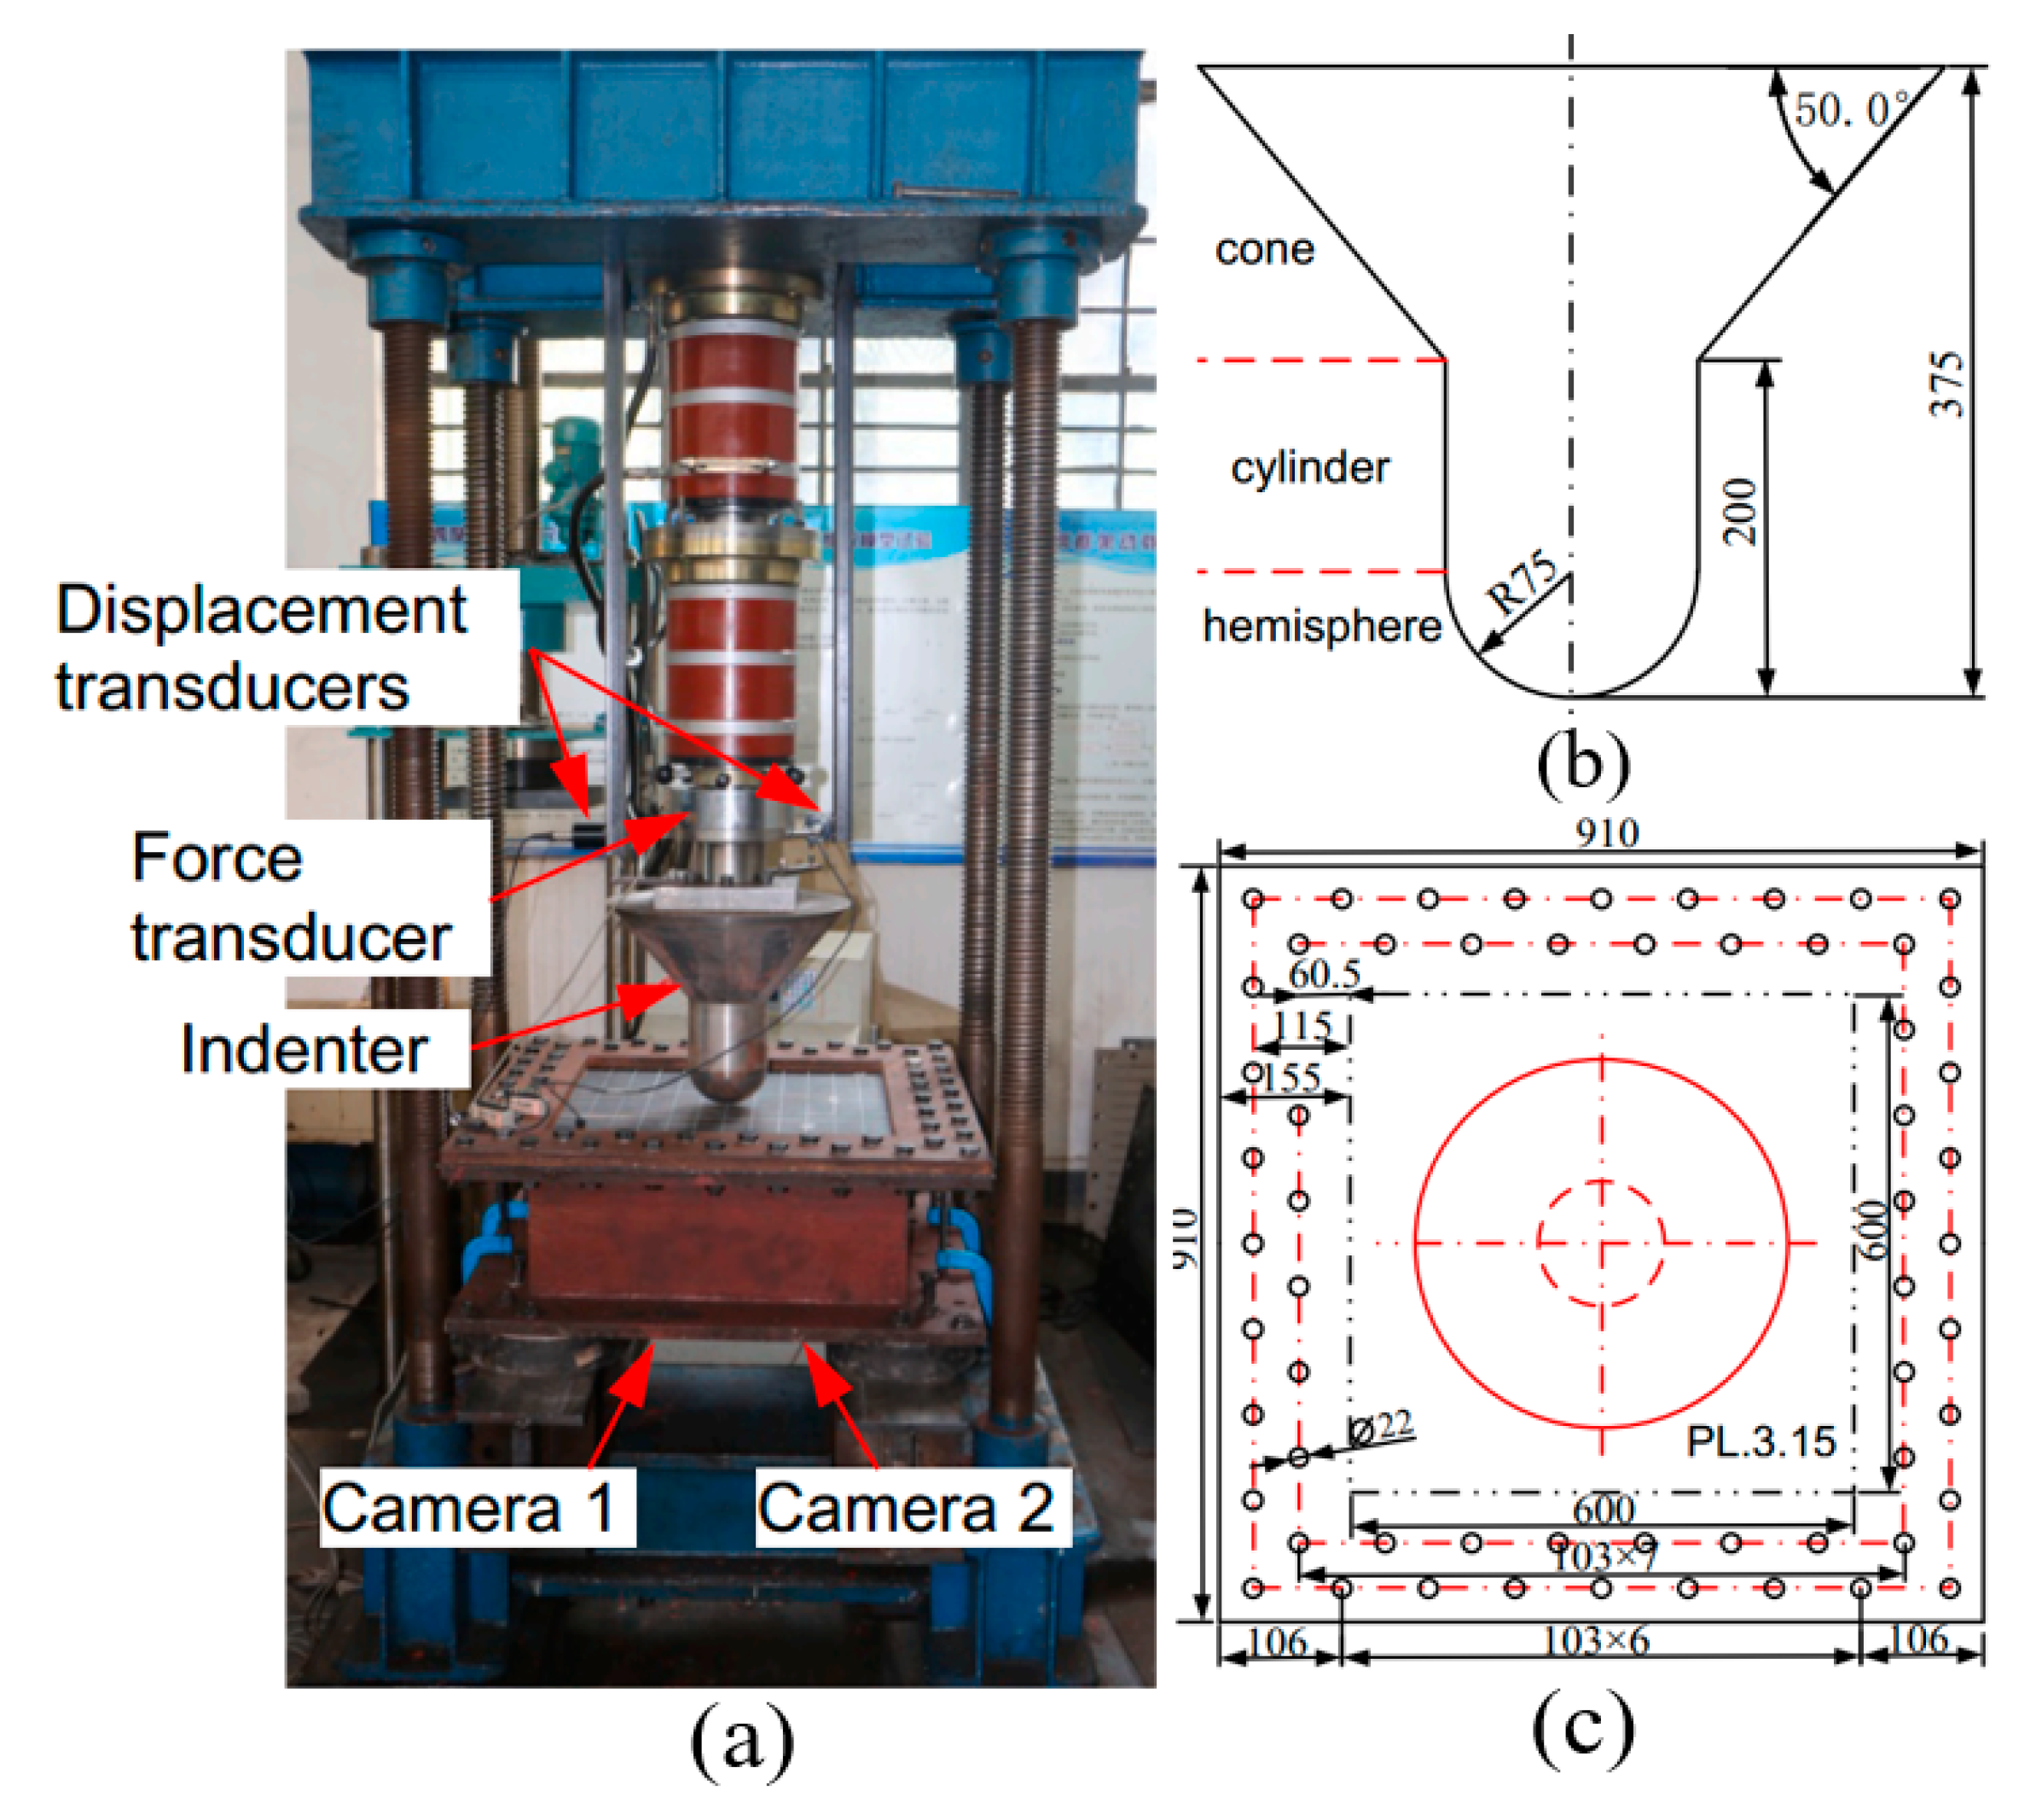
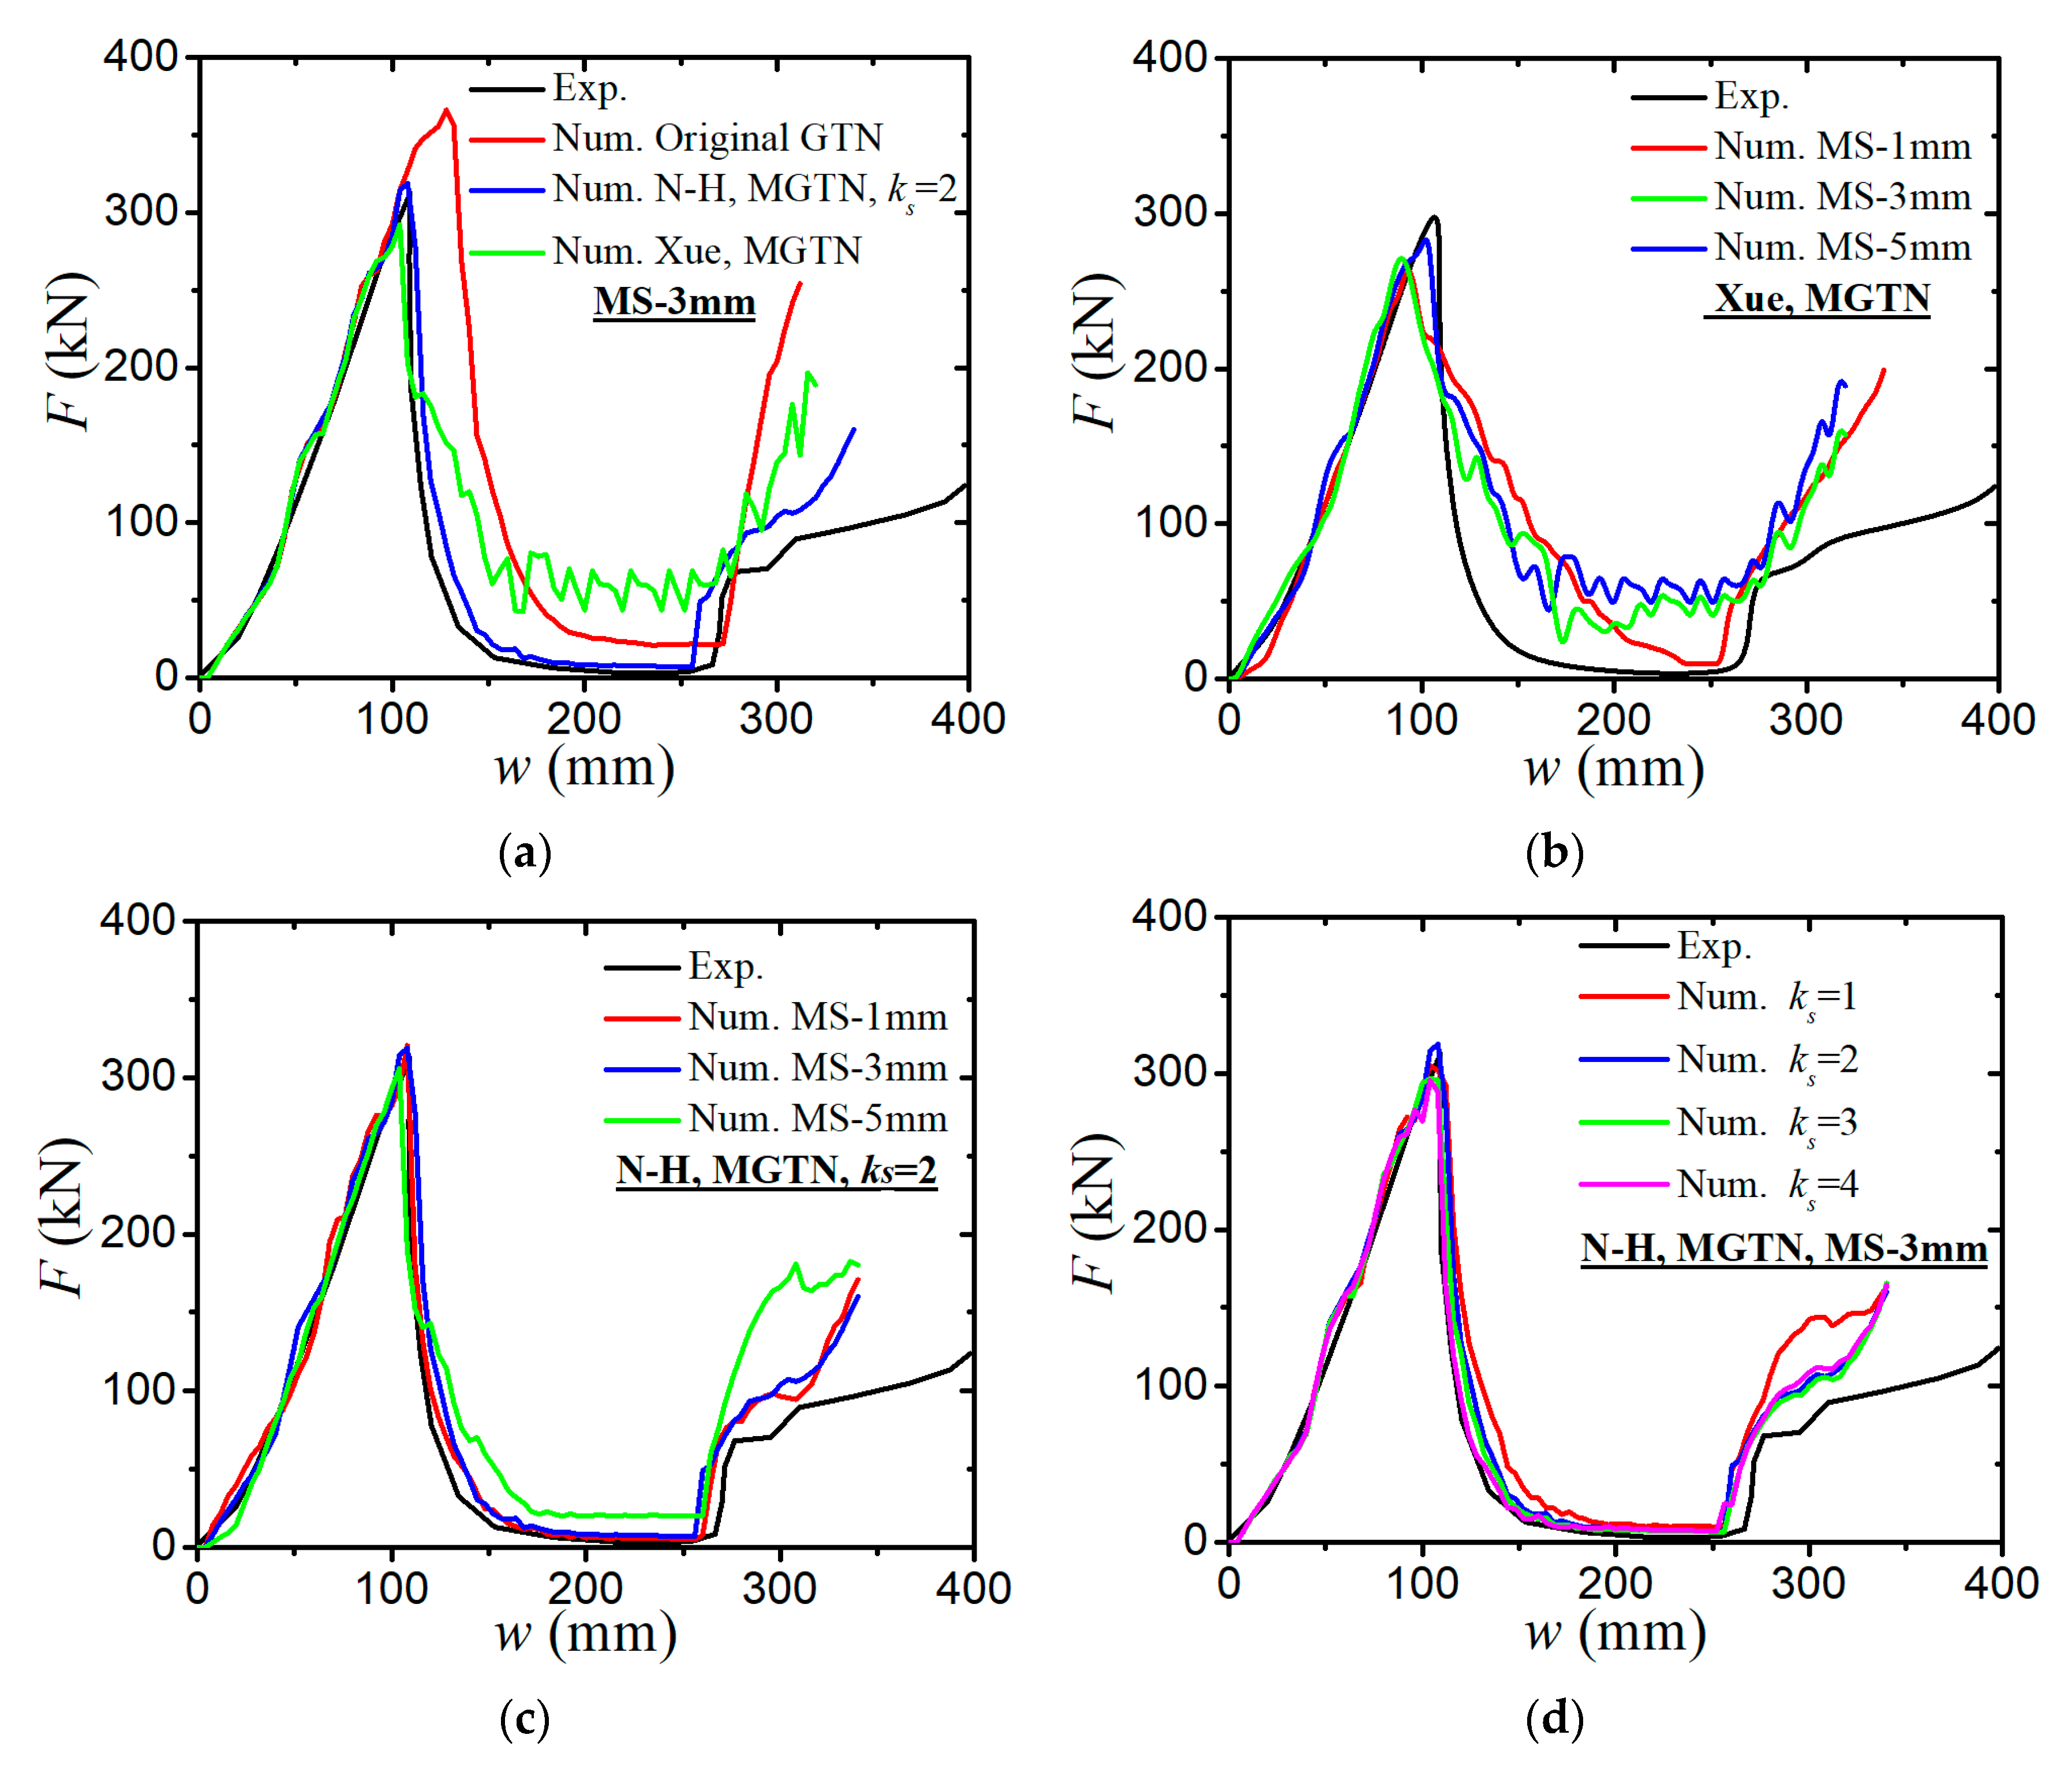
4. Steel-Plated Structures under Quasi-Static Punch Loading

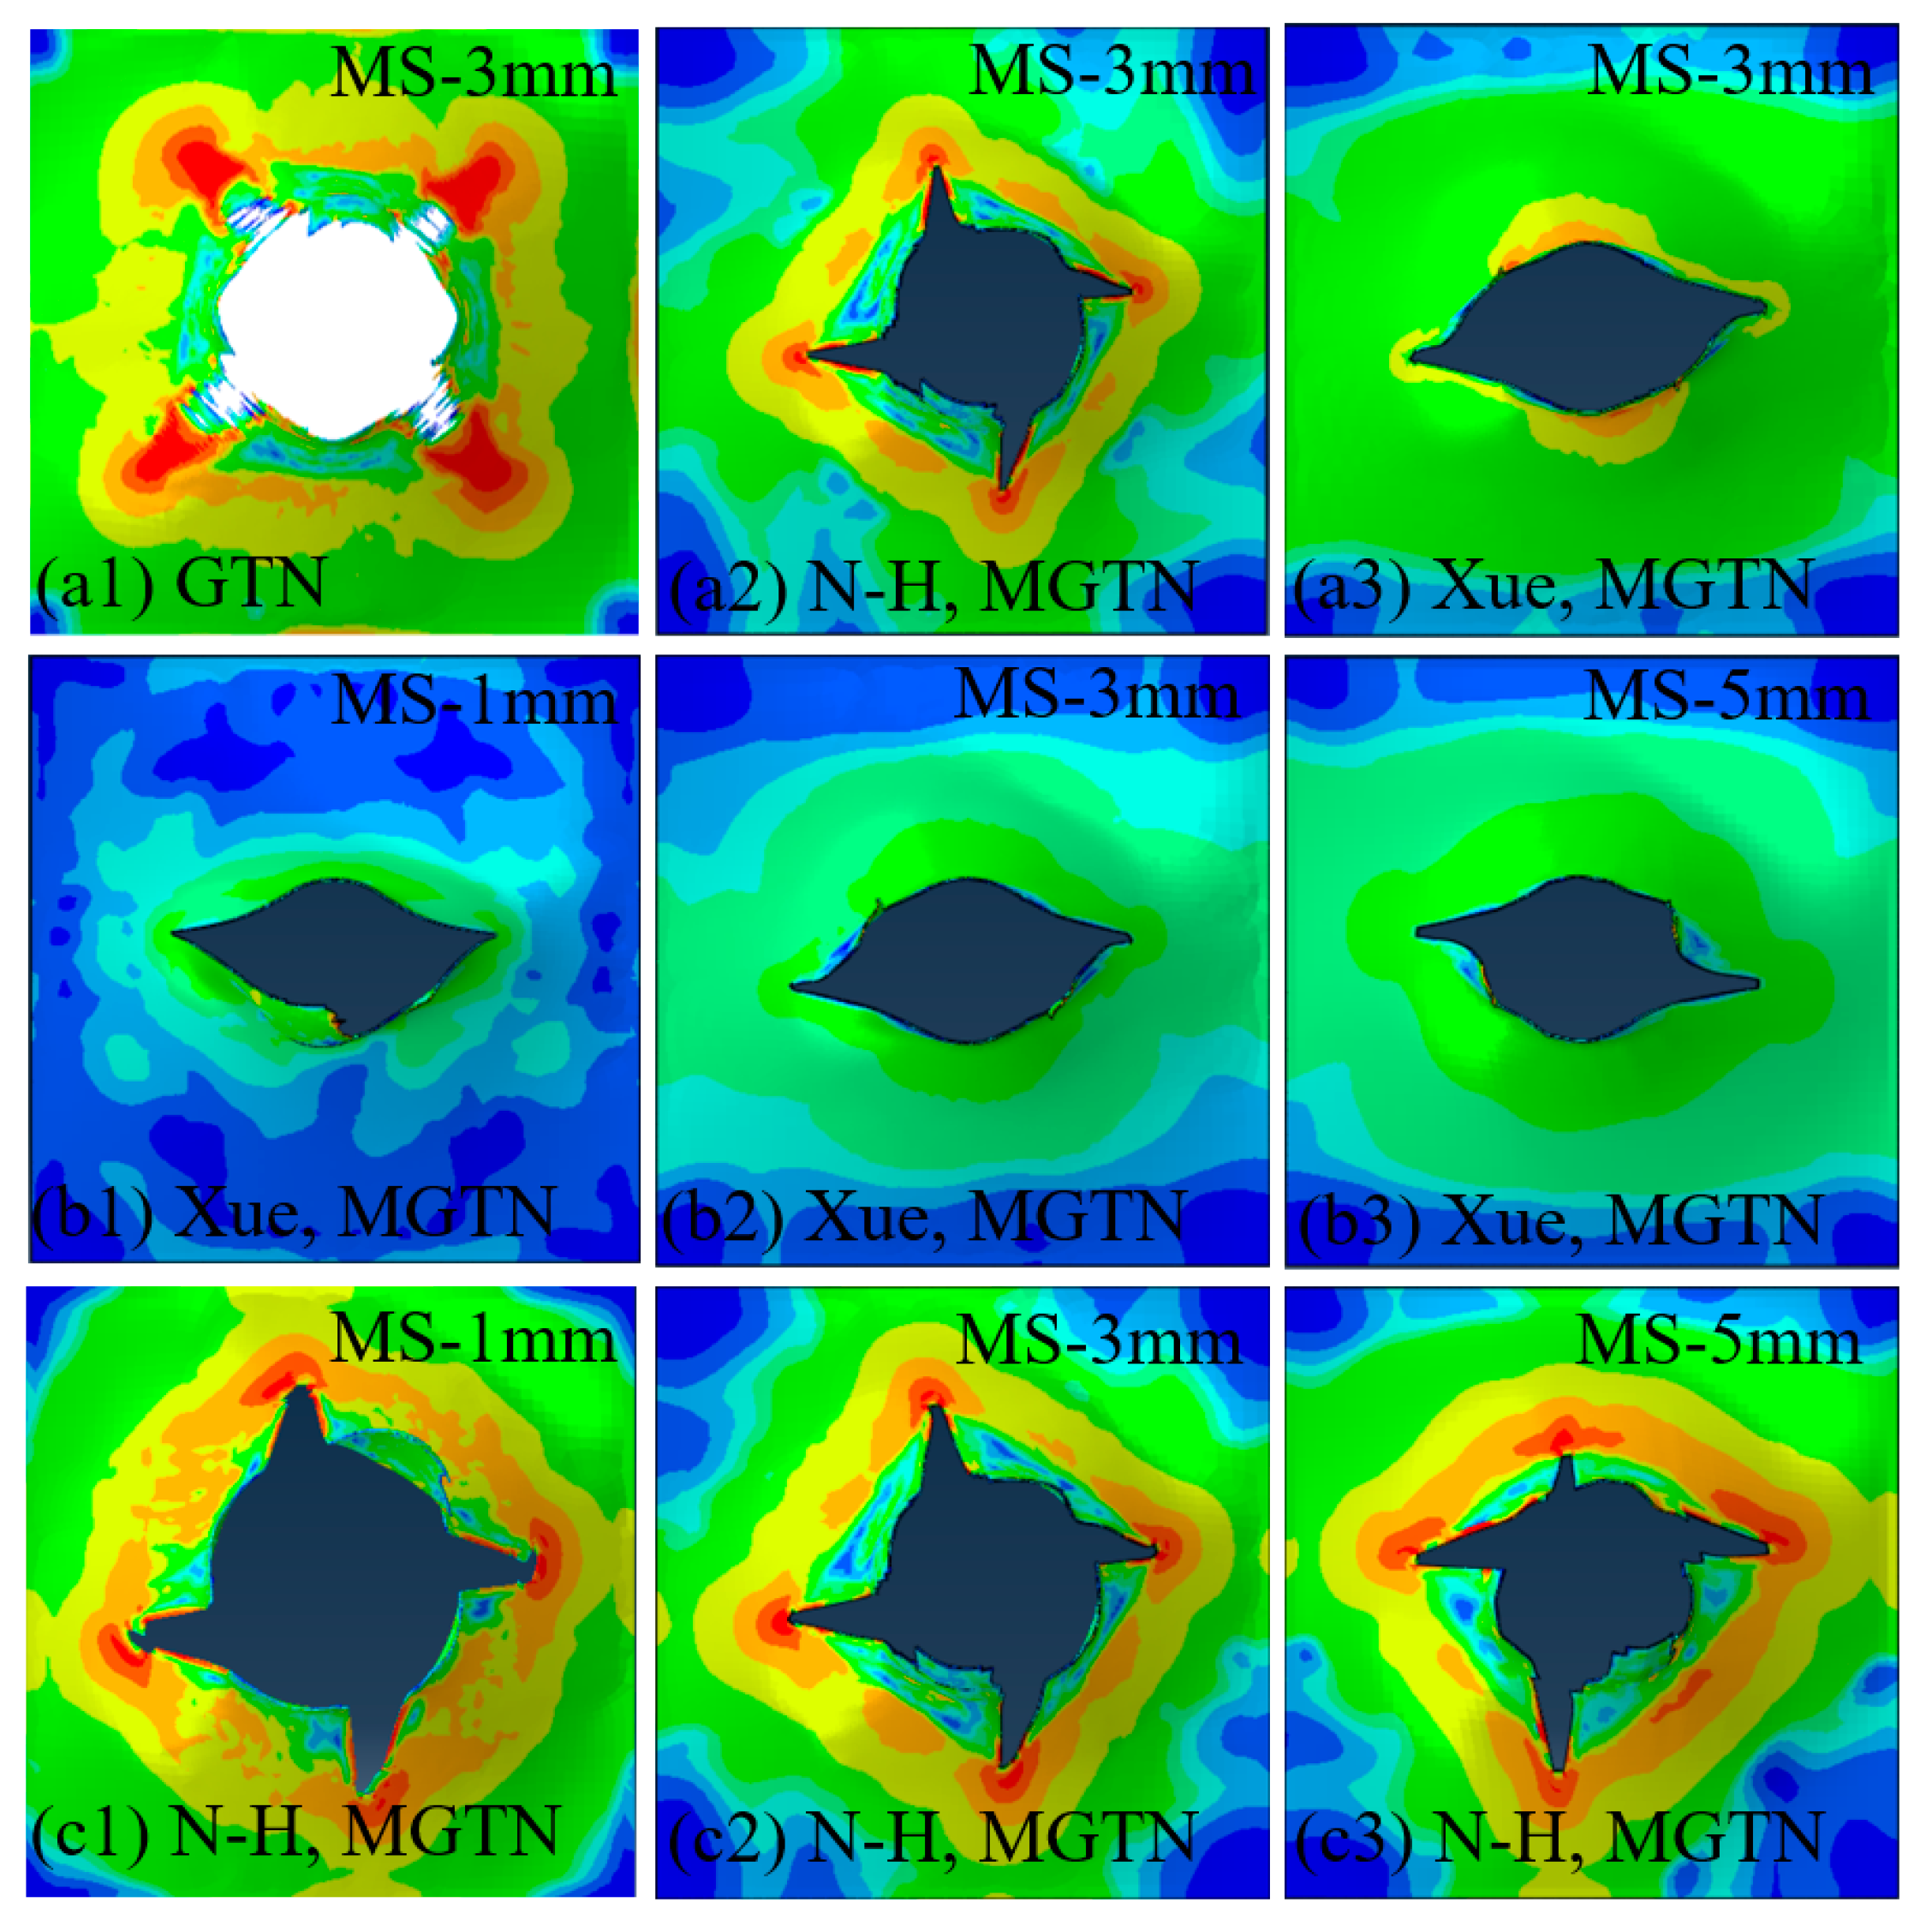
4.1. Simulations of Non-Stiffened Plate Penetration Test

Zhang et al. [33] presented the experimental study on non-stiffened plates under quasi-static punch loading. Figure 14 illustrates the experimental setup and dimensions of indenter and plate. The thickness of the plate is equal to 3.15 mm. In the test, each of the four edges of the plate specimen had clamp supports between two thick steel plates, which were fixed with the strong base. The plate specimen was loaded at a rate of about 10 mm/min at the centre by hydraulic cylinders. The material used for the non-stiffened plate remained the same as Material-2 in Table 1.
The non-stiffened plate penetration test was analysed using the ABAQUS software with the calibrated modified GTN model given in previous sections. The material parameters of the plate specimen (material-2) are presented in Table 1, and the calibrated input parameters for GTN models are given in Table 4. The eight-node solid element with reduced integration (C3D8R) was used in modelling the plate specimen, as shown in Figure 15. The plate specimen in the contact region was meshed with three different characteristic solid element sizes, 1 mm, 3 mm, and 5 mm. All degrees of freedoms for nodes at the boundary edges of the plate were constrained in the numerical model to simulate the fully clamped boundary condition in the penetration test, without modelling the detailed clamping setup. The indenter was modelled with rigid material because no deformations were observed in the test. The surface-to-surface contact (explicit) defines the interaction between the indenter and plate specimen. The friction coefficient in the contact interaction is defined as 0.2 [33]. The part of the plate specimen in the contact region where the crack initiates and propagates is simulated with fine solid elements.
Figure 16 shows experimental load–displacement curve and numerical load–displacement curves computed from different meshes, GTN models, and damage parameters of ks. In the test, the contact between the plate specimen and the indenter has three stages as the indenter penetrates through the steel plate: (a) hemisphere–plate contact, (b) cylinder–plate contact, and (c) cone–plate contact, which correspond to different shapes of the three segments of the indenter shown in Figure 14. The whole penetration processes of the non-stiffened plate specimen are categorized into two fracture processes: the crack initiation process and crack propagation process. In the first contact stage (hemisphere–plate contact stage), the experimentally measured load decreases sharply when the crack initiates and propagates with the increase in the penetration depth. In the next contact stage (cylinder–plate contact stage), the measured load remains at a very low level with the increase in penetration depth. In the last contact stage, when the cone part of the indenter punches the ruptured plate, the load increases remarkably, as shown in Figure 16. Figure 16a and Table 5 compare the numerical load–displacement curves obtained from the original GTN model, N-H modified GTN model, and Xue’s modified GTN model. The comparisons show that the numerically computed load–displacement response based on the N-H modified GTN model agrees most closely with the experimental data for all three stages of contacts. The modified GTN models considering shear effect show better predictions on the peak load and post-peak response in the experiment than the original GTN model. Figure 16b,c present the numerical load–displacement curves with different mesh sizes obtained from the N-H modified GTN model and Xue’s modified GTN model, respectively. The plate specimen in the contact region is meshed with three different characteristic element sizes, 1 mm, 3 mm, and 5 mm. The mesh sizes of plate model have a marginal effect on the numerical load–displacement relations. For Xue’s modified GTN model, the peak force simulated with coarse mesh size (5 mm) is closest to the experimental value among the three meshes, whereas for the N-H modified GTN model, the fine mesh size (1 mm and 3 mm) has best estimation on the experimental response. Figure 16d elucidates the influences of the damage parameter ks in the N-H modified GTN model, which shows a negligible effect on the load–displacement responses.
Figure 17 compares the experimentally and numerically obtained fracture shapes of the plate specimen. The N-H modified GTN damage model with ks = 4 was used in the simulation. In the penetration test, the plate specimen experienced plastic deformations, necking, crack initiation, and propagation, which are also observed in the numerical simulation of the N-H modified GTN damage model. At first, necking appears on the plate with the increase in plastic deformations in the contact region, and the plate subsequently experiences fracture accompanied by a rapid load decrease. Several cracks subsequently emerge in the plate around the necking circle with the punch of the indenter, as shown in Figure 17b. The ruptured specimen separates into several petal pieces as the crack propagates caused by the punching of the conical part of the indenter bar as shown in Figure 17d. Figure 18 shows the fracture shapes of the damaged plate specimen obtained from numerical simulations with different GTN models and mesh sizes. Due to the different failure criteria, the fracture shapes predicted by the three GTN models are quite different. The comparisons in Figure 17 and Figure 18 show that the N-H modified GTN model with a fine mesh size has a most reasonable prediction of crack initiation and propagation in a plate under punch loading.

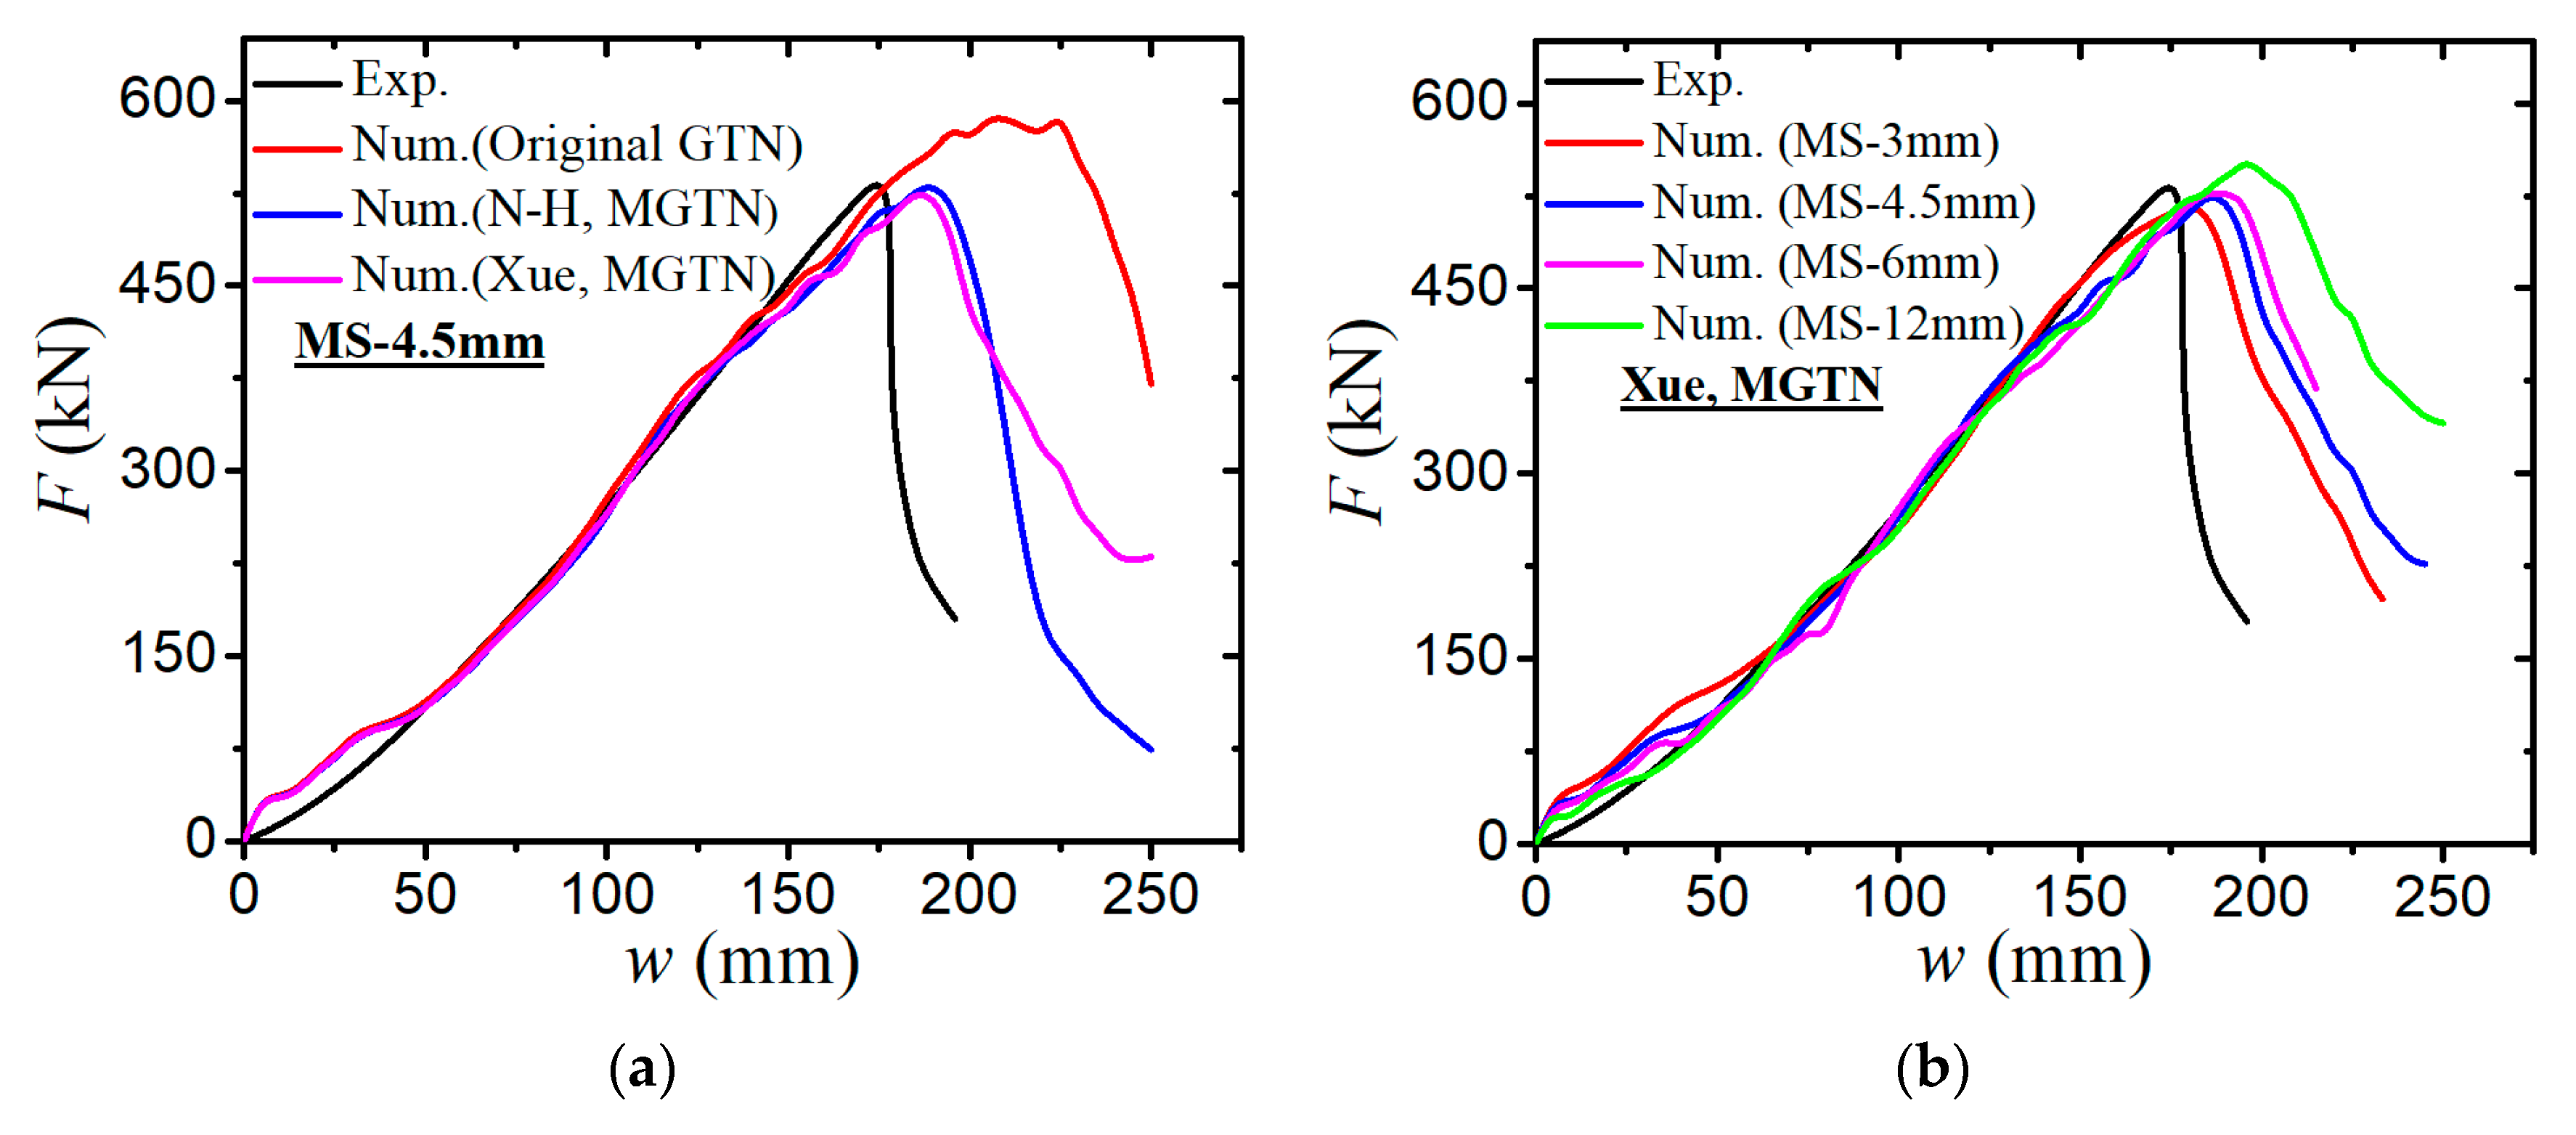
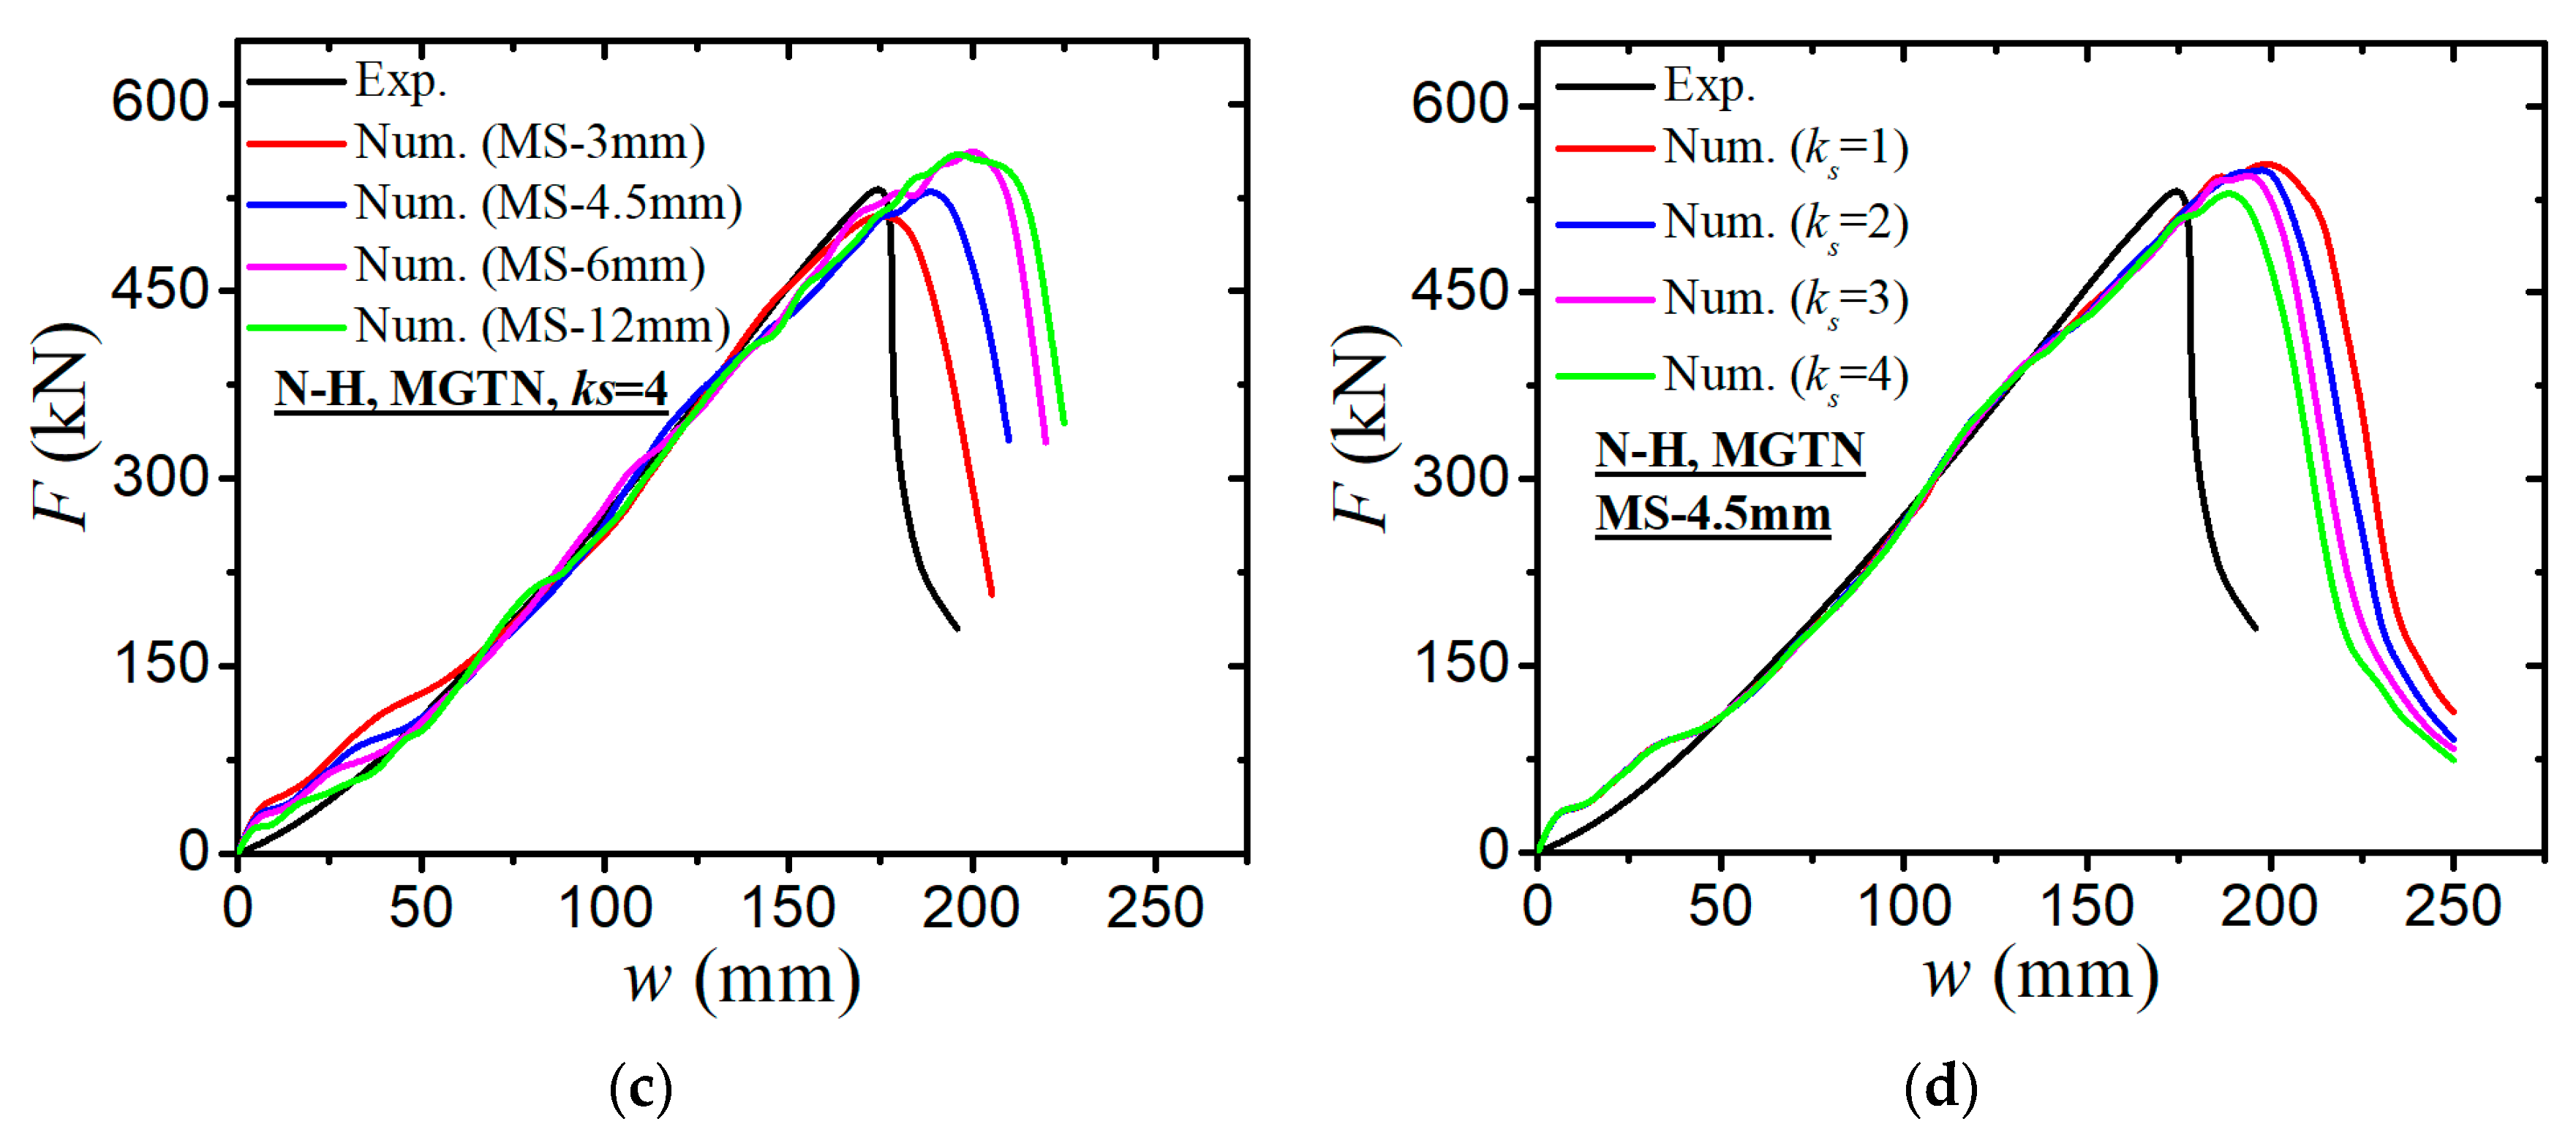
4.2. Simulations of Laser-Welded Stiffened Plate Penetration Test

Kõrgesaar et al. [32] reported a quasi-static penetration test for a laser-welded stiffened plate performed in the Strength of Material laboratory at Aalto University. Figure 19 shows the experimental setup and fracture shapes of stiffened plate specimen under punch loading. The flat-bar stiffeners with a 30 mm web height and 120 mm spacing were welded on the panel by the laser-welding technique. The in-plane dimension of the stiffened panel was 1200 × 1200 mm, and the thickness of plate and stiffeners equalled 3 mm, as illustrated in Figure 20. The edge of the stiffened plate specimen is fully clamped between two supporting thick plates made from steel S355. A hemispherical indenter with a radius of 120 mm was loaded to punch through the centre of the stiffened plate. The material used for the stiffened plate remained the same as material-1 in Table 1.
The simulation method for a stiffened plate penetration test is the same with that of a non-stiffened plate penetration test. The calibrated modified GTN model is implemented in ABAQUS via a user-defined VUMAT material subroutine. Table 1 and Table 4 list the material parameters of the stiffened plate specimen (material-1) and the calibrated input parameters for GTN models, respectively. The eight-node solid element with reduced integration (C3D8R) was employed in modelling the stiffened plate specimen. The stiffened plate specimen in the contact region was meshed with four types of solid element sizes, 3 mm, 4.5 mm, 6 mm, and 12 mm. All degrees of freedom for nodes on the clamped plate edges remained constrained in the numerical model. The surface-to-surface contact defines the interaction between the indenter and plate specimen. The friction coefficient in the contact interaction is defined as 0.23 [32]. The part of panels and stiffeners in the contact region where the crack initiates and propagates were simulated with fine solid elements, as shown in Figure 21.
Figure 22 illustrates the numerically predicted force–displacement curves with different GTN damage models and mesh sizes and compares them with experiment results. The comparisons of different GTN models in Figure 22a and Table 6 show that the numerically predicted results based on the modified GTN models considering shear failure are closer to experimental results than those of the original GTN model. Figure 22b,c illustrate the mesh size sensitivity of modified GTN damage models. The peak load and the final displacement decrease slightly with the decreasing mesh size of a stiffened plate model. Xue’s and the N-H modified GTN models with a mesh size of 3 mm have agreed most closely with the experimentally measured load–deformation curves among the four element sizes considered. The mesh sensitivity analysis shows the coarse mesh elements may lead to the over-prediction of load resistance and fail to capture the strain concentrations and hence the crack initiation. Figure 22d shows the effect of the shear damage parameter ks in the N-H modified GTN model on the force–displacement curve. With the increase in ks, the peak load and final displacement decline slightly. The numerically predicted load–displacement relation based on the N-H modified GTN model with ks = 4 and a fine mesh size (3 mm) demonstrates good agreement with the experimental measurement.
Figure 23 presents the numerically predicted post-fracture shape of the stiffened plate with different GTN models and mesh sizes and some test photographs from Kõrgesaar et al. [33]. In the test, cracks firstly initiated on the panel and propagated parallel to the central stiffener, followed by the crack initiation and propagation on the panel in the transverse direction across the stiffener, as shown in Figure 23(a1–a3). Figure 23(b1–b3) compares the numerically computed post-fracture shape of stiffened plate from three types of GTN models. No crack occurs on the stiffened panels based on the original GTN model, whereas some small circular cracks emerge around the central stiffener in the contact region for Xue’s and the N-H modified GTN models. The comparisons in Figure 23(b1–b3) show that the shear-driven failure is a key mechanism in the ductile fracture of plates under quasi-static punch loading. The GTN damage model requires a damage criterion for the shearing of voids to accurately reflect the failure modes in these plates. For Xue’s modified GTN model, the mesh sizes of the stiffened plate model have some influence on the fracture shape, and the finer mesh facilitates the fracture in the plate structures, as shown in Figure 23(c1–c3). Figure 24 shows the cracking path of the stiffened plate model captured from numerical simulations based on modified GTN models. For Xue’s modified GTN model, the crack first initiates and propagates on the panels in the transverse direction perpendicular to the stiffener, followed by crack initiation and propagation in the longitudinal direction along the stiffener, as shown in Figure 24a. For the N-H modified GTN model, the crack first initiates on the panels and propagates parallel to the stiffener, with subsequent crack initiation and propagation in the transverse direction across the stiffener. The stiffener finally ruptures completely as shown in Figure 24b. The fracture path of the N-H modified GTN model resembles what is observed in the experiment but differs from that of Xue’s modified GTN model. Hence, the N-H modified GTN model captures the experimentally observed shear-driven fracture initiation and propagation better than Xue’s modified GTN model.

5. Concluding Remarks

This paper aims to identify an appropriate modified GTN model to simulate the shear-driven fracture failure in steel plates under quasi-static punch loading. Consequently, the original GTN model, Xue’s modified GTN model, and the N-H modified model are investigated and compared to quantify the effect of shear failure on the ductile fracture and the load–displacement responses. The material and damage parameters in the different GTN models are calibrated through the laboratory material tests using specimens with varying levels of shearing and stress triaxiality. The sensitivity of a number of important parameters including the material damage parameters and the element sizes is also examined. The calibrated damage parameters for the various GTM models by the laboratory material tests are subsequently used to investigate the large-scale steel plates under punch loading. Some major concluding remarks of this paper are drawn as follows:
(1)
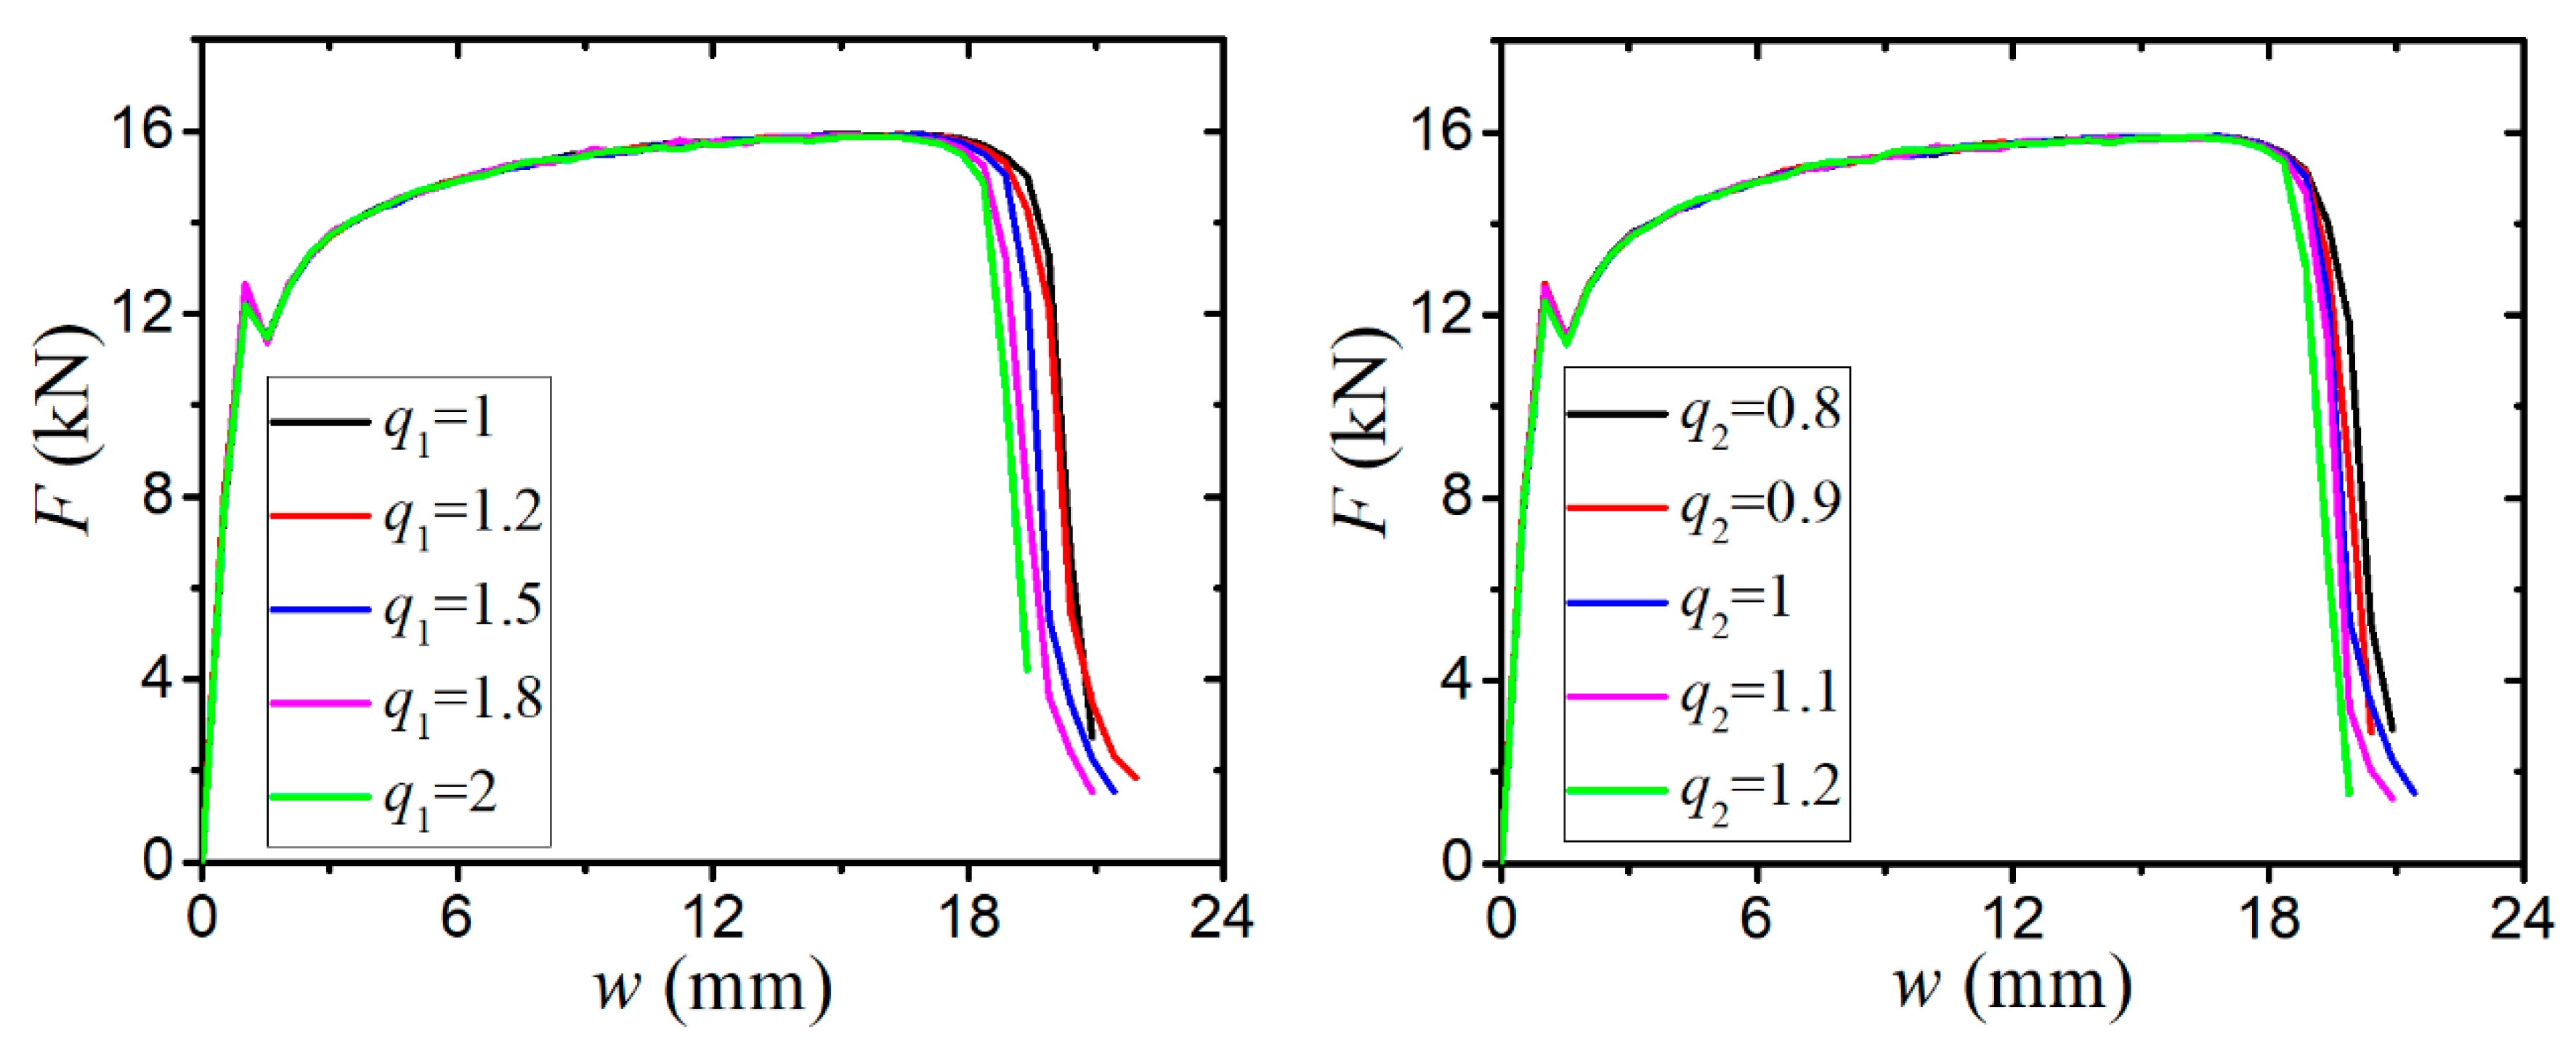
The sensitivity analysis of void-related parameters (q1, q2, f0, fN, fc, ff) and shear damage parameters (q4, q5, ks) indicate different levels of effects on the force–displacement responses for a standard tensile laboratory material test. The parameters (q1, q2, fN, fc, ff) have negligible effects on the force–displacement curves before necking occurs, whereas the parameter of the initial void volume fraction f0 affects the force–displacement relation before necking because a nonzero f0 leads to a shrink in the material yield surface. The parameters of q1, q2, f0, fN, and q4 have a negative correlation and the parameters of fc, ff, and q5 have a positive correlation with the tension displacement at the onset of fracture. The shear damage parameter ks of the N-H modified GTN model has a very minor effect on the force–displacement response in uniaxial tension.
(2)
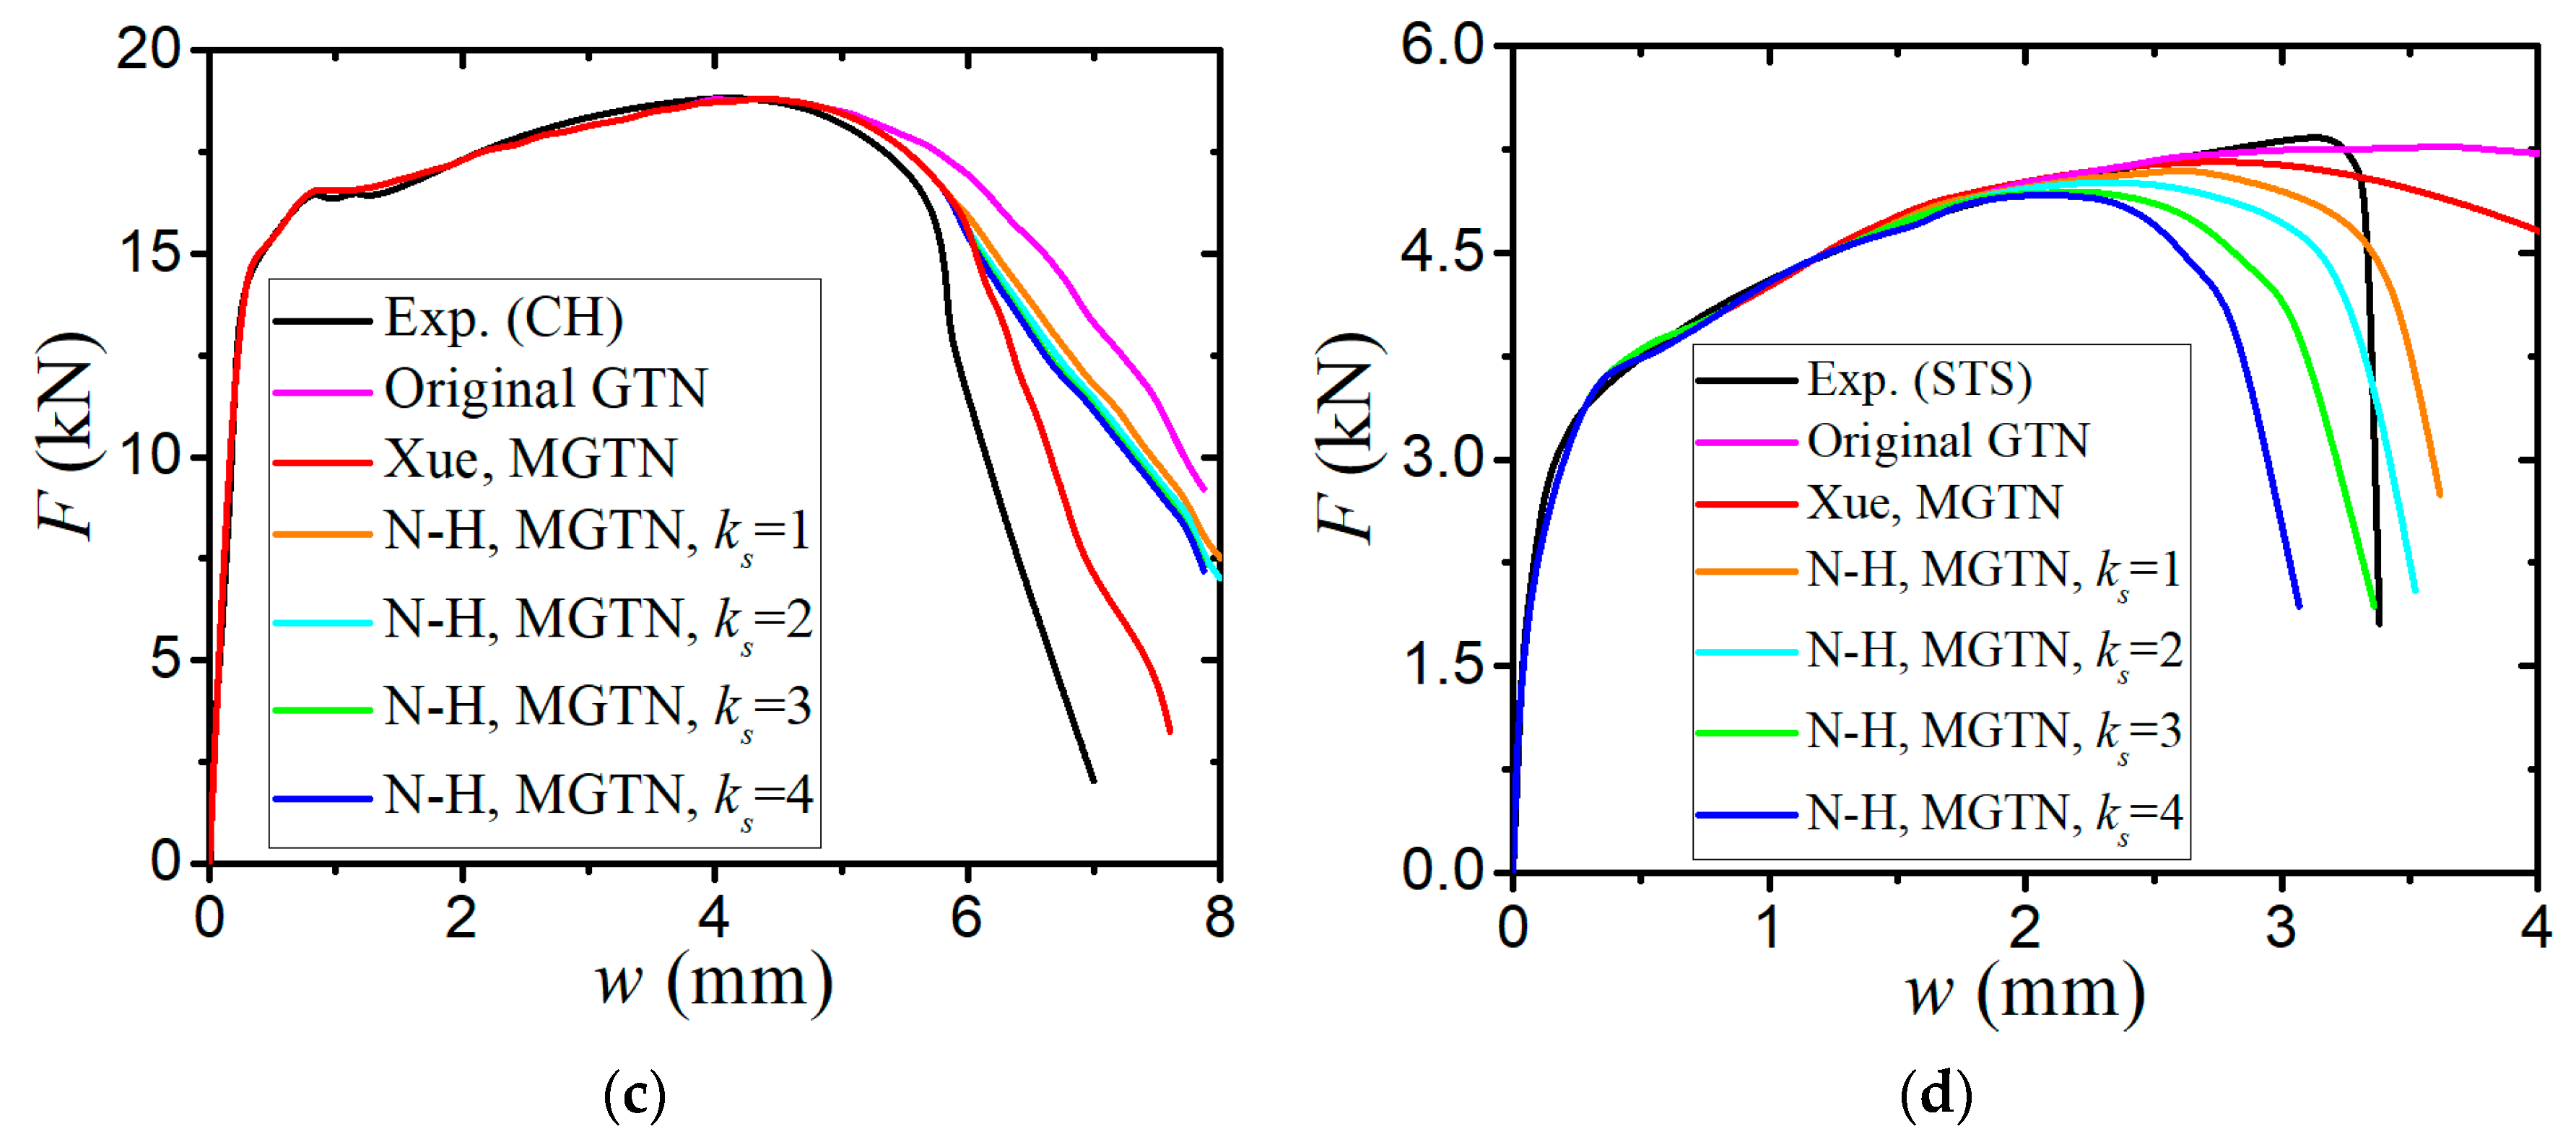
The numerical prediction based on Xue’s or the N-H modified GTN models provides closer estimations on the crack initiation and the load–displacement relationships observed from the tensile tests with various geometries and stress triaxialities and shearing conditions. The damage evolution associated with the shearing of voids has strong influences on the stress triaxiality versus equivalent plastic strain under complex stress states, especially for the shear-driven fracture failure. A strong mesh sensitivity to the failure criterion of the modified GTN model exists in the necking and fracture initiation stages of tests. The differences between the load–displacement curves become more pronounced when the mesh size increases.
(3)
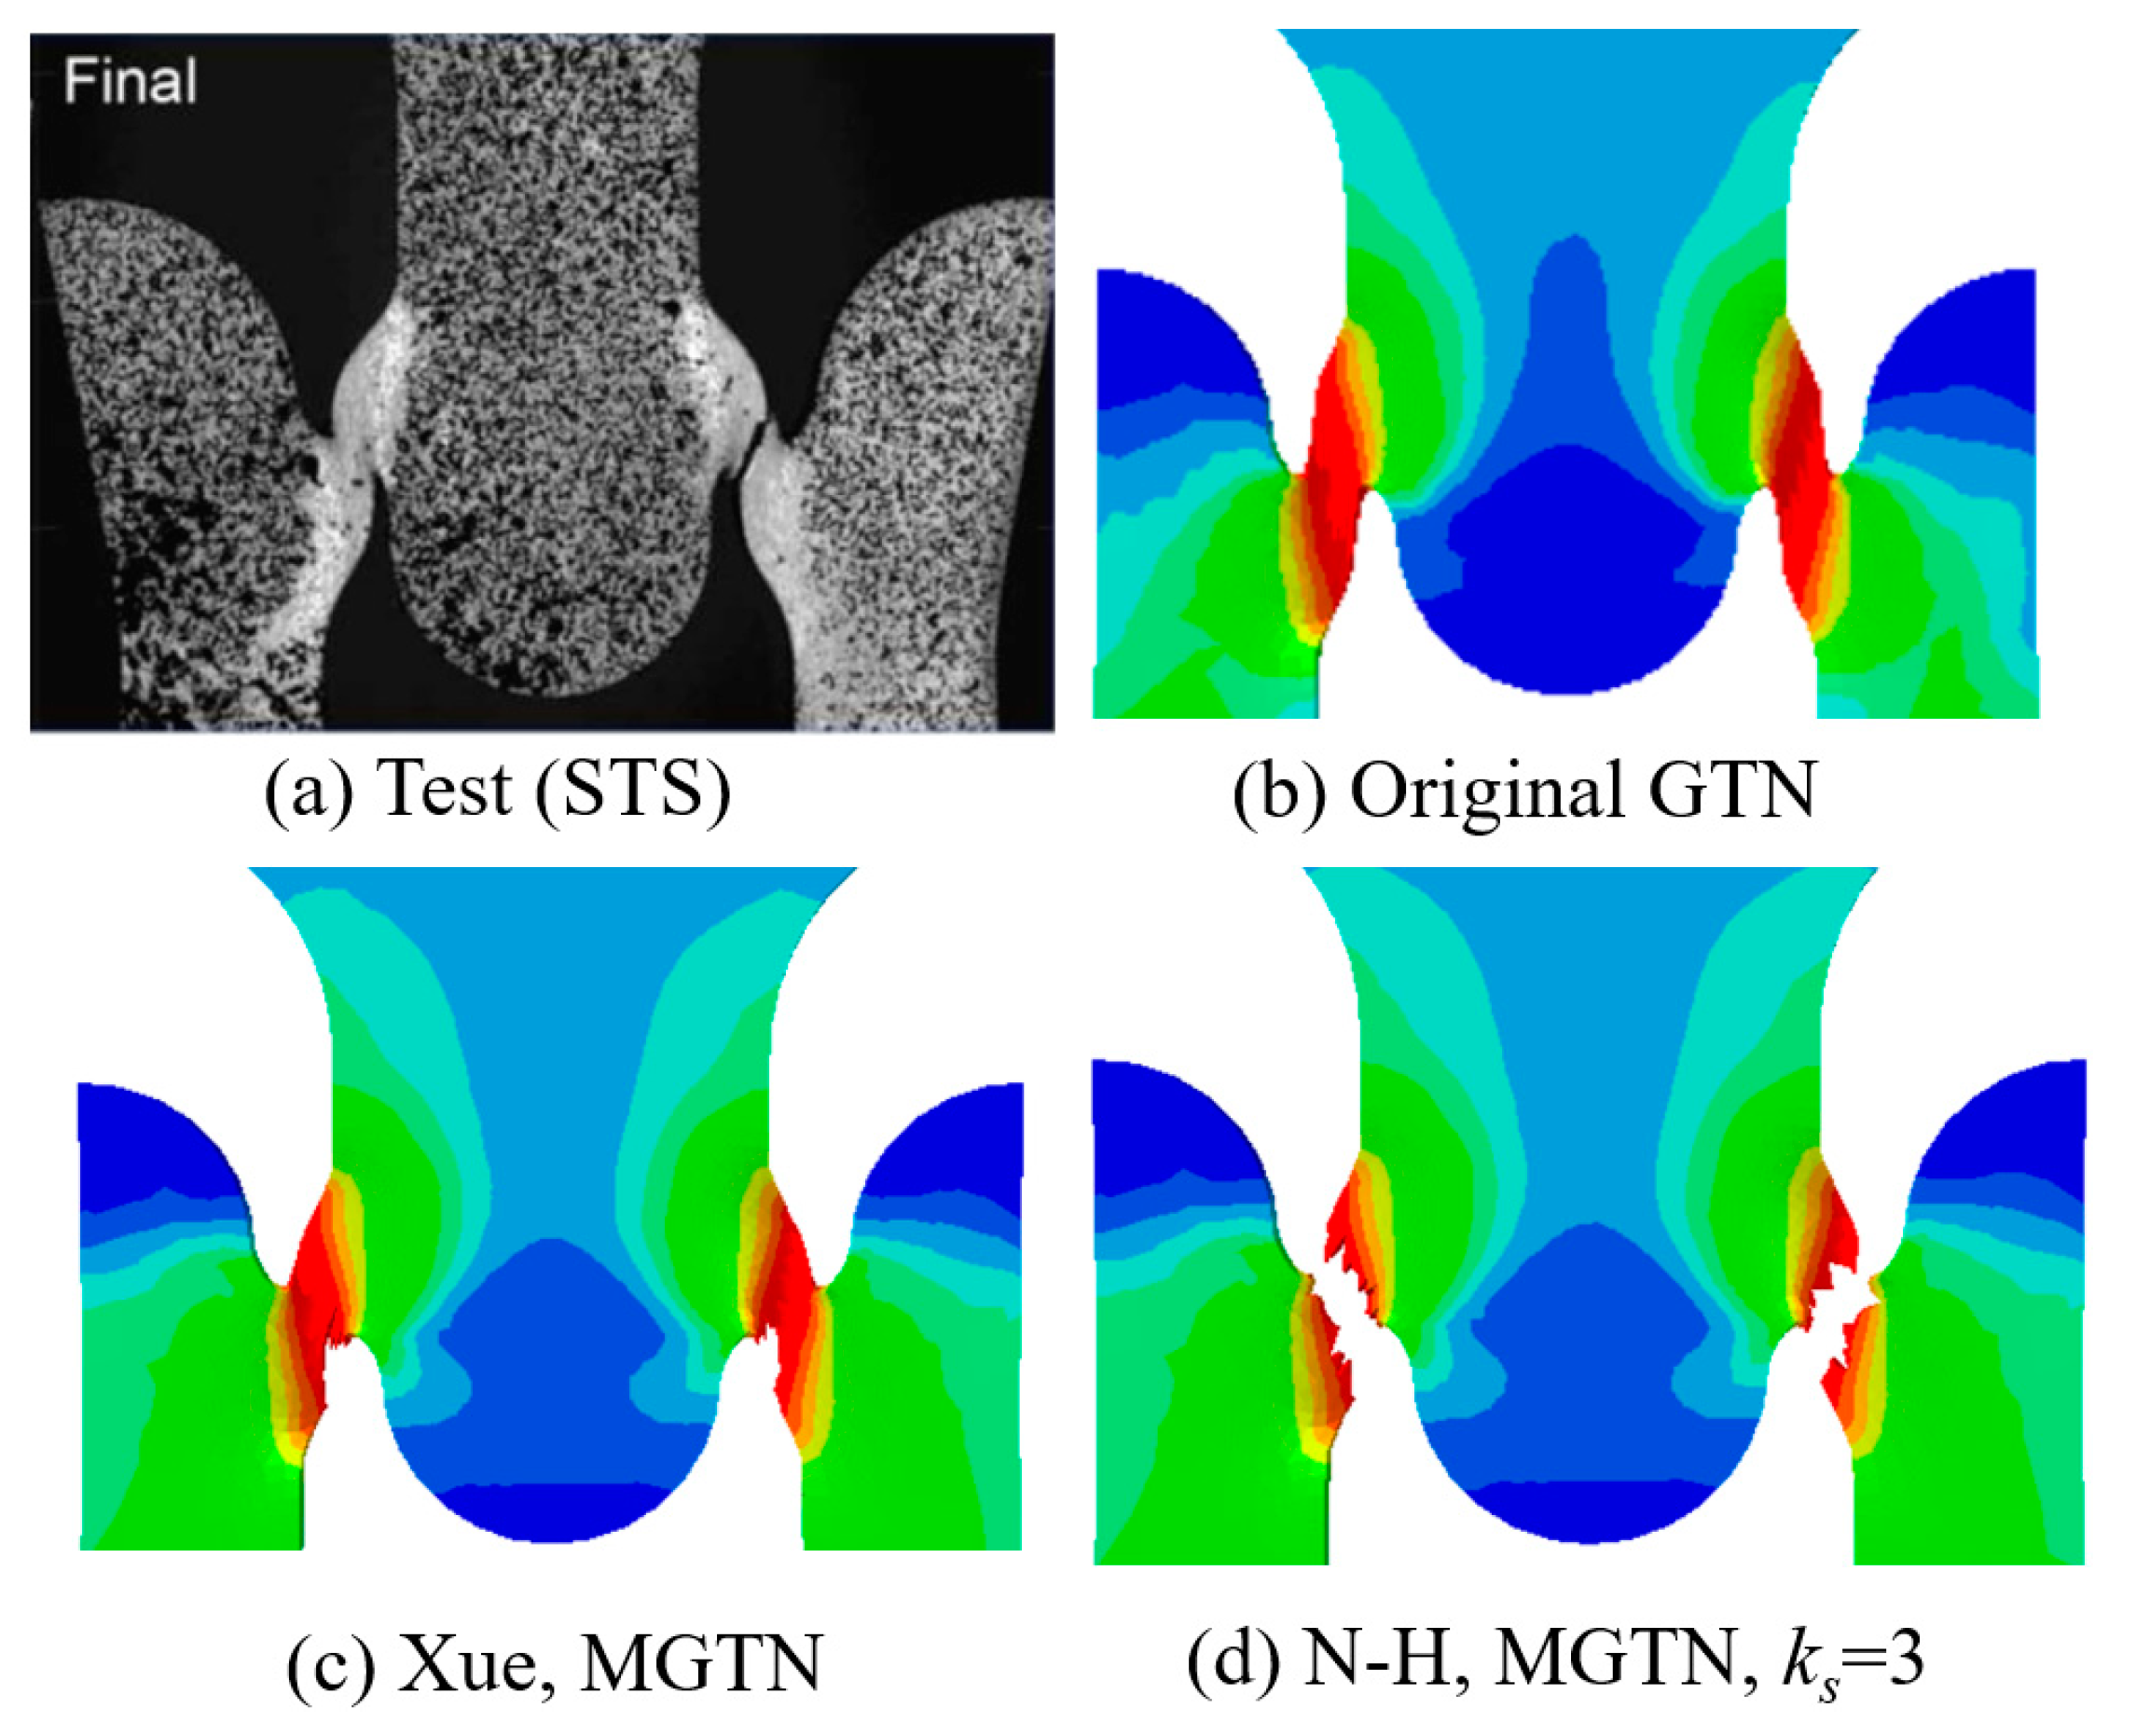
The modified GTN model considering the shear effect with calibrated parameters is applied to simulate steel plate structures under quasi-static punch loading. The experimental results captured from non-stiffened plate and stiffened plate penetration tests are compared well with numerical results based on the N-H modified GTN models. The N-H modified model with ks = 4 provides much better prediction to the experimental observations compared with the original GTN model and Xue’s modified model. The results demonstrated that the evolution law for the shear failure of voids in the modified GTN model is very important for simulating the ductile fracture of structures under punch loading.
The good agreement between the experimental and numerical results shows that the modified GTN model considering the shear failure can accurately simulate cracking evolution and fracture behaviour in large-scale, thin-walled steel structures. The modified GTN model can be further applied for numerical analysis of failure behaviours of structures in ship collision and grounding events. The study of this paper can provide an effective and accurate numerical calculation procedure for the crashworthiness of a structure under localised load. But for the modified GTN models, it is still a difficult issue to give some quantitative expressions or explanations to calculate the void-related and shear damage parameters, such as f0, fN, fc, ff, and so on, which need in-depth research in the future.

Author Contributions

Conceptualization, X.Q. and L.Z.; methodology, W.C.; software, W.C. and Z.Z.; validation, W.C., D.C. and H.H.; formal analysis, Z.Z.; investigation, W.C.; resources, X.Q.; data curation, W.C.; writing—original draft preparation, W.C.; writing—review and editing, X.Q., S.L. and L.Z.; supervision, S.L.; funding acquisition, D.C. and W.C. All authors have read and agreed to the published version of the manuscript.

Funding

This research was funded by the program of China Scholarship Council (CSC) (No. 201906950096), Foshan Xianhu Laboratory of the Advanced Energy Science and Technology Guangdong Laboratory (XHT2020-002), the National Natural Science Foundation of China (no. 52273080), and the Fundamental Research Funds for the Central Universities (WUT: 2022IVA175 and WUT: 2023IV018h).

Institutional Review Board Statement

Not applicable.

Informed Consent Statement

Not applicable.

Data Availability Statement

The data presented in this study are available on request from the corresponding author.

Conflicts of Interest

The authors declare no conflict of interest.

References

  1. Zhu, L.; James, P.; Zhang, S. Statistics and damage assessment of ship grounding. Mar. Struct. 2002, 15, 515–530. [Google Scholar] [CrossRef]
  2. Ehlers, S.; Broekhuijsen, J.; Alsos, H.S.; Biehl, F.; Tabri, K. Simulating the collision response of ship side structures: A failure criteria benchmark study. Int. Shipbuild. Prog. 2008, 55, 127–144. [Google Scholar]
  3. Simonsen, B.C.; Törnqvist, R. Experimental and numerical modelling of ductile crack propagation in large-scale shell structures. Mar. Struct. 2004, 17, 1–27. [Google Scholar] [CrossRef]
  4. Tornqvist, R. Design of Crashworthy Ship Structures. Ph.D. Thesis, Department of Naval Architecture and Offshore Engineering, Technical University of Denmark, Kongens Lyngby, Denmark, 2003. [Google Scholar]
  5. Gurson, A.L. Continuum theory of ductile rupture by void nucleation and growth: Part I-Yield criteria and flow rules for porous ductile media. J. Eng. Mater. Technol. 1977, 99, 2–15. [Google Scholar] [CrossRef]
  6. Tvergaard, V. Influence of voids on shear band instabilities under plane strain conditions. Int. J. Fract. 1981, 17, 389–407. [Google Scholar] [CrossRef]
  7. Tvergaard, V. On localization in ductile materials containing spherical voids. Int. J. Fract. 1982, 18, 237–252. [Google Scholar] [CrossRef]
  8. Tvergaard, V.; Needleman, A. Analysis of the cup-cone fracture in a round tensile bar. Acta Metall. 1984, 32, 157–169. [Google Scholar] [CrossRef]
  9. Alsos, H.S.; Hopperstad, O.S.; Tornqvist, R.; Amdahl, J. Analytical and numerical analysis of local necking using a stress based instability criterion. Int. J. Solids Struct. 2008, 45, 42–55. [Google Scholar] [CrossRef] [Green Version]
  10. Zhu, L.; Atkins, A.G. Failure Criteria for Ship Collision and Grounding. In Proceedings of the 7th International Symposium on Practical Design of Ship and Mobile Units, Hague, The Netherlands, 28 September 1998; pp. 141–147. [Google Scholar]
  11. Stoughton, T.B. A general forming limit criterion for sheet metal forming. Int. J. Mech. Sci. 2000, 42, 1–27. [Google Scholar] [CrossRef]
  12. Alsos, H.S.; Amdahl, J.; Hopperstad, O.S. On the resistance to penetration of stiffened plates, Part II: Numerical analysis. Int. J. Impact Eng. 2009, 36, 875–887. [Google Scholar] [CrossRef]
  13. Faleskog, J.; Gao, X.; Shih, C.F. Cell model for nonlinear fracture analysis–I. Micromechanics calibration. Int. J. Fract. 1998, 89, 355–373. [Google Scholar] [CrossRef]
  14. Kim, J.; Gao, X.; Srivatsan, T.S. Modeling of void growth in ductile solids: Effects of stress triaxiality and initial porosity. Eng. Fract. Mech. 2004, 71, 379–400. [Google Scholar] [CrossRef]
  15. Qian, X.; Choo, Y.S.; Liew, J.Y.; Wardenier, J. Simulation of ductile fracture of circular hollow section joints using the Gurson model. J. Struct. Eng. 2005, 131, 768–780. [Google Scholar] [CrossRef]
  16. Qian, X. An out-of-plane length scale for ductile crack extensions in 3-D SSY models for X65 pipeline materials. Int. J. Fract. 2011, 167, 249–265. [Google Scholar] [CrossRef]
  17. Gholipour, H.; Biglari, F.R.; Nikbin, K. Experimental and numerical investigation of ductile fracture using GTN damage model on in-situ tensile tests. Int. J. Mech. Sci. 2019, 164, 105170. [Google Scholar] [CrossRef]
  18. Yan, R.; Xin, H.; Veljkovic, M. Ductile fracture simulation of cold-formed high strength steel using GTN damage model. J. Constr. Steel Res. 2021, 184, 106832. [Google Scholar] [CrossRef]
  19. McClintock, F.A.; Kaplan, S.M.; Berg, C.A. Ductile fracture by hole growth in shear bands. Int. J. Fract. Mech. 1966, 2, 614–627. [Google Scholar] [CrossRef]
  20. Xue, L. Constitutive modeling of void shearing effect in ductile fracture of porous materials. Eng. Fract. Mech. 2008, 75, 3343–3366. [Google Scholar] [CrossRef]
  21. Xue, L. Ductile Fracture Modelling-Theory, Experimental Investigation and Numerical Verification. Ph.D. Thesis, Massachusetts Institute of Technology, Cambridge, MA, USA, 2007. [Google Scholar]
  22. Nahshon, K.; Hutchinson, J.W. Modification of the Gurson model for shear failure. Eur. J. Mech. A Solids 2008, 27, 1–17. [Google Scholar] [CrossRef]
  23. Butcher, C.; Chen, Z.; Bardelcik, A.; Worswick, M. Damage-based finite-element modeling of tube hydroforming. Int. J. Fract. 2009, 155, 55–65. [Google Scholar] [CrossRef]
  24. Zhou, J.; Gao, X.; Sobotka, J.C.; Webler, B.A.; Cockeram, B.V. On the extension of the Gurson-type porous plasticity models for prediction of ductile fracture under shear-dominated conditions. Int. J. Solids Struct. 2014, 51, 3273–3291. [Google Scholar] [CrossRef] [Green Version]
  25. Malcher, L.; Reis, F.J.P.; Pires, F.M.A.; de Sá, J.C. Evaluation of shear mechanisms and influence of the calibration point on the numerical results of the GTN model. Int. J. Mech. Sci. 2013, 75, 407–422. [Google Scholar] [CrossRef]
  26. Li, W.T.; Cai, Z.Y.; Li, H.; Peng, L.F.; Lai, X.M.; Fu, M.W. The modified GTN-Thomason criterion for modelling of ductile fracture considering shear factor and size effect in micro-scaled plastic deformation. Int. J. Mech. Sci. 2021, 204, 106540. [Google Scholar] [CrossRef]
  27. He, Z.; Zhu, H.; Hu, Y. An improved shear modified GTN model for ductile fracture of aluminium alloys under different stress states and its parameters identification. Int. J. Mech. Sci. 2021, 192, 106081. [Google Scholar] [CrossRef]
  28. Zhang, M.; Liu, J.; Hu, Z.; Zhao, Y. Experimental and numerical investigation of the responses of scaled tanker side double-hull structures laterally punched by conical and knife edge indenters. Mar. Struct. 2018, 61, 62–84. [Google Scholar] [CrossRef] [Green Version]
  29. Koplik, J.; Needleman, A. Void growth and coalescence in porous plastic solids. Int. J. Solids Struct. 1988, 24, 835–853. [Google Scholar] [CrossRef]
  30. Tho, N.C.; Cong, P.H.; Zenkour, A.M.; Doan, D.H.; Van Minh, P. Finite element modeling of the bending and vibration behavior of three-layer composite plates with a crack in the core layer. Compos. Struct. 2023, 305, 116529. [Google Scholar]
  31. Duc, D.H.; Van Minh, P.; Tung, N.S. Finite element modelling for free vibration response of cracked stiffened FGM plates. Vietnam. J. Sci. Technol. 2020, 58, 119–129. [Google Scholar]
  32. Kõrgesaar, M.; Romanoff, J.; Remes, H.; Palokangas, P. Experimental and numerical penetration response of laser-welded stiffened panels. Int. J. Impact Eng. 2018, 114, 78–92. [Google Scholar] [CrossRef]
  33. Zhang, M.; Sun, Q.; Liu, J.; Hu, Z.; Zhang, S. A study of the rupture behavior of a ship side plate laterally punched by a full-shape bulbous bow indenter. Ocean Eng. 2019, 182, 48–60. [Google Scholar] [CrossRef]
  34. Skallerud, B.; Zhang, Z.L. A 3D numerical study of ductile tearing and fatigue crack growth under nominal cyclic plasticity. Int. J. Solids Struct. 1997, 34, 3141–3161. [Google Scholar] [CrossRef]
  35. Hambli, R. Comparison between Lemaitre and Gurson damage models in crack growth simulation during blanking process. Int. J. Mech. Sci. 2001, 43, 2769–2790. [Google Scholar] [CrossRef]
  36. Rachik, M.; Roelandt, J.M.; Maillard, A. Some phenomenological and computational aspects of sheet metal blanking simulation. J. Mater. Process. Technol. 2002, 128, 256–265. [Google Scholar] [CrossRef]
  37. Springmann, M.; Kuna, M. Identification of material parameters of the Gurson-Tvergaard-Needleman model by combined experimental and numerical techniques. Comput. Mater. Sci. 2005, 33, 501–509. [Google Scholar] [CrossRef]
  38. Lemiale, V.; Chambert, J.; Picart, P. Description of numerical techniques with the aim of predicting the sheet metal blanking process by FEM simulation. J. Mater. Process. Technol. 2009, 209, 2723–2734. [Google Scholar] [CrossRef]
  39. Marouani, H.; Ismail, A.B.; Hug, E.; Rachik, M. Numerical investigations on sheet metal blanking with high speed deformation. Mater. Des. 2009, 30, 3566–3571. [Google Scholar] [CrossRef]
  40. Kossakowski, P.G. Simulation of ductile fracture of S235JR steel using computational cells with microstructurally-based length scales. J. Theor. Appl. Mech. 2012, 50, 589–607. [Google Scholar]
  41. Kiran, R.; Khandelwal, K. Gurson model parameters for ductile fracture simulation in ASTM A992 steels. Fatigue Fract. Eng. Mater. Struct. 2014, 37, 171–183. [Google Scholar] [CrossRef]
  42. Zhao, P.J.; Chen, Z.H.; Dong, C.F. Experimental and numerical analysis of micromechanical damage for DP600 steel in fine-blanking process. J. Mater. Process. Technol. 2016, 236, 16–25. [Google Scholar] [CrossRef]
Figure 1. Variation of the yield criterion and the plastic flow potential with respect to the hydrostatic and the effective stress space. (a) Influences of q1f and (b) influences of f0.
Jmse 11 01197 g001
Figure 2. Void shear: (a) initial configuration, (b) deformed configuration [20].
Jmse 11 01197 g002
Figure 3. Evolution of the Lode angle functions [20,22].
Jmse 11 01197 g003
Figure 4. Tensile specimens with different shapes (unit: mm). (a) Standard tensile specimen (ST-1), (b) central-hole specimen (CH), (c) notched tensile specimen (NT-1), (d) sheared tensile specimen (STS), (e) standard tensile specimen (ST-2), (f) notched tensile specimen (NT-2). ((ad) Kõrgesaar et al. [33]; (e,f) Zhang et al. [33]).
Jmse 11 01197 g004
Figure 5. Finite element models of tensile specimens.
Jmse 11 01197 g005
Figure 6. Influences of the parameters (q1, q2, f0, fN, fc, ff) of the original GTN model on force–displacement curves.
Jmse 11 01197 g006aJmse 11 01197 g006b
Figure 7. Influences of the parameters (q4, q5) of the Xue’s modified GTN model on force–displacement curves.
Jmse 11 01197 g007
Figure 8. Comparisons of engineering stress–strain curves between tensile tests and numerical simulations with different mesh sizes based on Xue’s modified GTN model. (a) Results of ST-1 specimen with different mesh sizes and (b) results of ST-2 specimen with different mesh sizes.
Jmse 11 01197 g008
Figure 9. Comparisons of force–displacement curves of three material models. (a) Numerical results of ST-1 specimen with different models and (b) numerical results of ST-2 specimen with different models.
Jmse 11 01197 g009
Figure 10. Force–displacement curves for (a) NT-1, (b) NT-2, (c) CH and (d) STS specimens obtained by experiments and numerical simulations using original GTN model, N-H modified GTN model, and Xue’s modified GTN model.
Jmse 11 01197 g010aJmse 11 01197 g010b
Figure 11. Comparisons of fracture modes of experiment and numerical simulations for NT-2 specimen.
Jmse 11 01197 g011
Figure 12. Comparisons of fracture modes of experiment and numerical simulations for STS specimen.
Jmse 11 01197 g012
Figure 13. Evolution of stress triaxiality with the increase in equivalent plastic strain.
Jmse 11 01197 g013aJmse 11 01197 g013b
Figure 14. (a) Experimental setup. (b) Dimensions of indenter. (c) Dimensions of plate. (Dimension unit: mm, figures from Zhang et al. [33]).
Jmse 11 01197 g014
Figure 15. Finite element model for non-stiffened plate penetration test.
Jmse 11 01197 g015
Figure 16. Comparisons of experimental and numerical force–displacement curves. (a) Different models with mesh size = 3 mm, (b) Xue’s MGTN model with different mesh sizes, (c) N-H MGTN model with different mesh sizes and (d) N-H MGTN model with different values of ks.
Jmse 11 01197 g016
Figure 17. Fracture shapes of plate specimen obtained from experiment and numerical simulation with the N-H modified GTN model (ks = 4), (a,b) view from the top of the plate specimen, (c,d) view from the bottom of the plate specimen.
Jmse 11 01197 g017
Figure 18. Fracture shapes as viewed from bottom of the plate specimen in simulations, (a1a3) different GTN models with mesh size 3mm, (b1b3) Xue’s modified GTN model with different mesh sizes, (c1c3) N-H modified GTN model with different mesh sizes.
Jmse 11 01197 g018
Figure 19. (a) Experimental setup. (b) Fracture shapes of stiffened plate specimen (Kõrgesaar et al. [32]).
Jmse 11 01197 g019
Figure 20. Dimensions of stiffened plate specimen (unit: mm, Kõrgesaar et al. [32]). (a) Experimental details of test device and (b) dimensions of stiffened plate.
Jmse 11 01197 g020
Figure 21. Finite element model for stiffened plate penetration test.
Jmse 11 01197 g021
Figure 22. Comparisons of force–displacement curves obtained from experiment and numerical simulations. (a) Different models with mesh size = 4.5 mm, (b) Xue’s MGTN model with different mesh sizes, (c) N-H MGTN model with different mesh sizes and (d) N-H MGTN model with different values of ks.
Jmse 11 01197 g022aJmse 11 01197 g022b
Figure 23. Comparison of experimentally and numerically obtained fracture shapes of the stiffened plate. (a1a3) Penetration test, (b1b3) different GTN models with mesh size 4.5 mm, (c1c3) Xue’s modified GTN model with different mesh sizes, (d1d3) N-H modified GTN model with different mesh sizes.
Jmse 11 01197 g023
Figure 24. Numerically obtained fracture path of stiffened plate based on N-H and Xue’s modified GTN models.
Jmse 11 01197 g024
Table 1. Material parameters of specimens.
Material TypeMaterial 1 [32]Material 2 [33]
SpecimenST-1, CH, NT-1, SHSST-2, NT-2
Thickness (mm)33.15
Density (kg/m3)78507850
Young’s modulus (GPa)200207
Poisson’s ratio0.30.3
Yield   stress   σ y (MPa)275302.8
Strength coefficient k (MPa)630690.2
Strain-hardening index n0.210.2
Plateau strain ε L 0.0120.0189
Table 2. GTN model parameters in the literature.
SourceMaterialq1q2q3 ε N SNf0fNfcff
Tvergaard et al. (1984) [8]-1.512.250.30.100.040.150.25
Skallerud and Zhang (1997) [34]CMn steel1.512.250.30.10.00030.0060.0260.15
Hambli (2001) [35]Carbon steel1.512.250.30.1-0.04--
Rachik et al. (2002) [36] Steels DD13, X6Cr171.512.250.30.1-0.040.10.101
Springmann et al. (2005) [37]Steel1.512.250.30.10.0010.010.010.15
Lemiale et al. (2009) [38]Mild steel XES1.512.250.20.1-0.040.150.25
Marouani et al. (2009) [39]FeSi (3 wt.%) steel1.512.250.30.1-0.040.110.12
Kossakowshi et al. (2012) [40]S235JR steel1.910.793.650.30.050.00170.040.060.6
Kiran et al. (2014) [41]ASTM A992 steel1.512.250.450.0500.020.030.5
Zhao et al. (2016) [42]DP600 steel1.512.250.20.10.00080.020.0280.09
Gholipour et al. (2019) [17]SAE 1010 steel1.512.250.30.10.001070.007160.010.15
Table 3. The value range of modified GTN damage model parameters.
Parameterq1q2f0fNfcffq4q5ks
Range1–20.8–1.20–0.010.001–0.040.01–0.150.1–0.61.5–4.50.198–0.4621–4
Table 4. The calibrated input parameters for Xue’s modified GTN damage model.
Material Typeq1q2q3 ε N SNf0fNfcffq4q5
Material-11.20.81.440.30.10.0010.0050.020.353.720.33
Material-21.512.250.30.10.0010.0050.040.253.720.33
Table 5. The comparisons between experimental and numerical results of the non-stiffened plate test (mesh size = 3 mm).
ResultsTestSimulation Value (Original GTN)Simulation Value (N-H GTN)Simulation Value (Xue GTN)
Maximal force (kN)311.6365.82319.52291.45
Prediction error of maximal force-17.4%2.54%−6.47%
Displacement corresponding to peak load (mm)110.25128.31108.16103.69
Prediction error of displacement-16.38%−1.90%−5.95%
Table 6. The comparisons between experimental and numerical results of the stiffened plate test (mesh size = 4.5 mm).
ResultsTestSimulation Value (Original GTN)Simulation Value (N-H GTN)Simlation Value (Xue GTN)
Maximal force (kN)533.39582.31526.95524.38
Prediction error of maximal force-9.17%−1.21%−1.69%
Displacement corresponding to peak load (mm)174.18224.40188.73186.97
Prediction error of displacement-28.83%8.35%7.34%
Disclaimer/Publisher’s Note: The statements, opinions and data contained in all publications are solely those of the individual author(s) and contributor(s) and not of MDPI and/or the editor(s). MDPI and/or the editor(s) disclaim responsibility for any injury to people or property resulting from any ideas, methods, instructions or products referred to in the content.

