Article

Increasing Maritime Safety and Security in the Off-Shore Activities with HFSWRs as Primary Sensors for Risk Assessment

1
Hensoldt Sensors, ISR and Space Radar Engineering, Graf-von-Soden Strasse, 88090 Immenstaad, Germany
2
Vlatacom Institute of High Technologies, Milutina Milankovica 5, 11070 Belgrade, Serbia
3
School of Electrical Engineering, University of Belgrade, Bul. Kralja Aleksandara 73, 11120 Belgrade, Serbia
*
Author to whom correspondence should be addressed.
J. Mar. Sci. Eng. 2023, 11(6), 1167; https://doi.org/10.3390/jmse11061167
Submission received: 11 March 2023 / Revised: 12 May 2023 / Accepted: 15 May 2023 / Published: 1 June 2023
(This article belongs to the Special Issue Safety and Risk Management in Offshore Activities)

Abstract

:
This paper demonstrates the benefits that high-frequency surface wave radars (HFSWR) are bringing to maritime safety and security in off-shore activities at over the horizon distances. As a primary means for remote sensing of marine and maritime environment, a network of HFSWRs is deployed in the western part of the Gulf of Guinea and covers an area of over 100 km2. Alongside HFSWRs, usual maritime sensors are utilized for vessel tracking as well, however, only satellite automatic identification systems (SAIS) and land automatic identification systems (LAIS) are capable of covering over the horizon distances. Unfortunately, both LAIS and SAIS require vessel cooperation in order to provide any data, which is often abused by vessels conducting illegal activities. Here, analysis is done in which AIS and HFSWR data are compared in order to identify a pattern of behavior of non–cooperative vessels (vessels with onboard AIS devices turned off) so a proper risk assessment may be achieved. It is shown that typical patterns can be easily recognized for two illegal activities which plague the waters where this study is conducted. Those illegal activities are oil bunkering and piracy, both conducted off-shore and out of the reach of the usual coastal sensors such as X or S band radars. Furthermore, tracks created whilst conducting illegal activities are easily distinguishable from others in the overall operational picture. Additionally, it should be pointed out that numerous vessels are switching off their AIS devices when they leave the coastal regions in order to avoid detection by pirate vessels. This behavior can also be easily recognized and must not be mixed with the illegal activities mentioned above.

1. Introduction

In recent decades, steady growth of world trade and the trend of globalization, in general, led to a tremendous increase in maritime traffic. From [1], it can be seen that during the last four decades, the total number of goods transported over the sea increased nearly four times. This is not a surprise since the most affordable way to transport large amounts of goods (especially bulkier ones) is to use regular shipping routes. On top of this purely economic reason, transportation over the sea is less impactful to the environment on a global scale since the number of CO2 emissions caused by marine traffic is the lowest among all transportation means [2]. However, on a microscale, there is still a huge impact on ports and coastal cities in terms of water and air pollution, with additional problems such as occasional oil leaks.
However, the increase in the number of goods transported overseas inevitably led to an increase in criminal activities in maritime areas. This phenomenon is becoming more and more threatening every year [3], and just when countries and international organizations addressed the issue in the most affected regions, new regions of the world experienced the sudden rise of piracy and became world piracy hotspots. One such case occurred when the UN and EU intervened in East Africa in order to counter Somali pirates [4,5], and West Africa suddenly experienced a significant increase in both maritime piracy and armed robbery at sea, making it a new piracy hotspot of the world [6,7].
The growing trend of maritime crime urged many nations, as well as international organizations, to act in order to stop and hopefully eliminate such behavior. This was the motivation for United Nations Security Council (UNSC) Resolution 2634 on Piracy and Armed Robbery in the Gulf of Guinea, which was adopted in May 2022, where member states in the Gulf of Guinea region are called to criminalize piracy and armed robbery at sea under their domestic laws and to prosecute or extradite, in accordance with applicable international law, executors of such crimes [8].
However, the first and foremost prerequisite is the deployment of well-developed and reliable maritime surveillance networks. Unfortunately, deploying a maritime surveillance network that can provide reliable over the horizon surveillance is not an easy and straightforward task since this kind of surveillance network requires multiple types of sensors, which may be installed on the ground (seashore) but also on moving platforms, such as helicopters, planes, or even satellites. Since the installation of sensors on flying platforms raises the cost of the total network to amounts many countries cannot afford, the emphasis of this work is on sensors that are installed on the seashore but are still able to provide reliable real-time information regarding the movement of non-cooperative vessels sat over the horizon distances. One such sensor is HFSWR [9]. Although HFSWRs are initially designed for oceanographic measurements [10,11,12,13], nowadays, they are finding increasing usage in vessel detection and tracking at over the horizon distances [14,15,16,17,18].
In this paper, a network consisting of HFSWRs described in [19] will be used in order to identify the threats to maritime safety and security at open sea in the western part of the Gulf of Guinea, specifically the Bight of Benin. In order to do so, vessel tracks obtained via the HFSWR network are examined and compared with vessel positions provided by both AIS sources: LAIS stations located at the shore and SAIS data provided by the SAIS provider [20]. It is shown that two typical illegal activities which represent a persistent threat in the Bight of Benin region can be easily recognized. Those activities are illegal oil smuggling and piracy, both conducted on the high seas, away from the usual coastal sensors such as X or S band radars. In some cases, regular vessels are also switching off their AIS devices when they leave the coastal regions in order to avoid being detected by pirates. Our study shows that this action can also be recognized and is not to be confused with the illegal activities mentioned above.
The major contribution of this work is that it provides a clear way of identifying the illegal activities described in [6,7,8] using technical means (HFSWR). Moreover, according to the author’s knowledge, this is the first analysis of security threats and risk assessments in the Gulf of Guinea, which uses remote sensing systems as a main source of data. This is achieved through statistical analysis of all radar tracks collected over the period of several months. Detailed examination of vessels has been performed, and several distinctive cases of suspicious behavior have been identified and analyzed thoroughly, which confirms the benefits HFSWR is bringing to maritime safety and security in off-shore activities.
The rest of the paper is organized as follows: in Section 2, over the horizon sensor network currently deployed in the Bight of Benin is presented. A detailed analysis of illegal activities in the area is done in Section 3. Discussion regarding a way to recognize maritime threats at the high seas using HFSWR is provided in Section 4. Conclusions are drawn in Section 5.

2. Over the Horizon Maritime Sensor Network in the Gulf of Guinea

Over the horizon network considered in this analysis (and corresponding with the time period of observation as described in Section 4) covers one part of the Gulf of Guinea, specifically, the Bight of Benin, and it consists of:
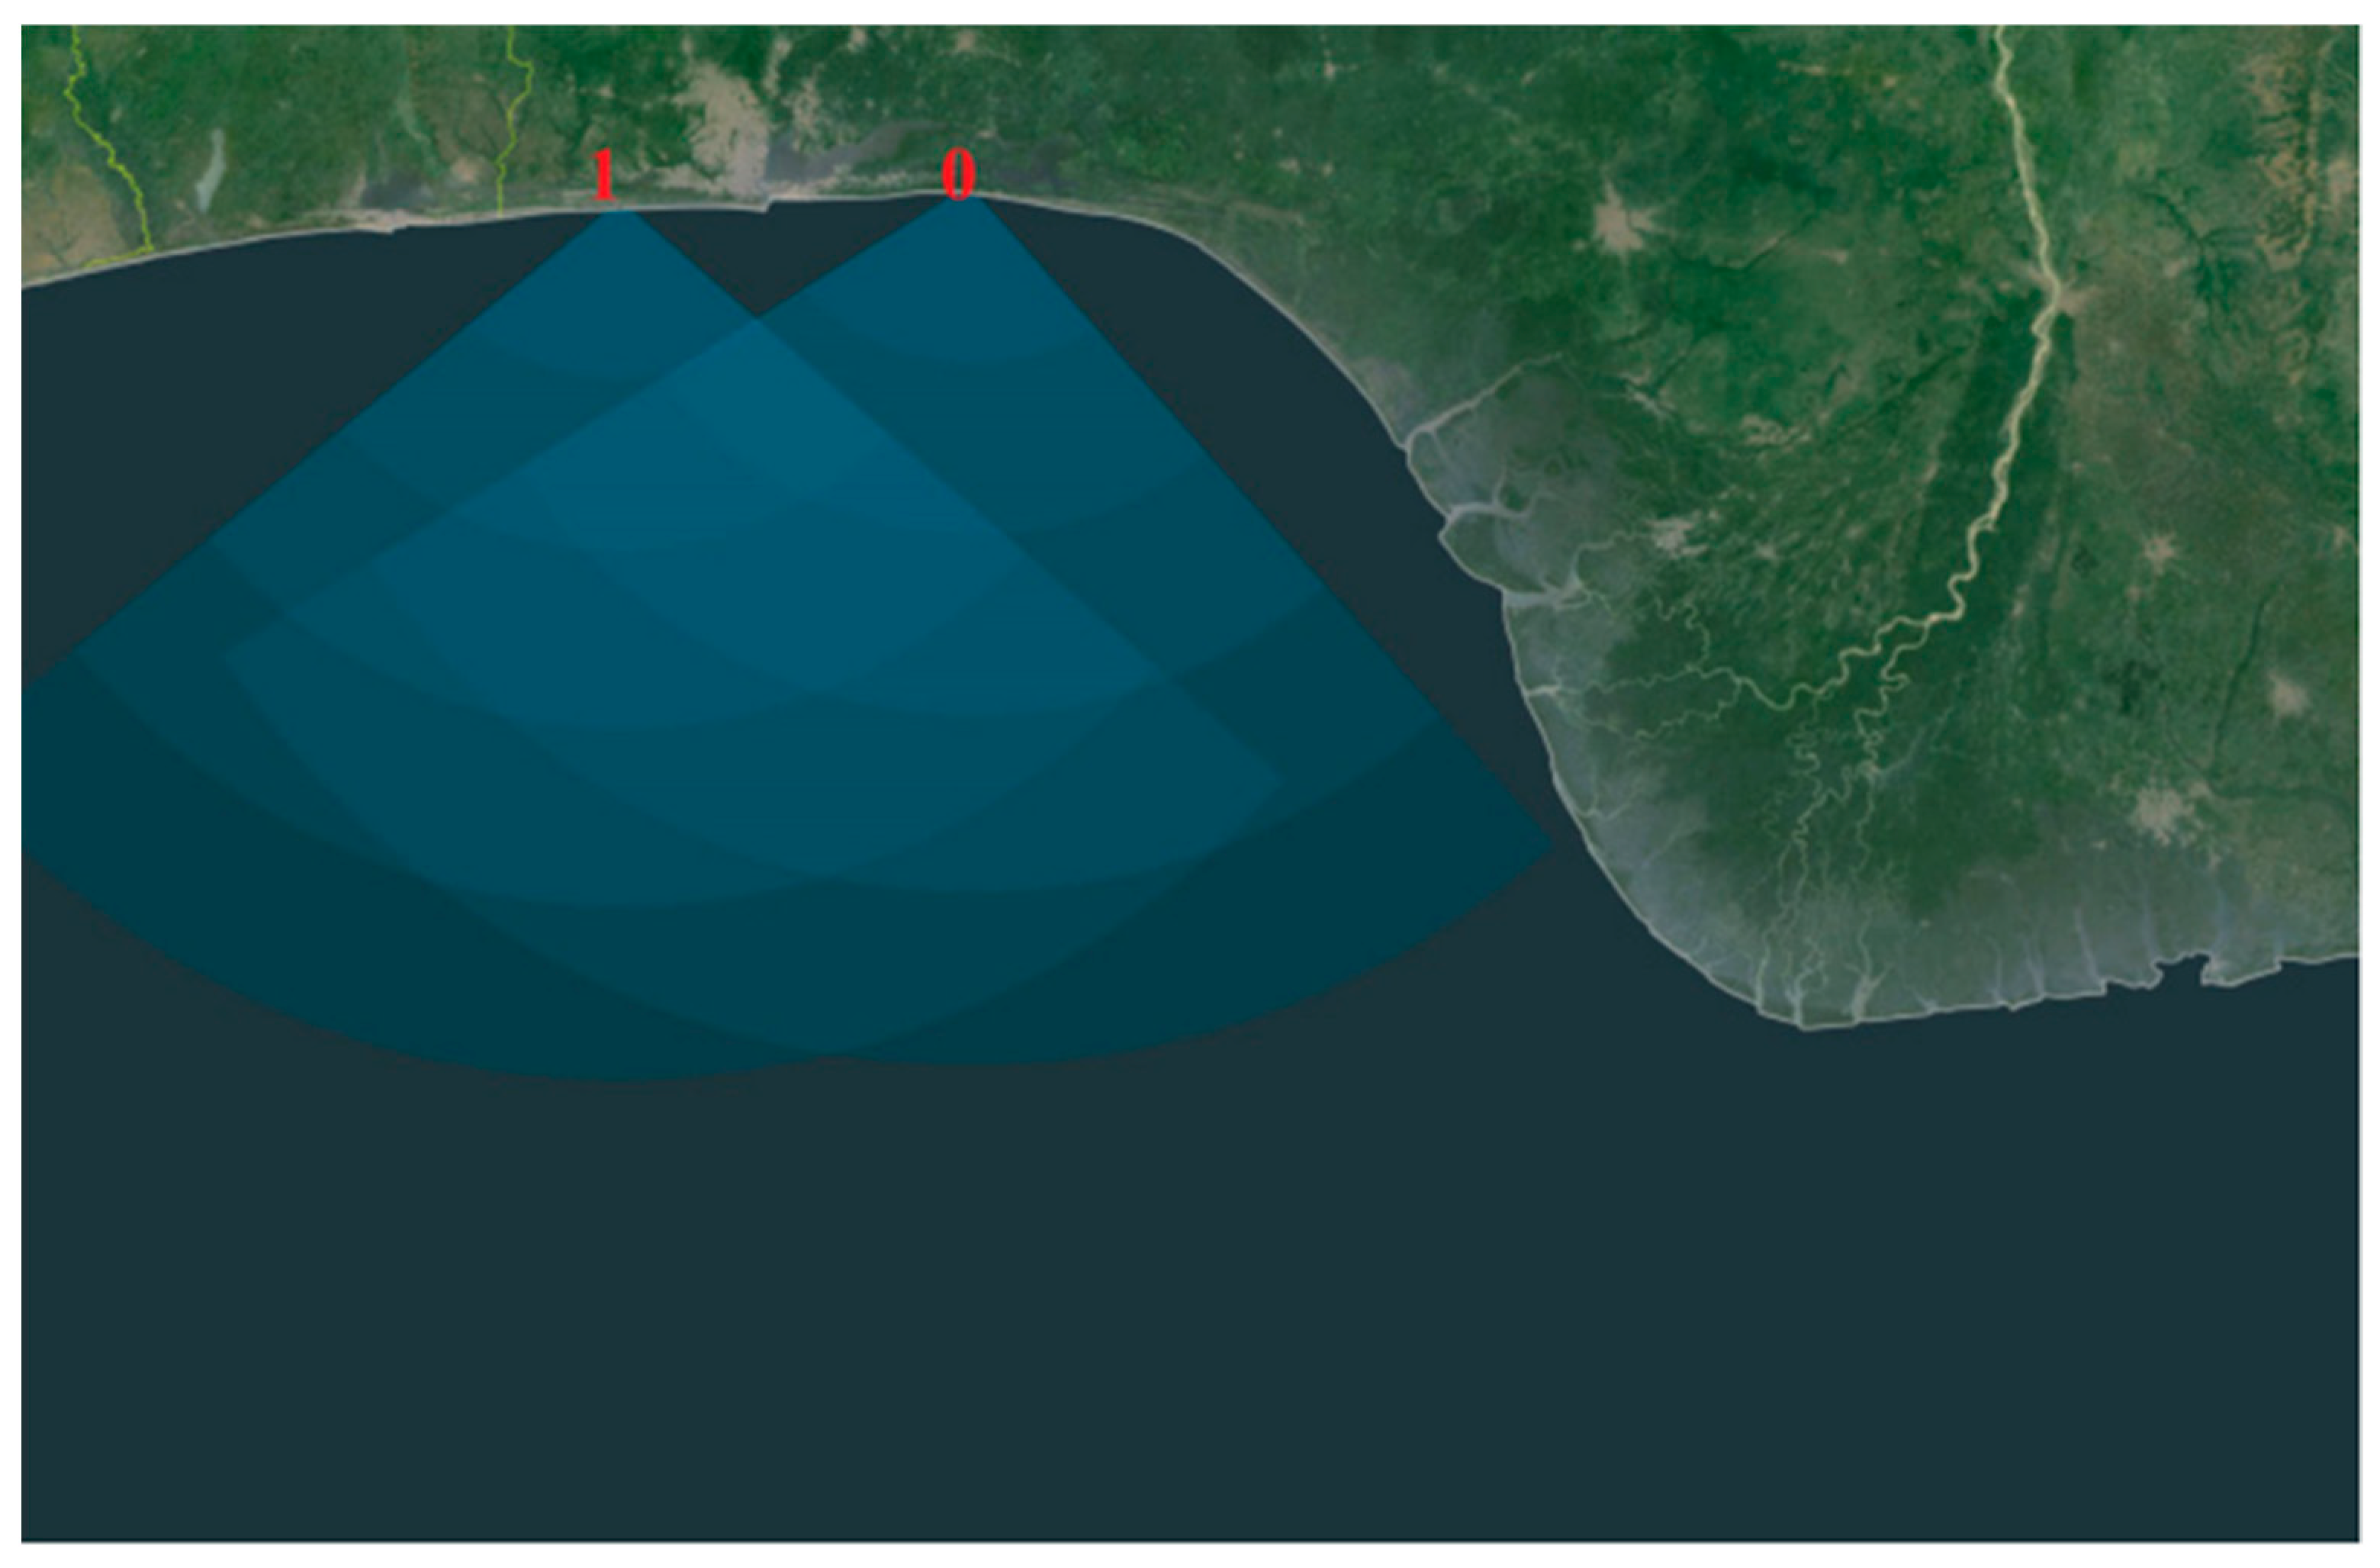
  • Two HFSWRs with a nominal range of 80 nautical miles (approximately 150 km) for a Bonn Express class of vessel [21] during night-time and sea states [22] up to 3. For larger vessels and during the day—time range can extend even beyond 125 nautical miles (approximately 230 km). Regardless of the time of day and vessel size, angle coverage is set to 120 degrees. More about used HFSWRs can be found further in the text, while the HFSWR network coverage area is shown in Figure 1.
  • Land AIS data: provided by multiple coastal sites equipped with AIS receivers.
  • Satellite AIS data: provided by the SAIS provider [20].

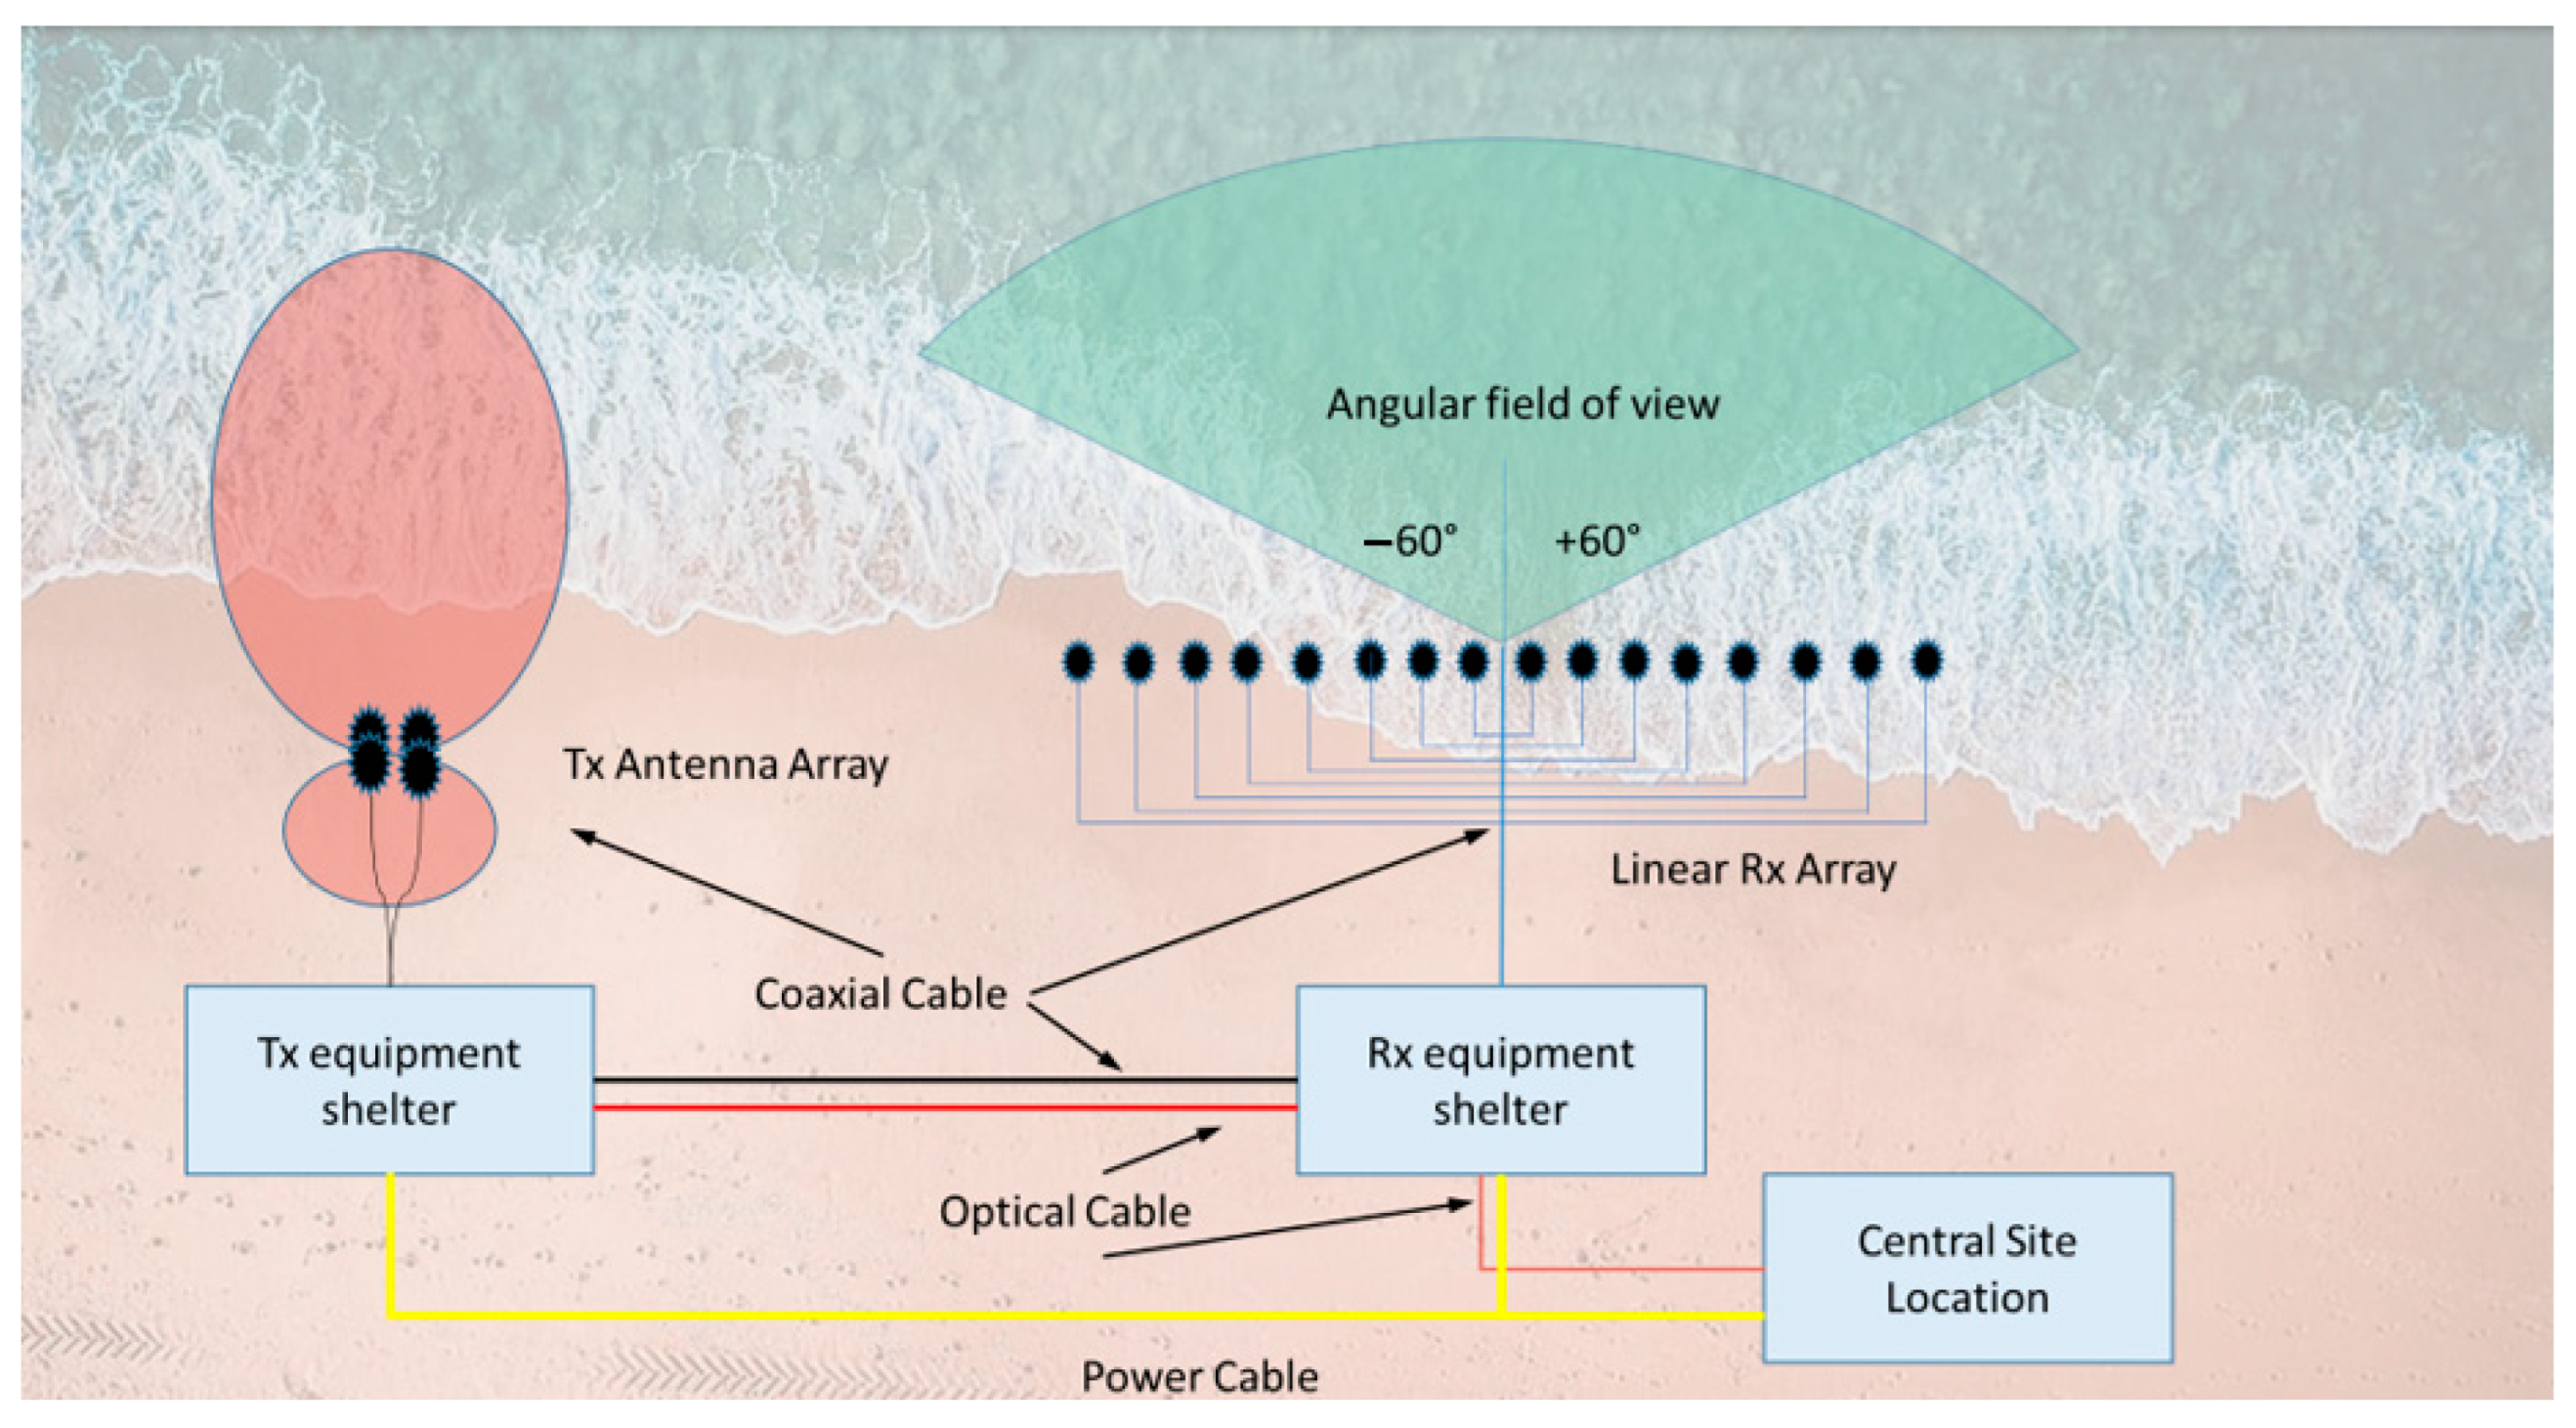
2.1. A Brief Description of Deployed HFSWR

The deployed HFSWR is based on Frequency Modulated Continuous Wave (FMCW) and quasi-monostatic principles. The deployed HFSWR site consists of a transmitter and receiver with their antenna arrays and a Central Site Location (CSL), which provides power supply, connectivity to the C2 (Command and Control), and sometimes even physical security (armed guards) to the HFSWR. A typical site layout is shown in Figure 2.
The transmitter array is a planar array consisting of 4 monopole antennas, while the receiving array is a linear array of 16 monopole antennas. It is important to note that the exact measure of the site’s geometry is defined by HFSWR center frequency since antenna spacing is roughly half of the wavelength (λ/2), while the transmitter and receiver’s mutual distance, with their antenna arrays, is 10λ. For example, if the center frequency is chosen to be 6.8 MHz, the wavelength is approximately 44 m, which corresponds to having a receiver site length of over 300 m and a mutual distance between sites of at least 440 m. A picture of the fully deployed site is shown in Figure 3.
As reported in [19], HFSWR measurement resolutions are provided in Table 1, resulting directly from properties of the transmitted FMCW signal (100 kHz bandwidth within 260 ms chirp duration), 16-element receiver antenna array, and adopted signal processing within a standard radar accumulation time period of 33 s. It should be noted that detection performance over a particular vessel directly depends on the vessel’s effective Radar Cross Section (RCS), where its vertical structures are the most significant limiting factor (the best range is achieved for vessels with vertical structures of λ/4 or more, while for structures less then λ/8, the range is significantly reduced).
In its current form, HFSWR performs independent signal acquisition with each receiver antenna, which is followed by its own receiver. At the antenna level, the signal is filtered from out-of-band components, pre-amplified, and translated to the baseband. After Direct Component (DC) suppression (component around 0 Hz) and low-pass filtering, the signal goes through 16-bit A/D conversion and further signal processing in digital form.
Complete signal processing consists of the following steps:
  • Range processing:
    where the digitalized complex envelope of the received signal is translated into the baseband, followed by the Fast Fourier Transform. In this way, the received signal is reshaped into signal level vs range form.
  • Doppler processing:
    where the signal is processed by the Blackman–Harris window function for suppression of higher order side lobes, followed by FFT, which outputs the Range–Doppler maps. These maps are generated for each angle value in the HFSWR field of view and represent signal levels dependent on the range and speed (Doppler shift) of targets.
  • Beamforming:
    where a conventional phase shift beam former is used for angle calculations, with the Orchard algorithm used for weighting coefficients calculations [18]. Numerical solving in an iterative manner provides the end result of beamforming: the so-called Range–Doppler–Azimuth cube (RDA cube), which contains signal power levels defined by all relevant parameters (range, Doppler shift, and azimuth).
  • Constant false alarm rate (CFAR) processing:
    where the input data for processing is given in the form of RDA cubes and joint noise/clutter distribution functions–formed especially for the area of the Gulf of Guinea (and thus representing dedicated, original contribution in modified Cell Averaging Greatest of CFAR algorithm used further for target detection). The end result of this processing is provided in the form of a list of detected targets.
  • Tracking:
    where all detections are fed to the algorithms with a track–before–detect principle to eliminate false targets by adopting a dedicated clutter density estimator [19]. In the Data association (DA) procedure, the simple gating density-based clustering method has been adopted: gating is based on the squared Mahalanobis distance (enhanced through binary search methods) and performed via an ellipsoid gate. The clustering process is relatively straightforward, performed on the list of all available tracks and ensuring that there are practically no links between the clusters in case of two measurements that differ only by range, it can be shown that the allowed range value differences span from 8 km to 32 km for extreme precision cases. Bearing differences span from 5° to 16°, while radial velocity spans from 1.8 m/s to 8 m/s. Optimal track-to-measurement assignments in a data association process are achieved with the partial use of JPDA on a majority of clusters (and the real-time performance with faster sub-optimal Roecker’s algorithm in less than 2% of all cluster cases).
Described signal processing is executed over all targets collected by (any) HFSWR: both targets using AIS and targets without AIS. In this way, HFSWR forms its own set of targets (and their corresponding tracks), which are integrated further (among two or more HFSWRs, and with the AIS system) within the process of data fusion.
This is just a brief description to provide the reader with a perception of the deployed HFSWR. The detailed description of the deployed HFSWR, including the block diagram and presentation of the processing steps up to the target tracking, can be found in [18], while algorithms and software used for target tracking on a single HFSWR level are described in detail in [19].

2.2. Description of Data Fusion Algorithms

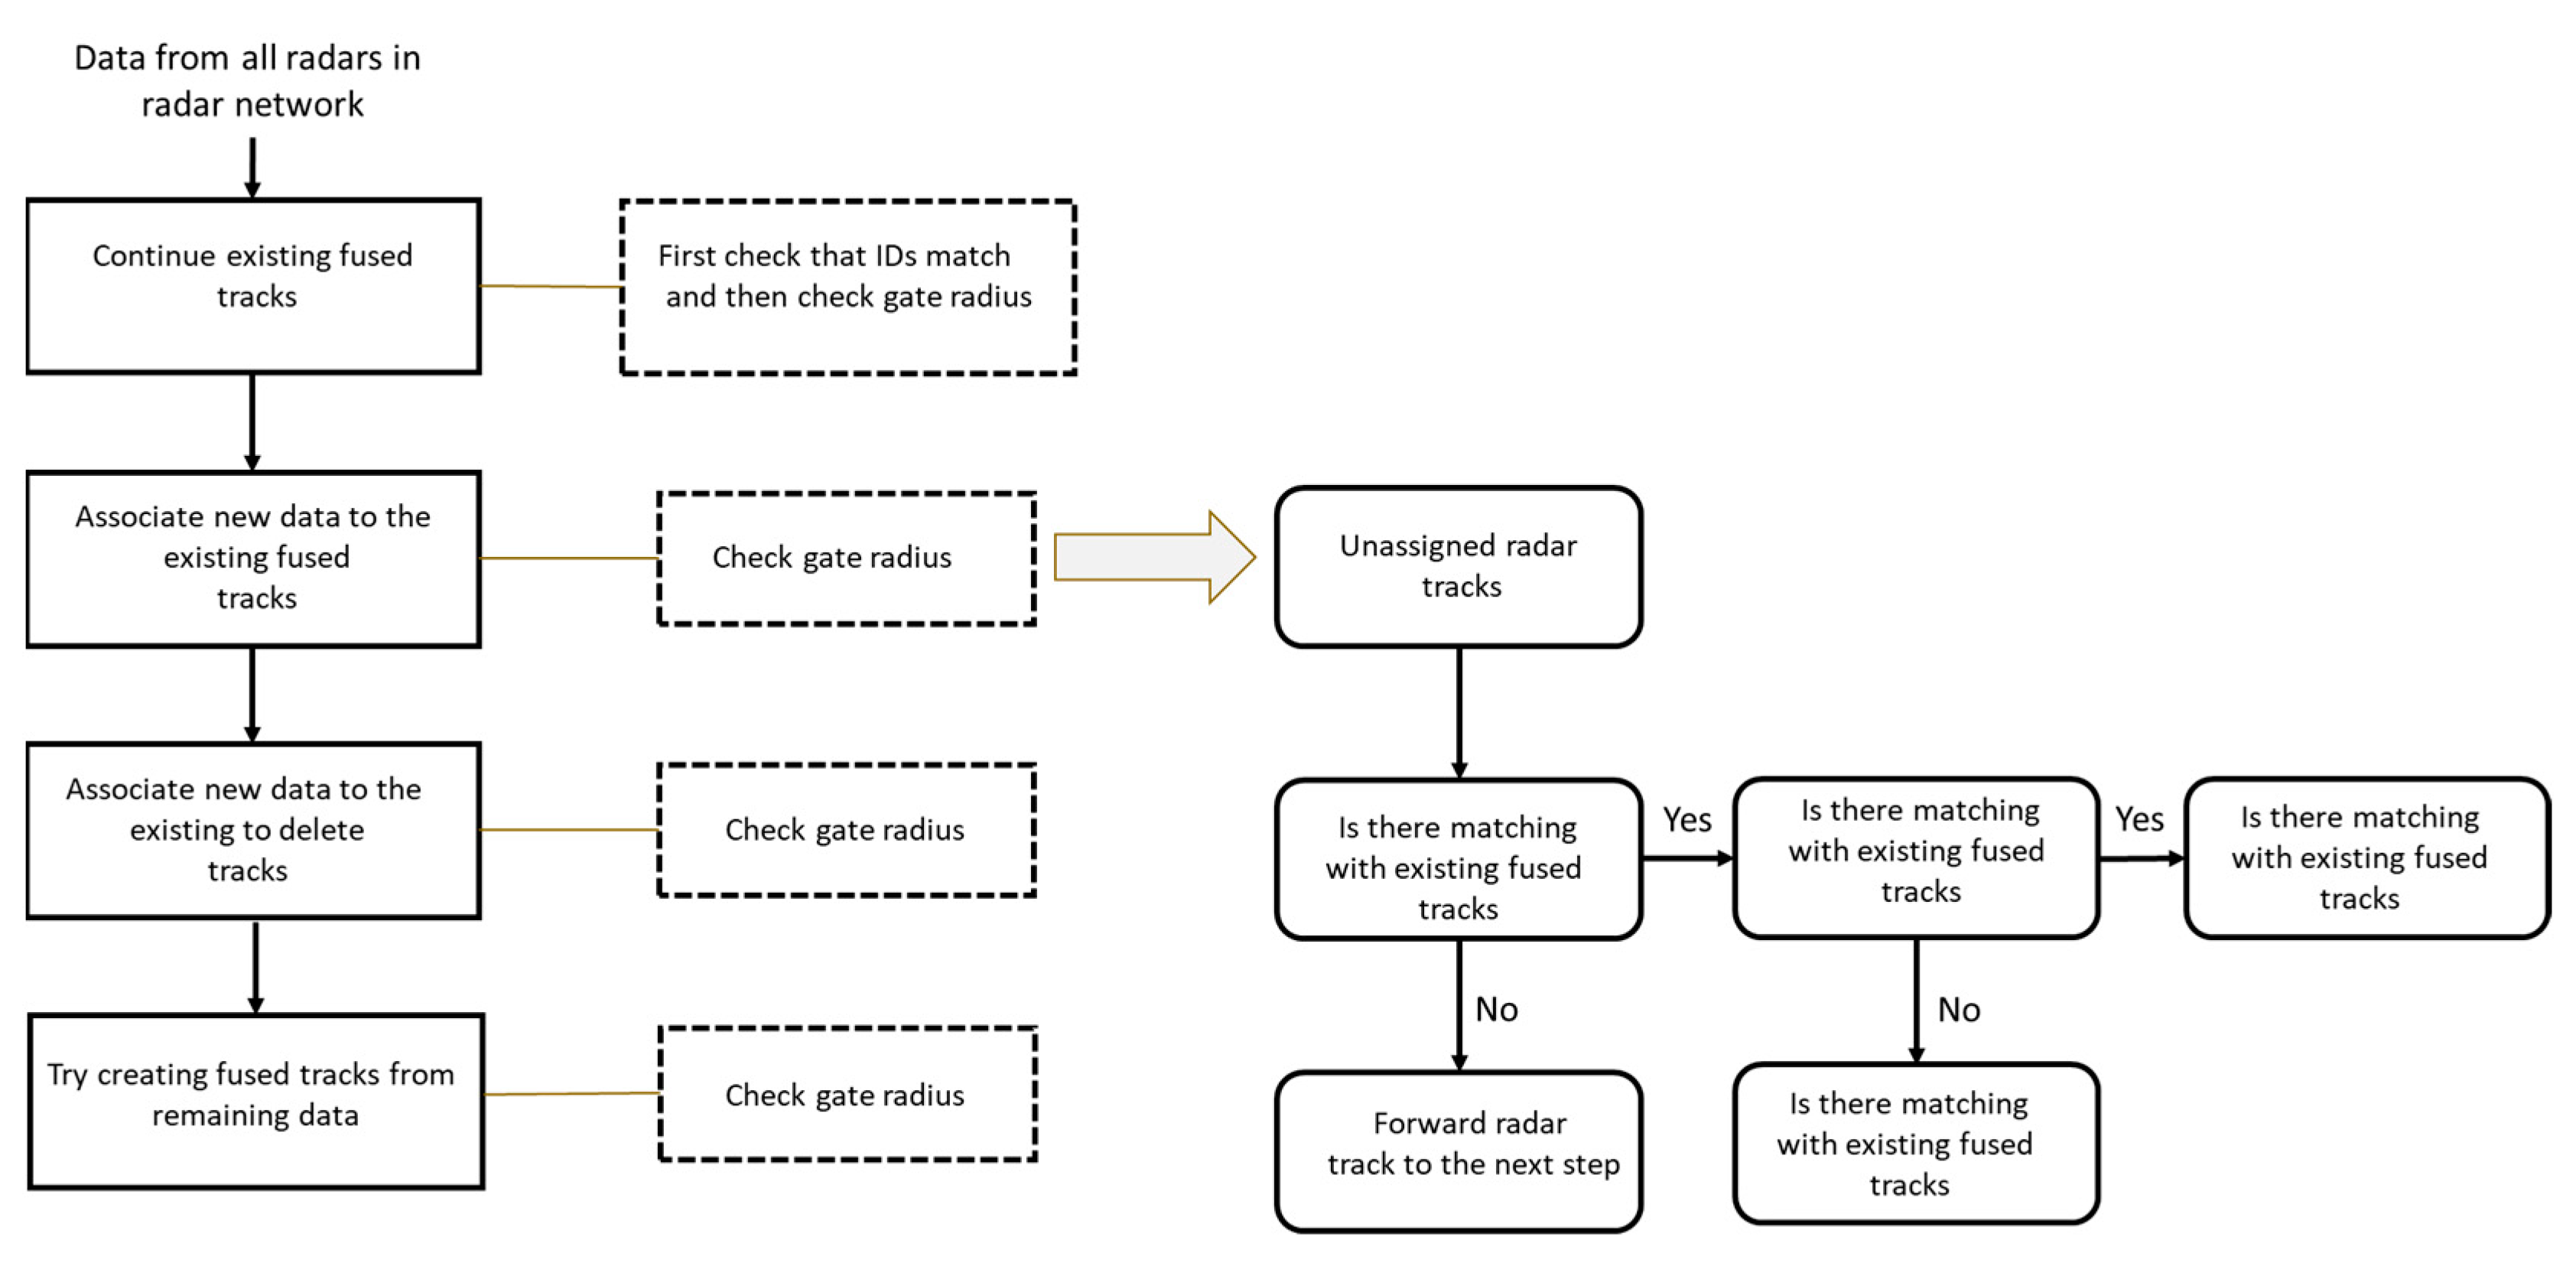
2.2.1. HFSWR–HFSWR Data Fusion Algorithm

The main purpose of the data fusion process is to combine radar tracks from individual HFSWRs into a single operational picture while simultaneously introducing performance improvement in terms of the probability of detection and the probability of a false alarm. The fusion of data collected by two or more HFSWRs is presented in Figure 4. In this concept, each track formed by any radar in the network has an identification (Id) and is being processed only when it appears N times in M consecutive observation periods. During the first step, the algorithm updates already formed fused tracks using newly arrived radar tracks. For each fused track, it is checking if the originating radar tracks are present in the newly arrived data. If the Id is matched, the algorithm checks if the radar track still falls within the fused track gate radius. When both conditions are satisfied, the fused track is updated. Otherwise, the radar track is forwarded to the following step of the algorithm, where for all unassigned radar tracks, the gating with existing fused tracks is checked. If a fused track loses all its source radar tracks, it is moved to the so-called predicted tracklist. The fused track stays in this list for K consecutive update periods and it is referred to as the predicted track. If no source (either new or old) is found within this time frame, the track is declared non-existent, and the algorithm stops further processing. The third step of the algorithm operates on tracks that are currently in the predicted tracklist, comparing them with the remaining radar tracks. If a matching track is found, the track is returned to the fused tracklist. During the last step of the algorithm, new fused tracks are formed from the remaining unassigned radar tracks. In the end, the predictions and corresponding gate radiuses for all the tracks present in the fused track and predicted track lists are calculated. The Thiel–San estimator is used to successfully track fused targets.
In order to demonstrate the benefits of the presented data fusion algorithm, a statistical analysis of all radar tracks collected over the period of one year is shown in Figure 5.
The analysis is presented on a monthly basis starting from the 1st of January 2018 and ending with the 31st of December 2018. During this period, nearly 68,000 single radar tracks were delivered by the HFSWRs in the network. After processing, slightly over 52,000 fused tracks were created, which means that nearly 16,000 radar tracks were eliminated since they were duplicates. In other words, this algorithm removes about 23% of the received radar tracks, thus significantly reducing the false alarm rate. Please take note that Appendix 1 of [25] provides a detailed analyses of HFSWR detection accuracy. There you may find that the typical position measurement error for HFSWR is several hundred meters. This is far too much for any of the commercially available maritime C2 systems. So, without the algorithms presented in [24,25,26], all duplicated targets will cause false tracks in the C2 system. Moreover, comparing results from the data fusion algorithm for the number of obtained targets with the number of targets obtained with individual radars, it becomes clear that the fusion algorithm introduces a detection improvement of 15 to 50% over the single radar. More details about measurements obtained with individual HFSWR radars, data fusion algorithms, and AIS are well described in our previous works [24,25].

2.2.2. HFSWR–AIS Data Fusion Algorithm

Multi-Radar Fusion Track (MRFT) points, are used for fusion with AIS data, which have their unique identifiers—Maritime Mobile Service Identity (MMSI). Since AIS message dataflow is chaotic, 8 h of deep history records for every MRFT and AIS must be kept. The algorithm is searching for a set of suitable MRFT integration candidates for each AIS data source, as shown in Figure 6. The algorithm checks all currently active MRFTPs to find the ones with a time stamp close to that of the AIS data. If this cannot be achieved, the algorithm tries to load MRFTs from its history in order to find those MRFTPs close to the AIS timestamp. Otherwise, the AIS position is extrapolated from the data provided by AIS under the assumption that the vessel did not change its course and speed. Next, the gate radius needs to be checked. Those MRFTs which pass both checks (timestamp and gate radius) are considered candidates for integration. If MRFT is considered unsuitable for integration N consecutive times, it shall never again be considered for integration with the observed AIS track. Then, for each candidate pair, the matching factor is calculated: the likelihood that the observed pair of data originates from the same vessel. At the end of this step, for every AIS track, MFRT candidates are sorted by their matching factor value.
During the next step, mutual integration affinities are cross-analyzed on the basis of the current matching factor, the average value of the matching factor during previous N integration periods, and the number of candidates. Finally, the best possible integration pairs of data are chosen and processed further, while the uniqueness of integration pairs (AIS MMSI, MRFT Id) is preserved. The integration link will not be created if the matching factor is less than 51%. At the final stage, all integrated MRFTs are marked with their corresponding MMSI. All MRFTs which cannot be integrated with any AIS data will be forwarded as they are. The same stands true for all AIS data which cannot be integrated with any MRFTs.
The fusion concept described above has been deployed in operating maritime surveillance systems in the Gulf of Guinea for several years, where it is nowadays directly processing approximately 6000 targets per month on average. Approximately one-half of these targets are matched with corresponding AIS data, while around 30% of targets are eliminated by the algorithm due to duplication, which seriously reduces the number of false alarms in the system. A more detailed description of the presented HFSWR–AIS data fusion algorithm may be found in [25].
The methodology regularly used for data collection, processing, and classification for high-level analysis in the regular operation of the HFSWR network, as described in this section, is also used for considerations derived from data of interest in Section 4 of this paper.

2.3. Role and Description of the Other Maritime Sensor in the Area

AIS is an automatic tracking system that provides information such as unique identification, position, course, and speed of the vessel through the integration of onboard devices such as VHF standard transceivers, GPS receivers, gyro-compasses, and electronic navigation sensors in order to combine all relevant information about the vessel into a single data stream. The International Maritime Organization’s Convention for the Safety of Life at Sea requires onboard AIS devices to be operational aboard international voyaging vessels with a gross tonnage (GT) of 300 or more and all passenger ships of all sizes. It is mandatory to remember that the vessel’s crew cooperativity is a must in order to track the vessel via AIS data since at any time crew may switch off the onboard AIS device.
Land AIS base stations are situated along the coastline, and they are able to track vessels equipped with AIS transceivers. Their shortcoming is their ability to cover vessels traveling near the shore or slightly beyond the horizon. Vessels can also be tracked by satellites with AIS receivers located on the satellites orbiting over the area. This is very important for vessels that are sailing far away from the shore since their AIS data can only be relayed to the authorities via satellite networks. The shortcoming of SAIS is its latency, which in the Gulf of Guinea may measure in hours.
In the end, it should be mentioned that coastal site towers are equipped with Maritime Microwave Radars (MMR) in X-band (8–12 GHz) and/or S-band (2–4 GHz) as well as Electro-Optical devices (EOD). MMRs are traditionally used to assist in the navigation process and monitor the naval traffic near the coastline. Their role is crucial for the navigation process, more precisely in the conditions of low visibility or busy traffic in territorial waters and harbor areas. MMR in X-band provides higher resolution, while S-band radar performances are less prone to bad weather conditions (fog, haze, etc.). EOD consists of visible and IR range cameras, and their main purpose is to identify vessels sailing close to the coastline. However, both EOD and MMR are limited by an optical line-of-sight and cannot be used efficiently for monitoring the high seas unless they are mounted on moving platforms or high mountains near the shore. Since neither is available in the area, MMR and EOD cannot be efficiently used for high-seas monitoring.

3. Analyses of Maritime Threats in the Gulf of Guinea

Before an in-depth analysis is conducted, the terms piracy and armed robberies at sea must be clearly defined. A strict definition of maritime piracy only includes attacks on shipping on the high seas. The term “high seas” defines an area of the sea that lies more than 12 nautical miles from the nearest coastline and does not fall under the jurisdiction of any state. On the other hand, if an attack is carried out inside those 12 nautical miles, then it is classified as an armed robbery at sea. For simplicity’s sake, in Figure 7, both piracy and armed robbery at sea conducted in the Gulf of Guinea from 2016–2019 are presented.
The main target of the pirate attacks on the high seas is valuable cargo transported by vessels in the area or even hijacking of vessels and their crews. According to United Nations Office for Drugs and Crime (UNODC), in the three years stretching from early 2015 to late 2017, the losses countries in the region had experienced due to piracy exceeded 2.3 billion US dollars [7], while in 2018, the number of incidents (piracy and armed robbery) recorded was 112, which was an increase of 15% compared to 2017. In 2019, 98 incidents of piracy and robbery of vessels were recorded in the Gulf of Guinea [27]. Hijacking/kidnapping incidents were reported in 2018, resulting in 102 crew kidnapped and 164 in 2019 [27].
The second threat in the area is illegal fishing, and this is almost exclusively done on the high seas. However, since illegal fishing is completely unregulated, it can lead to the complete depletion of biological resources and thus endanger the marine ecosystem to the point of no return [28]. According to the World Wildlife Fund, those losses are measured in billions of dollars every year [29]. Comprehensive analyses of illegal fishing in West Africa, and thus the Gulf of Guinea, can be found in [30]. Henceforth, no analysis is done regarding the sailing pattern of illegal fishers simply because no action is being taken by the authorities, as far as the authors of this paper are informed.
The third threat is smuggling, and in this area, there are no kinds of goods that cannot be subjected to smuggling. Entities behind smuggling start from small rice smugglers, who are trying to avoid import taxes, and end with huge criminal organizations who operate a fleet of small and medium-sized tankers in order to “export” the crude oil from rich fields located in the Niger River Delta to the illegal refineries [31].

4. Recognizing Maritime Threats at the OTH Distances Using HFSWR

In order to properly recognize potential threats at the high seas in the area, a detailed examination of vessels must be conducted, taking into consideration both those using the AIS and those not using the AIS. The only way available in the area (since there are no MW radars and EO devices mounted on the flying platforms available in the area) to successfully detect and track a vessel at high seas which are not utilizing its AIS device is the network of HFSWRs presented in Section 2. All AIS tracks obtained during the last half of 2018 are presented in Figure 8.
In Figure 8, all the routes are represented in shades of blue, stretching from dark blue to white. The brighter the color, the more vessels were using the route. From Figure 8, it can easily be seen that the majority of vessels are centered around large ports such as Lagos in the north of Figure 8, which is not a surprise since Lagos is one of the busiest harbors in Africa. In the eastern portion of Figure 8, an oil-rich area of the Niger River Delta can also be easily noted. This area consists of both inland oil fields, which can be accessed by sea, and offshore oil platforms, which are located in Nigerian territorial waters as well as Nigerian high seas. It is clear that some of the platforms are located far beyond the horizon and thus out of the reach of regular microwave sensors located on land but well inside the coverage area of HFSWRs. The usual routes used by vessels in the area are quite expected and lead straight to the large ports and the oil fields, nothing unusual at first glance.
Now, let us examine the routes of the vessels which are not utilizing AIS devices, although the majority are obligated to do so by international regulations. Figure 9 represents these vessels, which are detected and tracked by the network of HFSWRs during the same observation period.
In order to make the HFSWR network as efficient as possible, the HFSWRs are located outside of port areas so they can be focused on the high seas. In Figure 9, a large number of vessels not utilizing AIS devices may be observed.
Three distinctive cases must be clarified here:
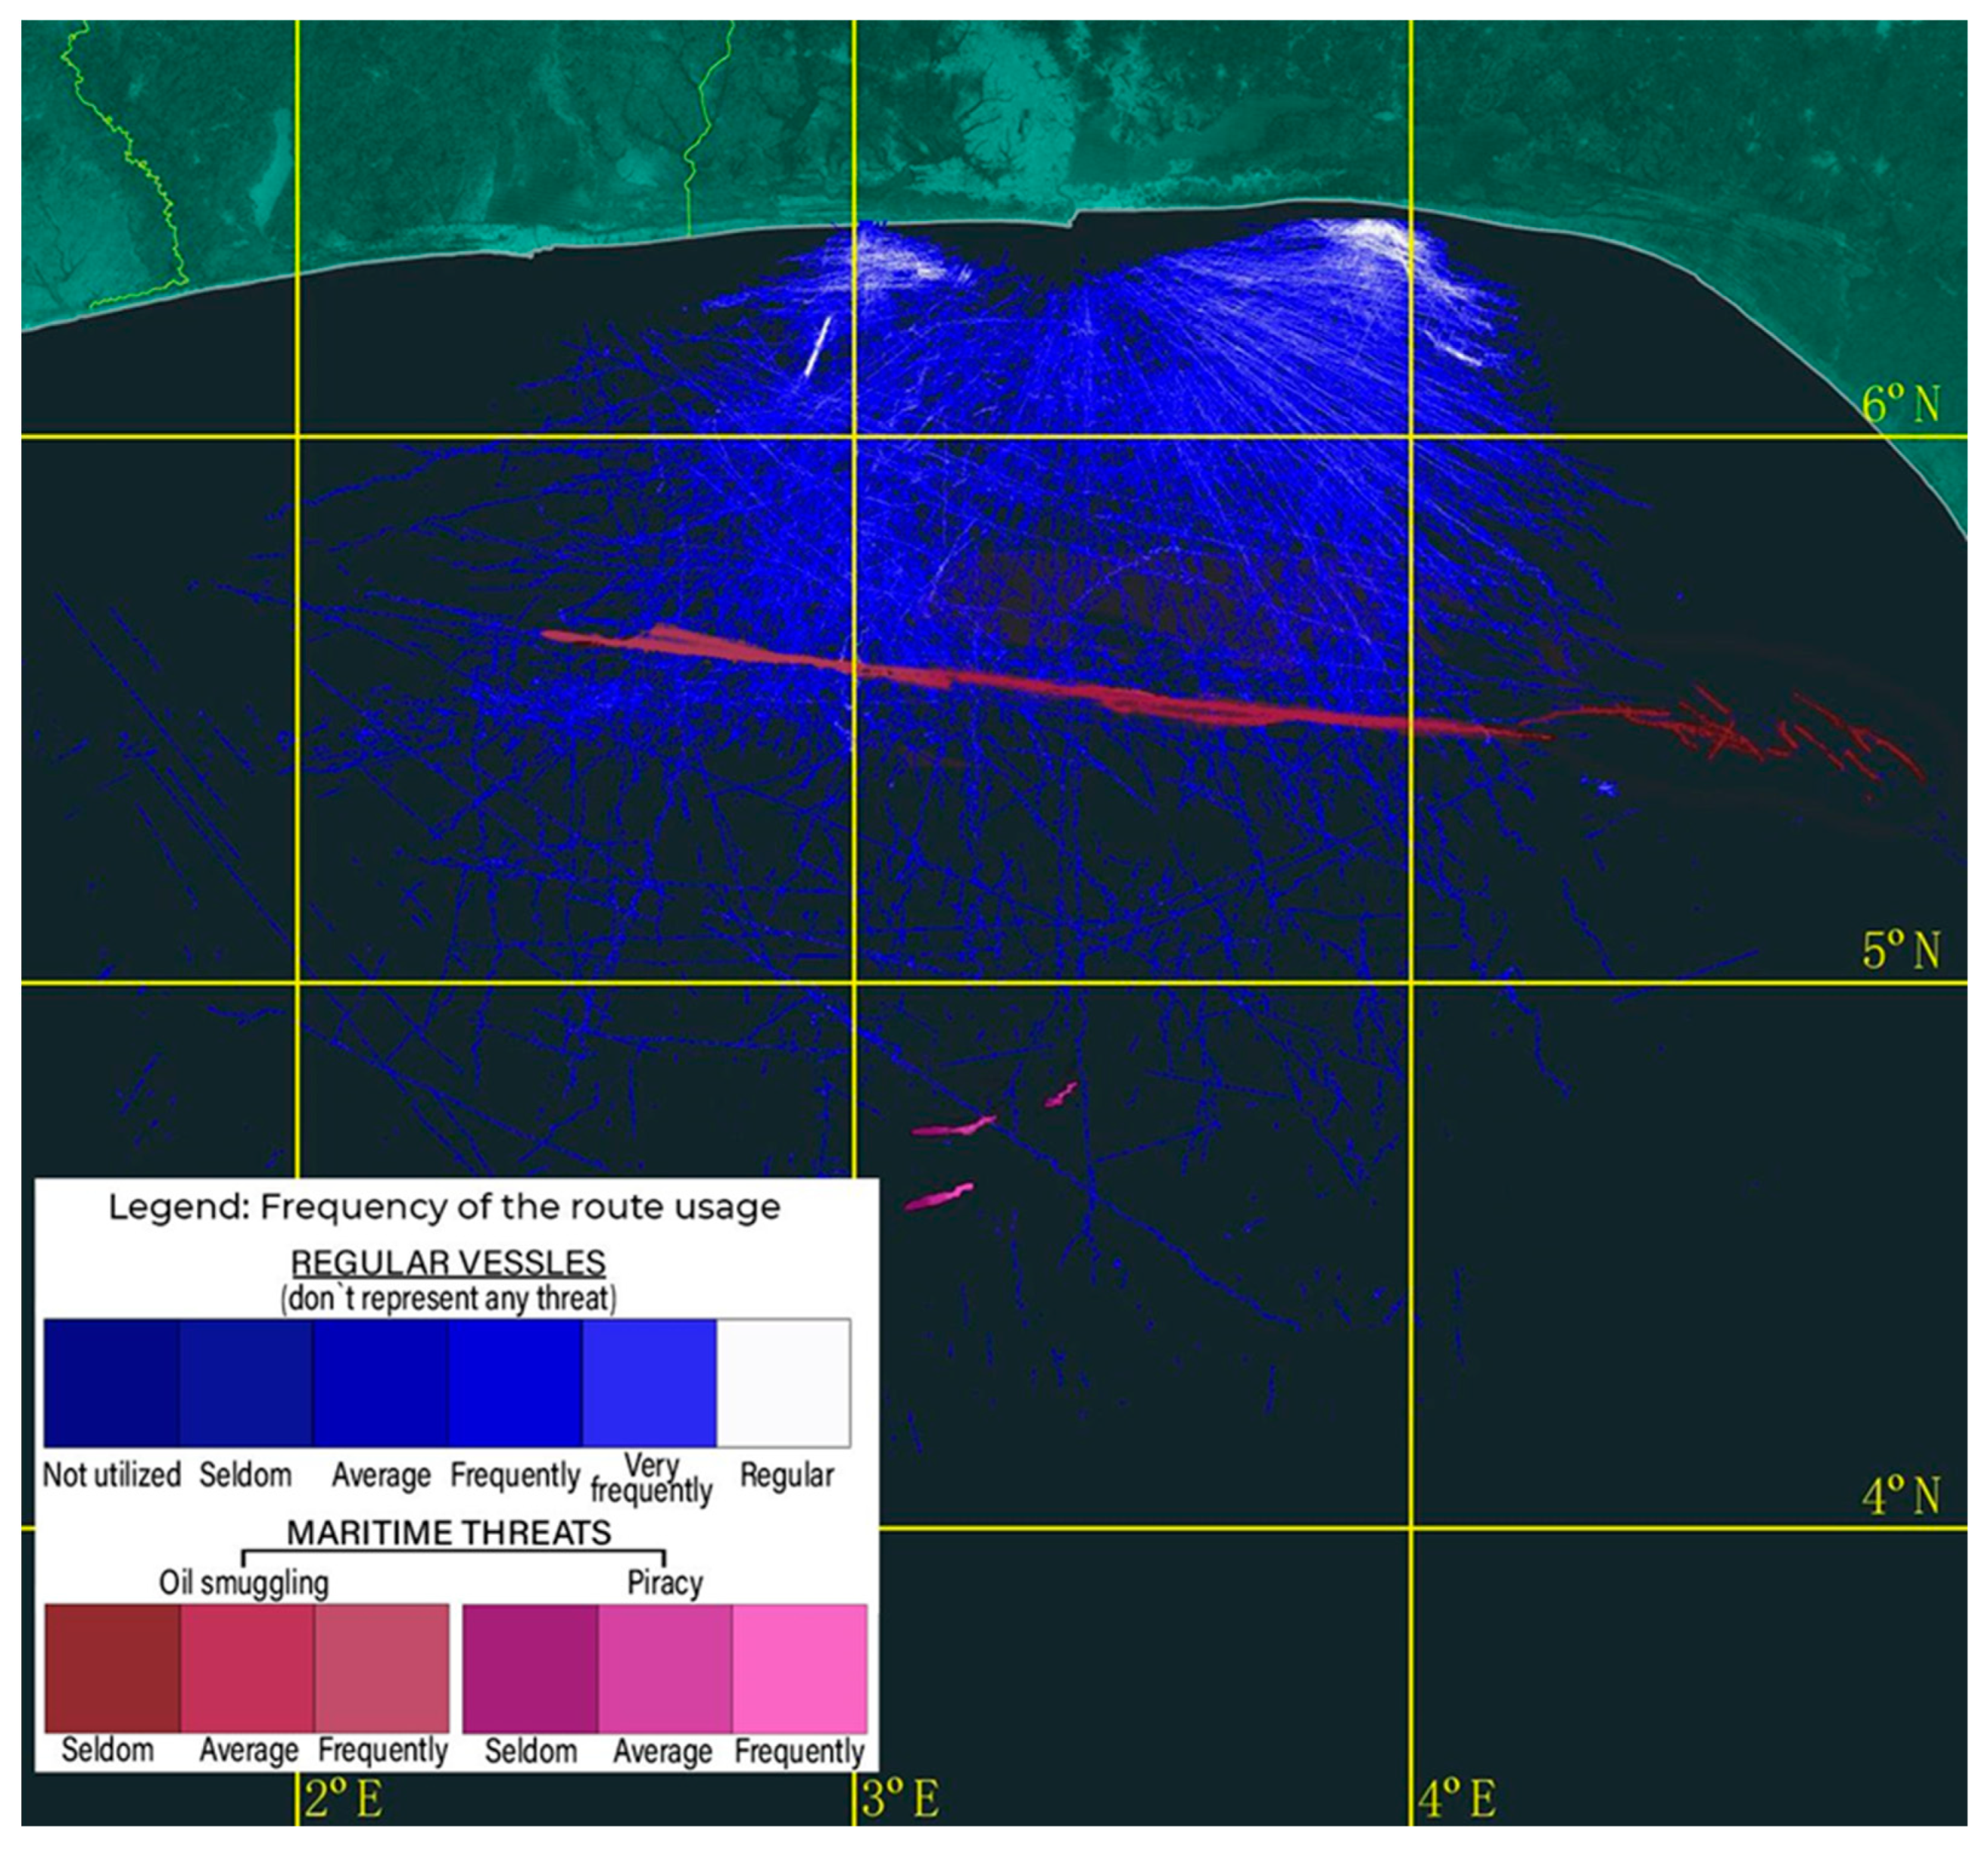
  • Vessels detected in HFSWR vicinity: Those vessels are smaller fishing vessels, and despite reflecting a weak echo, they are fairly close to the HFSWR and thus are detected and tracked. Furthermore, there is a development project near the eastern HFSWR with a lot of activity in the area, so more vessels are passing in the coverage area of that HFSWR. In the end, that HFSWR is located between the port of Lagos and the oil fields in the Niger River Delta, and not all vessels passing through the area are utilizing AIS devices, although the majority of them should. All vessels in this area can also be detected with MMR and/or electro-optical systems located on the shore and thus are tracked by more than one sensor type. Henceforth, the trajectories of these vessels are depicted with shades of blue, signalizing that they do not represent a maritime threat. There are other routes that are located further away from the shore and are depicted with shades of blue in Figure 9. In practice, these routes most probably represent the vessels that simply turn off their AIS devices in order to avoid detection by pirates operating in the area since they are following the regular shipping routes. Although this is not completely in accordance with international regulations, it has been a proven tactic to avoid pirate attacks. It is clear that those vessels do not represent any kind of threat but simply try to stay out of trouble.
  • Vessels whose trajectories are depicted in shades of red color: Frequent movement directly from the rich oil area westward without the utilization of AIS devices. This is extremely suspicious behavior. Although it may be argued that these vessels are also trying to avoid detection by pirates operating in the area, similar to case 2, it also may signal that there is a large-scale oil smuggling operation. If this is the case, a fleet of tankers is illegally “exporting” crude oil without approval from the authorities. Such an operation will represent a large-scale organized crime scheme involving hundreds (probably thousands) of people in multiple countries, producing millions in illegal profits annually, which directly translates to at least the same amount of losses to all participants in the legal oil trade. Naturally, the authorities checked and confirmed the suspicions, which resulted in the arrest of multiple medium-sized tankers which were transporting the oil from Niger River Delta fields westward utilizing the described route [31,32,33].
  • Vessels whose trajectories are depicted in shades of purple: Unusually high number of vessels far away in the high seas which are not following any regular shipping route and do not utilize AIS devices. The three short but very frequent sailing patterns can be noticed here, all of them nearly laying perpendicular to the usual shipping routes. These patterns may very well present vessels circulating in the area looking for prey since these routes do not follow any shipping route but directly intersect them. Needless to say, this was also checked by the authorities, and even though the operation was carried away approximately 120 nautical miles offshore, the network of HFSWRs was quite successful in vectoring navy vessels toward the suspicious vessel. According to the data made publicly available during International Maritime Defense Exhibition and Conference (IMDEC) held in Accra in July 2019 [33], this operation resulted in the prevention of planned pirate attacks and the seizure of pirate vessels. According to the same source, similar operations were conducted afterward and resulted in multiple vessel seizures on the high seas, thus reducing the number of pirate attacks in the Bight of Benin by nearly 50%.

5. Conclusions

In this paper, a network of sensors built around HFSWRs as primary sensors for maritime surveillance at the high seas was presented, and its efficiency in the detection of potential maritime threats is discussed. An environment where the maritime surveillance network is located in the Gulf of Guinea, specifically the Bight of Benin. The maritime surveillance network consists of two HFSWRs, several coastal sites with LAIS receivers, and SAIS data provided by a SAIS data provider and covers approximately 100,000 km2 of the sea. In order to identify a behavior pattern of non–cooperative vessels (potential threats), an analysis is done in which AIS and HFSWR data are compared. In conducted analyses, it is shown that a typical pattern of behavior can be easily recognized for illegal activities (illegal oil smuggling and piracy) which plague the waters where this study is conducted. This provides an edge to the authorities over those who are engaged in illegal activities since, with the provided information, authorities can react before the illegal act is conducted and prevent it.
In the end, it should be mentioned that even though it may present a greater threat, illegal fishing is out of the focus of the authorities in the area. Henceforth, no analysis is done regarding the sailing pattern, which may be a trademark of illegal fishers, simply because no action by the authorities known to the authors of this paper is conducted. However, illegal fishing is a threat to both humans and the planet and presents a topic for future work.

Author Contributions

Conceptualization, D.N.; methodology, D.N.; software, N.S. (Nikola Stojkovic), N.S. (Nikola Stojiljkovic) and Z.P.; validation, S.P. and D.N.; formal analysis, D.N.; investigation, N.S. (Nikola Stojkovic) and D.N.; resources, V.D.O.; data curation, N.S. (Nikola Stojkovic); writing—original draft preparation, S.P. and D.N.; writing—review and editing, D.N., S.P. and N.G.; visualization, N.S. (Nikola Stojkovic) and Z.P.; supervision, V.D.O.; project administration, V.D.O. and N.G. All authors have read and agreed to the published version of the manuscript.

Funding

The research is funded by the Vlatacom Institute of High Technologies under project #89.1. The APC is also covered by Vlatacom Institute of High Technologies.

Acknowledgments

Research is completely funded by Institute Vlatacom. Furthermore, APC is also funded by Institute Vlatacom.

Conflicts of Interest

The authors declare no conflict of interest.

References

  1. United Nations. Handbook on Statistics 2019; United Nations Publication: Geneva, Switzerland, 2019; pp. 71–83. ISBN 978-92-1-112940-3.
  2. Bosch, T.; Colijn, F.; Ebinghaus, R.; Körtzinger, A.; Latif, M.; Matthiessen, B.; Melzner, F.; Oschlies, A.; Petersen, S.; Proelß, A.; et al. World Ocean Review 1, Living with the Oceans; MaribusgGmbH: Hamburg, Germany, 2010; pp. 165–170. ISBN 978-3-86648-012-4. [Google Scholar]
  3. UNITAR. Global Report on Maritime Piracy; UNITAR: Geneva, Switzerland, 2014; Available online: https://unosat.web.cern.ch/unosat/unitar/publications/UNITAR_UNOSAT_Piracy_1995-2013.pdf (accessed on 12 February 2023).
  4. UN News. Available online: https://news.un.org/en/story/2017/11/570172-un-security-council-urges-comprehensive-response-piracy-somali-coast (accessed on 20 January 2023).
  5. EU NAVFOR. Available online: http://eunavfor.eu/mission/ (accessed on 1 February 2023).
  6. World Economic Forum. Available online: https://www.weforum.org/agenda/2019/06/west-africa-is-becoming-the-world-s-piracy-capital-here-s-how-to-tackle-the-problem/ (accessed on 10 February 2023).
  7. The United Nations Office on Drugs and Crime. Available online: https://www.unodc.org/nigeria/en/press/west-africa-loses-2-3-billion-to-maritime-crime-in-three-years-as-nigeria--unodc-rally-multi-national-efforts-to-thwart-piracy-in-the-gulf-of-guinea.html (accessed on 11 February 2023).
  8. Available online: https://documents-dds-ny.un.org/doc/UNDOC/GEN/N22/366/73/PDF/N2236673.pdf?OpenElement (accessed on 9 March 2023).
  9. Fabrizio, G. High Frequency over-the-Horizon Radar: Fundamental Principles, Signal Processing, and Practical Applications; McGraw-Hill, Inc.: New York, NY, USA, 2013. [Google Scholar]
  10. Helzel, T.; Kniephoff, M.; Petersen, L. Oceanography radar system WERA: Features, accuracy, reliability and limitations. Turk. J. Electr. Eng. Comput. Sci. 2010, 18, 389–397. [Google Scholar] [CrossRef]
  11. Shay, L.K.; Martinez-Pedraja, J.; Cook, T.M.; Haus, B.K.; Weisberg, R.K. High-Frequency Radar Mapping of Surface Currents Using WERA. J. Atmos. Ocean. Technol. 2007, 24, 484–503. [Google Scholar] [CrossRef]
  12. Liu, Y.; Weisberg, R.H.; Merz, C.R. Assessment of CODAR SeaSonde and WERA HF Radars in Mapping Surface Currents on the West Florida Shelf. J. Atmos. Ocean. Technol. 2014, 31, 1363–1382. [Google Scholar] [CrossRef]
  13. Lipa, B.; Barrick, D.; Alonso-Martirena, A.; Fernandes, M.; Ferrer, M.I.; Nyden, B. Brahan Project High Frequency Radar Ocean Measurements: Currents, Winds, Waves and Their Interactions. Remote Sens. 2014, 6, 12094–12117. [Google Scholar] [CrossRef]
  14. Ponsford, A.; McKerracher, R.; Ding, Z.; Moo, P.; Yee, D. Towards a Cognitive Radar: Canada’s Third-Generation High Frequency Surface Wave Radar (HFSWR) for Surveillance of the 200 Nautical Mile Exclusive Economic Zone. Sensors 2017, 17, 1588. [Google Scholar] [CrossRef] [PubMed]
  15. Sun, W.; Ji, M.; Huang, W.; Ji, Y.; Dai, Y. Vessel Tracking Using Bistatic Compact HFSWR. Remote Sens. 2020, 12, 1266. [Google Scholar] [CrossRef]
  16. Sevgi, L.; Ponsford, A.; Chan, H.C. An integrated maritime surveillance system based on high-frequency surface-wave radars. Part 1. Theoretical background and numerical simulations. IEEE Antennas Propag. Mag. 2001, 43, 28–43. [Google Scholar] [CrossRef]
  17. Ponsford, A.; Sevgi, L.; Chan, H.C. An integrated maritime surveillance system based on high-frequency surface-wave radars. Part 2. Operational status and system performance. IEEE Antennas Propag. Mag. 2001, 43, 52–63. [Google Scholar] [CrossRef] [PubMed]
  18. Nikolic, D.; Stojkovic, N.; Petrovic, P.; Tosic, N.; Lekic, N.; Stankovic, Z. The high frequency surface wave radar solution for vessel tracking beyond the horizon. Facta Univ. Electron. Energetics 2020, 33, 37–59. [Google Scholar] [CrossRef]
  19. Stojkovic, N.; Nikolic, D.; Puzović, S. Density Based Clustering Data Association Procedure for Real–Time HFSWRs Tracking at OTH Distances. IEEE Access 2020, 8, 39907–39919. [Google Scholar] [CrossRef]
  20. Satellite AIS. Available online: https://www.orbcomm.com/en/solutions/maritime/ais-data (accessed on 10 February 2023).
  21. Marine Traffic. Available online: https://www.marinetraffic.com/is/ais/details/ships/shipid:371702/mmsi:-8711368/imo:8711368/vessel:BONN_EXPRESS (accessed on 15 January 2023).
  22. Table 3700: Sea State. Available online: https://www.nodc.noaa.gov/woce/woce_v3/wocedata_1/woce-uot/document/wmocode.htm (accessed on 15 January 2023).
  23. Institute Vlatacom. vHF-OTH Radar System Design Document; Internal Company Standard Document; Institute Vlatacom: Belgrade, Serbia, 2014. [Google Scholar]
  24. Nikolic, D.; Stojkovic, N.; Popovic, Z.; Tosic, N.; Lekic, N.; Stankovic, Z.; Doncov, N. Maritime over the horizon sensor integration: HFSWR data fusion algorithm. Remote Sens. 2019, 11, 852. [Google Scholar] [CrossRef]
  25. Nikolic, D.; Stojkovic, N.; Lekic, N. Maritime over the Horizon Sensor Integration: High Frequency Surface Wave Radar and Automatic Identification System Data Integration Algorithm. Sensors 2018, 18, 1147. [Google Scholar] [CrossRef] [PubMed]
  26. Institute Vlatacom. OTHR System: Results of the Field Measurement Report; Internal Company Standard Document; Institute Vlatacom: Belgrade, Serbia, 2016. [Google Scholar]
  27. Okafor-Yarwood, I.; Adewumi, I.; Pigeon, M. Stable Seas: Gulf of Guinea. Available online: https://www.researchgate.net/publication/340952763_Stable_Seas_Gulf_of_Guinea (accessed on 9 March 2023).
  28. World Wildlife Overfishing. Available online: https://www.worldwildlife.org/threats/overfishing (accessed on 10 February 2023).
  29. Greenpeace. Available online: https://www.greenpeace.org.uk/what-we-do/oceans/overfishing/ (accessed on 10 February 2023).
  30. Merem, E.C.; Twumasi, Y.; Wesley, J.; Alsarari, M.; Fageir, S.; Crisler, M.; Romorno, C.; Olagbegi, D.; Hines, A.; Ochai, G.S.; et al. Analyzing the Tragedy of Illegal Fishing on the West African Coastal Region. Int. J. Food Sci. Nutr. Eng. 2019, 9, 1–15. [Google Scholar] [CrossRef]
  31. Over the Horizon Surveillance System Performance; Internal Report of the End-User, Undisclosed Communication, 2019.
  32. This Day. Available online: https://www.thisdaylive.com/index.php/2019/07/26/naval-chief-lauds-rmac-falcon-eye-for-arrests-of-130-illegal-vessels/ (accessed on 15 January 2023).
  33. Ibas, I.E. Falcon Eye Illegality Prevention. In Proceedings of the International Maritime Defense Exhibition and Conference (IMDEC), Accra, Ghana, 24–25 July 2019. [Google Scholar]
Figure 1. Position of installed HFSWRs with associated coverage areas in the Gulf of Guinea, Africa.
Jmse 11 01167 g001
Figure 2. HFSWR site deployment (taken from [23]).
Jmse 11 01167 g002
Figure 3. Deployed HFSWR: physical arrangement onsite (a) and geometric layout with dimensions of elements described (b).
Jmse 11 01167 g003
Figure 4. Algorithm for fusion of data collected by HFSWRs.
Jmse 11 01167 g004
Figure 5. Yearly statistics of HFSWR–HFSWR data fusion (taken from [24]).
Jmse 11 01167 g005
Figure 6. Algorithm for fusion of radar data with AIS (taken from [25]).
Jmse 11 01167 g006
Figure 7. Piracy and armed robbery in the Gulf of Guinea from 2016–2019 (from [27]).
Jmse 11 01167 g007
Figure 8. AIS tracks.
Jmse 11 01167 g008
Figure 9. HFSWR tracks.
Jmse 11 01167 g009
Table 1. HFSWR measurement resolutions.
QuantityResolutionExtreme Value Range
Range1.5 [km]0.5–2
Bearing1 [°]0.5–1.5
Range rate0.32 [m/s]0.5–2
Disclaimer/Publisher’s Note: The statements, opinions and data contained in all publications are solely those of the individual author(s) and contributor(s) and not of MDPI and/or the editor(s). MDPI and/or the editor(s) disclaim responsibility for any injury to people or property resulting from any ideas, methods, instructions or products referred to in the content.

